Accounting for biodiversity in marine ecosystem models
12
Accounting for biodiversity in marine ecosystem models Jorn Bruggeman S.A.L.M. Kooijman Dept. of Theoretical Biology Vrije Universiteit Amsterdam
-
Upload
constance-wilkerson -
Category
Documents
-
view
33 -
download
3
description
Accounting for biodiversity in marine ecosystem models. Jorn Bruggeman S.A.L.M. Kooijman Dept. of Theoretical Biology Vrije Universiteit Amsterdam. Interspecific differences quantified by traits. How to capture biodiversity in models? Species-specific models are incomparable - PowerPoint PPT Presentation
Transcript of Accounting for biodiversity in marine ecosystem models
Accounting for biodiversity in marine ecosystem models
Jorn BruggemanS.A.L.M. Kooijman
Dept. of Theoretical Biology
Vrije Universiteit Amsterdam

Interspecific differences quantified by traits
How to capture biodiversity in models? Species-specific models are incomparable Approach: one omnipotent species Parameter values determine the species Species-determining parameters: traits
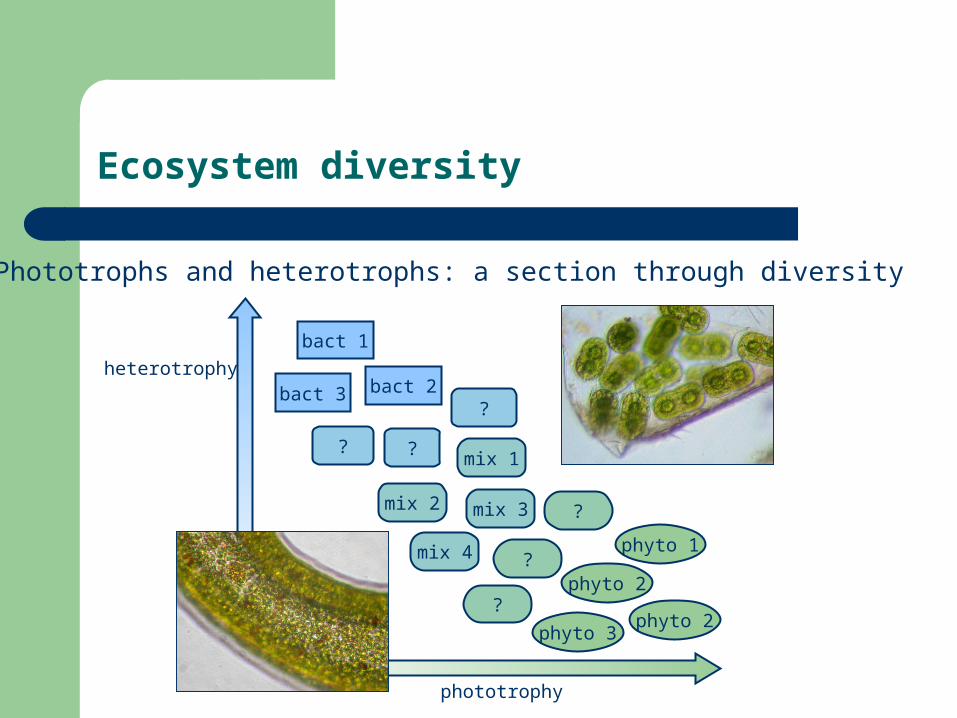
Ecosystem diversity
Phototrophs and heterotrophs: a section through diversity
phototrophy
heterotrophy
phyto 2
phyto 1
phyto 3
bact 1
bact 3 bact 2?
? ?
mix 2
mix 4
?
?
mix 3
mix 1
?
phyto 2

Infinite diversity continuity in traits
Species = investment strategy
Why not ‘just’ do everything well? Good qualities must be paid for
– costs for directly associated machinery
(photosynthesis, phagocytosis)– costs for containment if qualities conflict
(nitrogen fixation requires anoxic environment) Budget is limited make choices! Usefulness of qualities depends on environment
– No photosynthesis in dark environments Species define niche by choosing qualities to invest in (‘strategy’)

Cost-aware phytoplankton population
structural biomassnutrient
++
++
structural biomass
light harvesting
nutrient harvesting
+
++
+
nutrient
κL
κN
Functional group: phytoplankton
Discretized trait distribution– 15 x 15 trait values = 225 ‘species’
Start with homogeneous distribution, low densities
Realistic setting
Bermuda Atlantic Time-series Study (BATS)– 10 years of monthly depth profiles for physical/biological variables
Turbulent water column model (1D)– General Ocean Turbulence Model (GOTM)– upper 250 meter– k-ε model for turbulence parameterization– realistic forcing with meteorological data (ERA-40)
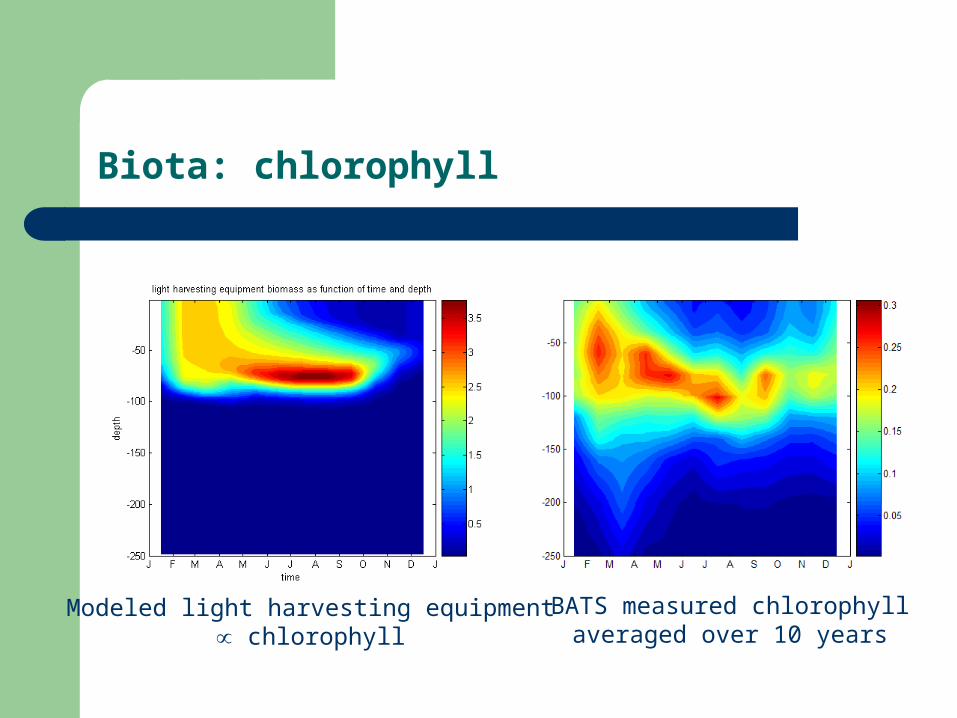
Biota: chlorophyll
Modeled light harvesting equipment chlorophyll
BATS measured chlorophyllaveraged over 10 years

Succession: average trait values in time
Modeled nutrient harvesting equipment surface-to-volume 1/cell length
Modeled light harvesting equipment cell-specific chlorophyll
Trends
Cell-specific chlorophyll increases with depth– High-chlorophyll species do better in low-light deep– Thus: succession (‘shade flora’), not photo-acclimation (Geider)
Seasonal succession: large small species– Small species fare better in oligotrophic environment– Bloom start with high nutrient level, large species– Small species gain upper hand as bloom proceeds (Margalef)

Conclusions and perspectives
Trait-based approach demonstrates diversity in space and time– increase in chlorophyll content with increasing depth– decrease in cell size between start of bloom and winter
Description of BATS– Qualitatively ‘reasonable’ with current (5 parameter!) model– Space for improvement; parameter fitting with base no-trait model
Aim: collapse trait distribution– Loss of state variables fitting becomes possible
Future: traits for ecosystems– heterotrophy– predation/defense– body size