
ACCOMODATING PRODUCTION TO THE MARKET DEMANDS OF …
80
1 ACCOMODATING PRODUCTION TO THE MARKET DEMANDS OF THIS ERA Improving the Production Flow of Distribution Transformers Line in ABB Turkey through Process and Layout Optimizations to Advance into a More Flexible and Leaner Production System TUNC ATLIHAN Master of Science Thesis Royal Institute of Technology (KTH) STOCKHOLM, SWEDEN 2011
Transcript of ACCOMODATING PRODUCTION TO THE MARKET DEMANDS OF …

1
ACCOMODATING PRODUCTION TO
THE MARKET DEMANDS OF THIS ERA
Improving the Production Flow of Distribution Transformers Line in ABB
Turkey through Process and Layout Optimizations to Advance into a More
Flexible and Leaner Production System
TUNC ATLIHAN
Master of Science Thesis
Royal Institute of Technology (KTH)
STOCKHOLM, SWEDEN 2011

2
ACCOMODATING PRODUCTION TO THE
MARKET DEMANDS OF THIS ERA
Improving the Production Flow of Distribution Transformers Line in ABB
Turkey through Process and Layout Optimizations to Advance into a More
Flexible and Leaner Production System
Tunc ATLIHAN
Supervised by Ove Bayard
Master of Science Thesis in Production Engineering and Management
Royal Institute of Technology (KTH)
School of Industrial Engineering and Management
Department of Production Engineering
Brinellvägen 68 SE-100 44
STOCKHOLM, SWEDEN, June 2011

3
ABSTRACT
In the last decades the old manufacturing ideology which is based on only quantity has faded away.
With globalization of the world, competitors in all industries have risen and instead of buyers
searching for suppliers, now the manufacturers have to get to customers by distinguishing
themselves from the other competitors. The main problems that the manufacturing companies face
changed from how they can produce more to how they can get their product to customers more
quickly in a changing market while improving the efficiency of their production. Hence most of the
manufacturers tend to use lean manufacturing techniques to get a more flexible and agile production
systems.
The Distribution Transformer Factory of Asea Brown Boveri Turkey is facing with similar problems in
adapting the customer-oriented production. The company is using a design-to-order system to meet
each customer’s specific needs but the compatibility with its production system is discussable.
Although the yearly capacity demands can be easily met, the system doesn’t show the flexibility to
quickly accommodate its production to deviating customer order.
The objective of this project is to create a new agile manufacturing system that can effectively meet
the changing demands. In the first phase, from the data gathered from the production floor, a
current state value stream map is created to get a clear view of the present situation. Through
improvement on the marked processes a new production model, with less throughput time and
increased reactivenes to changing demands, is created in future state value stream map. In the
second chapter, the bottleneck that stands as the capacity and flexibility constraint of the system is
unraveled according to the model created. A new changeover system is implemented and a
formulation to generate process times to help the scheduling activities is created. Lastly a new
inventory layout system is introduced which will support the new improvements in system constraint
as well as all the other process.

4
Preface
This report is the result of Master Thesis Project done as the final part of International M.Sc.
Programme of Production Engineering and Management in Royal Institute of Technology, Sweden.
The thesis has been conducted between June 2010 and December 2010 in Turkish Branch of Asea
Brown Boveri(ABB) Group.
In these first few lines I wish to express my gratitude for the people who have supported me through
this period.
First of all, I would like to give my thanks to all my Colleagues in ABB Turkey for their inspiring and
informative advices, especially Melih Adali who as my project head helped me to form all my study.
Secondly I wish to express my gratitude to my professors in Royal Institute of Technology for their
teachings that give me the knowledge to carry out this research and special thanks to my project
coordinator, Ove Bayard for his assistance.
Finally, my family who have their undying support to me through the master degree as all my life,
have my thanks and love.

5
Table of Contents
LIST OF TABLES ........................................................................................................................................ 6
LIST OF FIGURES ...................................................................................................................................... 7
CHAPTER 1 - INTRODUCTION .................................................................................................................. 9
1.1 Company Background ................................................................................................................... 9
1.2 Aim and Objectives ...................................................................................................................... 10
1.3 Scope ........................................................................................................................................... 11
CHAPTER 2 - THEORY AND METHODOLOGY ......................................................................................... 13
2.1 Theory .......................................................................................................................................... 13
2.1.1 Theory of Constraints ........................................................................................................... 13
2.1.2 Lean Manufacturing ............................................................................................................. 15
2.1.3 Motion Analysis .................................................................................................................... 17
2.1.4 TRIZ ....................................................................................................................................... 19
2.2 Methodology ............................................................................................................................... 22
CHAPTER 3 – THE NEW PRODUCTION MODEL ...................................................................................... 24
3.1 Introduction to Products and Production Floor .......................................................................... 24
3.2 Current State ............................................................................................................................... 29
3.2.1 Data Analysis of Current Production .................................................................................... 29
3.2.2 Current State VSM ................................................................................................................ 33
3.3 The Idolized Production Model and Its Analysis ......................................................................... 37
CHAPTER 4 - Elevating the System Constraint ...................................................................................... 41
4.1 New Changeover System ............................................................................................................. 41
4.1.1 Data Analysis of Constraint Operation ................................................................................. 42
4.1.2 Creation of New Changeover Procedures ............................................................................ 49
4.1.3 Pilot Area Implementation ................................................................................................... 56
4.1.4 Operator Allocation .............................................................................................................. 57
4.2 HV Winding Machining Time Formulation .................................................................................. 59
CHAPTER 5 - INVENTORY LAYOUT OPTIMIZATION ................................................................................ 66
CHAPTER 6 - CONCLUSION .................................................................................................................... 72
REFERENCES .......................................................................................................................................... 74
APPENDIX .............................................................................................................................................. 76

6
LIST OF TABLES
Table 2.1 List of Invention Levels………………………………………………………………………………………………….20
Table 2.2 List of Engineering Features…………………………………………………………………………………………..21
Table 2.3 List of 40 Principles of Triz……………………………………………………………………………………………..21
Table 3.1 MDT and SDT Lines Process Data…………………………………………………………………………………..30
Table 3.2 Current Capacity Planning of SDT Line…………………………………………………………………………..32
Table 3.3 Current Capacity Planning of MDT Line………………………………………………………………………….33
Table 3.4 Lead Time Data of Current VSM…………………………………………………………………………………….35
Table 3.5 Future Model Process Capacities……………………………………………………………………………….….39
Table 3.6 Future Model Lead Times……………………………………………………………………………….…………….40
Table 4.1 Formulated Times Based on Project Features………………………………………………………………..63
Table 4.2 Average Times Gathered from Formulation…………………………………………………………………..64
Table 4.3 Projects with Similar Times from Formulation and Machine Logs………………………………….65
Table 5.1 The Effect of the New Layout in Search Times…………………………………………………………….…70

7
LIST OF FIGURES
Figure 1.1 ABB Logo……………………………………………………………………………….………………………………………9
Figure 2.1 A VSM example created by me in a previous project for KTH.……………………………………...17
Figure 2.2 Example window of AVIX program……………………………….……………………………………………..18
Figure 2.3 Problem finding techniques……………………………….…………………………………………………………19
Figure 2.4 Triz Problem Solving Method……………………………….………………………………………………………20
Figure 2.5 A Section of Contradiction Matrix…………………………….……………………………………………….…22
Figure 2.6 Design Cycle of Practice Oriented Research……………….……………………………………………..….22
Figure 2.7 Research Framework……………………………….…………………………………………………………………..23
Figure 3.1 Standard Distribution Transformer and Its Components………………………………………….…..24
Figure 3.2 Core and Windings…………………………………………………………………………….…………………………25
Figure 3.3 Process Flow of Pre-Assembly Line……………………………………………………….………………………26
Figure 3.4 Process Flow of Main Assembly Line…………………………………………………….………………………29
Figure 3.5 Current State VSMs of SDT(up) and MDT(down) Lines………………………….………………………34
Figure 3.6 Future State VSMs for MDT (upside) and SDT (downside) Lines…………….……………………..38
Figure 4.1 The Changing of the HV Winding Operation Work Flow………………………….……………………42
Figure 4.2 Task List and Efficiency Chart of HV Winding Process………………………….………………………..44
Figure 4.3 Task Report of HV Winding Process…………………………………………………….……………………….45
Figure 4.4 HV Winding Machine Layout…………………………………………………….………………………………….46
Figure 4.5 Task List and Efficiency Chart of LV Winding Process……………….…………………………………..47
Figure 4.6 Task Report of LV Winding Process…………………………………………….………………………………..48
Figure 4.7 Contradiction Matrix Intersections…………………………………………….………………………………..49
Figure 4.8 Current Timeline of Winding Process……………………………………….…………………………………..51

8
Figure 4.9 Idolized Timeline of Winding Process with the New Procedure.…………………………………...52
Figure 4.10 Image of Pilot Process……………………………………….……………………………………………………….56
Figure 4.11 Task List and Efficiency Chart of Pilot Area………….……………………………………………………..56
Figure 4.12 Allocation of Operators……………………………………….…………………………………………………….58
Figure 4.13 Process Time System Used in Polish Branch of ABB………………………………………………….…60
Figure 4.14 Comparison of Times Generated from Formulation and Datalogs………………………………64
Figure 5.1 The Inventory Layout and Transportation Paths………………………………………………….…….…68
Figure 5.2 The Sorting Example (up) and Disposition of the Materials (down) …………………….…….…69

9
CHAPTER 1 - INTRODUCTION
1.1 Company Background
Asea Brown Boveri(ABB) is one of the largest engineering companies in the world and is a global
leader in power and automation technologies. The company has operations in approximately 100
countries with 119,000 employers and registered in the Swiss, Stockholm and New York stock
exchanges.
Figure 1.1 ABB Logo
The history of ABB starts in 1880s with the forming of two different companies, Allmana Svenska
Elektriska Aktiebolaget(ASEA) and Brown, Boveri & Cie(BBC). In 1883 ASEA is established by Ludwig
Fredholm in Sweden as a manufacturer of electrical lighting and generators. In 1891 BBC was
incorporated by Charles E.L. Brown and Walter Boveri in Switzerland and in a few years after the
forming became the first company to transmit high-voltage power. Through the 20th century both of
these companies had grown to important figures and became fierce compatitors in the field of power
industry. In 1988 these two strong competitors announced their intent to merge because of the
reasons to combine their expensive research and development efforts and unify the markets they
were strong at.(ASEA in Scandinavia and northern Europe; BBC in Austria, Italy, Switzerland and West
Germany) The new group has established its headquarters in Zurich and started its operations on
January 5, 1988 with a revenue of 17.83 billion dollars and 160,000 employers. From the merging to
this day, ABB had grown into Eastern Europe and Asia markets, and nearly doubled its size by
increasing its revenues to 31.8 billion dollars.(2009)

10
The organization structure of ABB is divided to 5 main branches based on the type of products.
These main divisions are listed in order of share of revenues:
Power Products – The division operates in the field of production of components for the
transition and distribution of electricity. The key products of the group are transformers;
automation relays; High Voltage(HV) & Medium Voltage(MV) switchgears and circuit
breakers. The division holds %30 of total revenue.
Low Voltage Products – The field of this division is to produce equipment for low voltage
usage. Circuit breakers, drivers, motors and wiring accessories are typical products of the
group. %25 of the total revenues are hold in LVP
Process Automation- The main purpose of the division is to supply customers with products
and solutions for automation and optimization of industrial processes. The group holds %22
of revenue.
Power Systems- The division provides turnkey system for power grids and power plants. The
most common systems provides are, transformer centers, FACTS, HVDC, HVDC Light and
power plant automation systems. %18 is of the revenue is hold by this division.
Discrete Automation and Motion- Regarded as robotics also, the group provides products
and services for industrial production. The key products are driver, programmable logic
controllers (PLC) and industrial robots. The group has the lowest percent of the revenue,
with %5.
ABB Elektrik Sanayi A.S. is the Turkish branch of ABB Group. Its history dates back to 1965, when
company formed under the name ESAS for production of transformers in Turkey. It had started it
production of distribution transformers (DT) with USA design of Kuhlman Electrics, and to 80s
became an important figure in Turkish Industry. In 1987 %53 of its shares were bought by ASEA and
one year after that, when BBC and ASEA cohered, the company merged into the ABB group. The
Turkish factory has become the European focus factory for Large-Medium Distribution Transformers
in 2005 and right now ABB Elektrik Sanayi A.S. is one of the leaders in power industry of Turkey with
3 factories and 3 service centers.
1.2 Aim and Objectives
With the globalization of the World, the competition has increased greatly in energy sector with a
huge number of new companies. To get a good market share, the energy companies has to stand out
11
in this mass with its qualifications such as product quality, supply lead time and customization for
buyers. As one of the old-established energy companies, ABB keeps a sizable amount of market share
by meeting the demands of the time. The company is known for its product quality and customized
product that are designed in regard to customer specifications. However it needs to increase the
effectiveness of production system to reduce the supply lead times and adjust to changing demands.
The aim of this project is to implement a new production system that will enhance the flexibility and
efficiency of the current one. The objectives to accomplish this goal are:
Creating a new production model from the deep understanding of current situation.
Generating creative solutions to constraints, which stand as a bar to elevating the system,
and implementing them.
Carrying out improvement activities that support the constraint solutions as well as
increasing the efficiency of the overall system.
1.3 Scope
There is a huge range of transformer products in Turkish branch of ABB. They are classified to
different groups based on their properties and the production of each class is carried in different
plants or areas. Therefore a specific group of products should be chosen as the focus product group
to carry out the project.
The Power Products Group has the biggest share of all groups in the Turkish branch of ABB. The
transformers division in this group has two separate factories in Dudullu(16,670m2; 9,570m2 closed)
and Kartal (31,000m2 ; 9000m2 closed). While Kartal Factory focuses on the manufacturing of power
transformers, Dudullu Factory focuses on distribution transformers. These two types are classified
based on their power capacities as; up to 30 MVA transformers are called distribution transformers
(DT) and transformers with bigger capacities are named power transformers(PT). This project is
carried out on the floor of Dudullu Distribution Transformers Factory so DT products will be the
subject of the research.
Another classification based on power capacities, is done at the DT factory. This time the distribution
transformers are divided to 3 groups for different production lines: small distribution
transformers(SDT), medium distribution transformer(MDT) and large-medium distribution
transformers(LMDT). The classification of the 3 lines is as:

12
SDT line – line for the production of smallest type of transformers
SDT < 315kVA max 36kV
MDT line- the middle production line where MDT are manufactured
315kVA < MDT < 2500kVA max 36kV
LMDT line- the line where both large and semi large transformers are produced.
2500kVA < LMDT < 10MVA max 36kV
10MVA < LDT < 30MVA max 72kV
As the power capacity increase, the size and the complexity of the transformer increase. Therefore,
although the production processes are the same, the time and manpower needed for operations
differs for each line. For SDT and MDT line, the operation times, types of machines used and
personnel assigned to the tasks are similar. However the LMDT line`s flow is much different than the
other lines. The LMDT products are much larger and more complex designs, so a standardization of
the process can`t be done like the other ones. Due to the complexity of the products, this line
requires more labor and some processes do not use PLC machines unlike the other lines. For all these
reasons, the LMDT line is excluded from the project and SDT&MDT products, which are similar in
many ways, are chosen as the focus product family of the project.

13
CHAPTER 2 - THEORY AND METHODOLOGY
2.1 Theory
There are various theories used throughout the research. In this chapter they will be explained
briefly.
2.1.1 Theory of Constraints
The theory of constraints is a management theory, first introduced by Goldratt, in his book “The
Goal” where the story of Alex Rogo, the manager of a plant in a problematic state, is told. The book
first questions the old thinking of productivity in the manufacturing company by realizing the fact
that although all the divisions of the manufacturing plant assumed to think that they have separate
prime objectives or goals, which they should focus on achieving; in reality the true goal of the whole
organization is to make money and all the rest should be classified as necessary activities. From this,
it is deducted that activities that activities which does not make the company move closer to its goal
is unproductive and the company should focus on activities which moves it closer to its goal.
As the theory formed around this idea, the flow of the system is idolized as a steel chain which
always breaks at its weakest link irrelevant from the strength of the other links therefore the
strength of the whole chain is equal to the strength of this weakest link. When considering a
organization this link refers to a process or department that limits the system from achieving its goal.
In terminology this is called a constraint and can be viewed as a structural bottleneck which
determines the capacity of the whole system. TOC concludes the limits of an organization to at least
one or a limited number of constraints and to evolve, the organization should restructure itself to
these constraints and solve them by using the five focusing steps of theory of constraints.
Before starting the five step analysis of TOC, to gain perspective for the analysis, two facts should be
identified:
The definition of the system and its goal purpose(goal)
Because the constraint is relatively perspective and can be viewed different from division to
division, the definition of whole system`s goal is a prerequisite for defining the true constraint of
a system. As mentioned above, in manufacturing companies, choosing making money as the
primary goal can satisfy the demands and conditions in most situations.

14
The way to measure the system`s purpose
After stating the goal of the organization, the methodology to measure this goal should be
defined. As in the example of the book “The Goal”, when the character assigned the plants goal
as making money, he had to throw his old techniques of calculating productivity to trash and
define new terms such as throughput, operating expenses and rate of return.
After these definitions analysis can be carried with the five focusing steps in below
Step1: Identify the System’s Constraint
In this step the capacity of each process is measured and then by comparing the actual
throughput with the capacities, the constraint which has the highest capacity utilization rate is
found. The constraint is identified ether not enough sales in the market, no enough materials
from vendors or inefficiency of a process in an internal resource.
Step2: Decide How to Exploit the System’s Constraint
The second step is to identify the key factors in the constraint that can be used to manipulate the
capacity of it. In this step actions to increase the production rate in the capacity limits are done.
These actions can be reduction of waste, decrease in setup times for internal constraints;
reducing scraps or finished inventory for raw material constraints; and increasing quality,
fastening lead times for market constraints.
Step3: Subordinate Everything Else to Constraint
This step is where most of the management activities takes place to maximize the rate of
throughput. The management sets its own rules and standards in this stage and change the
behavior of emotional resistance which prevent the constraint from being solved. All the non-
constraint resources are planned according to the constraint to insure feeding the process with
material. The drum-buffer-rope model is applied in this planning phase.
Step4: Elevate the System Constraint
This is the stage; the decision is made if the productivity of the bottleneck which has been
improved in the last two steps is satisfying. If the capacity of the process meets the market
demand, than the bottleneck has moved to another process. However if the production is not in
the level which is desired still, then new resources should be invested. In the case the bottleneck
is an internal source; implementation of additional shifts, hiring new personnel, outsourcing or
investment of new machines can be the solution. In other cases where the bottleneck is either in

15
raw materials or sales, new suppliers or new customers should be found. The ideal improvement
would be to increase the constraining process to the whole system’s limit, but in continuous
improvement, improving the capacity of the system above the next most significant constraint is
good enough.
Step5: Prevent Inertia, Go to Step 1 if the Constraint is Solved
In continuous improvement thinking, inertia to act on advancing the system is unacceptable.
Therefore once the constraint is solved, it is required to go back to step 1 of identification of
constraint because by breaking a constraint, a new one is created in the system. The important
thing is to keep the constraint in check and move it to a desired process so that control over the
whole system can be maintained. However in some cases where there is no way to improve the
system any further, it might be needed to change the structure of the whole system.
2.1.2 Lean Manufacturing
The concept lean manufacturing roots back to production systems developed by the Japanese
manufacturers after World War 2 in response to the shortages of material, financial and human
resources. The prime example is the Toyota Production System which Taichi Ocho developed with
inspirations from the Ford Production System in 1940s. As the system developed over the years and
the Japanese has passed their western counterparts, the book ‘’The Machine Changed the World’’
(Womach, Jones, Ross; 1990) published from the studies in Massachusetts Institute of Technology,
made an awareness of the benefits of lean manufacturing to all industries.
The principle behind the lean manufacturing is utilizing activities that add value to the final product
from the customer’s perspective. This utilization can be achieved by reducing or abolishing of the
non-value activities called wastes. The Japanese culture define the wastes in continues improvement
in three broad categories: muda, translated wastefull activity but in common practice it is simply
referred as any kind of waste to be eliminated; mura, translated unevenness like excess variation due
to non-standardized work; and muri, translated overexertion as the reduction in efficiency due to
work beyond limits. In lean manufacturing the primary focus is on reduction of muda and it is
categorized in 7 groups:
Overproduction- It is the waste caused by manufacturing a product before it is required.
Mostly believed to be the worst kind of waste because it covers all the other kind of wastes.
It results in high inventory and waiting times, also lowers the quality of the products.

16
Waiting- This type occurs because of the waiting times of products between processes. The
researches show that in the traditional batch and queue manufacturing %99 of the product
life cycle is waiting meaning only %1 is value added. Reduction in this waste achieves a much
shorter throughput time and smoother material flow.
Inventory- Any kind of excess raw material, component and finish product is included in this
group. It is usually viewed as a symptom of poor processes where batching occurs. Because
cash is tied to these material for unknown period, it has a negative impact in cash flow of the
company. To keep this extra material extra storage should be created so another cost.
Implementation of kanban systems are the solutions to this problem in lean.
Transportation- Moving parts from one location to another is not a value-adding process.
Moving the parts from warehouse to operation sites or shuffling the inventory to get the
right components can be viewed in this group. It should be noted that some transport in
necessary but they should be minimized with defining the shortest paths.
Unnecessary Movement- Any kind of unwanted movement of the production personnel is in
this group. The movement of worker outside of their process are to get tools or materials
should be eliminated. Also the work place should be organized in such a way that the
operator should not do unergonomic movements like bending or stretching that will
decrease their efficiency in the long run.
Over processing- Using the wrong techniques or taking unnecessary steps that extends the
process are in this waste group. Using larger scale equipment or trying to narrow the
tolerances than necessary can be used as examples. Not only the cost with extended process
times are increased, also it creates an over fatigue on workers.
Defects- The last type is the defects caused by caused by errors in process and creates a
waste of inventory and time because of the rework. Creating quality systems for every
station is a good way of preventing this wastes.
Value Stream Mapping
Value stream mapping (VSM) is visual lean manufacturing tool used for the analysis and realization of
the material and information flow. The method consists of creating a one page picture of all
processes in a company from the receiving of the order from customer to shipping of the product.
The purpose of the VSM is to visually document both the value-adding processes and the wastes for
easier identification and create a baseline for improvements. The method is carried on 4 steps as:

17
1. Step1- Define Product or Product Tree
A product family which share common processes from order entry to shipment is
defined.
2. Create the Current State Value Stream Map(CSVSM)
The scope of the VSM is defined and information on the processes in the boundaries is
gathered. From this analysis an initial map is drawn and areas of improvements are
noted.
3. Create the Future State Value Stream Map(FSVSM)
A new map is created by changing the flow to a desired state to fit the needs.
4. Develop an Action Plan to Convert the CSVSM to FSVSM
An action plan is created to implement improvements in the areas noted and oversee
the efficiency of the changes.
Figure 2.1 A VSM example created by me in a previous project for KTH
2.1.3 Motion Analysis
Motion analysis is the studies that conducting analysis from a visual series to create data from the
processing of two or more sequential images. The information that is created from the images are
based on specific time-points, hence the motion can be converted to time-dependent data. It is used
in computer, electrical and industrial engineering sciences. In industrial sciences, the usage of
computer vision is called machine vision, which is the analysis of images to produce time data in
controlling processes and activities.
In its applications on manufacturing; by using video cameras and analysis software, analysis are
carried out on the efficiencies of assembly lines and production machines. Also by creating a library
of the machining data, the underlying factors for malfunctions and defects can be monitored.

18
Avix Method
Avix is a family of video based software designed by SOLME A.B. It has several modules which aim to
enhance the user’s competitiveness in its products and processes by supporting the industrial
functions.
Avix method is one of the modules of the Avix product tree that focuses on motion and time analysis
used especially on manual assembly processes. The software can be used on:
Time and motion studies
Cost and optimization calculations
Improvement of productivity in single workstations
Optimizing tooling and lay-out for a workstation
Continuous improvement
Measuring productivity and improvement potential
Documenting the manufacturing processes
Investment and outsourcing decisions.
The usage of Avix Method is quite simple. The video images of processes are integrated to the
software. First every operation is separated by assigning the object of focus and the motion of the
operator according to defined categories (e.g. assembling, adjusting, waiting…) by an analyzer. If
desired the tools which are used in the operation can be specified. Also the number of undesired
operator activities such stretching and bending can be inserted. After all the motions are defined, the
software creates a chart by the dividing the work to productive, semi-productive and waste areas.
More reports over the process can be acquired and it creates a data base to pinpoint areas of future
improvements. An example program window of Avix is shown in figure 2.2.
Figure 2.2 Example window of AVIX program

19
2.1.4 TRIZ
TRIZ is a problem-solving method, taking its name from the first letters of Russian words “ Teoriya
Resheniya Izobretatelskikh Zadatch” meaning “Theory of Inventive Problems Solving” , which is also
widely abbreviated as TIPS. Unlike other methods such as brainstorming which bases on random idea
generation; TRIZ uses algorithmic approaches to improvements and inventions so it relies on
knowledge on the patters of problems and solution, instead of intuition of individuals.
Figure 2.3 Problem finding techniques
The TRIZ theory is first created in 1946 by Genrich Altshuller, a Russian scientist working for the USSR
Patent Institute. In his work many inventors had seek consult from him and this led him to search for
standard methods of problem solving. However what he found was mostly psychological tool, not
meeting the demands set. He concluded that an inventive problem solving method should:
1. Be Systematic, a step by step process
2. Lead to ideal solution in a range variety of options
3. Not be related to psychological tools and be repeatable
4. Able to reach inventive/innovative knowledge
5. Able to add to inventive/innovative knowledge
In the years following Altshuller had studied over 200000 patents to understand how these
problems are solved. As a matter of fact, from that day on the patents are still being researched by
his follower to improve his method. Now over 2 million inventions are studied and they are divided
to 5 levels.

20
LEVEL INVENTION LEVEL RATIO NEEDED KNOWLEDGE
1 KNOWN SOLUTION 32 KNOWLEDGE OF INDIVIDUAL
2 MINOR IMPROVEMENT 45 KNOWLEDGE OF COMPANY
3 MAJOR IMPROVEMENT 18 KNOWLEDGE OF INDUSTRY
4 NEW CONCEPT 4 KNOWLEDGE OF CROSS INDUSTRIES
5 DISCOVERY 1 EVERYTHING
Table 2.1 List of Invention Levels
As the table shows over %90 solution of all the problems are present and the creativity involves
finding that solution and altering it fit to the problem at hand. The basic idea behind TRIZ is to create
a database of problems and solutions which can be used to adapt the problem at hand.
Figure 2.4 Triz Problem Solving Method
Altshuller stated that all solutions to problems, create their own problems. He identified
contradiction as when a feature in a technical system is improved another one is worsened.
Therefore to solve a problem one must know the reaction that the action will bring. By studying over
1.5 million invention problems Altshuller identified 39 standard engineering features which lead to
contradictions.

21
Table 2.2 List of Engineering Features
Also from his research on the 1.5 million inventive solutions, Altshuller has identified the common
solutions to similar problems. By using this, he had created “40 Inventive Principles” which can be
used as guidelines in problem solving. He formed the “ Contradiction Matrix” by putting standard
engineering features in a 39*39 matrix and put at most 4 inventive solutions to each intersection .
Table 2.3 List of 40 Principles of Triz

22
In the problem solving case, the inventor must identify his own problem and compare his action and
reaction features with TRIZ contradictions. If the solution does not meet a reaction, it is the ideal
solution. However, if the problem is not too simple, the solution is accepted to meet a resistance.
When the improving feature and worsening feature is both identified, the solution can be generated
by using the principles found in the intersection of the matrix.
Figure 2.5 A Section of Contradiction Matrix
For complex problems, ARIZ, the algorithmic solution method of TRIZ, is used. It is a 85 step-by-step
procedure to solve problems.
2.2 Methodology
This project is an applied practice-oriented research because it is carried out to solve a problem in an
industrial institution. Therefore the framework of the project is based on the design cycle of practice-
oriented research methodology.
Figure 2.6 Design Cycle of Practice Oriented Research

23
The design cycle is adapted to the problem at hand so its disposition is a little different in the project.
In the project the problem finding phase and diagnosis phase has interlocked with each other. The
problems are identified through data collection and observation of the created current state VSM
through literature study of lean manufacturing. At the same time the diagnosis is carried from
analysis of current state VSM and improvement areas are identified. At the design step, the new
production model is created in the future state VSM.
In the intervention step, improvements to reach the idolized model are done. Each improvement can
be viewed as a design cycle in themselves because they show a similar structure. In the VSMs the
problem finding and diagnosis parts are done for each individual problem. Then through an
improvement approach of using both TOC and Lean Manufacturing techniques in harmony; the
solutions to elevate the system constraint and continuous improvements to eliminate wastes of the
system are done at the same time. This could be counted as the sub-design part of intervention step
because through literature study (TRIZ, Motion Analysis…) various methods are researched and
effective solutions to the problems are created. Then the improvements proposed are implemented
first through a pilot are to see results in bottleneck operations and through calculating the benefits
from a simulation in layout changes.
In conclusion the results of each improvement and progress covered on the new model are
discussed. Lastly future work that can be done to advance this research is described.
Figure 2.7 Research Framework

24
CHAPTER 3 – THE NEW PRODUCTION MODEL
3.1 Introduction to Products and Production Floor
Transformers are static devices that transfer electrical energy from one voltage level to another
through induction with minimum losses. The first discovery of the three-phased transformers which
are used today dates back to 1890s. Although new technologies are developed and different kind of
transformers are being produces today, the most common old design still is the most popular one.
The main parts of a transformer are shown in the figures below.
Figure 3.1 Standard Distribution Transformer and Its Components
Although there are some designs such as amorphous transformers where some parts change due to
the different shape of the core; the parts in the active part are same in every design. However parts
on the tank of the transformer vary a lot. Except the corrugated tank, nearly all other parts are
optional and are used according to the wishes of the customers. A better view of the core and the
winding can be seen in figure3.2.

25
Figure 3.2 Core and Windings
ABB production is based on build-to-order system meaning that the production starts after the
customer`s order is received. So the production cycle begins when sale department confirms the
project and sends the requirements of the customer to the design department. The design
department does not categories the specifications of the project to standard products but create
new design for each customer with the help of CDS, a tool for standardization of design. The reason
of this is the vision of ABB to create transformers specific to each customers demand. Because of the
huge number of the new designs, there is always a work load in this department and the process
takes from 2 to 3 weeks.
After the creation of the designs, they are passed to the production planning department. The
planning department checks the manufacturability of the designs and makes an inventory check
based on the bill of the materials. If no revision for the design is required, the materials lacking in the
inventory is ordered by the supply chain group in this department. The production schedule is
created for both the core pre-assembly line and the assembly line. The production plan in the
assembly line is created according to the bottleneck operation, HV winding, and all the downstream
and upstream operations are scheduled based on that operation. After the materials are gathered
from the suppliers the production begins. In the production phase the production planning
department oversees the process of the production advancement and creates daily orders according
to it. These orders are transmitted to production supervisors and through them to operators working
on the machines.

26
The pre-assembly line is the core production workshop. In this workshop the silicon steel raw
material are shaped in to central core of the transformers. The inventory of silicon steel varies due
to the order strategy based on prices of metal market. However a constant inventory is always kept
due to the material`s long supply time because ABB buys all of the silicon steel from off-shore
suppliers.
The first process in the pre-assembly line is core slitting. Here the wide silicon steels coil sheets are
passed through blades for being split to desired thickness. The thicknesses are arranged with
shrinkage in both ends of the coil, the silted pieces rolled again to coils to be passed to the next
process.
The second process is core cutting. The slit coils are cut and shaped into desired forms. The sheets
can be formed rectangular, triangular ended (450 is the most common) or even amorphous. The core
stacking process can be combined to core cutting because once the sheets are cut they are moved
through the machine automatically to be stacked. Each sheet is released over each other by sliding
through a pin to create the multilayer core form. The operators introduce the project to the PLC and
make sure that the pins are correctly placed so sheets misplace. The process map of core workshop
can be seen in figure 3.3.
Figure 3.3 Process Flow of Pre-Assembly Line
One important fact about the pre-assembly line is that, it cannot create desired numbers of
intermediate products and keep up with the production rate of the assembly line. The reason of this
is the insufficient production capacity of the machines in the core cutting and core stacking
processes. Therefore although the core slitting capacity can keep up with the production pace, the
core cutting and stacking operation are done to subcontractors or even manufactured cores are
acquired directly from suppliers. The pre-assembly can manufacture %50 of the cores necessary in
the production of the transformers and the rest %50 is supplied by other means. However right now
a new core cutting & stacking machine has been brought to the workshop and its implementation is
27
still going on. When the new machine becomes fully-operational, the need of out-sourcing will be
eliminated.
The main assembly line starts with the LV winding process. Both SDT line and MDT line has one
machine each for this operation. One coil before the finish of the project, a signal is given to the
material handling personnel for kitting. The insulation paper where they are arranged for production
in paper workshop and the conductor sheet rolls positioned in their open inventory locations are
brought to the kitting area in front of the machine. In most of the project the cores produced are
carried to this area because winding will be rolled over them. However in some projects the winding
is not done this way but to wooden block with the same width of the core. In these projects, the
windings are stacked to the cores after the HV winding process. ABB is still trying to standardize all its
production to winding over core but still there are some exceptions.
In the change-over for a new project, first of all the operator replaces the insulation paper and the
conductor metal coil. Then he places the core and inserts the project`s program to the PLC and the
operation begins. The operation consists of covering the coil by rolling the thick insulation paper and
the metal foil over it. Also according to the design in specific laps, aluminum leadout plates are be
cold-welded on the machine. However because aluminum oxides quickly, the leadouts should be
grinding just before the welding so the operator should leave the workspace to go to the grinding
machine.
The second operation in the main assembly line is the HV winding. For this operation there are 4
machines in MDT line and 3 machines in SDT line. The coils created in the first operation are moved
through the conveyor to the second work area. They are picked by manipulators and placed to the
HV winding machines. The change-over of this operation is similar to its predecessor. After the
resources are gathered by the kitting signal, the insulation paper and the conductor wire holdings are
replaced, and the program is installed. The operation is carried on by rolling the conductor wire over
the coil while at the same time covering it with thin insulation papers. Again in specific lap leadouts
are created but this time it is done by cutting the wire and bending it to the side of the coil. Once the
operation is done the coils are picked by manipulators and placed over the conveyor again. Because
the HV winding is the bottleneck of the main assembly line, a more detailed explanation will be done
in chapter 4.
The third operation is Assembly on Table. There is open machine for SDT line and one Machine for
MDT line again. In this operation, 3 coils, manufactured in HV and are ready in the conveyor, are
assembled to form the base of the transformer. The operators first place the 3 coils to holders on the
machine and then positions the upper and lower cores as the tip of the first 3 coils will stack with

28
them. After this yokes and sidings are assembled. In the end of the process, the base as one piece is
picked by a crane and carried to the waiting area in front of the next workstation. The windings
which are done not on cores but instead on wooden blocks are combined their cores in this phase.
The next operation is LV&HV Connectors Assembly. In this workstation the SDT and MDT lines are
merged and both operations are done in the same workspace. There two parts for this operation
which is handled by two different workers. In the first phase of the operation, the LV bushings and
the wires are connected and the tap changer is assembled. After LV connectors the second operator
assembles the HV bushings and wires and passes the product to the next station with crane.
The fifth operation continues as a single line for SDT and MDT. In the tanking operation the cover of
the transformer, tank, is lowered to the active part and assembled with screws. The bushings are
fastened again and the transformer is ready to pass to the next phase.
In the insulation drying operation, the MDT products and SDT products separates again. The MDT
products go the Low Frequency Heating (LFH) and the SDT ones to Natural Flow Heating (NFH). First
the parts are put to heating cells in batches and conductor wires are attached to its ends. Then the
number of the inserted parts and their specifications are identified the program. The machine first
vacuums the air in the cells so no moisture can affect the process. After this, under a constant circuit
the transformers are dried so the insulation papers of windings are stuck to each other.
In the end of drying operation the first thing is to fill the tanks with oil. Otherwise the insulation
papers will react with the water particles in the air and all the process will go to waste. After the oil is
filled the pressure test is carried and the transformers are carried to test waiting area for cooling to
room temperature.
The tests are common for both types of the products. The products are put to a conveyor in the
chamber and setup for the testing. There are two tests per product and the area is arranged as a
cellular layout. Two workers do the tests in a circular flow: while one operator finishes the first test
and pass the part to the second phase, the other operator finishes the second test and brings a new
product to testing chamber.

29
The last operation is the finishing and shipping. Finally the accessories specified by the customer are
assembled to the transformer and then the transformers are packed for shipping.
The process flow of the main assembly line is as figure 3.4.
Figure 3.4 Process Flow of Main Assembly Line
3.2 Current State
3.2.1 Data Analysis of Current Production
A companies’ capacity in carrying out production planning and improvement implementation
operations is parallel with collecting accurate data from the production floor. It is hard to maintain
an efficient data gathering system; therefore most companies have only vague ideas about their
processes. The biggest problem is the lack of information flow between production floor and higher
management due to traditional manufacturing.
In the recent years has carried out projects to overcome this problem. In the implementation of CP3
project, ABB has configured its SAP software to collect data of actual labor hours and material
consumption. Also in the early phases of the CP3 project, a VSM was created to make an overview
picture of the assembly line. However there are still problems in using these tools efficiently. First of
all there is no revision on the VSM so it is out of date. More importantly the SAP production module

30
is not fully utilized to the everyday usage in production floor. Although the operators are responsible
for writing the process times, there is no system that is overseeing nor checking them. Plus the
encouragement from the higher management on this is not sufficient, so most of the time the data is
not collected or unreliable. Due to the unreliability of this data, the data collection is carried through
inspection of the processes and interview with the operators and production supervisors.
Data Analysis of the Main Assembly Line
For the creation of VSM, the data which will be analyzed are:
Operation times
Change-over times
Batch sizes
Number of Shifts
Number of workstations/machines
Number of work in processes (WIP)
The process characteristics are acquired from the production supervisors and the process timings
from interview with operators for they held the best information on this topic. Although the times
can deviate hugely because of the sheer number of different designs, an average time has been
determined to be used. However for the number of WIP, a more direct approach has been used. For
three weeks an inventory count has been made and the average has been confirmed as the WIP
level. The data of the processes are shown in table 3.1.
Table 3.1 MDT and SDT Lines Process Data
Beside the usage of the data in the VSM, it is also important for capacity planning. In estimation the
company works for 280 days a year and a day consists of 3 shifts of 8 hours with 1.5 hour breaks. The
total available time is:

31
Because there is no efficient data about the breakdown and maintenance times an assumption of %5
breakdown time is made. So the actual total time is multiplied with a safety factor to find the actual
available time:
The yearly demands for the STD are 1800 and for MDT it is 2200. With the demands and available
time known the takt time is calculated for both lines:
SDT:
MDT:
After the calculation of the takt times, a capacity planning is carried out to assess if the demand is
met in each station and determine the bottleneck operation for both lines. The capacities of the
processes in SDT line is shown in table3.2.

32
SDT
No of
Workstations
Batch
Size
Daily Time
Avaible
Net Operation
Time
Capacity(280
days)
LV Winding 1 1 19,5 1,333333333 4095
HV Winding 2 1 19,5 4,333333333 2520
Core&Coil
Assembly 1 1 13 0,833333333 4368
LV & HV *
Connections 2 1 13 2 3640
Tanking 1 1 13 0,4 9100
NFH 1 6 19,5 8 4095
Cool&pres 1 6 19,5 2,5 13104
Test* 1 1 8,125 0,456666667 4981,751825
Packing &
Shipping 1 1 13 1,25 2912
Table 3.2 Current Capacity Planning of SDT Line
From the listed table 3.2, it can be viewed that the HV winding process has the least yearly capacity
with 2520. Therefore it can be bottleneck operation of the SDT main assembly line. Even though it is
the bottleneck, still the capacity satisfies the yearly demand. HV winding capacity is followed by
`packing & shipping` and LV&HV Connections processes in order.

33
For the MDT line the capacities are as table 3.3.
MDT
No of
Workstations
Batch
Size
Daily Time
Avaible
Net Operation
Time
Capacity(280
days)
LV Winding 1 1 19,5 1,933333333 2824,137931
HV Winding 3 1 19,5 6,9 2373,913043
Core&Coil
Assembly 2 1 13 2,333333333 3120
LV & HV *
Connections 2 1 13 2,5 2912
Tanking 1 1 13 0,6 6066,666667
NFH 1 5 19,5 10,41666667 2620,8
Cool&pres 1 5 19,5 2,533333333 10776,31579
Test* 1 1 8,125 0,656666667 3464,467005
Packing &
Shipping 1 1 13 1,25 2912
Table 3.3 Current Capacity Planning of MDT Line
For the MDT line, the bottleneck is again the HV winding process with a capacity of 2373 pieces a
year. However the second process with the least capacity is NFH although it is done in batches. Also
it should be noted that the HV winding have 4 machines actually but in the capacity planning it is
noted as 3. The reason of this is that one of the machines is not used in most of the time and the
operator availability at the night shifts. Most of the other processes have close capacities.
3.2.2 Current State VSM
After all the data about the main assembly line is gathered, these data are put into use for the
creation of VSM for both of the lines. The current state VSM of the MDT and SDT lines are in figure
3.5.

34
Figure 3.5 Current State VSMs of SDT(up) and MDT(down) Lines
The VSM just creates a clear picture of the material and information flow, hence to mark the
problems in this flow, a deeper analyze is done. However before the analyze, a note should be done
about the unfilled forms in the pre-assembly line. As mentioned before, this project was carried out
before the implementation of the new core stacking machine, therefore the core workshop is
included in the VSM just to show the flow of materials.
The first fact to be examined is the throughput time (TPT) because it is good identifier for both the
flexibility and the efficiency of the system. The TPT of the production line shows the time interval
between the production of a part starts and it is send to the customer. Thus the shorter the
throughput, the more flexible the system is. Also the ratio of the value added and non-value added
activities in the TPT, gives an estimate in the efficiency of the production.

35
From the sum of time intervals in the VSM, the TPT is calculated 8.16 days for MDT and 5.96 for SDT.
The dispersion of the value added and non-value added times in throughput are shown in table3.4.
Throughput
Time(days)
Value Added
Time(days) Waste Time(days)
Ratia of Value
Added(%)
MDT 8,17 1,37 6,80 17
SDT 5,96 1,00 4,96 17
Table 3.4 Lead Time Data of Current VSM
In both of the lines the value added time is %17 percent of the whole time, meaning the rest %83
goes to waste due to transportation and waiting. The layout of the floor is designed to minimize the
distances between station and the only considerable transportation waste is in the shipping process.
Thus the majority of the non-value added time is the waiting between processes. The four major
waiting areas are the shipping, HV winding, assembly on table and HV&LV connectors. All these areas
are identified in the VSM with a pull system from a safety stock.
The prime waiting area is the finished products inventory. In both lines almost %60 of the waiting is
recorded here. The underlying factor of this huge number of WIP is the uncertainty in the upstream
process and a limited number of made-to-stock products. Because the products are sent in parties,
even the products which are covered with protective coatings wait for the rest of their party to be
finished. This time can extend to undesired losses because the batching in the drying process and the
incongruity of the test shifts with the other processes. Also if a failure is detected in one of the
products in the tests, this waiting will be even prolonged because most of the times reworking the
product is not possible and the production should be started from the beginning.
The secondary huge WIP area is the HV winding. It should be noted that it is an expected result due
to its status as bottleneck. Because the production is scheduled according to the drum-buffer-rope
system, the allocation of the resources has been based on this process. Therefore for the production
in this station to continue even in the worst possible scenario a constant inventory is kept. The big
volume of this stock can be related to the sovereignty of the machines, where each machine works
on separate projects so must keep its own stock.
And the third important waiting area is the ``HV & LV connections``. Even the underlying cause of the
waiting times in the ``assembly on table`` station is the problems in this station so the importance of
the waste here increases. About the underlying factors of this huge waiting time, first this station has

36
the widest range of different parts to be assembled. Because of the deviation in the supply times of
these parts, a huge time is wasted in waiting for the arrival of the parts. Also although it is not
determined in the procedures, the operators in this station tend to work in a batch type style.
Therefore the operators first wait for all the assembled parts in the same project to be ready from
the previous stations and then start to work. This waiting can increase according to volume of the
order in the project and if one of the connections is not supplied in time, the flow can be interrupted.
One final important aspect in the waiting time is the transportation. Up until the ``assembly on
table`` the parts were transported through conveyor belt. However the coils are carried from there
to this station with cranes. Two of the three cranes on the ceiling of the plant can be used for this
purpose. Due to these cranes usage in various different tasks in the all three lines of production, the
unavailability of them can cause more wastes.
The production flow of both SDT and MDT lines are capacity oriented instead of tact time
orientation. The clearest indicator of this is the cycle time of the bottleneck. In both of the lines the
HV winding process is finished in a higher time than the tact, and especially in MDT line the cycle
time is 6,1h in contrast to the tact time, 2,59h. Here the demands are met with the number of
machines working on different products. A similar station is the insulation drying process where the
longest process times occur. The cycle times for MDT is 10 hours and for SDT 7,5 hours. However by
operating with a batching style and working for 3 shifts it meets the demand with a clear margin.
As for the flow of material through the line the first station LV winding starts with a push to keep a
constant inventory for the bottleneck. From there up to the connections assembly pull systems are
used. In this station the parts are pulled from the safety inventories before them according to the
scheduling and supply criteria of the projects. From here on again the materials are pushed to the
drying process so they can be available in one of the three cycle of operation start per day. The parts
which pass this station directly goes to pressure test in the order they enter and the testing
operators chose the priority of the parts according to their schedule. Finally in the packing they are
again pulled according to the shipping times of the finished good.
Also one other important fact about the current state is that all the operators are dedicated to their
respective stations. All the operators are specialized in their own stations and there is no rotation. In
the winding processes, although the HV and LV operations share similar traits, the operators in HV
can’t work LV and the versa because of the lack of knowledge on the machine. Another example of
this occurs in the connections assembly station. Once again the operators, who connect the LV parts,
do not help the HV assembly operators although they are in the same station.

37
3.3 The Idolized Production Model and Its Analysis
After the analysis of the current state VSM is done, the priorities for improvement of the line are
identified. From the early calculation, it was found out that the capacity of the plant meets the
demand of the market with a clear margin. Therefore the focus of the developments in the line
should not be the abatement of the cycle times to increase the capacity but issues which will
increase the compatibility of the company in the market.
Today with the widespread implementation of the lean manufacturing applications in the industry,
the production becomes more customized according to the customer demands. ABB’s design-to
order system to order system, that each product is specified to the customer, is a good application
for customer satisfaction but it can’t be said that its production system is compatible with it. The
backbone of the design-to-order system is a flexible and efficient production where throughput times
are low and wastes are minimal so changing from one project to another is done rapidly. However
the current state VSM shows clearly that the production flow is disrupted and does not allow
maximizing the advantages of the system.
Therefore in the visualization of the future VSM, the production line is composed to enhance the
total performance of the system. The waiting times are lowered to diminish the throughput time; the
change-over times are decreased to allow quicker passing through projects and the stations are re-
arranged for a smoother flow. The future VSMs for both lines are shown in figure 3.6. (For a more
detailed view see appendix)

38
Figure 3.6 Future State VSMs for MDT (upside) and SDT (downside) Lines
The new production model visualized in the future VSMs shows promising results while at the same
time not needing huge investments. Instead of creating more resources by integrating new machines
and processes to the system, it utilizes the performance of each station by allocating the existing
resources more evenly.
In the future VSM, the primary improved area is the processes before the insulation drying where the
flow is constantly interrupted with safety inventories. First the working style of the bottleneck is
changed. The extra fourth HV winding machine in MDT is sent to SDT line and the number of
machines evened with needed coils for a transformer in both lines. Instead of each machine
following a project individually to lower the importance of change/over times, the change times are
reduced to its half and a cell like system is visualized. In this system all three winding machines

39
undergo change/over at the same time and work on one coil of the same project. By this way the
cycle time of the process is lowered from 6.3 hours to below the tack time and evened with the
adjacent stations. The improvements carried to elevate the bottleneck operation, HV winding is in
chapter 4.
The connections assembly and tanking operations were combined to a cell to cancel the waiting time
before the tanking and overthrow the huge process time difference between them. The tanking
process is done by the LV winding operator instead of waiting for dedicated operators of tanking and
a balanced work load between LV and HV connection is assured. The operators here are trained so
that they can work in both of the assemblies in the situations where one operator is unavailable. Also
the work here is pure labor so a more flexible operation is advantageous.
As mentioned, no extra capacity contribution action is taken, hence from the re-arrangement of the
resources, the overall capacity alters modestly. The new capacity limits of the processes are shown in
table 3.5.
Table 3.5 Future Model Process Capacities
The only important capacity changes occur in HV winding and connection assembly & tanking
processes. The removal of the rarely used HV winding machine from the MDT line lowers the
capacity of the station only slightly due to the positive effect of the shorter change/over times.
However the implementation of this machine to the SDT line makes a huge impact on boosting the
SDT capacity. The system constraint is unraveled and the overall capacity increases to approximately
3000, the capacity of the new bottleneck. In both of the lines with the adding of the tanking process
to the same cell of connection assembly cell the capacity of the cell is lowered by nearly %20.

40
The capacity changes have an influence in the systems constraint where both lines have two
structural bottlenecks with close capacities. In MDT the bottleneck, HV winding process with 2520
yearly capacity is still one of the constraints with 2391 pieces/year but then newly formed
connection assembly cell is close-by with 2426 pieces/year. In the SDT line the bottleneck moves
totally to two stations, packing&shipping and connection assembly cell with 2912 and 3033 yearly
capacity respectively. To assign the connection assembly cell as the system constrain in both of the
stations is a desired outcome because the stations status that has the most deviance in the supplied
resources. Therefore by moving the constraint to this station, the upstream and downstream
operations can be planned according to the supply availability of the resources here and the waiting
times can be diminished.
With the new cellular working system in the processes, the material flow, between the LV winding
and insulation dying is advanced to cancel the flow disruptions. In the old production system the
scheduling of all the processes were done according to the HV winding and the work orders were
sent to each station. With the new model the scheduling is done according to the arrival dates of the
resources to the connection assembly cell and once all the materials are ready a kanban signal is sent
to the HV winding to start the production. The produced part in here are passed to assembly on table
and from there to connection assembly in one piece flow, hence the safety inventories which are an
important part of the total wastes is obliterated. However it requires a more precise scheduling
program so a system should be developed to accurately predict process times, especially for HV
winding.
With a better scheduling program, provided by kanbans and less throughput time, the inventory on
before the shipping can be debased to provide the goods just-in-time. Even if a defect is discovered
in the testing process, with the new more flexible system the defected product can be compensated
less than two days if spare parts are available. Therefore the waiting time before the shipping is
estimated as 1 day.
With the improvements in the future model, the throughput times and waste ratios alter to data in
table 3.6.
Throughput
Time(days)
Value Added
Time(days) Waste Time(days)
Ratia of Value
Added(%)
MDT 2,98 1,14 1,84 38
SDT 2,75 0,90 1,85 33
Table 3.6 Future Model Lead Times

41
The MDT line`s through put time lowers from 8.17 days to 2.98 days which is approximately 63
percent. For the SDT line it is 54 percent where it drops to 2.75 from 5.96. The ratio of the value
added increases in both stations; %38 for MDT and %33 for SDT. The analysis shows that a great
progress has been made in the company’s flexibility and production efficiency. The improvements
carried out to orient the company toward the future goal are explained in sections 4 and 5.
In conclusion about the VSM, it should be noted that the goals set in the future map are not written
in stones. As progress is made on the production system, the goals can become unfeasible or even
understated. In that case a new current state VSM should be created and new goals should be set in
for the future VSM.
CHAPTER 4 - Elevating the System Constraint
To prosecute the production system in the newly formed future model, first the current system
constraint should be ameliorated. Therefore a deeper analysis of the HV winding process is carried
on and from these research two main problems that are blocks to the process’ evolution stand out.
The first problem is the extent change over times due to its wasteful work procedure in both LV and
HV winding. This problem both prevents a cellular type production and stands as the underlying
factor of high safety inventories. The second conclusion is that no one has exact knowledge of the
process times, thus the vague information creates inefficiencies in both production scheduling and
material supplying. To overcome the problems the improvement activities conducted are:
Development and implementation of new changeover procedures and methods
Creation of a process time formula based on the properties of products
4.1 New Changeover System
In the new production model the cycle times of the winding processes are reduced with % 66. If the
changeover times are left as they are now, their ratio with process times would be 0.3. For a
production line where a project change, occurs averagely every 7 products, this ratio is unacceptable.
Furthermore with synchronization of the winding machines, each machine cannot make its own
pace. Hence the scheduling strategy to assign one machine to a very long project to one machine and
assigning the other deviating projects to other two for lowering the total number of changeovers is
not applicable and if an improvement on the changeover time is not made, the new system will

42
decrease the efficiency instead of busting the performance. To overcome this negative effect, it is
predicted that the changeover times should be at least halved. So a data analysis of the process is
carried out.
Figure 4.1 The Changing of the HV Winding Operation Work Flow
4.1.1 Data Analysis of Constraint Operation
As a part of CP3 Project implementation, ABB has implemented the Avix Method software for
monitoring manufacturing processes. Avix Method tool is a motion analysis program where the
processes recorded by a video camera can be used to carry a deeper analysis on the methodology of
manufacturing activities. From 2009 when Avix has started to be actively used, over a hundred hours
of filming has been done to create an archive on all of the production processes. Whenever a new
procedure or an improvement is proposed, the related files from this archive are used to base the
findings.
For the LV and HV winding processes where the changeover is nearly identical except installation of
different material types of conductor, there are several recording from different machines. However
to have more validate data for analyzing similar problems and to create a work description additional
video films from different projects were recorded and analyzed.
In both of the winding processes, it is observed that there are 4 objects of focus which the operator
should make sure fitting to the project to complete the changeover. So all the changeover activities
can be grouped based on which of these 4 objects that is prepared.
1. Coil: The changeover operations that the operator should do to ensure the coil is placed
properly to start the production compose this group. Preparation of the coil holders in the
machine and transportation, placing and affixing of the coil are its typical activities. In LV the
conductor sheets are placed over wooden shelves for picking but in HV winding they should

43
be chosen among the other LV winded coils on the conveyor. These operations are carried in
the front side or conveyor side of the machine.
2. Terminal: The operations concerning the object terminal are about preparing the winding
machinery for production. No material change is done on this group. The activities are
installation of the PLC program, or choosing of an already existing one, adjusting the frontier
holders for use and checking of any malfunction. Again these operations are carried on the
front side or conveyor side of the machine.
3. Conductor: These operations in this group are the activities carried out to switch the
conductor material to the fitting one for the new project. In LV the conductor are sheet rolls
while in HV they are either metal wires or less likely paper covered wires. According to the
projects two sheets/wire rolls may be needed to install. Handling the conductors via crane,
affixing wire holders, adjusting insuring the straightness of sheet/roll are counted in this
group. These activities occur in the back side of the machine.
4. Insulator: The activities in this group deal with replacing the old insulation papers with the
insulations fitting to the new project. In the LV machine long insulation paper rolls are used
but for HV strap insulation rolls are used. Two or more rolls can be used to achieve the
desired insulation thickness. The paper holders are stationed in the side of the machine.
It should be noted that all these operations can deviate from project to project. In many instances
projects with same material of conductor, insulator or both sequenced continues so no changeover
activity for that material is needed in the project change. By monitoring the project materials, the
planning department prioritizes scheduling projects this way. Also the design department tends to
use the same winding designs while making changes in the other parts because the time gap
between writing a new plc program and using an existing one is huge.
The Avix analysis made from different projects are very deviating. Therefore for a deeper
methodology analysis, from the data library the records which can be counted as the most standard
work where all four work groups are present and has the least unexpected events occurring are
chosen. The two operations were chosen are a 2500kVA transformer’ HV winding changeover
operation and a 400kVA transformers’ LV winding changeover operation
For the HV winding, the process chosen for deeper study was project 10117. The project was the
manufacturing of a transformer of 2500 kVA and its HV winding process was carried in Tuboly 294
machine. The changeover operation had been done by the dedicated operator alone save for some
minor jobs which he had help from the material handling personnel. From the analysis of the
operation, the task list and efficiency chart acquired from Avix is as figure4.2.

44
Figure 4.2 Task List and Efficiency Chart of HV Winding Process
There are a total of 21 tasks in the operation which takes approximately 60 minutes. In these 60
minutes of work there is no productive part with green indication at the performance chart. The
reason to this is that in theory changeover is not a value adding process but to precede it must be
accomplished. Therefore it is indicated with yellow color meaning it is a semi productive work. The
performance chart shows that %83 of the job is semi-productive while the rest %17 is waste. The
total waste is divided to 2 groups which is %4.78 waiting while %11.89 is unnecessary activities in the
work. For more detail in about the activities a task report was printed.

45
Figure 4.3 Task Report of HV Winding Process
The task report gives a better insight about the efficiency of all parts of operation. The type of
activity, the object in focus and the tool used for the task is described. Also the timings of waste and
productive activities for each task are given separately. As expected from a set-up operation the
placing activities have the highest value. The other high time consuming activities are handling,
adjusting, affixing and instructing.
It can be observed from the task report that the waits are divided proportionally throughout the
operation. The highest waste record was the time which the operator had to walk to the insulation
shop to retrieve insulation papers because it was not brought by material handling personnel.
Although the there are some waiting areas with high times, the real waste problem is caused by the
small waste times spread to all tasks because added together they form nearly %12 of all operation.

46
Figure 4.4 HV Winding Machine Layout
As the tasks which wastes occurred are monitored, the majority of this time is seen to be spent in
walking from one work place to another. Figure4.3 illustrated above shows the layout of the
machine. It can be seen that to work on the wires the operator should round the machine and reach
the walk path side of the machine and the insulator switching is done at the right side of the
machine. The tools are kept in the working area so the operator should walk back and forth
throughout the operation. The walking times are zero in the terminal operation because the operator
does not need to move for that operation but as the path he needs to walk extends the more waste
is recorded. The steps of the operator are counted from the record to be approximately 300 when
every step is counted as 0.8 seconds. In this calculation the path he had to to the insulation is not
counted. If that is added the operator spends 10 minutes of time just walking which has no value at
all and even decreases his performance because he tires himself.
A similar analysis is carried out in LV winding process for a 400kVA transformer. The winding machine
in focus was Tuboly 193 machine and the operator has done the changeover all by himself. The task
list and efficiency chart acquired is as figure 4.5.

47
Figure 4.5 Task List and Efficiency Chart of LV Winding Process
The LV set-up for this transformer takes 49 minutes. It should be noted that this time could be even
longer if the PLC program of the project wasn’t already present in the machine. The operator
accomplishes 22 tasks to finish the operation which is one more than the HV windings’. The efficiency
chart shows that the semi-productive work is %73.66 and the rest %26.34 is waste. Among the waste
area %1.71 is spent on waiting. The detailed task report is as below.

48
Figure 4.6 Task Report of LV Winding Process
In the LV changeover the highest time consuming activity is the placing again. It should be noted that
the instructions activity time is very low in this changeover. As mentioned before the program of the
project was already in the machine so it greatly reduced the time.
The waste percentage is %26 which is greater than it was in the previous projects. The waste times
are spread through all the processes, but their distribution is very different than the HV winding’s
changeover. In this process the majority of the waste time is spent in the conductor replacement. In
the HV winding the new wire rolls were carried by the operator for a very short distance with only
sheer force. However in LV winding the conductive rolls can’t be carried without the aid of a crane
for its heaviness. Therefore the operator should wait for the crane to be available then pick the right

49
roll from the inventory area and carry it. Plus the affixing of the conductor is more problematic; the
time spent in this task increases further more.
4.1.2 Creation of New Changeover Procedures
As the data of the winding process is gathered it is seen that even if all the waste time is eliminated,
it is not possible to reach the desired changeover times. The problem is not only the wastes but also
the long semi-productive work carried by the operator. Hence to find a solution to this problem, a
brainstorming activity is conducted. In this process, to generate creative ideas, the Triz problem
solving method was used. Although this method is generally used for product design solutions, it can
be efficiently applied for process improvements.
In the first step of Triz analysis, the contradiction matrix should be formed. The goal is to decrease
the changeover process times. Therefore the feature which is aimed to be improved is number 25,
loss of time. As for the contradiction feature, the property which is damaged by this action should be
identified. If the process time is diminished by just hastening the work pace of the operator, it would
lead to him to waste more energy and over exhaust himself. So the worsening quality in this problem
is number 22, loss of energy. The contradiction matrix with these feature are shown in figure 4.7.
Figure 4.7 Contradiction Matrix Intersections

50
The intersection in the Triz matrix proposes number 5, 10, 18 and 32 among the 40 principles. These
principles are:
5. Merging
Bring closer together (or merge) identical or similar objects, assemble identical or similar
parts to perform parallel operations.
Make operations contiguous or parallel; bring them together in time.
10. Preliminary Action
Perform, before it is needed, the required change of an object (either fully or partially).
Pre-arrange objects such that they can come into action from the most convenient place and
without losing time for their delivery.
18. Mechanical Vibration
Cause an object to oscillate or vibrate.
Increase its frequency (even up to the ultrasonic).
Use an object's resonant frequency.
Use piezoelectric vibrators instead of mechanical ones.
Use combined ultrasonic and electromagnetic field oscillations.
32. Color Changes
Change the color of an object or its external environment.
Change the transparency of an object or its external environment.
As the suggested principles are studied, while the numbers 18 and 32 are founded irrelevant with the
subject because they are more related with product designs; the merging and preliminary action
principles are found fitting to the changeover process. They are used as a base for the improvement
solutions to the problem.
The passage, “Pre-arrange objects such that they can come into action from the most convenient
place and without losing time for their delivery.” in the 10th principle, is directly pointing to the
kitting activities before the changeover process. ABB already has kitting procedures to prepare all the
necessary materials before the start of the projects. In the last coil before the new project, an order
to the material handling is sent for them to move the needed resources to kitting areas next to the

51
winding machines. However as seen in the Avix analysis, due to the material handling personnel’s
negligence some of the resource is not present in its kitting place causing the operator to personally
pick them up or mixed in the material pile in the kitting area, creating waste due to confusion.
These wastes can be eliminated easily with the implementation of a checklist to ensure the materials
are moved in time. With every new project a checklist, showing the resources to be placed before
the process, can be sent for material handling personnel to fill. By this way the material handlers can
see which resources are present in the kitting area and so the confusion caused by absent or mixed
materials can be eliminated.
As for the real creative idea, which shortens the changeover times to desired levels is formed from
the principle merging stating, “Make operations contiguous or parallel; bring them together in time.”
The idea generated is to create a parallel work flow where the operations don’t need to be
consequent to each other.
As shown in the Avix analysis, all the changeover tasks in the changeover processes are done by the
machine’s operator alone. As they are divided to the four groups (coil, terminal, conductor, insulator)
based on the object in focus, it is seen that although there prosecuting actions inside each activity
group, no continuity is needed between the different groups. Therefore to complete these actions in
the same time period is possible.
To assess the suitable task for dividing, the process timeline chart that is derived from the HV
winding process is used. It also represents the LV winding chart for both operations are identical.
Figure 4.8 Current Timeline of Winding Process

52
As the charts are examined, in addition to the non-prosecuting nature between the activity groups, it
can be observed that no consistency in the work flow is present. The single operator first starts a task
in one station, then in the middle of it, is tangled on another job, thereby constantly walking from
one location to another. The aim is to create work groups which can be done simultaneously so a
continuous work flow with less time can be achieved.
Because the goal is to shorten the time period to its half, a team of two operators are determined to
participate in the parallel operations of the process. The tasks could be divided to a team of four
where each operator gets to do one activity group but that much time reduction is not necessary and
it would cause a huge loss of manpower.
An important point in dividing the operation is to create a balanced workload for the two operators
participating in the changeover. Although the time needed for each activity group can differ in
different projects, for most of the new projects they are close to each other. So separation of two
activity groups to each operator is possible and creates similar time intervals. So time differences
between activities have secondary importance while the main base factor in task dividing goes to the
location of the activity.
The terminal adjustment and coil placement is done at the machine operator’s work station while
the replacement of conductor and insulator is carried on the side and back of the machine. The ideal
work style for best performance is to ensure that the operator never leaves his station. Therefore
assigning the coil and terminal activity groups to the first operator and the rest to the second
operator the optimum efficiency can be achieved. The predicted timeline charts with separating the
process is seen in chart 4.9.
Figure 4.9 Idolized Timeline of Winding Process with the New Procedure

53
By taking account all these fact the new procedures for the change over process is:
HV Winding Procedure
Title: HV Winding Changeover
Purpose: To ensure standard work flow is followed through all HV winding changeover activities,
prevent time and quality deviations in typical operations and increasing the awareness of the
operators.
Scope: This procedure applies to all changeovers in the project changes at HV winding machines.
Responsibilities: Two participants, one of them the operator of the HV winding machine and the
other one, either a LV winding operator or material handling personnel, is responsible from carrying
out the assignment. HV winding operators are responsible from coil and terminal adjustment activity
groups marked with A; LV winding operators / material handling personnel are responsible from
insulator and conductor change activity groups marked with B.
Materials: Coil produced in LV winding process, Insulation paper rolls, conductor wire, wrench, knife,
HV winding machine, Manipulator
Procedure:
1-B Control the checklist to ensure all necessary materials are in kitting area.
1-A Drag the right coil through the conveyor. Pick it up from the conveyor with
manipulator and place it on the winding machine. Adjust the holder clips so that they will support it
and take out the manipulator. Screw the clamps tightly with wrench. If a pressure indicator is present
in the wrench screw until specified measurement is reached.
2-B Take out the remaining conductor wires from the previous project and place them in
kitting are where they will be picked up by material handling personnel later. Drag the new
conductor wire from kitting area and place them to the machine. If the wires are still in plastic
package first cut the package with knife. Affix the wire to wire holders. Then, scarf the wire tightly
through roller mechanism until the end comes from the terminal side, ensuring no amplitude that
will jam the machine is left.
2-A Check the terminal if it is responding to commands. Introduce the PLC program to the
terminal. If a project which hasn’t been done before is introducing, write the parameters and

54
definitions of the program. However if the project is already registered in the machine, choose it
from machine memory.
3-B Take out the remaining insulation paper rolls from the previous project. Pick up the
new insulation paper rolls from the kitting area and place them to paper holders at the side of the
machine. Treat the papers through roller mechanism until the end of the paper comes out from the
terminal side.
3-A Affix the edge of insulation paper and conductor wire that is present at the operation
area to the coil.
4- If the tasks are completed before the other participant, help them in their activities.
5- In the end of the changeover process introduce the process ending date to SAP
program.
LV Winding Procedure
Title: LV Winding Changeover
Purpose: To ensure standard work flow is followed through all LV winding changeover activities,
prevent time and quality deviations in typical operations and increasing the awareness of the
operators.
Scope: This procedure applies to all changeovers in the project changes at LV winding machines.
Responsibilities: Two participants, one of them the operator of the HV winding machine and the
other one material handling personnel, is responsible from carrying out the assignment. LV winding
operators are responsible from coil and terminal adjustment activity groups marked with A; material
handling personnel are responsible from insulator and conductor change activity groups marked with
B.
Materials: Core, leadout bar, insulation paper rolls, conductor plate rolls, wrench, rivet, LV winding
machine, Crane
Procedure:
1-B Control the checklist to ensure all necessary materials are in kitting area.
1-A Adjust the clips that the core will be place to centre. Pick up the core from kitting area
with crane and place it on the machine adjusted before. Screw the clamps tightly with wrench. If a

55
pressure indicator is present in the wrench screw until specified measurement is reached. Then place
the rivet on to the machine
2-B Take out the remaining conductor plate roll from the previous project with crane and
place them in kitting are where they will be picked up by material handling personnel later. Transport
the new conductor plate roll from kitting area again using crane and place them to the machine.
Adjust the roll that it fits perfectly to the holding place in square shape, take of the crane and lock
the mechanism.
2-A Check the terminal if it is responding to commands. Introduce the PLC program to the
terminal. If a project which hasn’t been done before is introducing, write the parameters and
definitions of the program. However if the project is already registered in the machine, choose it
from machine memory.
3-B Take out the remaining insulation paper rolls from the previous project with crane.
Pick up the new insulation paper rolls from the kitting area and place them to paper holders at the
side of the machine using the crane. Treat the papers through roller mechanism until the end of the
paper comes out from the terminal side.
3-A Pick up the first leadout bar from the grinding machine and place it on cold welding
area over the machine. Then affix the edge of insulation paper and conductor wire that is present at
the operation area to the coil.
4- If the tasks are completed before the other participant, help them in their activities.
5- In the end of the changeover process introduce the process ending date to SAP
program.

56
4.1.3 Pilot Area Implementation
Figure 4.10 Image of Pilot Process
Before implementing the new procedure to all winding stations, there is a need to test it in
application check the feasibility of its implementation and accuracy to the goals set. For this reason,
the SDT LV winding area is chosen as a pilot area. The changeover of the same project, where a single
operator done the changeover of a 400kVA transformer’s coil in Tuboly 193, is carried out with the
new procedure. It is analyzed in Avix for comparison with the old method. The task list and efficiency
chart acquired is seen in figure 4.11.
Figure 4.11 Task List and Efficiency Chart of Pilot Area

57
The data gathered shows promising results. With the implementation of the new procedure the 43
minutes changeover time has reduced to 22 minutes, nearly half of what it was while a single
operator was operating. Also task was taking 3000 seconds to finish before. With the new procedure
the total time spent by both operators for individual tasks is 2162 seconds. This reduction is done in
the waste area where it is decreased from %24 to %2.52.
4.1.4 Operator Allocation
As all improvements the new changeover system has an aftermath that needs to be solved. To
reduce the process times, a new resource which is the second operator in this case, has been
introduced to the system. This resource can be provided by recruiting new personnel or changing the
use of the existing personnel to satisfy the needs. The assigned job involves placing of the materials
to ready the machine for production, so it fits to the work description of material handling personnel
and machine operators. The new changeover system should allocate both the material handling
personnel and machine operators in an efficient way so the overall productivity does not drop.
If the assumption that there are 7 products in every project is considered; every day approximately 3
projects are done which need 3 changeovers for LV winding and HV winding each. Because that all 3
machines will go through set-ups in the HV winding changeover, this corresponds to 12 machine set-
ups which take around 3 hours of work load. The new procedure passes some of the work load of
machine operators to material handling personnel.
The duties of material handling personnel are accepting the materials arrived from suppliers and
moving them to their shelves in the stock area, ensuring that the necessary materials are in kitting
places before and throughout the project; and helping the movement of products in the line in the
instances the cranes are used. If the production schedule is assigned as before where every machine
has its own pace in projects, the only problem would be the extra burden of scheduling one material
personnel. For the LV winding changeover the problem is just this.
However the simultaneous changeover, idolized for the HV winding machines in the future VSM
production, produce a more complex problem. The three HV winding machines have to go through
changeover at the same time. With the introduction of parallel operations, there should be 2
operators working on each machine so a total of 6 operators are needed. 3 of them are the HV
machine operators and it was thought that the rest would be material handling personnel. However

58
there are only two material handlers in each shift and recruiting one more was found unpractical.
Hence the problem becomes how to fill the gap of missing operator.
The solution is found from a present practice. It is not written as a procedure but in team work
application, the HV operators can ask for help from LV operators when they face with a problem. So
who is more fitting to fill this gap other than the operators who are closest to this station plus
already have knowledge on the process? Although LV operators are ideal for the task; before they
can be assigned as the third participant, it should be ensured that the production flow would not be
interrupted due to this.
The new assignment will add an approximately 0.25 hours extra task to LV operators for every
changeover. If this time con be eradicated inside the normal production flow, the solution is
applicable; otherwise another solution should be sought. When a comparison between the winding
times of LV and HV is made, from the VSMs it is found out that the average HV winding times are
greater with 0.3 hours in MDT and 0.15 hours in SDT. Hence in the normal flow these 0.25 hours
extra task will act as a work load balance and won’t cause any disturbances.
Figure 4.12 Allocation of Operators

59
4.2 HV Winding Machining Time Formulation
Most companies believe that they have full control of their production floor but the reality is that
they have only vague knowledge based on the intuitions of their workers. Therefore, to grasp what is
actually going on in the production floor is an essential part of the production engineers and
managers job so that can take the reins and direct the production to better. To accomplish this, they
need the right data gathering tools which will provide them accurate feedback from the production
floor. One of the most vital elements in production is time. Every second delayed in producing a part
is a waste of money so a equality between time and money can be formed. Therefore it is crucial for
a company to know what time will be wasted in each process before hand to manage production,
just as it knows which price it would pay for a service or material to manage its finance.
One of the biggest problems in ABB transformers production floor is that although the production
engineers and managers have great technical knowledge on the processes, their information is
lacking on the processes times which depends on mainly labor force. In the production line only the
sand drying processes has standard times because the NFH and LFH machines are fully automated
and they are autonomous from the project’s features. However the operation times for the rest of
the processes which mainly relies on the labor force, certain limits can’t be made because they are
highly depended on the changing properties of the projects. The HV winding is one these processes.
In the winding process there are many variants that differ from project to project, so usually only
inaccurate predictions can be made. Operators can’t give specific dates when the product will be
over because no standardization of process times is done.
The importance of knowing precise machining times in the HV winding has greatly increased in the
new one piece production flow idolized in the future VSM. The operation time is greatly reduced
with the implementation of cellular working style to provide flexibility so emergency orders could be
quickly put to production and rapid project changes can be made to market demands. However if the
scheduling done in the production planning department can’t match the real time applications, then
instead of a smooth flow there will be chaos and the control of upper management will be lost.
Furthermore the allocation of workers in the changeover system introduced in the previous chapter
is not applicable if the project finish times are set accurately. For these reasons, a research is
conducted to create a formula which will generate precise machining time predictions.
The first approach was to sort the process time data gathered before according the projects and use
this to create a curve out of these points. Then the variable changing between projects would be
singled out and a curve fitting process would be done to produce a formula. This process needed a
huge range of reliable data. The primary idea was to use the data that the operators filled in the
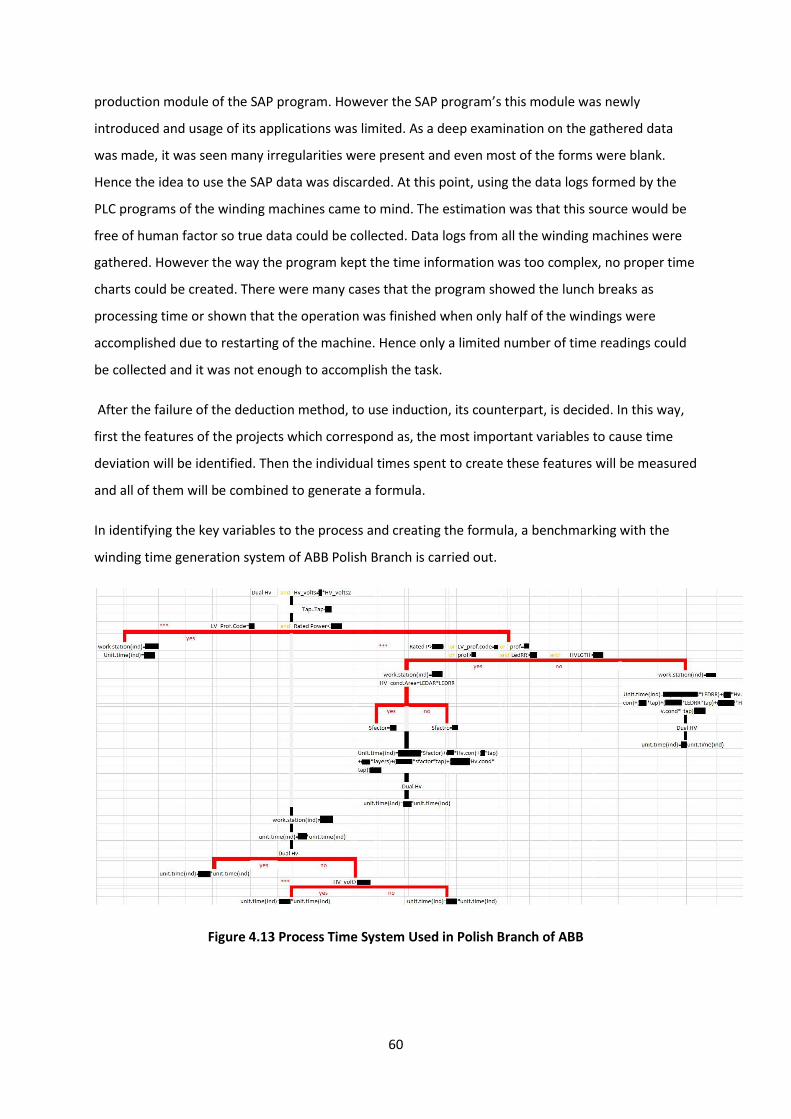
60
production module of the SAP program. However the SAP program’s this module was newly
introduced and usage of its applications was limited. As a deep examination on the gathered data
was made, it was seen many irregularities were present and even most of the forms were blank.
Hence the idea to use the SAP data was discarded. At this point, using the data logs formed by the
PLC programs of the winding machines came to mind. The estimation was that this source would be
free of human factor so true data could be collected. Data logs from all the winding machines were
gathered. However the way the program kept the time information was too complex, no proper time
charts could be created. There were many cases that the program showed the lunch breaks as
processing time or shown that the operation was finished when only half of the windings were
accomplished due to restarting of the machine. Hence only a limited number of time readings could
be collected and it was not enough to accomplish the task.
After the failure of the deduction method, to use induction, its counterpart, is decided. In this way,
first the features of the projects which correspond as, the most important variables to cause time
deviation will be identified. Then the individual times spent to create these features will be measured
and all of them will be combined to generate a formula.
In identifying the key variables to the process and creating the formula, a benchmarking with the
winding time generation system of ABB Polish Branch is carried out.
Figure 4.13 Process Time System Used in Polish Branch of ABB

61
The Polish Branch of ABB has a unique time processing system where an effective time formula is
used. With just filling the project specification, accurate HV machining time data for all transformers
can be generated with the program. Although the parameters used by the Polish branch stands as
the base for the formulation which is being developed, it can’t be used directly. The reason of this is
that the difference of production systems between branches because the status of Polish
Transformers Factory as ABB’s STD focus factory which priorities SDT products. Their STD products
are mainly standardized and they do mass production with much higher number numbers so their
production is fully automated with CNC machines. Therefore their formulation is adapted to fit the
needs of Turkish branch’s production system.
With the analysis of Polish Branch’s formula and putting an emphasis on our own production system,
the parameters for the formula are identified. They are:
Rated Power
Thickness of Wire and Width of Wire (Twire*Wwire= Wire Area)
Number of Wires in Winding
Number of Total Windings
Number of Layers
Number of Leadouts
Because the induction method is followed, the total process has been divided to sub-operations and
these sub-parts are analyzed individually. The parameters which effect these sub-operations are
sorted.
1. The first time consumption is done in the preparation of the machine. This part gives the
time for the placing taking out of the coil and attaching the wire to the coil to prepare for the
production. Two parameters are affecting this time. They are the rated power and wire
count. Unlike the Polish branch the rated power has less importance to the time. The only
separation it creates is that it changes the machine which the production will be carried
according to if the products are SDT or MDT. The other variable is the wire count. The
preparation takes higher time if two wires will be connected instead of one. Taking account
the difference of set-up times in SDT and MDT machines and extra time spent on attaching
the second wire, the formulation is created.

62
=2 ======>
Tprep = tp1
> 315 ======> CountWire
=1 ======>
Tprep = tp2
Rated Power
=2 ======>
Tprep = tp3
< 315 ======> CountWire
=1 ======>
Tprep = tp4
2. The second part of the formula is the safety part. In most cases in the middle of the process
the wire on the machine ends and forces the operator load a new wire. The part of the
formula shows the time spent in this material changing. The wires rolls are standardized in
weight so if the cut area of the wire increases the length of the wire decreases. With a
shorter wire length, the frequency of wire changeover in the middle of the process increases.
Hence the formulation oversees this parameter.
3. The third part is where the time spent on revolving the wires over the coil by the machine on
a arranged cycle. The period of each cycle is related with number of wires and wire area. As
the area of the wire and number of wires increase the rotation speed of the machine lowers
so the cycle time increases. The total time is the multiplication of each cycle’s time and total
number of cycles/windings so the time spent in this process can vary according to the
bigness of the transformer.
4. The fourth part generates the time spent on the work done by the operator to form the
starting and end features of each layer. There are not much variable which differ the work so
an average time, D, is taken and multiplied with the total number of layers.

63
5. The last part is the composing of the leadouts. Here the end wire is cut and bended to for
the leadouts. Because it is a rapid process the wire area or number does not have a great
importance. From many projects the forming times of leadouts are measured and their
average, E, is taken.
These sub-parts are combines to form the formula which generates the total process time. It is:
To confirm the reliability of the formula, it was used in various projects with different features.
Table 4.1 Formulated Times Based on Project Features
To compare the data acquired from the formula with company’s knowledge, number of products in
each project on the list is generated with a program. This generation is done in a way that that it

64
meets the average 7 transformers per project and the number of products decreases as the rated
power gets higher. These generated numbers is used on finding the average HV winding times for
both of the lines.
Avarage of Formulated Times
SDT MDT
84 min 126 min
Table 4.2 Average Times Gathered from Formulation
The results are very close to the actual data that are recorded in the production floor. The average
HV winding times for per coil confirmed by the company was 2.1 hours for MDT and 1.35 hours for
SDT. It can be clearly seen that the formula gives the exact data for MDT and a very close data for
SDT. It is a clear proof that the formula created is very effective.
Finally to just get another view, the time data generated by the formula is compared with the limited
data that could be salvaged from the machine data logs. As mentioned before, the machine data logs
are not very accurate and for only some project reliable data could be gathered.
Figure 4.14 Comparison of Times Generated from Formulation and Datalogs

65
In comparison of the data generated and data logs from the machine is very different. However for
the projects which high number of sample data that could be gathered from the data logs, the values
are very close to each other. Such examples are:
Project kVA Samples Formulated time
Time from Machine
Log
8--- 1000 62 141 149
9--- 1250 29 140 150
8--- 300 300 98 94
8--- 800 11 136 140
Table 4.3 Projects with Similar Times from Formulation and Machine Logs
There are many other examples like this but as mentioned it just to get another view and does not
prove anything due to unreliability of the data.

66
CHAPTER 5 - INVENTORY LAYOUT OPTIMIZATION
In the recent years, the manufacturing world realized the significance of inventory management to
cost reduction. Many companies implement inventory systems such, as JIT management and Kanban
systems, to minimize their inventory cost. The best example showing this importance is American
Company, Wal-Mart, which organized it supply chain to the point that no stock material is kept and
the inventory cost is reduced nearly to zero. For companies which’s production is an essential part of
its activities, keeping a constant amount of inventory is a must. Therefore these companies try to find
optimal solutions on how to keep their inventories in most effective ways. In this section, the existing
inventory layout of ABB transformers plant will be improved to create a more efficient flow.
ABB transformer plant uses an open inventory system, where the material stocks are kept in shelves
around the production floor. A few years back, there was debate on turning to warehouse system
but an assessment with production supervisors is carried, it was concluded that the advantages
predominate its downfalls. The open inventory does not need a separate construction or place to
sort the materials and the transportation distances are smaller. Also all the workers in the plant can
view the levels of inventory. However the open inventory is more disorderly so finding the right
material among the stock pile is harder. Also the inventory occupies a place in production floor and
the material handling activities carried here creates a chaotic environment.
Before the implementation of CP3 project a similar study was carried out and materials were sorted
to their specific cells to get effective transportation distances. However to this day, the production
floor has changed a lot, with an increase of capacity and more inventory locations. In addition to this
in the previous study no system to allocate the materials, with different properties but in the same
family, were designed.
The primary problem with the current layout is its although material groups are divided to different
shelves, there is no system which defines how materials with different measurement in the same
group distributed. In example, there are 9 shelves where Al wires are kept. However there are no
rules that determine where a wire with specific measurements will be placed among them. So only
the operator which put it knows its location and another operator should search all the shelves to
find the necessary material. This leads to loss of time for searching. Even there are incidents that the
material could not be found, thus, the production is stopped and the production schedule is
interrupted. This incident is seen frequently in night shifts. Most of the material acceptations are
done in the morning shifts so in night shifts the workers does not know the location of the needed
resource. This leads to halt of the line until morning or changing to another project deviating from
the schedule.

67
The new layout will:
Provide an update to the old layout study with covering the new inventory locations.
Create a system with a defined order where the material search is easier and faster.
Eliminate the production halts caused by unavailability of resources especially at night shifts.
Decrease the burden on material handling personnel to provide them time for working on
the changeover process introduced in the previous chapter.
The idea behind the new layout is simple. The old shelf structure was arranged according to total
weight of each material group and minimizing the transportation distances. The new layout will keep
it as a base with just minor changes and add a new sorting system inside the material groups in
regards to total weight of materials with different measurements. At the same time the layout will be
created in regards to the distances should be covered and try to find an optimum solution. The
activities that are done follow as:
1. The old inventory layout is analyzed and the production floor is examined to mark the new
inventory locations which were added with the expansion of the plant.
2. The yearly raw material arrivals data are gathered from the SAP files and in the light of this,
yearly holding capacities of each shelf is identified.
3. Based on the yearly amount of each raw material group (Al wires, Cu wires, Al plates ….) and
distances to the operations related, they are matched with cabinet groups which there are
mostly 5 shelves in each cabinet.
4. The paths of the materials from inventory location to the operation area are identified and
shown in the layout.

68
Figure 5.1 The Inventory Layout and Transportation Paths
5. The materials inside each group are sorted in regard to their distinctive variable as; Al wires,
Cu wires and paper covered wires according to wire diameter; the connector wires according
to the cross-section area; Al and Cu plates in according to their thicknesses. By taking
account the yearly amount of materials of different measurements and trying to minimize
their transportation distances they are distributed to different shelves. The new layout is
created.
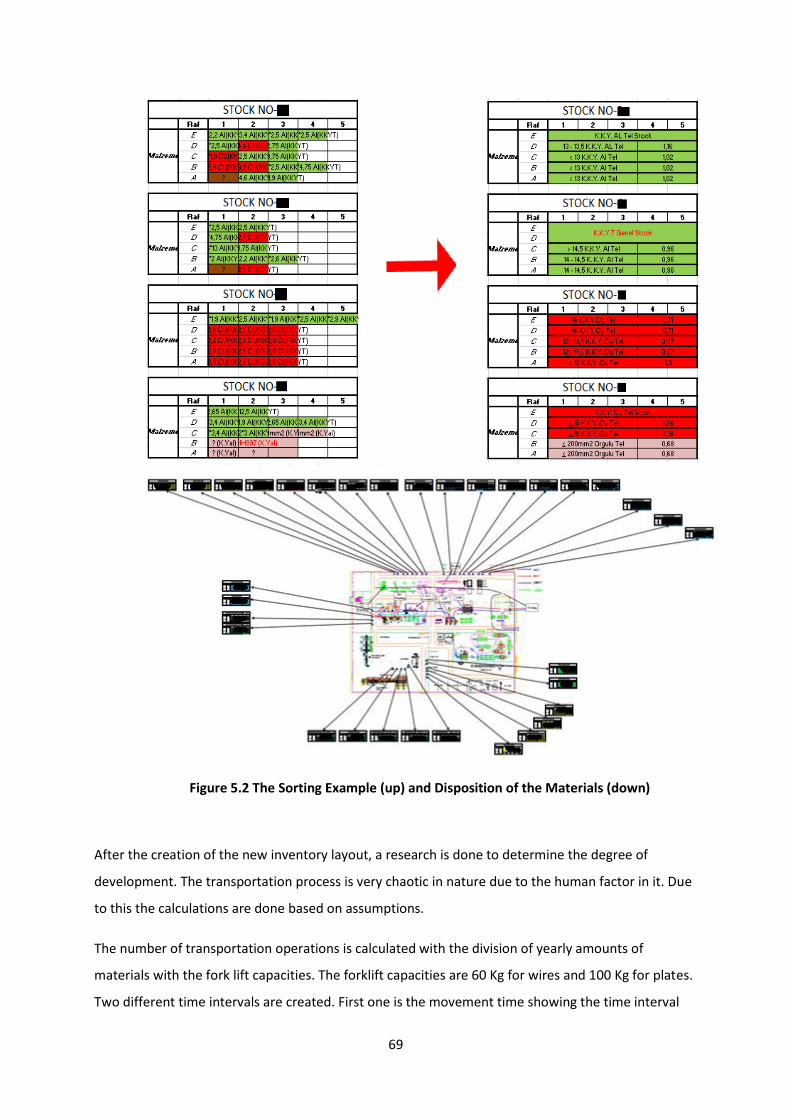
69
Figure 5.2 The Sorting Example (up) and Disposition of the Materials (down)
After the creation of the new inventory layout, a research is done to determine the degree of
development. The transportation process is very chaotic in nature due to the human factor in it. Due
to this the calculations are done based on assumptions.
The number of transportation operations is calculated with the division of yearly amounts of
materials with the fork lift capacities. The forklift capacities are 60 Kg for wires and 100 Kg for plates.
Two different time intervals are created. First one is the movement time showing the time interval

70
that is spent by the operator riding the forklift to reach a location either to pick up the material or
place it. The time spent here changes with the length of the path and speed of the forklift. The
forklift speed is taken as a constant, 1.95m/sec. The second time interval is the search time which the
operator spends searching the shelves to pick up the right material or searching for a suitable place
to place it. This time could change significantly with unknown factors so this is the part which is
mainly based on assumptions. In the old system where a specific material could be found in any shelf
which belongs to that raw material group, the operator could either find the right place in the first
try or after checking all the other shelves. The assumptions in here are that the operator spends 50
seconds to search per cabinet and in %60 of all his works he finds it in the first place. The percent of
finding the material in the rest of the shelves are evenly distributed. With this formula the search
time interval for each activity changes from 50 seconds to 3.5 minutes for material groups with
different shelve numbers. After all of the time savings are calculated for each material group, they
are added to find the overall performance improvement.
Table 5.1 The Effect of the New Layout in Search Times
The new layout showed effective results. The movement time is decreased by %5.25 and search time
is improved with %38.31. The yearly total time that is the sum of search time, movement time plus
the transportation time at the accepting of newly arrived raw materials, has decreased from 609
hours to 448 hours with a margin of %26.5.

71
With the new layout the work load on the material handling personnel has been decreased
approximately 35 minutes every working day. This free time could be effectively migrated to the
changeover activities introduced in the previous chapter and the lower their burden. Also because
the specific material’s distribution has been lowered to a limited range of shelves, the production
halts due to inability to find the needed resources at night shifts is diminished.
Although the new layout is a good start for organizing the inventory, there is still much to cover to
reach an effective inventory management. ABB plans to carry a project of implementing a banderol
system for raw materials in the coming years. When the company knowledge on the SAP program
will be matured, the inventory management will be integrated with the program. In the material
acceptance a banderol will be stick to the material and the electronic data of its amount, location
and project start date will be followed from the SAP. At that time the inventory layout may change
and instead of a sorting system based on material properties, they can be distributed according to
the date they would be used.
72
CHAPTER 6 - CONCLUSION
In the beginning, the aim of the research was set as to advance the production of MDTs and SDTs in
ABB Distribution Transformer Plant in to a more flexible and efficient system. Through the project
the objectives to accomplish this goal, generation of a new production model is done and activities to
adjust the production to the new system: elevating the system constraint and improving the general
efficiency with waste reduction are carried out.
With the creation and analysis of current VSM, the opportunities of improvement have been
identified and a new production model is created. The new model showed improved agility and
efficiency with promising results of at least % 50 throughput time reductions and % 100 increases in
value-added time ratio.
The bottleneck operation, HV winding which stands as a system constraint is unraveled with
reduction of its process times to one third of what it was without outsourcing while keeping the
capacity constant. To prevent efficiency drops a new changeover procedure is introduced that halves
the current changeover times and implementation of it in a pilot area is carried out where expected
results are gathered. The operator allocation system to meet needs in the new procedure is
proposed from the present resources.
Finally a new inventory layout is created to reduce the waste in transportation. % 26 time reductions
are acquired with this layout to be distributed to the usage of operators in other works.
In conclusion the foundations of transition to the new agile production system are laid through the
project so the research can be assessed as successful.
However there is still much ground to cover to reach the idolized production model. For future work,
after the implementation of the new core machines, they should be integrated to the VSM to get the
complete view of the production. Also there are still many other processes that need to be improved.
The inventories, especially the finish product’s inventory, should be reduced with implementation of
JIT management but to this a more standardized supply chain management system should be
developed. The operators should be trained to be able to work in different stations for a more
flexible system.
In manufacturing system improvements never ends. Even if the idolized model is reached perfectly in
future, the value stream mapping process should be carried out again to assess the needs of the day.

73
A new model should be idolized; with implementation of more lines in case of capacity needed or
with changes at the dying process to allow one piece flow in case of lesser throughput times needed.

74
REFERENCES
Common Practices Production Practices CP3: Project Implementation Guide Version 1.2 , ABB
Corporate Research Centre , Vasa, Finland, December 2003.
Massuda, M. , Adali, M. (2009) Drummer APS Implementation: Design of Production Flow-
DBR ABB-Istanbul Version 1.0 , ABB & Linter Companies Co-operate Project , Istanbul ,
Turkey.
CP3 Istanbul Project: Gate 5 Meeting , {ABB Inside Company Presentation} , Istanbul , Turkey,
1 April, 2009.
Introduction to ABB DTR Factory & Design Process , {ABB Inside Company Presentation }
Istanbul , Turkey , July 2010.
Distribution Transformers , ABB Power Distribution Publication, Istanbul , Turkey.
Dulger, F. (2007) Transformer Training ,{ABB Inside Company Presentation} , Istanbul ,
Turkey.
Goldratt, E. M. , Cox, J. (2004) ”The Goal: A Process of Ongoing Improvement” . 3rd ed. ,
North River Press.
Rippenhagen, C. , Krishnashwamy, S. (1998) Implementin The Theory of Constraints
Philosophy in Highly Reentrant Systems , Austin, Texas , Winter Simulation Conference.
Nave, D. (2002) How to Compare Six Sigma, Lean and Theory of Constraints , American
Society of Quality.
Moore, R. , Scheinkopf, L. (1998) Theory of Constraints and Lean Manufacturing: Friends or
Foes? , Chesapeake Consulting, Inc.
Liker, J. K. (2004) “The Toyota Way: 14 Management Principles from the World’s Greatest
Manufacturer” , McGraw-Hill , USA.
Keller , P. A. (2001) Recent Trends in Six Sigma , Quality America Inc. , Tucson, AZ85710.
Introduction to Theory of Constraints , Mekong Capital Ltd. , Viet Nam, 21 July, 2005.
ABB Poland , Richard , The University of Western Ontario , Ivey Publishing , 1998.
Stewart, D. M. , 5-S and Value Stream Mapping , {Presentation of Anderson Schools of
Management}, University of New Mexico.
Fruggiero, F. , Lanbiase, A , Negri, F. (2006) Design and Optimization of a Facility Layout
Problem in Virtual Environment , University of Solerno , Italy , Proceedings of ICAD 2006.
Grajo, E. S. , Bozer, Y. A. LayOPT: A Data Driven Facilities Layout Optimization System for
Engineers , Department of Industrial and Operations Engineering, The University of Michigan.
Abdullah, F. (2003) Lean Manufacturing Tools and Techniques in the Process Industry with a
Focus on Steel , University of Pittsburg.

75
Buyuk, B. (2004) , Lean Manufacturing , HBS Solutions Bilgisayar ve Yazilim Sistemleri Sanayi
ve Ticaret Lim. St. ,Turkey, September 2004.
Weigand, H. , Research Methods and Methodology , {University Presentation} , University of
Tilburg.
AViX Method Theory Manual , Solme AB , Goteborg , Sweden , 2006.
AViX Method User’s Manual , Solme AB , Goteborg , Sweden , 2006.
TRIZ Handbook , St CC Coaching & Consulting , Izmir , Turkey , 2010.
Mikler, J. ,Value Stream Mapping , {Presentation of KTH/ITM MG 2203}, 2009.
Atlihan, T. , Demir, B. , Hergul, M. (2009) Value Stream Mapping Report on the Production of
M Company , Royal Institute of Technology.
TRIZ Theory of Inventive Problem Solving Seminar, UCTEA Chamber of Mechanical Engineers,
Izmir, Turkey , June 2010.
Efficiency Improvement Techniques in Production, UCTEA Chamber of Mechanical Engineers,
Izmir, Turkey , March 2010.
Mazur, G. Theory of Inventive Problem Solving(TRIZ),{Internet} , 1995 {updated February 26,
1996} , Available at www.mazur.net/triz
ABB Group home page
www.abb.com
www.Triz40.com
en.wikipedia.org

76
APPENDIX
Appendix A – Current State VSM of MDT Line
Appendix B – Current State VSM of SDT Line
Appendix C – Future State VSM of MDT Line
Appendix D – Future State VSM of SDT Line

77

78

79

80


