Improving Utility and Accessibility of the APSU Natural History Collections
Upload
trinhtuyenCategory
view
214download
0
1
PAGE TITLE HERE
Accessibility, utility and
learning effects in university-
business collaboration
ERC Research Paper No 57
February 2017

2
Accessibility, utility and learning effects in
university-business collaboration
Nola Hewitt-DundasEnterprise Research Centre and Queen’s University Belfast
Areti GkypaliEnterprise Research Centre and Warwick University
Stephen RoperEnterprise Research Centre and Warwick University
The Enterprise Research Centre is an independent research centre whichfocusses on SME growth and productivity. ERC is a partnership betweenWarwick Business School, Aston Business School, Imperial CollegeBusiness School, Strathclyde Business School, Birmingham BusinessSchool and Queen’s University School of Management. The Centre isfunded by the Economic and Social Research Council (ESRC); theDepartment for Business, Energy & Industrial Strategy (BEIS); Innovate UKand the British Business Bank. The support of the funders is acknowledged.The views expressed in this report are those of the authors and do notnecessarily represent those of the funders.
3
ABSTRACT
UK government reports have emphasised the potential role of universities in
driving localised economic development. There may be a utility-accessibility
trade-off, however, between the accessibility of local university knowledge
and its ‘fit’ with the specific needs of local firms. Here, using data from UK
Innovation Surveys (UKIS) covering the period 2004 to 2012, we examine
this trade-off and how it differs for firms of different sizes. Our analysis
suggests four main empirical results. First, we find support for the predicted
inverted-U shape relationship between the distance between collaborators
and the innovation benefits. Second, we find evidence, in accord with the
utility/accessibility trade-off, that local university collaboration benefits only
small and medium firms. Third, we find that learning effects from previous
collaborations with customers, suppliers etc. increase the probability of
collaborative activity. Fourth, we find strong evidence of the persistence of
university collaborations. Our results re-affirm the evidence from other
studies of the value of university collaboration and suggest the value of policy
action to address market failures which arise in the formation of university-
small business collaborations.
ACKNOWLEDGEMENTS
The statistical data used here is from the Office of National Statistics (ONS)
and is Crown copyright and reproduced with the permission of the controller
of HMSO and Queens Printer for Scotland. The use of the ONS statistical
data in this work does not imply the endorsement of the ONS in relation to
the interpretation or analysis of the statistical data. The analysis upon which
this paper is based uses research datasets which may not exactly reproduce
National Statistics aggregates. Useful comments were received from Ben
Marriott, BEIS.
4
CONTENTS
ABSTRACT .......................................................................................3
Acknowledgements .........................................................................3
CONTENTS .......................................................................................4
1. INTRODUCTION ........................................................................5
2. CONCEPTUAL FOUNDATIONS................................................6
3. DATA AND METHODS ............................................................10
3.1 The UK Innovation Survey..................................................10
3.2. Dependent variables..........................................................11
3.3. Econometric Strategy ........................................................12
3.4. Explanatory Variables........................................................14
4. EMPIRICAL RESULTS AND DISCUSSION ............................15
5. CONCLUSIONS .......................................................................19
REFERENCES ................................................................................30
5
1. INTRODUCTION
University-business collaboration has attracted significant attention from
both researchers and policy makers interested in maximising the economic
value of public knowledge investments. In the UK, a series of government
reports has emphasised the importance of effective university-business
collaboration, and the potential role of universities in driving localised
economic development (Etzkowitz and Leydesdorff 2000). Proximity, it is
argued, facilitates the exchange of tacit and complex knowledge through
personal interaction and shared knowledge and experiences. In this context,
the proximity of universities and other external knowledge sources plays a
defining role in shaping firms’ external knowledge sourcing strategies
(Boschma, 2005), i.e. local knowledge sources may be easier and more
cost-effective to access. However, in any particular location the range of
knowledge available from universities or other knowledge sources may be
limited (Guilani 2007; Leiponen and Helfat 2010). This may mean that a
firm’s search for knowledge which is appropriate for their specific needs
becomes inter-regional or international, and requires collaboration with less
easily accessible partners 1 . The implication is that firms’ collaborative
relationships with universities will be characterised by a utility-accessibility
trade-off reflecting the utility or value of knowledge available from local and
more distant collaborators and the relative accessibility of those partners.
The utility or value of knowledge available from local collaborators may be
limited by the number of local universities, their specific areas of expertise,
or level of engagement with local firms. Individual firms’ existing in-house
knowledge may also increase or decrease the perceived utility of locally
available knowledge.
The utility-accessibility trade-off is likely to work differently for firms with
different resource profiles and knowledge requirements. Larger firms with a
stronger internal resource base and greater absorptive capacity may be
better able to take advantage of university collaborations to access tacit and
1 The relevant literature has approximated this type of knowledge as explorativeand/or emerging (Laursen 2012; Hohberger, 2014).
6
complex knowledge (Powell et al. 1996; Almeida et al. 2002; Inkpen 2002;
Grant and Baden-Fuller, 2004). Larger firms may also be in a position to
manage and successfully exploit more numerous collaborative relationships,
potentially spanning multiple geographic levels. Small firms, on the other
hand, may have more to gain from collaboration, but because of their limited
internal resources may have more limited knowledge search and absorption
capabilities (Vahter et al., 2014). As a result, more distant knowledge
sources may be of greater utility but be less accessible, to smaller firms with
implications for the utility-accessibility trade-off.
Recent analyses of how firms access external knowledge have emphasised
the dynamic nature of knowledge search and learning processes (Vahter et
al. 2014; Balland et al. 2015; Hewitt-Dundas et al. 2017). Our analysis here
contributes to the growing literature on the dynamics of knowledge search
and how this influences the geography of collaborative innovation. We make
three main contributions; first, we introduce the idea of a utility-accessibility
trade-off as a general framework within which the spatial context of
collaboration, and its implications for the costs and benefits of collaboration
can be considered. Secondly, we test the predictions of the utility-
accessibility framework for local, national and international university-
business collaborations for innovation for small, medium and large firms.
Thirdly, we examine the dynamic interaction of proximity and collaboration
with universities and their effects on firms’ ability to introduce new-to-the-
market innovations.
The remainder of the paper is organised as follows; in the next section we
present our theoretical framework and the corresponding hypotheses.
Section 3 is presents information about our dataset and empirical strategy.
Section 4 presents estimation results while section 5 concludes.
2. CONCEPTUAL FOUNDATIONS
Knowledge acquired externally can make a significant contribution to firms’
innovation outputs (Brunswicker and Vanhaverbeke 2015; Spithoven,
Vanhaverbeke, and Roijakkers 2013; Parida, Westerberg, and Frishammar
7
2012). Firms may collaborate to augment or complement their own internal
knowledge stocks (Roper and Hewitt-Dundas 2015), or to share the costs
and risks of innovation (Astebro and Michela 2005). Where new technologies
are risky, or the market prospects for an innovation are highly uncertain, firms
may place higher value on working with collaborators who are seen as
trustworthy and capable of providing frontier-edge knowledge (Laursen
2012). Collaboration with trusted public research organisations, such as
universities, fulfils both criteria (Fabrizio 2009).
University-business collaborations for innovation may also have a particular,
explorative, character which emphasises the development and sharing of
tacit knowledge, and also the value of intensive face-to-face contacts
between collaborators (Breschi and Lissonni 2001). Spillovers from
universities themselves, or from such collaborations, are likely to share
similar characteristics and may therefore be geographically bounded, or at
least, that there may be limits to the geographical distribution of such
spillovers (Storper and Venables 2004). Early evidence of the potential for
such localised knowledge spillovers was provided by Jaffe (1989), with
(Anselin, Varga and Acs 1997) providing more specific US evidence which
suggested that knowledge created within 75 miles of any metropolitan area
had significant localised innovation effects2. Geographical proximity may
therefore shape firms’ ability to access relevant university knowledge (Jaffe
1989; Anselin et al. 1997; Bode 2004; Autant-Bernard and LeSage 2011;
Kang and Dall'erba 2016), with accessibility decreasing as distance
increases (Figure 1).
Geographical co-location of a firm with a University or public research
organisation is neither necessary or sufficient, however, to ensure that
knowledge is transmitted between actors(Giulani 2007; Balland et al. 2015).
Local collaboration will only provide access to a limited pool of knowledge,
2 More recent studies for Germany Bode (Bode 2004), France (Autant-Bernard andLeSage 2011) and the US (Kang and Dall'erba 2016), however, suggest theexistence of both regional and inter-regional spillovers, with the latter studysuggesting that the inter-regional spillovers from academic research are strongerthan those from private R&D.
8
leading to the potential for local lock-in, and a need to seek useful knowledge
elsewhere (Boschma 2005; Dolfsma and Leydesdorff 2009). More
extensive, geographically dispersed, knowledge search will increase the
number of potential collaborators which a firm can consider, and therefore
the probability that a firm will identify knowledge which is useful and
complementary to its own internal knowledge-base (Love et al. 2014). The
probability of identifying useful external knowledge will therefore increase as
firms shift beyond purely local knowledge search (Figure 1). However, the
greater the distance between actors, the more difficult it is to transfer newly
created knowledge that is mostly tacit, ensure effective co-ordination and
avoid potential issues of trust and cultural conflict which may reduce the
benefits of collaboration (Hamel 1991; Simonin 1997; Rao and Schmidt
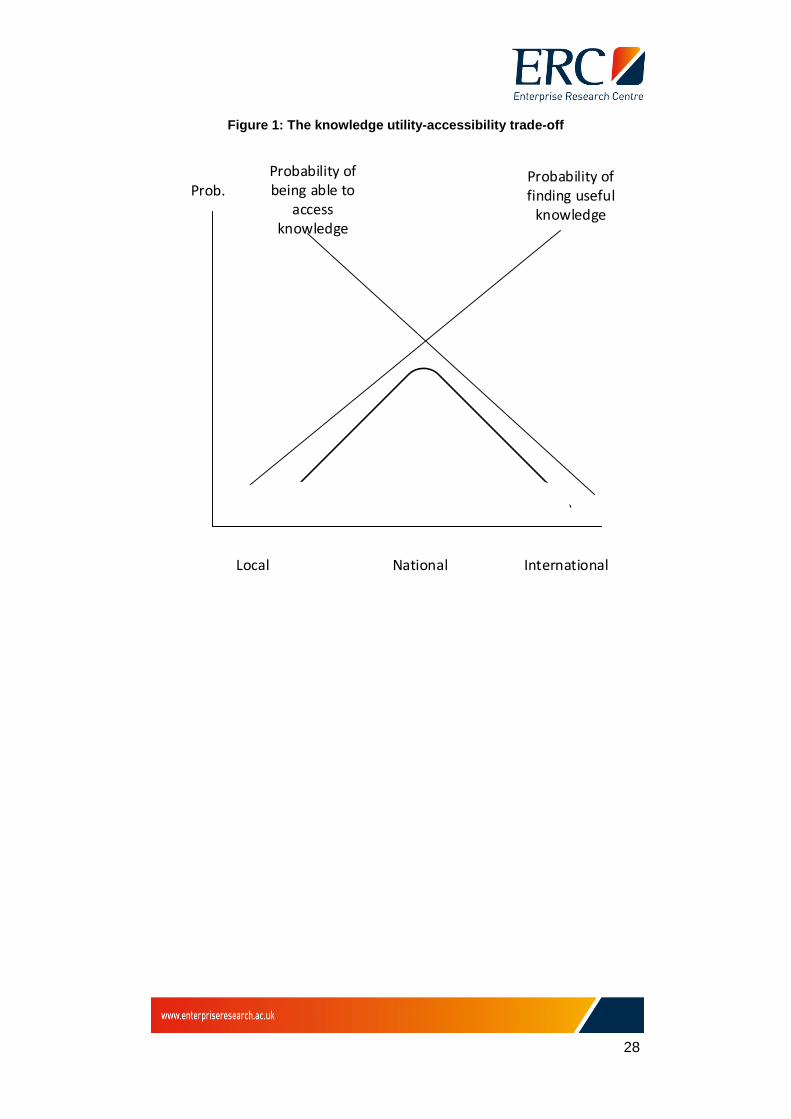
1998; Doney et al. 1998; Zaheer and George 2004). This suggests a trade-
off between more easily accessible local knowledge, which may be of limited
value to the firm, and more distant, less accessible and more costly,
knowledge which is of greater value (Figure 1). This utility/accessibility trade-
off suggests there may be an optimal level of geographical proximity
between a firm and its university collaborators (Boschma 2005; Boschma
and Frenken 2010; Broekel and Boschma 2012) which balances the utility of
local and more distantly available knowledge with the greater search,
assimilation and co-ordination costs of working with more distant university
partners (Figure 1). This leads to our first hypothesis:
Hypothesis 1: The utility/accessibility trade off
Trade-offs between the accessibility and utility of external knowledge
imply and inverted-U shape relationship between distance and the
benefits of university collaboration.
Organisational capabilities and aspirations will also shape the nature of the
utility/accessibility trade-off. For example, Laursen et al. (2011) suggest
firms’ propensity to collaborate with a local university will be influenced by
both physical distance and the research quality of the university. The optimal
level of geographical proximity may therefore depend on firms’ openness to
their external environment as well as their capacity to manage transaction,
9
search and co-ordination costs (Fontana et al. 2006). These capabilities may
be very different in firms of different sizes. On one hand, small firms which
operate in niche markets may have more limited internal resources (Vossen
1998) and absorptive capacity and may find it difficult to implement extensive
knowledge search strategies and identify more distant university
collaborators (Beise and Stahl 1999; Hewitt-Dundas 2006). Conversely,
larger firms with greater absorptive capacity will be better able to exploit more
geographically dispersed external knowledge. For small firms this means
that, at any given proximity to a partner, the probability of being able to
access knowledge will be lower than the average (Figure 2a). By contrast,
larger firms with greater internal resources and greater absorptive capacity
may be better able to access external knowledge (Figure 2b). However, the
more limited internal resources of small firms may also mean that external
knowledge is of more value to smaller companies. Vahter et al. (2014), for
example, demonstrate that small firms derive greater innovation benefits
from any given number of external collaborations than larger firms. This
suggests that the probability of small firms obtaining useful knowledge from
a university at any given distance is greater than that for large firms (Figure
2a), with the converse being true for larger businesses (Figure 2b). These
combinations of effects suggest our second and third hypotheses:
Hypothesis 2: Local knowledge and smaller firms
Lower accessibility and higher utility will mean that local university
knowledge sources are of greater innovation benefit to smaller firms.
Hypothesis 3: Distant knowledge and larger firms
Greater accessibility and lower utility will mean that more distant
university knowledge sources are of greater benefit to larger firms.
Recent evidence suggests that the benefits of external collaboration for
innovation may have a strong dynamic element (Love et al. 2014, 2014a).
Firms, learning from prior collaborations, may develop new knowledge
routines, and acquire new competences which benefit their ability to
innovate. Improved partner selection and management routines, for

10
example, may reduce transaction and coordination costs, and enable firms
to more effectively capture the knowledge flows from distant collaborators
(Miotti and Sachwall 2003). Through time, firms which engage in
collaboration will also learn both which types of collaboration are of most
value, and how to maximise the payoffs from those relationships. This may
be reflected in more persistent partnerships and, through time, the build-up
of trust (Gulati 1995), the exchange of tacit and more fine-grained
information and knowledge (Gilsing and Noteboom 2006), and the closer
integration of internal and collaborative innovation routines (Das and Teng
2000; Belderbos et al. 2016). and, in this context, studies have again
emphasised the role of proximity. In terms of the utility-accessibility trade-off,
the potential for learning from prior collaboration implies a shift of both the
utility and accessibility curves to the right (Figure 1), and therefore a potential
increase in the distance at which the optimal benefit from collaboration may
occur. This suggests our final hypothesis:
Hypothesis 4: Learning effects
Learning effects resulting from prior collaboration will increase the
innovation benefits of collaboration with more distant university
partners.
3. DATA AND METHODS
3.1 The UK Innovation Survey
Our analysis is based on the UK Innovation Surveys (UKIS) which covers
the period 2004 to 2012. This survey is non-compulsory, and is conducted
every two years. Questionnaires are sent by post using a sampling frame
derived from the Interdepartmental Business Register and stratifying for firm
size (in terms of number of employees), region and industry sector. Achieved
response rates range from 51 per cent in Wave 8 (covering firms’ innovation
activity over the period 2010-2012) to 58 per cent in Wave 4 (covering 2002-

11
2004) 3 . The UK Innovation Survey applies the definitions and type of
questions defined in the OECD Oslo Manual (2005) and, for innovating firms,
provides detailed information on the nature of firms’ innovation and their
collaboration with universities and other partners4. The survey also provides
on a range of other firm-level characteristics which we use as control
variables. Each UKIS wave consists of approximately 14,000 observations
although the panel structure of the dataset is extremely unbalanced. For our
analysis we require information on firms’ collaboration with universities –
which is only available for firms engaging in some innovation activity – and
also data on firms which responded to two successive waves of the UKIS to
allow us to capture potential learning effects. Applying these restrictions
results in a pooled data set containing around 24,000 observations.
3.2. Dependent variables
UKIS respondents who indicated that they introduced either new or
significantly improved products or services during a three year period were
then asked to indicate whether this was introduced ‘to the market before
competitors’. Such new-to-the-market products and/or services have the
potential for disruption because they may undermine the competences and
complementary assets of incumbent firms (Markides 2006). Based on firms'
responses we constructed a binary variable - ����� - which takes the value
of 1 if the innovating firm has introduced a new-to-the-market innovation and
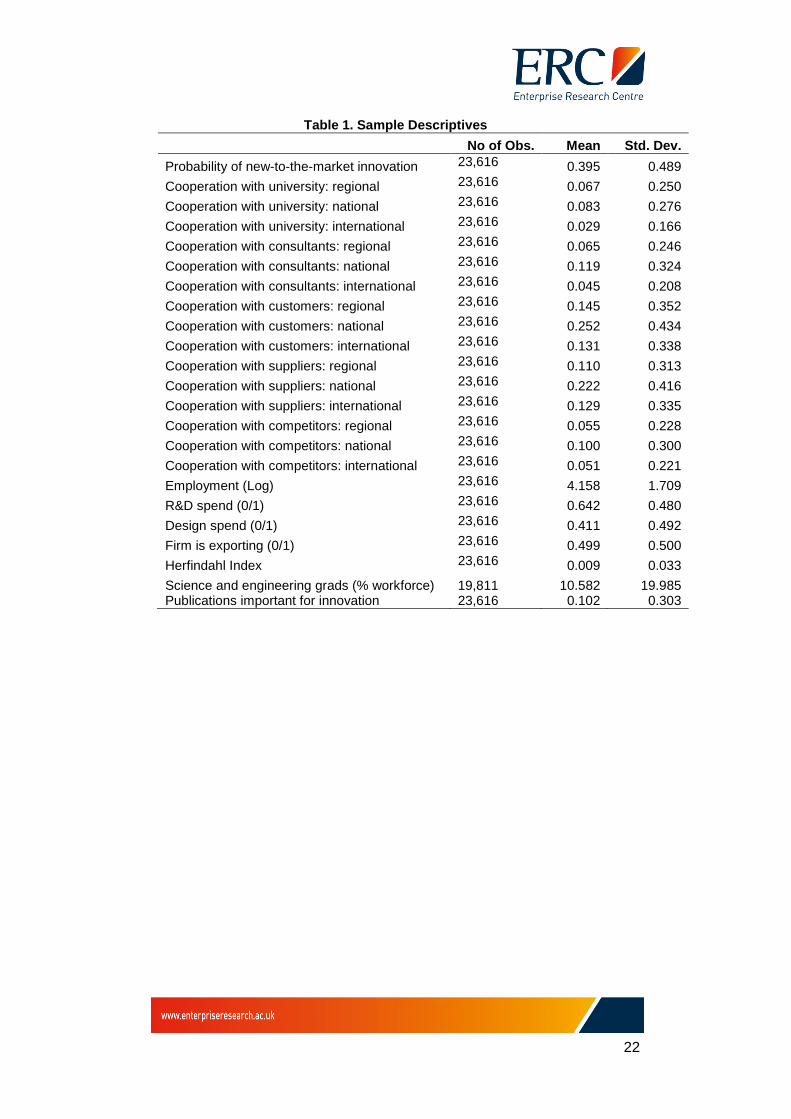
0 otherwise. Around 39.5 per cent of innovating firms indicating that they
introduced a new-to-the-market product or service in the sample period
(Table 1).
Besides the type of collaboration partner UKIS respondents have been also
asked to indicate the location of their innovation partners using a three-way
(regional, national or inter-national) categorisation. We use this data to
construct three binary variables to represent the geographical profile of firms’
3 See: https://www.gov.uk/government/collections/community-innovation-survey4 Filters included in the UKIS mean that questions on collaboration for innovation areonly asked of firms which undertook some innovation in products or services, orprocesses in the period covered by the survey.
12
university collaboration. Specifically, ���������_���� indicates whether
firms were collaborating with regional universities (i.e. within 100 miles of the
firm’s location) and ���������_���� and, ���������_���� indicate
whether firms were collaborating with a national University (i.e. within the UK
but more than 100 miles away of the firm’s location) and international
universities, respectively5.
3.3. Econometric Strategy
Our hypotheses emphasise the potential for university collaboration to
influence firms’ new-to-the-market innovation. However, the decision to
collaborate with a universities will depend on the utility accessibility trade-off
(Hypothesis 1), firm size (Hypotheses 2 and 3) and firms’ prior collaboration
(Hypothesis 4). Our empirical strategy needs therefore to account for the
potential interdependencies between the decision to introduce a new-to-the-
market innovation, the location of university partners, and the potential
simultaneity between these two decisions. In the presence of such
interdependencies, univariate probit models may produce biased and
inconsistent results. We therefore use a multivariate probit model to
simultaneously estimate the probability of introducing new-to-the-market
innovation – NTMIt - conditional on the likelihood of collaborating with a
university at regional, national or international level. Hence, we estimate the
following multivariate dynamic and recursive model:
ΝΤΜΙt*=α0+α1UNICOLLAB_REG
t+α2UNICOLLAB_NAT� + α�UNICOLLAB_INT
�+α�OTHCOLLAB_REG
t+
α�OTHCOLLAB_NATt+ α�OTHCOLLAB_INT
�+ α
7FLCt+ε1t (1)
UNICOLLAB_REGt=β
0+β
1NTMIt-1+β
2UNICOLLAB_REG
t-1+β
3OTHCOLLAB_REG
t-1+β
4FLCt+ε2t (2)
UNICOLLAB_NATt=γ
0+γ
1NTMIt-1+γ
2UNICOLLAB_NAT
t-1+γ
3OTHCOLLAB_NAT
t-1+γ
4FLCt+ε3t (3)
UNICOLLAB_INTt=δ0+γ
1NTMIt-1+δ2UNICOLLAB_INT
t-1+δ3OTHCOLLAB_INT
t-1+δ4FLCt+ε4t (4)
5 Note that while we know where firms’ university partners are located our surveydata provides no information on the absolute number of university (and other)collaborators with which firms are working.

13
� = (��� , ���, ��� , ���, )�~�(�,�)
� = �
1���
�1��
��1�
���1
�
where ���, i =1-4, are error terms distributed as multivariate normal, each with
a mean of zero, and variance–covariance matrix Σ , where Σ has values of
1 on the leading diagonal and � are the error correlations. Furthermore, the
���������_����� , ���������_����� , and ���������_����� variables
denote collaboration with other innovation partners at the corresponding
level and FLCt are a set of firm and sector level controls6. Equation (1) here
is the standard innovation production function relating innovation outputs in
the current period to innovation inputs from investment within the firm or
external collaborations (Leiponen and Byma 2009; Leiponen 2012).
Equations (2-4) reflect the effects of learning and expected returns on the
probability of collaborating with a university (Love et al. 2014, 2014a).
Hypothesis 1 relates to the utility/accessibility trade-off and suggests an
inverted-U shape relationship between the innovation benefits of
collaboration and distance. This requires α2> α1 and α2>α3. Hypothesis 2
relates to the impact of small firm size and requires that α2 – the parameter
on local university collaboration – will be greater in sub-sample estimates
relating to smaller firms. Conversely, Hypothesis 3 anticipates that α4 – the
coefficient on international university collaboration will be greater in sub-
sample estimates for larger firms. Finally, Hypothesis 4 envisages learning
from prior collaboration requiring β2, β3>0, γ2 γ3>0, and δ2 δ3>0 for regional,
national and international universities respectively. The correlation
coefficient among the error terms ���, i =1-4, accounts for all possible omitted
or unobservable factors that drive at the same time both the probability to
6 In principle, we could allow for a feedback loop in our system of equations, i.e.simultaneity between the probability of introducing new-to-the-market innovation andthe likelihood of collaborating with a university at the regional, national andinternational level. However, a coherency problem arises which Gouriroux et al.(1980) and Maddala (1983) show produces inconsistent results, and that priorparameter restrictions are needed in order to be logically consistent.

14
introduce new-to-the-market innovation and the likelihood of collaborating
with a university. The significance of �� represents a 'proof of the goodness
of this approach'. In other words, if �� is not significantly different from zero,
the error terms are not correlated and the model is equivalent to the
estimation of two univariate probit models. On the other hand, if �� is
significantly different from zero, the estimates of four separate probit models
are inconsistent and a joint estimation is required. Finally, we correct for
clustering of the standard errors which allows to take into account the non-
independence of observations within the same firm, allowing to catch at least
part of the unobserved heterogeneity.
3.4. Explanatory Variables
Variables reflecting collaboration with other types of innovation partners (e.g.
customers, suppliers) are defined in a similar way to that for university
collaboration (Table 1) with the most common collaborators being national
suppliers (22.2 per cent of innovating firms) and national customers (25.2
per cent of innovating firms) (Table1). We should note that partnering with
different types of collaborators may serve a two-fold purpose; on one hand,
the diversity of innovation partners is considered an important determinant
of the introduction of new-to-the-market innovation as it provides a variety of
technological inputs which potentially complement firms' existing knowledge
and skill endowments (Becker and Dietz 2004). On the other hand, the
decision to collaborate with a university as part of firms’ innovation activities
may be determined by firms' history and experience of previous
collaborations with university partners and other types of partners.
We therefore incorporate the lagged decisions to collaborate with a
university and other types of partners as well as the previous success in
introducing new-to-the-market innovations as explanatory variables of the
current decision to collaborate with a university whether it be regional,
national or international (equations 2-4).
We have also included in our analysis a set of control variables which
previous studies have linked to dimensions of innovation activity examined

15
here. In the innovation production function (equation 1), we have included a
binary indicator of whether or not a firm has an in-house R&D capability
(Love and Roper 2001; Griffith et al. 2003) which we anticipate will be
positively associated with the probability that a firm will introduce new-to-the-
market innovation. Second, we include a binary variable reflecting firms’
innovation related investments in design. Third, we also include a dummy
variable for the importance of standardisation in firms' innovation activities
which we also expect to have a positive effect on new-to-the-market
innovation. In order to capture any market scale effects we have included a
binary variable indicating whether or not a firm was selling in export markets,
and a Herfindahl index to approximate industrial concentration and firms’
market power. Previous studies have linked exporting to innovative activity
through both competition and learning effects (Love and Roper 2015).
Turning to the control variables included in the collaboration models
(equations 2-4) we have included a variable reflecting the strength of firms’
human resources – the percentage of the workforce which are graduates in
science and engineering (Leiponen 2005; Freel 2005, Hewitt-Dundas 2006).
In addition, we use a dummy variable reflecting the importance of
publications as a knowledge source in firms' innovation activities. For both
controls we expect a positive effect on the decision to collaborate with a
University. Finally, in both the innovation production function (equation 1)
and the collaboration models (equations 2-4) we control for firm size by
incorporating the (log) employment to reflect the scale of plants’ resources,
and we allow for sectoral and temporal heterogeneity by including sectoral
dummies at the 2-digit level and wave dummies in each equation.
4. EMPIRICAL RESULTS AND DISCUSSION
Our first Hypothesis relates to the effect of the utility/accessibility trade-off
on innovation outputs, and suggests that co-operation with national
universities should have the greatest innovation benefits. Table 3 reports
multi-variate probit estimates of equation (1), modelling the effect of
collaboration with regional, national and international universities on firms’
ability to introduce new-to-the-market innovation. We find significant error

16
correlations between the different models suggesting the value of the multi-
variate approach. Notably, however these correlations are stronger between
the errors in the three university collaboration decision models (i.e.
international, national, regional) than between the various types of university
collaboration and innovation. The implication being that the decision about
which type of university, or universities, to collaborate with are more strongly
inter-connected than the innovation and collaboration decisions (Table 3).
This is particularly evident for larger firms where the error correlations
between the innovation production function (equation 1) and the
collaboration models (equations 2-4) are insignificant (Table 3).
This suggests that decision processes regarding new-to-the-market
innovation and university collaboration may be different in small and medium
firms to those in larger companies. Previous studies have suggested that
collaboration is related to the innovation decision process (Du, Love, and
Roper 2007) but provide little insight into firm size differences. Our results
here suggest that in small and medium firms the innovation and collaboration
decisions appear closely related; in larger firms the decisions to introduce
new-to-the-market innovation and collaborate are essentially independent.
This may reflect the richness of firms’ resource base, with new-to-the-market
innovation actually requiring external collaboration in small and medium
firms – and therefore necessitating the linking of the innovation and
collaboration decisions (Lopez-Fernandez, Serrano-Bedia, and Gomez-
Lopez 2016). Larger firms with stronger internal resources may, on the other
hand, have more options about how they achieve new-to-the-market
innovation with a choice between internalised or collaborative strategies.
(Eiriz, Faria, and Barbosa 2013), for example, link their ‘discovery’ innovation
strategy – involving radical innovation and potentially collaboration – with
more mature and therefore potentially larger firms.
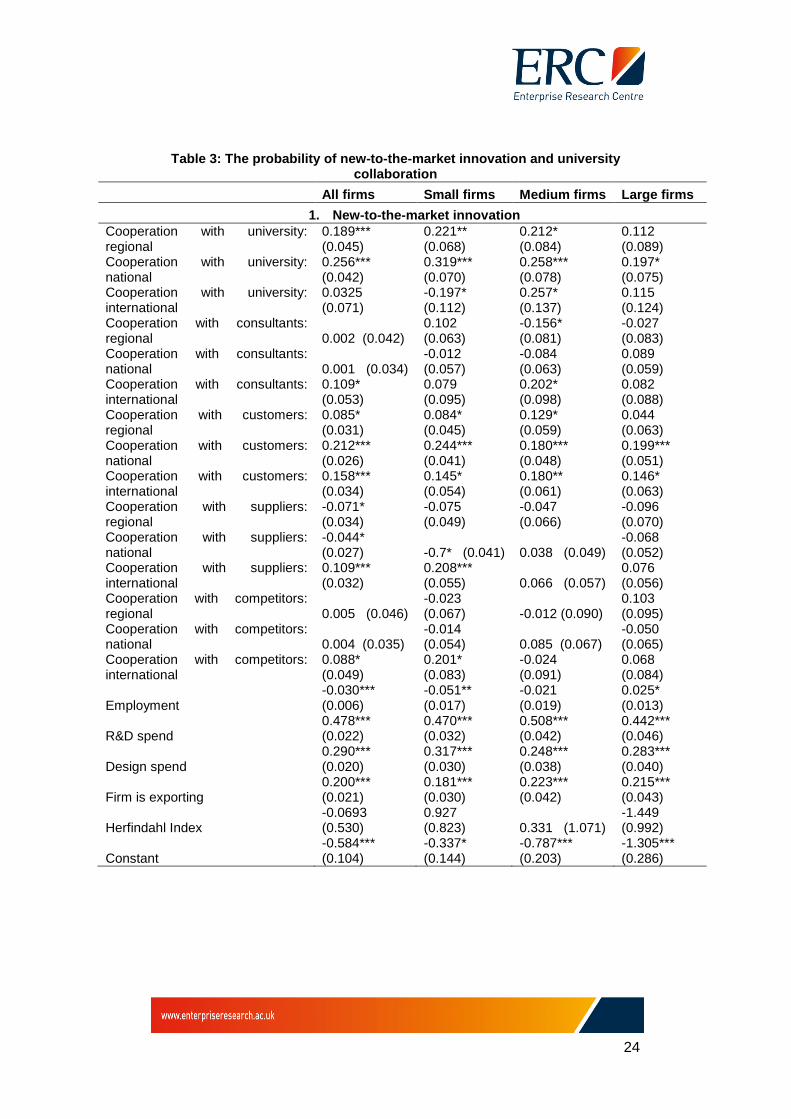
In our whole sample estimates (Model 1, Table 3) collaboration with both
regional and national universities have positive and significant effects on the
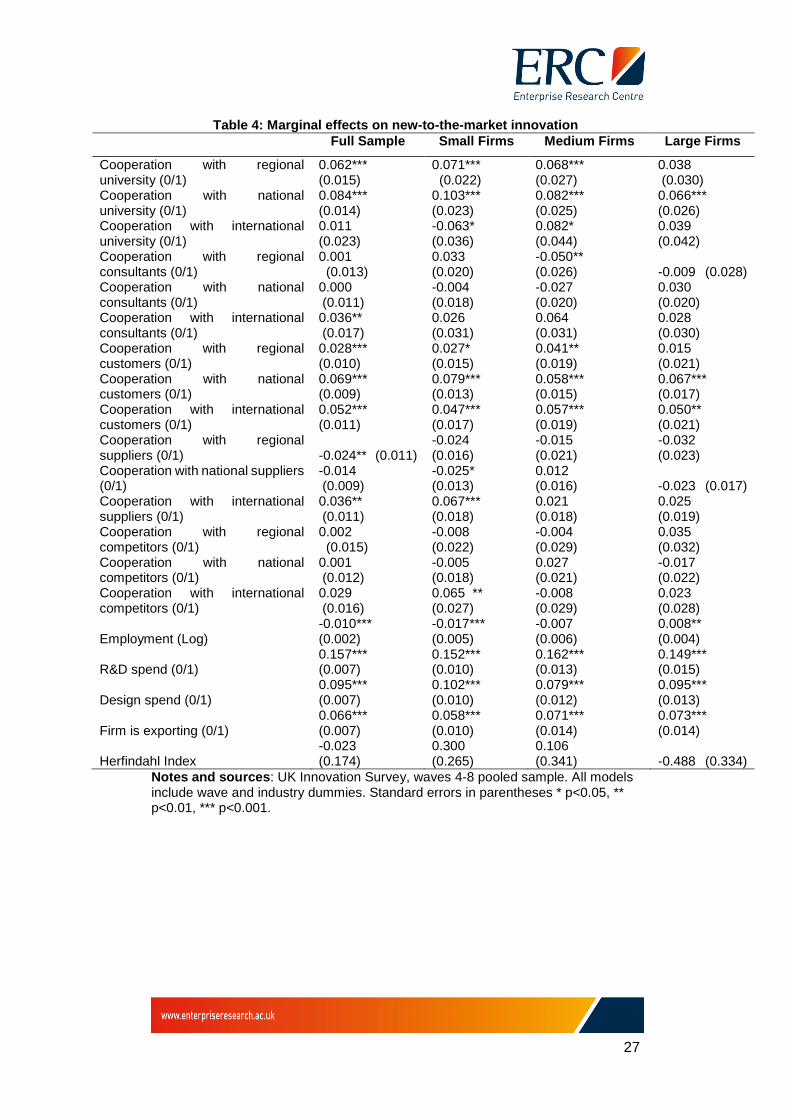
probability that firms will introduce new-to-the-market innovation. This is also
reflected in the marginal effects, with collaboration with a national university
increasing the probability of new-to-the-market innovation by 8.4 per cent on

17
average, and a regional university by 5.2 per cent (Table 4). In our full sample
estimates, collaboration with international universities has no significant
impact on the probability of introducing new-to-the-market innovation (Table
3). Our whole sample estimates therefore provide support for Hypothesis 1
and the utility-accessibility trade-off, with national universities also having the
largest impact on innovation in each firm sizeband (Table 4).
Hypothesis 2 suggests that the utility-accessibility trade-off means that,
relative to large firms, small firms will benefit more from collaboration with
local universities. Our estimation supports this contention although the
observed differences between small and medium firms are relatively small
(Table 3). For small firms, collaboration with local universities increases the
probability of new-to-the-market innovation by 7.1 per cent compared to 6.8
per cent in medium firms and 3.8 per cent in larger firms (Table 4). Small
firms’ collaboration with international universities suggests a negative (6.3
per cent) impact on the probability of new-to-the-market innovation (Table
4). This suggests the importance of the accessibility of knowledge for smaller
firms and the potential for over-collaboration with international partners
(although see Lew and Sinkovics 2013). Medium-sized firms seem able to
overcome this issue obtaining innovation benefits from local, national and
international university collaboration (Table 4). For larger firms – perhaps
due to their stronger internal knowledge base - the benefits of collaboration
with universities of each type are generally weaker, although again national
universities provide the most significant innovation benefits (Table 4). This
finding is consistent with Laursen et al. (2011) who found that UK firms tend
to favour collaboration with national universities rather than those which are
local or international. Overall, our results provide support for Hypothesis 2
but no real evidence for Hypothesis 3 that international collaborations are of
greater benefit to larger firms.
Beyond their collaboration with universities, it is collaboration with customers
which has the most consistently positive effect on firms’ new-to-the-market
innovation (Melton and Hartline 2015). As with universities, the strongest
relationships are also evident here in terms of nationally-based customers
rather than those based locally or internationally (Table 3). This suggests
18
that the type of utility-accessibility trade-off envisaged in Hypothesis 1 may
extend beyond university collaboration. Collaborations with other partners
have more diverse impacts, although it is notable that collaboration with
international suppliers has significant beneficial effects for smaller firms
(Table 3). Other factors also influence the probability that firms will undertake
new-to-the-market innovation. Larger firms are more likely to introduce new-
to-the-market innovations as do those with larger proportions of science and
engineering graduates (Calcagnini and Favaretto 2016; Fores and Camison
2016).
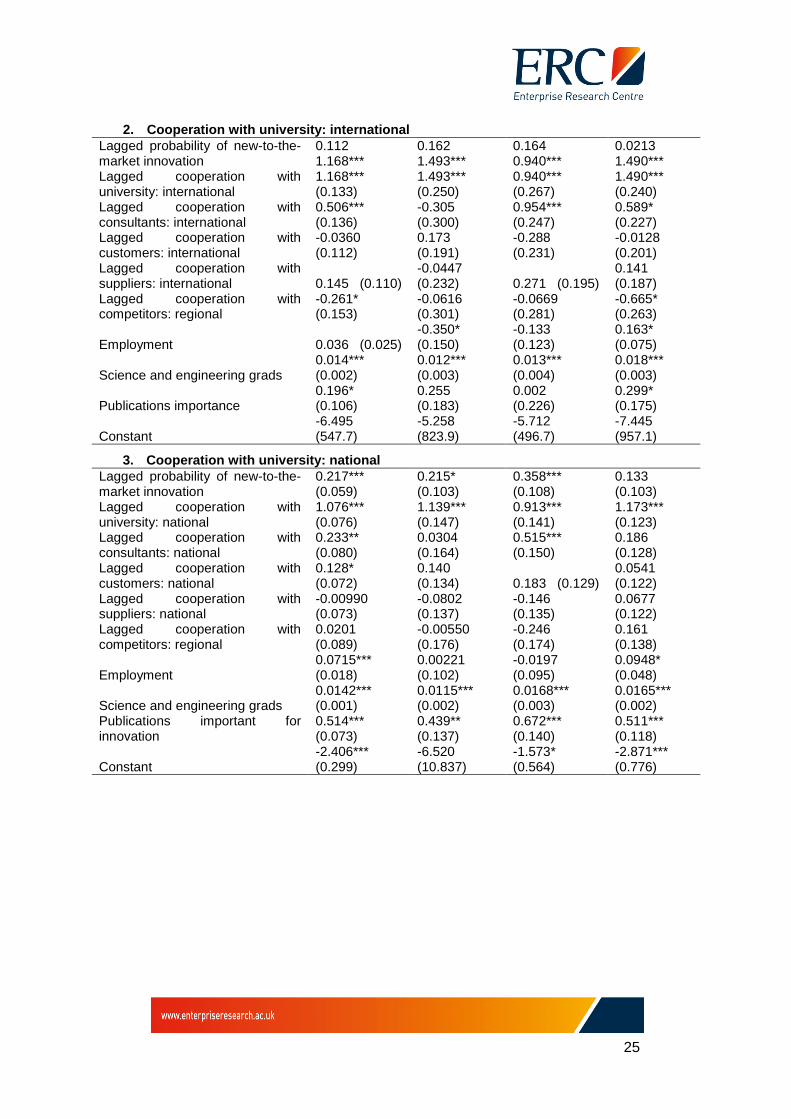
Our final hypothesis suggests that learning effects from previous
collaborations will increase the probability of collaborative activity with
universities. Two types of learning effects are possible here: experience
effects from collaboration with other types of partner (apart from universities)
and experience effects from prior university collaboration. In terms of
experience effects from collaboration with other types of partner, we find
some evidence of learning effects in collaboration with international and
national universities (Table 3). Learning effects seem less important as a
determinant of firms’ collaboration with regional universities (Table 3). More
specifically, prior experience of working with international consultants
generates significant positive learning effects in our full sample estimates
(Model 1, Table 3) and for medium and large firms (Models 3 and 4, Table
3). Such collaboration may be helping firms to learn to overcome cultural or
regulatory barriers to international collaboration, or helping them develop
appropriate management routines (Ojanen and Hallikas 2009). Another
possible explanation for this result is, however, that international consultants
may be brokering contacts between UK firms and international universities
(Bessant and Rush 1995; Prince 2012). Collaboration with national
universities is also related to prior collaboration with national consultants,
again perhaps reflecting learning or brokering effects, and prior collaboration
with customers (Table 3). Prior customer collaboration may be generating
dynamic economies of scope in the collaboration relationship but may also
be helping firms to identify market opportunities, stimulating future innovation
and collaboration. Finally, we find little evidence of significant learning effects
in terms of firms’ collaboration with regional universities (Table 3).
19
We also find strong experience or persistence effects from prior university
collaboration for each type of university (Table 3). Two explanations are
possible for this effect. First, it may simply be that in some instances
collaborative projects between firms and universities are longer than a single
survey period (3 years) and therefore the same project or projects is being
captured in two survey observations. Second, it may be that firms
experiencing university collaboration become aware of the benefits they
derive, and continue that relationship in subsequent periods (Bellucci and
Pennacchio 2016). From our data it is impossible to distinguish between
these two possibilities. In previous studies using Spanish data, however, the
vast majority of university-industry collaborations are of two years duration
or less (Montoro-Sanchez, Mora-Valentin, and Guerras-Martin 2006) 7 ,
suggesting the learning effect may be the primary explanation for the
observed persistence in university collaboration.
Among the other factors which influence university collaboration –
international, national and regional – the most consistent is the presence
within the firm of larger groups of science and engineering graduates. This
effect may reflect the ability of science trained graduates to effectively
identify and assimilate external scientific knowledge – an absorptive capacity
effect similar to that noted by Schmidt (2010) and Belderbos, Gilsing, and
Suzuki (2016). Another complementary possibility is that science graduates
may draw on their existing networks to support their employer’s innovation
activities (Calcagnini and Favaretto 2016).
5. CONCLUSIONS
Our main focus in this paper is firms’ ability to introduce new-to-the-market
innovations and how this is influenced by collaboration with universities at
regional, national and international levels. We argue that the choice of
university partners involves a utility/accessibility trade-off: local universities
7 More specifically of 800 agreements analysed by Montoro-Sanchez et al. (2006,Table 5), 11 per cent of collaborations were of 0-12 months duration, 60.9 per centwere 13-24 months duration, 26.7 per cent were 25-36 months long and only 1.6 percent exceeded 36 months.
20
are easy to access but their knowledge base may not ideally match the
needs of local firms; the larger group of national and international universities
may possess more relevant knowledge but at a greater access cost. This
suggests an inverted-U shape trade-off relationship between distance
between partners and the likely cost-benefit of collaboration. Firm size may
change this trade-off. Small firms facing resource constraints may find it
difficult to access distant knowledge but, at the same time, may derive
greater benefit due to their weaker internal knowledge resources. Larger
firms with stronger internal resources may be able to access more distant
knowledge but benefit less from that knowledge.
Our empirical analysis, based on the UK Innovation Surveys (UKIS) covering
the period 2004 to 2012, suggests four main empirical results. First, we find
support for the inverted-U shape relationship predicted by the
utility/accessibility trade-off between the distance between collaborators and
the innovation benefits. Collaboration with a national university increases the
probability of new-to-the-market innovation by 8.4 per cent on average, while
collaboration with a regional university has a smaller 5.2 per cent effect.
Second, we find evidence, in accord with the utility/accessibility trade-off,
that local university collaboration benefits small and medium firms only,
increasing the probability of new-to-the-market innovation by 6.8-7.1 per
cent. Third, we find consistent evidence that learning effects from previous
collaborations with customers, suppliers etc. increase the probability of
collaborative activity. Fourth, we find strong evidence of the persistence of
university collaborations, linked perhaps to firms’ realisation of the value of
such linkages.
Our results re-affirm the evidence from other studies of the value of university
collaboration for new-to-the-market innovation, particularly to smaller
companies. In terms of the utility/accessibility trade-off, an obvious policy
implication is to improve small firms’ accessibility to the national university
network. For example, Interface in Scotland provides a single point of entry
to Scotland’s university network for small firms across a range of sectors. In
2015/16, Interface brokered links between 387 small firms and Scottish
universities resulting in 172 collaborative projects (http://www.interface-

21
online.org.uk/). This type of initiative addresses two market failures which
occur in the formulation of open innovation relationships: firms’ lack of
awareness of the potential benefits from university collaboration and their
lack of knowledge of potential university partners (Hewitt-Dundas and Roper,
2016). Other research has also emphasised the potential value of initiatives
to support smaller firms in the initial commercialisation of new-to-the-market
innovations (Hewitt-Dundas et al. 2017).
Our analysis sheds new light on the benefits of university-business
collaboration in the UK and the contrasting experience of firms of different
sizes. While helpful our statistical analysis provides only limited information
as to why the observed relationships occur, and how the utility/accessibility
trade-off impacts on individual firms and individual decisions to collaborate
and innovate. There would be considerable value in complementary case-
level research which traces business-university collaborations from ideation
through to consummation and completion. This type of detailed, longitudinal
case-study has been used in studying academic entrepreneurship and spin-
outs but similar narratives of university-business collaboration are rare
(Lundquvist and Middleton, 2013). Ideally, such an analysis would focus on
the drivers of the collaboration decision as well as helping to understand the
factors which influence firms’ mode of engagement with universities be it
collaborative research or consultancy (Perkmann et al. 2013).
22
Table 1. Sample Descriptives
No of Obs. Mean Std. Dev.
Probability of new-to-the-market innovation 23,616 0.395 0.489
Cooperation with university: regional 23,616 0.067 0.250
Cooperation with university: national 23,616 0.083 0.276
Cooperation with university: international 23,616 0.029 0.166
Cooperation with consultants: regional 23,616 0.065 0.246
Cooperation with consultants: national 23,616 0.119 0.324
Cooperation with consultants: international 23,616 0.045 0.208
Cooperation with customers: regional 23,616 0.145 0.352
Cooperation with customers: national 23,616 0.252 0.434
Cooperation with customers: international 23,616 0.131 0.338
Cooperation with suppliers: regional 23,616 0.110 0.313
Cooperation with suppliers: national 23,616 0.222 0.416
Cooperation with suppliers: international 23,616 0.129 0.335
Cooperation with competitors: regional 23,616 0.055 0.228
Cooperation with competitors: national 23,616 0.100 0.300
Cooperation with competitors: international 23,616 0.051 0.221
Employment (Log) 23,616 4.158 1.709
R&D spend (0/1) 23,616 0.642 0.480
Design spend (0/1) 23,616 0.411 0.492
Firm is exporting (0/1) 23,616 0.499 0.500
Herfindahl Index 23,616 0.009 0.033
Science and engineering grads (% workforce) 19,811 10.582 19.985Publications important for innovation 23,616 0.102 0.303
23
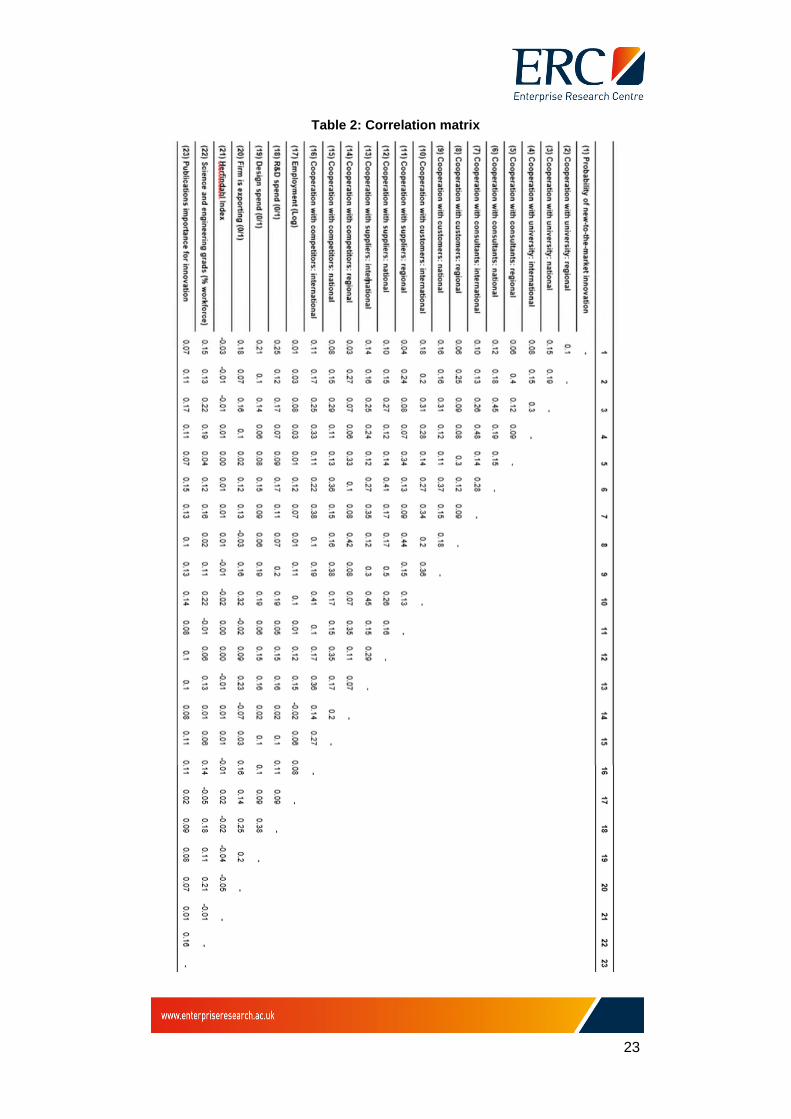
Table 2: Correlation matrix
24
Table 3: The probability of new-to-the-market innovation and universitycollaboration
All firms Small firms Medium firms Large firms
1. New-to-the-market innovationCooperation with university:regional
0.189***(0.045)
0.221**(0.068)
0.212*(0.084)
0.112(0.089)
Cooperation with university:national
0.256***(0.042)
0.319***(0.070)
0.258***(0.078)
0.197*(0.075)
Cooperation with university:international
0.0325(0.071)
-0.197*(0.112)
0.257*(0.137)
0.115(0.124)
Cooperation with consultants:regional 0.002 (0.042)
0.102(0.063)
-0.156*(0.081)
-0.027(0.083)
Cooperation with consultants:national 0.001 (0.034)
-0.012(0.057)
-0.084(0.063)
0.089(0.059)
Cooperation with consultants:international
0.109*(0.053)
0.079(0.095)
0.202*(0.098)
0.082(0.088)
Cooperation with customers:regional
0.085*(0.031)
0.084*(0.045)
0.129*(0.059)
0.044(0.063)
Cooperation with customers:national
0.212***(0.026)
0.244***(0.041)
0.180***(0.048)
0.199***(0.051)
Cooperation with customers:international
0.158***(0.034)
0.145*(0.054)
0.180**(0.061)
0.146*(0.063)
Cooperation with suppliers:regional
-0.071*(0.034)
-0.075(0.049)
-0.047(0.066)
-0.096(0.070)
Cooperation with suppliers:national
-0.044*(0.027) -0.7* (0.041) 0.038 (0.049)
-0.068(0.052)
Cooperation with suppliers:international
0.109***(0.032)
0.208***(0.055) 0.066 (0.057)
0.076(0.056)
Cooperation with competitors:regional 0.005 (0.046)
-0.023(0.067) -0.012 (0.090)
0.103(0.095)
Cooperation with competitors:national 0.004 (0.035)
-0.014(0.054) 0.085 (0.067)
-0.050(0.065)
Cooperation with competitors:international
0.088*(0.049)
0.201*(0.083)
-0.024(0.091)
0.068(0.084)
Employment-0.030***(0.006)
-0.051**(0.017)
-0.021(0.019)
0.025*(0.013)
R&D spend0.478***(0.022)
0.470***(0.032)
0.508***(0.042)
0.442***(0.046)
Design spend0.290***(0.020)
0.317***(0.030)
0.248***(0.038)
0.283***(0.040)
Firm is exporting0.200***(0.021)
0.181***(0.030)
0.223***(0.042)
0.215***(0.043)
Herfindahl Index-0.0693(0.530)
0.927(0.823) 0.331 (1.071)
-1.449(0.992)
Constant-0.584***(0.104)
-0.337*(0.144)
-0.787***(0.203)
-1.305***(0.286)
25
2. Cooperation with university: internationalLagged probability of new-to-the-market innovation
0.1121.168***
0.1621.493***
0.1640.940***
0.02131.490***
Lagged cooperation withuniversity: international
1.168***(0.133)
1.493***(0.250)
0.940***(0.267)
1.490***(0.240)
Lagged cooperation withconsultants: international
0.506***(0.136)
-0.305(0.300)
0.954***(0.247)
0.589*(0.227)
Lagged cooperation withcustomers: international
-0.0360(0.112)
0.173(0.191)
-0.288(0.231)
-0.0128(0.201)
Lagged cooperation withsuppliers: international 0.145 (0.110)
-0.0447(0.232) 0.271 (0.195)
0.141(0.187)
Lagged cooperation withcompetitors: regional
-0.261*(0.153)
-0.0616(0.301)
-0.0669(0.281)
-0.665*(0.263)
Employment 0.036 (0.025)-0.350*(0.150)
-0.133(0.123)
0.163*(0.075)
Science and engineering grads0.014***(0.002)
0.012***(0.003)
0.013***(0.004)
0.018***(0.003)
Publications importance0.196*(0.106)
0.255(0.183)
0.002(0.226)
0.299*(0.175)
Constant-6.495(547.7)
-5.258(823.9)
-5.712(496.7)
-7.445(957.1)
3. Cooperation with university: nationalLagged probability of new-to-the-market innovation
0.217***(0.059)
0.215*(0.103)
0.358***(0.108)
0.133(0.103)
Lagged cooperation withuniversity: national
1.076***(0.076)
1.139***(0.147)
0.913***(0.141)
1.173***(0.123)
Lagged cooperation withconsultants: national
0.233**(0.080)
0.0304(0.164)
0.515***(0.150)
0.186(0.128)
Lagged cooperation withcustomers: national
0.128*(0.072)
0.140(0.134) 0.183 (0.129)
0.0541(0.122)
Lagged cooperation withsuppliers: national
-0.00990(0.073)
-0.0802(0.137)
-0.146(0.135)
0.0677(0.122)
Lagged cooperation withcompetitors: regional
0.0201(0.089)
-0.00550(0.176)
-0.246(0.174)
0.161(0.138)
Employment0.0715***(0.018)
0.00221(0.102)
-0.0197(0.095)
0.0948*(0.048)
Science and engineering grads0.0142***(0.001)
0.0115***(0.002)
0.0168***(0.003)
0.0165***(0.002)
Publications important forinnovation
0.514***(0.073)
0.439**(0.137)
0.672***(0.140)
0.511***(0.118)
Constant-2.406***(0.299)
-6.520(10.837)
-1.573*(0.564)
-2.871***(0.776)
26
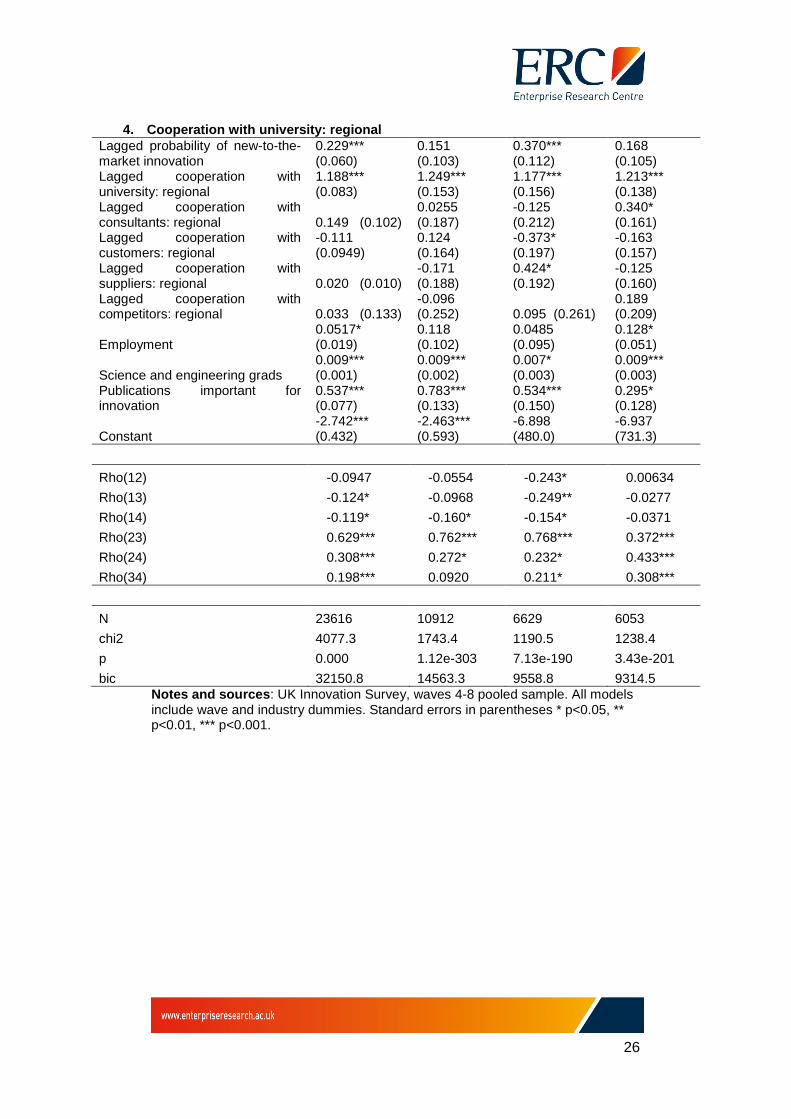
4. Cooperation with university: regionalLagged probability of new-to-the-market innovation
0.229***(0.060)
0.151(0.103)
0.370***(0.112)
0.168(0.105)
Lagged cooperation withuniversity: regional
1.188***(0.083)
1.249***(0.153)
1.177***(0.156)
1.213***(0.138)
Lagged cooperation withconsultants: regional 0.149 (0.102)
0.0255(0.187)
-0.125(0.212)
0.340*(0.161)
Lagged cooperation withcustomers: regional
-0.111(0.0949)
0.124(0.164)
-0.373*(0.197)
-0.163(0.157)
Lagged cooperation withsuppliers: regional 0.020 (0.010)
-0.171(0.188)
0.424*(0.192)
-0.125(0.160)
Lagged cooperation withcompetitors: regional 0.033 (0.133)
-0.096(0.252) 0.095 (0.261)
0.189(0.209)
Employment0.0517*(0.019)
0.118(0.102)
0.0485(0.095)
0.128*(0.051)
Science and engineering grads0.009***(0.001)
0.009***(0.002)
0.007*(0.003)
0.009***(0.003)
Publications important forinnovation
0.537***(0.077)
0.783***(0.133)
0.534***(0.150)
0.295*(0.128)
Constant-2.742***(0.432)
-2.463***(0.593)
-6.898(480.0)
-6.937(731.3)
Rho(12) -0.0947 -0.0554 -0.243* 0.00634
Rho(13) -0.124* -0.0968 -0.249** -0.0277
Rho(14) -0.119* -0.160* -0.154* -0.0371
Rho(23) 0.629*** 0.762*** 0.768*** 0.372***
Rho(24) 0.308*** 0.272* 0.232* 0.433***
Rho(34) 0.198*** 0.0920 0.211* 0.308***
N 23616 10912 6629 6053
chi2 4077.3 1743.4 1190.5 1238.4
p 0.000 1.12e-303 7.13e-190 3.43e-201
bic 32150.8 14563.3 9558.8 9314.5Notes and sources: UK Innovation Survey, waves 4-8 pooled sample. All modelsinclude wave and industry dummies. Standard errors in parentheses * p<0.05, **p<0.01, *** p<0.001.
27
Table 4: Marginal effects on new-to-the-market innovationFull Sample Small Firms Medium Firms Large Firms
Cooperation with regionaluniversity (0/1)
0.062***(0.015)
0.071***(0.022)
0.068***(0.027)
0.038(0.030)
Cooperation with nationaluniversity (0/1)
0.084***(0.014)
0.103***(0.023)
0.082***(0.025)
0.066***(0.026)
Cooperation with internationaluniversity (0/1)
0.011(0.023)
-0.063*(0.036)
0.082*(0.044)
0.039(0.042)
Cooperation with regionalconsultants (0/1)
0.001(0.013)
0.033(0.020)
-0.050**(0.026) -0.009 (0.028)
Cooperation with nationalconsultants (0/1)
0.000(0.011)
-0.004(0.018)
-0.027(0.020)
0.030(0.020)
Cooperation with internationalconsultants (0/1)
0.036**(0.017)
0.026(0.031)
0.064(0.031)
0.028(0.030)
Cooperation with regionalcustomers (0/1)
0.028***(0.010)
0.027*(0.015)
0.041**(0.019)
0.015(0.021)
Cooperation with nationalcustomers (0/1)
0.069***(0.009)
0.079***(0.013)
0.058***(0.015)
0.067***(0.017)
Cooperation with internationalcustomers (0/1)
0.052***(0.011)
0.047***(0.017)
0.057***(0.019)
0.050**(0.021)
Cooperation with regionalsuppliers (0/1) -0.024** (0.011)
-0.024(0.016)
-0.015(0.021)
-0.032(0.023)
Cooperation with national suppliers(0/1)
-0.014(0.009)
-0.025*(0.013)
0.012(0.016) -0.023 (0.017)
Cooperation with internationalsuppliers (0/1)
0.036**(0.011)
0.067***(0.018)
0.021(0.018)
0.025(0.019)
Cooperation with regionalcompetitors (0/1)
0.002(0.015)
-0.008(0.022)
-0.004(0.029)
0.035(0.032)
Cooperation with nationalcompetitors (0/1)
0.001(0.012)
-0.005(0.018)
0.027(0.021)
-0.017(0.022)
Cooperation with internationalcompetitors (0/1)
0.029(0.016)
0.065 **(0.027)
-0.008(0.029)
0.023(0.028)
Employment (Log)-0.010***(0.002)
-0.017***(0.005)
-0.007(0.006)
0.008**(0.004)
R&D spend (0/1)0.157***(0.007)
0.152***(0.010)
0.162***(0.013)
0.149***(0.015)
Design spend (0/1)0.095***(0.007)
0.102***(0.010)
0.079***(0.012)
0.095***(0.013)
Firm is exporting (0/1)0.066***(0.007)
0.058***(0.010)
0.071***(0.014)
0.073***(0.014)
Herfindahl Index-0.023(0.174)
0.300(0.265)
0.106(0.341) -0.488 (0.334)
Notes and sources: UK Innovation Survey, waves 4-8 pooled sample. All modelsinclude wave and industry dummies. Standard errors in parentheses * p<0.05, **p<0.01, *** p<0.001.
28
Figure 1: The knowledge utility-accessibility trade-off
Local National International
Prob.Probability offinding useful
knowledge
Probability ofbeing able to
accessknowledge

29
Figure 2: The knowledge utility-accessibility trade-off among smaller andlarger firms
(a) Smaller firms
Local National International
Prob.Probability offinding useful
knowledge
Probability ofbeing able to
accessknowledge
AB
(b) Larger firms
Local National International
Prob.Probability offinding useful
knowledge
Probability ofbeing able to
accessknowledge
A C
30
REFERENCES
Almeida, P.; J. Song; and R. Grant. 2002. Are firms superior to alliances and
markets? An empirical test of cross border knowledge building. Organization
Science 13:147–161.
Anselin, L.; A. Varga; and Z. Acs. 1997. Local Geographic spillovers between
University research and high technology innovations. Journal of Urban
Economics 42:422-448.
Astebro, T.; and J.L. Michela. 2005. Predictors of the survival of innovations.
Journal of Product Innovation Management 22:322-335.
Autant-Bernard, C.; and J.P. LeSage. 2011. Quantifying knowledge
spillovers using spatial econometric models. Journal of Regional Science
51:471-496.
Balland, P.A.; R. Boschma; and K. Frenken. 2015. Proximity and Innovation:
From Statics to Dynamics. Regional Studies 49: 907-920.
Becker, W.; and J. Dietz. 2004. R&D cooperation and innovation activities of
firms-evidence for the German manufacturing industry. Research Policy
33:209-223.
Beise, M.; and H. Stahl.1999. Public research and industrial innovations in
Germany, Research Policy 28:397–422.
Belderbos, R.; V.A. Gilsing; and S. Suzuki. 2016. Direct and mediated ties to
universities: "Scientific" absorptive capacity and innovation performance of
pharmaceutical firms. Strategic Organization 14:32-52.
Bellucci, A.; and L. Pennacchio. 2016. University knowledge and firm
innovation: evidence from European countries. Journal of Technology
Transfer 41(4):730-752.
Bessant, J. and H. Rush. 1995. Building Bridges For Innovation - The Role
Of Consultants In Technology-Transfer. Research Policy 24:97-114.
Bode, E. 2004. The spatial pattern of localized R&D spillovers: an empirical
investigation for Germany. Journal Of Economic Geography 4:43-64.
Boschma, R.A. 2005. Proximity and Innovation: A Critical Assessment.
Regional Studies 39:61-74.
Boschma. R.; and K. Frenken. 2010. The spatial evolution of innovation
networks. A proximity perspective, in Boschma R. A.; and R. Martin. (Eds)
31
Handbook on Evolutionary Economic Geography, 120–135. Edward Elgar,
Cheltenham
Broekel, T. and R. Boschma. 2012. Knowledge networks in the Dutch
aviation industry: the proximity paradox. Journal of Economic Geography
12:409–433.
Breschi S. F. Lissoni F.2001. Knowledge spillovers and local innovation
systems: A critical survey. Industrial and Corporate Change 10: 975–1005
Brunswicker, S. and W. Vanhaverbeke. 2015. Open Innovation in Small and
Medium-Sized Enterprises (SMEs): External Knowledge Sourcing Strategies
and Internal Organizational Facilitators. Journal of small business
management 53:1241-1263.
Calcagnini, G. and I. Favaretto. 2016. Models of university technology
transfer: analyses and policies. Journal of Technology Transfer 41:655-660.
Dolfsma, W. and L. Leydesdorff. 2009. Lock-in and break-out from
technological trajectories: Modeling and policy implications. Technological
Forecasting And Social Change 76:932-941.
Das, T. K., and B.S. Teng. 2000. Instabilities of strategic alliances: An
internal tensions perspective. Organization Science 11(1): 77–101.
Du, J.; J.H. Love; and S. Roper. 2007. The Innovation Decision.
Technovation 27:744-765.
Doney, P. M.; J. P.; Cannon.; and M. R. Mullen. 1998. Understanding the
influence of national culture on the development of trust. Academy of
Management Review 23: 601–620.
Eiriz, V.; A. Faria; and N. Barbosa. 2013. Firm growth and innovation:
Towards a typology of innovation strategy. Innovation-Management Policy &
Practice 15:97-111.
Etzkowitz, H.; L. Leydesdorff. 2000. The dynamics of innovation: From
national systems and ‘Mode 2’ to a Triple Helix of University-Industry-
Government relations, Research Policy 29(2):109-123.
Fabrizio, K. R. 2007. University patenting and the pace of industrial
innovation. Industrial and Corporate Change 16:505–534.
Fontana. R.; A. Geuna; and M. Matt. 2006. Factors affecting university–
industry R&D projects: the importance of searching, screening and signalling
Research Policy 35:309–323.
32
Fores, B. and C. Camison. 2016. Does incremental and radical innovation
performance depend on different types of knowledge accumulation
capabilities and organizational size? Journal of business research 69:831-
848.
Freel, M. S. (2005). "Patterns of Innovation and skills in small firms."
Technovation 25: 123-134.
Gilsing, V. and B. Nooteboom. 2006. Exploration and exploitation in
innovation systems: The case of pharmaceutical biotechnology. Research
Policy 35: 1–23.
Giuliani, E. 2007. The selective nature of knowledge networks in clusters:
evidence from the wine industry. Journal of Economic Geography 7:139–
168.
Grant, R. M.; and C. Baden-Fuller. 2004, A knowledge accessing theory of
strategic alliances. Journal of Management Studies 41:61-84.
Griffith, R., et al. (2003). "R&D and Absorptive Capacity: Theory and
Empirical Evidence." Scandinavian Journal of Economics 105(1): 99-118.
Gulati, R. 1995.Does Familiarity Breed Trust? The implications of repeated
ties for contractual choice in alliances. Academy of Management Journal 38:
85-112.
Gourieroux C.; J. Laffont.; and A. Monfort.1980. Coherency Conditions in
Simultaneous Linear Equations Models with Endogenous Switching Regime,
Econometrica, 48: 75-96.
Hamel, G. 1991. Competition for competence and inter partner learning
within international strategic alliances. Strategic Management Journal
12:83–104.
Hewitt-Dundas, N. 2006. Resource and capability constraints to innovation
in small and large plants. Small Business Economics 26:257-277.
Hewitt-Dundas, N.; A. Gykpali; and S. Roper. 2017. Does learning from prior
collaboration help firms to overcome the ‘two worlds’ paradox in university-
business collaboration? Enterprise Research Centre, Research Paper.
Hewitt-Dundas, N.; and Roper, S. 2016. Market failures in open innovation –
implications and policy responses’, Enterprise Research Centre, Research
Paper 49.
33
Hohberger, J. 2014. Searching for Emerging Knowledge: The Influence of
Collaborative and Geographically Proximate Search. European
Management Review. 11:139–157
Jaffe, A. 1989. Real effects of Academic research. American Economic
Journal 79:957-970.
Kang, D.W. and S. Dall'erba. 2016. An Examination of the Role of Local and
Distant Knowledge Spillovers on the US Regional Knowledge Creation.
International Regional Science Review 39:355-385.
Inkpen, A. C. 2002.Learning, knowledge acquisitions, and strategic
alliances: So many studies, so many unanswered questions. Contractor, F.
J.; and P. Lorange. (Eds.). Cooperative strategies and alliances. Oxford:
Pergamon.
Laursen, K. 2012. Keep searching and you’ll find: What do we know about
variety creation through firms’ search activities for innovation? Industrial and
Corporate Change 21:1181–1220.
Laursen, K.; T. Reichstein.; and A. Salter. 2011. Exploring the Effect of
Geographical Proximity and University Quality on University–Industry
Collaboration in the United Kingdom. Regional Studies 45: 507-523
Leiponen, A. 2005. Skills and innovation. International Journal of Industrial
Organization 23(5-6): 303-323.
Leiponen, A. 2012. The benefits of R&D and breadth in innovation strategies:
a comparison of Finnish service and manufacturing firms. Industrial and
Corporate Change 21:1255-1281.
Leiponen, A. and J. Byma. 2009. If you cannot block, you better run: Small
firms, cooperative innovation, and appropriation strategies. Research Policy
38:1478-1488.
Lew, Y.K. and R.R. Sinkovics. 2013. Crossing Borders and Industry Sectors:
Behavioral Governance in Strategic Alliances and Product Innovation for
Competitive Advantage. Long Range Planning 46:13-38.
Lopez-Fernandez, M.C.; A.M. Serrano-Bedia; and R. Gomez-Lopez. 2016.
Determinants of innovation decision in small and medium-sized family
enterprises. Journal of Small Business and Enterprise Development 23:408-
427.
34
Love, J. H.; and S. Roper 2001. Networking and Innovation Success: A
Comparison of UK, German and Irish Companies. Research Policy 30:643-
661.
Love, J. H.; and S. Roper. 2015. SME innovation, exporting and growth: A
review of existing evidence. International small business journal 33(1): 28-
48.
Love, J.H.; and S. Roper. 2013. SME innovation, exporting and growth: A
review of existing evidence. In White Paper No. 5. Warwick Business School:
Enterprise Research Centre.
Love, J.H.; S. Roper; and P. Vahter. 2014. Dynamic complementarities in
innovation strategies. Research Policy 43:1774-1784.
Love, J.H.; S. Roper; and P. Vahter. 2014a. Learning from openness: the
dynamics of breadth in external innovation linkages. Strategic Management
Journal. 35:1703-1716.
Lundqvist, Mats A., and Karen L. Williams Middleton. 2013. "Academic
entrepreneurship revisited–university scientists and venture creation."
Journal of Small Business and Enterprise Development 20.3 (2013): 603-
617.
Maddala, G. 1983. Limited Dependent and Qualitative Variables in
Econometrics. New York, Cambridge University Press.
Melton, H. and M.D. Hartline. 2015. Customer and employee co-creation of
radical service innovations. Journal of Services Marketing 29:112-123.
Miotti, L. and F. Sachwald. 2003. Co-operative R&D: Why and with Whom?
An Integrated Framework of Analysis. Research Policy 32(8):1481–1499.
Montoro-Sanchez, A., et al. 2006. R&D cooperative agreements between
firms and research organisations: a comparative analysis of the
characteristics and reasons depending on the nature of the partner.
International Journal Of Technology Management 35(1-4): 156-181.
Ojanen, V. and J. Hallikas. 2009. Inter-organisational routines and
transformation of customer relationships in collaborative innovation.
International Journal Of Technology Management 45:306-322.
Parida, V.; M. Westerberg; and J. Frishammar. 2012. Inbound Open
Innovation Activities in High-Tech SMEs: The Impact on Innovation
Performance. Journal of small business management 50:283-309.

35
Perkmann, M.; V. Tartari; M. McKelvey; E. Autio; A. Brostrom; P. D'Este; R.
Fini; A. Geuna; R. Grimaldi; A. Hughes; S. Krabel; M. Kitson; P. Llerena; F.
Lissoni; A. Salter; and M. Sobrero. 2013. Academic engagement and
commercialisation: A review of the literature on university-industry relations.
Research Policy 42:423-442.
Powell, W.; K. W. Koput; and L. Smith-Doerr. 1996. Interorganizational
collaboration and the locus of innovation: Network learning in biotechnology.
Administrative Science Quarterly, 41:116–145.
Prince, R. 2012. Policy transfer, consultants and the geographies of
governance. Progress in Human Geography 36:188-203.
Rao, A.; and S. M. Schmidt. 1998. A behavioral perspective on negotiating
international alliances. Journal of International Business Studies 29: 665–
693.
Roper, S. and N. Hewitt-Dundas. 2015. Knowledge stocks, knowledge flows
and innovation: Evidence from matched patents and innovation panel data.
Research Policy 44:1327-1340.
Schmidt, T. 2010. Absorptive Capacity - One Size Fits All? A Firm-Level
Analysis of Absorptive Capacity for Different Kinds of Knowledge.
Managerial and Decision Economics 31:1-18.
Simonin, B. L. 1997. The importance of collaborative knowhow: An empirical
test of the learning organization. Academy of Management Journal 40:
1150–1174.
Spithoven, A.; W. Vanhaverbeke; and N. Roijakkers. 2013. Open innovation
practices in SMEs and large enterprises. Small Business Economics 41:537-
562.
Vahter, P.; J.H. Love; and S. Roper. 2014. Openness and Innovation
Performance: Are Small Firms Different? Industry and Innovation 21:553-
573.
Vossen, R.W. 1998. Relative Strengths and Weaknesses of Small Firms in
Innovation. International small business journal 16:88-95.
Zaheer, A.; and V. P. George. 2004. Reach out or reach within? Performance
implications of alliances and location in biotechnology. Managerial and
Decision Economics 25: 437–452.

36
Centre ManagerEnterprise Research Centre
Aston Business SchoolBirmingham, B1 7ET
Centre ManagerEnterprise Research Centre
Warwick Business SchoolCoventry, CV4 7AL