Academic Program Viability Report
248
Academic Program Viability Report Upper Division Programs 2019-20 St. Petersburg College March 2021
Transcript of Academic Program Viability Report

Academic Program Viability Report
Upper Division Programs 2019-20
St. Petersburg College March 2021

Table of Contents
Introduction ................................................................ 1
Viability Measure Descriptions ........................................... 3
Program Viability Reports by Community .............................. 7
Business ................................................................. 7
Business Administration ............................................ 7
Management and Organizational Leadership .................. 19
Sustainability Management ...................................... 32
Education .............................................................. 46
Educational Studies and Community Leadership .............. 46
Elementary Education ............................................ 60
Exceptional Student Education .................................. 73
Mathematics Education ........................................... 87
Science Education ................................................ 102
Health Sciences and Veterinary Technology ..................... 117
Dental Hygiene .................................................... 117
Health Services Administration ................................. 129
Nursing ............................................................. 145
Veterinary Technology ........................................... 157
Public Safety, Public Policy, and Legal Studies ................. 173
Paralegal Studies ................................................. 173
Public Policy and Administration ............................... 186
Public Safety Administration.................................... 202
Science and Mathematics........................................... 217
Biology ............................................................ 217
Technology ........................................................... 231
Technology Development & Management ..................... 231
Contact Information .................................................... 245
St. Petersburg College P.O. Box 13489
St. Petersburg, FL 33733

Introduction The Academic Program Viability Report (APVR) was designed as an abbreviated yearly summative evaluation of a program’s viability and productivity. It provides key College stakeholders such as the President’s Cabinet a snapshot of relevant program-specific information in order to highlight program trends and issues. The publication of this report begins the process of making critical decisions regarding the continued sustainability of a program.
Reports indicating positive program trends may be used to identify and document best practices that can be utilized by programs throughout the College. Programmatic issues can be further investigated through the Comprehensive Academic Program Review (CAPR) process. Normally occurring on a four-year cycle, the CAPR process may also be initiated at the President’s request.
This 2019-20 Academic Program Viability Report contains detailed measure descriptions as well as individual program reports for all upper division programs designated by the active seventeen academic organization levels.
Program Viability Process The program viability process begins with the drafting of trend charts for each of the programs in each of the fourteen main measure areas: Student Count by year, SSH by campus, Success Rate by year, Student Count by ethnic group, Success Rate by course, Retention, Graduates, Graduates by ethnic group, Retention trend, Percent Full, Internship Enrollment, Industry Certification, Placement, and Employment Trends. [Note: the 14th area, employment trend information, is not charted and cannot be directly impacted by program performance].
To enhance the program viability report process, a committee consisting of deans and faculty decided in 2020 that program specific data would be extracted from both SPC’s Power/Business Intelligence and Pulse/Business Intelligence. Due to the pandemic, Institutional Effectiveness extracted all program trend charts and uploaded them to SharePoint in 2020, instead of conducting training sessions for program administrators to extract their own as usual.
As in prior years, Institutional Effectiveness conducted individualized program meetings for each lower division program, though in 2020 the meetings were held virtually rather than in person. Meeting attendees included the respective dean and program administrators,
Academic Program Viability Report UD 2019-20 Page 1

Career Connections, Academic Services, and Triad representatives. The meetings consisted of reviewing trend data charts and discussing goals and strategies that could be implemented to improve upon prior performance metrics. Program Goals and Strategies Beginning in 2020, program Goals and Strategies were submitted by deans/program administrators to capture detailed information about improvements expected to be completed during the following twelve months. These are completed using an automated form, after the program viability meeting and agreement by appropriate parties, and are added to each program’s APVR. Similarly, in prior years deans/program administrators completed action plans. Follow-up Reports Viability meetings also include a discussion regarding the previous year’s performance improvement status. A second form, program Goals and Strategies follow-up, is used to capture the results for the previous year. This completed form is also added to the program’s APVR.
Academic Program Viability Report UD 2019-20 Page 2

2019-20 Viability Report Measure Descriptions
Individual program reports include fourteen measures which are designed to evaluate a program’s viability. The source of the information for the first nine measures is the Viability Report Dashboard in Power BI; and for the next two measures it is the SPC Pulse/Business Intelligence system. Measures are extracted in October and November. Each measure is described in detail below. Power BI Dashboards I. Enrollment Tab Measure #1: Student Count by Academic Year Student Count by Academic Year is the total number of unduplicated students enrolled in courses within the specified Academic Organization during the selected academic years. Measure #2: SSH by Campus SSH enrollment by Campus is defined as the total number of student semester hours in the specified Academic Organization during the selected academic years. The overall SSH values and campus-specific values are provided. Measure #3: Success Rate by Academic Year The performance graph displays the percent of students successfully completing a course with a grade of A, B, or C (success rate), divided by the total number of students enrolled in courses within the Academic Organization during the selected academic years. Measure #4: Student Count by Ethnic Group and Academic Year Student Count by Academic Year is the total number of unduplicated students enrolled in courses within the specified Academic Organization during the selected academic years broken down by Asian, Black/African American, Hispanic/Latino, and White students. Measure #5: Success Rate by Course The Performance Table displays the student count, enrollment count, and percent of students successfully completing a course with a grade of A, B, or C (success rate), divided by the total number of students enrolled in courses within the Academic Organization during the selected academic years. The filters for the Enrollment Tab measures are as follows:
• Term: All
• Program: All
Academic Program Viability Report UD 2019-20 Page 3

• Plan: All
• College School Department: All
• Academic Organization: Academic Organization
• All other filters: All
II. Retention TabMeasure #6: Retention (by Semester)The Retention Table displays the Academic Plan ID, Student Count,Enrollment Count, Units Taken, Success Rate, Retention Count, andRetention Rate within the Academic Organization during the selectedacademic years.The filters for the Retention Tab measures are as follows:
• Academic Program: All
• Academic Plan: All
• College School Department: All
• Academic Organization: Academic Organization
• All other filters: All
III. Graduates TabMeasure #7: Number of Graduates and Number of Awards byAcademic YearThe graduates measure depicts the total number of graduates andawards within the specified program plan(s) associated with theAcademic Organization, for the selected academic years.
Measure #8: Student Count by Ethnic Group and Academic Year The graduates measure depicts the total number of awards within the specified program plan(s) associated with the Academic Organization broken down by Asian, Black/African American, Hispanic/Latino, and White students, for the selected academic years.
The filters for the Graduates Tab measures are as follows:
• Term: All
• Program: All
• Plan: Academic Plan
• All other filters: All
IV. Retention Trend TabMeasure #9: Retention Trend (by Semester)The Retention Table displays the Retention Trend Rate during theselected academic years.
The filters for the Retention Tab measures are as follows:
Academic Program Viability Report UD 2019-20 Page 4

• History Program Plan:
• Academic Plan: All
• College School Department: All
• Academic Organization: Academic Organization
• All other filters: All Pulse BI Dashboards Measure #10: Percent Full The percent full metric is calculated by dividing the actual enrollment count of the specified Academic Organization, by the Standard Course Load (SCL) for selected the academic terms. The filters for the Percent Full metric are as follows:
• Term Desc - Multi: 2019-20 Fall, Spring, Summer; 2020-21 Fall
• College - Group - Acad Org - Subject: Academic Organization
• Class Status: Active, Full, Stop Further Enrollment
• All other filters: All
Measure #11: Internship Enrollment (Course Groups) The Internship Enrollment measure reports the number of students enrolled in clinical, practicum, or internship courses within the program plan during the selected academic years. The filters for the Internship Enrollment measure are as follows:
• Academic Year - Term Desc - Multi: 2019-20 Fall, Spring, Summer;2020-21 Fall
• Career – Program – Plan – Subplan – Multi: Program Plan
• All other filters: All Sources for the remaining metrics are provided below Measure #12: Industry Certification Attainment The Industry Certification Attainment measure reports the number of students in the program plan that have attained an industry certification or have passed a licensing exam. Source: Career Pathways Department Database, and SPC Fact Book. Measure #13: Total Placement Total Placement is the percentage of students who are continuing their education or are employed in their field within the first year of graduation. The source of the information is: Florida Department of
Academic Program Viability Report UD 2019-20 Page 5

Education http://www.fldoe.org/accountability/fl-edu-training-placement-info-program/fl-college-system-vocational-reports.stml. Measure #14: National, State, and County Trends Employment trend information is reported by country, state, and county. The source of the information is: Florida Department of Economic Opportunity (DEO) http://www.floridajobs.org/labor-market-information/data-center/statistical-programs/employment-projections. Jobs (2019) refers to the average annual job openings due to growth and net replacement; % Change (2019-2027) depicts the percent change in the number of annual job openings during the eight-year period; and Median Earnings refers to the average earnings for the specified job title. [Note: the 14th area, employment trend information, is not charted and cannot be directly impacted by program performance. Trend data by job title(s) will be provided to each program].
Academic Program Viability Report UD 2019-20 Page 6

ACADEMIC PROGRAM VIABILITY REPORTStudent Count by Academic Year
0
100
200
300
400
2017 2018 2019 2020
415
375
329
183
SSH By Campus
Campus 2017
2018
2019
2020
Clearwater CampusElectronic CampusEpiCenter
31,152
519
1,272
312
1,122
186
59466
Total 1,674 1,584 1,308 660
Student Count by Ethnic Group and Academic Year
0
100
200
300
2017 2018 2019 2020
16 17 176
37 37 3518
49 48 4731
293
253
210
117
Ethnic Group Asian Black/African American Hispanic/Latino White
Success Rate by Academic Year
0%
20%
40%
60%
80%
2017 2018 2019 2020
88.0%80.9% 83.3% 80.9%
Term
All
Program
All
Plan
All
College School Depart…
All
Success Rate By Course
Academic YearSubject
2017StudentCount
EnrollmentCount
SucRate
ACG3103FIN4414MAN4725MAN4940MAR3334MAR4841QMB3200
5252
135165340
194
5453
135165440
206
8999997
Total 415 558 8Academic Organization
Business Adm-UD
Community
All
FTIC Flag
All
Part Full Time
All
Gender
All
Academic Program Viability Report UD 2019-20 Page 7

ACADEMIC PROGRAM VIABILITY REPORT
Academic Plan
All Academic Plan Id Student Count Enrollment Count
Units Taken Success Rate Grads Count2019-20
Enrolled in Fall2020-21 (0580)
Retention Rate0565 to 0580
BUS-BSMGTORG-BASSUSMGT-BASBUS-ASENRCH-NOBACCAPP-NOFSPFIN-TRINTBUS-BASTMGT-BASCIT-ASELEDR-BSHSA-ASBUS-TRENTR-CTMGT/LDR-CTWEBDS-CTACTAP-CTGEN-AAITSC-CTTRANS-NO
1731131
1
1
1
1
1
1,22983331612666544422221111
3,903264994832181818151211866663333
85.7 %81.9 %75.8 %93.8 %75.0 %
100.0 %83.3 %83.3 %
100.0 %100.0 %100.0 %50.0 %
100.0 %100.0 %100.0 %100.0 %100.0 %100.0 %
5681
1
10611
89.6 %81.8 %66.7 %
100.0 %
Total 193 1,420 4,482 85.3 % 66 108 86.5 %
86.5%Retention Rate 0565 to 0580
108Enrolled in Fall 2020-21
85.3%Success Rate Fall 2019-20
Academic Program
All
College School Depart…
All
Academic Organization…
BUS-UD
Community
All
FTIC Flag
All
Ethnic Group
All
Gender
All
66Grads Count 2019-20
193Student Count Fall 2019-20
Academic Program Viability Report UD 2019-20 Page 8

ACADEMIC PROGRAM VIABILITY REPORTNumber of Grads and Number of Awards by Academic Year
0
50
100
150
2017 2019 2018
148 148
131
148 148
131
Number of Grads Number of Awards
Student Count by Ethnic Group and Academic Year
0
50
100
2017 2019 2018
5 410
5
16 1314
24
13
118
9791
Student.Ethnic Group Asian Black/African American Hispanic/Latino White
Term
All
Program
All
Plan
BUS-BS
Academic YearDegree
2017Numberof Grads
Numberof Awards
2018Numberof Grads
Numberof Awards
2019Numberof Grads
Numberof Awards
BSBUS-BS
148148
148148
131131
131131
148148
148148
Total 148 148 131 131 148 148
Gender
All
Academic Program Viability Report UD 2019-20 Page 9

ACADEMIC PROGRAM VIABILITY REPORT
Academic Plan
All
88.6%Retention Rate 0535 to 0550
102Enrolled in Fall 2018-19
236Student Count Fall 2017-18
90.8%Success Rate Fall 2017-18
Academic Program
All
College School Depart…
All
Academic Organization…
BUS-UD
Community
All
FTIC Flag
All
Ethnic Group
All
Gender
All
114Grads Count 2017-18
221Student Count Fall 2018-19
193Student Count Fall 2019-20
89.3%Success Rate Fall 2018-19
85.3%Success Rate Fall 2019-20
110Enrolled in Fall 2019-20
108Enrolled in Fall 2020-21
79Grads Count 2018-19
66Grads Count 2019-20
82.8%Retention Rate 0550 to 0565
86.5%Retention Rate 0565 to 0580
Academic Plan Id Retention Rate 0535 to 0550 Retention Rate 0550 to 0565 Retention Rate 0565 to 0580
BACCAPP-NOBUS-BSINTBUS-BASMGTORG-BASSUSMGT-BASTMGT-BAS
100.0 %88.5 %50.0 %92.5 %
82.9 %
100.0 %80.0 %
100.0 %
89.6 %
81.8 %66.7 %
100.0 %Total 88.6 % 82.8 % 86.5 %
Academic Program Viability Report UD 2019-20 Page 10

��������� ������ ������� ��������� ����� � ����� ����
�������������� ������� ��!���"��������������� ������� ��������� ����������� ���� ���# $�$
%&'()*+,-. /)012))3 4-)5(,6) %,.)1 7+8)(. 9+&( :::%)'(;& .&,1 1,.)%*<=>?1,-)11 :-.)@@,A)-;) B,-'-;,'@ :-2+(C'.,+- 7);(?,.C)-. '-3 D3C,11,+-1 = 5).',@1 %.?3)-. :-2+(C'.,+- EFGHIJF KJLMNOPFQMJ R SIFPQTUVWXYZ[V \]_]WZ [Wa[b[cd eYf]c g \Y]VYhc ijbb k-(+@@C)-.l*)(2+(C'-;)l*)(;)-. B?@@lm('3?'.)1l<+?(1) m(+?n1\Y]VYhc ijbb oYc][V p]Wfq <@'11 %.'.?1r stFQuIv wGTTv EFMx wGNFyIN zJNMTTOIJFv <@'11 D;'3)C,; m(+?nr {Sv |Sv <@'11 <+@@)A) %;&++@ 5)n. = D;'3)C,; m(+?n 5)1; = D;'3)C,; 4(A'-,}'.,+- = %?8~);. <'.'@+A /8(r �|ER|S
\Y]VYhc ijbb oYc][V ad �h�c]jVc[hWb oYcqX ������� �������� ���� � ���� ������������ � ������� ����������� ����� ���������� ���� ��������� �� ¡ ¢ £��¤������ ¥¤��� ��¦ �§ �§ ¡ ������ ���� ��������� �� ¡ ¢ �������� ¥¤���� ©¤�� �¦� �¦ �¦ �� ������� ���� ��������� �� ¡ ¢ ª������ ���� �«�¬ ��«�¬ ¦«�¬ ¡�«�¬ �¦«¬����� ���� ��������� �� ®�¢ £��¤������ ¥¤��� �� �¦ �� ¡ � ������ ���� ��������� �� ®�¢ �������� ¥¤���� ©¤�� �¦� �¦ �¦ �� �������� ���� ��������� �� ®�¢ ª������ ���� ® «¦¬ ���«�¬ ¦�«®¬ ¡�«�¬ ®«¡¬������ ���� ��������� �� ® ¢ £��¤������ ¥¤��� ¦� ¦������� ���� ��������� �� ® ¢ �������� ¥¤���� ©¤�� ������ ���� ��������� �� ® ¢ ª������ ���� ¡�«�¬ ¡�«�¬���� ���� ��������� �� �¢ £��¤������ ¥¤��� �¡� �® ¦ �¦���� ���� ��������� �� �¢ �������� ¥¤���� ©¤�� �¦� § �� ������� ���� ��������� �� �¢ ª������ ���� ®�«¦¬ ¦¦«®¬ ¦�«�¬ ®®«�¬ <@'11 %.'.?1r stFQuIv wGTTv EFMx wGNFyIN zJNMTTOIJFv <@'11 D;'3)C,; m(+?nr {Sv |Sv <@'11 <+@@)A) %;&++@ 5)n. = D;'3)C,; m(+?n 5)1; = D;'3)C,; 4(A'-,}'.,+- = %?8~);. <'.'@+A /8(r �|ER|Sv B,@.)( )Cn. (+01 '-3 ;+@?C-1
Academic Program Viability Report UD 2019-20 Page 11

��������� ������ ������� ��������� ����� � ����� ������
�������������� ������� ��!���"��������������� ������� ��������� ����������� ������ ���# $�$
%&'()*+,-. /)012))3 4-)5(,6) %,.)1 7+8)(. 9+&( :::%)'(;& .&,1 1,.)%*<=>?1,-)11 :-.)@@,A)-;) B,-'-;,'@ :-2+(C'.,+- 7);(?,.C)-. '-3 D3C,11,+-1 = 5).',@1 %.?3)-. :-2+(C'.,+- EFGHIJF KJLMNOPFQMJ R SIFPQTUVWXYZ[V \]_]WZ [Wa[b[cd eYf]c g hi]jY k]ifj l-(+@@C)-.m*)(2+(C'-;)m*)(;)-. B?@@mn('3?'.)1m<+?(1) n(+?o1hi]jY k]ifj pqrr stuv wxyz{wxwx |x}~}� ��u��� stuv wxyz{wxwx |x}�x� ��vvtu stuv wxyz{wxwx |x}�}� pqrr stuv wxwx{wxwy |x}�x��rq�� ���u�t �u��� { ����t�� �q�qr�� ��u�����r��q�t� ����t�� ����� ��v�tu �� �rq��t� �����r��q�t� ����t�� ����� ��v�tu �� �rq��t� �����r��q�t� ����t�� ����� ��v�tu �� �rq��t� �����r��q�t� ����t�� ����� ��v�tu �� �rq��t����wz�x y y�����w} ~ y � y � y����zxx �w y ~� y �x y����z�x w y y y y y w y <@'11 <+?(1) n(+?o� KJFINJ��Q� �MGN�I�� %.?3)-. )(C <'())( 5)1; = *(+A('C 5)1; = *@'- 5)1; = %?8o@'- 5)1;� ¡G�QJI�� ¢HOQJQ�FNPFQMJ R ¡E� <@'11 D;'3)C,; <'())(� £¤¥S� B,@.)( )Co.¦ (+01 §ciXYc §djcYZ hiaY eY©]Yjª«q�� ¬t�ut�® °±²°±³±³ �µ¶�³ D9[Wa[b[cd eYf]c \]VYjj ·ViZYc �q��r��¹ ¬t��u� ºu��t�� »���vt��D;'3)C,; ¼)'( = )(C 5)1; = 9?@., B'@@ )(C ±³¶=±³±³ ½³²¾²¿� %o(,-A )(C ±À<'Co?1 5)1;(,o.,+- D@@<'())( = *(+A('C = *@'- = %?8o@'- = 9?@., >?1,-)11 D3C,-,1.('.,+- = >%<+@@)A) = n(+?o = D;'3 4(A = %?8Á);. D@@<+?(1) :-1.(?;.,+-'@ 9).&+3 D@@%.?3)-. ¦o) ½B :<¿D@@DA) n(+?o D@@l.&-,; n(+?o D@@n)-3)(D@@<?1.+C <+&+(. D@@%.?3)-. n(+?o D@@Academic Program Viability Report UD 2019-20 Page 12

Industry Certification Attainment
An industry certification or equivalent state or national exam has not been identified for the College of Business: Business Administration, BS program for evidence of certification attainment at the baccalaureate level.
Academic Program Viability Report UD 2019-20 Page 13

2019-20 Placement Data
*Refers to graduates found to be employed full-time or part-time
BUS BS Pool Count Percent Placed 2014-15 86 80% 2015-16 103 78% 2016-17 126 78% 2017-18 153 84%
Source: http://www.fldoe.org/accountability/fl-edu-training-placement-info-program/fl-college-system-reports.stml
80% 78% 78% 84%
0%
20%
40%
60%
80%
100%
2014-15 2015-16 2016-17 2017-18
Perc
ent o
f Stu
dent
sPl
aced
BUS BS*
Total Placement
Academic Program Viability Report UD 2019-20 Page 14

Table 1 Growth for Project management specialists and business operations specialists, all other
Jobs (2019) Median Earnings National 1,279,390 $35.37/hr
Florida 86,800 $29.35/hr
Pinellas County 14,430 $30.21/hr
Source: U.S. Department of Labor, Bureau of Labor Statistics https://www.bls.gov/oes/tables.htm
Table 2 Growth for Administrative services and facilities managers
Jobs (2019) Median Earnings National 307,280 $46.61/hr
Florida 15,970 $38.72/hr
Pinellas County 2,510 $40.43/hr
Source: U.S. Department of Labor, Bureau of Labor Statistics https://www.bls.gov/oes/tables.htm
Academic Program Viability Report UD 2019-20 Page 15

Perkins Completion & Non-Traditional Completion Performance
Perkins completion metrics do not apply to baccalaureate programs.
Academic Program Viability Report UD 2019-20 Page 16

Action Plan Follow-up and Evaluation Report for 2018-19 Viability Report Program: Business, Upper Division Date Completed: August 2020 Prepared By: Marta Przyborowski I. Action Plan Items Status
Action Item
Measure
Addressed (Value)
Completion
Status
Status Explanation
1
Develop a financial innovation center to align with the financial services subplan. This item was carried forward from the 2017-18 Action Plan.
Job Placement
Not Completed
The scope and focus of this project have changed.
II. Non-Completed Action Plan Items and Plan for Completion
Action Item
Completion
Date
Plan for Completion
1
Develop a financial innovation center to align with the financial services subplan. This item was carried forward from the 2017-18 Action Plan.
N/A The scope and focus of this project have changed. This action plan will not be moved forward.
III. Evaluation of the Impact of Action Plans on Program Quality The above action item pertained to a planned initiative for the Downtown Center. The proposed ‘Financial Innovation Center’ has changed in scope and focus. We are now offering our lower division Risk Management and Insurance program at the Downtown Center.
Academic Program Viability Report UD 2019-20 Page 17

St. Petersburg College
Program Goals and Strategies Program: Business, Upper Division Date Completed: 2/2/2021 Due Date: August 2021 Prepared By: Marta Przyborowski I. Goals
Program Goals SPC Commitment Pillar
1 Explore the possibility of developing a Business Analytics course. The course will be added to Major Core requirement for the program.
Academic Excellence
2 Review trends pertaining to the reduced program enrollment and determine strategies to improve enrollment.
Academic Excellence
II. Strategies
Strategies to be Implemented Viability Metric Target Outcome
Goal # Responsible Individuals
1
Develop a Business Analytics course that will highlight the importance of analysis in decision making, understanding of metrics, and the tools used in the analysis process.
SSH Enrollment: The addition of the course to the Major Core will result in additional SSH for the COB.
1 Dean, Academic Chair, and
Faculty
2
Ensure program is promoted and highlighted during college-wide and community wide recruitment events. Survey students who have 'stopped-out' to determine causes/challenges of finishing program. Ensure program transfer pathways are visible to prospective students (AA/AS).
Unduplicated Headcount: Increase unduplicated headcount by 25 students.
2 Dean, Academic Chair, and
Faculty
III. Special Resources Needed: Marketing funds for added program promotion. Course development funds.
IV. Area(s) of Concern/Improvement: N/A
Academic Program Viability Report UD 2019-20 Page 18

ACADEMIC PROGRAM VIABILITY REPORTStudent Count by Academic Year
0
500
1,000
1,500
2017 2018 2019 2020
1,3111,425 1,457
1,039
SSH By Campus
Campus 2017
2018
2019
2020
Electronic CampusEpiCenterSeminole Campus
5,6581,641
69
6,2402,079
5,8922,466
3,6601,797
Total 7,368 8,319 8,358 5,457
Student Count by Ethnic Group and Academic Year
0
200
400
600
800
1,000
2017 2018 2019 2020
40 52 44 29
149 163 174113
873945 967
705
Ethnic Group Asian Black/African American Hispanic/Latino White
Success Rate by Academic Year
0%
20%
40%
60%
80%
2017 2018 2019 2020
87.0% 84.4% 86.0% 83.3%
Term
All
Program
All
Plan
All
College School Depart…
All
Success Rate By Course
Academic YearSubject
2017StudentCount
EnrollmentCount
SucRate
FIN4470MAN3503MAN3786MAN3802MAN4061MAN4583MAN4584MAN4787MAN4788MAN4801MAN4881MAN4883MAN4885MAN4900MAR4836SPM3154SPM4104
4462694
24743
401
541045
1517773
22186
4464695
25147
414
571147
1527880
22388
1087879
75899898
Total 1,311 2,233 8
Academic Organization
Mgmt & Orgnl Ldrsh…
Community
All
FTIC Flag
All
Part Full Time
All
Gender
All
Academic Program Viability Report UD 2019-20 Page 19

ACADEMIC PROGRAM VIABILITY REPORT
Academic Plan
All Academic Plan Id Student Count Enrollment Count
Units Taken Success Rate Grads Count2019-20
Enrolled in Fall2020-21 (0580)
Retention Rate0565 to 0580
MGTORG-BASBUS-BSTMGT-BASSUSMGT-BASGEN-AAHSA-BASDENH-BASPRJMGT-CTBUS-TRBUS-ASARCH-ASITSC-ASENRCH-NOBACCAPP-NOCIT-ASCWPA-ASCOMSC-TRHSA-ASFSPMGT-TRLEGAL-AS
4022579550278
2731 1
1,8971,299
906303755049484140131312111111101088
6,0144,1232,741
90922114915114412212032393333333330232422
82.9 %85.1 %92.9 %84.8 %94.7 %90.0 %
100.0 %79.2 %90.2 %97.5 %
100.0 %84.6 %91.7 %90.9 %90.9 %90.9 %50.0 %50.0 %87.5 %
100.0 %
186124421021583
1831145731
63
11 1 1
82.6 %91.1 %92.6 %78.0 %
100.0 %85.7 %
100.0 %70.4 %
100.0 %100.0 %
100.0 %
Total 859 4,925 15,325 86.0 % 385 408 85.8 %
85.8%Retention Rate 0565 to 0580
408Enrolled in Fall 2020-21
86.0%Success Rate Fall 2019-20
Academic Program
All
College School Depart…
All
Academic Organization…
MGTORG-UD
Community
All
FTIC Flag
All
Ethnic Group
All
Gender
All
385Grads Count 2019-20
859Student Count Fall 2019-20
Academic Program Viability Report UD 2019-20 Page 20

ACADEMIC PROGRAM VIABILITY REPORTNumber of Grads and Number of Awards by Academic Year
0
100
200
2019 2018 2017
221210 209
251226
211
Number of Grads Number of Awards
Student Count by Ethnic Group and Academic Year
0
50
100
150
2019 2018 2017
9 6 4
3021
2628 31 27
163156
142
Student.Ethnic Group Asian Black/African American Hispanic/Latino White
Term
All
Program
All
Plan
Multiple selections
Academic YearDegree
2017Numberof Grads
Numberof Awards
2018Numberof Grads
Numberof Awards
2019Numberof Grads
Numberof Awards
BASMGTORG-BAS
CERTPRJMGT-CT
1931931818
1931931818
1761765050
1761765050
1901906161
1901906161
Total 209 211 210 226 221 251
Gender
All
Academic Program Viability Report UD 2019-20 Page 21
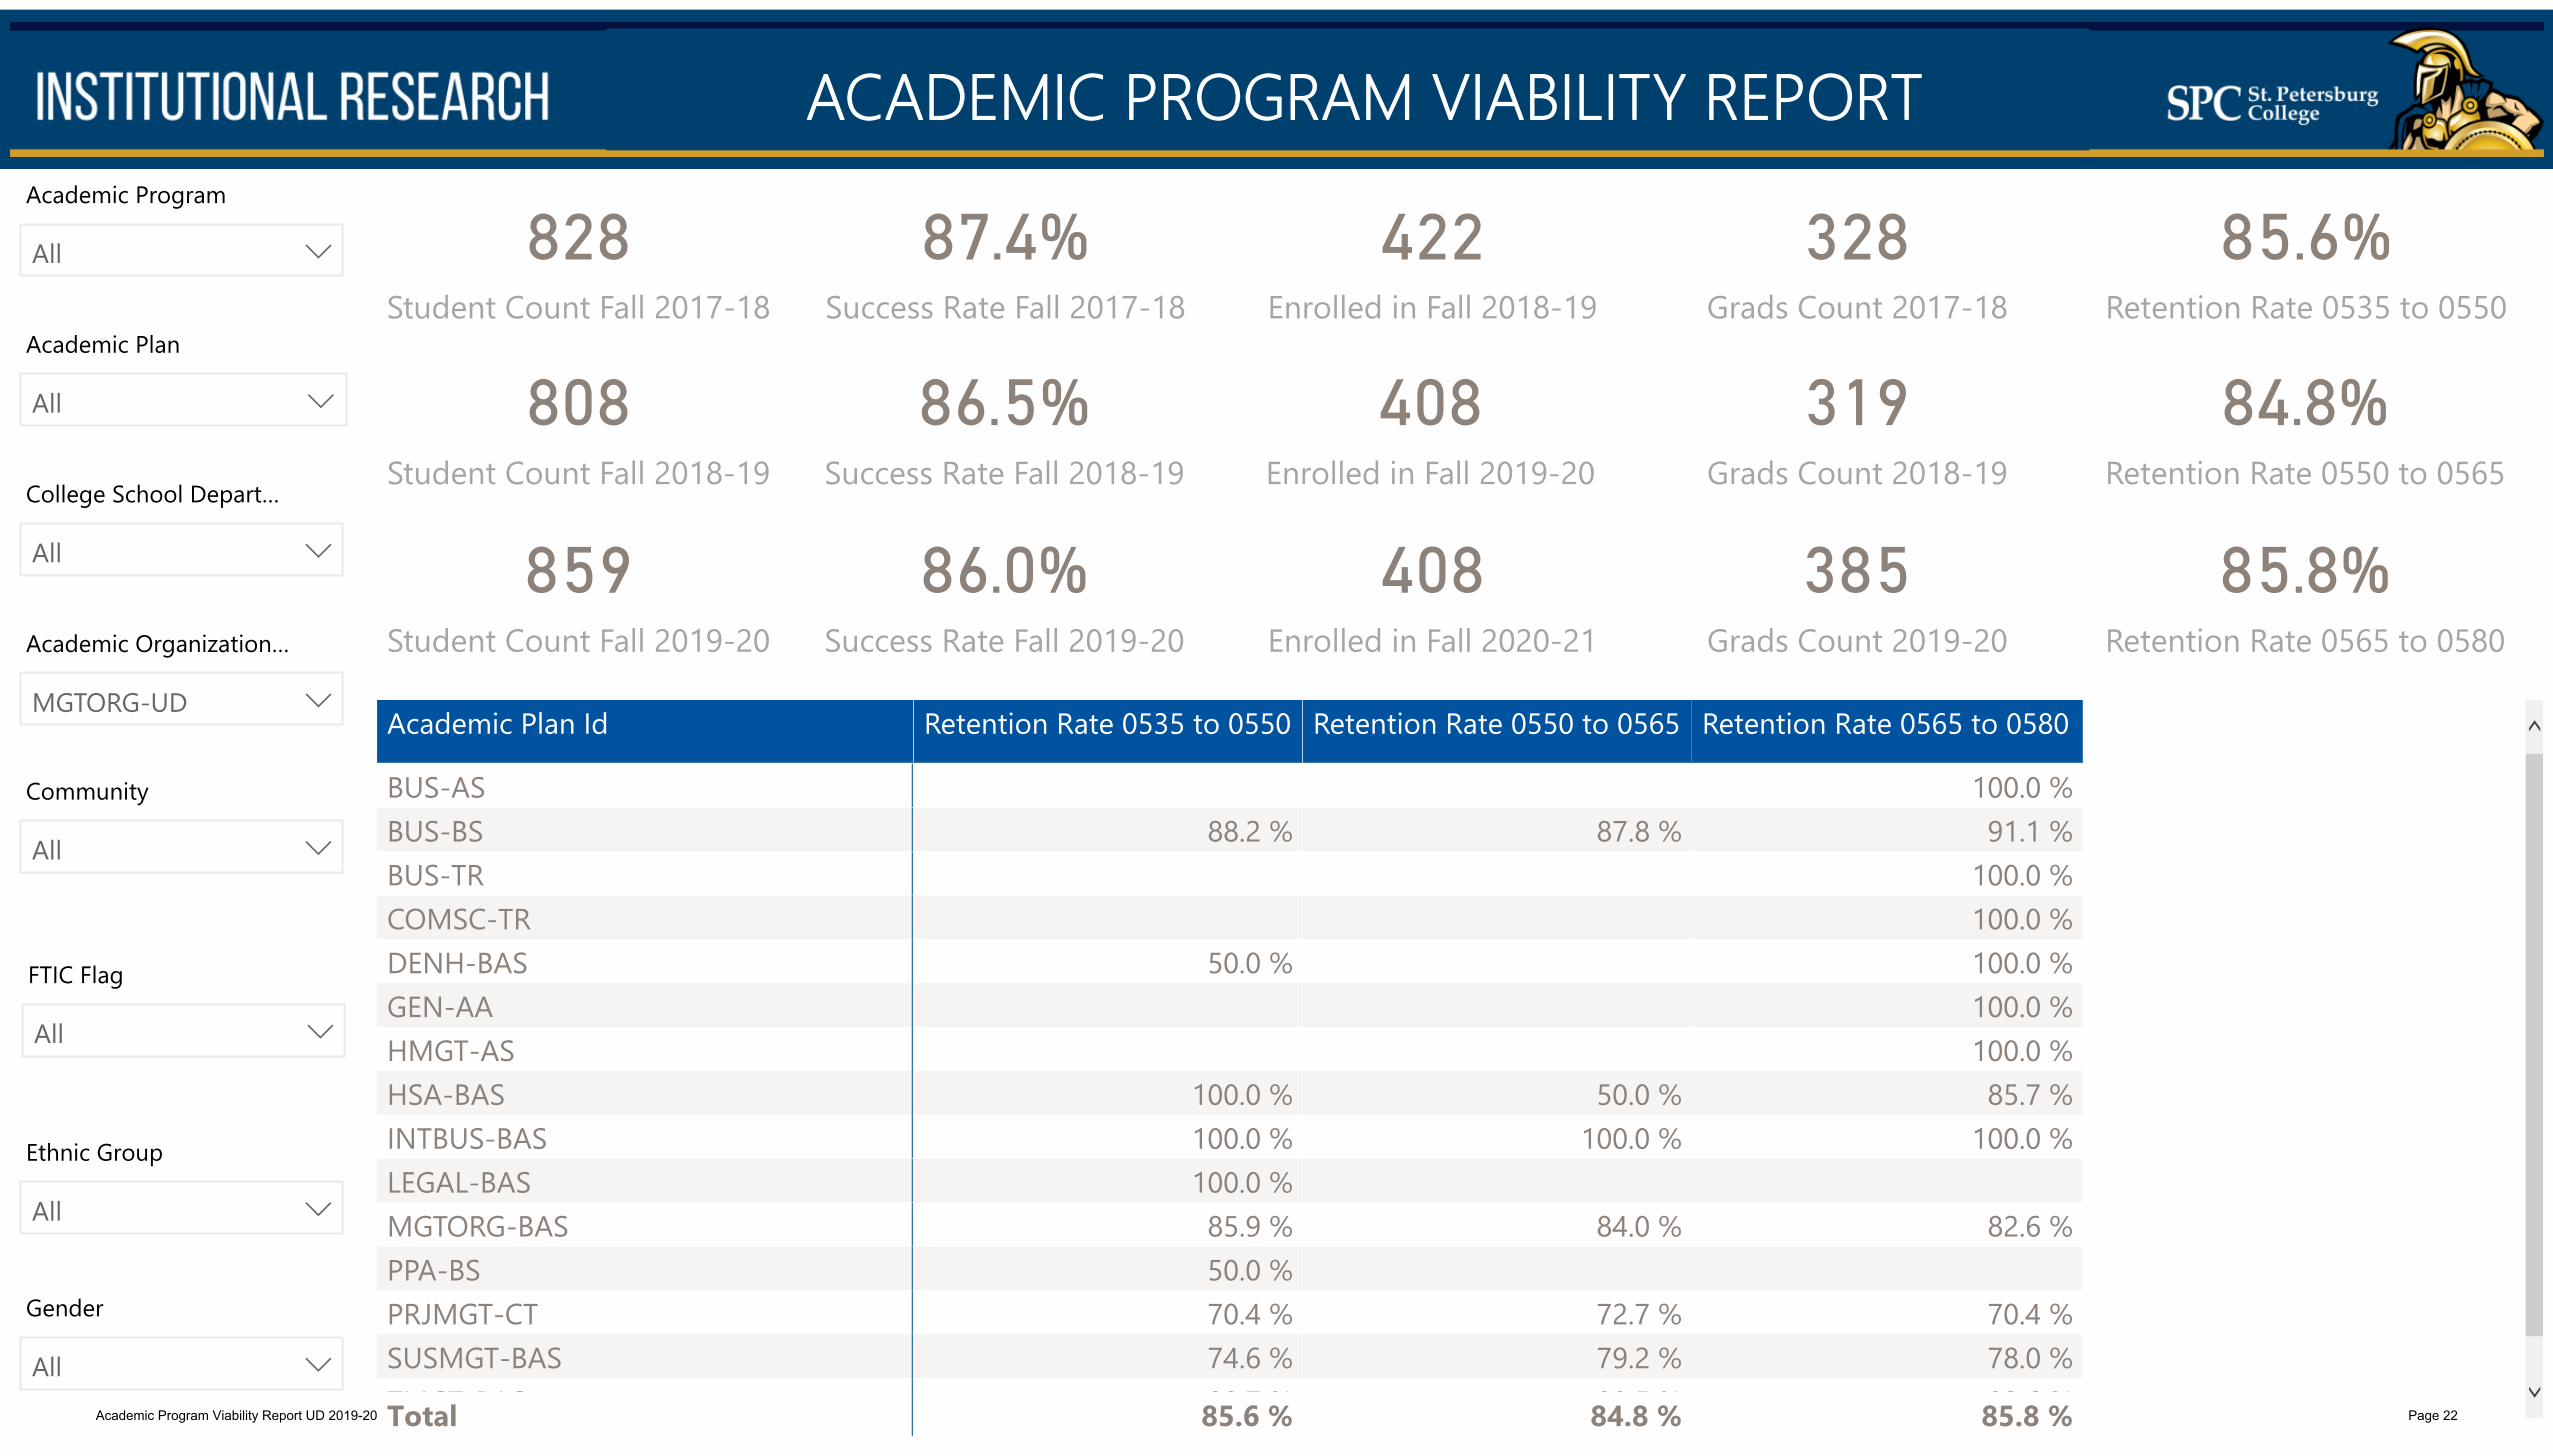
ACADEMIC PROGRAM VIABILITY REPORT
Academic Plan
All
85.6%Retention Rate 0535 to 0550
422Enrolled in Fall 2018-19
828Student Count Fall 2017-18
87.4%Success Rate Fall 2017-18
Academic Program
All
College School Depart…
All
Academic Organization…
MGTORG-UD
Community
All
FTIC Flag
All
Ethnic Group
All
Gender
All
328Grads Count 2017-18
808Student Count Fall 2018-19
859Student Count Fall 2019-20
86.5%Success Rate Fall 2018-19
86.0%Success Rate Fall 2019-20
408Enrolled in Fall 2019-20
408Enrolled in Fall 2020-21
319Grads Count 2018-19
385Grads Count 2019-20
84.8%Retention Rate 0550 to 0565
85.8%Retention Rate 0565 to 0580
Academic Plan Id Retention Rate 0535 to 0550 Retention Rate 0550 to 0565 Retention Rate 0565 to 0580
BUS-ASBUS-BSBUS-TRCOMSC-TRDENH-BASGEN-AAHMGT-ASHSA-BASINTBUS-BASLEGAL-BASMGTORG-BASPPA-BSPRJMGT-CTSUSMGT-BASTMGT BAS
88.2 %
50.0 %
100.0 %100.0 %100.0 %85.9 %50.0 %70.4 %74.6 %88 7 %
87.8 %
50.0 %100.0 %
84.0 %
72.7 %79.2 %88 5 %
100.0 %91.1 %
100.0 %100.0 %100.0 %100.0 %100.0 %85.7 %
100.0 %
82.6 %
70.4 %78.0 %92 6 %Total 85.6 % 84.8 % 85.8 %Academic Program Viability Report UD 2019-20 Page 22

��������� ������ ������� ��������� ����� � ����� ����
�������������� ������� ��!���"��������������� ������� ��������� ����������� ���� ���# $�$
%&'()*+,-. /)012))3 4-)5(,6) %,.)1 7+8)(. 9+&( :::%)'(;& .&,1 1,.)%*<=>?1,-)11 :-.)@@,A)-;) B,-'-;,'@ :-2+(C'.,+- 7);(?,.C)-. '-3 D3C,11,+-1 = 5).',@1 %.?3)-. :-2+(C'.,+- EFGHIJF KJLMNOPFQMJ R SIFPQTUVWXYZ[V \]_]WZ [Wa[b[cd eYf]c g \Y]VYhc ijbb k-(+@@C)-.l*)(2+(C'-;)l*)(;)-. B?@@lm('3?'.)1l<+?(1) m(+?n1\Y]VYhc ijbb oYc][V p]Wfq <@'11 %.'.?1r stFQuIv wGTTv EFMx wGNFyIN zJNMTTOIJFv <@'11 D;'3)C,; m(+?nr {Sv |Sv <@'11 <+@@)A) %;&++@ 5)n. = D;'3)C,; m(+?n 5)1; = D;'3)C,; 4(A'-,}'.,+- = %?8~);. <'.'@+A /8(r ������R|S
\Y]VYhc ijbb oYc][V ad �h�c]jVc[hWb oYcqX ������� �������� ���� � ���� ������������ � ������� ����������� ����� ���������� ���� � ¡¢�� � £ ¤¥¤¦ §�������� ©��� ¡ª «¡ ¡«¤ ¤« ¬¢���� ���� � ¡¢�� � £ ¤¥¤¦ �������� ©���� ®�� ¢¬ � «� ¬¬¬���� ���� � ¡¢�� � £ ¤¥¤¦ °������ ���� ¡ ¬±¬² «�¢±�² «¢±�² ¢±¤²�����³ ���� � ¡¢�� � £ ¤« ¦ §�������� ©��� ¡ª ¡¬ ¡¥� ¥« «¬¢�����³ ���� � ¡¢�� � £ ¤« ¦ �������� ©���� ®�� ¡ª ¤¥ � ¢¥ ¢¥�����³ ���� � ¡¢�� � £ ¤« ¦ °������ ���� ¢¥±² ¥«¤± ² ¥¢±¬² ¬±²������ ���� � ¡¢�� � £ ¤«¤¦ §�������� ©��� ¤¬ ¤ ¤������ ���� � ¡¢�� � £ ¤«¤¦ �������� ©���� ®�� ¬ � ¥ ������ ���� � ¡¢�� � £ ¤«¤¦ °������ ���� ¢±�² � ±¬² ¢¬±¡²���� ���� � � �� �¡ £ ¤¬ ¦ §�������� ©��� ¡ª¡¤ �«¢ ¬«¡���� ���� � � �� �¡ £ ¤¬ ¦ �������� ©���� ®�� ¡ª ¬ ¡� ¬¬¬���� ���� � � �� �¡ £ ¤¬ ¦ °������ ���� ¡¡±¡² ��±¤² ¢¬±¡² <@'11 %.'.?1r stFQuIv wGTTv EFMx wGNFyIN zJNMTTOIJFv <@'11 D;'3)C,; m(+?nr {Sv |Sv <@'11 <+@@)A) %;&++@ 5)n. = D;'3)C,; m(+?n 5)1; = D;'3)C,; 4(A'-,}'.,+- = %?8~);. <'.'@+A /8(r ������R|Sv B,@.)( )Cn. (+01 '-3 ;+@?C-1
Academic Program Viability Report UD 2019-20 Page 23

��������� ������ ������� ��������� ����� � ����� ������
�������������� ������� ��!���"��������������� ������� ��������� ����������� ������ ���# $�$
%&'()*+,-. /)012))3 4-)5(,6) %,.)1 7+8)(. 9+&( :::%)'(;& .&,1 1,.)%*<=>?1,-)11 :-.)@@,A)-;) B,-'-;,'@ :-2+(C'.,+- 7);(?,.C)-. '-3 D3C,11,+-1 = 5).',@1 %.?3)-. :-2+(C'.,+- EFGHIJF KJLMNOPFQMJ R SIFPQTUVWXYZ[V \]_]WZ [Wa[b[cd eYf]c g hi]jY k]ifj l-(+@@C)-.m*)(2+(C'-;)m*)(;)-. B?@@mn('3?'.)1m<+?(1) n(+?o1hi]jY k]ifj pqrr stuv wxyz{wxwx |x}~}� ��u��� stuv wxyz{wxwx |x}�x� ��vvtu stuv wxyz{wxwx |x}�}� pqrr stuv wxwx{wxwy |x}�x��rq�� ���u�t �u��� { ����t�� �q�qr�� ��u�����r��q�t� ����t�� ����� ��v�tu �� �rq��t� �����r��q�t� ����t�� ����� ��v�tu �� �rq��t� �����r��q�t� ����t�� ����� ��v�tu �� �rq��t� �����r��q�t� ����t�� ����� ��v�tu �� �rq��t����wz�x w y�pswz�w y y�����w} � y ~ y � y����zxx yxx y z� y yw} y����z�x y y w y y y <@'11 <+?(1) n(+?o� KJFINJ��Q� �MGN�I� %.?3)-. ¡)(C <'())( 5)1; = *(+A('C 5)1; = *@'- 5)1; = %?8o@'- 5)1;� ¢£OF ¤ ¥N£JFT ¦IPHIN��Q� <@'11 D;'3)C,; <'())(� § ©S B,@.)( )Co.ª (+01 «ciXY¬c «djcYZ hiaY eY]Yj®q�� °t�ut�±² ³µ¶µ·µ· �¹º�·³ D9[Wa[b[cd eYf]c \]VYjj »ViZY¬c ¼�q��r��½ °t��u� ¾u��t�� ¿���vt��D;'3)C,; À)'( = ¡)(C 5)1; = 9?@., B'@@ ¡)(C µ·º³=µ·µ· Á·¶Â¶Ã %o(,-A ¡)(C µÄ<'Co?1 5)1;(,o.,+- D@@<'())( = *(+A('C = *@'- = %?8o@'- = 9?@., 9AC. Å 4(A-.@ Æ)'3)(1&,o<+@@)A) = n(+?o = D;'3 4(A = %?8Ç);. D@@<+?(1) :-1.(?;.,+-'@ 9).&+3 D@@%.?3)-. ¡ªo) ÁB¡:<ÃD@@DA) n(+?o D@@l.&-,; n(+?o D@@n)-3)(D@@<?1.+C <+&+(. D@@%.?3)-. n(+?o D@@
Academic Program Viability Report UD 2019-20 Page 24

Industry Certification Attainment
An industry certification or equivalent state or national exam has not been identified for the College of Business: Management and Organizational Leadership, BAS program for evidence of certification attainment at the baccalaureate level.
Academic Program Viability Report UD 2019-20 Page 25

2019-20 Placement Data
*Refers to graduates found to be employed full-time or part-time.
MGTORG BAS Pool Count Percent Placed 2014-15 113 78% 2015-16 120 74% 2016-17 132 72% 2017-18 200 73%
Source: http://www.fldoe.org/accountability/fl-edu-training-placement-info-program/fl-college-system-reports.stml
Academic Program Viability Report UD 2019-20 Page 26

Table 1 Growth for Management analysts
Jobs (2019) Median Earnings National 709,750 $40.99/hr
Florida 48,910 $32.24/hr
Pinellas County 8,710 $35.26/hr
Source: U.S. Department of Labor, Bureau of Labor Statistics https://www.bls.gov/oes/tables.htm
Table 2 Growth for Managers, all other
Jobs (2019) Median Earnings National $/hr
Florida $/hr
Pinellas County $/hr
Note: No data were found for this employment title. Source: U.S. Department of Labor, Bureau of Labor Statistics https://www.bls.gov/oes/tables.htm
Academic Program Viability Report UD 2019-20 Page 27

Perkins Completion & Non-Traditional Completion Performance
Perkins completion metrics do not apply to baccalaureate programs.
Academic Program Viability Report UD 2019-20 Page 28

Action Plan Follow-up and Evaluation Report for 2018-19 Viability Report Program: Management and Organizational Leadership, Upper Division Date Completed: August 2020 Prepared By: Marta Przyborowski I. Action Plan Items Status
Action Item
Measure
Addressed (Value)
Completion
Status
Status Explanation
1
Revisit the development of an HR track in the Management and Organizational Leadership program. This item was carried forward from the 2017-18 Action Plan.
SSH Enrollment
Not Completed
The feasibility of an HR track is still being reviewed. The COVID pandemic has impacted our enrollment and we are in the process of reviewing additional program options that will benefit our students.
2
Increase program visibility and marketing outreach via a comprehensive marketing plan.
Unduplicated Headcount
Not Completed
We are in the process of developing a communication to current SPC students (AA/AS) related to our upper division programs. An overall COB programs flyer was developed to assist with program promotion.
II. Non-Completed Action Plan Items and Plan for Completion
Action Item
Completion
Date
Plan for Completion
1
Revisit the development of an HR track in the Management and Organizational Leadership program. This item was carried forward from the 2017-18 Action Plan.
Spring 2021 The feasibility of an HR track is still being reviewed. The COVID pandemic has impacted our enrollment and we are in the process of reviewing additional program options that will benefit our students.
Academic Program Viability Report UD 2019-20 Page 29
Action Item
Completion
Date
Plan for Completion
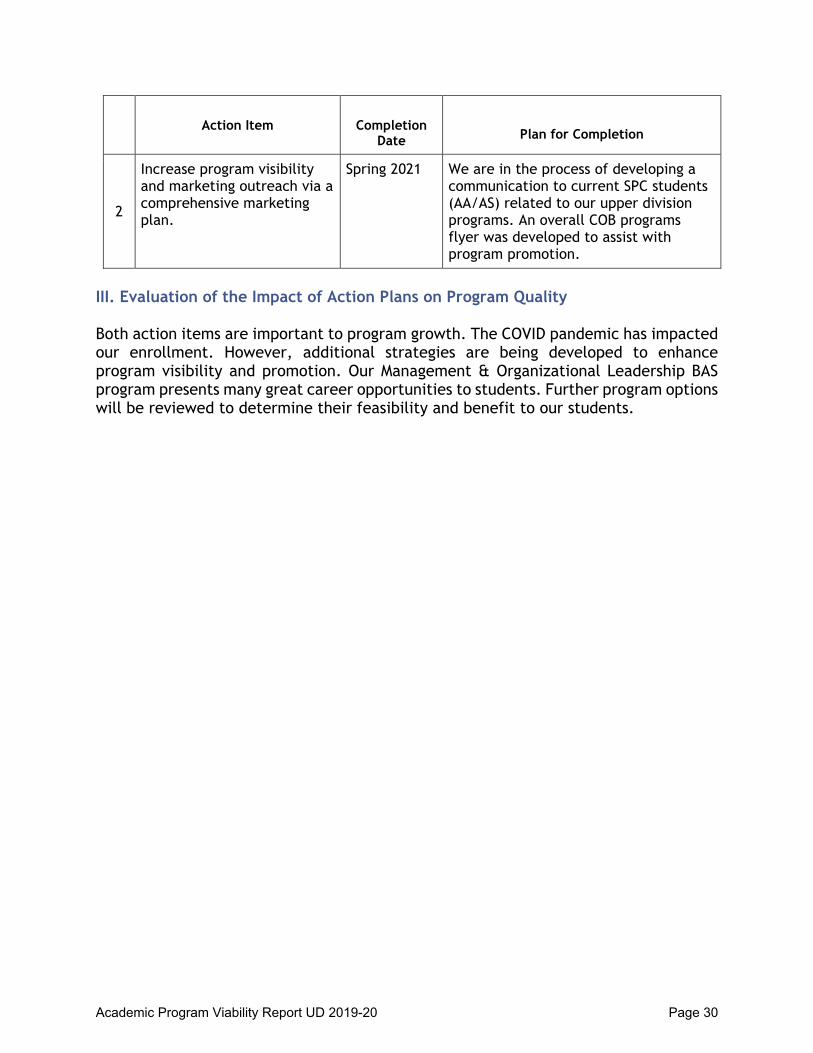
2
Increase program visibility and marketing outreach via a comprehensive marketing plan.
Spring 2021 We are in the process of developing a communication to current SPC students (AA/AS) related to our upper division programs. An overall COB programs flyer was developed to assist with program promotion.
III. Evaluation of the Impact of Action Plans on Program Quality Both action items are important to program growth. The COVID pandemic has impacted our enrollment. However, additional strategies are being developed to enhance program visibility and promotion. Our Management & Organizational Leadership BAS program presents many great career opportunities to students. Further program options will be reviewed to determine their feasibility and benefit to our students.
Academic Program Viability Report UD 2019-20 Page 30

St. Petersburg College
Program Goals and Strategies Program: Management and Organizational Leadership, Upper Division Date Completed: 2/2/2021 Due Date: August 2021 Prepared By: Marta Przyborowski I. Goals
Program Goals SPC Commitment Pillar
1 Increase program enrollment by promoting the program to current & prospective students (AA/AS).
Economic Mobility
2 Increase the number of relevant program options. Develop a new Strategic Communication concentration/subplan.
Academic Excellence
II. Strategies
Strategies to be Implemented Viability Metric Target Outcome
Goal # Responsible Individuals
1
Increase marketing efforts related to program promotion and visibility. Share program information with business partners.
SSH Enrollment: Increase program enrollment by 1%.
1 Marta Przyborowski
(COB)
2
Submit new program proposal. Develop 4-5 courses as part of the new concentration.
Unduplicated Headcount: This target aligns with the overall goal of increasing program enrollment (increase program enrollment by 1%).
2 Marta Przyborowski
(COB)
III. Special Resources Needed: Marketing funds. Course development funds.
IV. Area(s) of Concern/Improvement: N/A
Academic Program Viability Report UD 2019-20 Page 31

ACADEMIC PROGRAM VIABILITY REPORTStudent Count by Academic Year
0
100
200
2017 2018 2019 2020
253 248 240
197
SSH By Campus
Campus 2017
2018
2019
2020
Electronic CampusEpiCenter
774240
705297
618306
456249
Total 1,014 1,002 924 705
Student Count by Ethnic Group and Academic Year
0
50
100
150
2017 2018 2019 2020
8 6 7 513
27 22 2130 33 31
22
183
165 168
139
Ethnic Group Asian Black/African American Hispanic/Latino White
Success Rate by Academic Year
0%
20%
40%
60%
80%
100%
2017 2018 2019 2020
89.1%85.3%
91.6% 90.4%
Term
All
Program
All
Plan
All
College School Depart…
All
Success Rate By Course
Academic YearSubject
2017StudentCount
EnrollmentCount
SucRate
MAN3784MAN4741MAN4781MAN4783MAN4902
59158453334
60162463436
88997
Total 253 338 8
Academic Organization
Sustainability Manag…
Community
All
FTIC Flag
All
Part Full Time
All
Gender
All
Academic Program Viability Report UD 2019-20 Page 32

ACADEMIC PROGRAM VIABILITY REPORT
Academic Plan
All Academic Plan Id Student Count Enrollment Count
Units Taken Success Rate Grads Count2019-20
Enrolled in Fall2020-21 (0580)
Retention Rate0565 to 0580
MGTORG-BASSUSMGT-BASBUS-BSTMGT-BASPRJMGT-CTBIOLOGY-BSENVSC-ASBUS-TRFUNAT-ATCBACCAPP-NOENRCH-NOEDST-BS
3657191310
354256211120417643221
1,1357727023641231518126674
92.9 %86.7 %89.6 %91.7 %82.9 %
100.0 %100.0 %100.0 %100.0 %100.0 %100.0 %100.0 %
20301374
2420772
91.7 %84.2 %
100.0 %92.3 %60.0 %
Total 135 1,007 3,164 90.3 % 74 60 87.4 %
87.4%Retention Rate 0565 to 0580
60Enrolled in Fall 2020-21
90.3%Success Rate Fall 2019-20
Academic Program
All
College School Depart…
All
Academic Organization…
SUSMGT-UD
Community
All
FTIC Flag
All
Ethnic Group
All
Gender
All
74Grads Count 2019-20
135Student Count Fall 2019-20
Academic Program Viability Report UD 2019-20 Page 33

ACADEMIC PROGRAM VIABILITY REPORTNumber of Grads and Number of Awards by Academic Year
0
10
20
30
2018 2019 2017
30 29 2830 29 28
Number of Grads Number of Awards
Student Count by Ethnic Group and Academic Year
0
5
10
15
20
25
2018 2019 2017
21
23
5
23 23
18
Student.Ethnic Group Asian Hispanic/Latino White
Term
All
Program
All
Plan
SUSMGT-BAS
Academic YearDegree
2017Numberof Grads
Numberof Awards
2018Numberof Grads
Numberof Awards
2019Numberof Grads
Numberof Awards
BASSUSMGT-BAS
2828
2828
3030
3030
2929
2929
Total 28 28 30 30 29 29
Gender
All
Academic Program Viability Report UD 2019-20 Page 34

ACADEMIC PROGRAM VIABILITY REPORT
Academic Plan
All
87.3%Retention Rate 0535 to 0550
51Enrolled in Fall 2018-19
126Student Count Fall 2017-18
90.1%Success Rate Fall 2017-18
Academic Program
All
College School Depart…
All
Academic Organization…
SUSMGT-UD
Community
All
FTIC Flag
All
Ethnic Group
All
Gender
All
68Grads Count 2017-18
144Student Count Fall 2018-19
135Student Count Fall 2019-20
88.1%Success Rate Fall 2018-19
90.3%Success Rate Fall 2019-20
59Enrolled in Fall 2019-20
60Enrolled in Fall 2020-21
64Grads Count 2018-19
74Grads Count 2019-20
80.6%Retention Rate 0550 to 0565
87.4%Retention Rate 0565 to 0580
Academic Plan Id Retention Rate 0535 to 0550 Retention Rate 0550 to 0565 Retention Rate 0565 to 0580
BUS-BSMGTORG-BASPRJMGT-CTSUSMGT-BASTMGT-BAS
92.6 %95.0 %85.7 %83.6 %90.0 %
87.5 %90.9 %60.0 %79.7 %77.8 %
100.0 %91.7 %60.0 %84.2 %92.3 %
Total 87.3 % 80.6 % 87.4 %
Academic Program Viability Report UD 2019-20 Page 35

��������� ������ ������� ��������� ����� � ����� ����
�������������� ������� ��!���"��������������� ������� ��������� ����������� ���� ���# $�$
%&'()*+,-. /)012))3 4-)5(,6) %,.)1 7+8)(. 9+&( :::%)'(;& .&,1 1,.)%*<=>?1,-)11 :-.)@@,A)-;) B,-'-;,'@ :-2+(C'.,+- 7);(?,.C)-. '-3 D3C,11,+-1 = 5).',@1 %.?3)-. :-2+(C'.,+- EFGHIJF KJLMNOPFQMJ R SIFPQTUVWXYZ[V \]_]WZ [Wa[b[cd eYf]c g \Y]VYhc ijbb k-(+@@C)-.l*)(2+(C'-;)l*)(;)-. B?@@lm('3?'.)1l<+?(1) m(+?n1\Y]VYhc ijbb oYc][V p]Wfq <@'11 %.'.?1r stFQuIv wGTTv EFMx wGNFyIN zJNMTTOIJFv <@'11 D;'3)C,; m(+?nr {Sv |Sv <@'11 <+@@)A) %;&++@ 5)n. = D;'3)C,; m(+?n 5)1; = D;'3)C,; 4(A'-,}'.,+- = %?8~);. <'.'@+A /8(r E|E���R|S
\Y]VYhc ijbb oYc][V ad �h�c]jVc[hWb oYcqX ������� �������� ���� � ���� ������������ � ���������� ���� ��������� ������ ��� �����¡ ¢ ��¡ ��� ££ ������� ���� ��������� ������ ¤¡������ ¢ ���� ¥ �� ��¦ £¦ ������� ���� ��������� ������ §�����¡ ���� ���© ��ª© ��ª©¤«���¬ ���� ��������� ���ª�� ��� �����¡ ¢ ��¡ �� �� ¦£¤«���¬ ���� ��������� ���ª�� ¤¡������ ¢ ���� ¥ �� �££ £¦ ��¤«���¬ ���� ��������� ���ª�� §�����¡ ���� ª¦�© ��£© ¦ª�©¤����� ���� ��������� ���ª�� ��� �����¡ ¢ ��¡ � �¤����� ���� ��������� ���ª�� ¤¡������ ¢ ���� ¥ �� �£ �£¤����� ���� ��������� ���ª�� §�����¡ ���� �£�¦© �£�¦©���� ���� ��������� ���¦�� ��� �����¡ ¢ ��¡ �ª £ ������ ���� ��������� ���¦�� ¤¡������ ¢ ���� ¥ �� ��� £¦ �££���� ���� ��������� ���¦�� §�����¡ ���� ���© ¦��© ��© <@'11 %.'.?1r stFQuIv wGTTv EFMx wGNFyIN zJNMTTOIJFv <@'11 D;'3)C,; m(+?nr {Sv |Sv <@'11 <+@@)A) %;&++@ 5)n. = D;'3)C,; m(+?n 5)1; = D;'3)C,; 4(A'-,}'.,+- = %?8~);. <'.'@+A /8(r E|E���R|Sv B,@.)( )Cn.® (+01 '-3 ;+@?C-1
Academic Program Viability Report UD 2019-20 Page 36

��������� ������ ������� ��������� ����� � ����� ������
�������������� ������� ��!���"��������������� ������� ��������� ����������� ������ ���# $�$
%&'()*+,-. /)012))3 4-)5(,6) %,.)1 7+8)(. 9+&( :::%)'(;& .&,1 1,.)%*<=>?1,-)11 :-.)@@,A)-;) B,-'-;,'@ :-2+(C'.,+- 7);(?,.C)-. '-3 D3C,11,+-1 = 5).',@1 %.?3)-. :-2+(C'.,+- EFGHIJF KJLMNOPFQMJ R SIFPQTUVWXYZ[V \]_]WZ [Wa[b[cd eYf]c g hi]jY k]ifj l-(+@@C)-.m*)(2+(C'-;)m*)(;)-. B?@@mn('3?'.)1m<+?(1) n(+?o1hi]jY k]ifj pqrr stuv wxyz{wxwx |x}~}� ��u��� stuv wxyz{wxwx |x}�x� ��vvtu stuv wxyz{wxwx |x}�}� pqrr stuv wxwx{wxwy |x}�x��rq�� ���u�t �u��� { ����t�� �q�qr�� ��u�����r��q�t� ����t�� ����� ��v�tu �� �rq��t� �����r��q�t� ����t�� ����� ��v�tu �� �rq��t� �����r��q�t� ����t�� ����� ��v�tu �� �rq��t� �����r��q�t� ����t�� ����� ��v�tu �� �rq��t����yz�x y y���wz�z y y����zxw y} y y� y wx y����z�x � y w y w y y y <@'11 <+?(1) n(+?o� KJFINJ��Q� MGN�I�¡ %.?3)-. ¢)(C <'())( 5)1; = *(+A('C 5)1; = *@'- 5)1; = %?8o@'- 5)1;� EG�FPQJP£QTQF¤ ¥PJP¦IOIJF § E¡ <@'11 D;'3)C,; <'())(� ©ª«S¡ B,@.)( )Co.¬ (+01 ciXY®c djcYZ hiaY eY]Yj°±q�� �t�ut�²³ µ¶·µ¶¶ ¹�º»� D9[Wa[b[cd eYf]c \]VYjj ¼ViZY®c ��q��r��½ �t��u� ¾u��t�� ¿���vt��D;'3)C,; À)'( = ¢)(C 5)1; = 9?@., B'@@ ¢)(C ¶»=¶¶ Á·Â·Ã¡ %o(,-A ¢)(C ¶Ä<'Co?1 5)1;(,o.,+- D@@<'())( = *(+A('C = *@'- = %?8o@'- = 9?@., %?1.',-'8,@,.¬ 9'-'A)C)-. >D%<+@@)A) = n(+?o = D;'3 4(A = %?8Å);. D@@<+?(1) :-1.(?;.,+-'@ 9).&+3 D@@%.?3)-. ¢¬o) ÁB¢:<ÃD@@DA) n(+?o D@@l.&-,; n(+?o D@@n)-3)(D@@<?1.+C <+&+(. D@@%.?3)-. n(+?o D@@Academic Program Viability Report UD 2019-20 Page 37

Industry Certification Attainment
An industry certification or equivalent state or national exam has not been identified for the College of Business: Sustainability Management, BAS program for evidence of certification attainment at the baccalaureate level.
Academic Program Viability Report UD 2019-20 Page 38

2019-20 Placement Data
*Refers to graduates found to be employed full-time or part-time
SUSMGT BAS Pool Count Percent Placed
2014-15 20 65% 2015-16 28 75% 2016-17 22 73% 2017-18 29 66%
Source: http://www.fldoe.org/accountability/fl-edu-training-placement-info-program/fl-college-system-reports.stml
Academic Program Viability Report UD 2019-20 Page 39
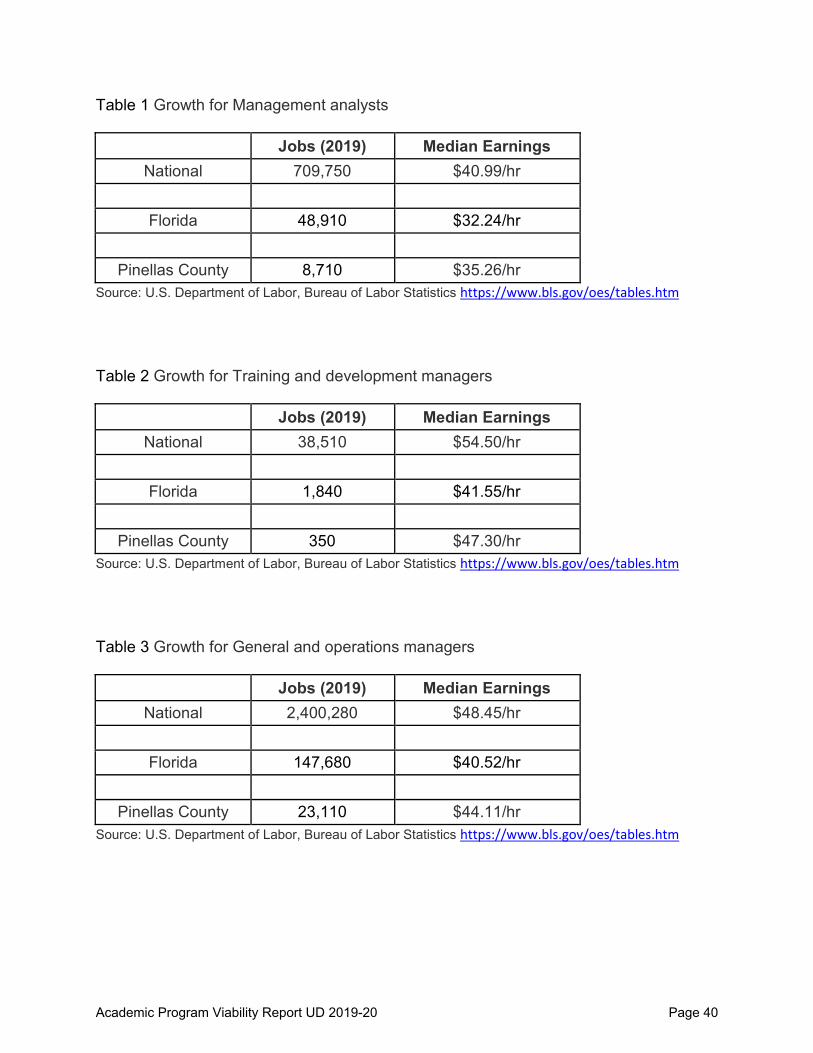
Table 1 Growth for Management analysts
Jobs (2019) Median Earnings National 709,750 $40.99/hr
Florida 48,910 $32.24/hr
Pinellas County 8,710 $35.26/hr
Source: U.S. Department of Labor, Bureau of Labor Statistics https://www.bls.gov/oes/tables.htm
Table 2 Growth for Training and development managers
Jobs (2019) Median Earnings National 38,510 $54.50/hr
Florida 1,840 $41.55/hr
Pinellas County 350 $47.30/hr
Source: U.S. Department of Labor, Bureau of Labor Statistics https://www.bls.gov/oes/tables.htm
Table 3 Growth for General and operations managers
Jobs (2019) Median Earnings National 2,400,280 $48.45/hr
Florida 147,680 $40.52/hr
Pinellas County 23,110 $44.11/hr
Source: U.S. Department of Labor, Bureau of Labor Statistics https://www.bls.gov/oes/tables.htm
Academic Program Viability Report UD 2019-20 Page 40

Table 4 Growth for Managers, all other
Jobs (2019) Median Earnings National $/hr
Florida $/hr
Pinellas County $/hr
Note: No data were found for this employment title. Source: U.S. Department of Labor, Bureau of Labor Statistics https://www.bls.gov/oes/tables.htm
Academic Program Viability Report UD 2019-20 Page 41

Perkins Completion & Non-Traditional Completion Performance
Perkins completion metrics do not apply to baccalaureate programs.
Academic Program Viability Report UD 2019-20 Page 42

Action Plan Follow-up and Evaluation Report for 2018-19 Viability Report Program: Sustainability Management, Upper Division Date Completed: August 2020 Prepared By: Marta Przyborowski I. Action Plan Items Status
Action Item
Measure
Addressed (Value)
Completion
Status
Status Explanation
1
Increase program enrollment. This item was carried forward from the 2017-18 Action Plan.
SSH Enrollment
Not Completed
The COVID pandemic has impacted our program enrollment. We are in the process of developing additional strategies to drive enrollment growth.
2
Increase program visibility and marketing outreach via a comprehensive program marketing plan.
Unduplicated Headcount
Not Completed
A program promotional video was developed to assist with program promotion. Additional visibility and outreach strategies will be implemented.
II. Non-Completed Action Plan Items and Plan for Completion
Action Item
Completion
Date
Plan for Completion
1
Increase program enrollment. This item was carried forward from the 2017-18 Action Plan.
Summer 2021 We are in the process of developing additional strategies to drive enrollment growth.
2
Increase program visibility and marketing outreach via a comprehensive program marketing plan.
Spring 2021 As per above, we are in the process of developing additional marketing strategies to increase program visibility.
Academic Program Viability Report UD 2019-20 Page 43

III. Evaluation of the Impact of Action Plans on Program Quality Both action items are connected in scope. The COVID pandemic has impacted our enrollment. However, additional strategies are being developed to enhance program visibility and promotion. Our Sustainability Management BAS program is a one of kind program within the state of Florida.
Academic Program Viability Report UD 2019-20 Page 44

St. Petersburg College
Program Goals and Strategies Program: Sustainability Management, Upper Division Date Completed: 2/2/2021 Due Date: August 2021 Prepared By: Marta Przyborowski I. Goals
Program Goals SPC Commitment Pillar
1 Increase program enrollment. Academic Excellence 2 Increase program outreach, promotion and visibility. Community Engagement
II. Strategies
Strategies to be Implemented Viability Metric Target Outcome
Goal # Responsible Individuals
1
Increase program visibility and promotion to current and prospective students (AA/AS). Consistently reach out to program students who are not enrolled in current term but were enrolled in prior semesters (good standing, have not completed program, etc.).
SSH Enrollment: Increase program enrollment by 1%.
1 Marta Przyborowski
2
Attend industry-wide sustainability events to highlight program offering.
Unduplicated Headcount: Attend at least 1 industry-wide sustainability event each semester.
2 Marta Przyborowski
III. Special Resources Needed: Marketing funds for program promotion. Marketing resources for video and flyer development.
IV. Area(s) of Concern/Improvement: N/A
Academic Program Viability Report UD 2019-20 Page 45

ACADEMIC PROGRAM VIABILITY REPORTStudent Count by Academic Year
0
100
200
300
400
500
2017 2018 2019 2020
366
464 469
353
SSH By Campus
Campus 2017
2018
2019
2020
Clearwater CampusSeminole CampusSt Petersburg/Gibbs CampusTarpon Springs Campus
1,213
3291,390
1,23260
1,3431,716
735
1,7201,607
468
1,116792
Total 2,932 4,351 4,062 2,376
Student Count by Ethnic Group and Academic Year
0
100
200
300
2017 2018 2019 2020
7 6 6 1
70
101 108
81
4453 49 43
227
280 284
210
Ethnic Group Asian Black/African American Hispanic/Latino White
Success Rate by Academic Year
0%
20%
40%
60%
80%
2017 2018 2019
83.8% 85.3% 88.1%
Term
All
Program
All
Plan
All
College School Depart…
All
Success Rate By Course
Academic YearSubject
2017StudentCount
EnrollmentCount
SuRa
EDF3152EDF3660EDF4084EDF4123EDF4490EDF4604EDF4632EDF4650EDF4731EDF4754EDF4810EDF4932EDG4940EEC3005EEC3009EEC3204EEC3266EEC3403EEC3413EEC3731EEC4207EEC4212EEC4227
48179
5687
163
796
42443026
288
12
48183
5689
168
816
42453026
288
12
1
1221624
231624 1
Total 366 973
Academic Organization
Educational Studies-…
Community
All
FTIC Flag
All
Part Full Time
All
Gender
All
Academic Program Viability Report UD 2019-20 Page 46

ACADEMIC PROGRAM VIABILITY REPORT
Academic Plan
All Academic Plan Id Student Count Enrollment Count
Units Taken Success Rate Grads Count2019-20
Enrolled in Fall2020-21 (0580)
Retention Rate0565 to 0580
EDST-BSPPA-BSGEN-AAEDU-TRELEDR-BSHSA-ASMGTORG-BASESEDR-BSCHDEV-ASEAM-ASARCH-ASRCERT-NOBACCAPP-NOHUS-ASINTRP-ASSOCIAL-TRCHDEV-CTLEGAL-BASPSA-BASBIO-TR
27315
1 2
1,25812325231715119665544443332
3,76736974734934332718189
15131211129996
83.9 %95.9 %84.0 %95.7 %
100.0 %80.0 %54.5 %
100.0 %100.0 %100.0 %100.0 %100.0 %100.0 %100.0 %100.0 %75.0 %
100.0 %100.0 %100.0 %100.0 %
739
1586
83.5 %86.7 %
Total 291 1,538 4,589 85.6 % 82 164 82.8 %
82.8%Retention Rate 0565 to 0580
164Enrolled in Fall 2020-21
85.6%Success Rate Fall 2019-20
Academic Program
All
College School Depart…
All
Academic Organization…
EDST-UD
Community
All
FTIC Flag
All
Ethnic Group
All
Gender
All
82Grads Count 2019-20
291Student Count Fall 2019-20
Academic Program Viability Report UD 2019-20 Page 47

ACADEMIC PROGRAM VIABILITY REPORTNumber of Grads and Number of Awards by Academic Year
0
20
40
60
80
100
2019 2018 2017
96
69
56
96
69
56
Number of Grads Number of Awards
Student Count by Ethnic Group and Academic Year
0
20
40
60
2019 2018 2017
1 2 2
15
911
1315
5
61
4037
Student.Ethnic Group Asian Black/African American Hispanic/Latino White
Term
All
Program
All
Plan
EDST-BS
Academic YearDegree
2017Numberof Grads
Numberof Awards
2018Numberof Grads
Numberof Awards
2019Numberof Grads
Numberof Awards
BSEDST-BS
5656
5656
6969
6969
9696
9696
Total 56 56 69 69 96 96
Gender
All
Academic Program Viability Report UD 2019-20 Page 48

ACADEMIC PROGRAM VIABILITY REPORT
Academic Plan
All
82.8%Retention Rate 0535 to 0550
91Enrolled in Fall 2018-19
157Student Count Fall 2017-18
84.8%Success Rate Fall 2017-18
Academic Program
All
College School Depart…
All
Academic Organization…
EDST-UD
Community
All
FTIC Flag
All
Ethnic Group
All
Gender
All
43Grads Count 2017-18
274Student Count Fall 2018-19
291Student Count Fall 2019-20
84.5%Success Rate Fall 2018-19
85.6%Success Rate Fall 2019-20
154Enrolled in Fall 2019-20
164Enrolled in Fall 2020-21
70Grads Count 2018-19
82Grads Count 2019-20
80.7%Retention Rate 0550 to 0565
82.8%Retention Rate 0565 to 0580
Academic Plan Id Retention Rate 0535 to 0550 Retention Rate 0550 to 0565 Retention Rate 0565 to 0580
EDST-BSELEDR-BSPKPED-BSPPA-BSRCERT-NO
86.1 %
50.0 %100.0 %16.7 %
81.1 %100.0 %
90.0 %
83.5 %
86.7 %
Total 82.8 % 80.7 % 82.8 %
Academic Program Viability Report UD 2019-20 Page 49

��������� ������ ������� ��������� ����� � ����� ����
�������������� ������� ��!���"��������������� ������� ��������� ����������� ���� ���# $�$
%&'()*+,-. /)012))3 4-)5(,6) %,.)1 7+8)(. 9+&( :::%)'(;& .&,1 1,.)%*<=>?1,-)11 :-.)@@,A)-;) B,-'-;,'@ :-2+(C'.,+- 7);(?,.C)-. '-3 D3C,11,+-1 = 5).',@1 %.?3)-. :-2+(C'.,+- EFGHIJF KJLMNOPFQMJ R SIFPQTUVWXYZ[V \]_]WZ [Wa[b[cd eYf]c g \Y]VYhc ijbb k-(+@@C)-.l*)(2+(C'-;)l*)(;)-. B?@@lm('3?'.)1l<+?(1) m(+?n1\Y]VYhc ijbb oYc][V p]Wfq <@'11 %.'.?1r stFQuIv wGTTv EFMx wGNFyIN zJNMTTOIJFv <@'11 D;'3)C,; m(+?nr {Sv |Sv <@'11 <+@@)A) %;&++@ 5)n. = D;'3)C,; m(+?n 5)1; = D;'3)C,; 4(A'-,}'.,+- = %?8~);. <'.'@+A /8(r zSE�R|S
\Y]VYhc ijbb oYc][V ad �h�c]jVc[hWb oYcqX ������� �������� ���� � ���� ������������ ������������ ���������� ���� ��������� ������ ���������� ���� ��� �� ¡¢£���� ���� ��������� ������ ¤������� ����� ¥��� ��¡ ¡� ¡�¡���� ���� ��������� ������ ¦������ ���� ��§� ¢�§� ���§�¤©���ª ���� ��������� ���¢�� ���������� ���� ��« £� ¡««¤©���ª ���� ��������� ���¢�� ¤������� ����� ¥��� ��� £� ¡¢�¤©���ª ���� ��������� ���¢�� ¦������ ���� ��£§� ���§� ��£§¡¤����� ���� ��������� ���¢�� ���������� ���� £�� �� £¡�¤����� ���� ��������� ���¢�� ¤������� ����� ¥��� ££« �� £�«¤����� ���� ��������� ���¢�� ¦������ ���� ���§� ���§� ���§����� ���� ��������� ���«�� ���������� ���� ��� £� ¡¢����� ���� ��������� ���«�� ¤������� ����� ¥��� ��¢ £� �£¢���� ���� ��������� ���«�� ¦������ ���� «�§� ��£§£ ««§� <@'11 %.'.?1r stFQuIv wGTTv EFMx wGNFyIN zJNMTTOIJFv <@'11 D;'3)C,; m(+?nr {Sv |Sv <@'11 <+@@)A) %;&++@ 5)n. = D;'3)C,; m(+?n 5)1; = D;'3)C,; 4(A'-,}'.,+- = %?8~);. <'.'@+A /8(r zSE�R|Sv B,@.)( )Cn.¬ (+01 '-3 ;+@?C-1
Academic Program Viability Report UD 2019-20 Page 50

��������� ������ ������� ��������� ����� � ����� ������
�������������� ������� ��!���"��������������� ������� ��������� ����������� ������ ���# $�$
%&'()*+,-. /)012))3 4-)5(,6) %,.)1 7+8)(. 9+&( :::%)'(;& .&,1 1,.)%*<=>?1,-)11 :-.)@@,A)-;) B,-'-;,'@ :-2+(C'.,+- 7);(?,.C)-. '-3 D3C,11,+-1 = 5).',@1 %.?3)-. :-2+(C'.,+- EFGHIJF KJLMNOPFQMJ R SIFPQTUVWXYZ[V \]_]WZ [Wa[b[cd eYf]c g hi]jY k]ifj l-(+@@C)-.m*)(2+(C'-;)m*)(;)-. B?@@mn('3?'.)1m<+?(1) n(+?o1hi]jY k]ifj pqrr stuv wxyz{wxwx |x}~}� ��u��� stuv wxyz{wxwx |x}�x� ��vvtu stuv wxyz{wxwx |x}�}� pqrr stuv wxwx{wxwy |x}�x��rq�� ���u�t �u��� { ����t�� �q�qr�� ��u�����r��q�t� ����t�� ����� ��v�tu �� �rq��t� �����r��q�t� ����t�� ����� ��v�tu �� �rq��t� �����r��q�t� ����t�� ����� ��v�tu �� �rq��t� �����r��q�t� ����t�� ����� ��v�tu �� �rq��t����wzx� y y <@'11 <+?(1) n(+?o� KJFINJ��Q� �MGN�I�� %.?3)-. �)(C <'())( 5)1; = *(+A('C 5)1; = *@'- 5)1; = %?8o@'- 5)1;� �H EFGHQI� � �MOOGJQF� �IPHIN� <@'11 D;'3)C,; <'())(� ¡¢S� B,@.)( )Co.£ (+01 ¤ciXY¥c ¤djcYZ hiaY eY¦]Yj§q�� ©t�ut�ª« ¬®®°®° ±�²³�°¬ D9[Wa[b[cd eYf]c \]VYjj ViZY¥c µ�q��r��¶ ©t��u� ·u��t�� ���vt��D;'3)C,; ¹)'( = �)(C 5)1; = 9?@., B'@@ �)(C ®°³¬=®°®° º°»¼� %o(,-A �)(C ®½<'Co?1 5)1;(,o.,+- D@@<'())( = *(+A('C = *@'- = %?8o@'- = 9?@., l3 %.?3,)1 ¾ <+CC?-,.£ ¿)'3)(<+@@)A) = n(+?o = D;'3 4(A = %?8À);. D@@<+?(1) :-1.(?;.,+-'@ 9).&+3 D@@%.?3)-. �£o) ºB�:<¼D@@DA) n(+?o D@@l.&-,; n(+?o D@@n)-3)(D@@<?1.+C <+&+(. D@@%.?3)-. n(+?o D@@Academic Program Viability Report UD 2019-20 Page 51

��������� ������ ������� ��������� ����� � ����� ������
�������������� ������� ��!���"��������������� ������� ��������� ����������� ������ ���# $�$
%&'()*+,-. /)012))3 4-)5(,6) %,.)1 7+8)(. 9+&( :::%)'(;& .&,1 1,.)%*<=>?1,-)11 :-.)@@,A)-;) B,-'-;,'@ :-2+(C'.,+- 7);(?,.C)-. '-3 D3C,11,+-1 = 5).',@1 %.?3)-. :-2+(C'.,+- EFGHIJF KJLMNOPFQMJ R SIFPQTUVWXYZ[V \]_]WZ [Wa[b[cd eYf]c g hi]jY k]ifj l-(+@@C)-.m*)(2+(C'-;)m*)(;)-. B?@@mn('3?'.)1m<+?(1) n(+?o1hi]jY k]ifj pqrr stuv wxyz{wxwx |x}~}� ��u��� stuv wxyz{wxwx |x}�x� ��vvtu stuv wxyz{wxwx |x}�}� pqrr stuv wxwx{wxwy |x}�x��rq�� ���u�t �u��� { ����t�� �q�qr�� ��u�����r��q�t� ����t�� ����� ��v�tu �� �rq��t� �����r��q�t� ����t�� ����� ��v�tu �� �rq��t� �����r��q�t� ����t�� ����� ��v�tu �� �rq��t� �����r��q�t� ����t�� ����� ��v�tu �� �rq��t�����z�x w~ w �x � yx y �y �����z�} yy y <@'11 <+?(1) n(+?o� KJFINJ��Q� �MGN�I� R ���� %.?3)-. )(C <'())( 5)1; = *(+A('C 5)1; = *@'- 5)1; = %?8o@'- 5)1;� �H EFGHQI� ¡ �MOOGJQF¢ £IPHIN� <@'11 D;'3)C,; <'())(� ¤¥¦S� B,@.)( )Co.§ (+01 ciXY©c djcYZ hiaY eYª]Yj«¬q�� t�ut�® °±²³±²² µ�¶·�° D9[Wa[b[cd eYf]c \]VYjj ViZY©c ¹�q��r��º t��u� »u��t�� ����vt��D;'3)C,; ¼)'( = )(C 5)1; = 9?@., B'@@ )(C ²·°=²² ½³¾³¿� %o(,-A )(C ²À<'Co?1 5)1;(,o.,+- D@@<'())( = *(+A('C = *@'- = %?8o@'- = 9?@., l3 %.?3,)1 Á <+CC?-,.§ Â)'3)(<+@@)A) = n(+?o = D;'3 4(A = %?8Ã);. D@@<+?(1) :-1.(?;.,+-'@ 9).&+3 D@@%.?3)-. §o) ½B :<¿D@@DA) n(+?o D@@l.&-,; n(+?o D@@n)-3)(D@@<?1.+C <+&+(. D@@%.?3)-. n(+?o D@@Academic Program Viability Report UD 2019-20 Page 52

Certifications Bachelor of Science Educational Studies and Community Leadership
Earned 2019-20
National Interpreter Certification: Knowledge 7 Source: Career Connections Certification Testing Center Records (2019-20).
Academic Program Viability Report UD 2019-20 Page 53

2019-20 Placement Data
*Refers to graduates found to be employed full-time or part-time.
EDST BS Pool Count Percent Placed 2014-15 31 74% 2015-16 39 77% 2016-17 42 76% 2017-18 53 75%
Source: http://www.fldoe.org/accountability/fl-edu-training-placement-info-program/fl-college-system-reports.stml
Academic Program Viability Report UD 2019-20 Page 54

Table 1 Growth for Education Administrators, Elementary and Secondary School
Jobs (2019) Median Earnings National 271,020 $/hr
Florida N/A* $/hr
Local N/A* $/hr
*Estimates not released. Source: U.S. Department of Labor, Bureau of Labor Statistics https://www.bls.gov/oes/tables.htm
Table 2 Growth for Education Administrators, All other
Jobs (2019) Median Earnings National 44,550 $41.08/hr
Florida 1,430 $34.53/hr
Local 220 $39.45/hr
Source: U.S. Department of Labor, Bureau of Labor Statistics https://www.bls.gov/oes/tables.htm
Table 3 Growth for Education Administrators, Preschool and Childcare Center/Program
Jobs (2019) Median Earnings National 52,360 $23.18/hr
Florida N/A* $20.65/hr
Local 270 $22.10/hr
*Estimates not released. Source: U.S. Department of Labor, Bureau of Labor Statistics https://www.bls.gov/oes/tables.htm
Academic Program Viability Report UD 2019-20 Page 55

Perkins Completion & Non-Traditional Completion Performance
Perkins completion metrics do not apply to baccalaureate programs.
Academic Program Viability Report UD 2019-20 Page 56

Action Plan Follow-up and Evaluation Report for 2018-19 Viability Report Program: Educational Studies, Upper Division Date Completed: August 2020 Prepared By: Dr. Kimberly Hartman and Ms. Margaret Bowman I. Action Plan Items Status
Action Item
Measure
Addressed (Value)
Completion
Status
Status Explanation
1
Increase enrollment in the new Educational Interpreting Track. This item was carried forward from the 2017-18 Action Plan.
SSH Enrollment
Completed COE faculty and staff partnered with SLIP faculty and staff to market the program and recruit students through events such as CAC Week and targeted advising.
II. Non-Completed Action Plan Items and Plan for Completion All action items were completed. III. Evaluation of the Impact of Action Plans on Program Quality Over the past two years, SSH within the Educational Interpreting track has increased by 66% as a result of targeted marketing, recruitment, and advising. We expect enrollment
Academic Program Viability Report UD 2019-20 Page 57

and SSH to continue to increase as the program matures and we will continue to use similar strategies since they have proven to be successful.
Academic Program Viability Report UD 2019-20 Page 58

St. Petersburg College
Program Goals and Strategies Program: Educational Studies, Upper Division Date Completed: 1/21/2021 Due Date: August 2021 Prepared By: Michael Poulin, COE Academic Chair I. Goals
Program Goals SPC Commitment Pillar
1 Improve student success by customizing some of the content within our courses for the students within the specific tracks within the Educational Studies major.
Academic Excellence
2 Develop a new Development & Training Track within the Ed Studies program.
Community Engagement
II. Strategies
Strategies to be Implemented Viability Metric Target Outcome
Goal # Responsible Individuals
1
Meet with course instructors to contextualize assignments in core classes for students enrolled in specific tracks in Ed Studies.
Course Success/W-WF-F Rates: A 1% increase in program course success.
1 Michael Poulin will meet with
Melissa McAllister,
course coordinator.
2
Create 5 new courses for the new track with a concentration on Development & Training.
Job Placement: Enrollment in the new track will begin in Fall 2021 with graduates entering the workforce beginning in Fall 2023.
2 Michael Poulin & Margaret
Bowman
III. Special Resources Needed: N/A
IV. Area(s) of Concern/Improvement: N/A
Academic Program Viability Report UD 2019-20 Page 59

ACADEMIC PROGRAM VIABILITY REPORTStudent Count by Academic Year
0
50
100
150
2017 2018 2019 2020
175
123
146
57
SSH By Campus
Campus 2017
2018
2019
2020
Clearwater CampusSt Petersburg/Gibbs CampusTarpon Springs Campus
10845
882
6366
690
45
912
315Total 1,035 819 957 315
Student Count by Ethnic Group and Academic Year
0
50
100
2017 2018 2019 2020
145 5
1
25
14 146
128
95
119
49
Ethnic Group Black/African American Hispanic/Latino White
Success Rate by Academic Year
0%
20%
40%
60%
80%
100%
2017 2018 2019
96.0%90.2% 93.2%
Term
All
Program
All
Plan
All
College School Depart…
All
Success Rate By Course
Academic YearSubject
2017StudentCount
EnrollmentCount
SucRate
EDE4940EDG3620
56119
56121
109
Total 175 177 9
Academic Organization
Elementary Educatio…
Community
All
FTIC Flag
All
Part Full Time
All
Gender
All
Academic Program Viability Report UD 2019-20 Page 60

ACADEMIC PROGRAM VIABILITY REPORT
Academic Plan
All Academic Plan Id Student Count Enrollment Count
Units Taken Success Rate Grads Count2019-20
Enrolled in Fall2020-21 (0580)
Retention Rate0565 to 0580
ELEDR-BSEDST-BSGEN-AAEDU-TRICERT-NOBUS-ASBUS-BSCHDEV-ASITSC-CTBACCAPP-NOCST-ASENRCH-NOESEDR-BS
701 2 1
4665221111044432221
1,52815863333012121296663
94.4 %90.4 %90.5 %
100.0 %100.0 %75.0 %
100.0 %25.0 %
100.0 %100.0 %100.0 %100.0 %
23
351
82.9 %100.0 %
Total 74 582 1,878 93.1 % 23 36 79.7 %
79.7%Retention Rate 0565 to 0580
36Enrolled in Fall 2020-21
93.1%Success Rate Fall 2019-20
Academic Program
All
College School Depart…
All
Academic Organization…
ELEM ED-UD
Community
All
FTIC Flag
All
Ethnic Group
All
Gender
All
23Grads Count 2019-20
74Student Count Fall 2019-20
Academic Program Viability Report UD 2019-20 Page 61

ACADEMIC PROGRAM VIABILITY REPORTNumber of Grads and Number of Awards by Academic Year
0
20
40
60
2017 2018 2019
61
52 51
61
52 51
Number of Grads Number of Awards
Student Count by Ethnic Group and Academic Year
0
20
40
2017 2019 2018
13
13
8 8
53
37 38
Student.Ethnic Group Black/African American Hispanic/Latino White
Term
All
Program
All
Plan
ELEDR-BS
Academic YearDegree
2017Numberof Grads
Numberof Awards
2018Numberof Grads
Numberof Awards
2019Numberof Grads
Numberof Awards
BSELEDR-BS
6161
6161
5252
5252
5151
5151
Total 61 61 52 52 51 51
Gender
All
Academic Program Viability Report UD 2019-20 Page 62

ACADEMIC PROGRAM VIABILITY REPORT
Academic Plan
All
84.4%Retention Rate 0535 to 0550
45Enrolled in Fall 2018-19
96Student Count Fall 2017-18
94.6%Success Rate Fall 2017-18
Academic Program
All
College School Depart…
All
Academic Organization…
ELEM ED-UD
Community
All
FTIC Flag
All
Ethnic Group
All
Gender
All
39Grads Count 2017-18
65Student Count Fall 2018-19
74Student Count Fall 2019-20
91.5%Success Rate Fall 2018-19
93.1%Success Rate Fall 2019-20
36Enrolled in Fall 2019-20
36Enrolled in Fall 2020-21
17Grads Count 2018-19
23Grads Count 2019-20
81.5%Retention Rate 0550 to 0565
79.7%Retention Rate 0565 to 0580
Academic Plan Id Retention Rate 0535 to 0550 Retention Rate 0550 to 0565 Retention Rate 0565 to 0580
EDST-BSELEDR-BSICERT-NO
92.9 %90.4 %25.0 %
75.0 %89.1 %20.0 %
100.0 %82.9 %
Total 84.4 % 81.5 % 79.7 %
Academic Program Viability Report UD 2019-20 Page 63

��������� ������ ������� ��������� ����� � ����� ����
�������������� ������� ��!���"��������������� ������� ��������� ����������� ���� ���# $�$
%&'()*+,-. /)012))3 4-)5(,6) %,.)1 7+8)(. 9+&( :::%)'(;& .&,1 1,.)%*<=>?1,-)11 :-.)@@,A)-;) B,-'-;,'@ :-2+(C'.,+- 7);(?,.C)-. '-3 D3C,11,+-1 = 5).',@1 %.?3)-. :-2+(C'.,+- EFGHIJF KJLMNOPFQMJ R SIFPQTUVWXYZ[V \]_]WZ [Wa[b[cd eYf]c g \Y]VYhc ijbb k-(+@@C)-.l*)(2+(C'-;)l*)(;)-. B?@@lm('3?'.)1l<+?(1) m(+?n1\Y]VYhc ijbb oYc][V p]Wfq <@'11 %.'.?1r stFQuIv wGTTv EFMx wGNFyIN zJNMTTOIJFv <@'11 D;'3)C,; m(+?nr {Sv |Sv <@'11 <+@@)A) %;&++@ 5)n. = D;'3)C,; m(+?n 5)1; = D;'3)C,; 4(A'-,}'.,+- = %?8~);. <'.'@+A /8(r z{z� zSR|S
\Y]VYhc ijbb oYc][V ad �h�c]jVc[hWb oYcqX ������� �������� ���� � ���� ������������ ������������ ���������� ���� ��������� ������ ���������� ���� ¡¢ �� �£���� ���� ��������� ������ ¤������� ����� ¥��� ¢¡ ¦� ������ ���� ��������� ������ §������ ���� ��¡¢© �¡��© ����©¤ª���« ���� ��������� ���¡�� ���������� ���� ¡¢ ¦¦ ¢�¤ª���« ���� ��������� ���¡�� ¤������� ����� ¥��� ¦� � ¦�¤ª���« ���� ��������� ���¡�� §������ ���� �¦�¦© �¬����© �¦�¡©���� ���� ��������� ���£�� ���������� ���� �¢ �� ¦£���� ���� ��������� ���£�� ¤������� ����� ¥��� �¡ � ������ ���� ��������� ���£�� §������ ���� ¦�¡�© £���© ��¦¦© <@'11 %.'.?1r stFQuIv wGTTv EFMx wGNFyIN zJNMTTOIJFv <@'11 D;'3)C,; m(+?nr {Sv |Sv <@'11 <+@@)A) %;&++@ 5)n. = D;'3)C,; m(+?n 5)1; = D;'3)C,; 4(A'-,}'.,+- = %?8~);. <'.'@+A /8(r z{z� zSR|Sv B,@.)( )Cn. (+01 '-3 ;+@?C-1
Academic Program Viability Report UD 2019-20 Page 64

��������� ������ ������� ��������� ����� � ����� ������
�������������� ������� ��!���"��������������� ������� ��������� ����������� ������ ���# $�$
%&'()*+,-. /)012))3 4-)5(,6) %,.)1 7+8)(. 9+&( :::%)'(;& .&,1 1,.)%*<=>?1,-)11 :-.)@@,A)-;) B,-'-;,'@ :-2+(C'.,+- 7);(?,.C)-. '-3 D3C,11,+-1 = 5).',@1 %.?3)-. :-2+(C'.,+- EFGHIJF KJLMNOPFQMJ R SIFPQTUVWXYZ[V \]_]WZ [Wa[b[cd eYf]c g hi]jY k]ifj l-(+@@C)-.m*)(2+(C'-;)m*)(;)-. B?@@mn('3?'.)1m<+?(1) n(+?o1hi]jY k]ifj pqrr stuv wxyz{wxwx |x}~}� ��u��� stuv wxyz{wxwx |x}�x� ��vvtu stuv wxyz{wxwx |x}�}� pqrr stuv wxwx{wxwy |x}�x��rq�� ���u�t �u��� { ����t�� �q�qr�� ��u�����r��q�t� ����t�� ����� ��v�tu �� �rq��t� �����r��q�t� ����t�� ����� ��v�tu �� �rq��t� �����r��q�t� ����t�� ����� ��v�tu �� �rq��t� �����r��q�t� ����t�� ����� ��v�tu �� �rq��t�����z�x w� y �� y y~ y����z�x w� y �� y y~ y <@'11 <+?(1) n(+?o� KJFINJ��Q� �MGN�I� R ��� %.?3)-. ¡)(C <'())( 5)1; = *(+A('C 5)1; = *@'- 5)1; = %?8o@'- 5)1;� �TIO �H ¢QF� £IPHQJ¤ �JHMN�IOI <@'11 D;'3)C,; <'())(� ¥¦£S B,@.)( )Co.§ (+01 ciXY©c djcYZ hiaY eYª]Yj«¬q�� �t�ut�® °±²°±³±³ �µ¶�³ D9[Wa[b[cd eYf]c \]VYjj ·ViZY©c �q��r��¹ �t��u� ºu��t�� ����vt��D;'3)C,; »)'( = ¡)(C 5)1; = 9?@., B'@@ ¡)(C ±³¶=±³±³ ¼³²½²¾ %o(,-A ¡)(C ±¿<'Co?1 5)1;(,o.,+- D@@<'())( = *(+A('C = *@'- = %?8o@'- = 9?@., l@)C l3 0,.& 7)'3,-A l-3+(1)C)<+@@)A) = n(+?o = D;'3 4(A = %?8À);. D@@<+?(1) :-1.(?;.,+-'@ 9).&+3 D@@%.?3)-. ¡§o) ¼B¡:<¾D@@DA) n(+?o D@@l.&-,; n(+?o D@@n)-3)(D@@<?1.+C <+&+(. D@@%.?3)-. n(+?o D@@Academic Program Viability Report UD 2019-20 Page 65

Industry Certification Attainment
In the College of Education, programs the Florida Teacher Certification Examinations (FCTE) are used to evaluate the students. The exams are required for certification within the State of Florida.
Education State Licensure Exam Passing Rates
Elementary Education BS 2013‐14 2014‐15 2015‐16 2016‐17 2017‐18 2018‐19
State Exam 100.0% 100.0% 100.0% 100.0% 100.0% 100.0%
Source: 2019‐20 Factbook, Table 9
Academic Program Viability Report UD 2019-20 Page 66

2019-20 Placement Data
*Refers to graduates found to be employed full-time or part-time.
ELEM ED BS Pool Count Percent Placed 2014-15 61 93% 2015-16 60 92% 2016-17 59 93% 2017-18 58 78%
Source: http://www.fldoe.org/accountability/fl-edu-training-placement-info-program/fl-college-system-reports.stml
Academic Program Viability Report UD 2019-20 Page 67
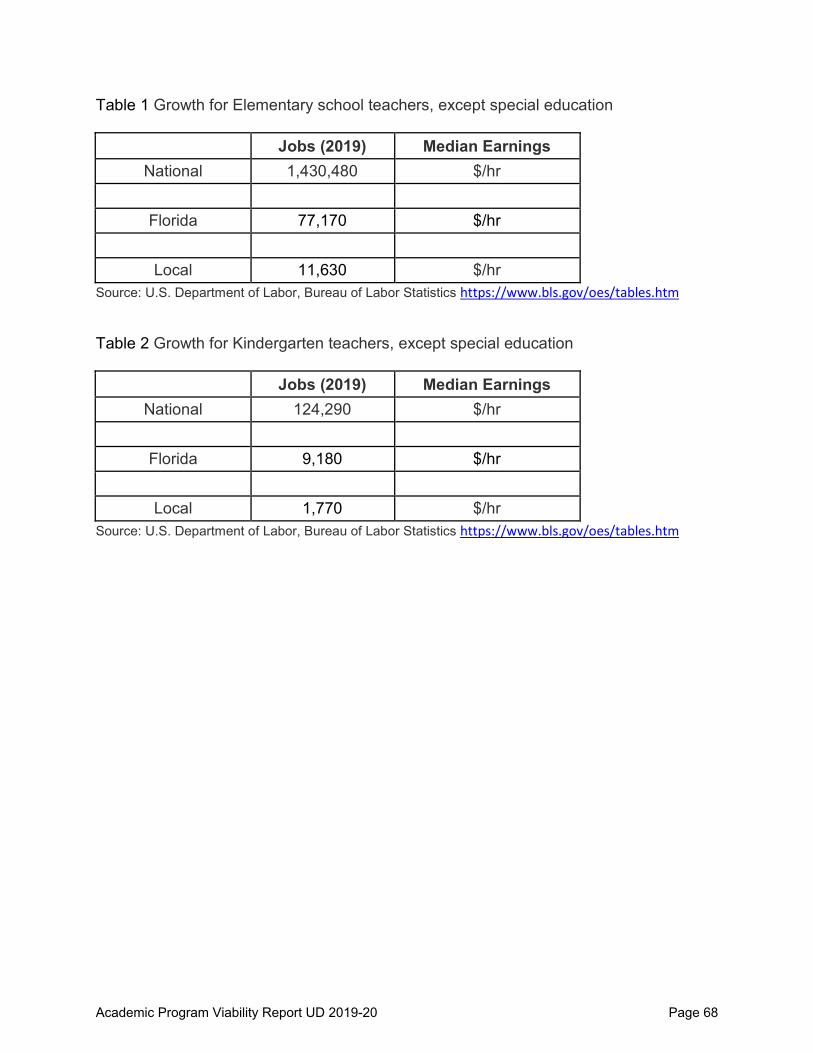
Table 1 Growth for Elementary school teachers, except special education
Jobs (2019) Median Earnings National 1,430,480 $/hr
Florida 77,170 $/hr
Local 11,630 $/hr
Source: U.S. Department of Labor, Bureau of Labor Statistics https://www.bls.gov/oes/tables.htm
Table 2 Growth for Kindergarten teachers, except special education
Jobs (2019) Median Earnings National 124,290 $/hr
Florida 9,180 $/hr
Local 1,770 $/hr
Source: U.S. Department of Labor, Bureau of Labor Statistics https://www.bls.gov/oes/tables.htm
Academic Program Viability Report UD 2019-20 Page 68
Perkins Completion & Non-Traditional Completion Performance
Perkins completion metrics do not apply to baccalaureate programs.
Academic Program Viability Report UD 2019-20 Page 69
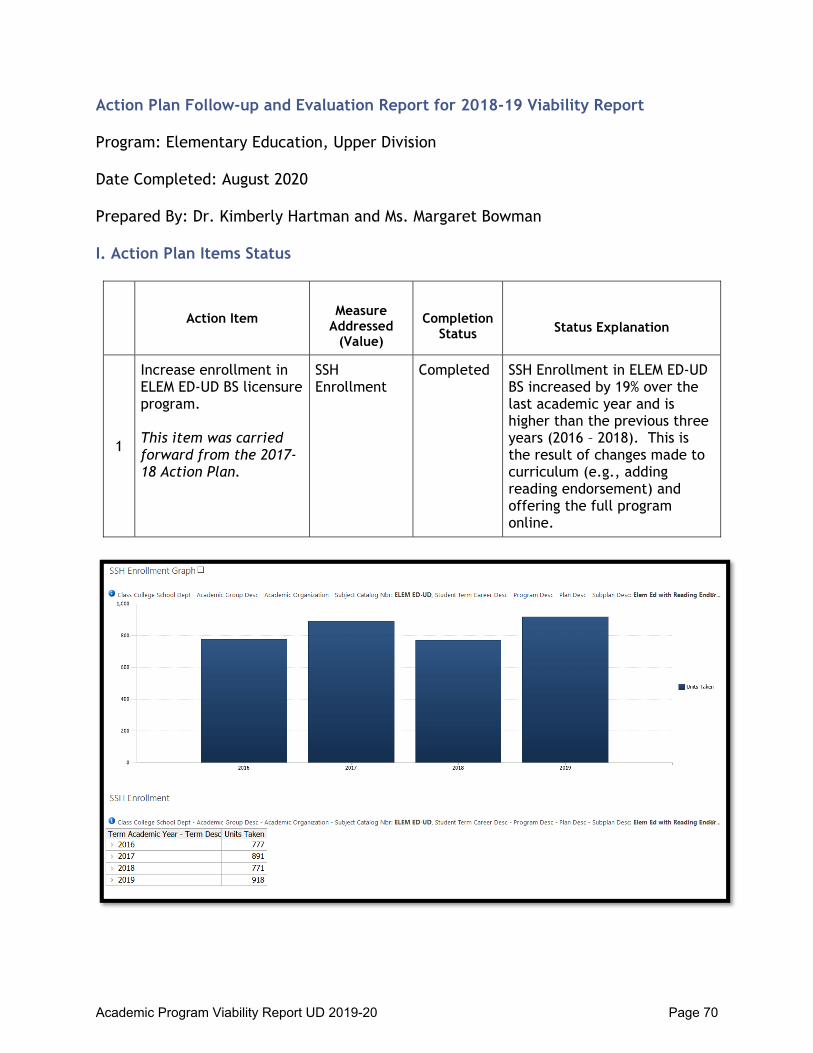
Action Plan Follow-up and Evaluation Report for 2018-19 Viability Report Program: Elementary Education, Upper Division Date Completed: August 2020 Prepared By: Dr. Kimberly Hartman and Ms. Margaret Bowman I. Action Plan Items Status
Action Item
Measure
Addressed (Value)
Completion
Status
Status Explanation
1
Increase enrollment in ELEM ED-UD BS licensure program. This item was carried forward from the 2017-18 Action Plan.
SSH Enrollment
Completed SSH Enrollment in ELEM ED-UD BS increased by 19% over the last academic year and is higher than the previous three years (2016 – 2018). This is the result of changes made to curriculum (e.g., adding reading endorsement) and offering the full program online.
Academic Program Viability Report UD 2019-20 Page 70

II. Non-Completed Action Plan Items and Plan for Completion All action items were completed. III. Evaluation of the Impact of Action Plans on Program Quality The addition of an online option for this teacher certification program has had a positive impact on the growth of the program, as expected. Our online program is enabling us to reach teacher preparation and in-service teachers in districts where access to affordable, high-quality teacher certification programs was limited. We expect this growth to continue.
Academic Program Viability Report UD 2019-20 Page 71

St. Petersburg College
Program Goals and Strategies Program: Elementary Education, Upper Division Date Completed: 2/18/2021 Due Date: August 2021 Prepared By: Margaret Bowman I. Goals
Program Goals SPC Commitment Pillar
1 Improve job placement rate by a minimum of 5% by collaborating with school districts.
Economic Mobility
2 Improve efforts to attract and retain underserved students by implementing additional outreach and marketing strategies.
Academic Excellence
II. Strategies
Strategies to be Implemented Viability Metric Target Outcome
Goal # Responsible Individuals
1 Invite new district partners to participate and present at practicum and internship seminars and to share anticipated job vacancies with students.
Job Placement: 5%
1 Office of School Partnerships
2
Implement additional methods, such as an encouraging email, to engage FTIC students within their first semester of the program. This could be done in EDF 1005 and in first semester courses in COE. We anticipate this will have a positive impact on underrepresented students.
Retention: 5% 2 ELED Faculty
III. Special Resources Needed: Will need the support of the Marketing Department to develop marketing materials.
IV. Area(s) of Concern/Improvement: COVID-19 continues to impact enrollment.
Academic Program Viability Report UD 2019-20 Page 72

ACADEMIC PROGRAM VIABILITY REPORTStudent Count by Academic Year
0
50
100
150
2017 2018 2019 2020
152
112102
58
SSH By Campus
Campus 2017
2018
2019
2020
Clearwater CampusDowntown/MidtownSt Petersburg/Gibbs CampusTarpon Springs Campus
7256139
299
111
167296
81
39438
279Total 971 574 558 279
Student Count by Ethnic Group and Academic Year
0
20
40
60
80
100
2017 2018 2019 2020
1
1511 10
4
27 2417
6
103
71 72
47
Ethnic Group Asian Black/African American Hispanic/Latino White
Success Rate by Academic Year
0%
20%
40%
60%
80%
100%
2017 2018 2019 2020
92.0%88.1%
95.6%89.3%
Term
All
Program
All
Plan
All
College School Depart…
All
Success Rate By Course
Academic YearSubject
2017StudentCount
EnrollmentCount
SucRate
EEX3241EEX3280EEX4094EEX4221EEX4261EEX4291EEX4761EEX4940EEX4941EEX4942EEX4943
94
561315594718475438
94
561315594819475438
7109
1010999899
Total 152 362 9
Academic Organization
Exceptional Student …
Community
All
FTIC Flag
All
Part Full Time
All
Gender
All
Academic Program Viability Report UD 2019-20 Page 73

ACADEMIC PROGRAM VIABILITY REPORT
Academic Plan
All Academic Plan Id Student Count Enrollment Count
Units Taken Success Rate Grads Count2019-20
Enrolled in Fall2020-21 (0580)
Retention Rate0565 to 0580
ESEDR-BSAUTISM-NORCERT-NOEDST-BSELEDR-BSHIT-ASENG-ASEDU-TRNURSE-AS
1721191 1
8039221954211
236876658149649
98.8 %84.6 %95.5 %78.9 %
100.0 %75.0 %
100.0 %100.0 %
6 1
92 1
88.2 %9.5 %
100.0 %
100.0 %
Total 59 173 489 91.9 % 7 12 32.2 %
32.2%Retention Rate 0565 to 0580
12Enrolled in Fall 2020-21
91.9%Success Rate Fall 2019-20
Academic Program
All
College School Depart…
All
Academic Organization…
EXCP ED-UD
Community
All
FTIC Flag
All
Ethnic Group
All
Gender
All
7Grads Count 2019-20
59Student Count Fall 2019-20
Academic Program Viability Report UD 2019-20 Page 74

ACADEMIC PROGRAM VIABILITY REPORTNumber of Grads and Number of Awards by Academic Year
0
5
10
15
20
2017 2019 2018
18
65
18
65
Number of Grads Number of Awards
Student Count by Ethnic Group and Academic Year
0
5
10
2017 2019 2018
1
3
1
2
13
5
3
Student.Ethnic Group Asian Hispanic/Latino White
Term
All
Program
All
Plan
ESEDR-BS
Academic YearDegree
2017Numberof Grads
Numberof Awards
2018Numberof Grads
Numberof Awards
2019Numberof Grads
Numberof Awards
BSESEDR-BS
1818
1818
55
55
66
66
Total 18 18 5 5 6 6
Gender
All
Academic Program Viability Report UD 2019-20 Page 75
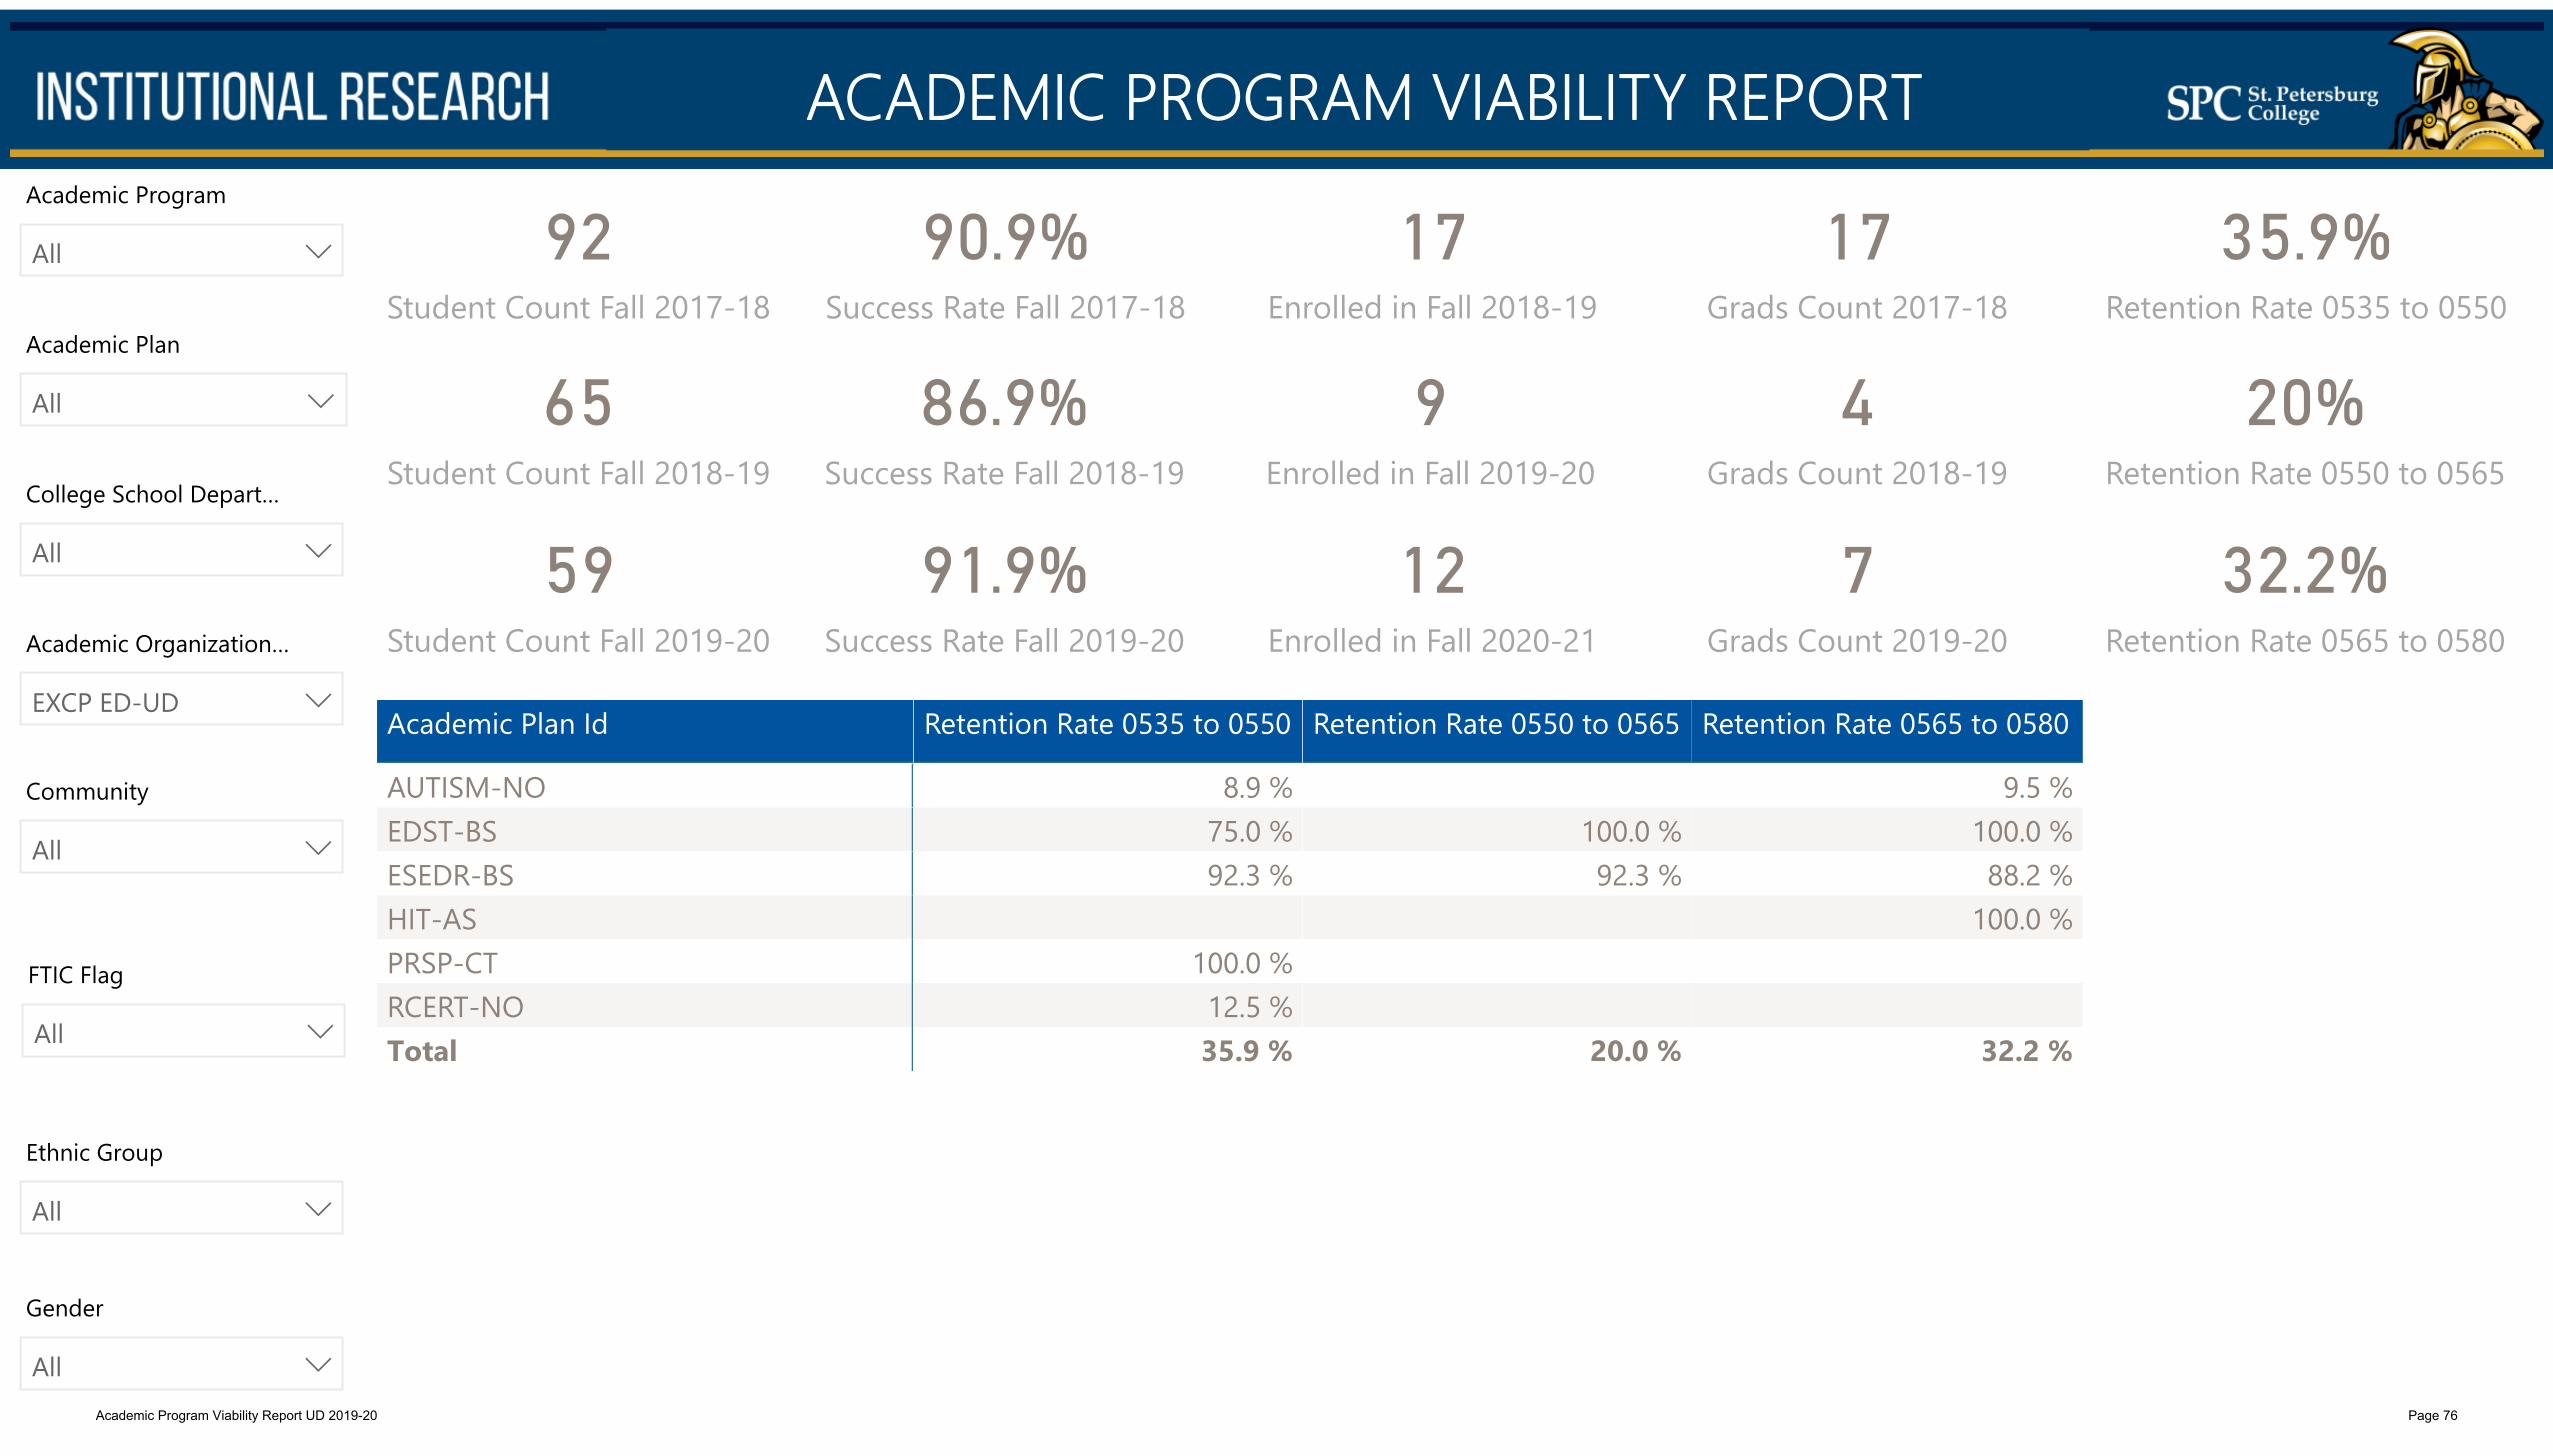
ACADEMIC PROGRAM VIABILITY REPORT
Academic Plan
All
35.9%Retention Rate 0535 to 0550
17Enrolled in Fall 2018-19
92Student Count Fall 2017-18
90.9%Success Rate Fall 2017-18
Academic Program
All
College School Depart…
All
Academic Organization…
EXCP ED-UD
Community
All
FTIC Flag
All
Ethnic Group
All
Gender
All
17Grads Count 2017-18
65Student Count Fall 2018-19
59Student Count Fall 2019-20
86.9%Success Rate Fall 2018-19
91.9%Success Rate Fall 2019-20
9Enrolled in Fall 2019-20
12Enrolled in Fall 2020-21
4Grads Count 2018-19
7Grads Count 2019-20
20%Retention Rate 0550 to 0565
32.2%Retention Rate 0565 to 0580
Academic Plan Id Retention Rate 0535 to 0550 Retention Rate 0550 to 0565 Retention Rate 0565 to 0580
AUTISM-NOEDST-BSESEDR-BSHIT-ASPRSP-CTRCERT-NO
8.9 %75.0 %92.3 %
100.0 %12.5 %
100.0 %92.3 %
9.5 %100.0 %88.2 %
100.0 %
Total 35.9 % 20.0 % 32.2 %
Academic Program Viability Report UD 2019-20 Page 76

��������� ������ ������� ��������� ����� � ����� ����
�������������� ������� ��!���"��������������� ������� ��������� ����������� ���� ���# $�$
%&'()*+,-. /)012))3 4-)5(,6) %,.)1 7+8)(. 9+&( :::%)'(;& .&,1 1,.)%*<=>?1,-)11 :-.)@@,A)-;) B,-'-;,'@ :-2+(C'.,+- 7);(?,.C)-. '-3 D3C,11,+-1 = 5).',@1 %.?3)-. :-2+(C'.,+- EFGHIJF KJLMNOPFQMJ R SIFPQTUVWXYZ[V \]_]WZ [Wa[b[cd eYf]c g \Y]VYhc ijbb k-(+@@C)-.l*)(2+(C'-;)l*)(;)-. B?@@lm('3?'.)1l<+?(1) m(+?n1\Y]VYhc ijbb oYc][V p]Wfq <@'11 %.'.?1r stFQuIv wGTTv EFMx wGNFyIN zJNMTTOIJFv <@'11 D;'3)C,; m(+?nr {Sv |Sv <@'11 <+@@)A) %;&++@ 5)n. = D;'3)C,; m(+?n 5)1; = D;'3)C,; 4(A'-,}'.,+- = %?8~);. <'.'@+A /8(r z��� zSR|S
\Y]VYhc ijbb oYc][V ad �h�c]jVc[hWb oYcqX ������� �������� ���� � ���� ������������ ������� ������������ ���������� ���� ��������� ��� �¡ ¢��������� £���� ¤¥ ¤ � ������ ���� ��������� ��� �¡ ¦������� £����� §��� �� �� � ¥����� ���� ��������� ��� �¡ ©������ ���� �ª«¥¬ ª�«�¬ ª�« ¬ ¥«¥¬¦���® ���� ��������� ���¤�¡ ¢��������� £���� ¤� �¤ ¨¦���® ���� ��������� ���¤�¡ ¦������� £����� §��� ��� � �¦���® ���� ��������� ���¤�¡ ©������ ���� ¤« ¬ �«�¬ ¤ª«ª¬¦����� ���� ��������� ���¤�¡ ¢��������� £���� �¤ �� ª¤¦����� ���� ��������� ���¤�¡ ¦������� £����� §��� ��� � �¦����� ���� ��������� ���¤�¡ ©������ ���� �¤«�¬ ��«�¬ �«¤¬���� ���� ��������� ���¥�¡ ¢��������� £���� ¥ �� �ª���� ���� ��������� ���¥�¡ ¦������� £����� §��� ��� � ¤����� ���� ��������� ���¥�¡ ©������ ���� � «¤¬ ªª«ª¬ ¤�«¤¬ <@'11 %.'.?1r stFQuIv wGTTv EFMx wGNFyIN zJNMTTOIJFv <@'11 D;'3)C,; m(+?nr {Sv |Sv <@'11 <+@@)A) %;&++@ 5)n. = D;'3)C,; m(+?n 5)1; = D;'3)C,; 4(A'-,}'.,+- = %?8~);. <'.'@+A /8(r z��� zSR|Sv B,@.)( )Cn. (+01 '-3 ;+@?C-1
Academic Program Viability Report UD 2019-20 Page 77

��������� ������ ������� ��������� ����� � ����� ������
�������������� ������� ��!���"��������������� ������� ��������� ����������� ������ ���# $�$
%&'()*+,-. /)012))3 4-)5(,6) %,.)1 7+8)(. 9+&( :::%)'(;& .&,1 1,.)%*<=>?1,-)11 :-.)@@,A)-;) B,-'-;,'@ :-2+(C'.,+- 7);(?,.C)-. '-3 D3C,11,+-1 = 5).',@1 %.?3)-. :-2+(C'.,+- EFGHIJF KJLMNOPFQMJ R SIFPQTUVWXYZ[V \]_]WZ [Wa[b[cd eYf]c g hi]jY k]ifj l-(+@@C)-.m*)(2+(C'-;)m*)(;)-. B?@@mn('3?'.)1m<+?(1) n(+?o1hi]jY k]ifj pqrr stuv wxyz{wxwx |x}~}� ��u��� stuv wxyz{wxwx |x}�x� ��vvtu stuv wxyz{wxwx |x}�}� pqrr stuv wxwx{wxwy |x}�x��rq�� ���u�t �u��� { ����t�� �q�qr�� ��u�����r��q�t� ����t�� ����� ��v�tu �� �rq��t� �����r��q�t� ����t�� ����� ��v�tu �� �rq��t� �����r��q�t� ����t�� ����� ��v�tu �� �rq��t� �����r��q�t� ����t�� ����� ��v�tu �� �rq��t�����z�x y y } y } y����z�x y y } y } y <@'11 <+?(1) n(+?o� KJFINJ��Q� �MGN�I� R ��� %.?3)-. ¡)(C <'())( 5)1; = *(+A('C 5)1; = *@'- 5)1; = %?8o@'- 5)1;� �¢£I�FQMJPT �H ¤QF� ¥IPHQJ¦ <@'11 D;'3)C,; <'())(� § ¥S B,@.)( )Co.© (+01 ªciXY«c ªdjcYZ hiaY eY¬]Yj®q�� �t�ut�° ±²³²³µ³µ ¶�·�µ± D9[Wa[b[cd eYf]c \]VYjj ¹ViZY«c º�q��r��» �t��u� ¼u��t�� ����vt��D;'3)C,; ½)'( = ¡)(C 5)1; = 9?@., B'@@ ¡)(C ³µ±=³µ³µ ¾µ¿À %o(,-A ¡)(C ³Á<'Co?1 5)1;(,o.,+- D@@<'())( = *(+A('C = *@'- = %?8o@'- = 9?@., lÂ;)o.,+-'@ l3 0,.& 7)'3,-A<+@@)A) = n(+?o = D;'3 4(A = %?8Ã);. D@@<+?(1) :-1.(?;.,+-'@ 9).&+3 D@@%.?3)-. ¡©o) ¾B¡:<ÀD@@DA) n(+?o D@@l.&-,; n(+?o D@@n)-3)(D@@<?1.+C <+&+(. D@@%.?3)-. n(+?o D@@Academic Program Viability Report UD 2019-20 Page 78

Industry Certification Attainment
In the College of Education, programs the Florida Teacher Certification Examinations (FCTE) are used to evaluate the students. The exams are required for certification within the State of Florida.
Education State Licensure Exam Passing Rates
Elementary Education BS 2013‐14 2014‐15 2015‐16 2016‐17 2017‐18 2018‐19
State Exam 100.0% 100.0% 100.0% 100.0% 100.0% 100.0%
Source: 2019‐20 Factbook, Table 9
Academic Program Viability Report UD 2019-20 Page 79

2019-20 Placement Data
*Refers to graduates found to be employed full-time or part-time.
Source: http://www.fldoe.org/accountability/fl-edu-training-placement-info-program/fl-college-system-reports.stml
EXCP ED BS Pool Count Percent Placed 2014-15 22 91% 2015-16 36 97% 2016-17 32 84% 2017-18 18 100%
Academic Program Viability Report UD 2019-20 Page 80

Table 1 Growth for Special education teachers, middle school
Jobs (2019) Median Earnings National 85,840 $/hr
Florida 3,120 $/hr
Local 360 $/hr
Source: U.S. Department of Labor, Bureau of Labor Statistics https://www.bls.gov/oes/tables.htm
Table 2 Growth for Special education teachers, secondary school
Jobs (2019) Median Earnings National 143,170 $/hr
Florida 4,920 $/hr
Local 870 $/hr
Source: U.S. Department of Labor, Bureau of Labor Statistics https://www.bls.gov/oes/tables.htm
Table 3 Growth for Special education teachers, kindergarten, and elementary school
Jobs (2019) Median Earnings National 193,830 $/hr
Florida 6,910 $/hr
Local 370 $/hr
Source: U.S. Department of Labor, Bureau of Labor Statistics https://www.bls.gov/oes/tables.htm
Academic Program Viability Report UD 2019-20 Page 81

Table 4 Growth for Special education teachers, preschool
Jobs (2019) Median Earnings National 22,340 $/hr
Florida 1,040 $/hr
Local NA $/hr
Source: U.S. Department of Labor, Bureau of Labor Statistics https://www.bls.gov/oes/tables.htm
Academic Program Viability Report UD 2019-20 Page 82

Perkins Completion & Non-Traditional Completion Performance
Perkins completion metrics do not apply to baccalaureate programs.
Academic Program Viability Report UD 2019-20 Page 83

Action Plan Follow-up and Evaluation Report for 2018-19 Viability Report Program: Exceptional Student Education, Upper Division Date Completed: August 2020 Prepared By: Dr. Kimberly Hartman and Ms. Margaret Bowman I. Action Plan Items Status
Action Item
Measure
Addressed (Value)
Completion
Status
Status Explanation
1
Increase enrollment in EXCP-UD BS licensure program. This item was carried forward from the 2017-18 Action Plan.
SSH Enrollment
Completed SSH Enrollment in EXCEP ED-UD BS increased by 26% over the last academic year. This is the result of changes made to curriculum (e.g., adding reading endorsement) and offering the full program online.
Academic Program Viability Report UD 2019-20 Page 84

II. Non-Completed Action Plan Items and Plan for Completion All action items were completed. III. Evaluation of the Impact of Action Plans on Program Quality The addition of an online option for this teacher certification program has had a positive impact on the growth of the program, as expected. Our online program is enabling us to reach teacher preparation and in-service teachers in districts where access to affordable, high-quality teacher certification programs was limited. We expect this growth to continue.
Academic Program Viability Report UD 2019-20 Page 85

St. Petersburg College
Program Goals and Strategies Program: Exceptional Student Education, Upper Division Date Completed: 2/18/2021 Due Date: August 2021 Prepared By: Margaret Bowman I. Goals
Program Goals SPC Commitment Pillar
1 Improve efforts to attract and retain underserved students by identifying barriers and implementing strategies to overcome them.
Academic Excellence
II. Strategies
Strategies to be Implemented Viability Metric Target Outcome
Goal # Responsible Individuals
1
Review national trends and local need to determine appropriate strategies. Send encouraging emails to FTIC students in EDF 1005; include information about FFMT scholarship. We anticipate this will have a positive impact on underrepresented students.
Unduplicated Headcount: 2%
1 ESE Faculty
III. Special Resources Needed: Assistance from Marketing Department to develop marketing materials.
IV. Area(s) of Concern/Improvement: Covid-19 continues to negatively impact enrollment and retention.
Academic Program Viability Report UD 2019-20 Page 86

ACADEMIC PROGRAM VIABILITY REPORTStudent Count by Academic Year
0
10
20
30
2017 2018 2019 2020
35
28
16 16
SSH By Campus
Campus 2017
2018
2019
2020
Clearwater CampusTarpon Springs Campus
44724
31120
18018
8932
Total 471 331 198 121
Student Count by Ethnic Group and Academic Year
0
10
20
30
2017 2018 2019 2020
2 21 11 11
3
31
24
14
10
Ethnic Group Asian Black/African American Hispanic/Latino White
Success Rate by Academic Year
0%
50%
100%
2017 2018 2019
96.2%90.9%
86.4%
Term
All
Program
All
Plan
All
College School Depart…
All
Success Rate By Course
Academic YearSubject
2017StudentCount
EnrollmentCount
SucRate
MAD3107MAE3320MAE3823MAE3941MAE4330MAE4642MAE4940MAE4942MAE4943MAS3105MAS4203MAS4301MGF4301MHF4404MTG3212
1412101213125
1387465 9
1412101213125
1387465 9
109
1099
10109
101010108
10Total 35 130 9
Academic Organization
Multiple selections
Community
All
FTIC Flag
All
Part Full Time
All
Gender
All
Academic Program Viability Report UD 2019-20 Page 87

ACADEMIC PROGRAM VIABILITY REPORT
Academic Plan
All Academic Plan Id
Student Count Enrollment Count Units Taken Success Rate Grads Count2019-20
Enrolled in Fall2020-21 (0580)
Retention Rate0565 to 0580
EDST-BSGEN-AAHUS-ASMTSED-BSPEND-NO
1 9
313
436
949
13518
100.0 %100.0 %100.0 %88.4 %
100.0 %
2
1 5
100.0 %
77.8 %
Total 10 56 175 91.1 % 2 6 80.0 %
80%Retention Rate 0565 to 0580
6Enrolled in Fall 2020-21
91.1%Success Rate Fall 2019-20
Academic Program
All
College School Depart…
All
Academic Organization…
Multiple selections
Community
All
FTIC Flag
All
Ethnic Group
All
Gender
All
2Grads Count 2019-20
10Student Count Fall 2019-20
Academic Program Viability Report UD 2019-20 Page 88

ACADEMIC PROGRAM VIABILITY REPORTNumber of Grads and Number of Awards by Academic Year
0
5
10
2017 2018 2019
1312
2
1312
2
Number of Grads Number of Awards
Student Count by Ethnic Group and Academic Year
0
5
10
2017 2018 2019
1
12
10
2
Student.Ethnic Group Black/African American White
Term
All
Program
All
Plan
Multiple selections
Academic YearDegree
2017Numberof Grads
Numberof Awards
2018Numberof Grads
Numberof Awards
2019Numberof Grads
Numberof Awards
BSMGMED-BSMTSED-BS
1385
1385
1275
1275
2 2
2 2
Total 13 13 12 12 2 2
Gender
All
Academic Program Viability Report UD 2019-20 Page 89

ACADEMIC PROGRAM VIABILITY REPORT
Academic Plan
All
83.9%Retention Rate 0535 to 0550
12Enrolled in Fall 2018-19
31Student Count Fall 2017-18
97.5%Success Rate Fall 2017-18
Academic Program
All
College School Depart…
All
Academic Organization…
Multiple selections
Community
All
FTIC Flag
All
Ethnic Group
All
Gender
All
15Grads Count 2017-18
24Student Count Fall 2018-19
10Student Count Fall 2019-20
90.6%Success Rate Fall 2018-19
91.1%Success Rate Fall 2019-20
5Enrolled in Fall 2019-20
6Enrolled in Fall 2020-21
12Grads Count 2018-19
2Grads Count 2019-20
70.8%Retention Rate 0550 to 0565
80%Retention Rate 0565 to 0580
Academic Plan Id Retention Rate 0535 to 0550 Retention Rate 0550 to 0565 Retention Rate 0565 to 0580
ENGINE-TRENRCH-NOGEN-AAMGMED-BSMTSED-BSPHARM-TR
100.0 %
100.0 %92.9 %
100.0 %
25.0 %
100.0 %100.0 %80.0 %
100.0 %
100.0 %
77.8 %
Total 83.9 % 70.8 % 80.0 %
Academic Program Viability Report UD 2019-20 Page 90

��������� ������ ������� ��������� ����� � ����� ����
�������������� ������� ��!���"��������������� ������� ��������� ����������� ���� ���# $�$
%&'()*+,-. /)012))3 4-)5(,6) %,.)1 7+8)(. 9+&( :::%)'(;& .&,1 1,.)%*<=>?1,-)11 :-.)@@,A)-;) B,-'-;,'@ :-2+(C'.,+- 7);(?,.C)-. '-3 D3C,11,+-1 = 5).',@1 %.?3)-. :-2+(C'.,+- EFGHIJF KJLMNOPFQMJ R SIFPQTUVWXYZ[V \]_]WZ [Wa[b[cd eYf]c g \Y]VYhc ijbb k-(+@@C)-.l*)(2+(C'-;)l*)(;)-. B?@@lm('3?'.)1l<+?(1) m(+?n1\Y]VYhc ijbb oYc][V p]Wfq <@'11 %.'.?1r stFQuIv wGTTv EFMx wGNFyIN zJNMTTOIJFv <@'11 D;'3)C,; m(+?nr {Sv |Sv <@'11 <+@@)A) %;&++@ 5)n. = D;'3)C,; m(+?n 5)1; = D;'3)C,; 4(A'-,}'.,+- = %?8~);. <'.'@+A /8(r �s�� zSR|Sv ���zSR|S
\Y]VYhc ijbb oYc][V ad �h�c]jVc[hWb oYcqX ������� �������� ���� � ���� ������������ � ������� ������������ ����������� ����� ���������� ���� � ¡¢�� � £ ¤¥¤¦ §��������� ���� �© © ¡¥ ©���� ���� � ¡¢�� � £ ¤¥¤¦ �������� ����� ª��� «¬ � ©¥ ¡����� ���� � ¡¢�� � £ ¤¥¤¦ ������ ���� ® ¬° � ° ®©¬° ®®®°�����± ���� � ¡¢�� � £ ¤« ¦ §��������� ���� ®© �« «�����± ���� � ¡¢�� � £ ¤« ¦ �������� ����� ª��� ¤¬ ©© ¡©�����± ���� � ¡¢�� � £ ¤« ¦ ������ ���� ¤¬¥° ¥¡©° ¤ °������ ���� � ¡¢�� � £ ¤«¤¦ §��������� ���� ¬ ¤ ®������ ���� � ¡¢�� � £ ¤«¤¦ �������� ����� ª��� �© ¡� ¡������� ���� � ¡¢�� � £ ¤«¤¦ ������ ���� ®®®° ©¡«° �¤ °���� ���� � � �� �¡ £ ¤¬ ¦ §��������� ���� �¬ �¡ ¥ ¡���� ���� � � �� �¡ £ ¤¬ ¦ �������� ����� ª��� ¢¬ ¤¥ �� � ���� ���� � � �� �¡ £ ¤¬ ¦ ������ ���� �¬¥° ®«¤° �«®° ¤ ° <@'11 %.'.?1r stFQuIv wGTTv EFMx wGNFyIN zJNMTTOIJFv <@'11 D;'3)C,; m(+?nr {Sv |Sv <@'11 <+@@)A) %;&++@ 5)n. = D;'3)C,; m(+?n 5)1; = D;'3)C,; 4(A'-,}'.,+- = %?8~);. <'.'@+A /8(r �s�� zSR|Sv ���zSR|Sv B,@.)( )Cn.² (+01 '-3 ;+@?C-1
Academic Program Viability Report UD 2019-20 Page 91

Course Groups
An internship course has not been identified for the Middle Grades Mathematics Education program at
the baccalaureate degree level.
Academic Program Viability Report UD 2019-20 Page 92

��������� ������ ������� ��������� ����� � ����� ������
�������������� ������� ��!���"��������������� ������� ��������� ����������� ������ ���# $�$
%&'()*+,-. /)012))3 4-)5(,6) %,.)1 7+8)(. 9+&( :::%)'(;& .&,1 1,.)%*<=>?1,-)11 :-.)@@,A)-;) B,-'-;,'@ :-2+(C'.,+- 7);(?,.C)-. '-3 D3C,11,+-1 = 5).',@1 %.?3)-. :-2+(C'.,+- EFGHIJF KJLMNOPFQMJ R SIFPQTUVWXYZ[V \]_]WZ [Wa[b[cd eYf]c g hi]jY k]ifj l-(+@@C)-.m*)(2+(C'-;)m*)(;)-. B?@@mn('3?'.)1m<+?(1) n(+?o1hi]jY k]ifj pqrr stuv wxyz{wxwx |x}~}� ��u��� stuv wxyz{wxwx |x}�x� ��vvtu stuv wxyz{wxwx |x}�}� pqrr stuv wxwx{wxwy |x}�x��rq�� ���u�t �u��� { ����t�� �q�qr�� ��u�����r��q�t� ����t�� ����� ��v�tu �� �rq��t� �����r��q�t� ����t�� ����� ��v�tu �� �rq��t� �����r��q�t� ����t�� ����� ��v�tu �� �rq��t� �����r��q�t� ����t�� ����� ��v�tu �� �rq��t�����z�x y y y y w y <@'11 <+?(1) n(+?o� KJFINJ��Q� �MGN�I� R ���� %.?3)-. )(C <'())( 5)1; = *(+A('C 5)1; = *@'- 5)1; = %?8o@'- 5)1;� EI¡MJHPN¢ £PF� �HG¡PFQMJ� <@'11 D;'3)C,; <'())(� ¤¥¦S� B,@.)( )Co.§ (+01 ciXY©c djcYZ hiaY eYª]Yj«¬q�� t�ut�® °±²³±²² µ�¶·�° D9[Wa[b[cd eYf]c \]VYjj ViZY©c ¹�q��r��º t��u� »u��t�� ¼���vt��D;'3)C,; ½)'( = )(C 5)1; = 9?@., B'@@ )(C ²·°=²² ¾³¿³À� %o(,-A )(C ²Á<'Co?1 5)1;(,o.,+- D@@<'())( = *(+A('C = *@'- = %?8o@'- = 9?@., %);+-3'(§ 9'.& l3?;'.,+-<+@@)A) = n(+?o = D;'3 4(A = %?8Â);. D@@<+?(1) :-1.(?;.,+-'@ 9).&+3 D@@%.?3)-. §o) ¾B :<ÀD@@DA) n(+?o D@@l.&-,; n(+?o D@@n)-3)(D@@<?1.+C <+&+(. D@@%.?3)-. n(+?o D@@Academic Program Viability Report UD 2019-20 Page 93

Industry Certification Attainment
In the College of Education, programs the Florida Teacher Certification Examinations (FCTE) are used to evaluate the students. The exams are required for certification within the State of Florida.
Education State Licensure Exam Passing Rates
Elementary Education BS 2013‐14 2014‐15 2015‐16 2016‐17 2017‐18 2018‐19
State Exam 100.0% 100.0% 100.0% 100.0% 100.0% 100.0%
Source: 2019‐20 Factbook, Table 9
Academic Program Viability Report UD 2019-20 Page 94

2019-20 Placement Data
*Refers to graduates found to be employed full-time or part-time.
Source: http://www.fldoe.org/accountability/fl-edu-training-placement-info-program/fl-college-system-reports.stml
MATH ED BS Pool Count Percent Placed 2014-15 N/A 90% 2015-16 N/A 84% 2016-17 N/A 100% 2017-18 N/A 89%
Academic Program Viability Report UD 2019-20 Page 95
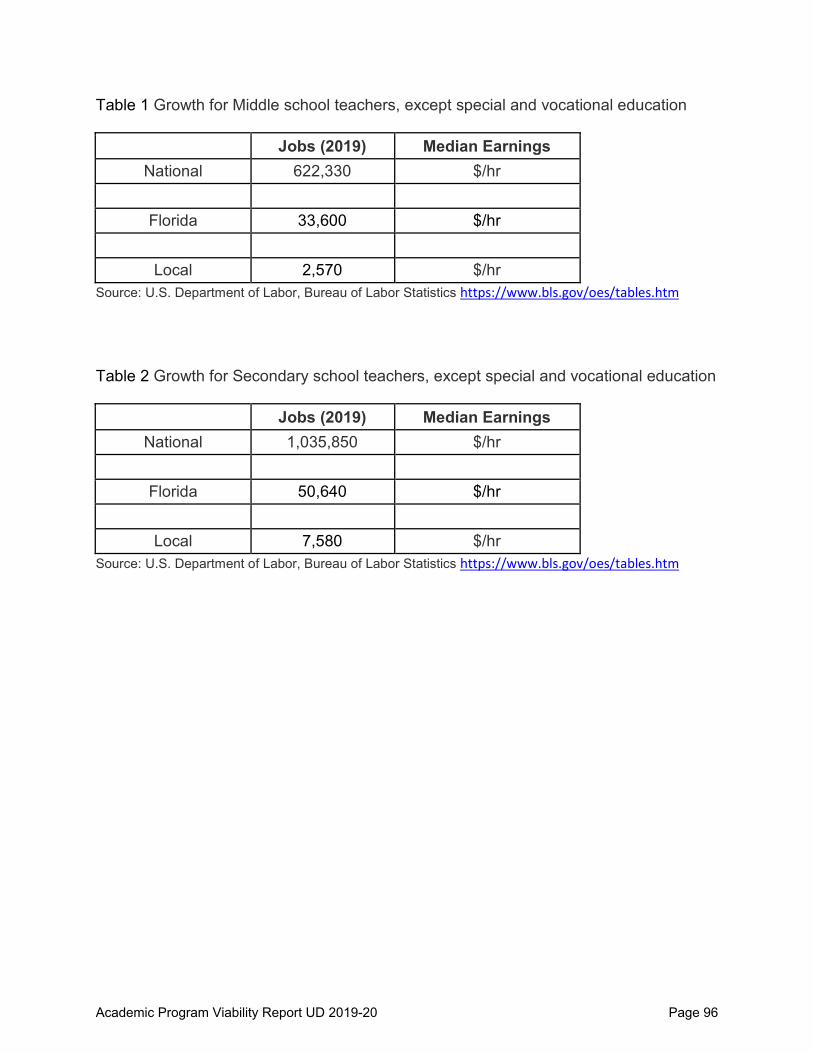
Table 1 Growth for Middle school teachers, except special and vocational education
Jobs (2019) Median Earnings National 622,330 $/hr
Florida 33,600 $/hr
Local 2,570 $/hr
Source: U.S. Department of Labor, Bureau of Labor Statistics https://www.bls.gov/oes/tables.htm
Table 2 Growth for Secondary school teachers, except special and vocational education
Jobs (2019) Median Earnings National 1,035,850 $/hr
Florida 50,640 $/hr
Local 7,580 $/hr
Source: U.S. Department of Labor, Bureau of Labor Statistics https://www.bls.gov/oes/tables.htm
Academic Program Viability Report UD 2019-20 Page 96

Perkins Completion & Non-Traditional Completion Performance
Perkins completion metrics do not apply to baccalaureate programs.
Academic Program Viability Report UD 2019-20 Page 97

Action Plan Follow-up and Evaluation Report for 2018-19 Viability Report Program: Mathematics Education, Upper Division Date Completed: August 2020 Prepared By: Dr. Kimberly Hartman and Ms. Margaret Bowman I. Action Plan Items Status
Action Item
Measure
Addressed (Value)
Completion
Status
Status Explanation
1
Increase enrollment in MATH ED-UD licensure program. This item was carried forward from the 2017-18 Action Plan.
SSH Enrollment
Not Completed
SSH Enrollment in these programs decreased by 102. Unduplicated Student Enrollment decreased by 7. Middle Grades Math entered teach-out status in Fall 2020; SSH Enrollment and Undup. Student Enrollment will remain flat or decline. SSH in Secondary Math declined slightly by 5; enrollment remained stable at 14.
Secondary Math and Middle Grades Math Programs:
Academic Program Viability Report UD 2019-20 Page 98

Secondary Math Program:
Academic Program Viability Report UD 2019-20 Page 99

II. Non-Completed Action Plan Items and Plan for Completion
Action Item
Completion
Date
Plan for Completion
1
Increase enrollment in MATH ED-UD licensure program. This item was carried forward from the 2017-18 Action Plan.
August 2021 Continue current marketing, recruitment, and advising strategies.
III. Evaluation of the Impact of Action Plans on Program Quality The decrease in SSH in these programs is likely the result of the COVID-19 pandemic, which interrupted educational programs nationwide. Our steady unduplicated enrollment count of 14 in Secondary Math is a positive year-to-year retention indicator. We will continue to focus on retention of current students, as the pandemic is ongoing, and market our program through strategies such as the Career and Academic Communities events.
Academic Program Viability Report UD 2019-20 Page 100

St. Petersburg College
Program Goals and Strategies Program: Mathematics Education, Upper Division Date Completed: 2/18/2021 Due Date: August 2021 Prepared By: Margaret Bowman I. Goals
Program Goals SPC Commitment Pillar
1 Improve retention rates in program by 5% by implementing additional student engagement strategies.
Academic Excellence
2 Improve enrollment rates in program by 5%. Academic Excellence II. Strategies
Strategies to be Implemented Viability Metric Target Outcome
Goal # Responsible Individuals
1
Implement additional engagement methods, such as sending an encouraging email to students in the first semester of their program. We anticipate this will also have a positive impact on underrepresented students.
Retention: 5% 1 Andrea Kelly
2
Develop a Math Education Pathway at the AA level that includes prerequisite courses students need to take for the higher-level math courses in the Secondary Math Ed BS program. We will work with Curriculum Services to post the pathway in high traffic areas on the website.
Unduplicated Headcount: 5%
2 Andrea Kelly; Margaret Bowman
III. Special Resources Needed: N/A
IV. Area(s) of Concern/Improvement: Covid-19 continues to negatively impact enrollment and retention.
Academic Program Viability Report UD 2019-20 Page 101

ACADEMIC PROGRAM VIABILITY REPORTStudent Count by Academic Year
0
20
40
2017 2018 2019 2020
54
19
11
5
SSH By Campus
Campus 2017
2018
2019
2020
Clearwater CampusSt Petersburg/Gibbs CampusTarpon Springs Campus
1067818
48713
12108
37
Total 202 122 120 37
Student Count by Ethnic Group and Academic Year
0
10
20
30
2017 2018 2019 2020
31
3 2 1
8
2 2 2
34
14
8
3
Ethnic Group Asian Black/African American Hispanic/Latino White
Success Rate by Academic Year
0%
50%
100%
2017 2018 2019
97.3% 97.9%
88.9%
Term
All
Program
All
Plan
All
College School Depart…
All
Success Rate By Course
Academic YearSubject
2017StudentCount
EnrollmentCount
SucRate
BCH3023BSC3096BSC3096CBSC4032SCE3030SCE3420CSCE3941SCE3945SCE4144SCE4330SCE4832SCE4940SCE4942SCE4943
246 23233 4
18431
246 23233 4
18431
1010
1010101010
108
101010
Total 54 73 9
Academic Organization
Multiple selections
Community
All
FTIC Flag
All
Part Full Time
All
Gender
All
Academic Program Viability Report UD 2019-20 Page 102

ACADEMIC PROGRAM VIABILITY REPORT
Academic Plan
All Academic Plan Id
Student Count Enrollment Count Units Taken Success Rate Grads Count2019-20
Enrolled in Fall2020-21 (0580)
Retention Rate0565 to 0580
AUTISM-NOBACCAPP-NOBSCED-BSBUS-ASCJPSS-ASEDST-BSELEDR-BSENRCH-NOESEDR-BSJOB-NOMGSED-BSRCERT-NO
1 1 1 31
145436
10321
173
31224129
152710133
4910
100.0 %100.0 %60.0 %
100.0 %100.0 %100.0 %100.0 %100.0 %100.0 %100.0 %88.2 %
100.0 %
1 2
1
100.0 %
100.0 %
66.7 %
Total 7 59 187 93.2 % 3 1 57.1 %
57.1%Retention Rate 0565 to 0580
1Enrolled in Fall 2020-21
93.2%Success Rate Fall 2019-20
Academic Program
All
College School Depart…
All
Academic Organization…
Multiple selections
Community
All
FTIC Flag
All
Ethnic Group
All
Gender
All
3Grads Count 2019-20
7Student Count Fall 2019-20
Academic Program Viability Report UD 2019-20 Page 103

ACADEMIC PROGRAM VIABILITY REPORTNumber of Grads and Number of Awards by Academic Year
0
1
2
3
4
2017 2018 2019
4
3
44
3
4
Number of Grads Number of Awards
Student Count by Ethnic Group and Academic Year
0
1
2
3
4
2017 2018 2019
1
3 3
4
Student.Ethnic Group Hispanic/Latino White
Term
All
Program
All
Plan
Multiple selections
Academic YearDegree
2017Numberof Grads
Numberof Awards
2018Numberof Grads
Numberof Awards
2019Numberof Grads
Numberof Awards
BSBSCED-BSMGSED-BS
431
431
312
312
422
422
Total 4 4 3 3 4 4
Gender
All
Academic Program Viability Report UD 2019-20 Page 104

ACADEMIC PROGRAM VIABILITY REPORT
Academic Plan
All
90%Retention Rate 0535 to 0550
6Enrolled in Fall 2018-19
20Student Count Fall 2017-18
90.2%Success Rate Fall 2017-18
Academic Program
All
College School Depart…
All
Academic Organization…
Multiple selections
Community
All
FTIC Flag
All
Ethnic Group
All
Gender
All
12Grads Count 2017-18
11Student Count Fall 2018-19
7Student Count Fall 2019-20
95.9%Success Rate Fall 2018-19
93.2%Success Rate Fall 2019-20
4Enrolled in Fall 2019-20
1Enrolled in Fall 2020-21
3Grads Count 2018-19
3Grads Count 2019-20
63.6%Retention Rate 0550 to 0565
57.1%Retention Rate 0565 to 0580
Academic Plan Id Retention Rate 0535 to 0550 Retention Rate 0550 to 0565 Retention Rate 0565 to 0580
BSCED-BSEDST-BSELEDR-BSESEDR-BSJOB-NOMGSED-BS
100.0 %
100.0 %90.9 %
100.0 %100.0 %
100.0 %
100.0 %
100.0 %100.0 %
66.7 %Total 90.0 % 63.6 % 57.1 %
Academic Program Viability Report UD 2019-20 Page 105

��������� ������ ������� ��������� ����� � ����� ����
�������������� ������� ��!���"��������������� ������� ��������� ����������� ���� ���# $�$
%&'()*+,-. /)012))3 4-)5(,6) %,.)1 7+8)(. 9+&( :::%)'(;& .&,1 1,.)%*<=>?1,-)11 :-.)@@,A)-;) B,-'-;,'@ :-2+(C'.,+- 7);(?,.C)-. '-3 D3C,11,+-1 = 5).',@1 %.?3)-. :-2+(C'.,+- EFGHIJF KJLMNOPFQMJ R SIFPQTUVWXYZ[V \]_]WZ [Wa[b[cd eYf]c g \Y]VYhc ijbb k-(+@@C)-.l*)(2+(C'-;)l*)(;)-. B?@@lm('3?'.)1l<+?(1) m(+?n1\Y]VYhc ijbb oYc][V p]Wfq <@'11 %.'.?1r stFQuIv wGTTv EFMx wGNFyIN zJNMTTOIJFv <@'11 D;'3)C,; m(+?nr {Sv |Sv <@'11 <+@@)A) %;&++@ 5)n. = D;'3)C,; m(+?n 5)1; = D;'3)C,; 4(A'-,}'.,+- = %?8~);. <'.'@+A /8(r ��EzSR|Sv E�K zSR|S
\Y]VYhc ijbb oYc][V ad �h�c]jVc[hWb oYcqX ������� �������� ���� � ���� ������������ � ������������ ���������� ���� ��������� ����� ¡��������� ¢���� �£ � � �¤���� ���� ��������� ����� ¥������� ¢����� ¦��� ��� �� � ������ ���� ��������� ����� §������ ���� ���© ��£© ���© ���©¥ª���« ���� ��������� ���£� ¡��������� ¢���� �� � ¤¥ª���« ���� ��������� ���£� ¥������� ¢����� ¦��� �� ¤� �¤¥ª���« ���� ��������� ���£� §������ ���� ���© �¤¬© ��£©���� ���� ��������� ���� ¡��������� ¢���� � ����� ���� ��������� ���� ¥������� ¢����� ¦��� �� ������ ���� ��������� ���� §������ ���� �© �© <@'11 %.'.?1r stFQuIv wGTTv EFMx wGNFyIN zJNMTTOIJFv <@'11 D;'3)C,; m(+?nr {Sv |Sv <@'11 <+@@)A) %;&++@ 5)n. = D;'3)C,; m(+?n 5)1; = D;'3)C,; 4(A'-,}'.,+- = %?8~);. <'.'@+A /8(r ��EzSR|Sv E�K zSR|Sv B,@.)( )Cn.® (+01 '-3 ;+@?C-1
Academic Program Viability Report UD 2019-20 Page 106

��������� ������ ������� ��������� ����� � ����� ������
�������������� ������� ��!���"��������������� ������� ��������� ����������� ������ ���# $�$
%&'()*+,-. /)012))3 4-)5(,6) %,.)1 7+8)(. 9+&( :::%)'(;& .&,1 1,.)%*<=>?1,-)11 :-.)@@,A)-;) B,-'-;,'@ :-2+(C'.,+- 7);(?,.C)-. '-3 D3C,11,+-1 = 5).',@1 %.?3)-. :-2+(C'.,+- EFGHIJF KJLMNOPFQMJ R SIFPQTUVWXYZ[V \]_]WZ [Wa[b[cd eYf]c g hi]jY k]ifj l-(+@@C)-.m*)(2+(C'-;)m*)(;)-. B?@@mn('3?'.)1m<+?(1) n(+?o1hi]jY k]ifj pqrr stuv wxyz{wxwx |x}~}� ��u��� stuv wxyz{wxwx |x}�x� ��vvtu stuv wxyz{wxwx |x}�}� pqrr stuv wxwx{wxwy |x}�x��rq�� ���u�t �u��� { ����t�� �q�qr�� ��u�����r��q�t� ����t�� ����� ��v�tu �� �rq��t� �����r��q�t� ����t�� ����� ��v�tu �� �rq��t� �����r��q�t� ����t�� ����� ��v�tu �� �rq��t� �����r��q�t� ����t�� ����� ��v�tu �� �rq��t�����z�� � y <@'11 <+?(1) n(+?o� KJFINJ��Q� �MGN�I� R ���� %.?3)-. �)(C <'())( 5)1; = *(+A('C 5)1; = *@'- 5)1; = %?8o@'- 5)1;� QHHTI ¡NPHI� ¡IJ E¢QIJ¢I �HG� <@'11 D;'3)C,; <'())(� £¡¤S� B,@.)( )Co.¥ (+01 ¦ciXY§c ¦djcYZ hiaY eY]Yj©ªq�� «t�ut�¬ ®°±°²°² ³�µ�²® D9[Wa[b[cd eYf]c \]VYjj ¶ViZY§c ·�q��r�� «t��u� ¹u��t�� º���vt��D;'3)C,; »)'( = �)(C 5)1; = 9?@., B'@@ �)(C °²µ®=°²°² ¼²±½±¾� %o(,-A �)(C °¿<'Co?1 5)1;(,o.,+- D@@<'())( = *(+A('C = *@'- = %?8o@'- = 9?@., 9,33@) n('3)1 n)- %;,)-;) l3?<+@@)A) = n(+?o = D;'3 4(A = %?8À);. D@@<+?(1) :-1.(?;.,+-'@ 9).&+3 D@@%.?3)-. �¥o) ¼B�:<¾D@@DA) n(+?o D@@l.&-,; n(+?o D@@n)-3)(D@@<?1.+C <+&+(. D@@%.?3)-. n(+?o D@@Academic Program Viability Report UD 2019-20 Page 107

��������� ������ ������� ��������� ����� � ����� ������
�������������� ������� ��!���"��������������� ������� ��������� ����������� ������ ���# $�$
%&'()*+,-. /)012))3 4-)5(,6) %,.)1 7+8)(. 9+&( :::%)'(;& .&,1 1,.)%*<=>?1,-)11 :-.)@@,A)-;) B,-'-;,'@ :-2+(C'.,+- 7);(?,.C)-. '-3 D3C,11,+-1 = 5).',@1 %.?3)-. :-2+(C'.,+- EFGHIJF KJLMNOPFQMJ R SIFPQTUVWXYZ[V \]_]WZ [Wa[b[cd eYf]c g hi]jY k]ifj l-(+@@C)-.m*)(2+(C'-;)m*)(;)-. B?@@mn('3?'.)1m<+?(1) n(+?o1hi]jY k]ifj pqrr stuv wxyz{wxwx |x}~}� ��u��� stuv wxyz{wxwx |x}�x� ��vvtu stuv wxyz{wxwx |x}�}� pqrr stuv wxwx{wxwy |x}�x��rq�� ���u�t �u��� { ����t�� �q�qr�� ��u�����r��q�t� ����t�� ����� ��v�tu �� �rq��t� �����r��q�t� ����t�� ����� ��v�tu �� �rq��t� �����r��q�t� ����t�� ����� ��v�tu �� �rq��t� �����r��q�t� ����t�� ����� ��v�tu �� �rq��t�����z�w y y y y <@'11 <+?(1) n(+?o� KJFINJ��Q� �MGN�I� R ���� %.?3)-. �)(C <'())( 5)1; = *(+A('C 5)1; = *@'- 5)1; = %?8o@'- 5)1;� EI�MJHPN E�QIJ�I �HG�PFQMJ� <@'11 D;'3)C,; <'())(� ¡¢£S� B,@.)( )Co.¤ (+01 ¥ciXY¦c ¥djcYZ hiaY eY§]Yj©q�� ªt�ut�«¬ ®°®±± ²�³�± D9[Wa[b[cd eYf]c \]VYjj µViZY¦c ¶�q��r��· ªt��u� u��t�� ¹���vt��D;'3)C,; º)'( = �)(C 5)1; = 9?@., B'@@ �)(C ±=±± »±°¼°½� %o(,-A �)(C ¾<'Co?1 5)1;(,o.,+- D@@<'())( = *(+A('C = *@'- = %?8o@'- = 9?@., %);+-3'(¤ %;,)-;) l3?;'.,+-<+@@)A) = n(+?o = D;'3 4(A = %?8¿);. D@@<+?(1) :-1.(?;.,+-'@ 9).&+3 D@@%.?3)-. �¤o) »B�:<½D@@DA) n(+?o D@@l.&-,; n(+?o D@@n)-3)(D@@<?1.+C <+&+(. D@@%.?3)-. n(+?o D@@Academic Program Viability Report UD 2019-20 Page 108

Industry Certification Attainment
In the College of Education, programs the Florida Teacher Certification Examinations (FCTE) are used to evaluate the students. The exams are required for certification within the State of Florida.
Education State Licensure Exam Passing Rates
Elementary Education BS 2013‐14 2014‐15 2015‐16 2016‐17 2017‐18 2018‐19
State Exam 100.0% 100.0% 100.0% 100.0% 100.0% 100.0%
Source: 2019‐20 Factbook, Table 9
Academic Program Viability Report UD 2019-20 Page 109

2019-20 Placement Data
*Refers to graduates found to be employed full-time or part-time.
SCI Ed BS Pool Count Percent Placed 2014-15 N/A 100% 2015-16 N/A 100% 2016-17 N/A 84% 2017-18 N/A 100%
Source: http://www.fldoe.org/accountability/fl-edu-training-placement-info-program/fl-college-system-reports.stml
Academic Program Viability Report UD 2019-20 Page 110

Table 1 Growth for Middle school teachers, except special and vocational education
Jobs (2019) Median Earnings National 622,330 $/hr
Florida 33,600 $/hr
Local 2,570 $/hr
Source: U.S. Department of Labor, Bureau of Labor Statistics https://www.bls.gov/oes/tables.htm
Table 2 Growth for Secondary school teachers, except special and vocational education
Jobs (2019) Median Earnings National 1,035,850 $/hr
Florida 50,640 $/hr
Local 7,580 $/hr
Source: U.S. Department of Labor, Bureau of Labor Statistics https://www.bls.gov/oes/tables.htm
Academic Program Viability Report UD 2019-20 Page 111

Perkins Completion & Non-Traditional Completion Performance
Perkins completion metrics do not apply to baccalaureate programs.
Academic Program Viability Report UD 2019-20 Page 112

Action Plan Follow-up and Evaluation Report for 2018-19 Viability Report Program: Science Education, Upper Division Date Completed: August 2020 Prepared By: Dr. Kimberly Hartman and Ms. Margaret Bowman I. Action Plan Items Status
Action Item
Measure
Addressed (Value)
Completion
Status
Status Explanation
1
Increase enrollment in SCI ED-UD-BS, licensure program. This item was carried forward from the 2017-18 Action Plan.
SSH Enrollment
Not Completed
SSH Enrollment declined by 50% as did Unduplicated Student Enrollment (from 4 to 2). These programs are in a teach-out status.
Secondary Science and Middle Grades Science (LAT 580) Programs:
Academic Program Viability Report UD 2019-20 Page 113

Secondary Science Program:
Academic Program Viability Report UD 2019-20 Page 114

II. Non-Completed Action Plan Items and Plan for Completion
Action Item
Completion
Date
Plan for Completion
1
Increase enrollment in SCI ED-UD-BS, licensure program.
N/A These programs are in teach-out.
III. Evaluation of the Impact of Action Plans on Program Quality N/A; These programs are in teach-out.
Academic Program Viability Report UD 2019-20 Page 115
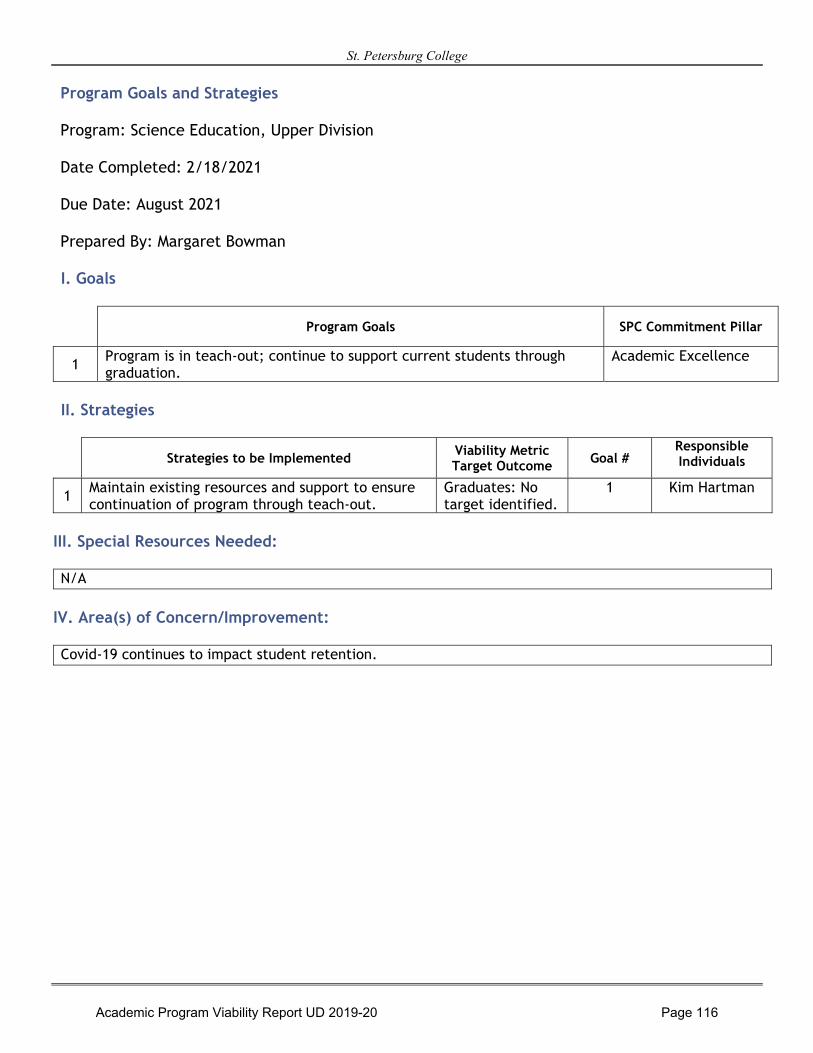
St. Petersburg College
Program Goals and Strategies Program: Science Education, Upper Division Date Completed: 2/18/2021 Due Date: August 2021 Prepared By: Margaret Bowman I. Goals
Program Goals SPC Commitment Pillar
1 Program is in teach-out; continue to support current students through graduation.
Academic Excellence
II. Strategies
Strategies to be Implemented Viability Metric Target Outcome
Goal # Responsible Individuals
1 Maintain existing resources and support to ensure continuation of program through teach-out.
Graduates: No target identified.
1 Kim Hartman
III. Special Resources Needed: N/A
IV. Area(s) of Concern/Improvement: Covid-19 continues to impact student retention.
Academic Program Viability Report UD 2019-20 Page 116

ACADEMIC PROGRAM VIABILITY REPORTStudent Count by Academic Year
0
50
100
150
2017 2018 2019 2020
135
154168
143
SSH By Campus
Campus 2017
2018
2019
2020
Health Education Center 1,617 1,981 2,004 905Total 1,617 1,981 2,004 905
Student Count by Ethnic Group and Academic Year
0
50
100
2017 2018 2019 2020
3 4 6107
14 12 10
29 26
39
31
93
105101
80
Ethnic Group Asian Black/African American Hispanic/Latino White
Success Rate by Academic Year
0%
20%
40%
60%
80%
100%
2017 2018 2019
97.9% 98.7% 99.4%
Term
All
Program
All
Plan
All
College School Depart…
All
Success Rate By Course
Academic YearSubject
2017StudentCount
EnrollmentCount
SucRate
DEH3730DEH3813DEH3814DEH4607DEH4851DEH4852DEH4854DEH4901DEH4947
586055504850461
49
586056504850471
49
99999
109
109
Total 135 419 9
Academic Organization
Dental Hygiene - UD
Community
All
FTIC Flag
All
Part Full Time
All
Gender
All
Academic Program Viability Report UD 2019-20 Page 117

ACADEMIC PROGRAM VIABILITY REPORT
Academic Plan
All Academic Plan Id
Student Count Enrollment Count Units Taken Success Rate Grads Count2019-20
Enrolled in Fall2020-21 (0580)
Retention Rate0565 to 0580
DENH-BASDENHY-ASDENHY-NOGEN-AAHSA-ASHSA-BAS
12166
316368211
1,0659630633
97.8 %100.0 %100.0 %100.0 %100.0 %100.0 %
486
6766
90.1 %100.0 %100.0 %
Total 133 364 1,203 98.1 % 54 79 91.0 %
91%Retention Rate 0565 to 0580
79Enrolled in Fall 2020-21
98.1%Success Rate Fall 2019-20
Academic Program
All
College School Depart…
All
Academic Organization…
DENHY -UD
Community
All
FTIC Flag
All
Ethnic Group
All
Gender
All
54Grads Count 2019-20
133Student Count Fall 2019-20
Academic Program Viability Report UD 2019-20 Page 118

ACADEMIC PROGRAM VIABILITY REPORTNumber of Grads and Number of Awards by Academic Year
0
20
40
60
2017 2018 2019
4548
58
4548
58
Number of Grads Number of Awards
Student Count by Ethnic Group and Academic Year
0
10
20
30
40
2017 2018 2019
1 12 24
108
10
32
36
41
Student.Ethnic Group Asian Black/African American Hispanic/Latino White
Term
All
Program
All
Plan
DENH-BAS
Academic YearDegree
2017Numberof Grads
Numberof Awards
2018Numberof Grads
Numberof Awards
2019Numberof Grads
Numberof Awards
BASDENH-BAS
4545
4545
4848
4848
5858
5858
Total 45 45 48 48 58 58
Gender
All
Academic Program Viability Report UD 2019-20 Page 119

ACADEMIC PROGRAM VIABILITY REPORT
Academic Plan
All
83.3%Retention Rate 0535 to 0550
59Enrolled in Fall 2018-19
114Student Count Fall 2017-18
97.2%Success Rate Fall 2017-18
Academic Program
All
College School Depart…
All
Academic Organization…
DENHY -UD
Community
All
FTIC Flag
All
Ethnic Group
All
Gender
All
39Grads Count 2017-18
125Student Count Fall 2018-19
133Student Count Fall 2019-20
97.9%Success Rate Fall 2018-19
98.1%Success Rate Fall 2019-20
72Enrolled in Fall 2019-20
79Enrolled in Fall 2020-21
44Grads Count 2018-19
54Grads Count 2019-20
86.4%Retention Rate 0550 to 0565
91%Retention Rate 0565 to 0580
Academic Plan Id Retention Rate 0535 to 0550 Retention Rate 0550 to 0565 Retention Rate 0565 to 0580
DENH-BASDENHY-ASDENHY-NO
82.4 %100.0 %100.0 %
86.0 %100.0 %100.0 %
90.1 %100.0 %100.0 %
Total 83.3 % 86.4 % 91.0 %
Academic Program Viability Report UD 2019-20 Page 120

��������� ������ ������� ��������� ����� � ����� ����
�������������� ������� ��!���"��������������� ������� ��������� ����������� ���� ���# $�$
%&'()*+,-. /)012))3 4-)5(,6) %,.)1 7+8)(. 9+&( :::%)'(;& .&,1 1,.)%*<=>?1,-)11 :-.)@@,A)-;) B,-'-;,'@ :-2+(C'.,+- 7);(?,.C)-. '-3 D3C,11,+-1 = 5).',@1 %.?3)-. :-2+(C'.,+- EFGHIJF KJLMNOPFQMJ R SIFPQTUVWXYZ[V \]_]WZ [Wa[b[cd eYf]c g \Y]VYhc ijbb k-(+@@C)-.l*)(2+(C'-;)l*)(;)-. B?@@lm('3?'.)1l<+?(1) m(+?n1\Y]VYhc ijbb oYc][V p]Wfq <@'11 %.'.?1r stFQuIv wGTTv EFMx wGNFyIN zJNMTTOIJFv <@'11 D;'3)C,; m(+?nr {Sv |Sv <@'11 <+@@)A) %;&++@ 5)n. = D;'3)C,; m(+?n 5)1; = D;'3)C,; 4(A'-,}'.,+- = %?8~);. <'.'@+A /8(r Sz��� R|S
\Y]VYhc ijbb oYc][V ad �h�c]jVc[hWb oYcqX ������� �������� ���� � ���� ������������ ����������� ����� ���������� ���� ��������� �¡¢¡£ ¤��¥������ ¦¥��� �§¢ �§¢���� ���� ��������� �¡¢¡£ �������� ¦¥���� ¥�� �¢© �¢©���� ���� ��������� �¡¢¡£ ª������ ���� «�¬© «�¬©�����® ���� ��������� �¡�£ ¤��¥������ ¦¥��� ��¢ ��¢�����® ���� ��������� �¡�£ �������� ¦¥���� ¥�� �©� �©������® ���� ��������� �¡�£ ª������ ���� «�¬ «�¬������ ���� ��������� �¡¡£ ¤��¥������ ¦¥��� �§ � �������� ���� ��������� �¡¡£ �������� ¦¥���� ¥�� ��� � ��������� ���� ��������� �¡¡£ ª������ ���� ¯¬¡ �¬� ¢¬���� ���� ��������� �¡«�£ ¤��¥������ ¦¥��� �§¡ �§¡���� ���� ��������� �¡«�£ �������� ¦¥���� ¥�� §�© §�©���� ���� ��������� �¡«�£ ª������ ���� �¬¡ �¬¡ <@'11 %.'.?1r stFQuIv wGTTv EFMx wGNFyIN zJNMTTOIJFv <@'11 D;'3)C,; m(+?nr {Sv |Sv <@'11 <+@@)A) %;&++@ 5)n. = D;'3)C,; m(+?n 5)1; = D;'3)C,; 4(A'-,}'.,+- = %?8~);. <'.'@+A /8(r Sz��� R|Sv B,@.)( )Cn.° (+01 '-3 ;+@?C-1
Academic Program Viability Report UD 2019-20 Page 121

��������� ������ ������� ��������� ����� � ����� ������
�������������� ������� ��!���"��������������� ������� ��������� ����������� ������ ���# $�$
%&'()*+,-. /)012))3 4-)5(,6) %,.)1 7+8)(. 9+&( :::%)'(;& .&,1 1,.)%*<=>?1,-)11 :-.)@@,A)-;) B,-'-;,'@ :-2+(C'.,+- 7);(?,.C)-. '-3 D3C,11,+-1 = 5).',@1 %.?3)-. :-2+(C'.,+- EFGHIJF KJLMNOPFQMJ R SIFPQTUVWXYZ[V \]_]WZ [Wa[b[cd eYf]c g hi]jY k]ifj l-(+@@C)-.m*)(2+(C'-;)m*)(;)-. B?@@mn('3?'.)1m<+?(1) n(+?o1hi]jY k]ifj pqrr stuv wxyz{wxwx |x}~}� ��u��� stuv wxyz{wxwx |x}�x� ��vvtu stuv wxyz{wxwx |x}�}� pqrr stuv wxwx{wxwy |x}�x��rq�� ���u�t �u��� { ����t�� �q�qr�� ��u�����r��q�t� ����t�� ����� ��v�tu �� �rq��t� �����r��q�t� ����t�� ����� ��v�tu �� �rq��t� �����r��q�t� ����t�� ����� ��v�tu �� �rq��t� �����r��q�t� ����t�� ����� ��v�tu �� �rq��t�����z�� y~ w �� � �x � <@'11 <+?(1) n(+?o� KJFINJ��Q� �MGN�I�� %.?3)-. �)(C <'())( 5)1; = *(+A('C 5)1; = *@'- 5)1; = %?8o@'- 5)1;� SIJFPT ¡¢QIJI� <@'11 D;'3)C,; <'())(� £¤¥S� B,@.)( )Co.¦ (+01 §ciXYc §djcYZ hiaY eY©]Yjª«q�� ¬t�ut�® °±²°±³±³ �µ¶�³ D9[Wa[b[cd eYf]c \]VYjj ·ViZYc �q��r��¹ ¬t��u� ºu��t�� ����vt��D;'3)C,; »)'( = �)(C 5)1; = 9?@., B'@@ �)(C ±³¶=±³±³ ¼³²½²¾� %o(,-A �)(C ±¿<'Co?1 5)1;(,o.,+- D@@<'())( = *(+A('C = *@'- = %?8o@'- = 9?@., 5)-.'@ À¦A,)-)<+@@)A) = n(+?o = D;'3 4(A = %?8Á);. D@@<+?(1) :-1.(?;.,+-'@ 9).&+3 D@@%.?3)-. �¦o) ¼B�:<¾D@@DA) n(+?o D@@l.&-,; n(+?o D@@n)-3)(D@@<?1.+C <+&+(. D@@%.?3)-. n(+?o D@@Academic Program Viability Report UD 2019-20 Page 122

Industry Certification Attainment
An industry certification or equivalent state or national exam has not been identified for the Dental Hygiene, BAS program for evidence of certification attainment at the baccalaureate level. All students in the BAS program were required to complete and pass the National Dental Hygiene Board Examination (NDHB) prior to enrolling in the BAS program.
Academic Program Viability Report UD 2019-20 Page 123

2019-20 Placement Data
*Refers to graduates found to be employed full-time or part-time.
Source: http://www.fldoe.org/accountability/fl-edu-training-placement-info-program/fl-college-system-reports.stml
DENHY BAS Pool Count Percent Placed 2014-15 44 70% 2015-16 38 68% 2016-17 41 78% 2017-18 40 90%
Academic Program Viability Report UD 2019-20 Page 124

Table 1 Growth for Dental Hygienists
Jobs (2019) Median Earnings National 221,560 $36.65/hr
Florida 11,310 $32.98/hr
Pinellas County 1,750 $36.70/hr
Source: U.S. Department of Labor, Bureau of Labor Statistics https://www.bls.gov/oes/tables.htm
Academic Program Viability Report UD 2019-20 Page 125

Perkins Completion & Non-Traditional Completion Performance
Perkins completion metrics do not apply to baccalaureate programs.
Academic Program Viability Report UD 2019-20 Page 126

Action Plan Follow-up and Evaluation Report for 2018-19 Viability Report Program: Dental Hygiene, Upper Division Date Completed: August 2020 Prepared By: Deanna Stentiford and Christine Patel I. Action Plan Items Status
Action Item
Measure
Addressed (Value)
Completion
Status
Status Explanation
1
In order to continue to recruit qualified students and increase enrollment in the Bachelor of Applied Science in Dental Hygiene (BASDH) program, we will begin work on securing lists of graduates (with their contact information) from all of the neighboring AS Dental Hygiene programs across the state. We will try to secure these lists with the help of Dr. Jason Krupp, SPC, Career Connection Director. We will also make an attempt to reach out to the Professional Board of Regulations via the Board of Dentistry (BOD) to secure lists of all dental hygiene licensees in the State of Florida.
SSH Enrollment
Completed In April of 2020, Jason Krupp secured a list of 14, 407 licensed dental hygienists in the state of Florida extracted from the Department of Health website. At the same time, Tracy Garrett and her team were also asked to work on reaching out/marketing our program to these licensees. Thereafter, I sent Tracy marketing text that she and her team could use. This was the last correspondence I had (May 20, 2020).
II. Non-Completed Action Plan Items and Plan for Completion The Action Item was completed. III. Evaluation of the Impact of Action Plans on Program Quality Sending our BASDH marketing material to all licensed dental hygienists in the state of Florida would certainly help with enrollment.
Academic Program Viability Report UD 2019-20 Page 127

St. Petersburg College
Program Goals and Strategies Program: Dental Hygiene, Upper Division Date Completed: 11/2/2020 Due Date: August 2021 Prepared By: Christine Patel I. Goals
Program Goals SPC Commitment Pillar
1 Continue student success by collaborating with the HEC Learning Resources (specifically the librarians and writing specialists).
Academic Excellence
II. Strategies
Strategies to be Implemented Viability Metric Target Outcome
Goal # Responsible Individuals
1
The BASDH program will continue offering the new students, among entrance into the program, an APA Bootcamp Workshop, conducted by the HEC librarians and writing specialists. This bootcamp helps new students understand the APA format, which sets them up for success in the classroom. The BASDH program will also continue to work with the librarians and writing specialists in all other core courses via discussion forums and collaboration on the program's writing assignment rubrics. This collaboration has improved the students writing and APA skills, leading to enhanced academic excellence.
Retention: We would like to have all new students (100%) complete the APA Bootcamp and at least 75% of current students collaborate with the librarians and writing specialists at HEC.
1 All BASDH faculty and the librarians and
writing specialists at
HEC.
III. Special Resources Needed: Funding for learning resources at HEC (specifically librarians and writing specialists).
IV. Area(s) of Concern/Improvement: Lack of funding and/or if our current HEC librarians and writing specialist leave SPC.
Academic Program Viability Report UD 2019-20 Page 128

ACADEMIC PROGRAM VIABILITY REPORTStudent Count by Academic Year
0
200
400
600
2017 2018 2019 2020
652 664 679
454
SSH By Campus
Campus 2017
2018
2019
2020
Health Education Center 5,571 5,990 5,772 2,535Total 5,571 5,990 5,772 2,535
Student Count by Ethnic Group and Academic Year
0
100
200
300
400
2017 2018 2019 2020
16 15 21 17
132 138 134
9774 82
9768
403 399 391
248
Ethnic Group Asian Black/African American Hispanic/Latino White
Success Rate by Academic Year
0%
20%
40%
60%
80%
100%
2017 2018 2019
89.8% 89.9% 90.1%
Term
All
Program
All
Plan
All
College School Depart…
All
Success Rate By Course
Academic YearSubject
2017StudentCount
EnrollmentCount
SuRa
HIM3240HIM3243HSA3104HSA3113HSA3170HSA3551HSA3702HSA4140HSA4184HSA4191HSA4192HSA4502HSC3201HSC3211HSC3243HSC4640HSC4910HSC4931HUS3321HUS3370HUS3570HUS4442HUS4561
20441
11919
123116257261695
213304169
101502244
21441
11919
128119270261696
214304169
102502244
1
1
1
414977
414978
Total 652 1,820
Academic Organization
Health Services Adm…
Community
All
FTIC Flag
All
Part Full Time
All
Gender
All
Academic Program Viability Report UD 2019-20 Page 129
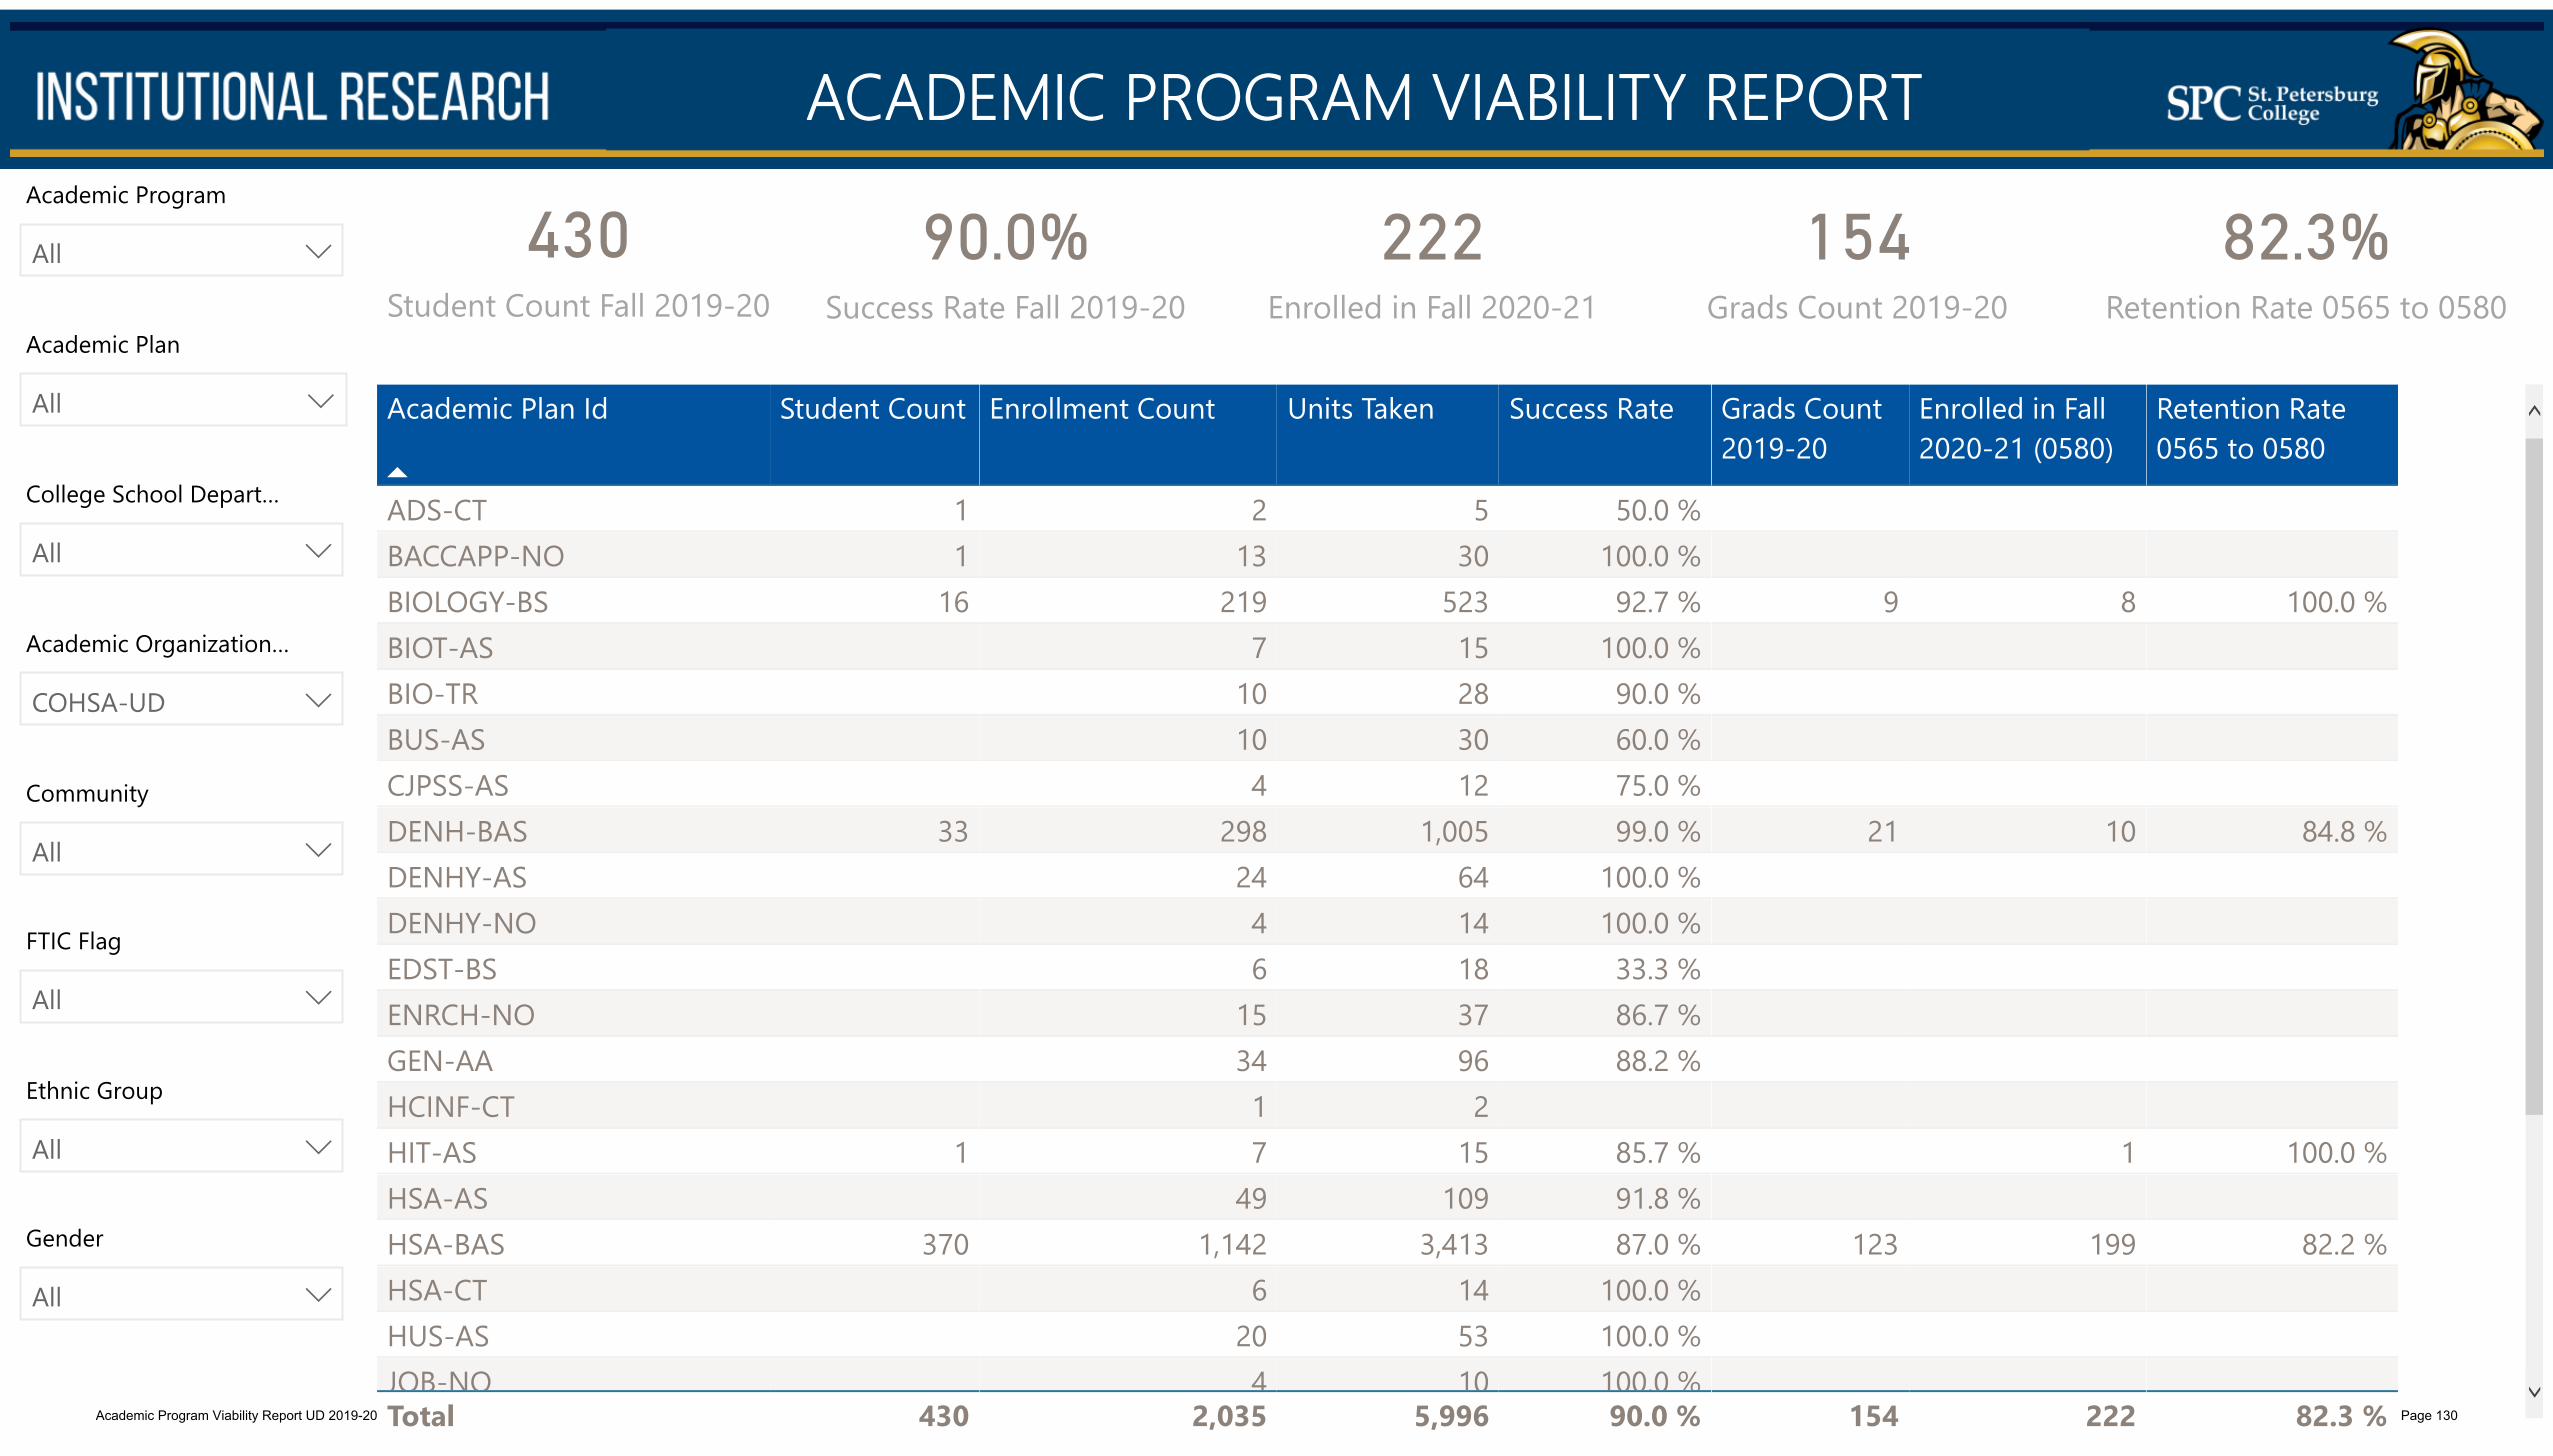
ACADEMIC PROGRAM VIABILITY REPORT
Academic Plan
All Academic Plan Id
Student Count Enrollment Count Units Taken Success Rate Grads Count2019-20
Enrolled in Fall2020-21 (0580)
Retention Rate0565 to 0580
ADS-CTBACCAPP-NOBIOLOGY-BSBIOT-ASBIO-TRBUS-ASCJPSS-ASDENH-BASDENHY-ASDENHY-NOEDST-BSENRCH-NOGEN-AAHCINF-CTHIT-ASHSA-ASHSA-BASHSA-CTHUS-ASJOB-NO
11
16
33 1
370
213
2197
10104
2982446
153417
491,142
6204
530
52315283012
1,00564141837962
15109
3,413145310
50.0 %100.0 %92.7 %
100.0 %90.0 %60.0 %75.0 %99.0 %
100.0 %100.0 %33.3 %86.7 %88.2 %
85.7 %91.8 %87.0 %
100.0 %100.0 %100.0 %
9
21
123
8
10 1
199
100.0 %
84.8 %
100.0 %
82.2 %
Total 430 2,035 5,996 90.0 % 154 222 82.3 %
82.3%Retention Rate 0565 to 0580
222Enrolled in Fall 2020-21
90.0%Success Rate Fall 2019-20
Academic Program
All
College School Depart…
All
Academic Organization…
COHSA-UD
Community
All
FTIC Flag
All
Ethnic Group
All
Gender
All
154Grads Count 2019-20
430Student Count Fall 2019-20
Academic Program Viability Report UD 2019-20 Page 130

ACADEMIC PROGRAM VIABILITY REPORTNumber of Grads and Number of Awards by Academic Year
0
50
100
2017 2018 2019
98
119
10398
119
103
Number of Grads Number of Awards
Student Count by Ethnic Group and Academic Year
0
20
40
60
2017 2018 2019
3 3
20 2217
5
12 12
7073
67
Student.Ethnic Group Asian Black/African American Hispanic/Latino White
Term
All
Program
All
Plan
HSA-BAS
Academic YearDegree
2017Numberof Grads
Numberof Awards
2018Numberof Grads
Numberof Awards
2019Numberof Grads
Numberof Awards
BASHSA-BAS
9898
9898
119119
119119
103103
103103
Total 98 98 119 119 103 103
Gender
All
Academic Program Viability Report UD 2019-20 Page 131

ACADEMIC PROGRAM VIABILITY REPORT
Academic Plan
All
82.4%Retention Rate 0535 to 0550
217Enrolled in Fall 2018-19
404Student Count Fall 2017-18
89.4%Success Rate Fall 2017-18
Academic Program
All
College School Depart…
All
Academic Organization…
COHSA-UD
Community
All
FTIC Flag
All
Ethnic Group
All
Gender
All
141Grads Count 2017-18
431Student Count Fall 2018-19
430Student Count Fall 2019-20
88.7%Success Rate Fall 2018-19
90.0%Success Rate Fall 2019-20
223Enrolled in Fall 2019-20
222Enrolled in Fall 2020-21
160Grads Count 2018-19
154Grads Count 2019-20
81%Retention Rate 0550 to 0565
82.4%Retention Rate 0565 to 0580
Academic Plan Id Retention Rate 0535 to 0550 Retention Rate 0550 to 0565 Retention Rate 0565 to 0580
BIOLOGY-BSCEONLYDENH-BASENRCH-NOHIT-ASHSA-ASHSA-BASPPA-BSRESC-AS
91.7 %
77.4 %
100.0 %82.7 %80.0 %
100.0 %
77.8 %
90.3 %66.7 %
100.0 %80.6 %77.8 %
100.0 %100.0 %84.8 %
100.0 %
82.2 %62.5 %
Total 82.4 % 81.0 % 82.4 %
Academic Program Viability Report UD 2019-20 Page 132

��������� ������ ������� ��������� ����� � ����� ����
�������������� ������� ��!���"��������������� ������� ��������� ����������� ���� ���# $�$
%&'()*+,-. /)012))3 4-)5(,6) %,.)1 7+8)(. 9+&( :::%)'(;& .&,1 1,.)%*<=>?1,-)11 :-.)@@,A)-;) B,-'-;,'@ :-2+(C'.,+- 7);(?,.C)-. '-3 D3C,11,+-1 = 5).',@1 %.?3)-. :-2+(C'.,+- EFGHIJF KJLMNOPFQMJ R SIFPQTUVWXYZ[V \]_]WZ [Wa[b[cd eYf]c g \Y]VYhc ijbb k-(+@@C)-.l*)(2+(C'-;)l*)(;)-. B?@@lm('3?'.)1l<+?(1) m(+?n1\Y]VYhc ijbb oYc][V p]Wfq <@'11 %.'.?1r stFQuIv wGTTv EFMx wGNFyIN zJNMTTOIJFv <@'11 D;'3)C,; m(+?nr {Sv |Sv <@'11 <+@@)A) %;&++@ 5)n. = D;'3)C,; m(+?n 5)1; = D;'3)C,; 4(A'-,}'.,+- = %?8~);. <'.'@+A /8(r ���EsR|S
\Y]VYhc ijbb oYc][V ad �h�c]jVc[hWb oYcqX ������� �������� ���� � ���� ������������ ����������� ����� ���������� ���� ��������� �¡¢¡£ ¤��¥������ ¦¥��� §¡§ §¡§���� ���� ��������� �¡¢¡£ �������� ¦¥���� ¥�� ��� ������� ���� ��������� �¡¢¡£ ©������ ���� ª«¬� ª«¬������® ���� ��������� �¡§�£ ¤��¥������ ¦¥��� §�� ¡ §������® ���� ��������� �¡§�£ �������� ¦¥���� ¥�� �� � ��������® ���� ��������� �¡§�£ ©������ ���� §§¬ª ��¬ª §�¬«������ ���� ��������� �¡§¡£ ¤��¥������ ¦¥��� �¢ �¢������ ���� ��������� �¡§¡£ �������� ¦¥���� ¥�� ª� ª������� ���� ��������� �¡§¡£ ©������ ���� ª¬¢ ª¬¢���� ���� ��������� �¡ª�£ ¤��¥������ ¦¥��� ª�� ª������ ���� ��������� �¡ª�£ �������� ¦¥���� ¥�� �°��ª �°��ª���� ���� ��������� �¡ª�£ ©������ ���� ª�¬ ª�¬ <@'11 %.'.?1r stFQuIv wGTTv EFMx wGNFyIN zJNMTTOIJFv <@'11 D;'3)C,; m(+?nr {Sv |Sv <@'11 <+@@)A) %;&++@ 5)n. = D;'3)C,; m(+?n 5)1; = D;'3)C,; 4(A'-,}'.,+- = %?8~);. <'.'@+A /8(r ���EsR|Sv B,@.)( )Cn.± (+01 '-3 ;+@?C-1
Academic Program Viability Report UD 2019-20 Page 133

��������� ������ ������� ��������� ����� � ����� ������
�������������� ������� ��!���"��������������� ������� ��������� ����������� ������ ���# $�$
%&'()*+,-. /)012))3 4-)5(,6) %,.)1 7+8)(. 9+&( :::%)'(;& .&,1 1,.)%*<=>?1,-)11 :-.)@@,A)-;) B,-'-;,'@ :-2+(C'.,+- 7);(?,.C)-. '-3 D3C,11,+-1 = 5).',@1 %.?3)-. :-2+(C'.,+- EFGHIJF KJLMNOPFQMJ R SIFPQTUVWXYZ[V \]_]WZ [Wa[b[cd eYf]c g hi]jY k]ifj l-(+@@C)-.m*)(2+(C'-;)m*)(;)-. B?@@mn('3?'.)1m<+?(1) n(+?o1hi]jY k]ifj pqrr stuv wxyz{wxwx |x}~}� ��u��� stuv wxyz{wxwx |x}�x� ��vvtu stuv wxyz{wxwx |x}�}� pqrr stuv wxwx{wxwy |x}�x��rq�� ���u�t �u��� { ����t�� �q�qr�� ��u�����r��q�t� ����t�� ����� ��v�tu �� �rq��t� �����r��q�t� ����t�� ����� ��v�tu �� �rq��t� �����r��q�t� ����t�� ����� ��v�tu �� �rq��t� �����r��q�t� ����t�� ����� ��v�tu �� �rq��t����w�wx y y <@'11 <+?(1) n(+?o� ��� �TQJQ�PT �MGN�I�� %.?3)-. �)(C <'())( 5)1; = *(+A('C 5)1; = *@'- 5)1; = %?8o@'- 5)1;� �IPTF� EIN Q�I� ¡HOQJQ�FNPFQMJ� <@'11 D;'3)C,; <'())(� ¢£¤S� B,@.)( )Co.¥ (+01 ¦ciXY§c ¦djcYZ hiaY eY]Yj©ªq�� «t�ut�¬ ®°±°²°² ³�µ�²® D9[Wa[b[cd eYf]c \]VYjj ¶ViZY§c ·�q��r�� «t��u� ¹u��t�� º���vt��D;'3)C,; »)'( = �)(C 5)1; = 9?@., B'@@ �)(C °²µ®=°²°² ¼²±½±¾� %o(,-A �)(C °¿<'Co?1 5)1;(,o.,+- D@@<'())( = *(+A('C = *@'- = %?8o@'- = 9?@., À)'@.& %)(6,;)1 D3C,-,1.('.,+-<+@@)A) = n(+?o = D;'3 4(A = %?8Á);. D@@<+?(1) :-1.(?;.,+-'@ 9).&+3 D@@%.?3)-. �¥o) ¼B�:<¾D@@DA) n(+?o D@@l.&-,; n(+?o D@@n)-3)(D@@<?1.+C <+&+(. D@@%.?3)-. n(+?o D@@Academic Program Viability Report UD 2019-20 Page 134

��������� ������ ������� ��������� ����� � ����� ������
�������������� ������� ��!���"��������������� ������� ��������� ����������� ������ ���# $�$
%&'()*+,-. /)012))3 4-)5(,6) %,.)1 7+8)(. 9+&( :::%)'(;& .&,1 1,.)%*<=>?1,-)11 :-.)@@,A)-;) B,-'-;,'@ :-2+(C'.,+- 7);(?,.C)-. '-3 D3C,11,+-1 = 5).',@1 %.?3)-. :-2+(C'.,+- EFGHIJF KJLMNOPFQMJ R SIFPQTUVWXYZ[V \]_]WZ [Wa[b[cd eYf]c g hi]jY k]ifj l-(+@@C)-.m*)(2+(C'-;)m*)(;)-. B?@@mn('3?'.)1m<+?(1) n(+?o1hi]jY k]ifj pqrr stuv wxyz{wxwx |x}~}� ��u��� stuv wxyz{wxwx |x}�x� ��vvtu stuv wxyz{wxwx |x}�}� pqrr stuv wxwx{wxwy |x}�x��rq�� ���u�t �u��� { ����t�� �q�qr�� ��u�����r��q�t� ����t�� ����� ��v�tu �� �rq��t� �����r��q�t� ����t�� ����� ��v�tu �� �rq��t� �����r��q�t� ����t�� ����� ��v�tu �� �rq��t� �����r��q�t� ����t�� ����� ��v�tu �� �rq��t����wz�x y y����zyx ~w � �z } �x }���wz�z y y <@'11 <+?(1) n(+?o� KJFINJ��Q� �MGN�I�� %.?3)-. �)(C <'())( 5)1; = *(+A('C 5)1; = *@'- 5)1; = %?8o@'- 5)1;� �IPTF� EIN Q¡I� ¢HOQJQ�FNPFQMJ� <@'11 D;'3)C,; <'())(� £¤¥S� B,@.)( )Co.¦ (+01 §ciXYc §djcYZ hiaY eY©]Yjª«q�� ¬t�ut�® °±²°±³±³ �µ¶�³ D9[Wa[b[cd eYf]c \]VYjj ·ViZYc �q��r��¹ ¬t��u� ºu��t�� »���vt��D;'3)C,; ¼)'( = �)(C 5)1; = 9?@., B'@@ �)(C ±³¶=±³±³ ½³²¾²¿� %o(,-A �)(C ±À<'Co?1 5)1;(,o.,+- D@@<'())( = *(+A('C = *@'- = %?8o@'- = 9?@., Á)'@.& %)(6,;)1 D3C,-,1.('.,+-<+@@)A) = n(+?o = D;'3 4(A = %?8Â);. D@@<+?(1) :-1.(?;.,+-'@ 9).&+3 D@@%.?3)-. �¦o) ½B�:<¿D@@DA) n(+?o D@@l.&-,; n(+?o D@@n)-3)(D@@<?1.+C <+&+(. D@@%.?3)-. n(+?o D@@Academic Program Viability Report UD 2019-20 Page 135

Industry Certification Attainment
An industry certification or equivalent state or national exam has not been identified for the Health Services Administration, BAS program for evidence of certification attainment at the baccalaureate level. Students pursuing the Respiratory Care track were required to complete the advanced practitioner’s exam through the National Board for Respiratory Care prior to enrollment.
Academic Program Viability Report UD 2019-20 Page 136

2019-20 Placement Data
*Refers to graduates found to be employed full-time or part-time.
COHSA BAS Pool Count Percent Placed 2014-15 106 78% 2015-16 72 82% 2016-17 75 83% 2017-18 100 77%
Source: http://www.fldoe.org/accountability/fl-edu-training-placement-info-program/fl-college-system-reports.stml
Academic Program Viability Report UD 2019-20 Page 137

Table 1 Growth for Medical and health services managers
Jobs (2019) Median Earnings National 394,910 $48.55/hr
Florida NA $44.62/hr
Pinellas County 3,590 $47.29/hr
Source: U.S. Department of Labor, Bureau of Labor Statistics https://www.bls.gov/oes/tables.htm
Academic Program Viability Report UD 2019-20 Page 138

Perkins Completion & Non-Traditional Completion Performance
Perkins completion metrics do not apply to baccalaureate programs.
Academic Program Viability Report UD 2019-20 Page 139
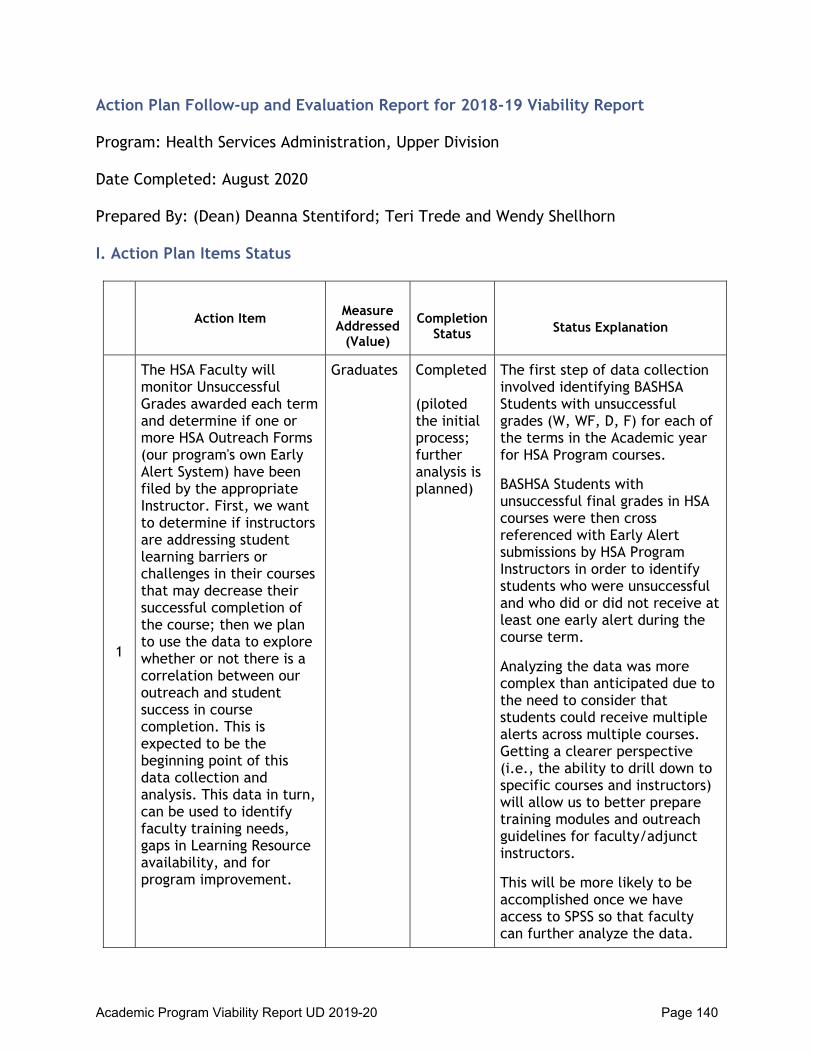
Action Plan Follow-up and Evaluation Report for 2018-19 Viability Report Program: Health Services Administration, Upper Division Date Completed: August 2020 Prepared By: (Dean) Deanna Stentiford; Teri Trede and Wendy Shellhorn I. Action Plan Items Status
Action Item
Measure
Addressed (Value)
Completion
Status
Status Explanation
1
The HSA Faculty will monitor Unsuccessful Grades awarded each term and determine if one or more HSA Outreach Forms (our program's own Early Alert System) have been filed by the appropriate Instructor. First, we want to determine if instructors are addressing student learning barriers or challenges in their courses that may decrease their successful completion of the course; then we plan to use the data to explore whether or not there is a correlation between our outreach and student success in course completion. This is expected to be the beginning point of this data collection and analysis. This data in turn, can be used to identify faculty training needs, gaps in Learning Resource availability, and for program improvement.
Graduates Completed (piloted the initial process; further analysis is planned)
The first step of data collection involved identifying BASHSA Students with unsuccessful grades (W, WF, D, F) for each of the terms in the Academic year for HSA Program courses.
BASHSA Students with unsuccessful final grades in HSA courses were then cross referenced with Early Alert submissions by HSA Program Instructors in order to identify students who were unsuccessful and who did or did not receive at least one early alert during the course term.
Analyzing the data was more complex than anticipated due to the need to consider that students could receive multiple alerts across multiple courses. Getting a clearer perspective (i.e., the ability to drill down to specific courses and instructors) will allow us to better prepare training modules and outreach guidelines for faculty/adjunct instructors.
This will be more likely to be accomplished once we have access to SPSS so that faculty can further analyze the data.
Academic Program Viability Report UD 2019-20 Page 140

Action Item
Measure
Addressed (Value)
Completion
Status
Status Explanation
2
The HSA team will develop an Orientation Effectiveness Survey to determine the effectiveness of the current HSA BAS Online Orientation, and to identify strategies or resources to improve student readiness for HSA 4184, the Program's foundation course, and enhance students' acclimation to upper division, online, 8 week course structure. The data collected from this item will then be used for continuous improvement in our Orientation approach for students coming into the program.
Course Success/W-WF-D-F Rates
Not completed
The Orientation Survey was developed by Faculty. It was not loaded into courses until the program/advisor held multiple Orientation sessions. The development process was slowed by the low turnout in initial orientation sessions. The orientation sessions were key to survey development given that some questions are geared toward measuring students’ perception of the value and effectiveness of the orientation process. Another factor that slowed the process was the introduction of a new HSA specific Student Affairs Advisor. Faculty worked with the advisor to plan and develop Orientation sessions as the first step in the process. The survey is currently in the piloting phase and is expected to be revised.
3
HSA Faculty will design and create new Instructor and Mentor Evaluations that will more clearly target important competencies for career readiness, as stressed by our Advisory Committee and our Capstone mentors/partners. This data can be used for continuous improvement in our course offerings, content, and student preparation for their Capstone Experience.
Graduates Completed Both evaluations were revised to align more closely with Program Goals and to focus more closely with indicators of student readiness for the professional work environment.
Academic Program Viability Report UD 2019-20 Page 141

II. Non-Completed Action Plan Items and Plan for Completion
Action Item
Completion
Date
Plan for Completion
2
The HSA team will develop an Orientation Effectiveness Survey to determine the effectiveness of the current HSA BAS Online Orientation, and to identify strategies or resources to improve student readiness for HSA 4184, the Program's foundation course, and enhance students' acclimation to upper division, online, 8 week course structure. The data collected from this item will then be used for continuous improvement in our Orientation approach for students coming into the program.
Summer 2021 This action item will continue to evolve as we move forward. The survey was initially piloted in Summer 2020, after reinstituting HSA Orientation Sessions with a new HSA Case Manager/Advisor. It was revised and will be piloted once again for Fall 8 week 2. Faculty anticipate that further revisions may be needed for the Spring 2021 term in order to finalize the design that will allow for the most efficient and effective data collection.
III. Evaluation of the Impact of Action Plans on Program Quality Analysis of data regarding Early Alerts and Unsuccessful Attempts has led to identification of a need to further enhance Instructor use of Early Alerts, i.e., guidelines for submission, timing of submissions, completeness of information regarding students’ intervention needs/retention strategies for success. Further analysis of data will be done once Faculty have access to SPSS for more in-depth exploration of the data. This in turn will provide guidance for design and creation of professional development opportunities and tools. Data will be used to design a professional development/training module for all HSA Program Instructors/Faculty.
Academic Program Viability Report UD 2019-20 Page 142

St. Petersburg College
Program Goals and Strategies Program: Health Services Administration, Upper Division Date Completed: 11/17/2020 Due Date: August 2021 Prepared By: Dr. Teri A. Trede I. Goals
Program Goals SPC Commitment Pillar
1
90% of students enrolled in the HSA BAS Capstone course successfully complete the course with a B or better. Rationale: HSA BAS students often enroll in the program in pursuit of a BAS degree as there is an increasing trend in the requirement of a Baccalaureate degree as a minimum standard for entry level positions in health care and human services. In addition, many HSA BAS students are seeking the BAS as means to expand their knowledge base and skill set as well as qualify for promotion into management positions with their current employer. The ability to leverage their current experience in a way that maximizes their employment opportunity allows for upward mobility in their career as well as build seniority in their work environment.
Economic Mobility
2
Increase the percentage of students who earn a B or better in the foundation course, HSA 4184 Leadership in Health & Human Services course. The assumption is that starting the program with a solid foundation (a minimum of moderate success in the first course) will increase the likelihood of success in future program courses. This may also improve the likelihood of retention in following terms.
Academic Excellence
II. Strategies
Strategies to be Implemented Viability Metric Target Outcome
Goal # Responsible Individuals
1
Our strategies will include the introduction of mandatory Pre-Capstone and Capstone orientation sessions to better prepare students for their Capstone Experience. We will also seek guidance from the HSA Advisory Committee to ensure that curricula align with current industry trends. We will continue to assist students in the development of their evidence-based Learning Contracts that represent real-world situations that align with their career path.
Graduates: To increase successful completion of the Capstone course by 2% from the previous academic year.
1 Dr. Teri Trede Dr. Wendy Shellhorn
Academic Program Viability Report UD 2019-20 Page 143

St. Petersburg College
Strategies to be Implemented Viability Metric Target Outcome
Goal # Responsible Individuals
2
Early alerts and library referrals filed by 4184 instructors; Orientation/advising/MLP completion session with the HSA Advisor; continue to analyze data produced by the Readiness for Upper Division survey completed by HSA 4184 students to monitor need for course revisions or orientation adjustments.
Course Success/W-WF-F Rates: Increase by 3% over the average of A/B grades earned in the previous academic year.
2 Dr. Teri Trede Dr. Wendy Shellhorn
III. Special Resources Needed: Access to data; continued access to a dedicated advisor for HSA BAS (for MLP and advising/counseling).
IV. Area(s) of Concern/Improvement: None.
Academic Program Viability Report UD 2019-20 Page 144

ACADEMIC PROGRAM VIABILITY REPORTStudent Count by Academic Year
0
200
400
600
800
2017 2018 2019 2020
760709 726
682
SSH By Campus
Campus 2017
2018
2019
2020
Health Education CenterOnline
10,555
9,775
8,784806
8,221
Total 10,555 9,775 9,590 8,221
Student Count by Ethnic Group and Academic Year
0
200
400
2017 2018 2019 2020
43 38 50 4774 81 91 9894 93 99 96
505
454 439
399
Ethnic Group Asian Black/African American Hispanic/Latino White
Success Rate by Academic Year
0%
50%
100%
2017 2018 2019 2020
96.6% 95.2% 95.7%90.8%
Term
All
Program
All
Plan
All
College School Depart…
All
Success Rate By Course
Academic YearSubject
2017StudentCount
EnrollmentCount
SucRate
NSP3276NSP3289NSP3477NSP3685NUR3066NUR3125NUR3145NUR3178NUR3655NUR3805NUR3826NUR3874NUR3905NUR4169NUR4606NUR4636NUR4636LNUR4835NUR4835L
126242443
2572494634
232258261263
1261244270272277278
126242443
2582514634
233260263265
1262244271273277279
9109999999999
10999999
Total 760 3,434 9
Academic Organization
Nursing - UD
Community
All
FTIC Flag
All
Part Full Time
All
Gender
All
Academic Program Viability Report UD 2019-20 Page 145

ACADEMIC PROGRAM VIABILITY REPORT
Academic Plan
All Academic Plan Id Student Count Enrollment Count
Units Taken Success Rate Grads Count2019-20
Enrolled in Fall2020-21 (0580)
Retention Rate0565 to 0580
NURS-BSNURSE-ASGEN-AAENRCH-NOHSA-BASENVSC-ASHSA-TRHSA-ASNRS-NO
531 3 11
1,39081181673311
4,3153335841227933
95.7 %100.0 %94.4 %
100.0 %71.4 %
100.0 %100.0 %
100.0 %
236 1
250
89.5 %
33.3 %
Total 536 1,520 4,791 95.8 % 237 250 88.8 %
88.8%Retention Rate 0565 to 0580
250Enrolled in Fall 2020-21
95.8%Success Rate Fall 2019-20
Academic Program
All
College School Depart…
All
Academic Organization…
NURSE-UD
Community
All
FTIC Flag
All
Ethnic Group
All
Gender
All
237Grads Count 2019-20
536Student Count Fall 2019-20
Academic Program Viability Report UD 2019-20 Page 146

ACADEMIC PROGRAM VIABILITY REPORTNumber of Grads and Number of Awards by Academic Year
0
100
200
300
2017 2018 2019
280
237 226
280
237 226
Number of Grads Number of Awards
Student Count by Ethnic Group and Academic Year
0
50
100
150
200
2017 2018 2019
1710 13
30 27 2434 30 30
185
157144
Student.Ethnic Group Asian Black/African American Hispanic/Latino White
Term
All
Program
All
Plan
NURS-BS
Academic YearDegree
2017Numberof Grads
Numberof Awards
2018Numberof Grads
Numberof Awards
2019Numberof Grads
Numberof Awards
BSNURS-BS
280280
280280
237237
237237
226226
226226
Total 280 280 237 237 226 226
Gender
All
Academic Program Viability Report UD 2019-20 Page 147

ACADEMIC PROGRAM VIABILITY REPORT
Academic Plan
All
90.9%Retention Rate 0535 to 0550
284Enrolled in Fall 2018-19
615Student Count Fall 2017-18
96.5%Success Rate Fall 2017-18
Academic Program
All
College School Depart…
All
Academic Organization…
NURSE-UD
Community
All
FTIC Flag
All
Ethnic Group
All
Gender
All
284Grads Count 2017-18
558Student Count Fall 2018-19
536Student Count Fall 2019-20
95.5%Success Rate Fall 2018-19
95.8%Success Rate Fall 2019-20
251Enrolled in Fall 2019-20
250Enrolled in Fall 2020-21
239Grads Count 2018-19
237Grads Count 2019-20
86.2%Retention Rate 0550 to 0565
88.8%Retention Rate 0565 to 0580
Academic Plan Id Retention Rate 0535 to 0550 Retention Rate 0550 to 0565 Retention Rate 0565 to 0580
ENRCH-NOHSA-BASNURS-BS
90.9 %
100.0 %86.3 %
33.3 %
89.5 %Total 90.9 % 86.2 % 88.8 %
Academic Program Viability Report UD 2019-20 Page 148

��������� ������ ������� ��������� ����� � ����� ����
�������������� ������� ��!���"��������������� ������� ��������� ����������� ���� ���# $�$
%&'()*+,-. /)012))3 4-)5(,6) %,.)1 7+8)(. 9+&( :::%)'(;& .&,1 1,.)%*<=>?1,-)11 :-.)@@,A)-;) B,-'-;,'@ :-2+(C'.,+- 7);(?,.C)-. '-3 D3C,11,+-1 = 5).',@1 %.?3)-. :-2+(C'.,+- EFGHIJF KJLMNOPFQMJ R SIFPQTUVWXYZ[V \]_]WZ [Wa[b[cd eYf]c g \Y]VYhc ijbb k-(+@@C)-.l*)(2+(C'-;)l*)(;)-. B?@@lm('3?'.)1l<+?(1) m(+?n1\Y]VYhc ijbb oYc][V p]Wfq <@'11 %.'.?1r stFQuIv wGTTv EFMx wGNFyIN zJNMTTOIJFv <@'11 D;'3)C,; m(+?nr {Sv |Sv <@'11 <+@@)A) %;&++@ 5)n. = D;'3)C,; m(+?n 5)1; = D;'3)C,; 4(A'-,}'.,+- = %?8~);. <'.'@+A /8(r �|�EzR|S
\Y]VYhc ijbb oYc][V ad �h�c]jVc[hWb oYcqX ������� �������� ���� � ���� ������������ � ������������ ���������� ���� ��������� ������ ��������� ¡���� �¢£¤¥ ��� �¢�¤¤���� ���� ��������� ������ ¦������� ¡����� §��� �¢¥�¥ £�� �¢������� ���� ��������� ������ ������ ���� �¥©�ª �¥©�ª �¥©¥ª¦«���¬ ���� ��������� ����� ��������� ¡���� �¢�� ��� ��¤¦«���¬ ���� ��������� ����� ¦������� ¡����� §��� �¢£¥¥ ��¥ �¢�¤�¦«���¬ ���� ��������� ����� ������ ���� ��©�ª �¤©�ª ¤¤©ª¦����� ���� ��������� ����� ��������� ¡���� ��� ¤¤ ¥£�¦����� ���� ��������� ����� ¦������� ¡����� §��� ��� �� ¥��¦����� ���� ��������� ����� ������ ���� �¥©�ª ��©ª �¥©ª���� ���� ��������� ���¤�� ��������� ¡���� �¢�� �£� �¢������ ���� ��������� ���¤�� ¦������� ¡����� §��� �¢¥�¤ ��� �¢������� ���� ��������� ���¤�� ������ ���� ���©�ª ���©£ª ���©¥ª <@'11 %.'.?1r stFQuIv wGTTv EFMx wGNFyIN zJNMTTOIJFv <@'11 D;'3)C,; m(+?nr {Sv |Sv <@'11 <+@@)A) %;&++@ 5)n. = D;'3)C,; m(+?n 5)1; = D;'3)C,; 4(A'-,}'.,+- = %?8~);. <'.'@+A /8(r �|�EzR|Sv B,@.)( )Cn.® (+01 '-3 ;+@?C-1
Academic Program Viability Report UD 2019-20 Page 149

Course Groups
An internship course has not been identified for the Nursing program at the baccalaureate degree level.
Academic Program Viability Report UD 2019-20 Page 150

Industry Certification Attainment
An industry certification or equivalent state or national exam has not been identified for the Nursing, BS program for evidence of certification attainment at the baccalaureate level. All students in the BS program were required to complete the National Council Licensure Examination (NCLEX®) prior to enrolling in the program.
Academic Program Viability Report UD 2019-20 Page 151

2019-20 Placement Data
*Refers to graduates found to be employed full-time or part-time.
Source: http://www.fldoe.org/accountability/fl-edu-training-placement-info-program/fl-college-system-reports.stml
NURSE BS Pool Count Percent Placed 2014-15 326 88% 2015-16 367 88% 2016-17 282 84% 2017-18 309 87%
Academic Program Viability Report UD 2019-20 Page 152

Table 1 Growth for Registered Nurses
Jobs (2019) Median Earnings National 2,982,280 $35.24/hr
Florida 181,670 $31.65/hr
Pinellas County 30,390 $32.57/hr
Source: U.S. Department of Labor, Bureau of Labor Statistics https://www.bls.gov/oes/tables.htm
Academic Program Viability Report UD 2019-20 Page 153

Perkins Completion & Non-Traditional Completion Performance
Perkins completion metrics do not apply to baccalaureate programs.
Academic Program Viability Report UD 2019-20 Page 154

Action Plan Follow-up and Evaluation Report for 2018-19 Viability Report Program: Nursing, Upper Division Date Completed: August 2020 Prepared By: Louisana Louis I. Action Plan Items Status
Action Item
Measure
Addressed (Value)
Completion
Status
Status Explanation
1
Implement new strategies to increase enrollment in RN-BSN program. This item was carried forward from the 2017-18 Action Plan.
Unduplicated Headcount
Not Completed
Hired a BSN coordinator through the Shafer’s grant to support marketing to increase enrollment.
2
Implement new curricular changes.
Course Success/W-WF-F Rates
Fall 2020 New curriculum implemented. Required core courses changed from 40 to 32 credits.
II. Non-Completed Action Plan Items and Plan for Completion
Action Item
Completion
Date
Plan for Completion
1
Implement new strategies to increase enrollment in RN-BSN program. This item was carried forward from the 2017-18 Action Plan.
Summer 2021 Continued challenge. Hired a grant funded RN to BSN coordinator. Assistant Dean, Dr. Owen is working on a recruitment plan.
III. Evaluation of the Impact of Action Plans on Program Quality In order for the program to remain viable, changes were required to remain competitive.
Academic Program Viability Report UD 2019-20 Page 155

St. Petersburg College
Program Goals and Strategies Program: Nursing, Upper Division Date Completed: 1/14/2021 Due Date: August 2021 Prepared By: Louisana Louis I. Goals
Program Goals SPC Commitment Pillar
1 Implement new strategies to increase enrollment in the RN-BSN program. Community Engagement 2 Prepare for a successful accreditation Fall 21. Academic Excellence
II. Strategies
Strategies to be Implemented Viability Metric Target Outcome
Goal # Responsible Individuals
1
1. include the topic in the student affairs committee agenda. 2. Discuss how faculty can contribute to this effort and create innovative strategies. 3. Include Reney (grant-funded RN to BSN coordinator) & Annessa (Recruiter for HEC) in the discussion.
SSH Enrollment: Increase enrollment by 2%.
1 BSN Faculty, Deans, BSN
coordinator & the HEC recruiter
2
1. Prepare & finalize self-study. 2. Create a plan with a timeline from January- November to include due dates. 3. Hire a consultant. 4. Implement the plan, meet deadlines, and correct deficiencies identified.
No Metric Selected: Successful accreditation.
2 Deans, BSN Faculty
III. Special Resources Needed: Accreditation budget to be included in this academic year budget.
IV. Area(s) of Concern/Improvement: N/A
Academic Program Viability Report UD 2019-20 Page 156

ACADEMIC PROGRAM VIABILITY REPORTStudent Count by Academic Year
0
100
200
300
2017 2018 2019 2020
294
250
191
145
SSH By Campus
Campus 2017
2018
2019
2020
Clearwater CampusHealth Education Center
2,223
181,922
1,704
1,158
Total 2,223 1,940 1,704 1,158
Student Count by Ethnic Group and Academic Year
0
50
100
150
200
2017 2018 2019 2020
6 5 1 1714 8 2
41 3825
18
216
181
147
112
Ethnic Group Asian Black/African American Hispanic/Latino White
Success Rate by Academic Year
0%
50%
100%
2017 2018 2019
86.2% 86.5%90.4%
Term
All
Program
All
Plan
All
College School Depart…
All
Success Rate By Course
Academic YearSubject
2017StudentCount
EnrollmentCount
SuRa
ANS3006ANS3440ATE3052ATE3100ATE3200ATE3316ATE3344ATE3410ATE3510ATE3515ATE3601ATE3605ATE3615ATE3616ATE3617ATE3658ATE3744ATE3803ATE3914ATE4000ATE4051ATE4317ATE4319
6855
5650243910231417543929284145173237
6855
5951243910231417554030284146173337
92714
92714
Total 294 845
Academic Organization
Veterinary Technolo…
Community
All
FTIC Flag
All
Part Full Time
All
Gender
All
Academic Program Viability Report UD 2019-20 Page 157

ACADEMIC PROGRAM VIABILITY REPORT
Academic Plan
All Academic Plan Id Student Count Enrollment Count
Units Taken Success Rate Grads Count2019-20
Enrolled in Fall2020-21 (0580)
Retention Rate0565 to 0580
BIOLOGY-BSVETTC-BASVETTC-ASGEN-AAENRCH-NOTRANS-NOVETTC-CTBIO-TRHSA-ASBUS-ASCST-ASDIG-ASENVSC-ASCHW-CTHSA-BASVETT-NOBACCAPP-NOCRIM-TRHMGT-ASMGTORG-BAS
25891 57 11
26022532131211109744332221111
623665543935293023171210976663333
88.1 %92.0 %93.8 %92.3 %
100.0 %100.0 %100.0 %100.0 %57.1 %
100.0 %
50.0 %100.0 %100.0 %100.0 %100.0 %
11231 5
1359
2 11
84.0 %87.6 %
100.0 %
100.0 %
100.0 %100.0 %
Total 129 604 1,592 88.7 % 40 76 84.5 %
84.5%Retention Rate 0565 to 0580
76Enrolled in Fall 2020-21
88.7%Success Rate Fall 2019-20
Academic Program
All
College School Depart…
All
Academic Organization…
VETTEC-UD
Community
All
FTIC Flag
All
Ethnic Group
All
Gender
All
40Grads Count 2019-20
129Student Count Fall 2019-20
Academic Program Viability Report UD 2019-20 Page 158
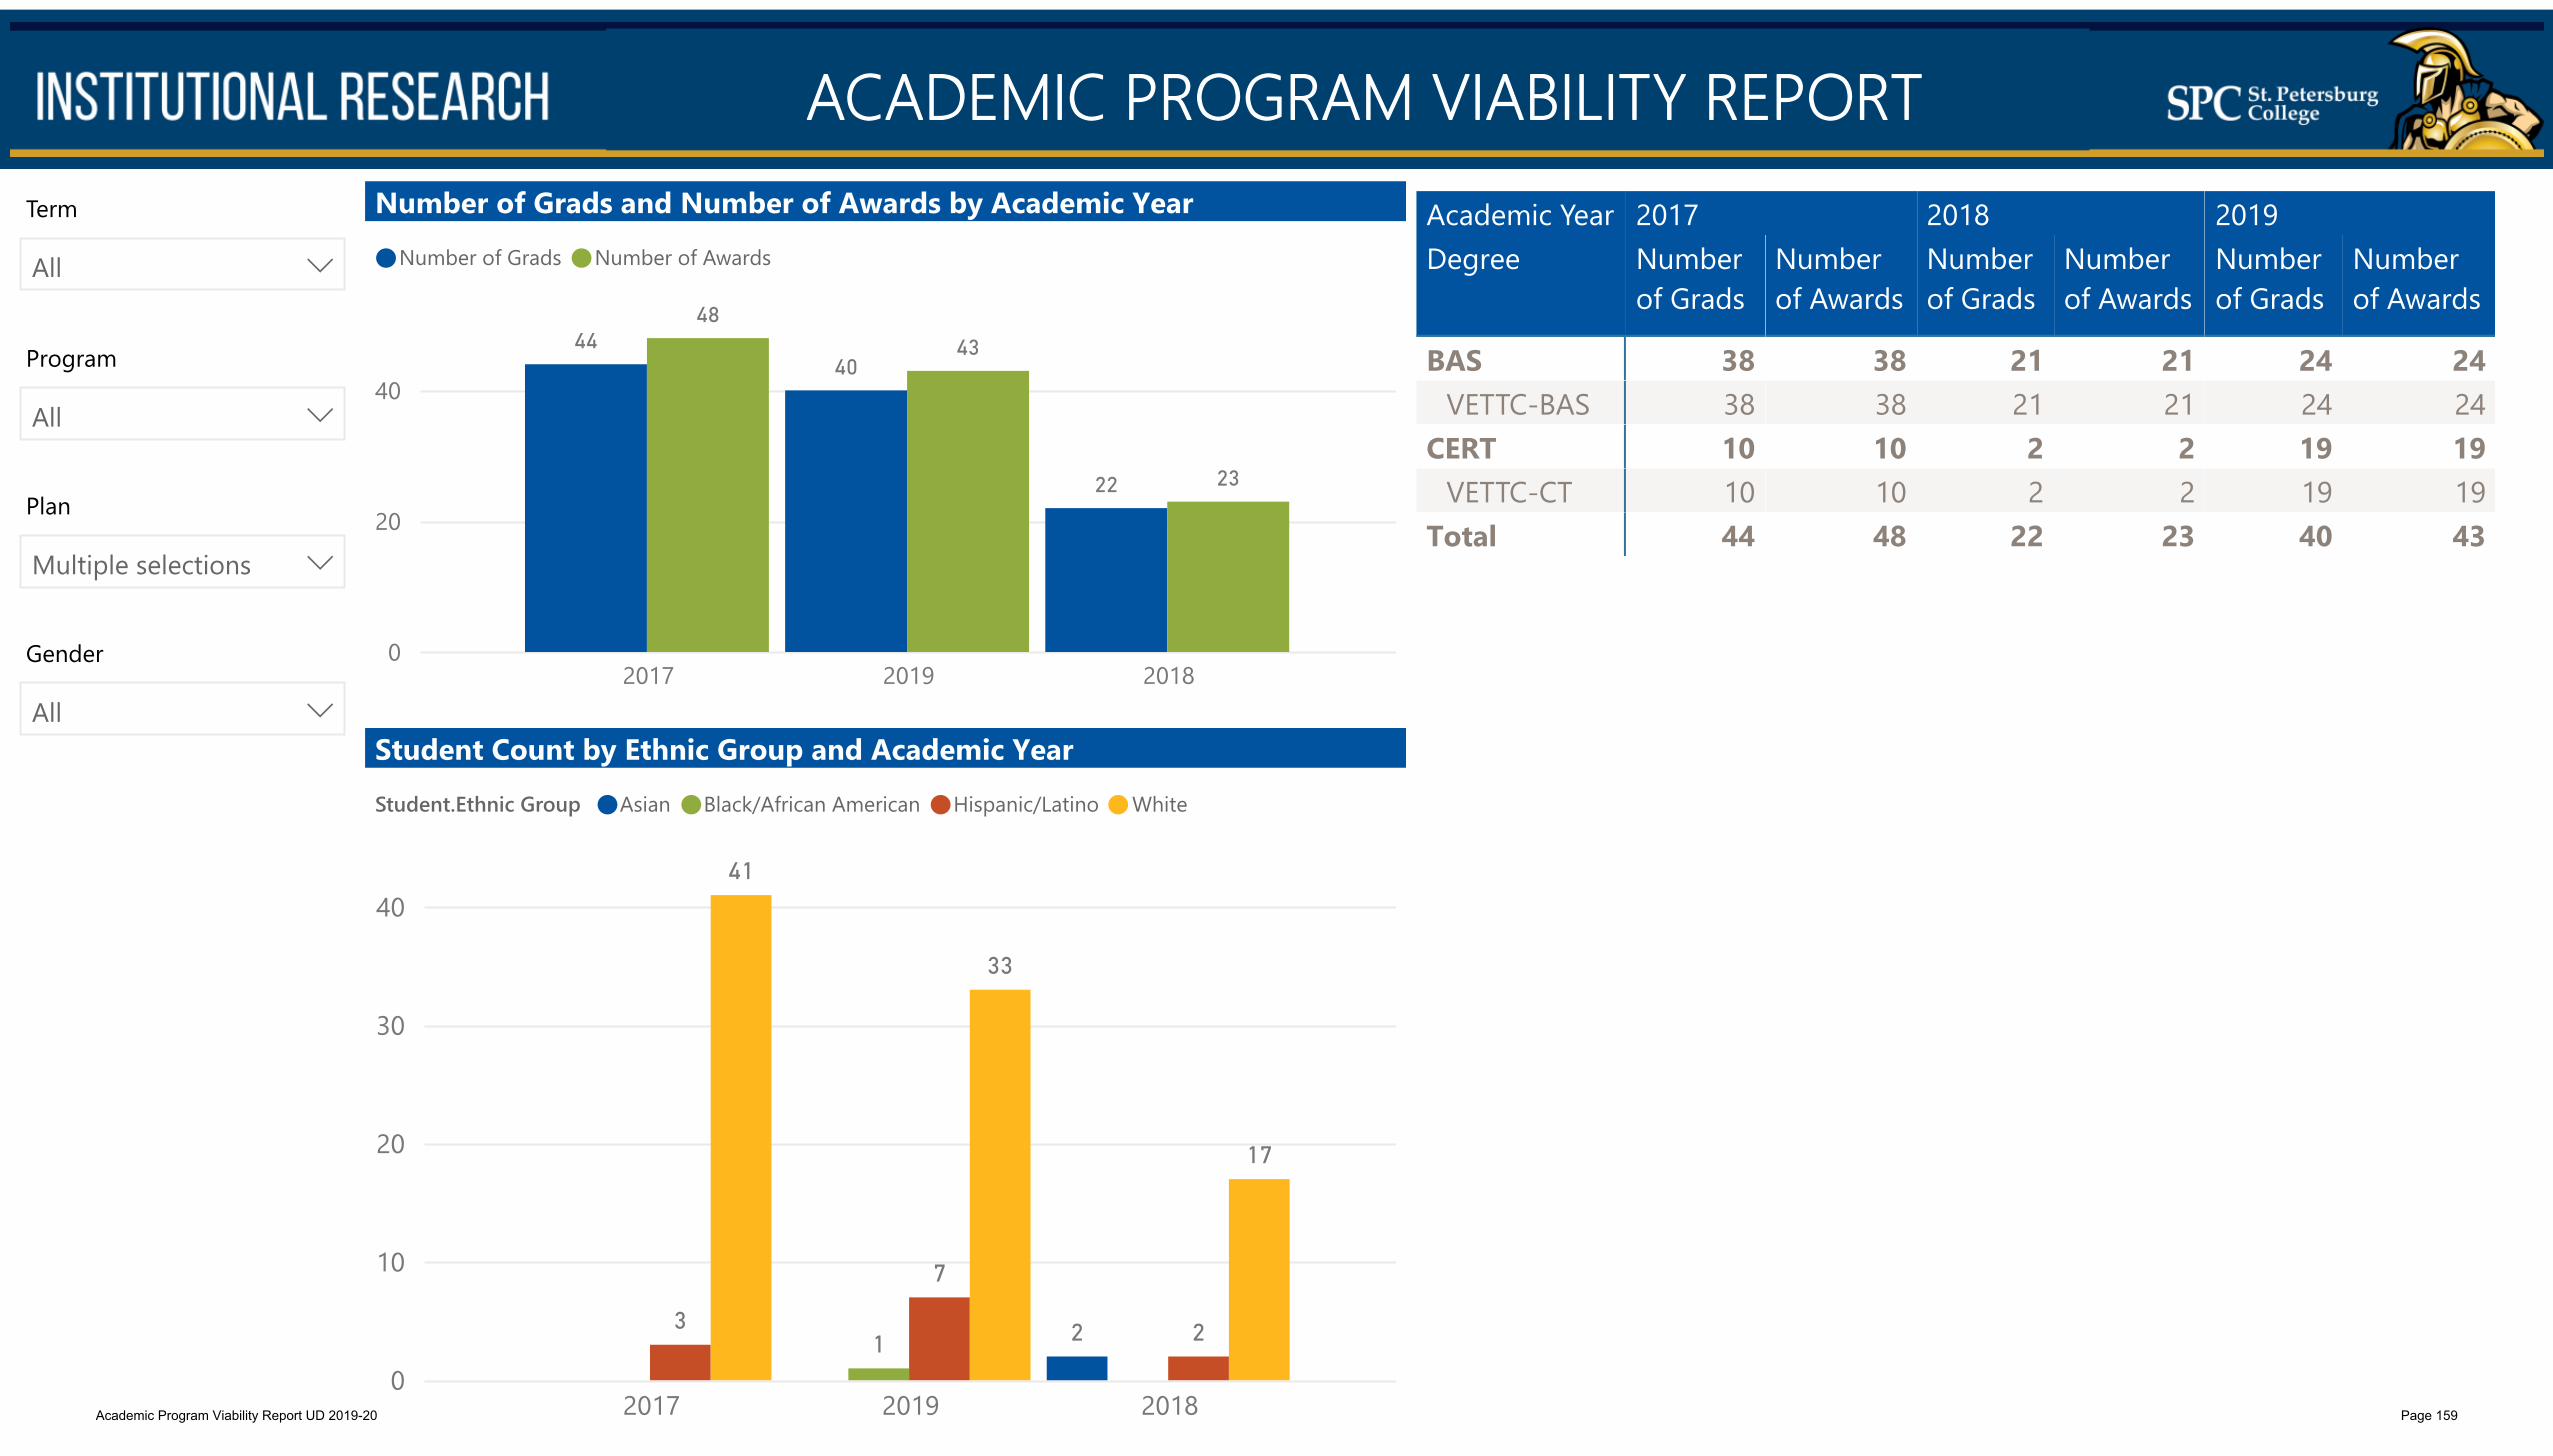
ACADEMIC PROGRAM VIABILITY REPORTNumber of Grads and Number of Awards by Academic Year
0
20
40
2017 2019 2018
4440
22
4843
23
Number of Grads Number of Awards
Student Count by Ethnic Group and Academic Year
0
10
20
30
40
2017 2019 2018
213
7
2
41
33
17
Student.Ethnic Group Asian Black/African American Hispanic/Latino White
Term
All
Program
All
Plan
Multiple selections
Academic YearDegree
2017Numberof Grads
Numberof Awards
2018Numberof Grads
Numberof Awards
2019Numberof Grads
Numberof Awards
BASVETTC-BAS
CERTVETTC-CT
38381010
38381010
212122
212122
24241919
24241919
Total 44 48 22 23 40 43
Gender
All
Academic Program Viability Report UD 2019-20 Page 159

ACADEMIC PROGRAM VIABILITY REPORT
Academic Plan
All
71.6%Retention Rate 0535 to 0550
84Enrolled in Fall 2018-19
183Student Count Fall 2017-18
87.7%Success Rate Fall 2017-18
Academic Program
All
College School Depart…
All
Academic Organization…
VETTEC-UD
Community
All
FTIC Flag
All
Ethnic Group
All
Gender
All
53Grads Count 2017-18
171Student Count Fall 2018-19
129Student Count Fall 2019-20
84.3%Success Rate Fall 2018-19
88.7%Success Rate Fall 2019-20
83Enrolled in Fall 2019-20
76Enrolled in Fall 2020-21
44Grads Count 2018-19
40Grads Count 2019-20
71.9%Retention Rate 0550 to 0565
84.5%Retention Rate 0565 to 0580
Academic Plan Id Retention Rate 0535 to 0550 Retention Rate 0550 to 0565 Retention Rate 0565 to 0580
BACCAPP-NOBIOLOGY-BSCHW-CTCRIM-TRENRCH-NOGEN-AAHSA-ASVETTC-ASVETTC-BASVETTC-CTVETT-NO
50.0 %87.5 %
33.3 %66.7 %
100.0 %
76.0 %75.0 %
81.8 %
100.0 %100.0 %33.3 %
100.0 %
74.5 %57.1 %
100.0 %84.0 %
100.0 %87.6 %
100.0 %100.0 %
Total 71.6 % 71.9 % 84.5 %
Academic Program Viability Report UD 2019-20 Page 160

��������� ������ ������� ��������� ����� � ����� ����
�������������� ������� ��!���"��������������� ������� ��������� ����������� ���� ���# $�$
%&'()*+,-. /)012))3 4-)5(,6) %,.)1 7+8)(. 9+&( :::%)'(;& .&,1 1,.)%*<=>?1,-)11 :-.)@@,A)-;) B,-'-;,'@ :-2+(C'.,+- 7);(?,.C)-. '-3 D3C,11,+-1 = 5).',@1 %.?3)-. :-2+(C'.,+- EFGHIJF KJLMNOPFQMJ R SIFPQTUVWXYZ[V \]_]WZ [Wa[b[cd eYf]c g \Y]VYhc ijbb k-(+@@C)-.l*)(2+(C'-;)l*)(;)-. B?@@lm('3?'.)1l<+?(1) m(+?n1\Y]VYhc ijbb oYc][V p]Wfq <@'11 %.'.?1r stFQuIv wGTTv EFMx wGNFyIN zJNMTTOIJFv <@'11 D;'3)C,; m(+?nr {Sv |Sv <@'11 <+@@)A) %;&++@ 5)n. = D;'3)C,; m(+?n 5)1; = D;'3)C,; 4(A'-,}'.,+- = %?8~);. <'.'@+A /8(r �z��z�R|S
\Y]VYhc ijbb oYc][V ad �h�c]jVc[hWb oYcqX ������� �������� ���� � ���� ������������ ����������� ����� ���������� ���� ��������� �¡¢¡£ ¤��¥������ ¦¥��� �§¢ � �§���� ���� ��������� �¡¢¡£ �������� ¦¥���� ©¥�� §¢¡ � §����� ���� ��������� �¡¢¡£ ª������ ���� ¢«¬ ®«§ ¢®«¢����� ���� ��������� �¡¬�£ ¤��¥������ ¦¥��� ��� ® �������� ���� ��������� �¡¬�£ �������� ¦¥���� ©¥�� §�� � §�¡����� ���� ��������� �¡¬�£ ª������ ���� ¢�«¡ §§«§ ¢�«¢������ ���� ��������� �¡¬¡£ ¤��¥������ ¦¥��� �� � ��§������ ���� ��������� �¡¬¡£ �������� ¦¥���� ©¥�� ��¢ � �¬������� ���� ��������� �¡¬¡£ ª������ ���� �«� «� ¡«����� ���� ��������� �¡®�£ ¤��¥������ ¦¥��� ��§ � ������� ���� ��������� �¡®�£ �������� ¦¥���� ©¥�� §�¡ �� ��§���� ���� ��������� �¡®�£ ª������ ���� ¬§«� ®«§ ¬¡«® <@'11 %.'.?1r stFQuIv wGTTv EFMx wGNFyIN zJNMTTOIJFv <@'11 D;'3)C,; m(+?nr {Sv |Sv <@'11 <+@@)A) %;&++@ 5)n. = D;'3)C,; m(+?n 5)1; = D;'3)C,; 4(A'-,}'.,+- = %?8~);. <'.'@+A /8(r �z��z�R|Sv B,@.)( )Cn.° (+01 '-3 ;+@?C-1
Academic Program Viability Report UD 2019-20 Page 161
Course Groups
An internship course has not been identified for the Veterinary Technology program at the
baccalaureate degree level.
Academic Program Viability Report UD 2019-20 Page 162

Industry Certification Attainment
An industry certification or equivalent state or national exam has not been identified for the Veterinary
Nursing, BAS program for evidence of certification attainment at the baccalaureate level.
Academic Program Viability Report UD 2019-20 Page 163

2019-20 Placement Data
*Refers to graduates found to be employed full-time or part-time.
^To protect the privacy of individual students, data are not reported when the total number of students in a group is fewer than 10.
Source: http://www.fldoe.org/accountability/fl-edu-training-placement-info-program/fl-college-system-reports.stml
VETTEC BAS Pool Count Percent Placed 2014-15 15 N/A 2015-16 23 N/A 2016-17 21 N/A 2017-18 46 43%
Academic Program Viability Report UD 2019-20 Page 164

Table 1 Growth for Veterinary technologists and technicians
Jobs (2019) % Change (2019-2027) Median Earnings Florida 9,946 20.3% $15.49/hr
Pinellas County 687 11.5% $15.81/hr
Source: Florida Department of Economic Opportunity (DEO) http://www.floridajobs.org/labor-market-information/data-center/statistical-programs/employment-projections
Academic Program Viability Report UD 2019-20 Page 165

Perkins Completion & Non-Traditional Completion Performance
Perkins completion metrics do not apply to baccalaureate programs.
Academic Program Viability Report UD 2019-20 Page 166

Action Plan Follow-up and Evaluation Report for 2018-19 Viability Report Program: Veterinary Technology, Upper Division Date Completed: August 2020 Prepared By: Cynthia Grey I. Action Plan Items Status
Action Item
Measure
Addressed (Value)
Completion
Status
Status Explanation
1
Attend VMX and WSV Conferences this year to recruit for the BAS program. We have received funding to exhibit at both of these conferences.
SSH Enrollment
Completed We had a presence at VMX with the college allowing for Chris Kerr to host the table so that faculty to complete required CE. Dr. Rib and I both attended WSVC. The college funded 1 of us to go. We shared a room and we paid out of pocket for the second air fare. The college also purchased the contact list for both VMX and WSV. We emailed all the participants on both lists providing information on both the AS and BAS programs. At WSVC, we met with the program director of Carrington College. He is aware of our BAS program and is very supportive. We followed up with information for him to distribute to his graduates. For the Fall semester, we have yet to be able to identify how effective these visits were. We however can report that the BAS program SSH for the Summer was up by 4.5% and flat (-1.7) for the Fall. Based upon the impact of COVID and
Academic Program Viability Report UD 2019-20 Page 167

Action Item
Measure
Addressed (Value)
Completion
Status
Status Explanation
the struggle across the majority of SPC programs to at least meet prior enrollment numbers for the Fall, we feel the BAS program has done well.
2
Recruiting from Florida vet tech associates' programs in person. This would allow us to have question and answer session on our BAS program in the classroom targeting increased enrollment.
SSH Enrollment
Not Completed
COVID has significantly affected this initiative. We were able to begin the process with 1 local visit and 1 virtual visit. Dr. Rib, Mr. Keller, and I hosted a lunch and learn at Hillsborough Community College Vet Tech program. There were some 22 senior AS vet tech students there. We have subsequently enrolled two students in the BAS program from this visit. We also hosted a virtual event with Piedmont Technical College. We had 1 student enroll in the BAS program after our visit.
3
Revitalize existing or build new courses to meet the needs of the approved Program. This year ATE 4850, Communications and Professionalism a new course is slated.
Job Placement
Completed (ate4940) and will be completed by the end of Fall 2020 semester (ATE4850).
We completed the new capstone practicum ahead of schedule. This was a new build of ATE 4940. The practicum experience focuses on allowing students to build their own practicum experience in an area of their career interest, outside of their current work environment. The Spring semester was the first semester this was offered. All the students reported enjoying and learning so much from the new practicum approach. We had 1 student email us excited about a career change that
Academic Program Viability Report UD 2019-20 Page 168

Action Item
Measure
Addressed (Value)
Completion
Status
Status Explanation
happened because of the program and her practicum experience “Good evening, I wanted to personally send a big thank you to both of you for helping me successfully complete my final semester! Dr. Grey, I received your mail and that was such a sweet gesture! I wanted to let you both know that the place I did my externship at recently just offered me a management position for a new hospital they just opened. I accepted the job! This wouldn’t have happened without the new class and of course my amazing professors. This is just a little success story from me, but I wanted to say thank you again for everything!” ATE 4850 will be completed this semester and will be offered this Spring. Our Advisory board members applauded our inclusion of this course to our curriculum because they identify this as a critical need for vet techs and practice management.
Academic Program Viability Report UD 2019-20 Page 169

II. Non-Completed Action Plan Items and Plan for Completion
Action Item
Completion
Date
Plan for Completion
2
Recruiting from Florida vet tech associates' programs in person. This would allow us to have question and answer session on our BAS program in the classroom targeting increased enrollment.
2021 This is a long-term initiative. We intend to virtually visit at least one program in the Spring. We have hopes of personally visiting the Florida colleges, but do not see this occurring until later in 2021 with the impact of COVID.
III. Evaluation of the Impact of Action Plans on Program Quality As discussed above in ‘Plan Completion,’ we see positive impacts to the quality of our program especially related to action item #3. This change of focus to career advancement and incorporating curriculum for those identified ‘soft skills’ will only increase our students’ ability to advance in the profession and to move into job positions that will also increase their salary base. Certainly, the quality of the program has been increased with the new program plan and the development and launching of the new real-world practicum-based capstone and the development of our Communication and Professionalism course. As discussed above, in the first semester there has been a successful placement as a result of the new capstone practicum that was a step up the organizational chart and an increase in salary. The importance of communication skills has been identified at all levels of the veterinary field. “Effective communication is essential to success in the veterinary field. In the 2006 edition of Ontario Veterinary College’s “Essential Skills and Abilities Required for the Study of Veterinary Medicine,” communication is the second ability listed. Communication is also listed as the top skill in Granville College’s “Top 5 Skills Needed to Succeed as a Veterinary Assistant” (Source: https://www.scilvet.ca/company/articles/the-importance-of-interpersonal-skills/). The development of the Communication and Professionalism course and its implementation will meet this need and increase our students’ skills and set students up for career advancement. Items #1 and #2 were definitely recruitment based, which we see as being successful even thought we have faced a pandemic where enrollment across colleges has been struggling. We believe that with increased enrollment, will come increased quality.
Academic Program Viability Report UD 2019-20 Page 170

St. Petersburg College
Program Goals and Strategies Program: Veterinary Technology, Upper Division Date Completed: 1/21/2021 Due Date: August 2021 Prepared By: Cynthia Grey I. Goals
Program Goals SPC Commitment Pillar
1 Continue to increase BAS enrollment. Community Engagement
2 Increase graduation rates for our Veterinary Practice Management Certificate.
Economic Mobility
II. Strategies
Strategies to be Implemented Viability Metric Target Outcome Goal #
Responsible Individuals
1
Continuing our action plan strategies identified in our Evaluation Report for 2018-19 Viability Report. This includes recruiting from Florida vet tech associates' programs 'in person' (based upon COVID, this will be accomplished through Zoom.) We will now add other Vet Tech programs across the country who do not currently have a Bachelor's program. Our percent full from Fall 2019-2020 to Fall 2020-2021 increased 7.2% providing support for the success of this initiative.
Percent Full: 2% increase from Fall 2020-2021 to Fall 2021-2022.
1 Cynthia Grey, Wendy Rib, and
Don Keller
2
Revitalize management classes to support the educational requirements of the Veterinary Hospital Manager's Association, who awards the Certified Practice Manager credential. This requires collaboration with VHMA in incorporating their industry driven standards and requirements into our curriculum. Students who complete our certificate program will have completed the educational requirements to sit for the CVPM exam, which will provide students the credential that will allow them to increase their pay levels. On average, a CVMP earns $61,000 per year; in comparison, a credentialed veterinary technician on average earns approximately $35,000 per year.
Industry Certifications: 2% increase from 2019.
2 Cynthia Grey
Academic Program Viability Report UD 2019-20 Page 171

St. Petersburg College
III. Special Resources Needed: 1. Funding to provide lunches. We would like to be able, even though we are Zooming into the classroom, to provide lunch to be delivered to the institution. 2. Funding to exhibit at the next VHMA conference (not virtual). This would include an exhibitor’s fee and travel expenses.
IV. Area(s) of Concern/Improvement: N/A
Academic Program Viability Report UD 2019-20 Page 172

ACADEMIC PROGRAM VIABILITY REPORTStudent Count by Academic Year
0
500
1,000
2017 2018 2019 2020
904 876 852
569
SSH By Campus
Campus 2017
2018
2019
2020
Clearwater CampusElectronic CampusEpiCenterSeminole CampusSt Petersburg/Gibbs Campus
2,7781,257
234
117
2,6551,137
168
2,568639180
351
2,0461598439
312Total 4,386 3,960 3,738 2,640
Student Count by Ethnic Group and Academic Year
0
200
400
600
2017 2018 2019 2020
23 35 28 13
98 101 9164
120 11682
601561 568
386
Ethnic Group Asian Black/African American Hispanic/Latino White
Success Rate by Academic Year
0%
50%
100%
2017 2018 2019 2020
90.8% 88.2% 91.5%
77.1%
Term
All
Program
All
Plan
All
College School Depart…
All
Success Rate By Course
Academic YearSubject
2017StudentCount
EnrollmentCount
SuRa
BUL3130BUL3310BUL3320BUL3322BUL3564BUL3583PLA3240PLA3306PLA3410PLA3467PLA3474PLA3563PLA3703PLA3723PLA3734PLA3873PLA3885PLA4116PLA4225PLA4263PLA4275PLA4404PLA4522
220305
8
1945324281916
11595260
57351232
221307
8
1985424281916
11615268
58361232
287
28
287
281
Total 904 1,462
Academic Organization
Paralegal Studies - UD
Community
All
FTIC Flag
All
Part Full Time
All
Gender
All
Academic Program Viability Report UD 2019-20 Page 173

ACADEMIC PROGRAM VIABILITY REPORT
Academic Plan
All Academic Plan Id Student Count Enrollment Count
Units Taken Success Rate Grads Count2019-20
Enrolled in Fall2020-21 (0580)
Retention Rate0565 to 0580
MGTORG-BASBUS-BSTMGT-BASLEGAL-BASSUSMGT-BASPPA-BSLEGAL-ASLEGAL-CTBUS-ASGEN-AABACCAPP-NOBUS-TRCWPA-ASHSA-ASENRCH-NOITSC-ASCIT-ASINTBUS-BASEDST-BSFBM-CT
12582687020128
13 1
1,6801,201
9822401521237454333123202015131311876
5,3053,8022,965
721457370215162999369606033383933332215
85.5 %85.6 %91.2 %87.9 %88.8 %97.6 %90.5 %96.3 %97.0 %96.8 %
100.0 %100.0 %90.0 %66.7 %92.3 %
100.0 %90.9 %75.0 %57.1 %83.3 %
31192131976
11
855535289222
82.4 %87.8 %73.5 %77.1 %90.0 %75.0 %75.0 %84.6 %
Total 400 4,791 14,844 87.7 % 135 218 80.8 %
80.8%Retention Rate 0565 to 0580
218Enrolled in Fall 2020-21
87.7%Success Rate Fall 2019-20
Academic Program
All
College School Depart…
All
Academic Organization…
LEGAL-UD
Community
All
FTIC Flag
All
Ethnic Group
All
Gender
All
135Grads Count 2019-20
400Student Count Fall 2019-20
Academic Program Viability Report UD 2019-20 Page 174

ACADEMIC PROGRAM VIABILITY REPORTNumber of Grads and Number of Awards by Academic Year
0
20
40
2017 2019 2018
5348
43
5348
43
Number of Grads Number of Awards
Student Count by Ethnic Group and Academic Year
0
10
20
30
2017 2019 2018
32
75
6
12
57
33 33
22
Student.Ethnic Group Asian Black/African American Hispanic/Latino White
Term
All
Program
All
Plan
Multiple selections
Academic YearDegree
2017Numberof Grads
Numberof Awards
2018Numberof Grads
Numberof Awards
2019Numberof Grads
Numberof Awards
BASLEGAL-BAS
CERTLEGAL-CT
38381515
38381515
27271616
27271616
29291919
29291919
Total 53 53 43 43 48 48
Gender
All
Academic Program Viability Report UD 2019-20 Page 175

ACADEMIC PROGRAM VIABILITY REPORT
Academic Plan
All
83.2%Retention Rate 0535 to 0550
222Enrolled in Fall 2018-19
410Student Count Fall 2017-18
87.6%Success Rate Fall 2017-18
Academic Program
All
College School Depart…
All
Academic Organization…
LEGAL-UD
Community
All
FTIC Flag
All
Ethnic Group
All
Gender
All
158Grads Count 2017-18
404Student Count Fall 2018-19
400Student Count Fall 2019-20
87.8%Success Rate Fall 2018-19
87.7%Success Rate Fall 2019-20
239Enrolled in Fall 2019-20
218Enrolled in Fall 2020-21
123Grads Count 2018-19
135Grads Count 2019-20
83.2%Retention Rate 0550 to 0565
80.8%Retention Rate 0565 to 0580
Academic Plan Id Retention Rate 0535 to 0550 Retention Rate 0550 to 0565 Retention Rate 0565 to 0580
BACCAPP-NOBUS-BSENRCH-NOINTBUS-BASLEGAL-ASLEGAL-BASLEGAL-CTMGTORG-BASPPA-BSSUSMGT-BASTMGT-BASTRANS-NO
87.5 %33.3 %85.7 %
100.0 %83.8 %
100.0 %78.7 %
100.0 %79.2 %85.5 %
66.7 %86.5 %
100.0 %
76.4 %
100.0 %84.9 %80.0 %78.9 %91.5 %33.3 %
87.8 %
75.0 %77.1 %84.6 %82.4 %75.0 %90.0 %73.5 %
Total 83.2 % 83.2 % 80.8 %
Academic Program Viability Report UD 2019-20 Page 176

��������� ������ ������� ��������� ����� � ����� ����
�������������� ������� ��!���"��������������� ������� ��������� ����������� ���� ���# $�$
%&'()*+,-. /)012))3 4-)5(,6) %,.)1 7+8)(. 9+&( :::%)'(;& .&,1 1,.)%*<=>?1,-)11 :-.)@@,A)-;) B,-'-;,'@ :-2+(C'.,+- 7);(?,.C)-. '-3 D3C,11,+-1 = 5).',@1 %.?3)-. :-2+(C'.,+- EFGHIJF KJLMNOPFQMJ R SIFPQTUVWXYZ[V \]_]WZ [Wa[b[cd eYf]c g \Y]VYhc ijbb k-(+@@C)-.l*)(2+(C'-;)l*)(;)-. B?@@lm('3?'.)1l<+?(1) m(+?n1\Y]VYhc ijbb oYc][V p]Wfq <@'11 %.'.?1r stFQuIv wGTTv EFMx wGNFyIN zJNMTTOIJFv <@'11 D;'3)C,; m(+?nr {Sv |Sv <@'11 <+@@)A) %;&++@ 5)n. = D;'3)C,; m(+?n 5)1; = D;'3)C,; 4(A'-,}'.,+- = %?8~);. <'.'@+A /8(r �� QFIO�
\Y]VYhc ijbb oYc][V ad �h�c]jVc[hWb oYcqX ������� �������� ���� � ���� ������������ � ������� ������������ ����������� ����� ���������� ���� �� ¡����� ¢�£¤£¥ ¦��������� §���� �� £© ©£ ������ ���� �� ¡����� ¢�£¤£¥ �������� §����� ª��� �¤£ «¡ £ ©£���� ���� �� ¡����� ¢�£¤£¥ ¬������ ���� «£® ¤« ® ¡® £« ®�����° ���� �� ¡����� ¢�£«�¥ ¦��������� §���� � ¤ ������° ���� �� ¡����� ¢�£«�¥ �������� §����� ª��� �£« � £©�����° ���� �� ¡����� ¢�£«�¥ ¬������ ���� «��® ¤£® «©�®������ ���� �� ¡����� ¢�£«£¥ ¦��������� §���� �© ¡£ � ¤������ ���� �� ¡����� ¢�£«£¥ �������� §����� ª��� £© � £ ������� ���� �� ¡����� ¢�£«£¥ ¬������ ���� ¤«©® «�® ©©® ¤��®���� ���� �������� ¢�£�¥ ¦��������� §���� ��« ��£ ������ ���� �������� ¢�£�¥ �������� §����� ª��� �� �£ ©£���� ���� �������� ¢�£�¥ ¬������ ���� ® ©«® ¤�¡® <@'11 %.'.?1r stFQuIv wGTTv EFMx wGNFyIN zJNMTTOIJFv <@'11 D;'3)C,; m(+?nr {Sv |Sv <@'11 <+@@)A) %;&++@ 5)n. = D;'3)C,; m(+?n 5)1; = D;'3)C,; 4(A'-,}'.,+- = %?8~);. <'.'@+A /8(r �� QFIO�v B,@.)( )Cn.± (+01 '-3 ;+@?C-1
Academic Program Viability Report UD 2019-20 Page 177

��������� ������ ������� ��������� ����� � ����� ������
�������������� ������� ��!���"��������������� ������� ��������� ����������� ������ ���# $�$
%&'()*+,-. /)012))3 4-)5(,6) %,.)1 7+8)(. 9+&( :::%)'(;& .&,1 1,.)%*<=>?1,-)11 :-.)@@,A)-;) B,-'-;,'@ :-2+(C'.,+- 7);(?,.C)-. '-3 D3C,11,+-1 = 5).',@1 %.?3)-. :-2+(C'.,+- EFGHIJF KJLMNOPFQMJ R SIFPQTUVWXYZ[V \]_]WZ [Wa[b[cd eYf]c g hi]jY k]ifj l-(+@@C)-.m*)(2+(C'-;)m*)(;)-. B?@@mn('3?'.)1m<+?(1) n(+?o1hi]jY k]ifj pqrr stuv wxyz{wxwx |x}~}� ��u��� stuv wxyz{wxwx |x}�x� ��vvtu stuv wxyz{wxwx |x}�}� pqrr stuv wxwx{wxwy |x}�x��rq�� ���u�t �u��� { ����t�� �q�qr�� ��u�����r��q�t� ����t�� ����� ��v�tu �� �rq��t� �����r��q�t� ����t�� ����� ��v�tu �� �rq��t� �����r��q�t� ����t�� ����� ��v�tu �� �rq��t� �����r��q�t� ����t�� ����� ��v�tu �� �rq��t����wz�x y y����z�z ~ y � y ~ y � y <@'11 <+?(1) n(+?o� KJFINJ��Q� �MGN�I�� %.?3)-. �)(C <'())( 5)1; = *(+A('C 5)1; = *@'- 5)1; = %?8o@'- 5)1;� �PNPTI PT EFGHQI� ¡¢E� <@'11 D;'3)C,; <'())(� £¤¥S� B,@.)( )Co.¦ (+01 §ciXYc §djcYZ hiaY eY©]Yjª�q�� «t�ut�¬ ®°±°²°² ³�µ�²® D9[Wa[b[cd eYf]c \]VYjj ¶ViZYc ·�q��r�� «t��u� �u��t�� ¹���vt��D;'3)C,; º)'( = �)(C 5)1; = 9?@., B'@@ �)(C °²µ®=°²°² »²±¼±½� %o(,-A �)(C °¾<'Co?1 5)1;(,o.,+- D@@<'())( = *(+A('C = *@'- = %?8o@'- = 9?@., *'('@)A'@ %.?3,)1 >D%<+@@)A) = n(+?o = D;'3 4(A = %?8¿);. D@@<+?(1) :-1.(?;.,+-'@ 9).&+3 D@@%.?3)-. �¦o) »B�:<½D@@DA) n(+?o D@@l.&-,; n(+?o D@@n)-3)(D@@<?1.+C <+&+(. D@@%.?3)-. n(+?o D@@Academic Program Viability Report UD 2019-20 Page 178

Industry Certification Attainment
An industry certification or equivalent state or national exam has not been identified for the Paralegal Studies, BAS program for evidence of certification attainment at the baccalaureate level.
Academic Program Viability Report UD 2019-20 Page 179

2019-20 Placement Data
*Refers to graduates found to be employed full-time or part-time.
LEGAL BAS Pool Count Percent Placed 2014-15 36 58% 2015-16 44 68% 2016-17 44 73% 2017-18 40 73%
Source: http://www.fldoe.org/accountability/fl-edu-training-placement-info-program/fl-college-system-reports.stml
Academic Program Viability Report UD 2019-20 Page 180

Table 1 Growth for Paralegals and legal assistants
Jobs (2019) Median Earnings National 329,870 $24.87/hr
Florida 30,850 $23.50/hr
Pinellas County 5,510 $21.40/hr
Source: U.S. Department of Labor, Bureau of Labor Statistics https://www.bls.gov/oes/tables.htm
Table 2 Growth for Legal secretaries and administrative assistants
Jobs (2019) Median Earnings National 168,140 $22.74/hr
Florida 9,760 $21.37/hr
Pinellas County 1,030 $20.81/hr
Source: U.S. Department of Labor, Bureau of Labor Statistics https://www.bls.gov/oes/tables.htm
Academic Program Viability Report UD 2019-20 Page 181

Perkins Completion & Non-Traditional Completion Performance
Perkins completion metrics do not apply to baccalaureate programs.
Academic Program Viability Report UD 2019-20 Page 182

Action Plan Follow-up and Evaluation Report for 2018-19 Viability Report Program: Paralegal Studies, Upper Division Date Completed: August 2020 Prepared By: Susan Demers and Christy Powers I. Action Plan Items Status
Action Item
Measure
Addressed (Value)
Completion
Status
Status Explanation
1
A. Work with Curriculum Services to create and articulate AA and AS transfer plans from other institutions through the FUSE program.
B. Market and
expand the Post-Bacc CT to other four year institutions.
This item was carried forward from the 2017-18 Action Plan.
Unduplicated Headcount
A. Completed B. Not Completed
We continue to market our transfer plan internally to keep the AA/AS student within SPC to move on to our BAS Degree. We have identified and maintain articulations with PHSC and HCC’s two year programs.
II. Non-Completed Action Plan Items and Plan for Completion
Action Item
Completion
Date
Plan for Completion
1
B. Market and expand the Post-Bacc CT to other four year institutions.
Summer 2021 Due to COVID-19, we know are exploring the option for our CT to be LIVE ONLINE for a national launch to market all institutions across the country.
Academic Program Viability Report UD 2019-20 Page 183

III. Evaluation of the Impact of Action Plans on Program Quality We continue to market our transfer plan internally to keep the AA/AS student within SPC to move on to our BAS Degree. We have identified and maintain articulations with PHSC and HCC’s two year programs. By maintaining relationships with both local two year programs, the program directors assist in directing their students to SPC. We frequently communicate how we can assure that all two year students know their BAS Degree Options at SPC. This smooth transition allow for confidence in advising for students placed directly with a paralegal specific advisor. As for our CT going LIVE ONLINE nationally, the logistics regarding SACS accreditation and ABA approval are currently being addressed. This will impact students by giving them flexibility in attending classes from anywhere in addition to exposure to students from different states and possibly different countries.
Academic Program Viability Report UD 2019-20 Page 184

St. Petersburg College
Program Goals and Strategies Program: Paralegal Studies, Upper Division Date Completed: 2/9/2021 Due Date: August 2021 Prepared By: Christy Powers I. Goals
Program Goals SPC Commitment Pillar
1
Continue to market our transfer plan to retain SPC AA/AS transfer and BAS/BS students within SPC to move on to our BAS Degree and Post-Baccalaureate Certificate respectively. Also, continue to maintain articulations with PHSC and HCC’s two year programs.
Academic Excellence
2 Increase UD-LEGAL graduation rate. Academic Excellence II. Strategies
Strategies to be Implemented Viability Metric Target Outcome
Goal # Responsible Individuals
1
Twice a semester we run Information Sessions regarding our two degrees and certificate in Paralegal Studies. Additionally, we provide departmental Zoom Advising Sessions with Full-Time Faculty to develop learning plans to assure graduation requirements are met.
Retention: 2% increase.
1 Susan Demers, Christy Powers, Ian Banks, and
Deborah Eldridge
2
While continuing to recruit future students, we must assure that current students finish what they start despite the pandemic. We regularly advise and monitor student progress for those who fall below satisfactory academic progress. Continue to provide departmental Zoom Advising Sessions with Full-Time Faculty to develop learning plans to assure graduation requirements are met.
Graduates: 3% increase.
2 Susan Demers, Christy Powers, Ian Banks, and
Deborah Eldridge
III. Special Resources Needed: Assistance from CAC individuals designated in Workforce and Career Services to achieve the marketing of our BAS and CT.
IV. Area(s) of Concern/Improvement: N/A
Academic Program Viability Report UD 2019-20 Page 185

ACADEMIC PROGRAM VIABILITY REPORTStudent Count by Academic Year
0
50
100
150
2017 2018 2019 2020
171180
158
125
SSH By Campus
Campus 2017
2018
2019
2020
Clearwater CampusSeminole Campus
879606
1,050639
1,032441
549267
Total 1,485 1,689 1,473 816
Student Count by Ethnic Group and Academic Year
0
50
100
2017 2018 2019 2020
7 9 61
2822
1812
19 2028
21
106
116
94
85
Ethnic Group Asian Black/African American Hispanic/Latino White
Success Rate by Academic Year
0%
50%
100%
2017 2018 2019 2020
88.3% 89.2% 90.6%
50.0%
Term
All
Program
All
Plan
All
College School Depart…
All
Success Rate By Course
Academic YearSubject
2017StudentCount
EnrollmentCount
SucRate
INR4030PAD3330POS3235PUP3002PUP3033PUP3040PUP3043PUP3046PUP3052PUP3054PUP3055PUP3823PUP4941PUP4949
119
367836563528275726491923
119
368236573528275726491923
810979889
1088989
Total 171 495 8
Academic Organization
Public Policy and Ad…
Community
All
FTIC Flag
All
Part Full Time
All
Gender
All
Academic Program Viability Report UD 2019-20 Page 186

ACADEMIC PROGRAM VIABILITY REPORT
Academic Plan
All Academic Plan Id Student Count Enrollment Count
Units Taken Success Rate Grads Count2019-20
Enrolled in Fall2020-21 (0580)
Retention Rate0565 to 0580
PPA-BSLEGAL-BASEDST-BSGEN-AABUS-TRPSA-BASBACCAPP-NOHSA-BASITSC-ASMGTORG-BASSOCIAL-TRENRCH-NOBIO-TRHSA-ASLEGAL-AS
105 3 11
37234242298654443222
1,1211037367252418141212109666
93.8 %100.0 %50.0 %
100.0 %100.0 %100.0 %66.7 %
100.0 %25.0 %50.0 %
100.0 %100.0 %100.0 %100.0 %100.0 %
41 2
50 1
83.8 %
66.7 %
100.0 %
Total 110 501 1,506 91.6 % 43 51 82.7 %
82.7%Retention Rate 0565 to 0580
51Enrolled in Fall 2020-21
91.6%Success Rate Fall 2019-20
Academic Program
All
College School Depart…
All
Academic Organization…
PPA-UD
Community
All
FTIC Flag
All
Ethnic Group
All
Gender
All
43Grads Count 2019-20
110Student Count Fall 2019-20
Academic Program Viability Report UD 2019-20 Page 187

ACADEMIC PROGRAM VIABILITY REPORTNumber of Grads and Number of Awards by Academic Year
0
10
20
30
40
2019 2018 2017
43
33
19
43
33
19
Number of Grads Number of Awards
Student Count by Ethnic Group and Academic Year
0
10
20
2019 2018 2017
5
12
6
24
24
1
27
22
12
Student.Ethnic Group Asian Black/African American Hispanic/Latino White
Term
All
Program
All
Plan
PPA-BS
Academic YearDegree
2017Numberof Grads
Numberof Awards
2018Numberof Grads
Numberof Awards
2019Numberof Grads
Numberof Awards
BSPPA-BS
1919
1919
3333
3333
4343
4343
Total 19 19 33 33 43 43
Gender
All
Academic Program Viability Report UD 2019-20 Page 188

ACADEMIC PROGRAM VIABILITY REPORT
Academic Plan
All
77.6%Retention Rate 0535 to 0550
67Enrolled in Fall 2018-19
116Student Count Fall 2017-18
83.6%Success Rate Fall 2017-18
Academic Program
All
College School Depart…
All
Academic Organization…
PPA-UD
Community
All
FTIC Flag
All
Ethnic Group
All
Gender
All
25Grads Count 2017-18
121Student Count Fall 2018-19
110Student Count Fall 2019-20
85.5%Success Rate Fall 2018-19
91.6%Success Rate Fall 2019-20
72Enrolled in Fall 2019-20
51Enrolled in Fall 2020-21
36Grads Count 2018-19
43Grads Count 2019-20
82.6%Retention Rate 0550 to 0565
82.7%Retention Rate 0565 to 0580
Academic Plan Id Retention Rate 0535 to 0550 Retention Rate 0550 to 0565 Retention Rate 0565 to 0580
ACTAP-CTEDST-BSITSC-ASLEGAL-ASLEGAL-BASPPA-BSPPA-NO
83.3 %77.8 %
100.0 %
100.0 %
100.0 %100.0 %82.9 %
66.7 %
100.0 %
83.8 %
Total 77.6 % 82.6 % 82.7 %
Academic Program Viability Report UD 2019-20 Page 189

��������� ������ ������� ��������� ����� � ����� ����
�������������� ������� ��!���"��������������� ������� ��������� ����������� ���� ���# $�$
%&'()*+,-. /)012))3 4-)5(,6) %,.)1 7+8)(. 9+&( :::%)'(;& .&,1 1,.)%*<=>?1,-)11 :-.)@@,A)-;) B,-'-;,'@ :-2+(C'.,+- 7);(?,.C)-. '-3 D3C,11,+-1 = 5).',@1 %.?3)-. :-2+(C'.,+- EFGHIJF KJLMNOPFQMJ R SIFPQTUVWXYZ[V \]_]WZ [Wa[b[cd eYf]c g \Y]VYhc ijbb k-(+@@C)-.l*)(2+(C'-;)l*)(;)-. B?@@lm('3?'.)1l<+?(1) m(+?n1\Y]VYhc ijbb oYc][V p]Wfq <@'11 %.'.?1r stFQuIv wGTTv EFMx wGNFyIN zJNMTTOIJFv <@'11 D;'3)C,; m(+?nr {Sv |Sv <@'11 <+@@)A) %;&++@ 5)n. = D;'3)C,; m(+?n 5)1; = D;'3)C,; 4(A'-,}'.,+- = %?8~);. <'.'@+A /8(r ��sR|S
\Y]VYhc ijbb oYc][V ad �h�c]jVc[hWb oYcqX ������� �������� ���� � ���� ������������ � ������� ������������ ���������� ���� ��������� ������ ��������� ¡���� �¢¢ £¢ ¢� ������ ���� ��������� ������ ¤������� ¡����� ¥��� �£� ¦¦ ��� ������ ���� ��������� ������ §������ ���� ¢©¦ª �£�©�ª ��©�ª ��©�ª¤«���¬ ���� ��������� ����� ��������� ¡���� �� ¦� �� ¢�¤«���¬ ���� ��������� ����� ¤������� ¡����� ¥��� �� ¦¦ ��� ��¤«���¬ ���� ��������� ����� §������ ���� £©�ª ���©�ª �©�ª �¦©¢ª¤����� ���� ��������� ����� ��������� ¡���� �� £� ��¤����� ���� ��������� ����� ¤������� ¡����� ¥��� �£� ¨ �¢¤����� ���� ��������� ����� §������ ���� ��©�ª ��©�ª ¢�©£ª���� ���� ��������� ���¢�� ��������� ¡���� �£� �£ ¨���� ���� ��������� ���¢�� ¤������� ¡����� ¥��� �¢¦ � ������� ���� ��������� ���¢�� §������ ���� ¨©�ª ��©�ª �¢©¢ª <@'11 %.'.?1r stFQuIv wGTTv EFMx wGNFyIN zJNMTTOIJFv <@'11 D;'3)C,; m(+?nr {Sv |Sv <@'11 <+@@)A) %;&++@ 5)n. = D;'3)C,; m(+?n 5)1; = D;'3)C,; 4(A'-,}'.,+- = %?8~);. <'.'@+A /8(r ��sR|Sv B,@.)( )Cn. (+01 '-3 ;+@?C-1
Academic Program Viability Report UD 2019-20 Page 190

��������� ������ ������� ��������� ����� � ����� ������
�������������� ������� ��!���"��������������� ������� ��������� ����������� ������ ���# $�$
%&'()*+,-. /)012))3 4-)5(,6) %,.)1 7+8)(. 9+&( :::%)'(;& .&,1 1,.)%*<=>?1,-)11 :-.)@@,A)-;) B,-'-;,'@ :-2+(C'.,+- 7);(?,.C)-. '-3 D3C,11,+-1 = 5).',@1 %.?3)-. :-2+(C'.,+- EFGHIJF KJLMNOPFQMJ R SIFPQTUVWXYZ[V \]_]WZ [Wa[b[cd eYf]c g hi]jY k]ifj l-(+@@C)-.m*)(2+(C'-;)m*)(;)-. B?@@mn('3?'.)1m<+?(1) n(+?o1hi]jY k]ifj pqrr stuv wxyz{wxwx |x}~}� ��u��� stuv wxyz{wxwx |x}�x� ��vvtu stuv wxyz{wxwx |x}�}� pqrr stuv wxwx{wxwy |x}�x��rq�� ���u�t �u��� { ����t�� �q�qr�� ��u�����r��q�t� ����t�� ����� ��v�tu �� �rq��t� �����r��q�t� ����t�� ����� ��v�tu �� �rq��t� �����r��q�t� ����t�� ����� ��v�tu �� �rq��t� �����r��q�t� ����t�� ����� ��v�tu �� �rq��t�����z�y y� y wx y � y y� y����z�z � y ~ y } y ~ y <@'11 <+?(1) n(+?o� KJFINJ��Q� �MGN�I�� %.?3)-. �)(C <'())( 5)1; = *(+A('C 5)1; = *@'- 5)1; = %?8o@'- 5)1;� �G�TQ� �MTQ� PJH ¡HOQJQ�FNPFJ� <@'11 D;'3)C,; <'())(� ¢£¤S� B,@.)( )Co.¥ (+01 ¦ciXY§c ¦djcYZ hiaY eY]Yj©ªq�� «t�ut�¬ ®°±°²°² ³�µ�²® D9[Wa[b[cd eYf]c \]VYjj ¶ViZY§c ·�q��r�� «t��u� �u��t�� ¹���vt��D;'3)C,; º)'( = �)(C 5)1; = 9?@., B'@@ �)(C °²µ®=°²°² »²±¼±½� %o(,-A �)(C °¾<'Co?1 5)1;(,o.,+- D@@<'())( = *(+A('C = *@'- = %?8o@'- = 9?@., *?8@,; *+@,;¥ '-3 D3C,-,1.('.-<+@@)A) = n(+?o = D;'3 4(A = %?8¿);. D@@<+?(1) :-1.(?;.,+-'@ 9).&+3 D@@%.?3)-. �¥o) »B�:<½D@@DA) n(+?o D@@l.&-,; n(+?o D@@n)-3)(D@@<?1.+C <+&+(. D@@%.?3)-. n(+?o D@@Academic Program Viability Report UD 2019-20 Page 191
Industry Certification Attainment
An industry certification or equivalent state or national exam has not been identified for the Public Policy and Administration, BS program for evidence of certification attainment at the baccalaureate level.
Academic Program Viability Report UD 2019-20 Page 192

2019-20 Placement Data
*Refers to graduates found to be employed full-time or part-time.
Source: http://www.fldoe.org/accountability/fl-edu-training-placement-info-program/fl-college-system-reports.stml
PPA BS Pool Count Percent Placed 2014-15 27 85% 2015-16 27 70% 2016-17 30 67% 2017-18 18 89%
Academic Program Viability Report UD 2019-20 Page 193

Public Policy Administration
Supplemental Placement Data
Continuing Education
• George Washington School of Law • Seton Hall University • University of Central Florida • University of South Florida • University of Vermont
Employed
• Administrative Assistant, Florida Fish and Wildlife • Administrative Assistant, Pinellas County Utilities Department • Biological Scientist III, Florida Department of Health • Executive Assistant, Volunteers of America, Florida • Judicial Assistant, 6th Judicial Circuit • Legislative Aide, City of St. Petersburg • Legislative Aide, Pasco County Board of County Commissioners • Managerial Assistant, City of Anna Maria • Management Fellow, City of Largo’s Performance and Budget Department • President, Association pour le development Communautaire au Sahel, Timbuktu,
Africa • Public Health Administrator, Department of Vermont Health • Senior Director/Chief Communications Officer, City of Savanah • Special Needs Shelter Coordinator III, Florida Department of Health
Academic Program Viability Report UD 2019-20 Page 194

Table 1 Growth for Chief executives
Jobs (2019) Median Earnings National 205,890 $88.68/hr
Florida 26,300 $79.14/hr
Pinellas County N/A* $84.37/hr
*Estimates not released. Source: U.S. Department of Labor, Bureau of Labor Statistics https://www.bls.gov/oes/tables.htm
Table 2 Growth for General and operations managers
Jobs (2019) Median Earnings National 2,400,280 $48.45/hr
Florida 147,670 $40.52/hr
Pinellas County 23,110 $44.11/hr
Source: U.S. Department of Labor, Bureau of Labor Statistics https://www.bls.gov/oes/tables.htm Table 3 Growth for Administrative services and facilities managers
Jobs (2019) Median Earnings National 307,280 $46.61/hr
Florida 15,970 $38.72/hr
Pinellas County 2,510 $40.43/hr
Source: U.S. Department of Labor, Bureau of Labor Statistics https://www.bls.gov/oes/tables.htm
Academic Program Viability Report UD 2019-20 Page 195

Table 4 Growth for Transportation, storage, and distribution managers
Jobs (2019) Median Earnings National 132,040 $45.46
Florida 5,890 $40.77/hr
Pinellas County 700 $39.16/hr
Source: U.S. Department of Labor, Bureau of Labor Statistics https://www.bls.gov/oes/tables.htm
Table 5 Growth for Postmasters and mail superintendents
Jobs (2019) Median Earnings National 13,850 $36.97/hr
Florida 350 $41.42/hr
Pinellas County 40 $46.50/hr
Source: U.S. Department of Labor, Bureau of Labor Statistics https://www.bls.gov/oes/tables.htm
Table 6 Growth for Managers, all other
Jobs (2019) Median Earnings National $/hr
Florida $/hr
Pinellas County $/hr
Note: No data were found for this employment title. Source: U.S. Department of Labor, Bureau of Labor Statistics https://www.bls.gov/oes/tables.htm
Academic Program Viability Report UD 2019-20 Page 196

Table 7 Growth for Eligibility interviewers, Government programs
Jobs (2019) Median Earnings National 139,780 $22.40/hr
Florida 2,930 $19.89/hr
Pinellas County 410 $19.88/hr
Source: U.S. Department of Labor, Bureau of Labor Statistics https://www.bls.gov/oes/tables.htm Table 8 Growth for Urban and Regional Planners
Jobs (2019) Median Earnings National 38,560 $35.75/hr
Florida 2,880 $34.08/hr
Pinellas County 510 $35.91/hr
Source: U.S. Department of Labor, Bureau of Labor Statistics https://www.bls.gov/oes/tables.htm
Academic Program Viability Report UD 2019-20 Page 197

Perkins Completion & Non-Traditional Completion Performance
Perkins completion metrics do not apply to baccalaureate programs.
Academic Program Viability Report UD 2019-20 Page 198

Action Plan Follow-up and Evaluation Report for 2018-19 Viability Report Program: Public Policy Administration Date Completed: August 2020 Prepared By: Susan Demers and Jeff Kronschnabl I. Action Plan Items Status
Action Item
Measure
Addressed (Value)
Completion
Status
Status Explanation
1
Develop a comprehensive plan to launch our Public Policy & Administration Baccalaureate Degree Program nationally. This item was carried forward from the 2017-18 Action Plan.
SSH Enrollment
Not Completed
Will revisit early next year. Stoppage is a direct result of an international pandemic and an internal change in college leadership. Will address same with Dean Demers to work out logistics on feasibility of moving this forward. This item is not moving forward.
2
Develop online course entitled "Capstone" PUP4941. This item was carried forward from the 2017-18 Action Plan.
Completion (Perkins Measure)
Completed Course is completed and being implemented.
3
Continued support of the City of Seminole's Business Associate Training Program. This item was carried forward from the 2016-17 and 2017-18 Action Plans.
Job Placement
Completed Program is still moving forward with our 5th student being placed this year. The City of Seminole has committed to 10 years of a Business Associate Training Program.
Academic Program Viability Report UD 2019-20 Page 199

II. Non-Completed Action Plan Items and Plan for Completion
Action Item
Completion
Date
Plan for Completion
1
Develop a comprehensive plan to launch our Public Policy & Administration Baccalaureate Degree Program nationally. This item was carried forward from the 2017-18 Action Plan.
This item will not be moved forward at this time due to the COVID situation and internal changes in college leadership.
III. Evaluation of the Impact of Action Plans on Program Quality Item #2 – Completion of our online Capstone course is essential to closing out our program’s curriculum. It enables students to interact online and to view previous students’ capstones from which they can build on.
Item #3 – Is a highly successful business associate training program that gets our students “job ready.” Upon completion of the one year collaborative endeavor, our students are highly sought after for a variety of government career opportunities. This program has provided the energy for another city to emulate and offer a similar program to our students.
Academic Program Viability Report UD 2019-20 Page 200

St. Petersburg College
Program Goals and Strategies Program: Public Policy and Administration Date Completed: 2/2/2021 Due Date: August 2021 Prepared By: Jeff Kronschnabl I. Goals
Program Goals SPC Commitment Pillar
1 Improve student success by offering more internship and/or “shadowing” opportunities for students to test drive career opportunities.
Academic Excellence
2 Develop a marketing plan to launch our program to surrounding counties – 5 county area.
Community Engagement
II. Strategies
Strategies to be Implemented Viability Metric Target Outcome
Goal # Responsible Individuals
1
Continue our relationships with the HR Directors within Pinellas County to include my serving on Pinellas Counties HR Board.
Internship: Increase internship enrollment by 2%.
1 Jeff Kronschnabl
2
Attend major/program fairs with local colleges not offering a B.S. Degree in Public Policy & Administration.
SSH Enrollment: Increase enrollment of students from surrounding counties by 2%.
2 Jeff Kronschnabl
III. Special Resources Needed: Audio/video equipment and our portable kiosk.
IV. Area(s) of Concern/Improvement: N/A
Academic Program Viability Report UD 2019-20 Page 201

ACADEMIC PROGRAM VIABILITY REPORTStudent Count by Academic Year
0
200
400
600
800
2017 2018 2019 2020
884 856
737
542
SSH By Campus
Campus 2017
2018
2019
2020
Allstate Center 6,705 6,138 5,418 3,432Total 6,705 6,138 5,418 3,432
Student Count by Ethnic Group and Academic Year
0
200
400
600
2017 2018 2019 2020
15 15 16 9
135155
13299107 95 84
61
586543
466
345
Ethnic Group Asian Black/African American Hispanic/Latino White
Success Rate by Academic Year
0%
20%
40%
60%
80%
2017 2018 2019 2020
85.3% 87.2% 88.5% 87.4%
Term
All
Program
All
Plan
All
College School Depart…
All
Success Rate By Course
Academic YearSubject
2017StudentCount
EnrollmentCount
SuRa
CJC3311CJC3601CJE3263CJE3341CJE3361CJE3611FES3003FES3015FES3533FES3780FES3823FES3833FES4014FES4585FFP3785MAN3301PAD3034PAD3311PAD3820PAD3874PAD4014PAD4046PAD4204
132814422532799
222528221215
37285
112130184
132814422532799
222528221215
38085
121133192
1
1
47111178
47114184
Total 884 2,235
Academic Organization
Public Safety Admin …
Community
All
FTIC Flag
All
Part Full Time
All
Gender
All
Academic Program Viability Report UD 2019-20 Page 202

ACADEMIC PROGRAM VIABILITY REPORT
Academic Plan
All Academic Plan Id Student Count Enrollment Count
Units Taken Success Rate Grads Count2019-20
Enrolled in Fall2020-21 (0580)
Retention Rate0565 to 0580
EDST-BSPSA-BASHSA-BASPPA-BSMGTORG-BASSUSMGT-BASGEN-AABUS-BSCST-ASCJPSS-ASEAM-ASDENH-BASLEGAL-BASENRCH-NOFIRE-ASHSA-ASCRIM-TRBACCAPP-NOELEDR-BSBUS-AS
82215536099 4 1 1
708686532363159755240352726211914111110887
2,1082,0661,5991,092
5042261531321007979635736332732242421
83.8 %83.5 %88.7 %93.7 %82.4 %84.0 %96.2 %85.0 %94.3 %96.3 %96.2 %
100.0 %84.2 %85.7 %
100.0 %81.8 %
100.0 %100.0 %100.0 %57.1 %
1672111234 2 1
52111333564 1
80.5 %77.2 %79.2 %76.7 %
100.0 %77.8 %
75.0 %
100.0 %
Total 436 2,869 8,639 86.8 % 121 242 78.0 %
78%Retention Rate 0565 to 0580
242Enrolled in Fall 2020-21
86.8%Success Rate Fall 2019-20
Academic Program
All
College School Depart…
All
Academic Organization…
PSA - UD
Community
All
FTIC Flag
All
Ethnic Group
All
Gender
All
121Grads Count 2019-20
436Student Count Fall 2019-20
Academic Program Viability Report UD 2019-20 Page 203

ACADEMIC PROGRAM VIABILITY REPORTNumber of Grads and Number of Awards by Academic Year
0
20
40
60
80
2018 2017 2019
8782
64
8782
64
Number of Grads Number of Awards
Student Count by Ethnic Group and Academic Year
0
20
40
60
2018 2017 2019
3
17
97
9 810
58 58
44
Student.Ethnic Group Asian Black/African American Hispanic/Latino White
Term
All
Program
All
Plan
PSA-BAS
Academic YearDegree
2017Numberof Grads
Numberof Awards
2018Numberof Grads
Numberof Awards
2019Numberof Grads
Numberof Awards
BASPSA-BAS
8282
8282
8787
8787
6464
6464
Total 82 82 87 87 64 64
Gender
All
Academic Program Viability Report UD 2019-20 Page 204

ACADEMIC PROGRAM VIABILITY REPORT
Academic Plan
All
79.1%Retention Rate 0535 to 0550
309Enrolled in Fall 2018-19
554Student Count Fall 2017-18
85.9%Success Rate Fall 2017-18
Academic Program
All
College School Depart…
All
Academic Organization…
PSA - UD
Community
All
FTIC Flag
All
Ethnic Group
All
Gender
All
168Grads Count 2017-18
540Student Count Fall 2018-19
436Student Count Fall 2019-20
86.4%Success Rate Fall 2018-19
86.8%Success Rate Fall 2019-20
289Enrolled in Fall 2019-20
242Enrolled in Fall 2020-21
168Grads Count 2018-19
121Grads Count 2019-20
79.3%Retention Rate 0550 to 0565
78%Retention Rate 0565 to 0580
Academic Plan Id Retention Rate 0535 to 0550 Retention Rate 0550 to 0565 Retention Rate 0565 to 0580
ACTAP-CTBACCAPP-NOBUS-BSDENH-BASEDST-BSENRCH-NOFIRE-ASHSA-ASHSA-BASLEGAL-BASMGTORG-BASPPA-BSPSA-BASSUSMGT-BAS
50.0 %81.3 %
100.0 %76.1 %
100.0 %
89.4 %75.0 %77.8 %71.6 %79.6 %95.7 %
100.0 %
91.7 %100.0 %78.3 %
100.0 %100.0 %100.0 %77.8 %
100.0 %80.0 %90.9 %76.0 %
100.0 %
75.0 %100.0 %80.5 %
79.2 %
100.0 %76.7 %77.2 %77.8 %
Total 79.1 % 79.3 % 78.0 %Academic Program Viability Report UD 2019-20 Page 205

��������� ������ ������� ��������� ����� � ����� ����
�������������� ������� ��!���"��������������� ������� ��������� ����������� ���� ���# $�$
%&'()*+,-. /)012))3 4-)5(,6) %,.)1 7+8)(. 9+&( :::%)'(;& .&,1 1,.)%*<=>?1,-)11 :-.)@@,A)-;) B,-'-;,'@ :-2+(C'.,+- 7);(?,.C)-. '-3 D3C,11,+-1 = 5).',@1 %.?3)-. :-2+(C'.,+- EFGHIJF KJLMNOPFQMJ R SIFPQTUVWXYZ[V \]_]WZ [Wa[b[cd eYf]c g \Y]VYhc ijbb k-(+@@C)-.l*)(2+(C'-;)l*)(;)-. B?@@lm('3?'.)1l<+?(1) m(+?n1\Y]VYhc ijbb oYc][V p]Wfq <@'11 %.'.?1r stFQuIv wGTTv EFMx wGNFyIN zJNMTTOIJFv <@'11 D;'3)C,; m(+?nr {Sv |Sv <@'11 <+@@)A) %;&++@ 5)n. = D;'3)C,; m(+?n 5)1; = D;'3)C,; 4(A'-,}'.,+- = %?8~);. <'.'@+A /8(r �Es R |S
\Y]VYhc ijbb oYc][V ad �h�c]jVc[hWb oYcqX ������� �������� ���� � ���� ������������ ����������� ����� ���������� ���� ��������� ��� �¡ ¢��£������ ¤£��� ¥ � ¦ ¥�§���� ���� ��������� ��� �¡ �������� ¤£���� £�� §�� �� §©����� ���� ��������� ��� �¡ ª������ ���� §�«¦¬ ��«�¬ ��«�¬����� ���� ��������� ���¥�¡ ¢��£������ ¤£��� ¥�¦ ¥�¦����� ���� ��������� ���¥�¡ �������� ¤£���� £�� §�� §������� ���� ��������� ���¥�¡ ª������ ���� §§«�¬ §§«�¬������ ���� ��������� ���¥�¡ ¢��£������ ¤£��� ��� ��������� ���� ��������� ���¥�¡ �������� ¤£���� £�� ©�� ©�������� ���� ��������� ���¥�¡ ª������ ���� ��«©¬ ��«©¬���� ���� ��������� ���§�¡ ¢��£������ ¤£��� §�� �� §������ ���� ��������� ���§�¡ �������� ¤£���� £�� §�¥ �� §�¥���� ���� ��������� ���§�¡ ª������ ���� ���«§¬ ���«�¬ ���«¥¬ <@'11 %.'.?1r stFQuIv wGTTv EFMx wGNFyIN zJNMTTOIJFv <@'11 D;'3)C,; m(+?nr {Sv |Sv <@'11 <+@@)A) %;&++@ 5)n. = D;'3)C,; m(+?n 5)1; = D;'3)C,; 4(A'-,}'.,+- = %?8~);. <'.'@+A /8(r �Es R |Sv B,@.)( )Cn.® (+01 '-3 ;+@?C-1
Academic Program Viability Report UD 2019-20 Page 206
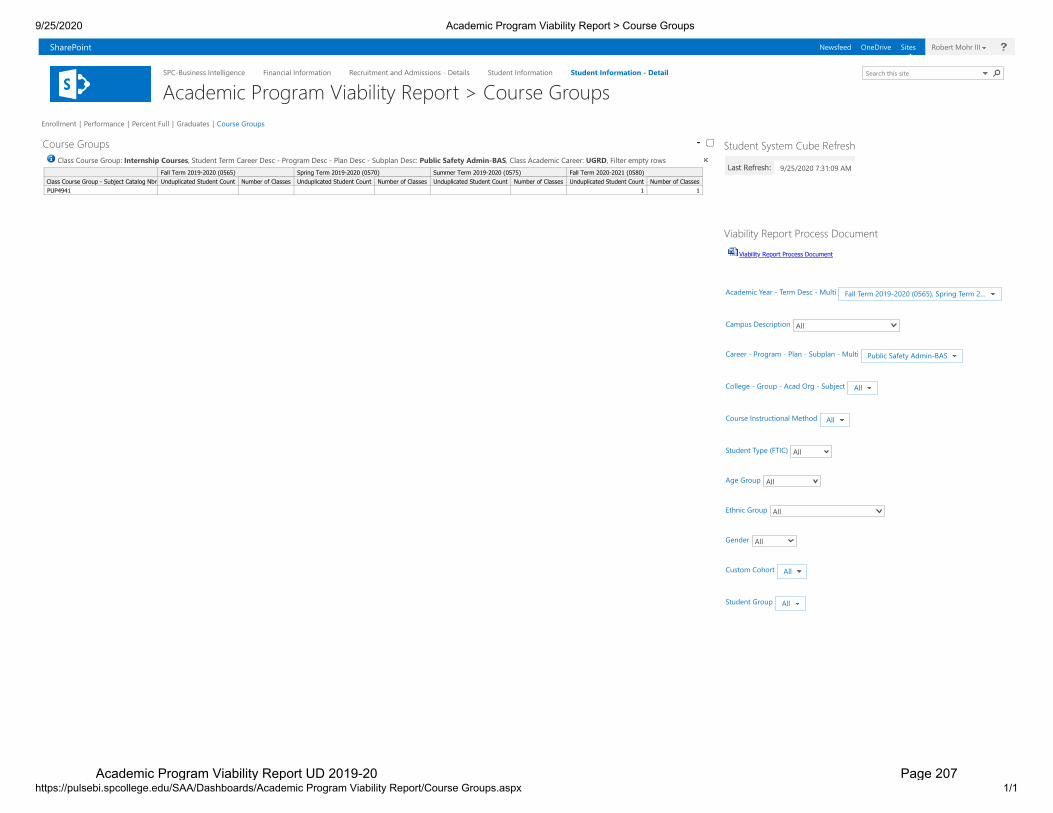
��������� ������ ������� ��������� ����� � ����� ������
�������������� ������� ��!���"��������������� ������� ��������� ����������� ������ ���# $�$
%&'()*+,-. /)012))3 4-)5(,6) %,.)1 7+8)(. 9+&( :::%)'(;& .&,1 1,.)%*<=>?1,-)11 :-.)@@,A)-;) B,-'-;,'@ :-2+(C'.,+- 7);(?,.C)-. '-3 D3C,11,+-1 = 5).',@1 %.?3)-. :-2+(C'.,+- EFGHIJF KJLMNOPFQMJ R SIFPQTUVWXYZ[V \]_]WZ [Wa[b[cd eYf]c g hi]jY k]ifj l-(+@@C)-.m*)(2+(C'-;)m*)(;)-. B?@@mn('3?'.)1m<+?(1) n(+?o1hi]jY k]ifj pqrr stuv wxyz{wxwx |x}~}� ��u��� stuv wxyz{wxwx |x}�x� ��vvtu stuv wxyz{wxwx |x}�}� pqrr stuv wxwx{wxwy |x}�x��rq�� ���u�t �u��� { ����t�� �q�qr�� ��u�����r��q�t� ����t�� ����� ��v�tu �� �rq��t� �����r��q�t� ����t�� ����� ��v�tu �� �rq��t� �����r��q�t� ����t�� ����� ��v�tu �� �rq��t� �����r��q�t� ����t�� ����� ��v�tu �� �rq��t�����z�y y y <@'11 <+?(1) n(+?o� KJFINJ��Q� �MGN�I�� %.?3)-. �)(C <'())( 5)1; = *(+A('C 5)1; = *@'- 5)1; = %?8o@'- 5)1;� �G�TQ� EPLIF ¡HOQJR¢¡E� <@'11 D;'3)C,; <'())(� £¤¥S� B,@.)( )Co.¦ (+01 §ciXYc §djcYZ hiaY eY©]Yjª«q�� ¬t�ut�® °±²°±³±³ �µ¶�³ D9[Wa[b[cd eYf]c \]VYjj ·ViZYc �q��r��¹ ¬t��u� �u��t�� º���vt��D;'3)C,; »)'( = �)(C 5)1; = 9?@., B'@@ �)(C ±³¶=±³±³ ¼³²½²¾� %o(,-A �)(C ±¿<'Co?1 5)1;(,o.,+- D@@<'())( = *(+A('C = *@'- = %?8o@'- = 9?@., *?8@,; %'2).¦ D3C,-=>D%<+@@)A) = n(+?o = D;'3 4(A = %?8À);. D@@<+?(1) :-1.(?;.,+-'@ 9).&+3 D@@%.?3)-. �¦o) ¼B�:<¾D@@DA) n(+?o D@@l.&-,; n(+?o D@@n)-3)(D@@<?1.+C <+&+(. D@@%.?3)-. n(+?o D@@Academic Program Viability Report UD 2019-20 Page 207

Industry Certification Attainment
An industry certification or equivalent state or national exam has not been identified for the Public
Safety Administration program for evidence of certification attainment at the baccalaureate level.
Academic Program Viability Report UD 2019-20 Page 208

2019-20 Placement Data
*Refers to graduates found to be employed full-time or part-time.
Source: http://www.fldoe.org/accountability/fl-edu-training-placement-info-program/fl-college-system-reports.stml
PSA BAS Pool Count Percent Placed 2014-15 74 88% 2015-16 78 81% 2016-17 76 84% 2017-18 88 72%
Academic Program Viability Report UD 2019-20 Page 209
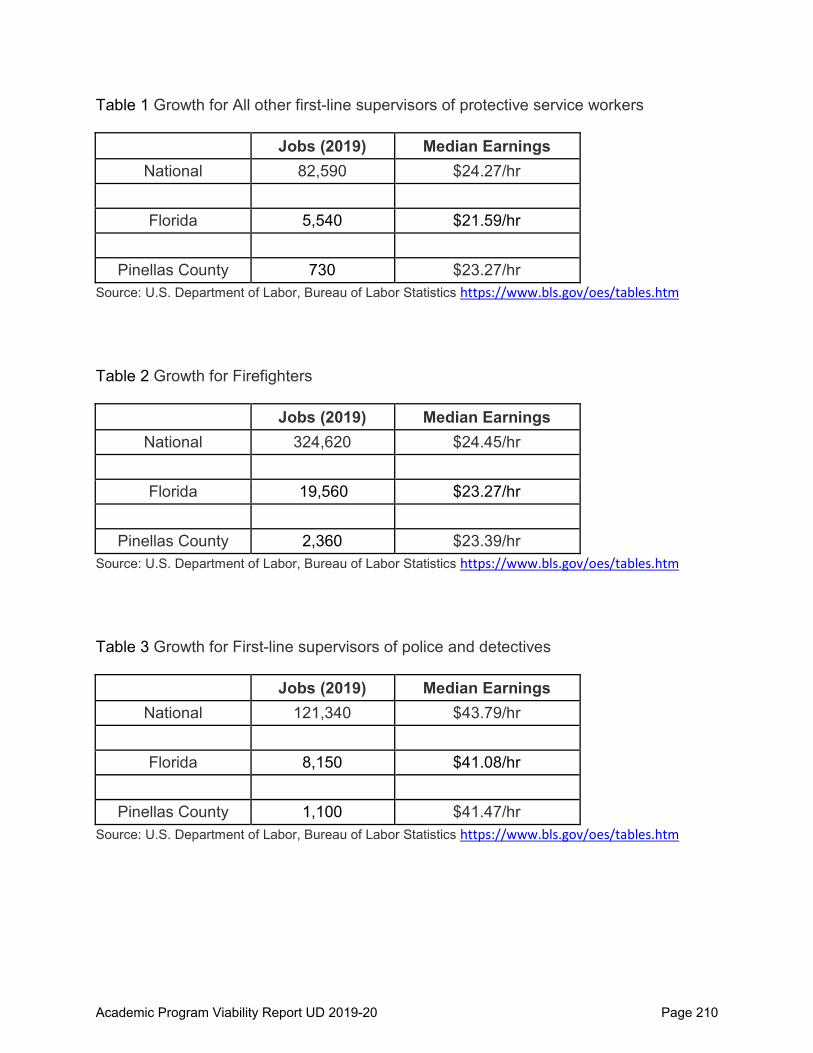
Table 1 Growth for All other first-line supervisors of protective service workers
Jobs (2019) Median Earnings National 82,590 $24.27/hr
Florida 5,540 $21.59/hr
Pinellas County 730 $23.27/hr
Source: U.S. Department of Labor, Bureau of Labor Statistics https://www.bls.gov/oes/tables.htm
Table 2 Growth for Firefighters
Jobs (2019) Median Earnings National 324,620 $24.45/hr
Florida 19,560 $23.27/hr
Pinellas County 2,360 $23.39/hr
Source: U.S. Department of Labor, Bureau of Labor Statistics https://www.bls.gov/oes/tables.htm
Table 3 Growth for First-line supervisors of police and detectives
Jobs (2019) Median Earnings National 121,340 $43.79/hr
Florida 8,150 $41.08/hr
Pinellas County 1,100 $41.47/hr
Source: U.S. Department of Labor, Bureau of Labor Statistics https://www.bls.gov/oes/tables.htm
Academic Program Viability Report UD 2019-20 Page 210

Table 4 Growth for Detectives and criminal investigators
Jobs (2019) Median Earnings National 105,620 $39.99/hr
Florida 6,890 $30.83/hr
Pinellas County 1,180 $38.90/hr
Source: U.S. Department of Labor, Bureau of Labor Statistics https://www.bls.gov/oes/tables.htm
Table 5 Growth for Police and sheriff’s patrol officers
Jobs (2019) Median Earnings National 665,280 $30.36/hr
Florida 39,090 $28.07/hr
Pinellas County 5,880 $28.59/hr
Source: U.S. Department of Labor, Bureau of Labor Statistics https://www.bls.gov/oes/tables.htm
Table 6 Growth for Emergency management directors
Jobs (2019) Median Earnings National 10,060 $35.86/hr
Florida 400 $39.96/hr
Pinellas County 70 $37.98/hr
Source: U.S. Department of Labor, Bureau of Labor Statistics https://www.bls.gov/oes/tables.htm
Academic Program Viability Report UD 2019-20 Page 211

Table 7 Growth for Probation officers and correctional treatment specialists
Jobs (2019) Median Earnings National 88,120 $26.10/hr
Florida 2,150 $17.67/hr
Pinellas County 380 $17.23/hr
Source: U.S. Department of Labor, Bureau of Labor Statistics https://www.bls.gov/oes/tables.htm
Academic Program Viability Report UD 2019-20 Page 212

Perkins Completion & Non-Traditional Completion Performance
Perkins completion metrics do not apply to baccalaureate programs.
Academic Program Viability Report UD 2019-20 Page 213

Action Plan Follow-up and Evaluation Report for 2018-19 Viability Report Program: Public Safety Administration, Upper Division Date Completed: August 2020 Prepared By: Frank, Afienko, Beck and Rasor I. Action Plan Items Status
Action Item
Measure
Addressed (Value)
Completion
Status
Status Explanation
1
Develop a veteran-friendly academic path where a series of courses would be offered face-to-face to allow veteran students to receive their full benefits and be in compliance. This item was carried forward from the 2017-18 Action Plan.
SSH Enrollment
Not Completed
Class lists revealed low number of veterans in our program.
2
We will review the current program and adjust accordingly. Currently, the focus will be creating a leadership track and re-branding the degree program. This item was carried forward from the 2017-18 Action Plan.
SSH Enrollment
Not Completed
Dean wanted to rename program before initiating this action item. Renaming program was going to be completed by Dean in December 2019 but did not occur.
Academic Program Viability Report UD 2019-20 Page 214
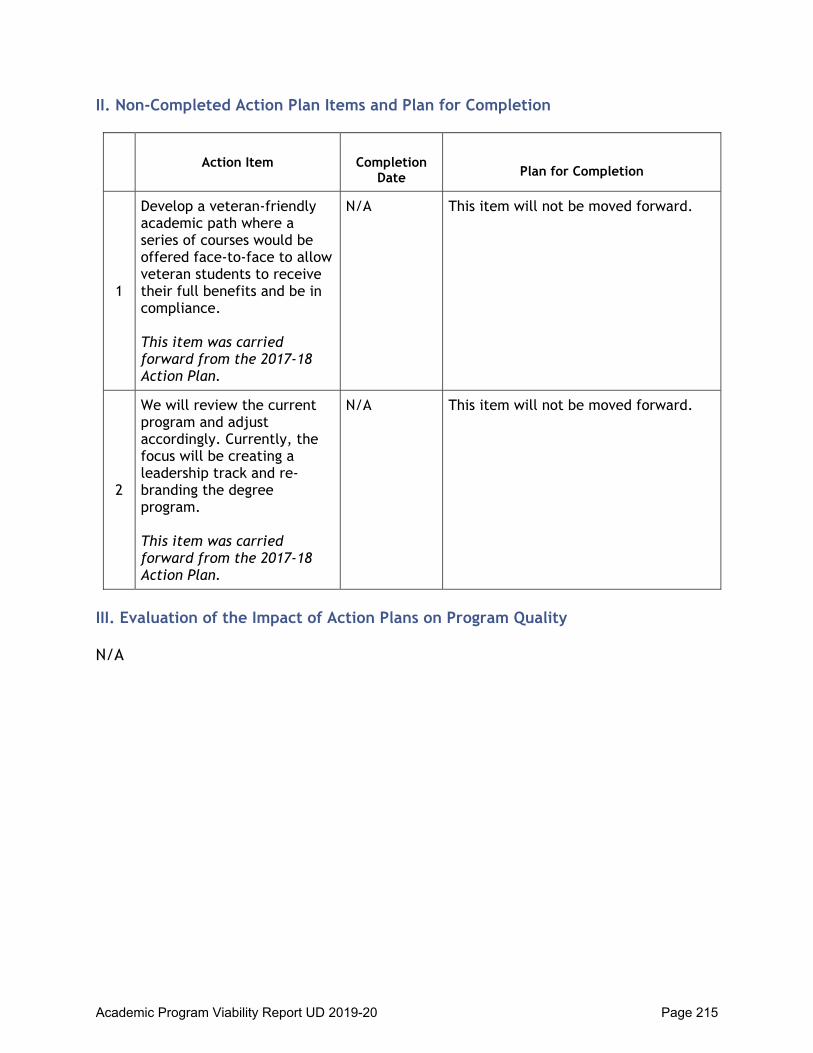
II. Non-Completed Action Plan Items and Plan for Completion
Action Item
Completion
Date
Plan for Completion
1
Develop a veteran-friendly academic path where a series of courses would be offered face-to-face to allow veteran students to receive their full benefits and be in compliance. This item was carried forward from the 2017-18 Action Plan.
N/A This item will not be moved forward.
2
We will review the current program and adjust accordingly. Currently, the focus will be creating a leadership track and re-branding the degree program. This item was carried forward from the 2017-18 Action Plan.
N/A This item will not be moved forward.
III. Evaluation of the Impact of Action Plans on Program Quality N/A
Academic Program Viability Report UD 2019-20 Page 215

St. Petersburg College
Program Goals and Strategies Program: Public Safety Administration, Upper Division Date Completed: 2/2/2021 Due Date: August 2021 Prepared By: Carol Rasor-Cordero and Rosanne Beck I. Goals
Program Goals SPC Commitment Pillar
1 Improve student engagement and workforce readiness by enhancing subplans to reflect needs in the public safety industry.
Community Engagement
2 Improve student success by reviewing sequencing of course offerings. Academic Excellence II. Strategies
Strategies to be Implemented Viability Metric Target Outcome
Goal # Responsible Individuals
1
Create a digital forensic subplan and certificate to meet the needs in the public safety industry.
SSH Enrollment: To increase enrollment in the Public Safety Administration Program by 2 percent in year 1 of the adoption of program.
1 Dean and Faculty
2
Improve student success by offering all core courses within a one year period.
Graduates: Increase graduation rates by 2 percent.
2 Dean and Faculty
III. Special Resources Needed: Funding to develop a Digital Forensic Subplan and Certificate.
IV. Area(s) of Concern/Improvement: Concerns about student enrollment due to Covid and any future pandemics.
Academic Program Viability Report UD 2019-20 Page 216

ACADEMIC PROGRAM VIABILITY REPORTStudent Count by Academic Year
0
100
200
300
2017 2018 2019 2020
288265
299
238
SSH By Campus
Campus 2017
2018
2019
2020
Bay Pines FacilityClearwater CampusTarpon Springs Campus
882,976
202,932
28
122,968
21,789
Total 3,064 2,980 2,980 1,791
Student Count by Ethnic Group and Academic Year
0
50
100
150
200
2017 2018 2019 2020
11 12 815
25 23 27 25
43 39
55
36
192178
193
147
Ethnic Group Asian Black/African American Hispanic/Latino White
Success Rate by Academic Year
0%
20%
40%
60%
80%
2017 2018 2019 2020
85.7% 87.5% 85.1%
42.3%
Term
All
Program
All
Plan
All
College School Depart…
All
Success Rate By Course
Academic YearSubject
2017StudentCount
EnrollmentCount
SuRa
BCH4024BOT3015BOT3015LBOT3143CBSC3017BSC3052BSC3312CBSC3931BSC3931LBSC3932BSC4422CBSC4905CBSC4931BSC4940MCB3020MCB3020LPCB3023PCB3023LPCB3043PCB3043LPCB3063PCB3063LPCB4024
815959
716
13498
3913124330747140367273
836060
716
13608
4013144535767141377374
11
1
11
94916
95926 1
Total 288 1,346
Academic Organization
Biology-UD
Community
All
FTIC Flag
All
Part Full Time
All
Gender
All
Academic Program Viability Report UD 2019-20 Page 217

ACADEMIC PROGRAM VIABILITY REPORT
Academic Plan
All Academic Plan Id Student Count Enrollment Count
Units Taken Success Rate Grads Count2019-20
Enrolled in Fall2020-21 (0580)
Retention Rate0565 to 0580
BIOLOGY-BSENRCH-NOBACCAPP-NOBIO-TRBIOT-ASHSA-ASGEN-AATRANS-NOJOB-NOHSA-BASCST-ASENGINE-TRNURSE-ASBSCED-BSCHEMBS-TRCWPA-ASELEDR-BSFTCMBIO-TRFTBIOMD-TRHSA-CT
135167 24 541 1 1
599916150412219181287775555544
1,39821214913010051474127221916392415111414108
86.5 %90.1 %86.9 %90.0 %82.9 %
100.0 %100.0 %72.2 %
100.0 %100.0 %85.7 %
100.0 %100.0 %60.0 %80.0 %
100.0 %100.0 %100.0 %100.0 %100.0 %
48 1
6941 11
83.0 %25.0 %14.3 %
50.0 %25.0 %
100.0 %
Total 181 999 2,411 87.3 % 49 78 67.4 %
67.4%Retention Rate 0565 to 0580
78Enrolled in Fall 2020-21
87.3%Success Rate Fall 2019-20
Academic Program
All
College School Depart…
All
Academic Organization…
BIOLOGY-UD
Community
All
FTIC Flag
All
Ethnic Group
All
Gender
All
49Grads Count 2019-20
181Student Count Fall 2019-20
Academic Program Viability Report UD 2019-20 Page 218

ACADEMIC PROGRAM VIABILITY REPORTNumber of Grads and Number of Awards by Academic Year
0
20
40
2019 2018 2017
49
40 39
49
40 39
Number of Grads Number of Awards
Student Count by Ethnic Group and Academic Year
0
10
20
30
40
2019 2018 2017
1
6
1 1
4 5 5
38
31
28
Student.Ethnic Group Asian Black/African American Hispanic/Latino White
Term
All
Program
All
Plan
BIOLOGY-BS
Academic YearDegree
2017Numberof Grads
Numberof Awards
2018Numberof Grads
Numberof Awards
2019Numberof Grads
Numberof Awards
BSBIOLOGY-BS
3939
3939
4040
4040
4949
4949
Total 39 39 40 40 49 49
Gender
All
Academic Program Viability Report UD 2019-20 Page 219

ACADEMIC PROGRAM VIABILITY REPORT
Academic Plan
All
66.3%Retention Rate 0535 to 0550
99Enrolled in Fall 2018-19
205Student Count Fall 2017-18
88.3%Success Rate Fall 2017-18
Academic Program
All
College School Depart…
All
Academic Organization…
BIOLOGY-UD
Community
All
FTIC Flag
All
Ethnic Group
All
Gender
All
44Grads Count 2017-18
176Student Count Fall 2018-19
181Student Count Fall 2019-20
89.9%Success Rate Fall 2018-19
87.3%Success Rate Fall 2019-20
99Enrolled in Fall 2019-20
78Enrolled in Fall 2020-21
46Grads Count 2018-19
49Grads Count 2019-20
77.3%Retention Rate 0550 to 0565
67.4%Retention Rate 0565 to 0580
Academic Plan Id Retention Rate 0535 to 0550 Retention Rate 0550 to 0565 Retention Rate 0565 to 0580
BACCAPP-NOBIOLOGY-BSBIOT-ASBIO-TRBSCED-BSEDST-BSENGINE-TRENRCH-NOENVSC-ASFSPBIO-TRGEN-AAHSA-ASMGSED-BSPHARM-TRREADM NO
46.7 %80.6 %
100.0 %
100.0 %50.0 %
29.0 %66.7 %
100.0 %
100.0 %
33.3 %85.0 %
100.0 %50.0 %
100.0 %
46.2 %100.0 %100.0 %100.0 %33.3 %
100.0 %
14.3 %83.0 %50.0 %
100.0 %25.0 %50.0 %
25.0 %
100 0 %Total 66.3 % 77.3 % 67.4 %Academic Program Viability Report UD 2019-20 Page 220

��������� ������ ������� ��������� ����� � ����� ����
�������������� ������� ��!���"��������������� ������� ��������� ����������� ���� ���# $�$
%&'()*+,-. /)012))3 4-)5(,6) %,.)1 7+8)(. 9+&( :::%)'(;& .&,1 1,.)%*<=>?1,-)11 :-.)@@,A)-;) B,-'-;,'@ :-2+(C'.,+- 7);(?,.C)-. '-3 D3C,11,+-1 = 5).',@1 %.?3)-. :-2+(C'.,+- EFGHIJF KJLMNOPFQMJ R SIFPQTUVWXYZ[V \]_]WZ [Wa[b[cd eYf]c g \Y]VYhc ijbb k-(+@@C)-.l*)(2+(C'-;)l*)(;)-. B?@@lm('3?'.)1l<+?(1) m(+?n1\Y]VYhc ijbb oYc][V p]Wfq <@'11 %.'.?1r stFQuIv wGTTv EFMx wGNFyIN zJNMTTOIJFv <@'11 D;'3)C,; m(+?nr {Sv |Sv <@'11 <+@@)A) %;&++@ 5)n. = D;'3)C,; m(+?n 5)1; = D;'3)C,; 4(A'-,}'.,+- = %?8~);. <'.'@+A /8(r �K�{���R|S
\Y]VYhc ijbb oYc][V ad �h�c]jVc[hWb oYcqX ������� �������� ���� � ���� ������������ � ������� ������������ ����������� ����� ���������� ���� � ¡¢�� � £ ¤¥¤¦ §��������� ���� ¤¡¤ © ª¢¢ ¡« ¡¢���� ���� � ¡¢�� � £ ¤¥¤¦ �������� ����� ¬��� ¤¥¡ ¥ ¤ �ª � ���� ���� � ¡¢�� � £ ¤¥¤¦ ®������ ���� ¢¡©° ¡�¤ ° ©«¢° «ª¢° ¢¤ °�����± ���� � ¡¢�� � £ ¤« ¦ §��������� ���� ¤�¥ ¥ �© ¢ ©ª�����± ���� � ¡¢�� � £ ¤« ¦ �������� ����� ¬��� ¥ª¡ ¡ ¤ª� ¤ ©�����± ���� � ¡¢�� � £ ¤« ¦ ®������ ���� ©ª° ¥ ° © ¤° ¡© ° ¢©©°������ ���� � ¡¢�� � £ ¤«¤¦ §��������� ���� �¤ ¡ª¤ ¡¡ ������ ���� � ¡¢�� � £ ¤«¤¦ �������� ����� ¬��� ª¡ª ¡©¡ ¡ª������� ���� � ¡¢�� � £ ¤«¤¦ ®������ ���� «©ª° «¥° ©ªª°���� ���� � � �� �¡ £ ¤© ¦ §��������� ���� « ¤© ©¢ ¥ « �ªª���� ���� � � �� �¡ £ ¤© ¦ �������� ����� ¬��� ¤ ª ¥ ¡� ¢¥ ¡ª �¡ ���� ���� � � �� �¡ £ ¤© ¦ ®������ ���� ©©¢° ¢¥«° «¡©° ¥�¤° ¤ª©° ¡¡¡ ° <@'11 %.'.?1r stFQuIv wGTTv EFMx wGNFyIN zJNMTTOIJFv <@'11 D;'3)C,; m(+?nr {Sv |Sv <@'11 <+@@)A) %;&++@ 5)n. = D;'3)C,; m(+?n 5)1; = D;'3)C,; 4(A'-,}'.,+- = %?8~);. <'.'@+A /8(r �K�{���R|Sv B,@.)( )Cn.² (+01 '-3 ;+@?C-1
Academic Program Viability Report UD 2019-20 Page 221

SharePoint Newsfeed OneDrive Sites Amy Eggers
Search this siteSPC-Business Intelligence Financial Information Recruitment and Admissions - Details Student Information Student Information - Detail
Academic Program Viability Report > Course Groups Enrollment | Performance | Percent Full | Graduates | Course Groups
Course Groups
Fall Term 2019-2020 (0565) Spring Term 2019-2020 (0570) Summer Term 2019-2020 (0575) Fall Term 2020-2021 (0580)Class College School Dept - Academic Group Desc - Academic Organization -… Unduplicated Student Count Number of Classes Unduplicated Student Count Number of Classes Unduplicated Student Count Number of Classes Unduplicated Student Count Number of ClassesBSC4905C 5 3 7 4 2 1 3 2BSC4931 24 1 23 1 6 1 16 1BSC4940 11 2 7 3 3 1
Class Course Group: Internship Courses, Student Term Career Desc - Program Desc - Plan Desc - Subplan Desc: Biology-BS, Class Academic Career: UGRD, Filter empty rows Student System Cube Refresh
Last Refresh: 12/9/2020 8:33:43 AM
Viability Report Process DocumentViability Report Process Document
Academic Year - Term Desc - Multi Fall Term 2019-2020 (0565), Spring Te…
Campus Description All
Career - Program - Plan - Subplan - Multi Biology-BS
College - Group - Acad Org - Subject All
Course Instructional Method All
Student Type (FTIC) All
Age Group All
Ethnic Group All
Gender All
Custom Cohort All
Student Group All
Academic Program Viability Report > Course Groups https://pulsebi.spcollege.edu/SAA/Dashboards/Academic Program Viability Report/Course Gr...
1 of 1 12/9/2020, 3:24 PM
Academic Program Viability Report UD 2019-20 Page 222

Industry Certification Attainment
An industry certification or equivalent state or national exam has not been identified for the Biology, BS program for evidence of certification attainment at the baccalaureate level.
Academic Program Viability Report UD 2019-20 Page 223

2019-20 Placement Data
*Refers to graduates found to be employed full-time or part-time.
BIO BS Pool Count Percent Placed 2014-15 34 79% 2015-16 46 65% 2016-17 47 68% 2017-18 40 70%
Source: http://www.fldoe.org/accountability/fl-edu-training-placement-info-program/fl-college-system-reports.stml
Academic Program Viability Report UD 2019-20 Page 224

Table 1 Growth for Natural sciences managers
Jobs (2019) Median Earnings National 67,720 $62.07/hr
Florida 2,230 $37.05/hr
Pinellas County 190 $38.67/hr
Source: U.S. Department of Labor, Bureau of Labor Statistics https://www.bls.gov/oes/tables.htm
Table 2 Growth for Biological scientists, all other
Jobs (2019) Median Earnings National 40,100 $39.53/hr
Florida 1,670 $33.51/hr
Pinellas County NA* $29.72/hr
*Estimates not released. Source: U.S. Department of Labor, Bureau of Labor Statistics https://www.bls.gov/oes/tables.htm
Table 3 Growth for Life scientists, all other
Jobs (2019) Median Earnings National 6,450 $36.49/hr
Florida 130 $40.16/hr
Pinellas County NA $/hr
Source: U.S. Department of Labor, Bureau of Labor Statistics https://www.bls.gov/oes/tables.htm
Academic Program Viability Report UD 2019-20 Page 225

Table 4 Growth for Biological technicians
Jobs (2019) Median Earnings National 79,530 $22.05/hr
Florida 3,250 $19.70/hr
Pinellas County 520 $20.10/hr
Source: U.S. Department of Labor, Bureau of Labor Statistics https://www.bls.gov/oes/tables.htm
Academic Program Viability Report UD 2019-20 Page 226

Perkins Completion & Non-Traditional Completion Performance
Perkins completion metrics do not apply to baccalaureate programs.
Academic Program Viability Report UD 2019-20 Page 227

Action Plan Follow-up and Evaluation Report for 2018-19 Viability Report Program: Biology, Upper Division Date Completed: August 2020 Prepared By: Dr. Natavia Middleton and Linda Gingerich I. Action Plan Items Status
Action Item
Measure
Addressed (Value)
Completion
Status
Status Explanation
1
Study use of Subject Matter ETS Field tests at other institutions. Determine an appropriate minimum score for passing. Discuss use of scores in letters of recommendations with ETS.
Graduates Completed We investigated minimums required for other. Other schools encourage students to post high scores on their CVs so use in letters is possible. UF also does awards based on high scores, which is something we should consider.
2
Develop Senior Seminar (BSC 4931, Theory and Practice (BSC 3017) and Ecology (PCB 3043) as online courses to further increase flexibility of scheduling and ensure consistency across faculty.
Graduates Not Completed
BSC 3017 and PCB 3043 are complete. Just started BSC 4931.
3
Incorporate career exploration and preparation into BSC 3017 (theory and practice), BSC 4931 (senior seminar), and BSC 4940 (internship) and expand internship base.
Job Placement
Not Completed
Career exploration incorporated into BSC 3017 and BSC 4931. Expansion of internship base has stalled a bit due to Covid.
Academic Program Viability Report UD 2019-20 Page 228

II. Non-Completed Action Plan Items and Plan for Completion
Action Item
Completion
Date
Plan for Completion
2
Develop Senior Seminar (BSC 4931, Theory and Practice (BSC 3017) and Ecology (PCB 3043) as online courses to further increase flexibility of scheduling and ensure consistency across faculty.
May 2021 Just began standard course development Sept 2020.
3
Incorporate career exploration and preparation into BSC 3017 (theory and practice), BSC 4931 (senior seminar), and BSC 4940 (internship) and expand internship base.
May 2021 New website for Advisory boards will hopefully allow us to expand this.
III. Evaluation of the Impact of Action Plans on Program Quality The completion of the standard course development for BSC 3017 and PCB 3043 allow us to offer more flexibility in course scheduling. With a small program often offering only one section of each class, scheduling can be challenging for students. We expect with more online and Live Online formats, students will be able to complete more SSH per semester and finish in a timely manner. Standard courses also offer increased program cohesiveness and maintains high academic standards. Aligning our criteria for success on the ETS test with Florida universities helps us promote our standing among other institutions. Offering awards for high scoring students and creating a scale for the test rather than pass/fail in the Senior Seminar class might encourage students to do well on the ETS.
Academic Program Viability Report UD 2019-20 Page 229

St. Petersburg College
Program Goals and Strategies Program: Biology, Upper Division Date Completed: 2/5/2021 Due Date: August 2021 Prepared By: Linda Gingerich I. Goals
Program Goals SPC Commitment Pillar
1 Collaborate with Honor's College to Propose a Baccalaureate Honor's program in Biology.
Academic Excellence
2 Expand internships, especially in virtual environments. Also expand internal internships within science labs.
Community Engagement
II. Strategies
Strategies to be Implemented Viability Metric Target Outcome
Goal # Responsible Individuals
1
Determine the entry requirements for Honor's Biology program and determine the requirements to graduate with Honor's designation. Expand undergraduate research opportunities.
SSH Enrollment: Increase SSH by 5%. Increase enrollment in Undergraduate research by 5%.
1 Linda Gingerich,
Natavia Middleton
2
Create lists of internships for both face-to-face and virtual options. Work with lab staff to develop a plan to integrate internship within science labs.
Internship: Increase internship participation by 5%.
2 Linda Gingerich,
Natavia Middleton
III. Special Resources Needed: OPS funds to help lab staff train interns and coordinate schedules.
IV. Area(s) of Concern/Improvement: N/A
Academic Program Viability Report UD 2019-20 Page 230

ACADEMIC PROGRAM VIABILITY REPORTStudent Count by Academic Year
0
200
400
600
800
1,000
2017 2018 2019 2020
976
817 816
483
SSH By Campus
Campus 2017
2018
2019
2020
Clearwater CampusDowntown/MidtownEpiCenterSeminole CampusSt Petersburg/Gibbs CampusTarpon Springs Campus
1,827153
1,437
1,2391,410
1,569192
1,257
1,3711,164
831546984210
1,7581,512
38132462496
597708
Total 6,066 5,553 5,841 2,730
Student Count by Ethnic Group and Academic Year
0
200
400
600
2017 2018 2019 2020
43 32 28 15
11087 75
49
10768
668
547 556
327
108
Ethnic Group Asian Black/African American Hispanic/Latino White
Success Rate by Academic Year
0%
20%
40%
60%
80%
100%
2017 2018 2019
89.0%92.4% 92.8%
Term
All
Program
All
Plan
All
College School Depart…
All
Success Rate By Course
Academic YearSubject
2017StudentCount
EnrollmentCount
SuRa
CAP4770CEN3088CEN4031CEN4722CIS3083CIS3661CIS4200CNT3010CNT3421COP3035COP4504COP4533CTS4124CTS4454ISM3011ISM3212ISM3232ISM4113ISM4212ISM4320ISM4321ISM4323ISM4324
16
4038
363048
18
658
18477
13973
17
4238
383149
18
682
19277
14673
739580
759784
Total 976 2,022
Academic Organization
Technology Manage…
Community
All
FTIC Flag
All
Part Full Time
All
Gender
All
Academic Program Viability Report UD 2019-20 Page 231

ACADEMIC PROGRAM VIABILITY REPORT
Academic Plan
All Academic Plan Id
Student Count Enrollment Count Units Taken Success Rate Grads Count2019-20
Enrolled in Fall2020-21 (0580)
Retention Rate0565 to 0580
ACTAP-CTAPLS-CTBACCAPP-NOBUSADM-CTBUS-ASBUS-BSBUS-TRCCNA-CTCIT-ASCJPSS-ASCMPRG-CTCOMPNET-ASCOMSC-TRCPS-CTCRCI-CTCRIM-TRCST-ASCWPA-ASDIGFORN-ASEAM-AS
1 1
89
22
442
591,241
412
293
1694
1161
103246
66
1356
1753,864
1246
879
48271233183
26961218
50.0 %100.0 %97.7 %
100.0 %98.3 %84.4 %90.2 %
100.0 %93.1 %
100.0 %100.0 %77.8 %
100.0 %100.0 %100.0 %100.0 %100.0 %93.8 %
100.0 %100.0 %
3
1
77
100.0 %88.8 %
Total 470 3,725 11,389 88.9 % 151 302 88.1 %
88.1%Retention Rate 0565 to 0580
302Enrolled in Fall 2020-21
88.9%Success Rate Fall 2019-20
Academic Program
All
College School Depart…
All
Academic Organization…
TMGT-UD
Community
All
FTIC Flag
All
Ethnic Group
All
Gender
All
151Grads Count 2019-20
470Student Count Fall 2019-20
Academic Program Viability Report UD 2019-20 Page 232

ACADEMIC PROGRAM VIABILITY REPORTNumber of Grads and Number of Awards by Academic Year
0
50
100
2017 2018 2019
130 128121
130 128121
Number of Grads Number of Awards
Student Count by Ethnic Group and Academic Year
0
20
40
60
80
100
2017 2018 2019
63
6
13 15
812 14
17
92 90
80
Student.Ethnic Group Asian Black/African American Hispanic/Latino White
Term
All
Program
All
Plan
TMGT-BAS
Academic YearDegree
2017Numberof Grads
Numberof Awards
2018Numberof Grads
Numberof Awards
2019Numberof Grads
Numberof Awards
BASTMGT-BAS
130130
130130
128128
128128
121121
121121
Total 130 130 128 128 121 121
Gender
All
Academic Program Viability Report UD 2019-20 Page 233

ACADEMIC PROGRAM VIABILITY REPORT
Academic Plan
All
82.1%Retention Rate 0535 to 0550
329Enrolled in Fall 2018-19
564Student Count Fall 2017-18
87.4%Success Rate Fall 2017-18
Academic Program
All
College School Depart…
All
Academic Organization…
TMGT-UD
Community
All
FTIC Flag
All
Ethnic Group
All
Gender
All
176Grads Count 2017-18
504Student Count Fall 2018-19
470Student Count Fall 2019-20
88.6%Success Rate Fall 2018-19
88.9%Success Rate Fall 2019-20
292Enrolled in Fall 2019-20
302Enrolled in Fall 2020-21
173Grads Count 2018-19
151Grads Count 2019-20
84.1%Retention Rate 0550 to 0565
88.1%Retention Rate 0565 to 0580
Academic Plan Id Retention Rate 0535 to 0550 Retention Rate 0550 to 0565 Retention Rate 0565 to 0580
APLS-CTBACCAPP-NOBUS-ASBUS-BSCIT-ASEDST-BSENRCH-NOFSPISM-TRGEN-AAHSA-BASINTBUS-BASITSC-ASMGTORG-BASPPA-BSPPA NO
100.0 %
76.2 %100.0 %83.3 %
75.0 %100.0 %
80.6 %72.5 %
100 0 %
75.0 %
75.3 %
50.0 %
100.0 %100.0 %
78.3 %73.9 %
100.0 %88.8 %
50.0 %100.0 %100.0 %100.0 %
100.0 %50.0 %89.5 %
Total 82.1 % 84.1 % 88.1 %Academic Program Viability Report UD 2019-20 Page 234

��������� ������ ������� ��������� ����� � ����� ����
�������������� ������� ��!���"��������������� ������� ��������� ����������� ���� ���# $�$
%&'()*+,-. /)012))3 4-)5(,6) %,.)1 7+8)(. 9+&( :::%)'(;& .&,1 1,.)%*<=>?1,-)11 :-.)@@,A)-;) B,-'-;,'@ :-2+(C'.,+- 7);(?,.C)-. '-3 D3C,11,+-1 = 5).',@1 %.?3)-. :-2+(C'.,+- EFGHIJF KJLMNOPFQMJ R SIFPQTUVWXYZ[V \]_]WZ [Wa[b[cd eYf]c g \Y]VYhc ijbb k-(+@@C)-.l*)(2+(C'-;)l*)(;)-. B?@@lm('3?'.)1l<+?(1) m(+?n1\Y]VYhc ijbb oYc][V p]Wfq <@'11 %.'.?1r stFQuIv wGTTv EFMx wGNFyIN zJNMTTOIJFv <@'11 D;'3)C,; m(+?nr {Sv |Sv <@'11 <+@@)A) %;&++@ 5)n. = D;'3)C,; m(+?n 5)1; = D;'3)C,; 4(A'-,}'.,+- = %?8~);. <'.'@+A /8(r ����R|S
\Y]VYhc ijbb oYc][V ad �h�c]jVc[hWb oYcqX ������� �������� ���� � ���� ������������ ������� ���������� ���� ��������� ������ ��¡�����¢ £¡��¢ ¤�¤ �� ¥������ ���� ��������� ������ ¦¢������ £¡���� §¡�� ��©� �ª ���¤���� ���� ��������� ������ «�����¢ ���� ¥¤¬© ��¬� ¥�¬�¦®��� ���� ��������� ���¥�� ��¡�����¢ £¡��¢ ¤�� �� ¤©�¦®��� ���� ��������� ���¥�� ¦¢������ £¡���� §¡�� ���� �ª ��¥�¦®��� ���� ��������� ���¥�� «�����¢ ���� ¥�¬� ��¬� ¥�¬©¦����� ���� ��������� ���¥�� ��¡�����¢ £¡��¢ �¤¤ �¤¤¦����� ���� ��������� ���¥�� ¦¢������ £¡���� §¡�� ª�� ª��¦����� ���� ��������� ���¥�� «�����¢ ���� �©¬� �©¬����� ���� ��������� ���¤�� ��¡�����¢ £¡��¢ ��� ������� ���� ��������� ���¤�� ¦¢������ £¡���� §¡�� ���ª ���ª���� ���� ��������� ���¤�� «�����¢ ���� ¤�¬ª ¤�¬ª <@'11 %.'.?1r stFQuIv wGTTv EFMx wGNFyIN zJNMTTOIJFv <@'11 D;'3)C,; m(+?nr {Sv |Sv <@'11 <+@@)A) %;&++@ 5)n. = D;'3)C,; m(+?n 5)1; = D;'3)C,; 4(A'-,}'.,+- = %?8~);. <'.'@+A /8(r ����R|Sv B,@.)( )Cn.° (+01 '-3 ;+@?C-1
Academic Program Viability Report UD 2019-20 Page 235

��������� ������ ������� ��������� ����� � ����� ������
�������������� ������� ��!���"��������������� ������� ��������� ����������� ������ ���# $�$
%&'()*+,-. /)012))3 4-)5(,6) %,.)1 7+8)(. 9+&( :::%)'(;& .&,1 1,.)%*<=>?1,-)11 :-.)@@,A)-;) B,-'-;,'@ :-2+(C'.,+- 7);(?,.C)-. '-3 D3C,11,+-1 = 5).',@1 %.?3)-. :-2+(C'.,+- EFGHIJF KJLMNOPFQMJ R SIFPQTUVWXYZ[V \]_]WZ [Wa[b[cd eYf]c g hi]jY k]ifj l-(+@@C)-.m*)(2+(C'-;)m*)(;)-. B?@@mn('3?'.)1m<+?(1) n(+?o1hi]jY k]ifj pqrr stuv wxyz{wxwx |x}~}� ��u��� stuv wxyz{wxwx |x}�x� ��vvtu stuv wxyz{wxwx |x}�}� pqrr stuv wxwx{wxwy |x}�x��rq�� ���u�t �u��� { ����t�� �q�qr�� ��u�����r��q�t� ����t�� ����� ��v�tu �� �rq��t� �����r��q�t� ����t�� ����� ��v�tu �� �rq��t� �����r��q�t� ����t�� ����� ��v�tu �� �rq��t� �����r��q�t� ����t�� ����� ��v�tu �� �rq��t����wz�x y y y y��swz�x w y���wz�x y y�s�wz�x y y w y y y����zy} }� � }} } yw y �w � <@'11 <+?(1) n(+?o� KJFINJ��Q� �MGN�I�� %.?3)-. )(C <'())( 5)1; = *(+A('C 5)1; = *@'- 5)1; = %?8o@'- 5)1;� ¡I¢� SI£ITM�OIJF ¤ ¥PJP¦IOIJF� <@'11 D;'3)C,; <'())(� § ©S� B,@.)( )Co.ª (+01 «ciXY¬c «djcYZ hiaY eY]Yj®q�� °t�ut�±² ³µ¶µ·µ· �¹º�·³ D9[Wa[b[cd eYf]c \]VYjj »ViZY¬c ¼�q��r��½ °t��u� �u��t�� ¾���vt��D;'3)C,; ¿)'( = )(C 5)1; = 9?@., B'@@ )(C µ·º³=µ·µ· À·¶Á¶Â� %o(,-A )(C µÃ<'Co?1 5)1;(,o.,+- D@@<'())( = *(+A('C = *@'- = %?8o@'- = 9?@., );& 5)6)@+oC)-. Ä 9'-'A)C)-.<+@@)A) = n(+?o = D;'3 4(A = %?8Å);. D@@<+?(1) :-1.(?;.,+-'@ 9).&+3 D@@%.?3)-. ªo) ÀB :<ÂD@@DA) n(+?o D@@l.&-,; n(+?o D@@n)-3)(D@@<?1.+C <+&+(. D@@%.?3)-. n(+?o D@@
Academic Program Viability Report UD 2019-20 Page 236

Industry Certification Attainment
The ITIL Foundation industry certification has been identified in ISM 4361 of the College of Computer and Information Technology: Technology Management, BAS program for evidence of certification attainment at the baccalaureate level. This opportunity is not Perkins funding eligible, but some student voucher scholarships will be available each academic year through Workforce Service funds.
Academic Program Viability Report UD 2019-20 Page 237

2019-20 Placement Data
*Refers to graduates found to be employed full-time or part-time.
Source: http://www.fldoe.org/accountability/fl-edu-training-placement-info-program/fl-college-system-reports.stml
TMGT BAS Pool Count Percent Placed 2014-15 69 78% 2015-16 108 70% 2016-17 94 76% 2017-18 127 78%
Academic Program Viability Report UD 2019-20 Page 238

Table 1 Growth for Computer and information systems managers
Jobs (2019) Median Earnings National 433,960 $70.37/hr
Florida 20,090 $61.85/hr
Pinellas County 4,050 $65.56/hr
Source: U.S. Department of Labor, Bureau of Labor Statistics https://www.bls.gov/oes/tables.htm
Table 2 Growth for Computer systems analysts
Jobs (2019) Median Earnings National 589,060 $43.71/hr
Florida 27,450 $38.09/hr
Pinellas County 6,280 $40.02/hr
Source: U.S. Department of Labor, Bureau of Labor Statistics https://www.bls.gov/oes/tables.htm
Table 3 Growth for Information Security Analysts
Jobs (2019) Median Earnings National 125,570 $47.95/hr
Florida 6,630 $42.90/hr
Pinellas County 1,700 $41.60/hr
Source: U.S. Department of Labor, Bureau of Labor Statistics https://www.bls.gov/oes/tables.htm
Academic Program Viability Report UD 2019-20 Page 239

Table 4 Growth for Network and Computer Systems Administrators
Jobs (2019) Median Earnings National 354,450 $40.15/hr
Florida 17,930 $37.10/hr
Pinellas County 3,730 $37.68/hr
Source: U.S. Department of Labor, Bureau of Labor Statistics https://www.bls.gov/oes/tables.htm Table 5 Growth for Computer Programmers
Jobs (2019) Median Earnings National 199,540 $41.61/hr
Florida 9,670 $36.02/hr
Pinellas County 1,970 $37.55/hr
Source: U.S. Department of Labor, Bureau of Labor Statistics https://www.bls.gov/oes/tables.htm Table 6 Growth for Industrial Production Managers
Jobs (2019) Median Earnings National 185,790 $50.71/hr
Florida 5,900 $47.03/hr
Pinellas County 1,140 $46.56/hr
Source: U.S. Department of Labor, Bureau of Labor Statistics https://www.bls.gov/oes/tables.htm
Academic Program Viability Report UD 2019-20 Page 240

Table 7 Growth for Software developers and software quality assurance analysts and testers
Jobs (2019) Median Earnings National 1,406,870 $51.69/hr
Florida 59,880 $46.12/hr
Pinellas County 13,740 $47.05/hr
Source: U.S. Department of Labor, Bureau of Labor Statistics https://www.bls.gov/oes/tables.htm
Academic Program Viability Report UD 2019-20 Page 241

Perkins Completion & Non-Traditional Completion Performance
Perkins completion metrics do not apply to baccalaureate programs.
Academic Program Viability Report UD 2019-20 Page 242

Action Plan Follow-up and Evaluation Report for 2018-19 Viability Report Program: Technology Management, Upper Division Date Completed: August 2020 Prepared By: John Duff I. Action Plan Items Status
Action Item
Measure
Addressed (Value)
Completion
Status
Status Explanation
1
CCIT will introduce a new sub plan in cyber defense and risk mitigation into the existing Technology Development and Management BAS degree program.
SSH Enrollment
Completed This sub plan was introduced ahead based on courses that had been developed to support the new BAS program in cybersecurity that was also being developed. Twenty students are enrolled in the sub plan.
2
Given the growing interest in Cyber Security CCIT will develop a proposal for a new BAS degree program in Cyber Security with an anticipated start date of August 2020 (dependent upon state approval).
Unduplicated Headcount
Completed The new BAS program in cybersecurity was approved by the state and introduced in the Fall of 2020. There are 60 students enrolled in the plan.
II. Non-Completed Action Plan Items and Plan for Completion All action items were completed. III. Evaluation of the Impact of Action Plans on Program Quality The new offerings in cybersecurity have enabled CCIT to meet a workforce need for cybersecurity professionals. The new BAS has given AS degree students in cybersecurity an academic pathway that allows them to continue their education at SPC.
Academic Program Viability Report UD 2019-20 Page 243

St. Petersburg College
Program Goals and Strategies Program: Technology Management, Upper Division Date Completed: 11/17/2020 Due Date: August 2021 Prepared By: John Duff I. Goals
Program Goals SPC Commitment Pillar
1 Improve the effectiveness of the CCIT Advisory Committee’s participation in the Technology Development and Management Capstone Course.
Community Engagement
II. Strategies
Strategies to be Implemented Viability Metric Target Outcome
Goal # Responsible Individuals
1
Working with CCIT Advisory Committee chair, the CCIT team will create an orientation program for Advisory Committee members who will be participating in evaluating capstone presentations.
Course Success/W-WF-F Rates: A 5% increase in the scores for student capstone presentations.
1 John Duff
III. Special Resources Needed: N/A
IV. Area(s) of Concern/Improvement: N/A
Academic Program Viability Report UD 2019-20 Page 244

Contact Information
Please address any questions or comments regarding this evaluation to:
Magaly Tymms, MA Institutional Effectiveness Director, Institutional Effectiveness St. Petersburg College, P.O. Box 13489, St. Petersburg, FL 33733 (727) 341-3195 [email protected]
Academic Program Viability Report UD 2019-20 Page 245

Data and information contained herein cannot be used without the express written authorization of the St. Petersburg College. All inquiries about the use of this information should be directed to the Executive Director of Institutional
Research and Effectiveness at St. Petersburg College.
© Copyright St. Petersburg College, March 2021. All rights reserved.