Academic achievement team - a school within a school ...
59
Rowan University Rowan University Rowan Digital Works Rowan Digital Works Theses and Dissertations 5-16-2002 Academic achievement team - a school within a school program: Academic achievement team - a school within a school program: does specialized remediation increase test scores? does specialized remediation increase test scores? Donald F. Mills Rowan University Follow this and additional works at: https://rdw.rowan.edu/etd Part of the Educational Leadership Commons Recommended Citation Recommended Citation Mills, Donald F., "Academic achievement team - a school within a school program: does specialized remediation increase test scores?" (2002). Theses and Dissertations. 1481. https://rdw.rowan.edu/etd/1481 This Thesis is brought to you for free and open access by Rowan Digital Works. It has been accepted for inclusion in Theses and Dissertations by an authorized administrator of Rowan Digital Works. For more information, please contact [email protected].
Transcript of Academic achievement team - a school within a school ...

Rowan University Rowan University
Rowan Digital Works Rowan Digital Works
Theses and Dissertations
5-16-2002
Academic achievement team - a school within a school program: Academic achievement team - a school within a school program:
does specialized remediation increase test scores? does specialized remediation increase test scores?
Donald F. Mills Rowan University
Follow this and additional works at: https://rdw.rowan.edu/etd
Part of the Educational Leadership Commons
Recommended Citation Recommended Citation Mills, Donald F., "Academic achievement team - a school within a school program: does specialized remediation increase test scores?" (2002). Theses and Dissertations. 1481. https://rdw.rowan.edu/etd/1481
This Thesis is brought to you for free and open access by Rowan Digital Works. It has been accepted for inclusion in Theses and Dissertations by an authorized administrator of Rowan Digital Works. For more information, please contact [email protected].

ACADEMIC ACHIEVEMENT TEAM - A SCHOOL WITHIN A SCHOOL PROGRAM
DOES SPECIALIZED REMEDIATION INCREASE TEST SCORES?
ByDonald F. Mills
A Thesis
Submitted in partial fulfillment of the requirements of theMasters of Arts Degree
OfThe Graduate School
OfRowan University(April 29, 2002)
Approved byProfessor
Date Approved /?Tr / ~ ' i/

ABSTRACT
Donald Mills Academic Achievement Team - Aschool within a school program doesspecialized remediation increase testscores?2002Dr. Kathy SemakEducational Leadership
This research is being done to assess the tenets of the Academic Achievement Program.
Those tenets being that a school within a school program devoted to those students who did not
successfully complete any of the three parts of the Grade Eight Proficiency Assessment will help
them to catch up and successfully pass the High School Proficiency Assessment. This program
will also reduce behavior problems and absenteeism while simultaneously increasing the
student's feelings of success and accomplishment. To test these tenets a set of surveys will be
utilized along with report card grades for two sets of students. The students enrolled in the
program will be compared with a control group of students from the regular program. The
research seeks to compare the relative improvement in grades/performance of each group during
their first year of high school compared to their eighth grade year.
The results of the grade data comparing the Academic achievement students to the
regular program show greater improvements in all subject areas as well as attendance over the
regular students. This leads to the conclusion that the Academic Achievement students are
outperforming the Regular Program students and "catching up." Further the behavior data
remains constant at three referrals on average between the two groups for the first semester of
their ninth grade year. Based upon these results it can be concluded that the program is
accomplishing what it set forth as its goals.

MINI-ABSTRACT
Donald Mills Academic Achievement Team - Aschool within a school program doesspecialized remediation increase testscores?2002Dr. Kathy SemakEducational Leadership
Will a school within a school program help to remediate students who did not
successfully complete the Grade Eight Proficiency Assessment and to pass the High School
Proficiency Assessment while reducing behavior problems and absenteeism and increasing the
student's feelings of success and accomplishment.
The Academic Achievement students are outperforming the Regular Program students
and "catching up" and it can be concluded that the program is accomplishing what it set forth as
its goals.

ACKNOWLEDGEMENTS
I wish to thank my family for all their support and encouragement throughout the timewhile I worked on this degree. I also wish to thank the staff and students of CumberlandRegional High School for their continuing support and guidance. I especially wish to thankKathy Kelk, Robert Vanella, Carole Laster and Robert Bumpus for all the help and guidance thatthey gave me this year. And last but not least, my university mentor, Dr. Semak for all herinsights and guidance with my thesis and project.

TABLE OF CONTENTS
Page
Acknowledgementsii
Chapter 1 Introduction1
Introduction 2
Focus of the Study 2
Purpose of the Study 2
Definitions 3
Limitations 3
Setting of the Study 4
Significance of the Study 4
Organization of the Study 5
Chapter 2 Review of Literature 7
Chapter 3 Research Design 11
General Description of Research Design 12
Description of Development of Research Instrument 13
Description of Sample and Sampling Techniques 14
Description of Data Collection Approach 15
Description of Data Analysis Plan 16
Chapter 4 Presentation of Research Findings 18
Chapter 5 Conclusions, Implications and Further Study 28
References 35

TABLE OF CONTENTS (continued)
Appendix A 36
Appendix B 43
Biographical Data 52

Chapter One
Introduction
1

Introduction
Twenty-five percent of the eight graders in the County have failed the Grade Eight
Proficiency Assessment. Every day students from across America are lost between the cracks in
the education system. Low standardized test scores and poor academic success leave dismal
futures for these students. Something must be done to help these students regain their potential.
Regional High School is instituting an innovative program to identify these students and assist
them in becoming successful. This program will be led by an experienced group of four teachers,
called the Academic Achievement Team. The success of these students must be measured to
ensure that the program is meeting the needs of the students involved in the program.
Focus of the Study
The focus of this study is to determine the effectiveness of the Academic Achievement
Team's program on students who have failed the Grade Eight Proficiency Assessment upon
entering Regional High School in order to increase their academic skills so they will be able to
successfully pass the High School Proficiency Assessment.
Purpose of the Study
The purpose of this study is to identify the strengths and weaknesses of the Academic
Achievement Program on its ability to improve scores on standardized tests of those high school
students who failed the Grade Eight Proficiency Assessment. This study will result in an
2

evaluative report on the first year of the program informing teachers and administrators where
more instructional time will need to be spent in the following year. The Academic Achievement
Program provides students with an environment where specialized instruction will assist them in
passing the High School Proficiency Assessment.
This study seeks to provide the intern with an opportunity to promote the
success of all students by advocating, nurturing, and sustaining a school culture and
instructional program conducive to student learning and staff professional growth.
The Academic Achievement Team seeks an organizational change which provides a
environment and instructional program that remediates as well as educates students for the
purpose of passing the HSPA.
Definitions
Academic Achievement team is defined as a group of four teachers that will work
collaboratively together on the curriculum, instruction and program decisions regarding the
Academic Achievement program. This group is represented by one Language Arts teacher, one
Science teacher, one Math teacher and one History teacher.
GEPA will be defined as the Grade Eight Proficiency Assessment.
HSPA will be defined as the High School Proficiency Assessment.
3

Limitations
The study will involve the ninth grade students of Regional High School who are
involved with Academic Achievement Program as well as a number of stratified randomly
selected ninth grade students involved in the regular program. The study will utilize a sample
size of 70 individuals, thirty-five participants of the Academic Achievement Program as well as
thirty-five regular school participants randomly selected in a manner which mirrors the
ethnosocial demographics of the Academic Achievement Program. These two group's test
scores and percentage improvement will be compared to each.
Setting of the Study
The Academic Achievement Program is located within Regional High School. Regional
High School is located in rural southern New Jersey. This is the poorest area of the state.
Regional High School maintains a student population of approximately 1200 and 90 faculty.
Regional High School serves a student population makeup of 70 percent Caucasian, 28 percent
African American and three percent other nationalities. Regional High School receives its
students from seven diverse sending districts. These districts vary from upper middle income
being the norm in the district to those where lower income is the norm. Some districts annually
send over 100 students to Regional High School where others may only send between one and
two dozen annually. Regional high School utilizes and "4x4" style of block scheduling. Each
block is 84 minutes in length with four minutes for passing between classes. Four classes are
held daily for each of two 90 day semesters.
4

Students take eight classes a year, four in each semester. Regional High School also utilizes
a 35 minute activity period in the middle of the school day along with a 35 minute lunch. The
Academic Achievement Team is given three classrooms in one hallway to use. The team is
given a common planning period at the end of the day and has the freedom to create their own
schedule for classes as well as how many students will meet in each class. The team has the
flexibility to change this schedule, etc. at will. Thirty-five students have tudbeen selected to
participate in the Academic Achievement Program. These students were selected due to their
poor performance on the GEPA. For the purposes of this study, these students 'progress will be
compared to 35 randomly selected 9th grade students in the regular program. The selection
process from the regular program will further seek to match the ethnic data for the Academic
Achievement Program.
Significance of the Study
The study will contribute to the concerns of practice of those teachers and students
involved with the Academic Achievement Program of Regional High School. Areas where the
program is not achieving intended results will need revision and the study will identify these
areas and help to identify means by which they can be improved.
Organization of the Study
The next chapter will review the literature that provides support for the formation and
utilization of the Academic Achievement Team. Chapter Three will discuss the design of the
5

study while Chapter four will provide the data collected and its significance. Chapter five will
provide conclusions and indications concerning the practices of the Academic Achievement
Team as well as implications for further study.
6

Chapter Two
Review of Literature
7

The current climate of high stakes assessment as a graduation requirement mandates a
rethinking of teaching -learning process in high school. For students entering ninth grade
without proficiency in multiple content areas, intervention is a matter of fundamental fairness
(Jones, 2000). One method of combating this lack of proficiency in ninth grade students is to
create a small school environment utilizing a school within a school program. The Academic
Achievement Team at Regional High School is a school within a school model that is designed
to meet the 21st century challenge requiring all students to meet high academic standards. The
Academic Achievement team seeks to create a student centered and work related environment
that also includes the benefits of small school setting, a closer connection between staff and
students, "fewer discipline problems, lower student tardiness and absenteeism, lower dropout
rates and higher graduation rates; and higher and more varied extracurricular participation, which
promotes academic success, better attendance, positive attitudes toward school, and enhanced
social behavior" (Bailey, 2000).
The team plans an activity based, integrated approach incorporating inquiry and
collaboration, higher order thinking and workplace readiness skills through an interdisciplinary
program. With a focus on progressive remediation, the Academic Achievement Team pursues
student achievement through the empowerment of learners as partners. "There is compelling
research evidence to support the contention that student-involved...classrooms...can give a big
boost to standardized test scores" (Stiggins, 1999). The ultimate vision of the Academic
Achievement Team is to "expand the range of students who want to succeed and who feel
capable of doing so" (Stiggins, 1999). A school within a school setting should provide the
flexibility and small class size that encourages this type of positive learning environment.
8

Splitting existing schools into smaller "schools within a school" has gained popularity
even bringing in political support "Vice President Gore urged school officials to "stop herding all
students ... into overcrowded, factory-style high schools." Praise also comes from child
development and mental health professionals. Dr. James Gabarino of Cornell University and a
noted author recently said, "The most despicable thing we've done to American teen-agers is put
them in large high schools." (Bailey, 2000)
"Research indicates that small schools produce equal or better achievement for students
in general, effects of small schools on achievement of ethnic-minority and low-socioeconomic-
status (SES) students are the most positive. Teachers in small schools are more likely to form
teaching teams, integrate subject matter content, employ multiage grouping and cooperative
learning, and use alternative assessments. These schools also have greater emphasis on learning
that is experiential and relevant to the world outside school."(Galletti, 1999) These concepts and
successes are exactly what Regional School District seeks in creating its school within a school
environment. Other side benefits from schools within a school settings are a greater sense of
belonging, a more positive school climate, especially among the low socioeconomic status and
minority students, greater student participation, and more favorable interpersonal relationships
not only between students but also between students and teachers.
Positive results have been the selling point of school within a school programs but
research does indicate problems as well. Galletti himself indicates that his experience as a
principal in three middle schools, sized 450 to 900, has seen that the larger the school, the more
difficult it was to provide instructional leadership and cultivate teacher and student leadership
resulting in problems associated with the school within a school program. "Schools-within-
schools can result in elitism, competition, and professional rivalry among teachers. It is
9

questionable that the advantages of small schools outweigh the disadvantages of fragmenting
current large schools."(Galletti, 1999)
Surprisingly some research indicates that a school can be too small. Research done by
Gerald Bracey shows that math achievement rises as school size increases to about 600 students,
holds steady to about 900 students, and then diminishes. Many schools within a school programs
including Regional High School's seek to have a student population well below 600 students.
The idea being as close to a one to one student teacher ratio as possible. The more individual
attention that a learner receives is thought to correlate to better achievement.
"Schools-within-a-school plans have potential for producing results like those of small
schools provided they are distinct administrative entities within the buildings that house them"
(Cotton 1996) "The major challenge to schools within schools," writes Mary Ann Raywid, "has
been obtaining sufficient separateness and autonomy to permit staff members to generate a
distinctive environment and to carry out their own vision of schooling" (1985, p. 455).
10

Chapter Three
Research Design
11

General Description of Research Design
This research is being done to assess the tenets of the Academic Achievement Program.
Those tenets being that a school within a school program devoted to those students who did not
successfully complete any of the three parts of the Grade Eight Proficiency Assessment will help
them to catch up and successfully pass the High School Proficiency Assessment. This program
will also reduce behavior problems and absenteeism will simultaneously increasing the student's
feelings of success and accomplishment. To test these tenets a set of surveys will be utilized
along with report card grades for two sets of students. Of course the ultimate assessment of the
program will be when the students take the HSPA. To test this program along the way the
process described here will be used.
The students enrolled in the program will be compared with a control group of students
from the regular program. The research seeks to compare the relative improvement in
grades/performance of each group during their first year of high school compared to their eighth
grade year. The researcher wished to compare performance on standardized tests but the testing
done did not conform to needed time frames for this research. Since both groups are to be
taught the same materials and achieve the same standards according to the NJ core curriculum
content standards for each course they are enrolled in, the grades for these groups' grades can be
compared to each other.
This research also seeks to compare the attendance and behavior records of each of these
groups. According to the ideas and goals that this program is founded upon, the program will be
successful if students in the program show a greater improvement in grades, performance, and
12

attendance than those students in the regular program. This greater improvement is based upon
the "catch up" concept of the program.
The research also seeks to measure the impact on the participants of the attitudes that the
regular teaching staff have towards this program.
Description of Development of Research Instruments
The research instruments used to evaluate the Academic Achievement Program
participant's improvement in grades were developed utilizing the following criteria. First since
the Academic Achievement Program uses a year long four marking period grading system and
the regular program uses a two-semester 4x4 block schedule only the first two marking period
grades will be compared for the ninth grade year. Both marking periods begin and end on the
same dates within the school. The first two marking period grades will be used from the eight
grade year. The attendance and behavior information will also be compared for the same time
periods.
The surveys are designed to indicate the attitudes of the respondents towards the program
they are involved in and/or their attitudes towards the other program. This survey process is
divided into two focus groups, the teaching staff and students. The student's survey will seek to
identify how the students perceive their academic performance as well as their personal opinions
regarding the program they are enrolled in. The teacher's survey will seek to uncover their
thoughts about both programs. Both surveys will employ a Likert scales to indicate the
respondents agreement with specific statements as well as some yes/no responses. The Likert
13

scale employed uses a 1 to 4 response scale to require respondents to make a decision regarding
their attitudes as opposed to choosing a response that falls in the middle which would not easily
indicate the positivity or negativity associated with their attitude.
Further the Academic Achievement Program's teachers will be interviewed to identify
their attitudes. The interview will be a group interview lasting approximately one hour.
Description of sample and sampling techniques
There are two major sample groups used in this research, the teachers and the students.
The members of both groups will remain anonymous. The teachers sample group is divided into
two groups, the control group and the focus group. The focus group consists of the four teachers
who teach the Academic Achievement program. The Control group consists of the eighty-one
teachers who teach students in the regular program.
The students' group is also divided into two groups, the control group and the focus
group. The focus group consists of the 34 students enrolled in the Academic Achievement
Program. These students must have failed all three sections of the Grade Eight Proficiency
Assessment. The control group will consist of 34 students within the regular program. These
students are chosen using a stratified random sampling process. First all of these students must
be ninth graders. Second, these students as a group must meet the same ethnic makeup as the
focus group. Third the students in the control group must also meet the same sending district
makeup as the focus group that is to say that since this school receives students from seven
different sending districts that each district is represented equally between the two groups. Next,
the students in the control group must be taking science, math and language arts during the first
14

semester. This will allow a valid comparison between these two groups since the focus group is
taking these three courses at the same time. It is important to note that the control group will
have completed their course work in the two marking period time frame whereas the focus group
will have only gone through half of their course work. One of the concepts that the Academic
Achievement Program is based on is that the students involved in the program are not ready for
the intensive block schedule utilized by the regular program. One process for comparing these
two groups on a more equal setting is to compare the first marking period grades of the regular
program students with the average of the first two marking periods for the Academic
Achievement students since for both groups this represents coverage of one half of the
coursework for a given subject. According to the concept of block scheduling the time spent on
each subject for both groups should be the same, the only difference being that the regular
program spends more time (84 minutes) each day on a subject for a shorter course duration (90
days) where as the Academic Achievement Program spends less time a day on a subject for a
longer course duration (180 days.) In essence one aspect of the Academic Achievement program
being evaluated is whether or not the time framework of the program is effectively helping the
students involved in the program to be successful.
Description of Data Collection approach
Data will be collected by reviewing the students' records after the end of the second
marking period to obtain grades, attendance and behavior data. This information will be written
down on a spreadsheet.
Survey data will be collected from the two student groups by having each group respond
to a survey (see Appendix A) on the 10th day of the third marking period. This day was chosen
15

to allow the regular program teachers the time to get acquainted with their new students and to
establish a routine with them. Doing the surveys earlier than this might disrupt the establishment
of this routine. The focus group will be surveyed together during one of their classes since they
are all in the same room. The surveys will be given to their teachers to distribute and collect.
The control group of students will be surveyed the same day and the same time period by having
their teacher's distribute and collect their surveys. The students will be rewarded with a Hershey
bar for filling out the survey.
The teacher group surveys will be distributed via the teacher's mailbox and asked to be
returned within three days. To help facilitate a large return from the teacher group a "reward"
will be used for returning the survey. This reward will also be a Hershey chocolate bar.
Description of Data analysis plan
Data from the both the teacher and student surveys will be averaged per question for the
control and focus groups. These averages will then be compared to each other to identify any
substantial differences and any substantial commonalities.
The student's grades and attendance data from the eighth grade year and ninth grade year
will be compared to each other to identify the degree of improvement a student has made in their
ninth grade year. Comparisons will be made separately for their science, language arts, and math
grades separately. The degree of improvement for each course will be identified for each
individual student. In order to compare the groups, the average improvement of all the students
in each subject area in the focus group and of those in the control group will be determined.
These group averages will be examined to each other to identify any differences. Further, the
16

overall improvement for all three courses combined will be computed for each group. These
group averages will also be compared to each other.
Behavior data will be collected by comparing the amount of discipline referrals between
the focus and control groups for the ninth grade year and by comparing discipline records from
their eighth grade year. The data will be identified for individual students as well as being
averaged to receive group discipline data. The group and individual data will be compared to
each other to see if any differences in discipline problems have occurred between the two groups
since entering ninth grade.
17

Chapter Four
Presentation of the Research Findings
18

The overall purpose of this study was to evaluate the effectiveness of the Academic
Achievement program. Two areas were studied to gather data regarding the Academic
Achievement Program, first the beliefs of both groups of teachers in the school, those involved
with the Academic Achievement Program and those involved in the regular program. Secondly
the students in the school, those involved with the Academic Achievement Program and those in
the regular program. Each group of students was surveyed as to their beliefs and experiences,
grade data was also collected. The sum of the data was used to draw conclusions about the
program and its effectiveness.
The results of the regular teaching staff survey outline how these staff members feel
concerning the Academic Achievement Program. Sixty-six of the eighty-one teaching faculty
returned the survey representing an 81% response. The survey responses can be viewed in
appendix B. This survey was designed to cover all programs within the school as to prevent
anyone from inferring which program was being targeted in the school. If the teaching staff in
general was aware of which program was being targeted that could influence their responses.
The questions that were used for this study relate to the Academic Achievement program and
those that refer to the class or students that any teacher within the school system is directly
involved with. Also used in this survey were the questions referring to communication between
faculty members within the entire school. Of note for this study is the regular teaching staff
response to questions three and four (data numbers shown in bold).
Question 3:With regard to professional communication between yourself and other teachers in our
school:
There is:(no communication) 1 2 3 4 (a lot of communication)
(4) (33) (16) (9)
19

Question 4:
With regard to knowledge about academic programs offered at our school (other thanthe subject area(s)/level(s) that you teach):
I have no knowledge: 1 2 3 4 I have extensive knowledge(6) (31) (19) (3)
Based on the response to question three, sixty percent (37/62) of the regular teaching staff
believed there is little communication between teachers within the school and this directly relates
to the response to question four which shows that most teachers (63%) have little knowledge of
other subject areas or levels than that they teach.
Even though there is little communication or knowledge of the Academic Achievement
Program among staff members in general, the regular teaching staff expressed their beliefs
regarding the students involved in the Academic Achievement Program through their responses
to questions one and two. Question one refers to the Regular program Teacher's
beliefs about students that they teach. Question two had the Regular Program Teachers express
their beliefs about the students involved in the Academic Achievement Program. The regular
teaching staff also expressed their beliefs regarding the Academic Achievement Program in
general through their responses to questions 5i and 5j. These questions asked the Regular
Program Teachers to express their beliefs concerning how the Academic Achievement Program
has affected the overall learning environment of the school as well as the overall learning
environment of their classroom. The results of these questions are best expressed in the graphs
that follow. Each graph has two lines, one line represents beliefs about the Academic
Achievement Program students and the second represents beliefs about the Regular Program
students. The area between the two graphs indicates the difference in beliefs. The greater the
area between the two lines relates to a greater difference in beliefs concerning the Academic
20

Achievements Program students and those students in the Regular Program. Since the regular
program teachers have shown in their responses to questions one and two that there is little
knowledge or communication concerning the Academic Achievement Program as was discussed
previously, these differences could be best interpreted as stereotypes based upon previous
experiences of the regular program teachers.
This graph indicates that the Regular Program faculty belief that the students they teach are
more motivated than the students in the Academic Achievement Program. The large area
between the lines on the graph indicated that they believed that the Academic Achievement
students are far less motivated than the regular program students.
21

The Regular Program teachers also believe that the Academic Achievement students are far
less intelligent than the students they teach as shown by the large area between the lines on the
graph.
The Regular Program Faculty also showed that they believed that the students that they teach
are far better behaved than the students in the Academic Achievement Program through the
responses resulting in the large area between the two lines on the graph regarding behavior.
22
nI RFLiFFC nN IMNTFII InF'rF I
35 ' T acher's own students inteltigent f} ,::ad S .rric: l,,::hi l l ", I '!I'I1
'e
.'.~;S ~': Ji'dil~r js' e il,'ligenl l \N
30 / \
25 . \C
A200 >, \20 v ' X
E15 '- . / "-
10 0X \
vv 3 / rt^response number indicated ~~ >
1.0 1.5 2.0 2.5 3.0 3.5 .1 2, , , . , I, i i ,
^^_^^^^^^-*MI8 ' ' ' 1

The Regular Program faculty further expressed their beliefs regarding the Academic
Achievement Students with their responses to the survey questions regarding student
successfulness; here once again they rated the students they teach far more successful than the
academic achievement students which can be seen by the large area between the lines on the
graph.
The survey also indicates that sixty-nine percent of the Regular Program faculty believes that the
Academic Achievement program has not impacted on their classroom. More Regular program
teachers indicated that the program has made a positive impact on the school showing that in
both cases that a minority of regular program faculty believe the Academic Achievement
program has had a negative impact on the school. This can be seen in the following graph for
school and classroom environmental impact.
23
I

The faculty members that are directly involved with the Academic Achievement program
were interviewed and have a different set of beliefs. The Academic Achievement faculty
members indicate that they believed these students can be successful. Faculty member A
responded that "these children just need more attention and a schedule that is more suited to their
needs than that of the regular program." The team members theorized that these students are not
as motivated perhaps because of past failures, but that "they can learn and be successful if given
the opportunity to experience success." The team members all agree that these children can pass
the HSPA and with the a little help they will be back on the pathway to success. The Academic
Achievement Teachers further believe that if the Academic Achievement students are left
without help they most likely will continue to experience failure. When comparing the
Academic Achievement faculty responses during their interview with the survey responses from
the Regular Program teachers a simple difference can be seen. The Academic Achievement
teachers believe that the students they teach are the "equal to the students in the regular program
with the exception of those involved with the Honors program." The Academic Achievement
24
35 _ I BELIEFS ON ENVIRONMENT
Academic Achievement impact on classroom/ c ^ Ac ::ades rict A hieir?-eiri: iripa:-: rt icn -.hoo:I
30
25 /\
20 | / Ae X X / .k/
15
10
// response indicated510 12 1.2 1.4 1.6 1.8 2.0 2.2 2.4 2.6 2.8 3.0
E 5 i-.;. . .
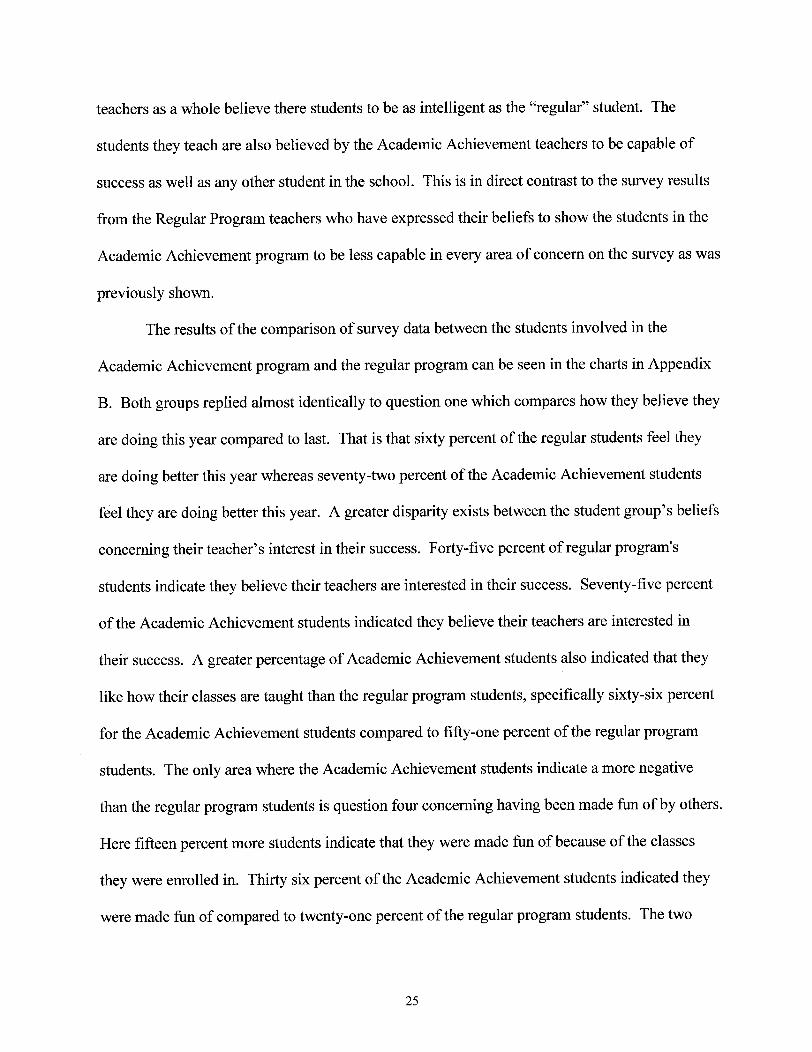
teachers as a whole believe there students to be as intelligent as the "regular" student. The
students they teach are also believed by the Academic Achievement teachers to be capable of
success as well as any other student in the school. This is in direct contrast to the survey results
from the Regular Program teachers who have expressed their beliefs to show the students in the
Academic Achievement program to be less capable in every area of concern on the survey as was
previously shown.
The results of the comparison of survey data between the students involved in the
Academic Achievement program and the regular program can be seen in the charts in Appendix
B. Both groups replied almost identically to question one which compares how they believe they
are doing this year compared to last. That is that sixty percent of the regular students feel they
are doing better this year whereas seventy-two percent of the Academic Achievement students
feel they are doing better this year. A greater disparity exists between the student group's beliefs
concerning their teacher's interest in their success. Forty-five percent of regular program's
students indicate they believe their teachers are interested in their success. Seventy-five percent
of the Academic Achievement students indicated they believe their teachers are interested in
their success. A greater percentage of Academic Achievement students also indicated that they
like how their classes are taught than the regular program students, specifically sixty-six percent
for the Academic Achievement students compared to fifty-one percent of the regular program
students. The only area where the Academic Achievement students indicate a more negative
than the regular program students is question four concerning having been made fun of by others.
Here fifteen percent more students indicate that they were made fun of because of the classes
they were enrolled in. Thirty six percent of the Academic Achievement students indicated they
were made fun of compared to twenty-one percent of the regular program students. The two
25

groups had very different responses to question five concerning what would most help them
become successful students. The most notable being that none of the Academic Achievement
students indicated more individualized instruction would help them be more successful
compared to fifteen percent of the regular program students. Also forty-two percent of the
Academic Achievement students indicated completing assignments compared to twelve percent
of the regular students. Forty-five percent of the regular program students indicated better
understanding compared to twenty-seven percent of the Academic Achievement students.
Twenty-four percent of both groups indicated that the students feel more time studying would
make them more successful. Overall the most important difference is that most of regular
students indicate better understanding of material will make them more successful compared
with most of Academic Achievement students indicate completing assignments will make them
more successful. The important point being that the Regular program students are indicating an
answer that requires more instruction or instructional change by the teachers, whereas the
Academic Achievement students' response is dependent on a personal change.
A comparison of the grade data seen in Appendix B shows that the students involved in
the Academic Achievement Program have been absent on average one less day, are scoring two
points better in Language Arts, are scoring nine points better in Science, and nine points better
in Math. Further the behavior data indicates that both groups are identical in the number of
discipline referrals they have on average. This shows that these two student groups are equally
predisposed to get into trouble. The reason for this may be as simple as kids are just kids and
they all tend to behave similarly. This is especially true when the children from these two groups
are coming from environments that are very similar in their socio-economic structures as these
two student groups are. One interesting difference is that the control group of students from the
26

regular program has a larger number students with greater numbers of discipline referrals than
the Academic Achievement student group has. This would show that the students with the worst
behavior problems exist in the regular program, not the Academic Achievement program.
Behavior data was not available from the students' sending districts to make any comparisons
between eighth and ninth grades.
27

Chapter Five
Conclusions, Implications and Further Study
28

The major point of this study was to evaluate the effectiveness of the Academic
Achievement program. The effectiveness of the program was based upon the students enrolled
in the program making improvements in their academic performance from eighth grade to ninth
grade. The improvements made by the Academic Achievement students should be greater than
the improvements made by the regular program students during the same time period, since the
concept of the program is to "catch up the Academic Achievement students." The Academic
Achievement program is designed so that the ultimate goal is for these at-risk students to pass the
High School Proficiency Assessment. To accomplish this, students enrolled in the program
cannot work at the same caliber as they have in the past. In fact these students must outperform
their peers in the regular program so that the Academic Achievement students can close the
grade point average gap between themselves and the regular program students. Once this gap is
closed and the Academic Achievement students are performing at the same level as the regular
program students, then successfully completing the HSPA should not be a problem for the
Academic Achievement students. The results of the grade data comparing the Academic
achievement students to the regular program show greater improvements in all subject areas as
well as attendance over the regular students. This leads to the conclusion that the Academic
Achievement students are outperforming the Regular Program students and "catching up."
Further the behavior data remains constant at three referrals on average between the two groups
for the first semester of their ninth grade year. Based upon these results it can be concluded that
the program is accomplishing what it set forth as its goals.
A secondary point to this study was to assess the effects of the school staffs belief
systems on the Academic Achievement Program. Communication between staff being the major
conduit for beliefs. The results of the teacher survey show there is little communication between
29

staff members. This combined with the results that state the staff believe they have little
knowledge of programs other than their own indicate that the regular staff has been poorly
informed about the Academic Achievement Program and its progress. The lack of
communication regarding the program leads to the staff making their own uninformed judgments
regarding the program and its participants. These judgments are most probably based upon
stereotypes. The result of these judgments are a poor image of the academic achievement
program in the minds of the regular program teachers, which is indicated in the graphs discussed
in Chapter Four. Based upon those results it can be concluded that the staff not associated with
the program have a generally negative impression of the program and its participants when
compared with the classes and students that they teach.
The beliefs that the Regular Program staff hold are directly in conflict with the results
being shown by the program. The Regular Program staff believes that the students in the
program are less intelligent, less motivated and less successful than the students in their classes.
When compared to the control group of regular program students with the same sending district
and ethnic codes, the Academic Achievement students outperform the regular students in every
one of those areas, that is the Academic Achievement students are scoring better than the regular
students for every subject. That implies that the Regular Program staff has the wrong impression
of the program and its participants. Further the staff feels that the students enrolled in the
Academic Achievement program behave poorly compared to the students they teach. The reality
is that there is no difference between the groups based upon the results of the behavior data
collected. In fact the students with the greatest discipline referrals come from the regular student
group. Again this implies that the staff has the wrong impression of the students participating in
the Academic Achievement Program.
30

Another indication of the program accomplishing its goals in the reduction is absentee
days for the Academic Achievement program. This reduction in days absent implies a greater
motivation on the part of the students involved with the program as well as an improvement in
motivation over the past year. This once again implies that the staff has the wrong impression of
the program's participants. Couple the behavior results with decreased absenteeism and the
conclusion that the Academic Achievement students are feeling better about their classes and
being in school can also be made. This conclusion is further supported by the high percentages of
positive responses the Academic Achievement students made on the student survey concerning
their classes.
The staff directly involved with the Academic Achievement Program has beliefs that are
much more in line with the performance of the students enrolled in the program. The lack of
communication amongst staff at the school and the limited knowledge of programs other than
that which a teacher is involved in restrict the possibility of changing the staffs beliefs about the
Academic Achievement Program or its participants. The staff involved with the program should
be communicating with staff not involved with the program and informing them of the students'
success. The staff of the Academic Achievement program should take every opportunity
possible to talk up the program, especially when confronting members of the Regular Program
Staff who feel negatively about the Academic Achievement Program. Other communication
could be made through newsletters or other forms of printed communication. Currently there is
no printed communication for the staff of the school other than that used for faculty meetings.
The creation of such a device could not only help to communicate the successes of the Academic
Achievement Program but the successes of all of the other programs within the school. This
communication will help promote the program and its students. It would seem that the students
31

enrolled in the program have been incorrectly stereotyped. More likely, the learning
environment in which they find themselves now is more conducive to their success than the
learning environments they have found themselve ones in the past. The overall belief of the staff
about the impact of the program on the school shows that the majority of the staff feels there is
no impact or that there is a positive impact on the school. Greater communication between the
staff involved with the program and those not involved would move more staff to believing there
is a positive impact on the overall school environment. This change in belief would help to
generate more support for the program and its students within the school population. Greater
support can help internalize the program within the school creating greater collegiality
concerning the Academic Achievement Program which will help to improve the program.
Another belief system within the school is student beliefs. The results of the student
survey indicate that the students in the program are not only doing better, but that more of these
students feel that they are doing better as well. The control group students feel they are doing
better in the ninth grade compared to the eighth grade on average, but are actually not doing as
well as in ninth grade as they did in the eighth. What the reason is for this belief is unknown.
The survey also indicates that the students in the Academic Achievement program believe that
their teachers are interested in their success and also like how their classes are taught more so
than the students in the regular program. The program, therefore, is having a positive effect on
these students, another reason to conclude that the program is reaching its goals. The fact that
none of the Academic Achievement students indicated more individualized instruction was
needed to help make them more successful as a student combined with fewer Academic
Achievement students having indicated better understanding as reasons to become more
successful than the regular program students leads to the conclusion that the program is meeting
32

the needs of the Academic Achievement students. Based upon the responses to this survey one
would conclude that addressing "completing homework assignments" within the program would
only lead to greater student success. The remaining student survey question indicates how the
students communicate with each other about what classes the students are enrolled in. The
results of this question indicate that more students in the Academic Achievement Program are
made fun of because of being enrolled in this program than in the regular program. Again
greater communication could diminish this problem. In this case the communication would have
to be between students and teachers to help remove the stigma associated with being enrolled in
a "special" program.
Overall the conclusions that can be drawn from this study are that the Academic
Achievement Program is achieving its goals of remediation or "catching up" the students.
Further it can be concluded that the lack of communication between staff within the school
impairs the Academic Achievement Program's reputation amongst the Regular Program staff
while largely having no direct effect on the program. If the Regular Program staff are
communicating this opinion outside the school to friends and members of the community support
for the program could be questioned especially in times when school budgets and school taxes
increase. An attempt to improve communication regarding the Academic Achievement Program
should be made at the school and local level, especially considering the negative reputation the
program receives. This only serves to point out how important communication is to a school
system, especially when the message you want to deliver is positive. Too often schools do not
make the effort to counteract negative reputations, especially when controversial topics or
programs are involved. As a result of this study the Public Relations Committee at the school
33

will be preparing a newsletter article to highlight the successes of the Academic Achievement
program thus far. This article
will be shared with the public as well as within the staff. It also would be beneficial to
encourage the staff of the Academic Achievement Program to talk about the program and its
successes with other members of the staff.
A further result of this study has the school leadership team considering changing this
program to a ninth grade program only. The reason for this change being that possibly these
students only need an extra one year transitional time period from eighth grade to block
scheduled high school classes instead of the three year program originally envisioned. The
switch to block scheduling may be too drastic for these at-risk students. Currently this decision
has not been made. It would be better to wait for this decision to be made after further study can
be conducted.
Suggested further study would be to compare the results of standardized tests that all
ninth graders are to take and then compare the test results between these same two groups. The
standardized test chosen by the school will indicate progress made since the Grade Eight
Proficiency Assessment towards the High School Proficiency Assessment. The ultimate goal of
the program is to ensure that the students enrolled in the program will pass the HSPA and thus a
true evaluation of the program could be conducted by studying the results of the HSPA between
these two groups of students when they complete the eleventh grade. It would also be interesting
to see how the reputation of the program and its participants changes a result of increased
communication about the program, especially communication between the staff involved with
the program and other staff.
34

REFERENCES
Bracey, Gerald E., An Optimal Size for High Schools? Phi Delta Kappan v79 n5 p406 Jan
1998
Galletti, Susan, School Size Counts. Education Digest, May99, Vol. 64 Issue 9, p 5, 3p
Cotton, Kathleen, Affective and Social Benefits of Small-Scale Schooling. ERIC Digest. 1996
Schoenlein, James, Making a Huge High School Feel Smaller. Educational Leadership,
Mar2001, Vol. 58 Issue 6, p28, 3p, 2bw
Bailey, Jon, The Case for Small Schools. A Special Series from the Center for Rural Affairs
Monthly Newsletter. Center for Rural Affairs, Walthill, NE
Capps, William R.; Maxwell, Mary Ellen, Where Everybody Knows Your Name: The
Beauty of Small Schools. American School Board Journal, v186 n9 p35 -3 6 Sep 1999
Stiggins, Richard J., Assessment, Student Confidence, and School Success. Nov99, Vol. 81
Issue 3, p1 91
Jones, R (2000, September). Making standards work. American School Board Journal, 27-31
35

Appendix A
Research Instruments
36

LIST OF INSTRUMENTS
Page
Regular Program Teacher Survey 37
Student Survey 41
37

Teacher Survey
Thank you for taking the time to respond to this survey. Your input is appreciated.Please respond by choosing the one choice which you most agree with and circle it.
With regard to the students you teach:
On average the students you teach are:
(not) 1
(not) 1
(not) 1
(not) 1
What do you
(not) 1
(not) 1
(not) 1
(not) 1
COLLEGE PREP.:(not) 1
(not) 1
(not) 1
(not) 1
2 3 4(very)MOTIVATED
2 3 4(very)INTELLIGENT
2 3 4(very)SUCCESSFUL
2 3 4(very)WELL BEHAVED
believe about our various student populations?
2 3 4(very)MOTIVATED
2 3 4(very)INTELLIGENT
2 3 4(very)SUCCESSFUL
2 3 4(very)WELL BEHAVED
2 3 4(very)MOTIVATED
2 3 4(very)INTELLIGENT
2 3 4(very)SUCCESSFUL
2 3 4(very)WELL BEHAVED
(OVER)
38
HONORS:

MIDDLE LEVEL:(not) 1
(not) 1
(not) 1
(not) 1
2
2
2
2
BASIC SKILLS:(not) 1
(not) 1
(not) 1
(not) 1
ACADEMIC ACHIEVEMENT:(not) 1
(not) 1
(not) 1
(not) 1
ALTERNATIVE SCHOOL:(not) 1
(not) 1
(not) 1
(not) 1
2
2
2
2
2
2
2
2
2
2
2
2
3MOTIVATED
3INTELLIGENT
3SUCCESSFUL
3WELL BEHAVED
3MOTIVATED
3INTELLIGENT
3SUCCESSFUL
3WELL BEHAVED
3MOTIVATED
3INTELLIGENT
3SUCCESSFUL
3WELL BEHAVED
3MOTIVATED
3INTELLIGENT
3SUCCESSFUL
3WELL BEHAVED
(GO ON TO NEXT PAGE)
39
4(very)
4(very)
4(very)
4(very)
4(very)
4(very)
4(very)
4(very)
4(very)
4(very)
4(very)
4(very)
4(very)
4(very)
4(very)
4(very)
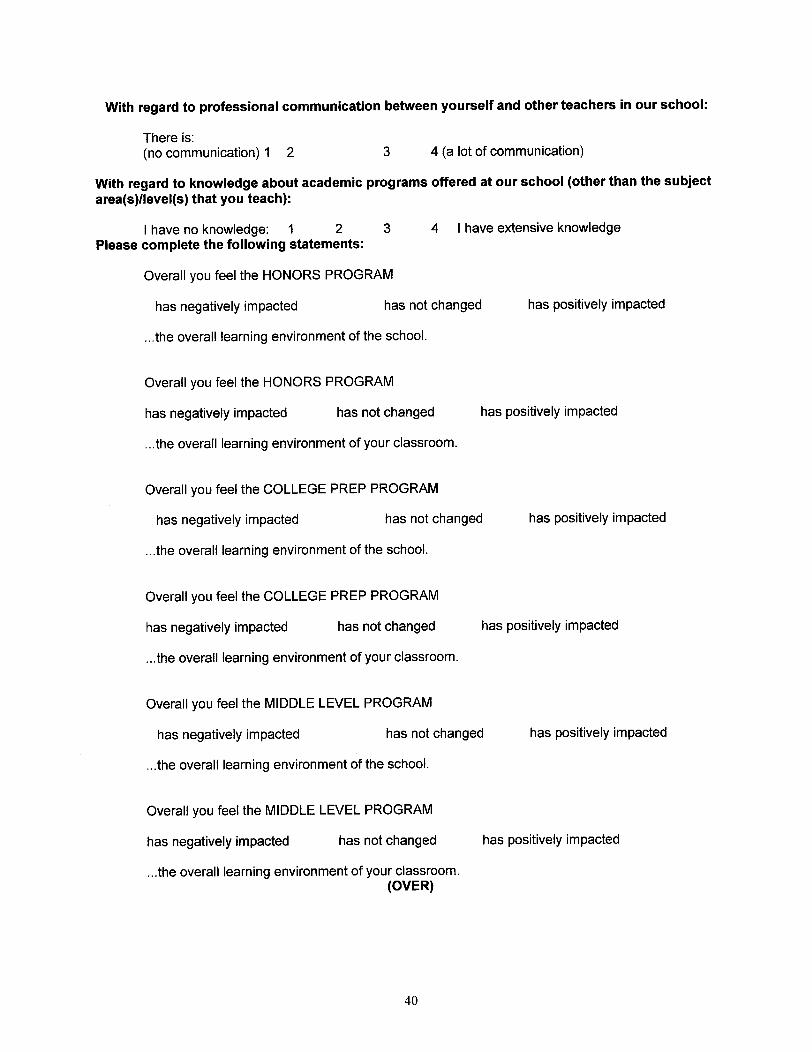
With regard to professional communication between yourself and other teachers in our school:
There is:(no communication) 1 2 3 4 (a lot of communication)
With regard to knowledge about academic programs offered at our school (other than the subjectarea(s)/level(s) that you teach):
I have no knowledge: 1 2 3 4 I have extensive knowledgePlease complete the following statements:
Overall you feel the HONORS PROGRAM
has negatively impacted has not changed has positively impacted
...the overall learning environment of the school.
Overall you feel the HONORS PROGRAM
has negatively impacted has not changed
...the overall learning environment of your classroom.
Overall you feel the COLLEGE PREP PROGRAM
has negatively impacted has not changed
...the overall learning environment of the school.
Overall you feel the COLLEGE PREP PROGRAM
has negatively impacted has not changed
...the overall learning environment of your classroom.
Overall you feel the MIDDLE LEVEL PROGRAM
has negatively impacted has not changed
...the overall learning environment of the school.
Overall you feel the MIDDLE LEVEL PROGRAM
has negatively impacted has not changed
...the overall learning environment of your classroom.(OVER)
has positively impacted
has positively impacted
has positively impacted
has positively impacted
has positively impacted
40

Overall you feel the BASIC SKILLS PROGRAM
has negatively impacted has not changed
...the overall learning environment of the school.
Overall you feel the BASIC SKILLS PROGRAM
has negatively impacted has not changed has p
...the overall learning environment of your classroom.
Overall you feel the ACADEMIC ACHIEVEMENT PROGRAM
has negatively impacted has not changed
...the overall learning environment of the school.
has positively impacted
)ositively impacted
has positively impacted
Overall you feel the ACADEMIC ACHIEVEMENT PROGRAM
has negatively impacted has not changed has positively impacted
...the overall learning environment of your classroom.
Overall you feel the ALTERNATIVE SCHOOL PROGRAM
has negatively impacted has not changed
...the overall learning environment of the school.
has positively impacted
Overall you feel the ALTERNATIVE SCHOOL PROGRAM
has negatively impacted has not changed has positively impacted
...the overall learning environment of your classroom.
41

Student Survey
Thank you for taking the time to respond to this survey. Your input is appreciated.Please respond by choosing the one choice which you most agree with and circle it.
Do you feel that you are doing better this year than last year in eighth grade?
yes no
Do you think your teachers are interested in your success as a student?
yes no
Do you like how your classes are taught?
yes no
Have you been made fun of because of the classes you are in?
yes no
Which of the following reasons would you most agree would help you to be moresuccessful in school?
A) better understanding of materialB) more individual instructionC) more time spent studyingD) completing all homework assignments
42

Appendix B
Data Tables and Survey Responses
43

LIST OF TABLES
Page
Academic Achievement Student Attendance, Behavior and Grade Data 44
Regular Program Student Attendance, Behavior and Grade Data 45
Regular Program Survey Responses 46
Student Survey Responses 50
44

ACADEMIC ACHIEVEMENT STUDENT ATTENDANCE, BEHAVIOR AND GRADE
DATA
Student Sending Attendance Attendance L.A. L.A. Science Science Math Math Behavior_# ___ Code Ethnic Code 8 9 8 9 8 9 8 9 9
500756 6000 1 14 8 78 80.5 79 77.5 75 88 2
505282 4000 3 1 3.5 81.5 85.5 90 82.5 90.5 77.5 0
506488 7000 3 4 1.5 87 84 80 91.5 89 87.5 0
510194 2000 2 3.5 2 77.5 92.5 83 79 74 76 0
516845 2000 2 2 2.5 65 66.5 69.5 73 74 70.5 6
523900 950 2 5 2 71 83.5 81 84.5 73 81 8
523999 950 2 10.5 2.5 82 91.5 88 92.5 87 90.5 4
528286 1000 1 14 7.5 88 79 78 81 77 70 0
528581 7000 1 4 2 96 88 87 97 87 95.5 0
529945 7000 3 4 3 87 84.5 82 92.5 78 86.5 0
532138 7000 2 2.5 0 87 91 78 94.5 85 90.5 0
524064 7000 3 10.5 12.5 88 76.5 93 77.5 88.5 67.5 9
541851 2000 2 2 1 79.5 87.5 79 92 78 93.5 4
541852 2000 2 10.5 5 71 70 71.5 79 75.5 71.5 10
542570 4000 1 6 5 85 91 95 93.5 85.5 88.5 0
544517 4000 10 0 88.5 93 90 94.5 91 95 0
546713 2000 2 4.5 1.5 78 71 76 74 81 71.5 7
547133 2000 2 5 10 76 63.5 81.5 77.5 72.5 60.5 12
550241 7000 1 6.75 5 87 85.5 82 90.5 87 89 0
557665 2000 2 2 0 92.5 92.5 87.5 94.5 81 97.5 0
599302 6000 1 2 1.5 76.5 90.5 75 94 87 94.5 0
559619 2000 2 6.5 5 70 73 72.5 71.5 71.5 69.5 7
569265 4000 1 3 3 77.5 86 83 87 77 80 0
573286 7000 2 4.5 3.5 93 80 87 83.5 87 83.5 4
575067 7000 2 4 0.5 87 77 75 90.5 84 87.5 1
575102 950 1 9 12.5 40 76 61 80.5 53 68 0
576261 1000 3 0 4 85 90.5 83 90 80 76.5 0
582387 2000 1 0.75 3 88 93 88 94.5 84 95.5 0
588889 2000 2 3 5 76 64 80 81.5 79 64 7
596405 2000 2 8.5 3 75 78.5 71 70.5 71 70 4
596451 2000 2 0.5 0 81 73 73 77.5 74 78 4
598023 2000 2 3 0 84 87 80 90.5 78 82.5 0
AVERAGE 5 4 81 82 81 85 80 81 3
CHANGE -1 -1 4 1
45

REGULAR PROGRAM STUDENT ATTENDANCE, BEHAVIOR AND GRADE DATA
Student Sending Attendance Attendance L.A. L.A. Science Science Math Math Behavior|# |_Code Ethnic Code 8 9 8 9 8 9 8 9 9
509258 2000 2 2.5 2 73 94 82 86.5 72 84.5 0
509182 2000 2 1 2.5 81.5 75.5 92 79.5 90.5 86 1
509261 2000 2 3.5 5 80 71 72 69.5 73 60.5 4
518364 2000 2 3 10.5 89 93.5 87 72.5 90 98 0
519195 2000 2 4.25 6 96 86.5 92 73.5 96 69.5 0
537912 2000 2 1.5 6 91 55 84 68 86 72.5 4
541283 2000 2 8 4 95 82.5 93 65.5 93 85 5
551826 2000 2 1.5 5 92 91.5 87 66 87 94.5 0
555199 2000 2 4 5.5 80 88 67.5 75 73 83 4
560525 2000 2 4 0 90 75 88 88 95 79.5 4
561232 2000 2 1 1 96 88.5 85 96 87 72 0
562392 2000 2 4 0 96 74 87 83.5 87 66 7
565075 2000 2 0.5 9 95.5 86.5 98 85 98.5 61.5 1
566333 7000 1 1.5 3 88 88 81 97 79 95.5 7
571834 7000 1 11 5.5 77 74.5 82.5 85 84.5 63 1
575104 7000 3 1 3 77 78 80 89.5 77 87.5 0
505282 7000 3 15 2 96 85.5 96 82.5 92 77.5 2
575766 7000 3 1.5 3 79 90.5 79 90 86 84.5 3
575768 6000 1 3.5 6 94 83 94 82 92 84.5 15
575964 6000 1 12.5 4 84 81 94 93 83 77.5 3
587469 1000 1 2 2 85 88 87 82 85 85 0
587473 4000 3 0.5 1 96 90.5 96 60.5 94 76.5 0
587969 950 2 2.5 0 93 96.5 88 75 83 75 3
588476 950 2 0.25 1 90 78 82 66.5 87 68 0
592107 950 1 3.5 3.5 86 94.5 85 63 88 45 0
595215 4000 1 10 7 60 95 80 81 80 94 0
597164 4000 1 3.25 3.5 92 95 85 96 92 96 0
598188 4000 1 4 2 90 67.5 86 98.5 85 75 1
599201 1000 3 1 8.5 86 83 84 73 90 90.5 5
599312 2000 1 9.75 0 93 89.5 85 98 88 60 20
599712 7000 2 8.5 4 93 89.5 94 70 95 73 0
599614 7000 2 2 2 83 78 78 87 77 79.5 1
AVERAGE 4 4 87 84 86 81 86 78 3
CHANGE__ 0 __-3 __ -5 _ -8
46

REGULAR PROGRAM TEACHER SURVEY RESULTS
66 surveys returned from 81 surveys distributed.Results are indicated in bold parenthesis.
With regard to the students you teach:
On average the students you teach are:
(not) 1
(not) 1
(not) 1
(not) 1
What do you believe about
HONORS:(not) 1
(not) 1
(not) 1
(not) 1
COLLEGE PREP.:(not) 1
(not) 1
(not) 1
(not) 1
(3) 2 (35) 3 (26)MOTIVATED
(3) 2 (21) 3 (36)INTELLIGENT
(1) 2 (19) 3 (43)SUCCESSFUL
(2) 2 (16) 3 (35)WELL BEHAVED
our various student populations?
(1) 2 (4) 3 (24)MOTIVATED
(0) 2 (3) 3 (32)INTELLIGENT
(0) 2 (0) 3 (30)SUCCESSFUL
(0) 2 (7) 3 (25)WELL BEHAVED
(0) 2 (23) 3 (38)MOTIVATED
(0) 2 (12) 3 (47)INTELLIGENT
(0) 2 (14) 3 (47)SUCCESSFUL
(0) 2 (20) 3 (39)WELL BEHAVED
(OVER)
47
4(very) (4)
4(very) (4)
4(very) (3)
4(very) (11)
4(very) (27)
4(very) (20)
4(very) (26)
4(very) (25)
4(very) (2)
4(very) (3)
4(very) (2)
4(very) (5)

MIDDLE LEVEL:(not) 1
(not) 1
(not) 1
(not) 1
BASIC SKILLS:(not) 1
(not) 1
(not) 1
(not) 1
ACADEMIC ACHIEVEMENT(not) 1
(not) 1
(not) 1
(not) 1
ALTERNATIVE SCHOOL:(not) 1
(not) 1
(not) 1
(not) 1
(6)
(3)
(1)
(6)
(18)
(9)
(7)
(11)
(10)
(10)
(8)
(9)
(29)
(19)
(29)
(35)
2 (44)
2 (29)
2 (40)
2 (37)
2 (27)
2 (31)
2 (31)
2 (15)
2(15)
2 (21)
2 (17)
2(15)
2(8)
2(14)
2 (9)
2 (4)
3 (10)MOTIVATED
3 (25)INTELLIGENT
3(19)SUCCESSFUL
3(16)WELL BEHAVED
3 (10)MOTIVATED
3 (10)INTELLIGENT
3 (10)SUCCESSFUL
3 (11)WELL BEHAVED
3(11)MOTIVATED
3 (6)INTELLIGENT
3 (8)SUCCESSFUL
3 (10)WELL BEHAVED
3 (0)MOTIVATED
3 (9)INTELLIGENT
3 (0)SUCCESSFUL
3 (0)WELL BEHAVED
(GO ON TO NEXT PAGE)
48
4(very) (0)
4(very) (0)
4(very) (0)
4(very) (1)
4(very) (0)
4(very) (0)
4(very) (0)
4(very) (0)
4(very) (2)
4(very) (2)
4(very) (3)
4(very) (5)
4(very) (0)
4(very) (2)
4(very) (0)
4(very) (0)
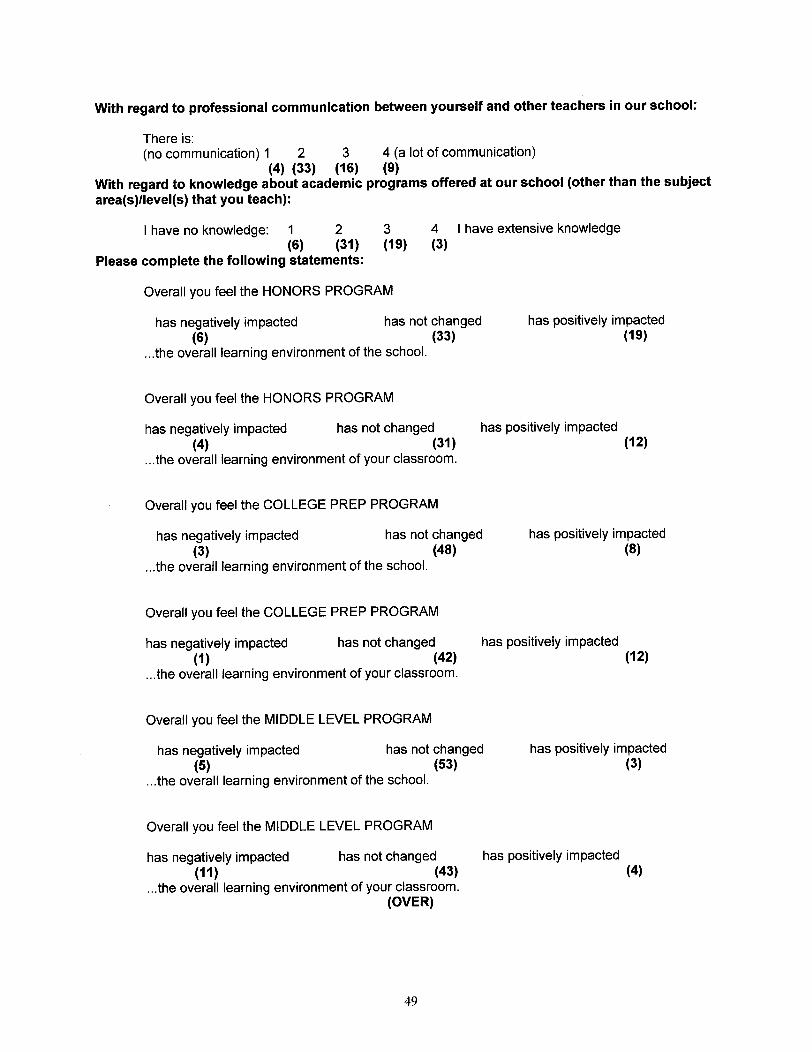
With regard to professional communication between yourself and other teachers in our school:
There is:(no communication) 1 2 3 4 (a lot of communication)
(4) (33) (16) (9)With regard to knowledge about academic programs offered at our school (other than the subjectarea(s)/level(s) that you teach):
I have no knowledge: 1 2 3 4 I have extensive knowledge(6) (31) (19) (3)
Please complete the following statements:
Overall you feel the HONORS PROGRAM
has negatively impacted has not changed has positively impacted(6) (33) (19)
...the overall learning environment of the school.
Overall you feel the HONORS PROGRAM
has negatively impacted has not changed h(4) (31)
...the overall learning environment of your classroom.
Overall you feel the COLLEGE PREP PROGRAM
has negatively impacted has not changed(3) (48)
...the overall learning environment of the school.
Overall you feel the COLLEGE PREP PROGRAM
has negatively impacted has not changed h(1) (42)
...the overall learning environment of your classroom.
Overall you feel the MIDDLE LEVEL PROGRAM
has negatively impacted has not changed(5) (53)
...the overall learning environment of the school.
Overall you feel the MIDDLE LEVEL PROGRAM
has negatively impacted has not changed h(11) (43)
...the overall learning environment of your classroom.(OVER)
as positively impacted(12)
has positively impacted(8)
as positively impacted(12)
has positively impacted(3)
ias positively impacted(4)
49

Overall you feel the BASIC SKILLS PROGRAM
has negatively impacted has not changed(13) (40)
...the overall learning environment of the school.
Overall you feel the BASIC SKILLS PROGRAM
has negatively impacted has not changed has r(14) (35)
...the overall learning environment of your classroom.
Overall you feel the ACADEMIC ACHIEVEMENT PROGRAM
has negatively impacted has not changed(11) (27)
...the overall learning environment of the school.
Overall you feel the ACADEMIC ACHIEVEMENT PROGRAM
has negatively impacted has not changed has I(7) (34)
...the overall learning environment of your classroom.
Overall you feel the ALTERNATIVE SCHOOL PROGRAM
has negatively impacted has not changed(11) (23)
...the overall learning environment of the school.
Overall you feel the ALTERNATIVE SCHOOL PROGRAM
has negatively impacted has not changed(12) (25)
...the overall learning environment of your classroom.
has positively impacted(9)
positively impacted(8)
has positively impacted(13)
positively impacted(8)
has positively impacted(20)
has positively impacted(16)
50

Student Survey Results66 surveys (33 for each group) - all surveys returned
Do you feel that you are doing better this year than last year in eighth grade?
yescontrol group 20A.A.T. students 24
no1310
Do you think your teachers are interested in your success as a student?
yescontrol group 15A.A.T. students 25
no188
Do you like how your classes are taught?
yescontrol group 17A.A.T. students 22
no138
Have you been made fun of because of the classes you are in?
yescontrol group 7A.A.T. students 12
no2420
Which of the following reasons would you most agree would help you to be moresuccessful in school?
A) better understanding of materialB) more individual instructionC) more time spent studyingD) completing all homework assignments
Control (15)Control (5)Control (8)Control (4)
A.A.T. students (9)A.A.T. students (0)A.A.T. students (8)A.A.T. students (14)
51

Biographical Data
Donald MillsName
High School Haverling High SchoolBath, New York
Undergraduate
Graduate
Present Occupation
Bachelor of ScienceBiological SciencesSaint Bonaventure UniversityOlean, New York
Master of ArtsSchool AdministrationRowan UniversityGlassboro, New Jersey
Science TeacherCumberland Regional High SchoolSeabrook, New Jersey
52