Abu Dhabi Sewerage Services Company (ADSSC), Abu Dhabi - UAE


Abu Dhabi in Figures 2010
Copyrights reserved for Statistics centre - Abu Dhabi
His Highness Sheikh
Khalifa bin Zayed Al NahyanPresident of the United Arab Emirates

His Highness Sheikh
Mohammad bin Zayed Al NahyanCrown Prince of Abu Dhabi and Deputy Supreme
Commander of the UAE Armed Forces

Foreword
Statistics Centre - Abu Dhabi is pleased to present “Abu Dhabi in Figures - 2010”, which culminates a year of dedicated statistical work. We aspire to serve the comprehensive development efforts in the Emirate of Abu Dhabi, under the wise leadership of HH sheikh Khalifa bin Za-yed Al Nahyan and the unlimited support of HH sheikh Mohammed bin Zayed Al Nahyan, Crown Prince of Abu Dhabi and Deputy Supreme Commander of the Armed Forces.
It gives me great pleasure to invite decision-makers, the business sector and all those interested in statistical figures to review this publica-tion. Through this book, we strive for accuracy, data quality and clarity of methodology and analysis. We hope to enrich the content of each publication, while providing key statistical data to the public.
In this book sets forth a vast array of economic, social and environmental figures that highlight the general determinants of development in the Emirate of Abu Dhabi and emphasize the continued efforts to promote the concept of balanced development, while ensuring the preservation of a sustainable environment.
I seize this opportunity to commend the cooperation of our strategic partners, including all the local government departments and entities, federal bodies and private enterprises that provided us with the required data.
Hopefully this new issue of Abu Dhabi in Figures will help to advance the efforts conducive to the investment in development opportunities along the road to prosperity and excellence through the vision of the nation’s judicious leadership.
Butti Ahmed Mohammed Butti Al QubaisiDirector GeneralAugust 2010

Economy
Industry and Business
Population and Demography
Social Statistics
Labour Force
Agriculture and Environment
Contents
13
18
26
28
31
32
I Units and Abbreviations
II The Emirate of Abu Dhabi


AED = UAE dirham
[Blank] = not applicable
CPI = Consumer Price Index
Donum = one thousand square metres
FDI = Foreign Direct Investment
GDP = Gross Domestic Product
kg = kilogram
km = kilometre
kwh = kilowatt hour
mwh = megawatt hour
mm = millimetre
na = figure not available
0 (0.0) = less than half of the unit concerned
'000 = in thousands
0C = degrees centigrade
• Figures in italics are provisional and subject to revision.
• Due to rounding, totals may not equal the sum of component parts.
• Unless otherwise indicated, all tables in this book relate to the Emirate of Abu Dhabi.

The Emirate of Abu Dhabi is located in west and southwest part of the United Arab Emirates along the southern cost of the Arabian Gulf between latitudes 22°40’ and around 25° north and longitudes 51° and around 56° east. The total area of the Emirate is 67,340 square kilometres, which represents about 87% of the total area of the UAE. The territorial waters of the Emirate embrace about 200 islands off its 700 km coastline.
Abu Dhabi is the richest emirate of the UAE federation, and Abu Dhabi City is the nation’s capital. The Emirate of Abu Dhabi is made up of three regions, namely, Abu Dhabi, Al Ain, and the Western reigion. The Emirate sits atop 10% of the world’s oil reserves and 5% of the global reserves of natural gas. Abu Dhabi accounts for 90% the UAE’s oil production.
Location and Area
The Emirate of Abu Dhabi is the largest among the seven emirates constituting the UAE federation. It occupies about 87% of the country’s total area and has a coastline extending more than 700 km.
Abu DhabiDubaiSharjahRas Al-Khaimah
FujairahUmm Al QiwainAjman
The Emirate of Abu Dhabi
86.67%
5.00%
3.33%
2.17%1.50%
1.00%0.33%

13
Gross Domestic Product
Despite the repercussions of the global financial crisis, economic activities of the Emirate’s non-oil sectors achieved a growth of 6.2% in 2009. As a result of the drop in oil prices, per capita GDP retreated to AED 332,500 in 2009, down from AED 423,900 in 2008, but remains one of the highest worldwide.
Economy
The Emirate’s GDP at current prices in 2009 is estimated at AED 546.5 billion, which constitutes more than 60% of total GDP of the UAE. On the other hand, non-oil economic activities grew by 6.2%.
Mining and quarrying accounted for only 49.4% of the GDP of the Abu Dhabi in 2009, while non-oil activities contributed an impressively high 50.6%. This result is in line with the Emirate’s plans to expand the economic base, diversify income sources and reduce dependency on oil.
Gross Domestic Product by Economic Activities at Current Prices (Million AED)
Economic Activity 2007 2008* 2009*Total 545,368 666,732 546,476Commodity Activities 407,934 516,719 386,415Agriculture, Live stock and fishing 5,591 5,512 5496Mining and quarrying 307,445 405,827 269875Manufacturing industries 35,270 38,862 40521Electricity, gas and water 12,592 14,165 15295Construction 47,036 52,353 55228Services Activities 137,433 150,012 160,061Wholesale retail trade and repairing services 26,160 28,363 30132Hotels and restaurants 4,864 5,542 6425Transport, storage and communications 33,292 36,646 38822Financial institution and insurance 27,294 30,313 31652Real Estate and Business services 40,088 43,209 46037Social and Personal services 1,508 1,677 1808Less: imputed bank service charge 16,233 19,353 21531Public Administration and Defense 11,571 13,703 15952Domestic Services of household 1,011 1,150 1321Education 6,121 6,808 7337Health 1,757 1,954 2106
Source: Statistics Centre – Abu Dhabi * Preliminary estimates

14
EconomyForeign Trade
Trade statistics reveal that the Abu Dhabi’s foreign trade in 2008 was valued at 73% of the Emirate’s GDP in that year, which also saw the trade balance of Abu Dhabi post a huge surplus of AED 307,071 million. Certainly, these indicators reflect the Emirate’s robust and highly developed level of commercial activity and significance of foreign trade for the Emirate’s economy in general.
The total value of Abu Dhabi’s non-oil foreign trade in 2009 was AED 112.1 billion, marking a growth of 9.0% over foreign trade in 2008, which totalled AED 102.8 billion. A break down of this growth shows that Abu Dhabi commodity imports grew in 2009 by 4.0%, while non-oil exports and re-exports surged 52.0% and 39.3%, respectively.
The ratio of non-oil exports and re-exports / imports for the Emirate’s foreign trade in 2009 was 19.4%, up from an average exports/ imports coverage ratio of 16.4% over the course of the past ten years.
Key indicators of foreign trade: (Million AED)
Item 2005 2007 2008 2009Total Exports 199,093.0 281,050.2 397,348.1 na
Oil, Gas and Oil Products 187,985 269,630 384,854 naNon - Oil Exports 3,186.4 5,805.3 6,252.0 9,500.8Re-Exports 7,921.6 5,615.0 6,242.0 8,694.2Imports 35,214.3 63,342.8 90,277.0 93,872.2Net trade in goods 163,879 217,707 307,071 na
Source: Statistics Centre – Abu Dhabi
Non-oil Foreign Trade, 2009
In terms of exports, Qatar and Nigeria were the top trading partners of Abu Dhabi, receiving 52.8% of the Emirate’s non-oil exports in 2009, followed by Saudi Arabia, China and India. On the other hand USA, Germany, Saudi Arabia, Japan and South Korea were the source countries that supplied Abu Dhabi with more than 50% of its imports by value.

15
Top Trading Partners , 2009 (Million AED)
Non-oil exports Imports
Country Value % Country Value %
Total 9500.8 100 Total 93,872.2 100.0
Qatar 3803.5 40.0 USA 12,571.1 13.4
Nigeria 1214.5 12.8 Germany 10,155.7 10.8
Saudi Arabia 877.9 9.2 Saudi Arabia 9,559.4 10.2
China 550.9 5.8 Japan 8,752.4 9.3
India 500.0 5.3 Korea 8,093.5 8.6
Other countries 2,554.0 26.9 Other countries 44,740.1 47.7
Source: Statistics Centre – Abu Dhabi
The main categories of re-exports in 2009 were “base metals and articles of base metals” and “plastics and articles thereof” which contributed 39% and 26% respectively of non-oil exports, thus accounting for a combined share of around two-third of Abu Dhabi’s non-oil exports in 2009. On the imports front the top commodity groups were “machinery, equipment, machine tools and their parts” which accounted for 33% of Abu Dhabi imports in 2009, followed by transport equipment at 25% and “base metals and articles thereof” at 16%. Altogether these three categories accounted for three quarters of Abu Dhabi’s commodity imports in 2009.
Key indicators of foreign trade as percentages of the GDP
Item 2006 2007Total Exports 51.9 51.5
Oil, Gas and Oil Products 49.0 49.4 Non - Oil Exports 0.8 1.1 Re-Exports 2.1 1.0
Imports 9.2 11.6Trade in goods 61.1 63.1Net trade in goods 42.7 39.9Source: Statistics Centre – Abu Dhabi
EconomyForeign Trade

16
EconomyPrices
Abu Dhabi inflation rate declined to 0.78% in 2009, down from 14.88% in 2008. Interestingly, this record low rate of inflation comes as one of the favourable consequences of the global financial crisis. It confirms the resilience of Abu Dhabi economy and gives it a competitive edge vis a vis other economies both regionally and globally, by enhancing the appeal of the Emirate’s economy to local and foreign investors.
The main findings of CPI calculations are outlined below:• The inflation rate in 2009 was 0.78% compared with
14.88% in 2008. This was a result of a rise in the CPI from 114.9 points in 2008 to 115.8 points in 2009.
• This rise implies that the rate of increase in the prices of the consumer basket for the year 2009 compared with 2008 was less than one percent.
• Housing, water, electricity, gas and other fuels contributed 223.3% to the total inflation rate in 2009, mainly due to an increase of 5.4% in rentals.
• Education contributed 38.8% to total inflation in 2009 rate, mainly due to an increase of nearly 11% in tuition fees.
• The “clothing and footwear” group detracted 77.3% from annual inflation. The negative contribution of this expenditure group was caused by the drop of 5.5% in the prices of the group, largely due to a decline of 3.3% in clothing prices and a fall of 23.5% in footwear prices.
• The “food and non-alcoholic beverages” group has also had a negative contribution to the 2009 inflation rate, detracting it by 69.1%, owing to a drop in the prices of most of its sub-groups.
Annual Inflation Rates
Monthly Year-on-Year Inflation Rates, 20092005 2006 2007 2008 2009
16.014.012.010.0
8.06.04.02.00.0
14.88
10.708.30
6.20
0.78

17
Public Finance
Abu Dhabi is a major producer and exporter of oil, which accounts for nearly 90% of the income of the Government of Abu Dhabi. This ratio undersores the fact that the taxes and duties levied by the Emirate’s authorities are very low, contributing a tiny 8.1% of the total government revenues in 2009. As for public expenditure, current expenditures consumed about 60.8% of total expenditure in 2009, compared with 39.2% for capital expenditures.
Percentage Distribution of Abu Dhabi Government Revenues
Item 2005 2007 2008 2009*Total 100 100 100 100Oil and tax revenues 85.9 91.6 92 89.2Current revenues of departments 11.6 6.5 6.4 8.1Capital revenues 2.5 1.9 1.6 2.7
Source: Statistics Centre – Abu Dhabi*Preliminary estimates
Percentage Distribution of Public Expenditures by Type
Relative weight 2005 2007 2008 2009*Total 100 100 100 100Current Expenditure 77.6 76.2 64.3 60.8Salaries and wages 15.4 13.4 11.4 9.8Goods and services 15.2 12.5 10.8 11.2Current tranfers 47.0 50.3 42.1 39.8Capital Expenditure 22.4 23.8 35.7 39.2Development expenditure on government projects 12.8 4.8 7.2 10.9Capital Expenditure (goods and services) 1.0 0.7 0.2 0.4Capital transfers 8.6 18.3 28.3 27.9
Source: Statistics Centre – Abu Dhabi * Preliminary estimates
Economy

18
Investment ClimateIndustry and Business
The Emirate of Abu Dhabi is characterized by an ideal investment climate that has arguably been essential to the Emirate’s current progress and prosperity. It is also true, however, that there is still room for upgrading the local business environment, enhance its appeal to selective investments, maximize the value added of the local economy and ramp up non-oil exports.
General Indicators of the Investment ClimateInvestment climate 2008 2009Total businesses registered (number) 73,677 76,943New businesses registered (number) 10,686 3,266Business entry rate (new registrations as % of total) 14.5% 4.2%
Source : Department of Economic Development
Inflows of FDI by Economic Sector, 2007 (value in Million AED)
Main Sector Value Relative Share
Total 31,465 100
Mining 1,892 6.0
Manufacturing 2,431 7.7
Electricity and Water 6,157 19.6
Construction 2,841 9.0
Wholesale and trade 198 0.6
Restaurant and Hotels 45 0.1
Transportation and communication 1,243 4.0
Real Estate * 11,840 37.6
Financial Intermediation and insurance 4,565 14.5
Other 254 0.8
Source: Statistics Centre - Abu Dhabi * Include housing sale to non resident
There are several factors behind the attractive investment climate of Abu Dhabi, including the Emirate’s strategic geographic location, highly developed infrastructure, miscellaneous facilities offered by the Emirate’s free zones and industrial cities, very low tax, easy access to low-cost energy sources and credit facilities, etc.
As trade license statistics in 2009 illustrate, how Abu Dhabi continues to be successful in creating an integrated investment climate and optimising it to cope with international changes in a way that would help to transform the Emirate into a regional financial and business centre. A total of 76,943 trade licenses were issued in 2009, of which 3,266 licenses were issued for new businesses, marking a rise of 4.2% over the 73,677 licenses issued in 2008.

19
Industry and BusinessOil and Gas
The Emirate of Abu Dhabi ranks sixth worldwide in terms of proven oil reserves. It sits atop 10% of the world’s oil reserves and accounts for 8% of OPEC’s production. Abu Dhabi Emirate also ranks seventh worldwide in terms of natural gas reserves.Abu Dhabi has two oil refineries with a combined production capacity of 600,000 barrels per day. The Emirate intends to set up a third refinery in the Emirate of Fujaira with a production capacity of 300,000 barrels per day.Oil revenues constitute the main source of finance for Abu Dhabi’s programmes of sustainable development and economic diversification. The value added of this activity contributes 60% of the Emirate’s GDP. This prompted the Government to adopt a plan aimed at diversifying the economic base and reducing this ratio to 36% by 2030.
Key Statistics of Oil and Gas ActivityOil and Gas Activity 2007 2008* 2009*Share in GDP(%) 56.4 60.9 49.4Gross output (% of GDP) 60.3 64.4 52.8Capital formation (% of GDP) . 1.5 1.5 1.6Compensation of employees (million AED) 4,878 5,448 5,962Imports (% of total imports) na 0.6 0.7Exports (% of total exports) 95.9 96.8 na
Source: Statistics Centre - Abu Dhabi *Preliminary estimates
Proven Oil and Natural Gas ReservesItem 2005 2007 2008 2009Oil Reserve (Billion Barrels) 92.2 92.2 92.2 92.2Natural Gas Reserve (Trillion Cubic Feet) 198 212 212 212
Source: Abu Dhabi National Oil Company – ADNOC
Crude Oil Production and Exports ( Thousand Barrels)
Item 2005 2006 2007 2008
Production Volume 818,330 838,770 863,225 901,751Daily Average 2,242 2,298 2,365 2,464
Exports Volume 672,330 685,470 814,939 858,012Daily Average 1,842 1,878 2,233 2,344
Source: Abu Dhabi National Oil Company – ADNOC Note: Production excludes condensates
Abu Dhabi’s oil reserves, is estimated at 92.2 billion barrels, which makes up 10 % of global oil reserves. The Emirate’s total natural gas reserves amount to 212 trillion cubic feet. In 2009, average production of crude oil was 2.464 million barrels per day, while natural gas was produced at 5,674 million cubic feet per day.

20
Industry and BusinessManufacturing industry
Petrochemicals
The manufacturing industry is one of the key activites targeted by the government for opportunities of economic diversification in the pursuit of sustainable economic development over the course of the next few years. Manufacturig industries accounted for 29.3% of Abu Dhabi’s industrial output and 12.4% of the value added generated in 2009.
At the forefront of the Emirate’s manufacturing activities is the base metals activity, which is key to the development of the manufacturing activity, having accounted for 4.5% of value-added and 36.2% of gross fixed capital formation of the manufacturing activity in 2009.
Key Statistics of the Manufacturing Activity
Manufacturing Activity 2007 2008* 2009*
Share in GDP(%) 6.5 5.8 7.4
Gross output (% GDP) 19.4 17.5 23.4
Capital formation (% GDP) . 1.8 1.6 2
Compensation of employees (million AED) 6194.0 7214 7523
Source: Statistics Centre - Abu Dhabi *Preliminary estimates
The Emirate’s petrochemical industry has been evolving constantly, benefitting from the availability of the basic inputs, which give this sector the opportunity to manufacture high-quality products and ensure market success. Abu Dhabi’s basic petrochemical products include polyethylene and fertilisers, such as urea and ammonia.
Production and Exports of Petrochemicals Products, 2008 ( Metric Tons )
Production ExportsTotal 1,658,919 1,188,483
Ammonia 456,691 79,886
Urea Fertilizer 618,377 583,800
Ethylene and Polyethylene 583,851 524,797
Source: Abu Dhabi National Oil Company – ADNOC

21
Industry and BusinessElectricity and Water
In 2009 the amount of electricity generated in the Emirate of Abu Dhabi was 39189 GWh, while per capita consumption of electricity was about 14.73 MWh. Water statistics show that about 219640 million imperial gallons of desalinated water were made available in 2009, while per capita daily consumption reached about 214.6 imperial gallons.
There are seven companies producing electrical power and desalinated water in the Emirate of Abu Dhabi. The government fully owns two of them and has a 60% stake in the remaining five. These companies operate 17 power and desalination plants. There are also four ADWEA affiliates dealing with water supplies and power transmission and distribution, all fully owned by the Emirate of Abu Dhabi.
In 2009 electricity consumption in the Emirate Abu Dhabi reached 24,214 GWh, of which domestic consumption accounted for around 38%. Abu Dhabi region’s share of total electricity consumption was 64%, followed by Al-Ain region (29%) and the Western region (7%).
The Emirate’s water consumption totalled 173,781 million imperial gallons, of which Abu Dhabi region consumed 62%, Al Ain region 24% and the Western region 14%. Domestic consumption accounted for 68% of the Emirate’s total water usage, followed by the agricultural sector (3.4%).
Key Statistics of the Electricity and Water ActivityElectricity and water Activity 2007 2008* 2009*
Share in GDP(%) 2.3 2.1 2.8
Gross output (% of GDP) 2.9 2.8 3.5
Capital formation (% of GDP) . 1.3 1.2 1.6
Compensation of employees (million AED). 1,330 1,420 1,502
Source: Statistics Centre - Abu Dhabi * Preliminary estimates
Electricity and Water Consumption by Region, 2009

22
Number of Permits Issued by Building Usage and Region, 2009
Building Usage Abu Dhabi Al Ain Western Region
Total 8,819 2,949 855Residential 3,718 2,114 534Commercial 388 304 146Industrial 338 232 9Public Utilities 424 189 62Agricultural 0 76 38Residential and Commercial 296 0 0Temporary 3,629 0 0Others 26 34 66
Source: Department of Municipal Affairs - Municipality of Abu Dhabi
Industry and BusinessConstruction
The contribution of the construction activity to the the GDP in 2009 is forecast to be 10.1%. Labour compensation within the construction activity is also expected to grow by about AED 3 billion from AED 12 billion in 2007 to AED 15 billion in 2009.
Number of Permits Issued by Type of Permit, 2009Type of Permits Abu Dhabi Al Ain Western Region Total 8,819 2,949 855
New building 1,429 939 160permits renewal or amendments 655 472 38Additions 2,609 956 427Improvements and decorations 22 357 215Temporary 3,629 24 7Demolition 264 185 5Others 211 16 3
Source: Department of Municipal Affairs - Municipality of Abu Dhabi

23
Industry and BusinessTransport
In 2009, the number of vehicles and heavy equipment in the Emirate of Abu Dhabi totalled 668,800 , while aircraft movement via Abu Dhabi and Al-Ain international airports totalled 105,392 flights.
Realizing the important role of transport sector in economic and social development and the fact that it serves as one its key indicators, the Emirate of Abu Dhabi pays particular attention to the development of the “transport, storage and communication” activity, which accounted for 5.5% of the Emirate’s GDP in 2008.
Annual Air Transportation Statistics
2009200820072005Item
105,39295,94985,49779,269Aircraft movement
9,764,7149,168,1827,109,7845,605,529Passenger traffic
381,386356,808319,888215,118Cargo tonnage
Source: Abu Dhabi Airports Company (ADAC)
Traffic statistics show that the number of light vehicles reached 586,100 units in 2009, a rise of 20.3% compared with 2008. It is also noted that road accidents increased by 4.4% in 2009, while injuries sustained as a result of road accidents dropped 19% to 3700 cases, down from 4600 inuries in 2008. The rate of road fatalities fell in 2009 to 20.6 deaths per 100 thousand population, down from 23.9 deaths per 100 thousand in 2008.
Main Indicators for Goods Vessels Movement in Zayed Port
Description 2005 2007 2008 2009
Number of Vessels 2,064 2,452 2,490 2,123
Total teus 230,354 336,496 390,087 526,188
General Cargo (metric tons) 1,823,692 2,680,101 5,122,866 4,914,167
Source: Abu Dhabi Terminals

24
Key ICT IndicatorsDetails 2007 2008 2009
Number of broadband internet subscriptions per 100 population 4 13 12
Number of Dial up connections per 100 population 12 25 25
Number of fixed telephone subscriptions 24 18 19
Number of mobile phone subscriptions per 100 population 131 161 176
Network coverage per 100 population 100 100 100
Source: Telecommunication Regulatory Authority *Preliminary estimates
Information and Communication Technology (ICT)Industry and Business
Mindful of the growing importance of information and communication technology (ICT) in all walks of life, Abu Dhabi is gradually adopting the concept of electronic government and seeks to create an e-link between all government departments within a single network, in order to help improve the quality and reliability of the services provided to the public.
The Government of Abu Dhabi is steadily evolving into an excellent provider of quality services to nationals and residents through gradually adopting the concept of electronic government. Abu Dhabi ranks top within the Arab World and is among the world’s top 30 countries in terms of information and communication technologies (e-Maturity).
ICT statisitics reveal that internet subscriptions have grown to 25 per 100 population, while subscriptions to the broadband internet reached 12 per 100 population. Telecom data also reports an impressive 176 subscriptions per 100 population for mobile telephone lines. The number of mobile phone lines rose to 2898162 in 2009, while broadband Internet subscriptions reached 194964 lines.

25
TourismIndustry and Business
The number of hotel establishments increased 13% to 110 in 2009, while the number of hotel guests and hotel rooms grew at 2.5% and 34%, respectively. Occupancy rate and average duration of stay were 72% and 2.8 nights, respectively.
A comparison with the tourism figures for 2008 reveals a notable growth in the number of hotel establishments in 2009, to match the demand created by the numerous international events hosted in Abu Dhabi. In this regard, the number of hotels in Abu Dhabi increased 13% to 110 facilities in 2009. This was paralleled by a growth of 34% in the number of hotel rooms. However, this significant rise in the number and capacity of hotels reduced the occupancy rate by 11.5 percentage points from 83.6% in 2008 to 72.2% in 2009, even though the number of hotel guests rose by 2.5% in 2009.Average duration of stay dropped from 3.1 nights in 2008 to 2.8 nights in 2009, reducing the total revenues of hotels and hotel apartments by 0.5%.Figures also point to a decline of 9.8% in the number of guests for all nationalities except UAE nationals, for whom the number surged by about 26%. The year 2009 also saw the number of guest nights retreat by 7.6%. A breakdown of this net change, however, shows a rise in guest nights for UAE nationals by 3.3% and for guests from Australia and Oceania by 13.7% compared with a drop of 10.9% in guest nights for other nationalities.
Key Statistics of Hotel Establishments
Item 2008 2009
Number of Hotel Establishments 97 110
Number of Rooms 12,727 17,104
Number of Guests 1,503 1,540
Number of Guestnights (Thousand) 4,673 4,319
Average Length of Stay ( in days) 3.11 2.80
Annual Occupancy Rate(Hotel + Hotel Apt.) 83.62 72.17
Total Revenues (million AED) 4.30 4.29
Source: Abu Dhabi Tourism Authority
Guests of Hotel Establishments and Guestnights by Nationality, 2009
GuestnightsGuestsNationality
4,318,5041,540,258Total
1,117,628650,585UAE
163,24785,670Other GCC
446,668158,797Other Arab
654,807173,921Asia ( Except Arab)
119,48426,013Australia and Pacific
53,23313,569Africa ( Except Arab)
1,272,993325,392Europe
444,64692,696North and South America
45,79813,615Not Specified
Source: Abu Dhabi Tourism Authority

26
Population and Demography Population
Population estimates for mid-2009 show that the population of Abu Dhabi has reached 1.643 million, of whom 25% are UAE nationals and 47% are residents of Abu Dhabi city. The age structure by broad age-groups shows that 40.2% of nationals are below age 15, 57.6% fall within the working age (15-64) years and 2.2% are elderly people aged 65 years and above.
In 1975 the total population of the Emirate of Abu Dhabi was 211812 people. The figure grew to 1,399,484 inhabitants according to the 2005 Census. SCAD’s mid-2009 estimates put the size of the Emirate’s population at 1,643,344 people. This marked rise in population resulted largely from the mass influx of foreign labour involvled in the various economic activities contributing to economic development in the Emirate. UAE nationals comprise 24.75% of Abu Dhabi’s total population.
Males Females
Age Groups
Population
Population Pyramid for Nationals, Mid 2009
However, the rate of annual population growth retreated from 15.2% between 1975 and 1980 to 4.4% over the period 2001-2005. Overall, the Emirate’s population grew sixfold from 1975 to 2005.

27
Population and Demography Key Demographic Indicators
Geographical Distribution of Population, mid-2009
20092005Item1,643,3441,374,169Mid-year population
126.0135.3General fertility rate – births per 1000 female nationals (15-49) years61.775.3General fertility rate – births per 1000 female non-nationals (15-49) years80.994.2General fertility rate – births per 1000 females (15-49) years
3.13.3Natural increase rate- nationals population %1.11.3Natural increase rate- nationals non-population %1.61.8Natural increase rate- total population %
73.573.4Life expectance at birth for males (years)77.174.5Life expectance at birth for females (years)
8.88.4Infant mortality rate per 100 live births33.135.7Crude birth rate per 1000 nationals population12.614.4Crude birth rate per 1000 non-nationals population17.719.7Crude birth rate per 1000 population
2.42.4Crude death rate per 1000 nationals population1.61.6Crude death rate per 1000 non-nationals population1.81.8Crude death rate per 1000 population
Source: Statistics Centre - Abu Dhabi

28
Social StatisticsHealth
Health services in the Emirate of Abu Dhabi have undergone remarkable development in terms of both coverage and quality, as demonstrated by the substantial increase in the number of health facilities to 39 hospitals and 207 health clinics.
Abu Dhabi Emirate provides comprehensive medical coverage to all nationals through the (Thiqa) Program in collaboration with the National Health Insurance Company (Daman). By early 2008, the program covered 95.3% of nationals. The health insurance scheme also caters to non-nationals, since their coverage is a pre-requisite for granting and renewal of residence permits. The number of cases treated at the Emirate’s health facilities increased 25% between 2007 and 2009.
Key Health Statistics, 2009Physicians per 1000 populations 2.6 Beds per 1000 populations 2.2 Nurses per 1000 population 5.0 Number of Hospitals 39 Number of Health centers 365 Number of Clinics 207 Number of Pharmacies 405 Number of Physicians 4,327 Number of Beds 3,621 Number of Nurses 8,142
Key Indicators of Government Health Services20092008200720062005Item
1212121313Hospitals
5951494848Clinics - Centres
26522,5962,4392,3672,343Beds
105,100106,200105,20084,63288,582Admissions
1,8222,7861,6621,7841,246Physicians
588,451750,881290,890175,390398,429Vaccinations
13,35518,48916,21615,79812,345Notifications of communicable diseases
1.61.71.61.61.7Beds per 1000 population
1.11.81.11.20.9Physicians per 1000 population
Source: Helath Authority-Abu Dhabi, Statistics Centre – Abu Dhabi

29
Social StatisticsEducation
According to educational statistics for the 2008/ 2009 academic year, there were 481 schools in Abu Dhabi, of which 301 are government schools and 180 are private schools. During the academic year under review, 278,764 students were enrolled in the Emirate’s schools, which have 12,466 classrooms and 20,275 teachers. There are nine universities based in the Emirate of Abu Dhabi, in addition to 16 other colleges and institutes of higher education. The period under review also saw 5,987 students graduate from the Emirate’s institutions of higher learning, while those studying on scholarships abroad totalled 823.
Illiteracy rate in Abu Dhabi Emirate has shown a significant drop from 23.4% in 1995 to 12.6% in 2005. In 2009 illiteracy rate was estimated at 8.3%.
During the academic year 2008/ 2009, the gross enrolment ratio in the first cycle was 95.6%, the corresponding figures for males and females were 96.1% and 95.1%, respectively. The the net enrolment ratio was 81.8%, while the corresponding figures for males and females were 83.0% and 80.5%, respectively.
Development in the area of higher education is evident from the increase in the number of institutions of higher learning. There are now nine public and private universities based in Abu Dhabi. The Emirate is also home to numerous centres and institutes that offer advanced training in a wide range of disciples.
A dropout rate of 1.8 % was recorded among students in government education during the school year 2007/2008.
Key Indicators of Educational Services2008 /
20092005 /
2006Item
Government Eduction
301322Schools
5,4255,492Classrooms
121,565127,136Students
10,36710,586Teachers
1,8481,791Administrators
Private Education
180173Schools
7,0215,836Classrooms
157,199123,773Students
9,9088,276Teachers
3,1411,674Administrators
13.713.3Student per teacher ratio
22.422.1Student per classroom ratio
Source: Ministry of Education

30
Social StatisticsCulture and Heritage
The Emirate of Abu Dhabi is experiencing a vigorous cultural activity as illustrated by the increase in the number of museums, publications and public lectures. Abu Dhabi now boasts 4 historical and cultural museums that attracted 136,000 visitors in 2009. During the same year, Abu Dhabi’s public libraries received 133,000 visitors.
Number of Visitors of Public Places
2009200820072006Item2,075,0242,545,2672,503,8161,664,460Public Parks
38,19556,69355,51753,110Al Ain Museum
761,715728,691662,951619,042Al Ain Zoo
82,77672,28171,22756,562Al Ain Palace Museum
175,708296,429250,016200,089Hili Fun city
1,8043,800--Dalma Museum*
13,409---Al Jahili Fort Museum**
3,148,6313,703,1613,543,5272,593,443Total
Source: Abu Dhabi Culture and Heritage Authority*Started in 2008**Started in 2008
Number of Visitors of Al Ain Museum
2009200820072006Item
4,3637,5955,5555,080Students410607569440Teachers
1,1661,6839211,143Official delegations32,25646,80848,47246,447Tourist groups38,19556,69355,51753,110Total
Source: Abu Dhabi Culture and Heritage Authority

31
Labour Force (15 years and above) in the Emirate of Abu Dhabi
2008 20052001 Item
86,27275,51860,753Nationals
Employed 803,146711,220588,589Non-nationals
889,418786,738649,342Total
10,04710,32010,898Nationals
Unemployed 19,83418,25316,307Non-nationals
29,88128,57327,205Total
96,31985,83871,651Nationals
Labour Force 822,980729,473604,896Non-nationals
919,299815,311676,547Total
10.412.015.2NationalsUnemployment Rate 2.42.52.7Non-nationals
3.33.54.0Total
64.765.466.8MalesRefined participation rate for nationals in the labour force (%)
17.616.414.9Females
41.340.940.6Total
Source: Statistics Centre – Abu Dhabi, Department of Economic Development
Labour ForceThe Labour Market
SCAD’s mid-2008 estimates show the size of Emirate’s labour force to be 919,298 people (aged 15 years and over), of whom about 10.5% are UAE nationals and 15.9% are females. Crude activity rate for the population in labour force was 58.4%, while unemployment rate was 10.43%, 2.41% and 3.25% for nationals, non-nationals and the total labour force, respectively.
Labour Force Indicators by Region, 2008
Distributed by educational structure, the largest proportion of the unemployed (31.1%) are found to have secondary school certificates, followed by holders of university degrees (25.8%), those with preparatory education (12.5%) and other educational categories at smaller percentages.
32
Agriculture and Environment Farm Holdings
Greenhouses
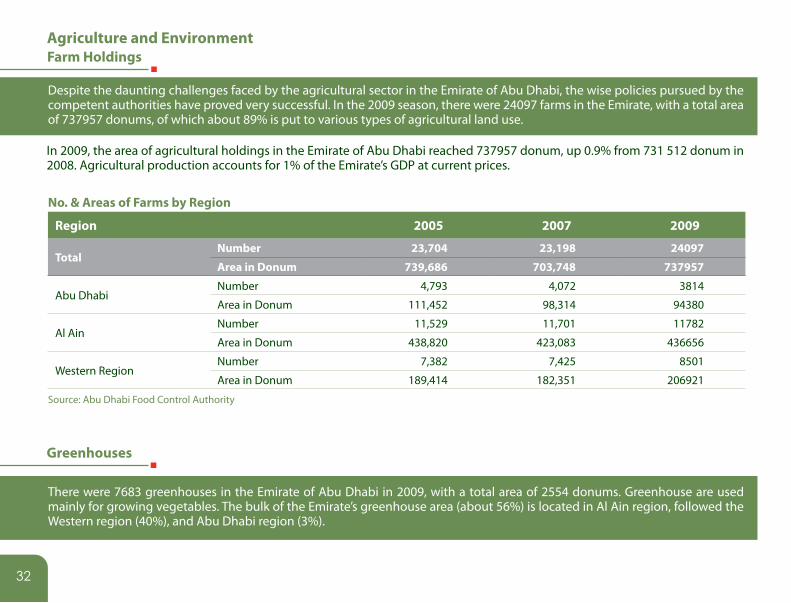
Despite the daunting challenges faced by the agricultural sector in the Emirate of Abu Dhabi, the wise policies pursued by the competent authorities have proved very successful. In the 2009 season, there were 24097 farms in the Emirate, with a total area of 737957 donums, of which about 89% is put to various types of agricultural land use.
There were 7683 greenhouses in the Emirate of Abu Dhabi in 2009, with a total area of 2554 donums. Greenhouse are used mainly for growing vegetables. The bulk of the Emirate’s greenhouse area (about 56%) is located in Al Ain region, followed the Western region (40%), and Abu Dhabi region (3%).
In 2009, the area of agricultural holdings in the Emirate of Abu Dhabi reached 737957 donum, up 0.9% from 731 512 donum in 2008. Agricultural production accounts for 1% of the Emirate’s GDP at current prices.
No. & Areas of Farms by Region
Region 2005 2007 2009
TotalNumber 23,704 23,198 24097
Area in Donum 739,686 703,748 737957
Abu DhabiNumber 4,793 4,072 3814
Area in Donum 111,452 98,314 94380
Al AinNumber 11,529 11,701 11782
Area in Donum 438,820 423,083 436656
Western RegionNumber 7,382 7,425 8501
Area in Donum 189,414 182,351 206921
Source: Abu Dhabi Food Control Authority

33
Agriculture and Environment Livestock
In 2009, sheep and goats populations in the Emirate of Abu Dhabi reached 2.3 million head, an increase of 15% compared to 2008. Some 63% of the Emirate’s sheep and goats herds are raised in Al Ain region. The camels count in 2009 stood at 378076 head, which is 12% in excess of the number of camels recorded in 2008, while the cattle inventory increased over the same period.
Number of sheep, Goats, Cattle, and Camels by Region
Year Abu Dhabi Al Ain Western Region Total
2007
Sheep & Goats 456783 1231951 438870 2127604
Cattle 10507 19442 8951 38900
Cattle 87237 167727 98373 353337
2008
Sheep & Goats 464155 1102856 431269 1998280
Cattle 11445 21240 9911 42596
Camels 83844 156625 96432 336901
2009
Sheep & Goats 473193 1443121 389289 2305603
Cattle 11799 22000 9193 42992
Camels 85445 202827 89804 378076
Source: Abu Dhabi Food Control Authority
Production of Red Meat
About 12,441 tons of red meat was produced during the 2008/ 2009 season. The bulk of this (63%) was sheep and goat meat, followed camels meat and beef, which constituted 26% and 11% of the Emirate’s red meat production, respectively.

34
Agricultural Producer Pirice IndexAgriculture and Environment
Agricultural producer price index increased by almost 9.5% compared to 2008, (2005 =100). The main crops that contributed to this increase included pepper by 54%, G Rocket by 25%, spinach by 21%, cabbage by 21%, beans by 9% and cauliflower by 6%.
On the other hand there was a significant drop in the prices of some crops, such as watermelon, whose price declined by 17%, coriander by 10%, carrots by 8.6%, J.mallow by 7%, onions by 4.2% and beets by 4%.
(2005 = 100)
Crop 2007 2008 2009All Products 101.95 95.21 104.80
F.Tomato 100.04 95.24 97.35Pepper 113.90 74.83 115.26Sweet Cucumber 99.72 101.82 100.93Marrow 105.48 100.22 98.45Cucumber 0.00 0.00 89.15Watermelon 119.84 119.91 99.50Sweet Melon 103.70 102.09 99.50Onion 86.56 113.59 108.88Cowpeas 0.00 100.90 110.00Okra 110.02 0.00 0.00Beans 100.28 100.55 100.26Peas 99.48 101.16 100.90Eggplant 100.37 97.73 101.00Cauliflower 97.15 97.53 102.70B.Bean 40.03 99.37 98.50Cabbage 99.99 86.68 104.93Lettuce 96.81 104.35 107.56Spinach 100.01 82.43 100.01J.Mallow 101.34 115.93 107.68Coriander 100.05 105.05 94.88Beets 101.48 93.55 89.82Parsley 102.76 101.07 103.02Potatoes 101.59 107.21 111.16Corn 149.21 112.42 108.91Turnip 96.14 97.21 100.00Carrot 99.36 111.63 101.93G Rocket 0.00 0.00 106.04
Source: Statistics Centre - Abu Dhabi

35
Agriculture and Environment Fish Production
The amount of fish caught in 2009 was 5977 tons, with an estimated value of total production at 104.8 million AED. Serranidae accounted for the highest total sale value for a single fish family at AED 29.1 million, followed by fish from the Scombridae family (AED 26.2 million) and the Carangidae family (AED 15.7 million). Fishermen made a total of about 26564 fishing trips to catch these quantities of fish.
Quantity of Fish Caught from the Major Families of Fish(Quantity in Tons, Value in millions of AED)
Fish2008 2009
Quantity Value Quantity Value
Total 5,363 74.6 5,977 104.8
Carangidae 761 11.8 1009 15.759
Haemulidae 567 2.8 727 3.918
Lethrinidae 1,063 12.2 1111 15.553
Lutjanidae 142 0.8 275 2.099
Portunidae 224 2.2 133 1.515
Scombridae 302 7.3 954 26.297
Serranidae 922 23.1 940 29.162
Sparidae 200 1.9 162 1.699
Others 1,182 12.5 666 8.815
Source: Environmental Agency - Abu Dhabi

36
Agriculture and Environment Climate
The Emirate of Abu Dhabi is located in a dry tropical region, with the tropic of cancer across the southern part of it. The Emirate has a typical desert climate, characterized by extreme temperatures in summer and a generally warm winter with frequent spells of cold weather
TemperatureThe Tropic of Cancer runs through the southern part of the Emirate of the Abu Dhabi, giving it an arid tropical climate characterized by high summer temperatures, which in 2009 reached a maximum average of 44 °C, but fell to a minimum of 10 °C on average in winter. The maximum summer temperature recorded in 2009 was 50°C, while the minimum temperature in winter was 3.1°C.
Rainfall Rainfall in the Emirate is relatively scanty and abrupt, with the bulk of it falling within a few days of the rainy winter months, especially January and December, in addition to March and April. In 2009, annual average rainfall was 81.1 mm.
HumidityRelative humidity is generally high, approaching 100% in Abu Dhabi Islands and coastal areas and declining towards the desert inland. Higher levels of relative humidity tend to augment the heat burden of air temperature. Average relative humidity ranged between 84% and 49% in winter and 75% - 24% in summer.
WindTwo types of winds prevail in the Emirate, namely, dry northerly winds in winter, often loaded with dust, and the brief, extremely hot easterly winds blowing from the Al-Rub’ Al-Khali (the Empty Quarter) desert. Non-seasonal southerly, south easterly, westerly and north westerly winds blow occasionally across the Emirate.

37
Air Quality
Air quality is one of the major challenges affecting health around the world. At the local level, most of the air pollutants remained within their acceptable limits over the period 2008-2009 in Abu Dhabi Emirate. However, there is an apparent tendency to increase in the concentration of most pollutants.
The maximum readings in the concentration of pollutants were 321 mcg/m3 for nitrogen dioxide, 184 mcg/m3 for ground-level ozone, and 330 mcg/m3 for sulfur dioxide. The readings were all recorded in Abu Dhabi city and are within the acceptable limits. The only exception, however, was the concentration of inhalable particulate matter, which exceeded the permissible limit by 12 times or double the maximum readings recorded in 2008, reaching a level of 1902 mcg/m3 .
Air Pollution Indicators by Region, 2009(Microgram/m3)
Maximum ReadingIndicator Objective Abu Dhabi AlAin Western Region
2008 2009 2008 2009 2008 2009
Carbon Monoxide ( CO) 30 micro gram / m3 10.5 5.4 13.3 7.9 na na
Ozone (O3) 200micro gram / m3 153.2 184.0 137.0 140.0 166.5 156.0
Nitrogen dioxide ( NO2) 400micro gram / m3 187.4 321.0 147.2 234.0 72.6 289.0
Sulfur Dioxide (SO2) 350micro gram / m3 in 1 hour 173.1 330.0 123.4 31.0 124.0 179.0
Suspended Particle Matter (PM10) 150micro gram / m3 in 24 hours 1026.2 1902.0 1032.7 1039.0 1025.7 1624.0
Source: Environment Agency - Abu Dhabi

38
Air Emissions
The total emissions of air pollutants from energy sectors include emissions from the oil and gas and water and electricity activities. Such emissions consist of sulfur dioxide, nitrogen oxides and volatile organic compounds (VOC’s). Emissions from the oil sector have been decreasing over the years from 2005-2008 those generated by the water and electricity sector have been fluctuating in the course of the aforesaid period. In 2009, oil-related emissions increased by 10% and constituted about 94% of the total emissions generated by the two energy sectors.
Total Emissions of Air Pollutants from Energy Sectors in TonsType 2005 2007 2008 2009Total Emission 410,148.40 355,630.62 287,669.01 318,744.22 SOx 263,680.07 218,328.26 157,907.47 191,252.73 NOx 65,082.06 66,908.59 65,699.29 58,230.04 VOC 81,386.27 70,393.77 64,062.25 69,261.45
Source: Abu Dhabi National Oil Company ; Abu Dhabi Water and Electricity Authority
Solid Waste
Solid waste is one of the environmental issues that have drawn the attention of many countries in today’s world. Given the severe damage to human health and the adverse impact on the environment resulting of the spread and accumulation of solid waste, the Emirate’s government pays particular attention to the proper management and recycling of waste and lives up to its image as an environmentally responsible government.
Estimates of Waste Streams by Region and Type of Source Activity in Tons, 2008Source Total Abu Dhabi Alain Western RegionGrand Total 4,891,528 2,531,211 857,251 1,503,066Total (daily Ton) 13,401 6,935 2,349 4,118
MSW 780,609 411,889 82,408 286,312Industrial 137,368 49,893 21,599 65,876Commercial 243,191 126,425 35,099 81,667D and C 3,436,231 1,885,099 671,276 879,856Green / Agriculture 294,129 57,905 46,869 189,355
Source: Waste Management Center - Abu Dhabi
Agriculture and Environment