Abu Dhabi Health Statistics 2017 - doh.gov.ae
51
Abu Dhabi Health Statistics 2017 A Healthier Abu Dhabi www.doh.gov.ae/statistics November, 2018
Transcript of Abu Dhabi Health Statistics 2017 - doh.gov.ae

Abu Dhabi Health Statistics 2017
A Healthier Abu Dhabi
www.doh.gov.ae/statistics
November, 2018

Contents
Note: The data presented have been prepared to the best of our knowledge at time of release. Although effort has been invested to creating consistency and coherence, this should be considered work in progress. Feedback on content and layout are welcome.
Overview Mission based on strong values 2 The journey so far 3 Statistical highlights 4 Public Health highlights 5 Investor highlights 6 Benchmarks 7 Population Births and Deaths 11 Causes of death 14 Injuries 16 Communicable diseases 17 Non-communicable diseases 18 Episodes and activities Episodes various analyses 24 Activities 27
Providers Providers 29 Hospital labour productivity 30 Hospitals 31 Hospital inpatient profile 32 Bed capacity 33 Centres and Clinics 35 Blood banks 36 Market structure 37 Claims Claims 40 Payers Payer members 42 Payer claims 43 Financing Enhanced plans premiums 45 Enhanced plans limits by category 47
1

Vision based on strong values
Vision A Healthier Abu Dhabi
Mission DOH aims to regulate and develop the healthcare sector and to protect the health of individuals by ensuring better access to services, continually improving quality of care, and sustainability of resources.
Values
• Commitment to society: Commitment to our society’s needs and expectations
• Creativity and innovation: Encourage creative thinking and continuous improvement of our services
• Accountability: All are responsible for his/her actions and their consequences
• Integrity: Honesty, commitment to the policies of DOH, and avoiding acts contrary to the code of conduct
• Excellence: Spreading and promoting the culture of excellence and continuously improving corporate performance
2

The journey so far…
3 Note:(a) WHO Statistical Information System/World Health Statistics 2015
In 2006 the vision for Abu Dhabi’s health system was defined to Ensure Reliable Excellence in Healthcare. This vision has guided major reforms and The Department of Health - Abu Dhabi (DOH) was created to regulate all healthcare sectors – public/private, provider/payer/professionals. DOH does not own, build or manage healthcare facilities, treat patients, pay for treatment (insurers and other payers do) or pay the private sector to partner. SEHA (Arabic for ‘health’) is the largest public provider; it manages most of public healthcare facilities in partnerships with two renowned international operators. In 2014 a consensus Health Sector Strategy developed by DOH and stakeholders was approved by the Abu Dhabi Executive Council. The Strategy identified six priorities in order to pursue DOH’s vision of a Healthier Abu Dhabi: 1. Integrated continuum of care for individuals: Full spectrum of health services. Our model of care sets out services which are appropriate, convenient and well coordinated around patients’ needs. Specialty care: Competition for patients has helped the creation of new services and increased convenience and efficiency for existing services. There is clear evidence that the Strategy to encourage investment in both public and private healthcare provision is now delivering major benefits. During 2013 there was a marked reduction of existing service gaps. Capacity has improved, for instance, since 2012 the number of hospital beds available to the population has increased by 31.0% (1’310). However, many challenges remain, for example, in 2017 the under 5 years old mortality rate (8.2 per 1’000 live births), which is significantly higher than that of the UK and Singapore (4 and 2.7 per 1’000 live births, respectively(a)). 2. Drive quality and safety as well as enhance patient experience: The Department of Health - Abu Dhabi (DOH), is implementing the next stage of reform related to significant improvement in quality of healthcare provision. DOH introduced Jawda Quality program that provides close monitoring of providers both public and private against robust clinical indicators to ensure high quality of care is provided. JAWDA is integrated to payment (“Pay-for-Quality”), first-in-kind program in the region is to provide positive reinforcement to good-quality healthcare providers, while discouraging poor performance. 3. Attract/retain/train workforce with a focus on national workforce: To account for population increase, several private providers have opened new acute and sub-acute care facilities. 21 new hospitals have opened in the last 5 years (2012-2017) adding 1’310 beds. In addition, 788 new clinics and centres have opened, with more planned, in both private and public sectors. In 2017 there were 2’846 licensed facilities offering healthcare. The challenge is to manage potential over-supply in some areas and to
ensure hospitals operate with both quality and cost comparable with international benchmarks. In the last 5 years the number of doctors per 10’000 population has increased from 21.4 to 33.2 (55.1% increase) and nurses per 10’000 population from 47.9 to 96.9 (101% increase). During 2017 the private sector was responsible for the growth in physician numbers and most of the growth in facilities. 4. Emergency preparedness and Ambulance services: Ensuring efficient pre-hospital care is crucial. In Abu Dhabi, the police provide emergency ambulance services. DOH is working with Abu Dhabi Police to develop a detailed and coordinated integrated service that responds to a wider range of health emergencies and ensures that patients are taken to the most appropriate facility. 5. Wellness and prevention—Public Health approach: Disease prevention and health promotion are cornerstones of our public health strategy to reduce burden of diseases at onset in vulnerable populations. This requires continuous collaboration with strategic stakeholders, e.g. municipalities on tobacco control, schools on healthy eating and exercise, police on road safety and employers on workplace health promotion. Screening for health risks: When Nationals were first screened for various health risk factors in a programme called ‘Weqaya’ (Arabic for ‘prevention’), it showed that 71% had at least one cardiovascular diseases (CVD) risk factor; many were unaware thus unable to seek care, and risk factors are projected to increase. Community-based services help patients manage their chronic conditions, like diabetes, on a daily basis. Some diabetes services now offer integrated consultation, diagnostic and pharmacy services to diabetic. 6. Sustainability of healthcare financial systems and ensuring value for money: A first in the region, in 2006 Abu Dhabi guaranteed access to healthcare for all expatriates by mandating health insurance and linking it to resident permits. In 2008 the old Ministry of Health’s health cards for Nationals were replaced with Thiqa health insurance, which provided access to care in both public and private sectors and the freedom to choose the provider. A Flexible and efficient financial system. DOH is focused on improving the reimbursement system to ensure adequate reimbursement levels that are based on reference prices and a revision of the tariff is expected soon. 7. Integrated Health Informatics and eHealth: to drive integration and health IT adoption, which will encourage innovation in patient care.

Statistical highlights
Notes: (a) See definition of Episode in www.doh.gov.ae/shafafiya, (b) percentages by value, (c) Reported operational beds. Zayed Military Hospital figures are excluded
Population
Providers Payers Claims
Financing Episodes
• Median age 19 for Nationals and 31 for Expatriates
• 39’392 births and 3’262 deaths
• 9’444 physicians (11% Nationals), 1’920 dentists (8% Nationals), 27’568 nurses (1% Nationals) and 8’731 allied health professionals (6% Nationals) and 3’714 pharmacists (3% Nationals).
• 2’846 licensed facilities including: – 60 hospitals (5’536 beds)(c) – 1’644 centres and clinics – 802 pharmacies
41 licensed payers provide health insurance for the entire population
3 million insurance contracts
• 26.7 million claims for treatment of Abu Dhabi Residents
• 99.2 % of claims for outpatients
• 18.2 million Episodes(a) : – 1.3% inpatient (241’313) – 38.4% nationals – 47.8% hospitals
• 115.3 million Activities(b) :
– 44.4% Consultations and procedures
– 18.7% DRGs – 12.3% Drugs
– 12.2% Services – 9.3% Dental – 3.1% Materials
(HCPCS)
4
(a)

Public health highlights
Definition: (a) Total fertility rate (per woman): Total fertility rate (TFR) in simple terms refers to total number of children born or likely to be born to a woman in her life time if she
were subject to the prevailing rate of age-specific fertility in the population. WHO
Notes: The superscripts in pages 5 and 6 refer to the specific pages of this publication where more detailed information can be found
• Population. 20% of residents are Nationals, of whom 66.6% are under 309. Expatriates are predominantly aged between 20 and 40.9 A significant share are employed in construction and accommodated in labour camps. The introduction of mandatory health insurance in 2006 provided all residents in Abu Dhabi access to high quality care.
• Birth. The UAE’s Total Fertility Rate (a) has declined from 4.4 to 1.8 per woman between 1990 and 2013 (World Health Statistics 2015 (WHO)). Declining birth rates might be attributed to urbanisation, delayed marriage, changing attitudes about family size, and increased education and work opportunities for women.
• Death. Mortality rates have also declined steadily13 over the past years. Infant mortality is now comparable with other developed countries7 and the WHO has reported a decrease in the under 5 mortality rate from 22 to 6.8 per 1’000 live births between 1990 and 2015 across the UAE. In 2017, the diseases of circulatory system caused the highest number of deaths in the Abu Dhabi Emirate. Injuries and neoplasms are the second and third highest causes of death14,15.
• Non-communicable diseases. The Emirate has high rates of chronic diseases related to lifestyle, such as obesity, diabetes, and cardiovascular diseases. Without major changes, these rates are set to increase further as the young population ages.
Cardiovascular diseases (CVD) accounted for 36.7% of all death cases in 2017. A screening programme for cardiovascular risk factors for all adult Nationals was initiated in 2008 as part of enrollment in Thiqa insurance. Individuals thought to be at high risk are being followed up. Education and awareness campaigns on risk factors; smoking, physical inactivity, unhealthy nutrition as well as screening are conducted yearly to control CVD and its risk factors.
Cancer caused 15.2% of all deaths in the Emirate in 2017. Breast (11.5%), Bronchus and lung (8.7%), and Colon (8.5%) cancers cause most of cancer deaths in Abu Dhabi.20 Regular screening exams can result in the detection and removal of precancerous growths, as well as cancers at an earlier stage, when they are most treatable. Available screening exams are: mammogram for women 40+, pap test for women 25-65 years and Colonoscopy or fecal blood exam for men & women 40-75 years. Education and awareness campaigns have increased screening rates for all nationalities. The Abu Dhabi Central Cancer Registry was established in 2012 to monitor the trends in cancer incidence rates and effectiveness of the cancer screening programs.
• Injuries. Injuries are the second leading cause of death (17.2%) and healthy life years lost in Abu Dhabi. Fatal injuries are caused primarily by road traffic (47.2%), followed by suicide (13.9%), falling objects (11.7%), poisoning (10.1%) and drowning/submersion(3.3%). Occupational injuries and childhood injuries are accounting for 24.3% and 6.2% of total injury deaths, respectively.16 Non-fatal injuries are mainly caused by falls (39.2%), stabs/cuts (19.9%), moving objects (9.8%), and traffic injuries(3.4%).16A
• Communicable diseases. Rates of childhood communicable diseases are very low17, due to immunization programs targeting children aged <5 years. Expatriates are screened for communicable diseases before acquiring residence status.
In 2016 Respiratory infections were the most common non-life threatening condition in the Emirate, accounting for 17.2% of Episodes across all healthcare facilities25. Respiratory infections mostly impact workforce productivity and quality of life.
5

Investor highlights
6 Note: (a) For Capacity Master Plan see www.haad.ae/statistics
* Capacity Master Plan (page 107), ** Planned facilities over DoH lands only.
• Population. At the end of 2017 there were 0.6m National Thiqa members, 1.3m Basic members and 1.1m Enhanced members residing in Abu Dhabi Emirate.42 10 year Compound Annual Population Growth Rate (CAGR) from 2007 to 2017 was 5.4%.
• Supply. Since the end of 2010 there has been 10.4% compound annual growth in the number of licensed clinicians and 8.9% growth in the number of licensed facilities. It is estimated that by 2025 up to 3’465 additional doctors and 11’979 nurses will be required. DoH demand projections also indicate that in 2025 demand for inpatient services may require over 1’346 additional acute hospital beds (based on current occupancy rate). However, there are currently 11 hospitals under construction that are more than 50% complete**, which should provide up to 468 acute hospital beds.
• Requirements*.
• Reimbursement. HAAD sets prices for the Basic product uniformly. Providers negotiate prices with Payers for Enhanced plans, generally as a multiple of Basic product rates. Thiqa rates are equivalent to Daman’s most generous Enhanced plan. DRGs were introduced for the Basic product in 2010, and mandated for all hospital inpatients in 2013.
• Provider market. Government-owned SEHA hospitals provided care in 50% of all inpatient Episodes and 28% of all hospital outpatients.24 These include Cleveland Clinic Abu DThe largest independent groups are VPS, NMC, Mediclinic, UEMedical and Mubadala. A number of notable international providers have come to Abu Dhabi.habi, Imperial College London Diabetes Centre, Kings College Hospital, Parkway Health and Moorfields Eye Hospital.
• Payer market. Overall, the competitive Enhanced health insurance market for 2017 had 1.1m members. Majority of this market is held by three payers – Daman (49%), ADNIC (7.1%) and National life (7%).47 Average Enhanced premium per contract in 2017 was 5’220 AED.47 Daman also administers Thiqa and Basic products. Claims per member have risen from 5.1 in 2013 to 9.5 in 2017.45 On average payers take 67 days to remit a claim.48

International Comparisons
Notes: (a) Adjusted for fair international comparisons as the population in Abu Dhabi is young and is not expected to use hospital beds as frequently as older populations.
The adjustment is made by mapping the population age structure of Abu Dhabi to that of OECD countries.
Population growth Abu Dhabi CAGR:2007-2017 others 2003-2013. Life expectancy 2015 for Abu Dhabi Nationals (SCAD), and 2013 for others (WHO). Road traffic mortality rates Abu Dhabi 2016, others 2013 (WHO). Under 5 mortality: Abu Dhabi 2017, others 2015 (WHO) and Infant rates: Abu Dhabi 2017, others 2013 (WHO). Beds rate: Abu Dhabi 2017, others 2006-2012. Physicians and Nurses: Abu Dhabi 2017 others 2007-2013 (WHO). USA nurses 2005 – 2012 (WHO).
Source: WHO Statistical Information System/World Health Statistics , Public Health Division, DOH population estimates, SCAD, and Health Statistics Analysis 7
6.5
4.2
6.8
2.7
14.5
11.6
8.6
3.7
6.2
8.2
USA
UK
UAE
Singapore
Saudi Arabia
Oman
Kuwait
Germany
Bahrain
Abu Dhabi
Under 5 mortality rate /1'000 live births
33.2
24.5
28.1
25.3
19.5
24.9
24.3
17.9
38.9
9.2
64.74
Physicians /10'000 populationAdjusted(a)
96.9
98.2
88
31.6
57.6
48.7
53.8
45.5
114.9
23.7
189.0
Nurses / 10'000 population
0.9
0.6
10.2
2.4
2.3
4.2
4.6
-0.1
5.5
5.4
USA
UK
UAE
Singapore
Saudi Arabia
Oman
Kuwait
Germany
Bahrain
Abu Dhabi
10-year population growth
5.9
3.9
7.0
2.2
13.4
9.8
8.1
3.2
5.2
6.8
Infant mortality rate / 1'000 live birth
76.9
79.4
76.4
80.0
73.2
75.0
73.7
78.7
76.2
76.0
Life expectancy at birth (years) Males
81.6
83.0
78.6
86.1
76.0
79.2
76.0
83.4
77.9
79.8
Life expectancy at birth (years)Females
10.6
2.9
10.9
3.6
27.4
25.4
18.7
4.3
8.0
11.6
Road traffic mortality/100'000 population
1.9
2.9
2.9
1.1
2.0
2.1
1.7
2.2
8.2
2.1
4.4
Beds/1'000 population
Adjusted(a)Adjusted(a)

Selected time series
Notes: Physicians figure doesn’t include dentists, Clinicians figures show un-adjusted Physicians and Nurses per 10’000 population.
Source: Public Health Division, DoH population estimates, SCAD, and Health Statistics Analysis 7A
22.2
20.2
21.6 20.9 21.0
20.5
19.2
2011 2012 2013 2014 2015 2016 2017
Injury mortality/100'000 population
4.0 3.9 4.3
5.0 5.2 4.8 5.0
2011 2012 2013 2014 2015 2016 2017
Neonatal Mortality rate /1'000 births
6.4 6.3 6.3
7.7 7.2 7.0 6.8
2011 2012 2013 2014 2015 2016 2017
Infant Mortality rate /1'000 live births
8.7 8.2 8.0 9.7 9.1 8.8 8.2
2011 2012 2013 2014 2015 2016 2017
Under-five mortality rate /1'000 live births
20.4 21.4 25.1
27.3 26.9 29.6
33.2
2011 2012 2013 2014 2015 2016 2017
Physicians/10'000 population
43.6 47.9 52.1 60.2
69.1 82.0
96.9
2011 2012 2013 2014 2015 2016 2017
Nurses/10'000 population
2.5 2.7 2.3
3.5 3.7 3.9 4.4
1.5 1.7 1.4 1.5 1.6 1.7 1.9
2011 2012 2013 2014 2015 2016 2017
Hospital beds/1'000 population Adjusted
74.9 75.2 76.0
77.0 78.7
79.8
2010 2012 2015
Life Expectancy at birth Male Female

Population
Providers Payers Claims
Financing Episodes
8

Births and Deaths
Note: (a) Rates: crude birth and death rates calculation are based on DOH population estimates (per 1’000); Neonatal, Infant, and Child mortality rates are calculated per 1’000 live births, Still births rate per 1’000 total births.
(b) NA: Information not available. Source: Birth and Death notifications; Health Statistics Analysis 11
Total By Region Rates (a) By Nationality and Gender
Number % Number National Expatriate NA (b)
20
12
20
13
20
14
20
15
20
16
20
17
Nat
ion
al
Mal
es
Ab
u D
hab
i
Al A
in
Al D
haf
ra
NA
(b)
Ab
road
Tota
l
Ab
u D
hab
i
Al A
in
Al D
haf
ra
Mal
e
Fem
ale
NA
(b)
Mal
e
Fem
ale
NA
(b)
Mal
e
Fem
ale
NA
(b)
Live Births 34'358 35'945 38'035 38'818 39'731 39'392 43% 51% 25'337 12'656 1'246 1 152 13.8 14.4 16.7 3.9 8'680 8'282 11'390 10'940 58 42
Deaths 2'923 3'015 3'153 3'163 3'283 3'262 36% 69% 1'999 1'064 122 77 1.1 1.1 1.4 0.4 713 445 4 1520 578 2
Still births 104 149 159 190 167 164 35% 44% 114 48 2 0 4.1 4.5 3.8 1.6 31 21 5 25 38 3 16 17 8
Neonatal mortality 135 155 191 201 191 195 52% 58% 122 68 2 3 5.0 4.8 5.4 1.6 62 37 2 52 42
Infant mortality 217 227 293 280 277 267 49% 57% 165 94 3 5 6.8 6.5 7.4 2.4 77 53 2 74 61
Child mortality (1-4) 64 59 76 74 73 55 44% 58% 31 21 1 2 1.4 1.2 1.7 0.8 12 11 1 20 11
Death by Age Group %
0-6 days 94 105 143 158 150 142 51% 59% 90 47 2 3 4% 5% 4% 2% 45 25 2 39 31
7-27 days 41 50 48 43 41 53 55% 57% 32 21 2% 2% 2% 0% 17 12 13 11
28-364 days 82 72 102 79 86 72 43% 51% 43 26 1 2 2% 2% 2% 1% 15 16 22 19
1-4 64 59 76 74 73 55 44% 58% 31 21 1 2 2% 2% 2% 1% 12 11 1 20 11
5-9 33 19 33 32 35 27 44% 33% 14 11 2 1% 1% 1% 0% 5 7 4 11
10-14 26 36 23 26 30 27 44% 56% 17 9 1 1% 1% 1% 0% 4 8 11 4
15-19 51 46 47 55 51 56 61% 88% 30 19 2 5 2% 2% 2% 2% 29 5 20 2
20-24 126 109 126 124 123 133 30% 83% 89 27 11 6 4% 4% 3% 9% 30 10 80 13
25-29 195 201 201 159 186 163 23% 80% 110 37 14 2 5% 6% 3% 11% 29 8 102 24
30-34 175 185 204 201 180 166 24% 83% 108 43 11 4 5% 5% 4% 9% 32 8 105 21
35-39 154 180 178 172 192 192 18% 80% 127 51 10 4 6% 6% 5% 8% 25 10 127 29 1
40-44 194 183 177 212 180 194 22% 76% 128 51 9 6 6% 6% 5% 7% 26 16 122 30
45-49 217 220 197 220 198 196 17% 77% 132 54 6 4 6% 7% 5% 5% 15 18 135 28
50-54 235 231 200 214 225 256 19% 77% 147 83 20 6 8% 7% 8% 16% 30 18 168 40
55-59 240 259 237 214 262 253 22% 75% 157 80 7 9 8% 8% 8% 6% 31 25 158 39
60-64 192 208 205 209 242 227 29% 70% 132 87 6 2 7% 7% 8% 5% 37 28 123 39
65-69 168 197 218 214 228 177 33% 69% 109 62 1 5 5% 5% 6% 1% 44 15 78 40
70-74 190 193 205 200 219 239 45% 62% 134 93 4 8 7% 7% 9% 3% 63 44 1 84 47
75-79 137 140 198 188 199 197 64% 53% 123 67 4 3 6% 6% 6% 3% 74 53 31 39
80-84 131 136 146 150 162 149 60% 59% 87 55 5 2 5% 4% 5% 4% 58 31 30 30
85+ 178 186 189 219 221 288 59% 49% 159 120 8 1 9% 8% 11% 7% 92 77 48 70 1
(b)
(b)

Births time series
Note: Rates based on DOH population estimates; DOH and SCAD are collaborating to align with official SCAD data.
2012-2017 Presented totals include cases where nationality is not available. Rates are per 1’000 population.
Crude birth rates
Source: MOH statistics, Previous[Preventive Medicine Department annual reports], Public Health Division; Health Statistics Analysis 12
0
10
20
30
40
50
1985
1986
1987
1988
198
9
1990
1991
1992
1993
1994
1995
199
6
1997
1998
1999
2000
2001
2002
2003
2004
2005
200
6
2007
2008
2009
2010
2011
2012
201
3
2014
2015
2016
2017
National
Expatriate
Aggregate
Year Total National Rate Expatriate Rate % Nationals
1985 18'874 6'376 46.9 12'498 29.1 34%
1986 19'700 6'328 45.2 13'372 30.3 32%
1987 20'667 6'400 43.8 14'267 30.7 31%
1988 22'113 6'668 43.3 15'445 31.6 30%
1989 21'686 6'647 41.0 15'039 29.2 31%
1990 21'750 6'652 39.1 15'098 27.9 31%
1991 20'246 6'729 37.8 13'517 23.7 33%
1992 20'456 7'202 38.3 13'254 22.1 35%
1993 20'410 7'928 40.4 12'482 19.8 39%
1994 21'505 8'060 39.1 13'445 20.2 37%
1995 20'425 8'261 37.1 12'164 16.9 40%
1996 20'095 8'697 38.1 11'398 15.4 43%
1997 20'017 8'917 37.2 11'100 14.3 45%
1998 20'348 8'435 33.5 11'913 14.5 41%
1999 21'303 8'948 33.9 12'355 14.3 42%
2000 23'525 9'783 35.2 13'742 15.1 42%
2001 23'974 10'349 34.9 13'625 15.6 43%
2002 24'317 10'714 34.5 13'603 15.1 44%
2003 24'990 11'279 34.6 13'711 14.7 45%
2004 26'215 12'021 35.2 14'194 14.7 46%
2005 27'112 12'254 35.3 14'858 15.8 45%
2006 25'738 12'165 33.8 13'573 10.9 47%
2007 27'002 12'857 34.7 14'145 10.7 48%
2008 28'456 13'040 32.4 15'416 8.9 46%
2009 29'044 13'479 33.1 15'565 10.3 46%
2010 29'502 13'635 31.4 15'867 8.4 46%
2011 32'034 14'636 33.7 17'398 8.7 46%
2012 34'358 15'170 35.0 19'131 9.1 44%
2013 35'945 15'576 31.4 20'316 9.1 43%
2014 38'035 16'023 31.6 21'958 9.8 42%
2015 38'818 16'405 31.3 22'369 8.5 42%
2016 39'731 16'732 30.3 22'911 9.2 42%
2017 39'392 16'962 29.8 22'330 9.8 43%

Deaths time series
Crude death rates
Notes: Rates based on DOH population estimates; DOH and SCAD are collaborating to align with official SCAD data.
2008-2017 Presented totals include cases where nationality is not available. Rates are per 1’000 population.
13 Source: MOH statistics, Previous[Preventive Medicine Department annual reports], Public Health Division; Health Statistics Analysis
0.0
1.0
2.0
3.0
4.0
19
85
19
86
19
87
19
88
19
89
19
90
19
91
19
92
19
93
19
94
19
95
19
96
19
97
19
98
19
99
20
00
20
01
20
02
20
03
20
04
20
05
20
06
20
07
20
08
20
09
20
10
20
11
20
12
20
13
20
14
20
15
20
16
20
17
0
10
20
30
40
50
1985
1986
1987
1988
1989
1990
1991
1992
1993
1994
1995
1996
1997
1998
1999
2000
2001
2002
2003
2004
2005
2006
2007
2008
2009
2010
2011
2012
2013
2014
2015
2016
National
Expatriate
Aggregate
Year Total National Rate Expatriate Rate % Nationals
1985 1'275 520 3.8 755 1.8 41%
1986 1'356 492 3.5 864 2.0 36%
1987 1'444 528 3.6 916 2.0 37%
1988 1'480 551 3.6 929 1.9 37%
1989 1'561 571 3.5 990 1.9 37%
1990 1'628 572 3.4 1'056 1.9 35%
1991 1'774 652 3.7 1'122 2.0 37%
1992 1'829 690 3.7 1'139 1.9 38%
1993 1'946 689 3.5 1'257 2.0 35%
1994 1'963 614 3.0 1'349 2.0 31%
1995 2'166 722 3.2 1'444 2.0 33%
1996 2'050 723 3.2 1'327 1.8 35%
1997 2'105 708 3.0 1'397 1.8 34%
1998 2'098 758 3.0 1'340 1.6 36%
1999 2'206 792 3.0 1'414 1.6 36%
2000 2'250 822 3.0 1'428 1.6 37%
2001 2'574 928 3.1 1'646 1.9 36%
2002 2'612 849 2.7 1'763 2.0 33%
2003 2'493 913 2.8 1'580 1.7 37%
2004 2'489 887 2.6 1'602 1.7 36%
2005 2'443 820 2.4 1'623 1.7 34%
2006 2'380 821 2.3 1'559 1.2 34%
2007 2'750 990 2.7 1'760 1.3 36%
2008 2'949 981 2.4 1'947 1.1 33%
2009 2'988 983 2.4 1'990 1.3 33%
2010 2'879 967 2.2 1'888 1.0 34%
2011 2'902 940 2.2 1'958 1.0 32%
2012 2'923 976 2.3 1'945 0.9 33%
2013 3'015 932 1.9 2'083 0.9 31%
2014 3'153 1'065 2.1 2'080 0.9 34%
2015 3'163 1'116 2.1 2'046 0.8 35%
2016 3'283 1'120 2.0 2'161 0.9 34%
2017 3'262 1'162 2.0 2'098 0.9 36%

Causes of death
Notes: Causes of death classified according to WHO ICD10 CM Neoplasms are classified into cancers and other (non-cancerous) growths.
Source: Death notifications; Health Statistics Analysis 14
Diseases of the circulatory
system37%
Injuries17%
Neoplasms16%
Congenital malformations, deformations
and chromosomal abnormalities
2%
Endocrine, nutritional and
metabolic diseases
2%
Other 26%
Causes 2017 2016 2015 2014 2013 2012 2011 2010 2009 2008 2007 2006 2005 2004 2003 2002 2001
3'262 3'283 3'163 3'153 3'015 2'923 2'902 2'879 2'988 2'949 2'742 2'450 2'446 2'489 2'492 2'617 2'574
1'198 1'219 1'105 1'107 1'107 1'135 1'089 762 707 697 506 378 424 413 624 778 622
External causes of morbidity and mortality 473 554 542 467 485 451 481 202 632 464
Injury, poisoning and certain other
consequences of external causes89 99 132 120 105 81 100 385 57 85
Cancer 497 421 427 406 389 406 403 448 390 350
Other (benign, in situ, neoplasms of uncertain
or unknown behaviour)27 79 73 81 79 68 58 13 7 10
78 89 97 117 62 85 72 144 199 120 177 131 156 146 152 199 190
63 70 83 78 73 63 98 194 210 79 201 130 133 126 103 73 65
837 752 704 777 715 634 601 731 786 1'144 867 993 874 943 763 664 845
Total
Neoplasms
Injuries
Diseases of the circulatory system
Endocrine, nutritional and metabolic diseases
Congenital malformations, deformations and chromosomal
abnormalities
Other
600
370 315 294 298 276 289 252
621 503 565 563 574 614

Causes of death
Note: (a) NA: Nationality information not available, Codes. Causes of death classified according to WHO ICD 10 CM.
Source: Death notifications; Health Statistics Analysis 15
National Expatriate NA(a)
By Gender By Age Group By Gender By Age Group By Gender By Age Group
Cases
Mal
e
Fem
ale
NA
(a)
< 1 1-14 15-29 30-44 45-59 60+
Mal
e
Fem
ale
NA
(a)
< 1 1-14 15-29 30-44 45-59 60+
Mal
e
NA
(a)
30-45 60+
Codes Total 3'262 713 445 4 132 48 111 117 137 617 1'520 578 135 61 241 434 568 659 2 1 1
I00-I99 Diseases of the circulatory system 1'198 213 134 2 8 11 17 33 46 234 671 177 10 10 39 183 309 297 1 1
S00-T98
V01-Y98Injuries 562 137 28 1 9 76 51 14 14 348 48 1 11 159 149 61 15 1 1
C00-D48 Neoplasms 524 98 98 6 8 20 41 121 181 147 9 13 41 117 148
J00-J99 Diseases of the respiratory system 173 47 37 3 3 2 7 69 64 25 3 1 6 12 18 49
P00-P96 Certain conditions originating in the perinatal period 143 45 21 1 67 46 30 75 1
A00-B99 Certain infectious and parasitic diseases 112 32 29 1 2 7 51 32 19 1 2 4 7 13 24
R00-R99Symptoms, signs and abnormal clinical and laboratory
findings, not elsewhere classified103 27 21 3 5 1 1 3 35 30 25 2 4 4 5 4 36
K00-K93 Diseases of the digestive system 90 28 14 1 1 5 7 28 33 15 1 3 10 15 19
Q00-Q99Congenital malformations, deformations and
chromosomal abnormalities78 24 16 1 37 4 19 18 27 7 2 1
E00-E90 Endocrine, nutritional and metabolic diseases 63 16 7 2 2 1 3 5 10 25 15 1 2 2 6 10 19
N00-N99 Diseases of the genitourinary system 61 20 14 3 31 17 10 1 1 4 21
G00-G99 Diseases of the nervous system 45 7 4 5 1 5 13 21 4 6 1 6 6 11
D50-D89Diseases of the blood and blood-forming organs and
certain disorders involving the immune mechanism18 4 2 1 1 4 8 4 6 3 1 2
M00-M99Diseases of the musculoskeletal system and connective
tissue10 2 1 1 2 2 5 2 1 4
Z00-Z99Factors influencing health status and contact with health
services8 3 1 2 5 3 1 1
F00-F99 Mental and behavioural disorders 4 1 2 1 2 1 1
L00-L99 Diseases of the skin and subcutaneous tissue 3 2 2 1 1
O00-O99 Pregnancy, childbirth and the puerperium 1 1 1
NA NA 66 12 12 10 2 3 2 7 25 17 11 1 4 6 7 13

Injury deaths
Source: Active Surveillance, DOH Death notification data complemented by investigation into the causes of injury using medical records and police reports - Public Health Division; Health Statistics Analysis 16
Definition: Fatal injuries: Mortality cases with underlying cause of death codes (S00-T98) in ICD 10 CM Chapter 19 and external cause codes (V01-Y98) excluding complications of medical and surgical care.
Notes: (a) Scales differ across charts, charts data: For unintentional injuries only. Injury deaths include fatal injuries occurring outside of AD Emirate, and RTI deaths occurring after more than 30 days after the injury.
By mechanism
Rates per 100'000 (a)
Nationals
Expatriates
Total
Mechanism/Intent/year 2017 2016 2015 2014 2013 2012 2011 2010 2009 2008
Total 547 624 661 575 591 514 537 551 680 623
Unintentional injuries 419 523 502 500 505 422 456 486 591 529
Road Traffic (RTI) 258 353 312 327 365 303 342 379 456 430
Poisoning/Toxic substance 55 61 75 42 24 16 6 10 12 3
Fall/Hit by falling object 64 58 48 65 66 55 64 66 55 56
Drowning/Submersion 18 24 19 27 20 29 12 17 23 14
Electricity 14 16 14 11 8 11 14 6 20 11
Fire/Flame, hot substance 10 11 34 28 22 8 18 8 25 15
Intentional injuries 91 70 144 68 68 74 55 51 68 77
Suicide 76 54 50 49 49 62 48 41 52 66
Homicide 15 16 15 19 19 12 7 10 16 11Other/Unknown 37 31 94 7 18 18 26 14 21 17
Road Traffic Deaths, N=258 Occupational Injury Deaths, N=133 Childhood Injury Deaths (0-17 yrs), N=34
6
1
2
4
7
10
60
168
(2.3%)
(0.4%)
(0.8%)
(1.6%)
(2.7%)
(3.9%)
(23.3%)
(65.1%)
Other/Unknown
Bus (>10 passengers)
Non-motorised vehicle (eg.cart,bicycle)
Motorcycle
Pickup/van/minibus (<10 passengers)
Truck
Pedestrian
Car
Road Traffic (RTI)47.2%
Suicide13.9%
Fall/Hit by falling object11.7%
Poisoning/Toxic substance10.1%
Drowning/Submersion3.3%
Homicide2.7%
Electricity2.6%
Fire/Flame, hot substance
1.8%
Other/Unknown6.8%
0.0
0.5
1.0
1.5
20
09
20
10
20
11
20
12
20
13
20
14
20
15
20
16
20
17
Homicide
0.0
1.0
2.0
3.0
4.0
5.0
6.0
7.0
8.0 Poisoning/toxic substance
0.0
0.5
1.0
1.5Electricity
0.0
0.5
1.0
1.5
2.0
2.5Drowning/submersion
0.0
2.0
4.0
20
09
20
10
20
11
20
12
20
13
20
14
20
15
20
16
20
17
Suicide
0.0
1.0
2.0
3.0
4.0Fall/Hit by falling object
0
10
20
30
40 Road Traffic (RTI)
0.0
1.0
2.0Fire/flame, hot substance
0.0
0.5
1.0
1.5
20
09
20
10
20
11
20
12
20
13
20
14
20
15
20
16
20
17
Other/Unknown
19
2
2
12
14
36
48
(14.3%)
(1.5%)
(1.5%)
(9.0%)
(10.5%)
(27.1%)
(36.1%)
Other/Unknown
Drowning/submersion
Hit by moving object
Electricity
Fire/flame, hot substance
Road Traffic (RTI)
Fall/Hit by falling object
1
1
1
1
3
6
21
(2.9%)
(2.9%)
(2.9%)
(2.9%)
(8.8%)
(17.6%)
(61.8%)
Environmental inc. heat or cold exposure
Assault
Poisoning/toxic substance: specify
Anaphylactic shock
Choking, hanging, suffocation
Drowning/Submersion
Road traffic injury
Nationals
Expatriates
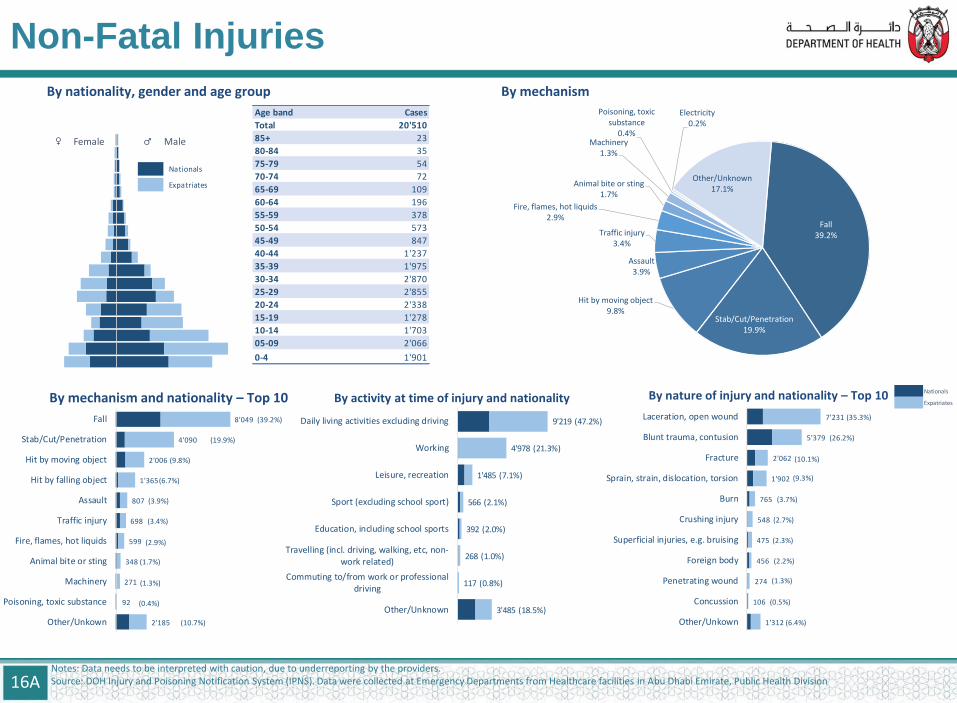
By nationality, gender and age group
By mechanism and nationality – Top 10 By activity at time of injury and nationality By nature of injury and nationality – Top 10
Notes: Data needs to be interpreted with caution, due to underreporting by the providers. Source: DOH Injury and Poisoning Notification System (IPNS). Data were collected at Emergency Departments from Healthcare facilities in Abu Dhabi Emirate, Public Health Division
By mechanism
Age group Cases
Total 36'767
85+ 37
80-84 45
Nationals 75-79 77
Expatriates 70-74 127
65-69 178
60-64 354
55-59 608
50-54 1'020
45-49 1'366
40-44 2'122
35-39 3'189
30-34 4'914
25-29 5'797
20-24 4'173
15-19 2'401
10-14 3'092
05-09 3'569
0-4 3'698
♂ Male ♀ Female
16A
Age band Cases
Total 20'510
85+ 23
80-84 35
75-79 54
70-74 72
65-69 109
60-64 196
55-59 378
50-54 573
45-49 847
40-44 1'237
35-39 1'975
30-34 2'870
25-29 2'855
20-24 2'338
15-19 1'278
10-14 1'703
05-09 2'066
0-4 1'901
♂ Male♀ Female
Nationals
Expatriates
Non-Fatal Injuries
Fall39.2%
Stab/Cut/Penetration19.9%
Hit by moving object9.8%
Assault3.9%
Traffic injury3.4%
Fire, flames, hot liquids2.9%
Animal bite or sting1.7%
Machinery1.3%
Poisoning, toxic substance
0.4%
Electricity0.2%
Other/Unknown17.1%
2'185
92
271
348
599
698
807
1'365
2'006
4'090
8'049
(10.7%)
(0.4%)
(1.3%)
(1.7%)
(2.9%)
(3.4%)
(3.9%)
(6.7%)
(9.8%)
(19.9%)
(39.2%)
Other/Unkown
Poisoning, toxic substance
Machinery
Animal bite or sting
Fire, flames, hot liquids
Traffic injury
Assault
Hit by falling object
Hit by moving object
Stab/Cut/Penetration
Fall
1'312
106
274
456
475
548
765
1'902
2'062
5'379
7'231
(6.4%)
(0.5%)
(1.3%)
(2.2%)
(2.3%)
(2.7%)
(3.7%)
(9.3%)
(10.1%)
(26.2%)
(35.3%)
Other/Unkown
Concussion
Penetrating wound
Foreign body
Superficial injuries, e.g. bruising
Crushing injury
Burn
Sprain, strain, dislocation, torsion
Fracture
Blunt trauma, contusion
Laceration, open wound
3'485 (18.5%)
117 (0.8%)
268 (1.0%)
392 (2.0%)
566 (2.1%)
1'485 (7.1%)
4'978 (21.3%)
9'219 (47.2%)
Other/Unknown
Commuting to/from work or professionaldriving
Travelling (incl. driving, walking, etc, non-work related)
Education, including school sports
Sport (excluding school sport)
Leisure, recreation
Working
Daily living activities excluding driving

Communicable diseases
Notes: Preventable: Diseases preventable by vaccination; Screened: Adult expatriates are screened on application or renewal of residence visa.
Source: DOH infectious diseases notification data - Public Health Division, Health Statistics Analysis 17
Total National Expatriate NA
Pre
ven
tab
le
Scre
en
ed
Disease 2011 2012 2013 2014 2015 2016 2017 0-4
5-9
10
-14
15
-19
20
-24
25
-29
30
-34
35
-39
40
-44
45
-49
50
-54
55
-59
60
-64
65
+
0-4
5-9
10
-14
15
-19
20
-24
25
-29
30
-34
35
-39
40
-44
45
-49
50
-54
55
-59
60
-64
65
+
25
-29
Seasonal Influenza 282 297 410 1'499 2'847 6'774 15'994 2'150 1'000 336 166 180 232 262 220 121 63 50 56 43 111 4'056 2'406 625 184 373 714 878 627 416 297 165 139 58 66
n Chickenpox 11'768 9'872 4'581 4'660 4'614 4'819 5'254 153 108 40 20 13 17 11 11 3 4 2 2 275 244 129 101 965 1'265 877 538 252 131 62 23 6 2
Scabies 585 758 1'001 1'475 1'579 1'907 2'111 20 18 18 22 17 24 14 10 9 5 8 2 9 72 61 29 52 292 444 415 240 141 95 49 34 5 6
Malaria 2'731 2'719 2'203 2'415 1'940 1'848 1'907 1 1 1 1 1 1 15 12 7 73 432 443 337 199 130 114 65 43 24 7
Other Food Poisoning 667 1'147 1'237 360 1'233 1'392 1'526 261 79 23 18 18 31 18 13 5 3 7 4 4 6 474 132 42 10 57 88 76 57 36 29 14 8 5 8
Other STIs 363 136 132 279 572 728 1'267 7 73 131 156 90 66 33 10 2 1 1 61 193 154 129 64 56 19 14 3 3 1
n n Viral Hepatitis B 673 665 699 818 1'121 1'139 1'085 1 5 10 32 58 65 44 17 24 13 8 20 4 69 136 164 136 100 75 42 27 14 21
Viral Hepatitis C 580 528 546 570 776 851 829 1 6 15 11 18 11 16 18 23 12 8 22 3 2 34 69 115 111 100 57 78 53 29 17
n n Pulmonary Tuberculosis 380 350 311 338 339 407 523 1 2 1 4 1 1 3 1 4 6 2 1 5 75 94 86 55 46 57 30 22 14 11 1
Scarlet Fever 239 201 198 220 319 271 285 84 45 2 1 1 66 78 7 1
Extra Pulmonary Tuberculosis 182 192 169 205 231 259 275 3 1 1 2 1 2 40 63 67 44 25 12 6 4 3 1
n Syphilis 99 88 162 203 271 317 256 1 14 6 11 9 9 5 5 1 3 8 1 12 27 41 45 21 18 8 6 3 2
n Mumps 194 198 174 182 240 296 217 27 29 7 1 1 1 3 1 1 4 1 1 27 35 8 7 15 15 15 9 7 2
n Viral Hepatitis A 138 279 271 224 173 318 189 8 29 14 9 2 1 2 1 13 35 14 9 14 13 7 6 3 7 1 1
Typhoid Fever 394 443 248 222 275 251 188 2 3 4 1 1 2 2 1 21 12 2 5 23 34 29 15 15 5 6 4 1
Gonorrhoea 42 44 92 64 110 154 183 17 30 27 11 14 1 1 1 1 3 9 25 19 16 5 1 1 1
Giardia Lambia 82 103 94 100 139 184 128 7 2 1 2 1 4 1 3 2 3 8 7 3 2 16 18 11 18 7 4 5 3
Brucellosis 75 135 99 49 75 118 91 6 3 5 3 5 3 3 1 1 2 4 7 2 2 1 2 2 8 7 11 7 2 1 2 1
Viral Meningitis 37 52 59 56 79 133 64 14 5 1 1 1 1 1 8 3 3 1 6 8 4 3 1 1 1 1
n Whooping Cough 39 53 38 15 31 51 50 19 1 2 1 1 1 13 1 2 1 3 1 2 1 1
n Measles 48 56 122 117 117 63 38 4 2 1 1 17 3 2 4 1 1 2
n Rubella 42 18 15 10 134 73 23 2 1 5 1 1 7 4 1 1
Other Viral Hepatitis 1 14 5 7 4 15 21 1 2 6 6 2 1 1 1 1
Corona Virus 0 0 0 0 28 14 12 1 2 2 3 1 1 1 1
Acute Encephalitis 10 26 11 11 7 19 11 1 1 1 1 1 3 1 1 1
Acute Flaccid Paralysis 14 21 10 7 6 8 9 1 2 1 3 2
n Tetanus 3 2 2 1 5 1 1
Other 422 875 1'268 1'874 1'287 1'856 2'233 247 66 40 36 34 48 52 26 21 15 4 11 15 32 407 91 48 35 84 216 197 157 112 77 64 42 26 30

Cancer incidence 2016
Source: 2016 Cancer incidence data, Cancer Prevention and Control Section, Public Health Division, Health Statistics Analysis
Note: for 2016 population, visit: www.doh.gov.ae/statistics2015 18
By nationality
Cancer incidence Rate per 100'000 population - 2016
2013 2014 2015 2016 Male Female Total Male Female
Total 1'589 1'768 1'713 1'816 882 934 59.8 41.3 103.6
Nationals 376 427 461 487 208 279 88.3 77.2 98.9
Expatriates 1'213 1'329 1'209 1'293 646 647 52.0 34.6 104.5
By gender NA 12 43 36 28 8
National26.8%
Expatriate71.2%
NA2.0%
Male48.6%Female
51.4%

Source: 2016 Cancer incidence data, Cancer Prevention and Control Section, Public Health Division, Health Statistics Analysis
2016 Abu Dhabi Health Statistic: www.doh.gov.ae/statistics2015
Cancer incidence 2016
2
12
14
14
27
34
39
51
66
73
114
115
235
253
0%
50%
19%
47%
56%
31%
21%
26%
33%
36%
28%
37%
Breast
Other and ill Defined- Sites
Skin
Bones, Joints andArticular Cartilage of Limbs
Lip, Oral Cavity and Pharynx
Unknown Primary Site
Thyroid and OtherEndocrine Glands
Mesothelial and soft tissue
Respiratory Systemand Intrathoracic Organs
Eye, Brain and Other Partsof Central Nervous System
Urinary Tract
Male Genital Organs
Digestive Organs
Lymphoid, haematopoieticand related tissue
National
Expatriate
NA
7
12
12
25
25
26
40
44
54
112
116
127
153
172
25%
44%
0%
15%
45%
34%
43%
54%
41%
11%
8%
44%
Other and ill Defined- Sites
Bones, Joints andArticular Cartilage of Limbs
Lip, Oral Cavity and Pharynx
Unknown Primary Site
Skin
Respiratory Systemand Intrathoracic Organs
Urinary Tract
Mesothelial and soft tissue
Eye, Brain and Other Partsof Central Nervous System
Thyroid and OtherEndocrine Glands
Digestive Organs
Female GenitalOrgans
Breast
Lymphoid, haematopoieticand related tissue
20
26
39
39
63
92
95
115
127
128
151
154
155
351
426
35%
46%
0%
21%
43%
20%
33%
36%
11%
33%
54%
36%
8%
32%
40%
Other and ill Defined- Sites
Bones, Joints and ArticularCartilage of Limbs
Skin
Lip, Oral Cavity and Pharynx
Unknown Primary Site
Respiratory Systemand Intrathoracic Organs
Mesothelial and soft tissue
Male Genital Organs
Female Genital Organs
Eye, Brain and Other Partsof Central Nervous System
Thyroid and OtherEndocrine Glands
Urinary Tract
Breast
Digestive Organs
Lymphoid, haematopoieticand related tissue
All Male Female
19
100
14
14
15
16
16
16
20
23
29
42
45
60
62
163
299
Other Sites
Skin
Hodgkin'S Lymphoma
Kidney And Renal Pelvis
Pancreas
Stomach
Bronchus And Lung
Liver
Ovary
Non-Hodgkin'S Lymphoma
Leukemia
Cervix Uteri
Uterus
Colorectum
Thyroid Gland
Breast
180
20
23
23
28
29
35
37
39
43
51
51
63
66
85
109
Other Sites
Multiple Myeloma
Testis
Pancreas
Liver
Brain And Other Cns
Bladder
Stomach
Skin
Kidney And Renal Pelvis
Non-Hodgkin'S Lymphoma
Thyroid Gland
Bronchus And Lung
Leukemia
Prostate Gland
Colorectum
379
40
41
45
48
53
53
58
60
79
80
85
108
171
214
302
Other Sites
Bladder
Brain And Other Cns
Cervix Uteri
Liver
Skin
Stomach
Kidney And Renal Pelvis
Uterus
Bronchus And Lung
Non-Hodgkin'S Lymphoma
Prostate Gland
Leukemia
Colorectum
Thyroid Gland
Breast

Cancer death cases 2017
Note: Data need to be interpreted with caution, due to undercounting and ambiguity about the overall population (denominator)
Source: Death Notifications, Health Statistics Analysis
By site
20
Cancer death cases Rate per 100'000 population
Total Male Female Total Male Female
Total 497 269 228 17.5 13.5 26.7
National 187 95 92 32.9 34.1 31.7
Expatriate 310 174 136 13.6 10.2 24.1
National38%Expatriate
62%
By nationality
Male54%
Female46%
By gender
37.8%
2.8%
3.0%
3.4%
4.6%
4.8%
7.0%
7.8%
8.5%
8.7%
11.5%
Other
Prostate
Ovary
Myeloid Leukaemia
Brain
Stomach
Pancreas
Liver And Intrahepatic Bile Ducts
Colon
Bronchus And Lung
Breast
All
29.7%
2.2%
2.6%
3.3%
5.2%
5.9%
5.9%
9.7%
9.7%
10.4%
10.8%
Other
Bladder
Lymphoid Leukaemia
Myeloid Leukaemia
Prostate
Brain
Stomach
Pancreas
Liver And Intrahepatic Bile Ducts
Bronchus And Lung
Colon
Male
29.8%
3.1%
3.5%
3.5%
3.9%
3.9%
5.7%
5.7%
6.6%
6.6%
24.6%
Other
Uterus, Part Unspecified
Myeloid Leukaemia
Stomach
Pancreas
Cervix Uteri
Liver And Intrahepatic Bile Ducts
Colon
Bronchus And Lung
Ovary
Breast
Female
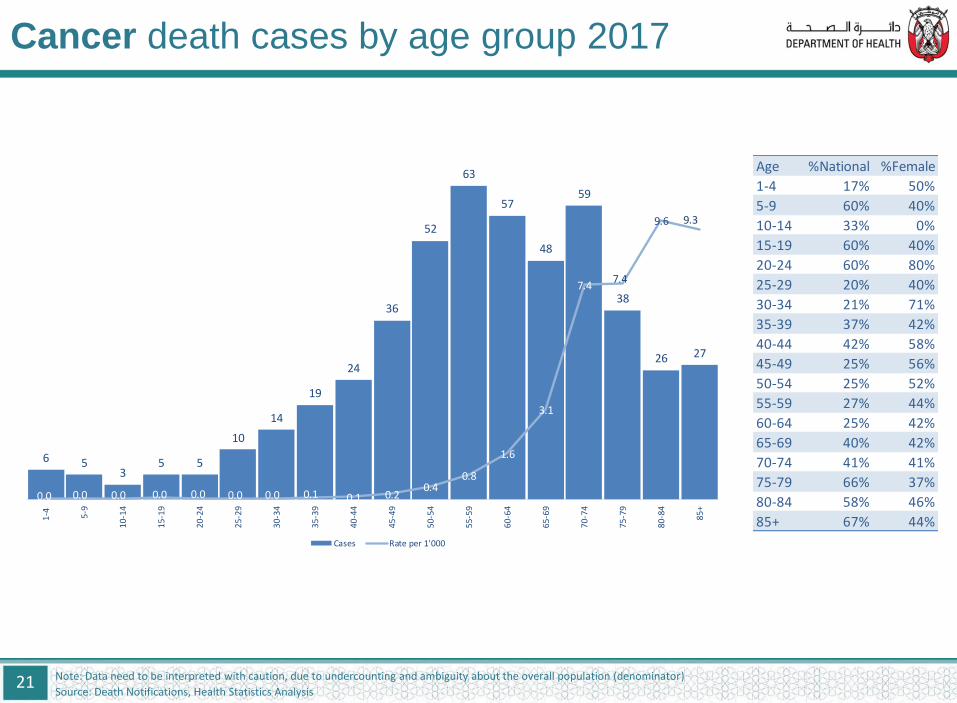
Cancer death cases by age group 2017
Note: Data need to be interpreted with caution, due to undercounting and ambiguity about the overall population (denominator)
Source: Death Notifications, Health Statistics Analysis 21
Age %National %Female
1-4 17% 50%
5-9 60% 40%
10-14 33% 0%
15-19 60% 40%
20-24 60% 80%
25-29 20% 40%
30-34 21% 71%
35-39 37% 42%
40-44 42% 58%
45-49 25% 56%
50-54 25% 52%
55-59 27% 44%
60-64 25% 42%
65-69 40% 42%
70-74 41% 41%
75-79 66% 37%
80-84 58% 46%
85+ 67% 44%
6 53
5 5
10
14
19
24
36
52
63
57
48
59
38
26 27
0.0 0.0 0.0 0.0 0.0 0.0 0.0 0.1 0.1 0.20.4
0.8
1.6
3.1
7.47.4
9.6 9.3
0.0
2.0
4.0
6.0
8.0
10.0
12.0
0
10
20
30
40
50
60
70
1-4 5-9
10
-14
15
-19
20
-24
25
-29
30
-34
35
-39
40
-44
45
-49
50
-54
55
-59
60
-64
65
-69
70
-74
75
-79
80
-84
85+
Cases Rate per 1'000

Prevalence of diabetes mellitus by age group 2016
Source: KEH-Cube 2016 Strategy Analysis
Definition: History of A1C >= 6.5% or Glucose >= 11.1 mmol/l or diabetes medication
Notes: (a) - Prevalence needs to be interpreted with caution as there was significant change in the 2016 population (the denominator) (b) - Standardized against WHO global age structure 2011
% Diabetes population by nationality, gender (Age: 20 - 79)
22
National Expatriate Total
Diabetes
Total 2016
Population
Total %
Diabetes
Age group Diabetes
2016
Population % Diabetes Diabetes
2016
Population % Diabetes
20-24 1'263 49'621 2.5% 2'036 243'067 0.8% 3'299 292'688 1.1%
25-29 2'245 47'568 4.7% 6'950 447'555 1.6% 9'195 495'123 1.9%
30-34 3'505 45'589 7.7% 14'255 468'048 3.0% 17'761 513'637 3.5%
35-39 4'462 38'756 11.5% 19'778 343'919 5.8% 24'240 382'675 6.3%
40-44 4'583 26'629 17.2% 24'554 244'102 10.1% 29'137 270'730 10.8%
45-49 4'484 18'103 24.8% 28'037 175'023 16.0% 32'521 193'126 16.8%
50-54 5'185 13'733 37.8% 25'333 106'650 23.8% 30'518 120'383 25.4%
National 55-59 5'663 10'536 53.8% 22'208 68'248 32.5% 27'871 78'784 35.4%
Expatriate 60-64 5'778 8'901 64.9% 12'990 29'323 44.3% 18'768 38'224 49.1%
65-69 4'494 6'381 70.4% 4'432 9'692 45.7% 8'925 16'073 55.5%
70-74 3'261 4'568 71.4% 1'746 4'239 41.2% 5'007 8'807 56.8%
75-79 2'335 3'490 66.9% 803 1'953 41.1% 3'138 5'444 57.6%
Total 47,258 273,873 17.3% 163,122 2,141,820 7.6% 210,380 2,415,693 8.7%20-24
25-29
30-34
35-39
40-44
45-49
50-54
55-59
60-64
65-69
70-74
75-79
♂ Male♀ Female
2016 Diabetes population (20 - 79)
Nationality Diabetes % Diabetes
Standardised
prevalence
National 47,258 17.3% 25.3%
Expatriate 163,122 7.6% 15.3%
Total 210,380 8.7% 17.6%
[a]
[b]
National Expatriate Total
Diabetic
Total 2016
Population
Total %
diabetic
Age group Diabetes 2016 Population % diabetes Diabetic 2016 Population % diabetes
20-24 1'263 49'511 3% 2'036 243'117 1% 3'299 292'629 1%
25-29 2'245 47'481 5% 6'950 447'467 2% 9'195 494'948 2%
30-34 3'505 45'486 8% 14'255 467'750 3% 17'761 513'235 3%
35-39 4'462 38'669 12% 19'778 343'639 6% 24'240 382'308 6%
40-44 4'583 26'616 17% 24'554 243'939 10% 29'137 270'555 11%
45-49 4'484 18'134 25% 28'037 174'980 16% 32'521 193'114 17%
50-54 5'185 13'767 38% 25'333 106'713 24% 30'518 120'480 25%
55-59 5'663 10'555 54% 22'208 68'363 32% 27'871 78'918 35%
60-64 5'778 8'906 65% 12'990 29'399 44% 18'768 38'305 49%
65-69 4'494 6'372 71% 4'432 9'742 45% 8'925 16'114 55%
70-74 3'261 4'555 72% 1'746 4'264 41% 5'007 8'820 57%
75-79 2'335 3'475 67% '803 1'966 41% 3'138 5'441 58%
Total 47'258 273'527 17% 163'122 2'141'338 8% 210'380 2'414'865 9%
2016 Diabetes population (20 - 79)
Nationality Diabetic % diabetic
Standardised
prevalence
National 47'258 17.3% 25.4%
Expatriate 163'122 7.6% 15.2%
Total 210'380 8.7% 17.6%
(a)
(b)

Population
Providers Payers Claims
Financing Episodes
23

Episodes by type, setting and nationality
Notes: See definition of Episode in www.doh.gov.ae/shafafiya. Unlike in previous years, 2015 onwards episodes are attributed to facilities of the first encounter in an episode and include episodes for members that are not reported in payers’ person register submissions. Non-SEHA ER Episodes are underrepresented because of coding of ER Encounter types as outpatient. SEHA episodes include Self-pay. Centers and clinics data includes some inpatient episodes that relate to procedures carried out by centers' clinicians in hospitals.
Source: KEH-Cube 2017, Health Statistics Analysis 24
Episodes
2017 SEHA 2016 SEHA 2015 SEHA 2014 SEHA 2013 SEHA 2012 SEHA 2011 SEHA 2010 SEHA
Total 19'336'529 25% 19'271'895 27% 17'843'632 30% 14'953'068 32% 14'344'192 35% 12'765'198 37% 11'361'157 37% 10'998'469 34%
Hospitals 9'169'888 26% 9'029'475 28% 8'397'446 31% 7'001'675 37% 6'969'966 39% 6'311'459 40% 5'774'551 40% 5'954'723 38%
Inpatients 268'041 44% 233'971 50% 219'278 52% 210'549 56% 193'996 61% 163'859 59% 130'219 65% 136'725 63%
ER 89'568 74% 73'089 86% 65'704 92% 68'122 89% 64'967 88% 60'124 88% 45'138 94% 36'576 95%
National 40'509 79% 36'250 86% 30'531 96% 27'810 95% 26'492 95% 29'886 94% 21'216 97% 18'311 98%
Expatriate 30'989 61% 19'714 82% 23'796 87% 26'886 85% 25'281 86% 26'102 87% 21'232 92% 17'469 95%
N/A 18'070 85% 17'125 90% 11'377 92% 13'426 83% 13'194 80% 4'136 43% 2'690 76% 796 22%
Non ER 178'473 29% 160'882 33% 153'574 34% 142'427 41% 129'029 47% 103'735 42% 85'081 49% 100'149 51%
National 55'860 48% 53'803 55% 46'896 54% 45'780 55% 40'941 63% 33'484 66% 28'894 67% 40'878 75%
Expatriate 90'163 15% 69'939 17% 77'750 21% 67'589 32% 56'931 41% 44'576 37% 40'135 41% 43'793 45%
N/A 32'450 34% 37'140 31% 28'928 37% 29'058 38% 31'157 37% 25'675 21% 16'052 39% 15'478 4%
Outpatient 8'901'847 25% 8'795'504 28% 8'178'168 31% 6'791'126 36% 6'775'970 38% 6'147'600 39% 5'644'332 40% 5'817'998 38%
ER 950'191 51% 958'747 55% 871'694 62% 780'943 65% 728'900 72% 828'293 81% 655'394 97% 575'654 95%
National 486'596 62% 483'796 68% 433'316 72% 390'593 70% 365'826 78% 440'637 87% 354'837 99% 321'781 96%
Expatriate 364'052 35% 307'172 39% 352'671 50% 347'761 58% 330'358 66% 368'230 75% 297'177 96% 251'751 93%
N/A 99'543 55% 167'779 48% 85'707 53% 42'589 72% 32'717 64% 19'426 46% 3'380 61% 2'123 61%
Non ER 7'951'656 22% 7'836'757 24% 7'306'474 27% 6'010'183 33% 6'047'070 34% 5'319'307 33% 4'988'938 32% 5'242'343 31%
National 2'570'774 44% 2'356'394 50% 2'225'813 53% 2'045'040 52% 1'935'277 57% 1'779'900 58% 1'647'896 57% 1'875'221 53%
Expatriate 4'423'865 11% 3'674'821 12% 3'987'981 16% 3'654'265 22% 3'695'273 24% 3'121'611 22% 2'907'096 22% 3'000'493 21%
N/A 957'017 16% 1'805'542 17% 1'092'680 17% 310'878 28% 416'520 14% 417'796 6% 433'946 2% 366'629 2%
Centre 9'500'272 26% 9'505'948 28% 8'751'419 30% 7'320'519 31% 6'765'800 35% 5'860'605 38% 5'049'446 38% 4'528'463 31%
National 4'171'844 42% 4'219'802 44% 3'969'870 47% 3'329'793 48% 3'107'622 54% 2'771'498 60% 2'269'165 63% 1'974'079 54%
Expatriate 4'946'422 13% 4'904'201 14% 4'430'457 16% 3'697'097 16% 3'366'210 19% 2'794'952 19% 2'497'339 19% 2'340'605 15%
N/A 382'006 25% 381'946 27% 351'091 29% 293'629 30% 291'969 11% 294'155 5% 282'941 1% 213'779 1%
Clinic 666'369 2% 736'472 3% 694'767 3% 630'874 3% 608'425 0% 593'134 3% 537'160 2% 515'283 1%
National 148'504 7% 164'879 8% 155'278 8% 142'833 9% 137'855 1% 131'091 5% 103'564 7% 107'613 2%
Expatriate 492'811 1% 543'905 1% 513'368 1% 464'327 1% 444'167 0% 425'743 2% 394'009 0% 380'371 0%
N/A 25'054 2% 27'688 3% 26'121 3% 23'714 3% 26'403 0% 36'300 1% 39'588 0% 27'298 0%
Outpatient93%
Expatriate53%
Hospital49%
Centre 47%
National38%
N/A9%
ER, 5%Clinic, 3%
Inpatient, 1%
Prov ider type Sett ing N at ional i ty

Episodes by diagnosis group, % of volume
Notes: Episodes are attributed to diagnosis groups according to principal diagnoses. Data should be interpreted with caution, particularly for categories with low counts.
Due to the rounding, % totals value may not correspond with the sum of separate figures.
Source:KEH-Cube 2017, Health Statistics Analysis; diagnosis groups based on WHO classification of diagnoses ICD 10 CM 25
Outpatient Inpatient
Total Non-ER ER Non-ER ER
% of Total Episodes 100 94.8 4.1 0.8 0.4
Signs, symptoms and ill-defined conditions 18.2 18.1 20.9 22.4 5.8
Respiratory infections 15.3 15.1 20.3 10.5 15.6
Musculoskeletal diseases 10.3 10.6 6.8 3.4 1.2
Genitourinary diseases 6.4 6.4 5.8 3.6 5.3
Skin diseases 5.4 5.5 2.6 1.4 1.5
Sense organ diseases 5.2 5.4 3.1 0.8 0.8
Digestive diseases 5.1 5.0 7.7 10.0 11.4
Respiratory diseases 5.0 5.1 4.2 5.2 4.7
Oral conditions 4.2 4.4 0.6 0.2 0.3
Injuries 3.9 3.4 15.6 3.3 10.7
Maternal conditions 3.6 3.4 3.2 20.7 12.9
Diabetes mellitus 3.5 3.6 0.5 1.1 1.5
Cardiovascular diseases 3.3 3.4 1.6 4.7 10.7
Endocrine disorders excluding diabetes 3.0 3.1 1.6 2.5 5.4
Infectious and parasitic diseases 2.8 2.8 2.7 3.3 5.8
Neuropsychiatric conditions 2.1 2.1 2.3 2.8 3.5
Nutritional deficiencies 1.7 1.8 0.3 0.3 0.5
Cancer 0.3 0.3 0.1 1.1 1.2
Benign and borderline neoplasms 0.3 0.3 0.1 0.9 0.3
Congenital anomalies 0.3 0.3 0.0 0.9 0.2
Perinatal conditions 0.2 0.2 0.2 0.9 0.7
Road Traffic Accidents 0.0 0.0 0.0

Episodes by diagnosis group, % of value
Notes: (a) Breakdown values reflect proportions of the total value (claimed amount) of each grouping (Outpatient and Inpatient). Episodes are attributed to diagnosis groups according to principal diagnoses. Data should be interpreted with caution, particularly for categories with low counts. (b) Due to the rounding, % totals value may not correspond with the sum of separate figures.
Source: KEH-Cube 2017, Health Statistics Analysis; diagnosis groups based on WHO classification of diagnoses ICD 10 CM 26
Total Outpatient Inpatient
100% 62.6% 37.4%
Break down Break down
Procedures Drugs Supplies Services DRG Procedures Services Drugs Supplies
% of Total value 100 70.0 25.0 3.0 2.0 100 49.0 16.7 27.4 4.7 2.1
Signs, symptoms and ill-defined conditions 15.2 14.8 11.4 2.6 0.4 0.4 17.0 7.6 4.8 1.9 2.5 0.2
Musculoskeletal diseases 8.7 11.1 9.3 1.6 0.2 4.8 2.2 0.8 0.7 0.4 0.7
Diabetes mellitus 7.8 10.1 4.0 5.3 0.8 4.1 0.5 0.2 3.1 0.3
Cardiovascular diseases 7.2 4.7 2.6 2.0 0.1 11.2 6.8 0.6 3.7 0.1
Oral conditions 6.8 10.5 10.4 0.1 0.6 0.5 0.1
Genitourinary diseases 6.4 7.7 4.5 1.3 0.1 1.8 4.5 1.8 1.5 1.1 0.1
Respiratory infections 5.8 6.4 4.5 1.9 4.9 3.4 1.2 0.2 0.1
Respiratory diseases 5.3 3.6 2.3 1.1 0.2 8.2 2.6 1.0 4.5 0.1
Neuropsychiatric conditions 5.1 3.7 2.1 1.2 0.4 7.5 1.3 0.4 5.6 0.2
Endocrine disorders excluding diabetes
excluding diabetes4.9 5.4 2.8 2.5 0.1 4.0 1.9 0.2 1.1 0.8
Maternal conditions 4.8 3.3 3.0 0.3 7.2 6.8 0.3 0.1
Digestive diseases 4.7 3.6 2.5 1.1 6.5 3.9 1.6 0.6 0.2 0.2
Injuries 3.6 2.1 1.9 0.2 5.9 3.3 1.4 0.8 0.4
Sense organ diseases 3.5 4.1 2.8 0.7 0.6 2.6 0.4 1.4 0.4 0.1 0.3
Skin diseases 2.5 3.4 2.2 1.2 1.0 0.5 0.2 0.2 0.1
Infectious and parasitic diseases 2.4 1.6 1.0 0.6 3.6 2.8 0.2 0.6
Cancer 1.9 1.7 0.6 1.0 0.1 2.1 1.5 0.1 0.5
Nutritional deficiencies 1.3 1.8 1.3 0.5 0.4 0.1 0.3
Congenital anomalies 1.1 0.6 0.4 0.1 0.1 2.0 0.8 0.1 1.1
Benign and borderline neoplasms 0.5 0.3 0.3 0.8 0.4 0.2 0.2
Perinatal conditions 0.4 0.1 0.1 1.0 0.4 0.6
Road Traffic Accidents 0.0
(a)
(b)
(a)

Activities by classification type, % of value
Source: KEH-Cube 2017; Health Statistics Analysis
Notes: (a) Dark area indicates proportion of outpatients
Not all drugs have been mapped to the appropriate ATC code http://en.wikipedia.org/wiki/ATC_code_A02; HCPCS CMS Hospital Outpatient Payment system includes 90% unclassified
drugs. (b) Service codes are an Abu Dhabi Emirate specific classification maintained by DOH HSF to complement the CPT classification for billing purposes. DRG: Diagnosis-Related Group.
27
`
CPT45%
DRG19%
Service13%
Drug11%
Dental9%
HCPCS3%

Population
Providers Payers Claims
Financing Episodes
28

Providers
Notes: Definitions of categories as per Health Facilities Licensing criteria, see www.doh.gov.ae. Behavioral Science Pavilion is considered part of SKMC as it is under SKMC management. Zayed Military Hospital is not included. Other Clinicians: includes (a) AHP (Allied Health Professionals), Pharmacists, and Alternative Medicine
(b) CAGR: Compound Annual Growth Rate. Source: Clinicians licensing database; Facility Licensing Database
Facilities Clinicians
29
1'2111'354
1'5081'626
1'811
2'137
2'455
2'846
2010 2011 2012 2013 2014 2015 2016 2017
Facilities
Total SEHA Abu Dhabi Al Ain Al Dhafrah
Total 2'846 6% 1'860 785 201
Hospital 60 23% 38 15 7
Centres (various) 944 9% 633 246 65
Centre 669 7% 458 188 23
Rehabilitation 172 1% 126 42 4
Diagnostic 31 29% 20 7 4
Mobile 52 17% 20 3 29
Dialysis 12 100% 4 3 5
Fertility 8 25% 5 3
Clinic 700 1% 398 230 72
Pharmacy 802 9% 545 210 47
Store 75 11% 66 8 1
Other 265 1% 180 76 9
Centres (various)
33%
Pharmacy28%
Clinic25%
Store3%
Hospital2%
Other9%
Growth rate (CAGR 2010 - 17)(b)
2017 2016 2015 2014 2013 2012 2011 2010 CAGR
Hospital 60 56 52 45 41 39 35 33 9
Centres (various) 944 875 757 629 587 540 494 429 12
Clinic 700 449 423 362 335 316 265 239 17
Pharmacy 802 750 637 557 502 454 427 408 10
Store 75 79 76 72 72 69 67 60 3
Clinicians
Total Physicians SEHA Dentists SEHANurses&
MidwifesSEHA AHP(a) SEHA
Pharma-
cistsSEHA
Alternative
MedicineSEHA
51'429 9'444 35% 1'920 15% 27'568 30% 8'731 27% 3'714 26% 52 0%
24'540 5'689 45% 193 15% 14'708 43% 3'940 41% 6 83% 4 0%
11'593 2'646 14% 1'475 11% 4'924 15% 2'499 19% 6 0% 43 0%
10'317 2'528 14% 1'472 11% 4'477 11% 1'801 22% 6 0% 33 0%
417 6 0% 82 0% 319 1% 10 0%
366 56 21% 9 100% 301 15%
50 7 0% 3 33% 25 20% 15 80%
247 3 100% 236 100% 8 100%
196 46 11% 95 11% 55 22%
880 179 4% 127 0% 516 1% 58 0%
3'294 1 0% 3'293 24%
132 132 14%
10'990 930 41% 125 80% 7'419 14% 2'234 14% 277 49% 5 0%
National Male 314 71% 39 54% 7 29% 73 37% 4 0% 1 0%
Female 732 88% 120 73% 181 76% 440 66% 108 72%
Expatriate Male 5'503 4% 990 2% 6'610 0% 3'977 1% 1'806 0% 25 0%
Female 2'895 22% 771 11% 20'770 1% 4'241 7% 1'796 4% 26 0%
Breakdown by Region
Abu Dhabi 6'648 28% 1'329 14% 19'569 26% 6'639 20% 2'614 20% 47 0%
Al Ain 2'340 49% 537 12% 6'913 36% 1'788 45% 929 34% 5 0%
Al Dhafrah 456 72% 54 48% 1'086 55% 304 80% 171 66%
5'636 5'764 6'497 8'084 7'516 10'021 10'717 11'364
8'22110'504
12'37514'235 16'577
21'73324'915
27'568
5'2465'222
6'347
7'7648'461
10'128
11'162
12'497
2010 2011 2012 2013 2014 2015 2016 2017
Physicians and dentists Nurses Other

Hospital labour productivity 2016
Indicative
Notes: Productivity is defined as adjusted episodes per clinician per day. To account for the higher resource need of inpatients, doctors’ inpatient episodes are multiplied by the ratio of the average value (ClaimNet) of an Inpatient episode versus an outpatient episode while for nurses – by the ratio of the number of inpatient to outpatient episodes per nurse in SEHA hospitals. To reflect clinical complexity inpatient episodes are then adjusted by the difference of case mix index of each individual hospital from Abu Dhabi average. Episodes of SEHA hospitals are underestimated due to certain SEHA clinical obligations such as public events medical preparation. Episodes are attributed to facilities of the first encounter in an episode and include episodes for members that are not reported in payers’ person register submissions.
Source: KEH-Cube 2016, DOH licensing database; Health Statistics Analysis 30
Epis
od
es
pe
r d
oct
or
pe
r d
ay
Episodes per nurse per day
SEHA
Non SEHA
5.1
6.1
Average

Hospitals
Notes: Total number of operational beds as of 31st December 2017, and licensed beds were used for the new facilities, beds occupancy doesn’t reflect bed capacity over the year; See definition of Episode in www.doh.gov.ae/shafafiya. Military Hospital is excluded and Behavioral Science Pavilion is considered part of SKMC as it is under SKMC management.
Source: Hospital submissions, Operation Centre, Clinician Licensing Database 31
Episodes, 000's Staff Beds
Region Hospital Inpatient Outpatient Total Physicians
Dentists
Nurses &
Midwifes
AHP &
Pharmacists Occupancy
%
Operational
Beds
ALOS
ER Non-ER ER Non-ER
Total 80.8 160.5 901.4 7'554.3 24'536 5'689 193 14'708 3'946 5'536
SEHA 61.8 47.8 460.2 1'659.2 10'579 2'549 28 6'393 1'609 2'506
Abu Dhabi Al Corniche 6.3 8.6 13.6 80.2 734 154 543 37 53% 247 4.1
Abu Dhabi Al Rahba 03.5 4.0 035.7 115.6 646 132 3 423 88 71% 156 5.2
Abu Dhabi Al Mafraq 11.7 7.0 75.9 234.6 1'929 422 1'208 299 84% 366 6.2
Abu Dhabi SKMC 10.7 4.6 90.9 331.8 2'952 755 7 1'749 441 70% 655 8.9
Abu Dhabi SKMC - Behavioral Sciences Pavilion .0 1.2 .0 22.8 59 3 44 12 14.8
Al Ain Al Ain 12.7 6.6 56.0 245.3 1'428 342 854 232 81% 356 6.1
Al Ain Tawam 11.3 11.7 82.9 381.5 2'290 636 2 1'274 378 85% 436 5.6
Al Ain Al Wagan 0.5 0.1 9.3 37.9 37 7 2 24 4 69% 10 3.0
Western Al Mirfa 0.3 .2 12.0 23.8 58 12 2 30 14 23% 19 2.9
Western Delma 0.2 0.1 6.1 12.1 40 11 2 15 12 16% 13 3.3
Western Al Silla 0.5 0.2 15.0 25.3 47 12 1 27 7 23% 38 4.8
Western Ghayathi 1.7 0.8 23.8 50.7 64 12 1 37 14 60% 59 3.9
Western Madinat Zayed 2.3 02.5 30.7 85.3 264 47 6 150 61 51% 129 5.3
Western Liwa 0.2 0.2 8.3 12.4 31 4 2 15 10 36% 22 1.8
Mubadala 2.6 5.8 39.4 456.0 2'856 456 22 1'741 637 408
Abu Dhabi Healthpoint .0 2.2 .0 181.5 454 82 20 213 139 57% 44 2.6
Abu Dhabi Cleveland Clinic Abu Dhabi 2.6 3.5 39.4 274.5 2'402 374 2 1'528 498 56% 364 8.3

31A
Hospitals
Notes: Total number of operational beds as of 31st December 2017, and licensed beds were used for the new facilities, beds occupancy doesn’t reflect bed capacity over the year; See definition of Episode in www.doh.gov.ae/shafafiya
Episodes, 000's Staff
Region Hospital Inpatient Outpatient Total Physicians
Dentists
Nurses &
Midwifes
AHP &
Pharmacists
Occupancy
%
Operational
Beds
ALOS
ER Non-ER ER Non-ER
Other 16.4 106.9 401.7 5,439.1 11'101 2'684 143 6'574 1'700 2'622
Abu Dhabi N M C Specialty 1.1 7.4 12.1 455.7 865 192 11 522 140 66% 104 2.7
Abu Dhabi Burjeel 2.0 6.1 50.2 393.7 726 168 15 413 130 66% 159 3.3
Abu Dhabi Al Ahli 0.5 3.0 1.7 349.1 382 99 4 221 58 64% 50 2.4
Abu Dhabi Universal 1.1 3.2 13.3 322.3 376 136 8 173 59 55% 86 3.1
Abu Dhabi Al Ahli 0.5 3.8 12.0 300.0 246 76 8 131 31 61% 123 2.4
Abu Dhabi Al Noor-Airport road 0.7 7.0 9.3 296.5 527 157 8 265 97 51% 117 2.9
Abu Dhabi N M C Royal 1.8 5.0 57.5 248.6 808 170 14 529 95 54% 179 3.0
Abu Dhabi Al Noor - Khalifa street 0.0 4.4 14.3 288.3 418 138 5 197 78 32% 117 2.6
Al Ain Al Noor - Al Ain - Khalifa 0.1 5.7 20.1 254.7 333 104 2 174 53 47% 75 2.2
Al Ain New Medical Centre Specialty 1.7 5.2 29.1 237.1 496 119 9 292 76 58% 93 3.0
Abu Dhabi LLH 0.0 3.6 4.6 213.8 245 87 1 129 28 73% 32 2.4
Abu Dhabi LLH-Musaffah 0.0 5.7 14.4 191.6 261 59 3 163 36 64% 35 2.4
Abu Dhabi Lifecare 0.7 1.9 10.3 193.2 239 66 1 141 31 67% 63 3.0
Abu Dhabi Medeor 24X7 0.8 2.9 8.8 164.8 259 72 3 142 42 66% 47 15.1
Abu Dhabi Lifecare 0.0 4.6 7.4 149.0 142 43 1 82 16 82% 27 2.4
Abu Dhabi Al Salama 0.7 1.3 7.3 148.8 227 58 5 124 40 52% 16 1.8
Al Ain Ain Al Khaleej 1.9 2.3 30.4 120.1 283 59 6 169 49 42% 73 2.2
Al Ain Oasis 0.0 7.3 0.0 140.3 294 69 184 41 48% 99 3.0
Abu Dhabi Gulf Diagnostic Center 0.0 0.1 0.0 147.4 156 61 3 48 44 14% 8 4.2
Abu Dhabi Danat Al Emarat Hospital For Women & Childern 0.7 9.4 5.3 107.5 365 82 229 54 61% 115 2.7
Al Ain Emirates International 0.8 1.3 47.8 68.3 106 53 39 14 54% 35 1.8
Abu Dhabi Dar Al Shifa 0.0 0.4 12.9 89.8 116 31 3 60 22 18% 17 2.3
Al Ain Al Ain Cromwell Women & Children 0.9 3.3 1.3 89.2 165 55 2 87 21 45% 67 3.3
Abu Dhabi Bareen International 0.3 1.5 4.2 61.2 148 39 1 81 27 42% 28 1.2
Al Dhafrah Ruwais 0.0 1.4 8.1 56.2 200 51 6 120 23 18% 48 3.2
Al Ain Specialized Medical Care 0.0 0.2 1.0 57.1 114 32 4 54 24 17% 18 1.4
Al Ain Al Noor - Al Ain- Al Jimi 0.0 1.1 13.4 39.3 132 47 1 72 12 26% 45 2.9
Abu Dhabi Al Raha 0.0 0.5 0.0 51.7 89 32 7 38 12 35% 13 2.1
Abu Dhabi Al Bustan Specialty 0.1 1.2 2.4 44.1 183 56 5 89 33 51% 50 2.6
Abu Dhabi National Hospital 0.0 0.2 0.3 46.3 95 32 2 47 14 8% 22 1.4
Abu Dhabi Bright Point Royal Womens 0.0 4.6 0.0 41.3 279 41 209 29 59% 53 3.0
Al Ain Medeor 24X7 International 0.0 0.9 1.8 37.6 152 41 3 83 25 43% 32 3.2
Abu Dhabi Seha Emirates 0.0 0.0 0.0 31.2 49 24 2 16 7 2.0
Abu Dhabi Cambridge Medical & Rehabilitation Centre - Abu Dhabi 0.0 0.1 0.0 1.0 138 10 108 20 81% 90 3.2
Abu Dhabi Nation 0.0 0.0 0.1 .8 213 42 134 37 3% 35 7.8
Al Ain Cambridge Medical & Rehabilitation Centre - Al Ain 0.0 0.1 0.0 .8 94 8 62 24 30% 90
Abu Dhabi Novavita Specialised Paediatric 0.0 0.0 0.0 .6 37 6 26 5 15.7
Abu Dhabi Amana Healthcare Medical And Rehabilitation 0.0 0.0 0.0 .1 243 10 202 31 61% 76 41.7
Abu Dhabi Provita International Medical Center 0.0 0.0 0.0 .0 253 13 203 37 89% 70 13.4
Al Ain Provita International Medical Center-Al Ain 0.0 0.1 0.0 .0 185 10 150 25 95% 54 13.2
Al Ain Long Term Medical And Rehabilitation 0.0 0.0 0.0 .0 224 6 202 16 79% 69 22.9
Abu Dhabi Disabled Custodial Care Center 75 69 6 82% 80
Abu Dhabi National Rehabilitation Centre 69 14 32 23
Abu Dhabi Emirates French 94 16 63 15 13% 12

Hospital inpatient profile by value
Note: (a) Dark area in pie chart represents share of top 5 Diagnosis groups within the total value of provider’s services
Attribution to diagnosis groups is based on principal diagnosis and does not necessarily reflect the full spectrum of services provided by respective healthcare facilities
Source: KEH-Cube 2017, Health Statistics Analysis, and diagnosis groups based on WHO classification of diagnoses ICD 10 CM 32
Hospital 100 Top 5 (a) 1st 2nd 3rd 4th 5th
Tawam 11 Maternal Conditions (10.2%) Cancer (9.8%) Endocrine Disorders Excluding Diabetes (8.3%) Cardiovascular Diseases (7.3%) Infectious And Parasitic Diseases (7.2%)
SKMC 11 Congenital Anomalies (11.3%) Respiratory Diseases (11.0%) Signs, Symptoms And Ill-Defined (7.2%) Cancer (6.8%) Neuropsychiatric Conditions (6.8%)
Cleveland Clinic Abu Dhabi 9 Respiratory Diseases (11.2%) Infectious And Parasitic Diseases (9.0%) Digestive Diseases (9.0%) Injuries (4.3%) Neuropsychiatric Conditions (4.2%)
Al Mafraq 7 Signs, Symptoms And Ill-Defined (11.9%) Cardiovascular Diseases (10.9%) Maternal Conditions (8.1%) Infectious And Parasitic Diseases (7.4%) Digestive Diseases (5.6%)
Al Ain 7 Signs, Symptoms And Ill-Defined (13.6%) Injuries (11.9%) Respiratory Diseases (11.3%) Infectious And Parasitic Diseases (9.7%) Neuropsychiatric Conditions (7.9%)
Al Corniche 4 Maternal Conditions (42.0%) Genitourinary Diseases (1.7%) Perinatal Conditions (1.1%) Benign And Borderline Neoplasms (0.4%) Congenital Anomalies (0.1%)
Long Term Medical And Rehabilitation 4 Neuropsychiatric Conditions (32.0%) Cardiovascular Diseases (20.0%) Congenital Anomalies (4.5%) Perinatal Conditions (2.2%) Signs, Symptoms And Ill-Defined (2.1%)
Burjeel 4 Maternal Conditions (15.4%) Signs, Symptoms And Ill-Defined (14.6%) Digestive Diseases (9.9%) Respiratory Infections (9.6%) Musculoskeletal Diseases (5.2%)
Danat Al Emarat Hospital For Women & Childern 3 Signs, Symptoms And Ill-Defined (39.3%) Respiratory Infections (3.6%) Genitourinary Diseases (1.9%) Perinatal Conditions (1.4%) Digestive Diseases (1.3%)
Amana Healthcare Medical And Rehabilitation 3 Perinatal Conditions (19.2%) Cardiovascular Diseases (18.3%) Congenital Anomalies (12.8%) Respiratory Diseases (7.4%) Musculoskeletal Diseases (3.9%)
Healthpoint 3 Injuries (14.7%) Endocrine Disorders Excluding Diabetes (5.0%) Respiratory Diseases (2.5%) Digestive Diseases (2.3%) Cancer (0.7%)
N M C Royal 3 Respiratory Diseases (14.9%) Respiratory Infections (12.5%) Cardiovascular Diseases (9.4%) Digestive Diseases (9.4%) Signs, Symptoms And Ill-Defined (9.2%)
Al Rahba 3 Respiratory Diseases (17.7%) Maternal Conditions (13.4%) Injuries (8.6%) Respiratory Infections (7.5%) Cardiovascular Diseases (6.6%)
Al Noor-Airport road 3 Maternal Conditions (15.8%) Signs, Symptoms And Ill-Defined (14.5%) Digestive Diseases (10.3%) Respiratory Infections (9.9%) Respiratory Diseases (5.3%)
N M C Specialty 2 Maternal Conditions (11.3%) Digestive Diseases (11.3%) Signs, Symptoms And Ill-Defined (9.2%) Respiratory Infections (9.1%) Cancer (6.4%)
Al Ahli 3 Digestive Diseases (13.1%) Injuries (9.5%) Respiratory Infections (8.9%) Signs, Symptoms And Ill-Defined (8.2%) Maternal Conditions (7.0%)
Cambridge Medical & Rehabilitation Centre - Abu Dhabi2 Neuropsychiatric Conditions (30.6%) Cardiovascular Diseases (9.9%) Congenital Anomalies (4.1%) Injuries (1.9%) Signs, Symptoms And Ill-Defined (1.2%)
New Medical Centre Specialty 2 Cardiovascular Diseases (18.2%) Maternal Conditions (17.8%) Digestive Diseases (14.8%) Respiratory Infections (5.6%) Genitourinary Diseases (4.5%)
Oasis 2 Signs, Symptoms And Ill-Defined (42.0%) Digestive Diseases (4.4%) Respiratory Infections (2.3%) Genitourinary Diseases (1.4%) Respiratory Diseases (1.2%)
Madinat Zayed 1 Maternal Conditions (12.6%) Cardiovascular Diseases (11.1%) Digestive Diseases (10.2%) Injuries (9.3%) Respiratory Infections (8.7%)
Universal 1 Signs, Symptoms And Ill-Defined (13.7%) Digestive Diseases (11.2%) Musculoskeletal Diseases (10.9%) Injuries (10.2%) Maternal Conditions (9.4%)
Al Noor - Al Ain - Khalifa 1 Cardiovascular Diseases (12.5%) Maternal Conditions (11.5%) Respiratory Infections (11.3%) Musculoskeletal Diseases (11.3%) Injuries (8.3%)
Bright Point Royal Womens 1 Signs, Symptoms And Ill-Defined (44.9%) Genitourinary Diseases (3.3%) Perinatal Conditions (1.5%) Benign And Borderline Neoplasms (1.4%) Endocrine Disorders Excluding Diabetes (0.1%)
Lifecare 2 Digestive Diseases (14.0%) Musculoskeletal Diseases (7.4%) Respiratory Infections (7.2%) Injuries (6.2%) Infectious And Parasitic Diseases (5.6%)
Al Noor - Khalifa street 1 Digestive Diseases (17.8%) Signs, Symptoms And Ill-Defined (16.0%) Respiratory Infections (7.6%) Cardiovascular Diseases (7.4%) Endocrine Disorders Excluding Diabetes (6.8%)
Al Ahli 3 Digestive Diseases (15.9%) Respiratory Infections (12.6%) Maternal Conditions (7.3%) Injuries (5.9%) Genitourinary Diseases (5.9%)
Medeor 24X7 1 Maternal Conditions (20.6%) Cardiovascular Diseases (16.5%) Digestive Diseases (9.1%) Respiratory Infections (6.4%) Genitourinary Diseases (3.9%)

Hospital inpatient profile by value
Note: (a) Dark area in pie chart represents share of top 5 Diagnosis groups within the total value of provider’s services
Attribution to diagnosis groups is based on principal diagnosis and does not necessarily reflect the full spectrum of services provided by respective healthcare facilities
Source: KEH-Cube 2017, Health Statistics Analysis, and diagnosis groups based on WHO classification of diagnoses ICD 10 CM 32A
Hospital 100 Top 5 (a) 1st 2nd 3rd 4th 5th
LLH-Musaffah 1 Maternal Conditions (12.7%) Cardiovascular Diseases (12.2%) Respiratory Infections (9.2%) Injuries (8.4%) Signs, Symptoms And Ill-Defined (6.7%)
Cambridge Medical & Rehabilitation Centre - Al Ain 1 Cardiovascular Diseases (16.3%) Neuropsychiatric Conditions (14.1%) Injuries (5.3%) Congenital Anomalies (3.7%) Musculoskeletal Diseases (2.7%)
SKMC_Behavioral Sciences Pavilion 1 Signs, Symptoms And Ill-Defined (0.6%) Maternal Conditions (0.1%) Injuries (0.0%) Cardiovascular Diseases (0.0%) Cardiovascular Diseases (0.0%)
Al Ain Cromwell Women & Children 1 Signs, Symptoms And Ill-Defined (24.2%) Respiratory Infections (21.0%) Digestive Diseases (7.1%) Genitourinary Diseases (4.8%) Infectious And Parasitic Diseases (2.9%)
Ain Al Khaleej 1 Maternal Conditions (20.5%) Signs, Symptoms And Ill-Defined (10.6%) Genitourinary Diseases (8.5%) Digestive Diseases (7.8%) Infectious And Parasitic Diseases (6.7%)
LLH 1 Maternal Conditions (18.7%) Signs, Symptoms And Ill-Defined (10.7%) Musculoskeletal Diseases (9.0%) Cardiovascular Diseases (8.7%) Respiratory Infections (6.7%)
Ghayathi 1 Cardiovascular Diseases (15.0%) Maternal Conditions (12.8%) Digestive Diseases (11.4%) Signs, Symptoms And Ill-Defined (8.7%) Infectious And Parasitic Diseases (6.1%)
Lifecare 2 Digestive Diseases (21.5%) Musculoskeletal Diseases (8.0%) Injuries (6.4%) Cardiovascular Diseases (5.2%) Respiratory Diseases (5.0%)
Al Salama Maternal Conditions (14.8%) Digestive Diseases (10.5%) Signs, Symptoms And Ill-Defined (9.5%) Respiratory Diseases (7.1%) Cardiovascular Diseases (5.7%)
Bareen International Signs, Symptoms And Ill-Defined (15.5%) Genitourinary Diseases (14.8%) Respiratory Infections (11.2%) Injuries (8.6%) Musculoskeletal Diseases (7.6%)
Al Noor - Al Ain- Al Jimi Digestive Diseases (15.2%) Signs, Symptoms And Ill-Defined (11.7%) Respiratory Infections (11.4%) Genitourinary Diseases (11.4%) Endocrine Disorders Excluding Diabetes (6.5%)
Emirates International Digestive Diseases (20.1%) Genitourinary Diseases (12.1%) Maternal Conditions (9.1%) Endocrine Disorders Excluding Diabetes (6.9%) Signs, Symptoms And Ill-Defined (6.3%)
Ruwais Digestive Diseases (16.9%) Signs, Symptoms And Ill-Defined (14.6%) Respiratory Infections (11.2%) Cardiovascular Diseases (10.9%) Injuries (4.1%)
Provita International Medical Center Neuropsychiatric Conditions (4.5%) Signs, Symptoms And Ill-Defined (1.7%) Congenital Anomalies (0.9%) Cardiovascular Diseases (0.0%) Cardiovascular Diseases (0.0%)
Al Bustan Specialty Hospital LLC Digestive Diseases (12.5%) Cardiovascular Diseases (8.1%) Maternal Conditions (6.7%) Signs, Symptoms And Ill-Defined (6.2%) Infectious And Parasitic Diseases (5.4%)
Al Silla Maternal Conditions (16.6%) Neuropsychiatric Conditions (8.8%) Digestive Diseases (8.2%) Signs, Symptoms And Ill-Defined (8.1%) Injuries (6.2%)
Medeor 24X7 International Maternal Conditions (15.8%) Digestive Diseases (13.8%) Injuries (12.6%) Signs, Symptoms And Ill-Defined (8.1%) Respiratory Diseases (6.4%)
Provita International Medical Center-Al Ain Congenital Anomalies (2.5%) Signs, Symptoms And Ill-Defined (0.2%) Neuropsychiatric Conditions (0.2%) Cardiovascular Diseases (0.0%) Maternal Conditions (0.0%)
Al Wagan Endocrine Disorders Excluding Diabetes (9.2%) Respiratory Diseases (7.8%) Genitourinary Diseases (6.9%) Infectious And Parasitic Diseases (4.1%) Sense Organ Diseases (3.0%)
Al Mirfa Respiratory Infections (14.8%) Infectious And Parasitic Diseases (9.9%) Signs, Symptoms And Ill-Defined (9.8%) Cardiovascular Diseases (6.1%) Digestive Diseases (5.2%)
Liwa Respiratory Infections (17.0%) Neuropsychiatric Conditions (16.0%) Signs, Symptoms And Ill-Defined (10.0%) Cardiovascular Diseases (6.3%) Genitourinary Diseases (4.5%)
Al Raha Respiratory Infections (13.9%) Respiratory Diseases (12.1%) Musculoskeletal Diseases (8.0%) Genitourinary Diseases (6.7%) Injuries (5.0%)
Dar Al Shifa Digestive Diseases (18.1%) Respiratory Diseases (13.9%) Signs, Symptoms And Ill-Defined (10.9%) Respiratory Infections (6.8%) Injuries (5.5%)
Delma Maternal Conditions (17.5%) Genitourinary Diseases (10.2%) Digestive Diseases (9.7%) Signs, Symptoms And Ill-Defined (7.5%) Injuries (6.2%)
National Hospital Respiratory Diseases (21.0%) Musculoskeletal Diseases (12.8%) Injuries (11.8%) Skin Diseases (7.9%) Sense Organ Diseases (4.6%)
Seha Emirates Digestive Diseases (23.3%) Respiratory Diseases (7.3%) Neuropsychiatric Conditions (5.8%) Injuries (5.4%) Genitourinary Diseases (3.9%)
Specialized Medical Care Digestive Diseases (20.0%) Genitourinary Diseases (10.6%) Respiratory Diseases (9.4%) Cardiovascular Diseases (7.7%) Signs, Symptoms And Ill-Defined (7.4%)

Bed capacity by bed type
Note: Reported operational beds
Source: 2017 Bed census, DOH Operation Centre 33
Acute Acute Intermediate Acute Specialty Designation Subset Adult Critical Care Pediatric Critical CareSubAcute Other
Hospital Name Tota
l
Gen
eral
Med
/ S
urg
Ob
stet
rics
/GYN
Ped
iatr
ic
VIP
Med
/Su
rg In
term
edia
te C
are
Un
it
Ped
iatr
ic In
term
edia
te C
are
Spec
ial C
are
Bab
y U
nit
Tele
met
ry
Iso
lati
on
Car
dia
c C
are
Un
it (
CC
U)
Car
dio
Th
ora
cic
ICU
Med
ical
/ Su
rgic
al IC
U
Su
rgic
al In
ten
sive
Car
e U
nit
Bu
rn U
nit
Med
ical
Inte
nsi
ve C
are
Un
it
NIC
U
PIC
U
Lo
ng-
term
-car
e/ L
TVU
Beh
avio
ura
l Sci
ence
s
Ped
iatr
ic E
xten
ded
Car
e U
nit
(P
ECU
)
Reh
abili
tati
on
Total 5'536 1'984 691 466 262 84 60 137 119 200 61 35 331 26 15 36 263 81 349 156 10 166 4
SEHA 2'506 878 308 316 82 47 13 76 103 109 36 22 93 16 15 22 111 34 38 156 10 21 0
Abu Dhabi Al Corniche 247 163 14 4 29 2 35
Abu Dhabi Al Rahba 156 46 23 21 2 10 18 28 8
Abu Dhabi Al Mafraq 366 183 21 44 8 0 11 6 23 12 0 16 15 16 11
Abu Dhabi SKMC 655 168 95 14 35 7 57 31 20 10 29 27 18 123 21
Western Al Mirfa 19 18 1
Western Liwa 22 18 4
Al Ain Al Ain 356 165 32 54 8 16 12 10 14 0 0 6 6 33
Al Ain Tawam 436 174 34 64 22 6 6 15 40 12 20 0 0 26 7 10
Al Ain Al Wagan 10 10 0
Western Al Silla 38 22 3 3 2 2 6
Western Ghayathi 59 27 3 11 2 1 4 4 1 6
Western Madinat Zayed 129 44 24 22 10 4 7 6 8 4
Western Delma 13 3 5 2 2 1
Mubadala 408 258 0 0 22 12 0 0 0 41 0 0 75 0 0 0 0 0 0 0 0 0 0
Abu Dhabi Cleveland Clinic Abu Dhabi 364 217 22 12 41 72
Abu Dhabi Healthpoint 44 41 3

Bed capacity by bed type
Note: Reported operational beds
Source: 2017 Bed census, DOH Operation Centre 33A
Acute Acute Intermediate Acute Specialty Designation Subset Adult Critical Care Pediatric Critical CareSubAcute Other
Region Hospital Name Tota
l
Gen
eral
Med
/ S
urg
Ob
stet
rics
/GYN
Ped
iatr
ic
VIP
Med
/Su
rg In
term
edia
te C
are
Un
it
Ped
iatr
ic In
term
edia
te C
are
Spec
ial C
are
Bab
y U
nit
Tele
met
ry
Ther
eof:
Iso
lati
on
Car
dia
c C
are
Un
it (
CC
U)
Car
dio
Th
ora
cic
ICU
Med
ical
/ Su
rgic
al IC
U
Su
rgic
al In
ten
sive
Car
e U
nit
Bu
rn U
nit
Med
ical
Inte
nsi
ve C
are
Un
it
NIC
U
PIC
U
Lo
ng-
term
-car
e/ L
TVU
Beh
avio
ura
l Sci
ence
s
Ped
iatr
ic E
xten
ded
Car
e U
nit
(P
ECU
)
Reh
abili
tati
on
Other 2'622 848 383 150 158 25 47 61 16 50 25 13 163 10 0 14 152 47 311 0 0 145 4
Abu Dhabi Health Sheild Medical Center 12 5 2 2 1 0 2
Abu Dhabi Al Noor - Khalifa street 117 46 38 4 3 3 3 5 15
Abu Dhabi Al Salama 16 5 5 2 1 3
Al Ain Al Noor - Al Ain - Khalifa 75 49 11 3 2 3 2 2 3
Abu Dhabi LLH 32 16 2 5 4 1 4
Al Ain New Medical Centre Specialty 93 25 18 7 5 7 3 8 2 3 1 4 10
Abu Dhabi Dar Al Shifa 17 12 3 2
Abu Dhabi LLH-Musaffah 35 19 5 3 2 1 5
Abu Dhabi Bareen International 28 7 11 2 2 2 4
Al Ain Al Ain Cromwell Women & Children 67 43 0 7 2 9 3 3
Abu Dhabi Al Noor-Airport road 117 38 30 12 6 10 1 4 6 10
Abu Dhabi Danat Al Emarat Hospital For Women & Childern 115 19 41 8 18 1 3 8 15 2
Abu Dhabi Al Ahli 50 22 10 5 1 10 2
Al Ain Emirates International 35 12 5 5 6 1 6
Abu Dhabi Lifecare 27 22 2 3
Abu Dhabi N M C Royal 179 52 24 22 15 2 6 8 2 11 6 6 25
Abu Dhabi Lifecare 63 54 2 7
Abu Dhabi Al Bustan Specialty 50 23 10 2 2 9 4
Abu Dhabi Burjeel 159 50 40 15 11 18 13 12
Abu Dhabi Al Raha 13 12 1
Al Ain Ain Al Khaleej 73 38 19 4 3 5 4
Abu Dhabi Universal 86 27 17 7 16 4 2 6 7
Al Ain Al Noor - Al Ain- Al Jimi 45 13 9 6 2 2 2 1 3 7
Abu Dhabi Provita International Medical Center 70 70
Abu Dhabi Disabled Custodial Care Center 80 80
Abu Dhabi Al Ahli 123 53 21 14 5 5 5 2 8 10
Abu Dhabi Bright Point Royal Womens 53 22 11 6 2 1 2 9
Abu Dhabi Nation 35 24 10 1 0
Al Ain Provita International Medical Center-Al Ain 54 54
Abu Dhabi Amana Healthcare Medical And Rehabilitation 76 2 0 0 58 16
Al Ain Long Term Medical And Rehabilitation 69 30 39
Al Ain Cambridge Medical & Rehabilitation Centre - Al Ain 90 8 7 75
Abu Dhabi Cambridge Medical & Rehabilitation Centre - Abu Dhabi90 31 5 54
Abu Dhabi N M C Specialty 104 56 14 11 5 2 3 2 10 1
Abu Dhabi Medeor 24X7 47 25 3 3 1 7 8
Al Ain Oasis 99 38 13 4 20 4 20
Al Dhafrah Ruwais 48 34 4 3 4 3
Al Ain Medeor 24X7 International 32 16 3 2 4 3 4
Al Ain Specialized Medical Care 18 8 7 3
Abu Dhabi Gulf Diagnostic Center 8 7 1
Abu Dhabi National Hospital 22 16 2 2 2

Bed occupancy
Notes: Presented bed occupancy is for selected bed type
Optimal occupancy is 85% for normal beds and 75% for critical care beds
Source: 2016 Bed census -DOH Operation Centre
SEHA Other Optimal Occupancy
34
0%
25%
50%
75%
100%Special Care Baby Unit
0%
25%
50%
75%
100%
Jan Apr Jul Oct
Medical/ Surgical ICU
0%
25%
50%
75%
100%
Jan Apr Jul Oct
PICU:Pediatric ICU
0%
25%
50%
75%
100%NICU
0%
25%
50%
75%
100%LongTermCare -LTVU
0%
25%
50%
75%
100%
Jan Apr Jul Oct
Cardio Thoracic ICU
0%
25%
50%
75%
100%Burn Unit
0%
25%
50%
75%
100%Cardiac Care Unit
(CCU)
0%
25%
50%
75%
100%Isolation

Centres & clinics
Notes:
The tables above show the top 10 among facilities with more than 10 clinicians, the excel version includes a complete list of the centers and clinics www.doh.gov.ae/statistics2016
Some centers' Episodes were reported under the managing hospital
Includes estimates based on the number of clinicians and average productivity, and the inpatient episodes that relate to procedures carried out by center’ clinicians in hospitals.
Source: KEH-Cube 2017, Professionals licensing database; Extrapolation and Facility submissions 35
SEHA Other
Episodes Ph
ysic
ian
s
Den
tist
s
Nu
rses
AH
P&
Ph
arm
acis
ts
Episodes Ph
ysic
ian
s
Den
tist
s
Nu
rses
AH
P&
Ph
arm
acis
ts
Total 2'259'988 379 156 748 481 Total 7'218'710 2'370 1'424 4'419 1997
Abu Dhabi Abu Dhabi
Madinat Khalifa Healthcare Centre 109'040 24 5 25 18 Imperial College London Diabetes Centre 194'095 75 0 53 22
Baniyas Healthcare Center 104'821 15 3 22 8 Burjeel Medical Centre 107'876 22 5 19 5
Al Maqtaa Healthcare Center 90'111 23 4 31 18 Burjeel Medical Center Al Shamkha 92'329 13 3 22 4
Madinat Mohamed Bin Zayed Healthcare Centre 89'329 11 2 8 2 Oasis Medical Centre 78'795 7 1 5 1
Al Bahya Healthcare Centre 84'784 18 2 16 14 Medical Services Administration Of Abu Dhabi Police Ghq 77'399 116 29 181 130
Al Zafaranah Diagnostic & Screening Centre 82'706 13 1 23 8 Nmc Day Surgery Centre 76'577 21 4 54 18
Al Falah Healthcare Centre 57'425 7 1 8 10 Al Salama One Day Surgery Center 75'089 18 0 38 6
Al Bateen Healthcare Centre 57'285 12 1 19 5 Eastern Alahili Medical Center 71'510 6 1 7 1
Mafraq Dialysis Centre 49'568 1 0 80 3 Al Borg Diagnostic Centre For Laboratories 69'590 4 0 0 29
Al Rowda Healthcare Centre 48'088 10 0 16 4 Mediclinic Hospitals Almusafah Speciality 64'764 23 2 18 13
Other 420'094 74 75 167 183 Other 4'447'442 1'592 937 2'927 1291
Eastern Eastern
Oud Al Touba Diagnostic & Screening Centre 109'361 11 4 27 17 Gems Medical Clinic 8'725 5 1 5 0
Al Hili Healthcare Center 91'173 12 1 13 3 New Medical Centre Of Abu Dhabi 2 8'224 16 0 31 9
Mezyad Healthcare Center 87'109 12 1 11 7 Al Ain Alahili Medical Centre 8'148 3 1 6 0
Al Yahar Healthcare Centre 84'259 10 5 13 4 Burjeel Medical Centre Barari 8'116 17 1 17 5
Al Towayya Children'S Specialty Centre 77'125 7 2 9 3 Modern Center 8'048 3 1 5 0
Al Muweiji Healthcare Center 71'702 20 6 16 14 Bin Sulaiman Medical Centre 8'032 5 3 7 0
Neima Healthcare Centre 67'868 9 3 19 5 Ultra Medical Center 7'693 11 4 17 6
Al Maqam Healthcare Centre 53'169 11 3 14 7 Al Mamoon Medical Centre 7'621 6 5 34 6
Seha Dialysis Services – Tawam 49'088 0 0 73 1 New Al Ain Medical Clincs Center 7'621 4 2 7 0
Al Ain Dental Center 48'068 0 29 0 63 Mubarak Medical Center 7'621 7 2 9 3
Other 274'319 65 8 119 69 Other 1'458'422 396 422 931 420
Western Western
Al Dhafra Family Medicine Center 38'965 7 0 13 5 Aldhwaa Private School Clinic 43'335 0 0 2 0
Disease Prevention And Screening Center Gaiathy 3'811 2 0 0 4 Al Hakeem Optician 33'953 0 0 0 1
Sir Baniyas Clinic 3'811 2 0 2 0 Al Ittihad National Private School Clinic 33'233 0 0 2 0
Abu Al Abyad Clinic 1'905 1 0 1 0 Noor Al Qmar Glasses 24'426 0 0 0 1
Disease Prevention And Screening Center Madinat Zayed 1'905 1 0 0 6 Optic World 23'090 0 0 0 1
Beda Al Mutawa Clinic 1'905 1 0 2 0 Allied Dental Lab 22'756 0 0 0 1
Seha Dialysis Services – Al Marfa 1'194 0 0 1 0 Optic Zone Of Abu Dhabi 2 19'233 0 0 0 1
Tawam Privte Model School Clinic 16'939 0 0 1 0
Other 0 0 0 0 0 Palestine Private Academy Clinic 15'219 0 0 1 0
House Of Colours Nursery Clinic 9'772 0 0 1 0
Other 83'015 0 0 19 23

Blood banks
Source: Blood Banks, Health Statistics Analysis
SKMC
Tawam
36
Donors
Year 2017 2016 2015 2014 2013 2012 2011 2010 2009 2008 2007
SKMC
Donors 39'451 38'961 37'805 37'805 35'297 26'819 27'094 25'850 24'758 21'834 19'461
National 6'254 5'815 6'527 6'527 6'117 5'077 3'794 4'240 4'116 3'832 3'311
Expatriate 33'197 33'146 31'278 31'278 29'180 21'742 23'300 21'610 20'642 18'002 16'150
Units donated 31'980 36'143 34'543 32'630 30'315 26'819 27'094 25'850 24'758 22'379 19'849
O + 12'211 13'450 13'280 12'622 11'356 10'279 10'141 9'441 8'960 8'314 7'242
A + 8'064 9'433 8'520 7'890 7'448 6'705 6'704 6'620 1'430 5'840 5'263
B + 6'405 7'150 6'992 6'698 6'384 5'364 5'740 5'423 6'421 4'294 4'040
AB + 1'772 2'144 2'119 1'974 1'843 1'555 1'767 1'727 705 1'302 1'074
O - 1'845 2'122 1'948 1'799 1'688 1'501 1'310 1'274 5'130 1'346 1'101
A - 864 960 870 793 833 705 706 711 483 667 587
B - 705 714 669 715 624 576 575 521 1'493 501 426
AB - 114 170 145 139 139 134 151 133 136 115 116
Tawam
Donors 15'074 15'033 15'924 13'526
National 4'615 5'162 4'237 4'325
Expatriate 10'459 9'871 11'687 9'201
Units donated 15'074 15'033 13'099 13'520
O + 6'212 5'933 5'280 5'301
A + 3'674 3'789 3'157 3'490
B + 2'940 3'060 2'608 2'711
AB + 690 720 756 647
O - 835 760 657 697
A - 374 373 320 338
B - 300 325 266 278
AB - 49 73 55 58
3'832 4'116 4'240 3'794 5'077 5'747 6'117 6'527 5'815 6'254
18
'00
2
20
'64
2
21
'61
0
23
'30
0
21
'74
2
27
'31
2
29
'18
0
27
'31
2
33
'14
6
33
'19
72008 2009 2010 2011 2012 2013 2014 2015 2016 2017
National Expatriate
4'237 5'162 4'615
11
'68
7
9'8
71
10
'45
9
2015 2016 2017
National Expatriate
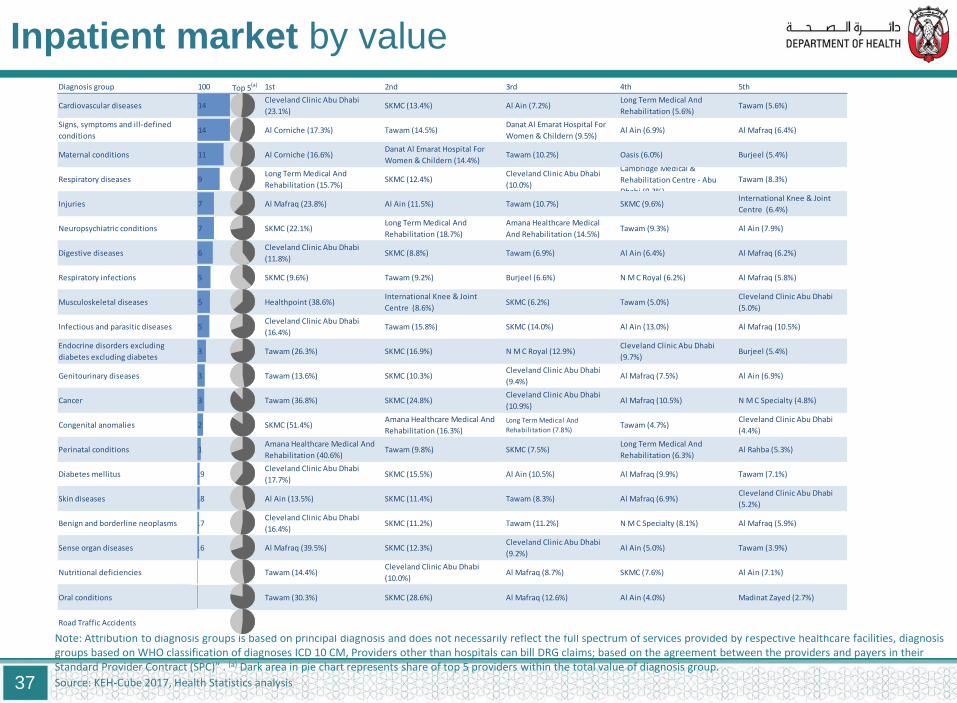
Inpatient market by value
Note: Attribution to diagnosis groups is based on principal diagnosis and does not necessarily reflect the full spectrum of services provided by respective healthcare facilities, diagnosis groups based on WHO classification of diagnoses ICD 10 CM, Providers other than hospitals can bill DRG claims; based on the agreement between the providers and payers in their Standard Provider Contract (SPC)” . (a) Dark area in pie chart represents share of top 5 providers within the total value of diagnosis group.
Source: KEH-Cube 2017, Health Statistics analysis 37
Diagnosis group 100 Top 5(a) 1st 2nd 3rd 4th 5th
Cardiovascular diseases 14Cleveland Clinic Abu Dhabi
(23.1%)SKMC (13.4%) Al Ain (7.2%)
Long Term Medical And
Rehabilitation (5.6%)Tawam (5.6%)
Signs, symptoms and ill-defined
conditions14 Al Corniche (17.3%) Tawam (14.5%)
Danat Al Emarat Hospital For
Women & Childern (9.5%)Al Ain (6.9%) Al Mafraq (6.4%)
Maternal conditions 11 Al Corniche (16.6%)Danat Al Emarat Hospital For
Women & Childern (14.4%)Tawam (10.2%) Oasis (6.0%) Burjeel (5.4%)
Respiratory diseases 9Long Term Medical And
Rehabilitation (15.7%)SKMC (12.4%)
Cleveland Clinic Abu Dhabi
(10.0%)
Cambridge Medical &
Rehabilitation Centre - Abu
Dhabi (9.3%)
Tawam (8.3%)
Injuries 7 Al Mafraq (23.8%) Al Ain (11.5%) Tawam (10.7%) SKMC (9.6%)International Knee & Joint
Centre (6.4%)
Neuropsychiatric conditions 7 SKMC (22.1%)Long Term Medical And
Rehabilitation (18.7%)
Amana Healthcare Medical
And Rehabilitation (14.5%)Tawam (9.3%) Al Ain (7.9%)
Digestive diseases 6Cleveland Clinic Abu Dhabi
(11.8%)SKMC (8.8%) Tawam (6.9%) Al Ain (6.4%) Al Mafraq (6.2%)
Respiratory infections 5 SKMC (9.6%) Tawam (9.2%) Burjeel (6.6%) N M C Royal (6.2%) Al Mafraq (5.8%)
Musculoskeletal diseases 5 Healthpoint (38.6%)International Knee & Joint
Centre (8.6%)SKMC (6.2%) Tawam (5.0%)
Cleveland Clinic Abu Dhabi
(5.0%)
Infectious and parasitic diseases 5Cleveland Clinic Abu Dhabi
(16.4%)Tawam (15.8%) SKMC (14.0%) Al Ain (13.0%) Al Mafraq (10.5%)
Endocrine disorders excluding
diabetes excluding diabetes3 Tawam (26.3%) SKMC (16.9%) N M C Royal (12.9%)
Cleveland Clinic Abu Dhabi
(9.7%)Burjeel (5.4%)
Genitourinary diseases 3 Tawam (13.6%) SKMC (10.3%)Cleveland Clinic Abu Dhabi
(9.4%)Al Mafraq (7.5%) Al Ain (6.9%)
Cancer 3 Tawam (36.8%) SKMC (24.8%)Cleveland Clinic Abu Dhabi
(10.9%)Al Mafraq (10.5%) N M C Specialty (4.8%)
Congenital anomalies 2 SKMC (51.4%)Amana Healthcare Medical And
Rehabilitation (16.3%)
Long Term Medical And
Rehabilitation (7.8%)Tawam (4.7%)
Cleveland Clinic Abu Dhabi
(4.4%)
Perinatal conditions 1Amana Healthcare Medical And
Rehabilitation (40.6%)Tawam (9.8%) SKMC (7.5%)
Long Term Medical And
Rehabilitation (6.3%)Al Rahba (5.3%)
Diabetes mellitus .9Cleveland Clinic Abu Dhabi
(17.7%)SKMC (15.5%) Al Ain (10.5%) Al Mafraq (9.9%) Tawam (7.1%)
Skin diseases .8 Al Ain (13.5%) SKMC (11.4%) Tawam (8.3%) Al Mafraq (6.9%)Cleveland Clinic Abu Dhabi
(5.2%)
Benign and borderline neoplasms .7Cleveland Clinic Abu Dhabi
(16.4%)SKMC (11.2%) Tawam (11.2%) N M C Specialty (8.1%) Al Mafraq (5.9%)
Sense organ diseases .6 Al Mafraq (39.5%) SKMC (12.3%)Cleveland Clinic Abu Dhabi
(9.2%)Al Ain (5.0%) Tawam (3.9%)
Nutritional deficiencies Tawam (14.4%)Cleveland Clinic Abu Dhabi
(10.0%)Al Mafraq (8.7%) SKMC (7.6%) Al Ain (7.1%)
Oral conditions Tawam (30.3%) SKMC (28.6%) Al Mafraq (12.6%) Al Ain (4.0%) Madinat Zayed (2.7%)
Road Traffic Accidents

Outpatient market by value
Source: KEH-Cube 2017; Health Statistics analysis; diagnosis groups based on WHO classification of diagnoses ICD 10 CM
Notes
- (a) Dark area in pie chart represents share
of top 5 providers within the total value
of diagnosis group
- Drugs and diagnostic centers are excluded
- Attribution to diagnosis groups is based
on principal diagnosis and does not
necessarily reflect the full spectrum of
services provided by respective
healthcare facilities.
- (b) Road Traffic Accidents related injuries
- RTA related injuries needs to interpreted with caution due to the possible miscoding of the External Cause of injury
38
Diagnosis group 100 Top 5 (a) 1st 2nd 3rd 4th 5th
Signs, symptoms and ill-defined
conditions17 Cleveland Clinic Abu Dhabi (6.6%) Fakih Ivf Fertility Center (5.3%) Tawam (4.9%) Burjeel (4.1%)
Health Plus Fertilty Center Abu Dhabi
(4.0%)
Oral conditions 11 Healthpoint (4.6%) Al Ain Dental Center (4.3%) Al Mafraq Dental Center (2.3%) Al Bustan Medical Center (2.3%) Burjeel (2.1%)
Musculoskeletal diseases 11 Healthpoint (11.4%) Burjeel (5.2%) Tawam (3.2%) Cleveland Clinic Abu Dhabi (3.2%) Al Ain (2.8%)
Genitourinary diseases 8Seha Dialysis Services – Tawam
(7.5%)Mafraq Dialysis Centre (7.5%)
Seha Dialysis Services – Sheikh
Khalifa Medical City (6.2%)Burjeel (4.3%) Tawam (2.6%)
Diabetes mellitus 7Imperial College London Diabetes
Centre (23.8%)
Imperial College London Diabetes
Centre (12.3%)
Imperial College London
Diabetes Centre (4.8%)
Imperial College London Diabetes
Centre (3.1%)Cleveland Clinic Abu Dhabi (2.6%)
Respiratory infections 6 Burjeel (3.5%) Al Noor-Airport road (2.9%) Universal (2.9%) N M C Royal (2.7%) Tawam (2.5%)
Sense organ diseases 5 Cleveland Clinic Abu Dhabi (11.7%)Samaya Specialized Center SscLaser &
Day Care Surgery (8.0%)Burjeel (6.5%)
Magrhabi Eye & Ear Center
Daycare Surgeries (5.5%)Al Mafraq (5.0%)
Neuropsychiatric conditions 5 Tawam (6.8%) Cleveland Clinic Abu Dhabi (5.8%) Al Ain (5.3%) SKMC (5.2%) Mf2073 (4.1%)
Cardiovascular diseases 4 Cleveland Clinic Abu Dhabi (8.0%) SKMC (6.2%) Al Noor-Airport road (4.5%) Burjeel (4.0%) N M C Specialty (3.9%)
Digestive diseases 4 Cleveland Clinic Abu Dhabi (9.9%) Tawam (4.6%) Burjeel (4.4%) N M C Royal (3.9%) SKMC (3.9%)
Respiratory diseases 4 Canadian Care Medical Center (6.0%) Cleveland Clinic Abu Dhabi (5.5%) SKMC (4.7%) Al Noor-Airport road (4.4%) Tawam (3.0%)
Endocrine disorders excluding
diabetes excluding diabetes4
Imperial College London Diabetes
Centre (13.6%)
Imperial College London Diabetes
Centre (7.3%)
Cleveland Clinic Abu Dhabi
(6.6%)SKMC (5.2%) Tawam (4.6%)
Maternal conditions 3 Al Corniche (12.2%)Danat Al Emarat Hospital For Women
& Childern (10.5%)Tawam (6.7%) Oasis (5.3%) Burjeel (5.0%)
Injuries 3 Al Mafraq (6.7%) Al Ain (6.0%) SKMC (5.1%) Tawam (5.1%) Burjeel (4.3%)
Skin diseases 3 Cleveland Clinic Abu Dhabi (4.4%) Al Hili Healthcare Center (4.0%) N M C Specialty (4.0%) SKMC (3.9%) Burjeel (3.9%)
Nutritional deficiencies 2Imperial College London Diabetes
Centre (23.1%)
Imperial College London Diabetes
Centre (15.6%)
Cleveland Clinic Abu Dhabi
(4.6%)SKMC (3.6%)
Imperial College London Diabetes
Centre (2.5%)
Infectious and parasitic diseases 1 Burjeel (5.1%) SKMC (3.7%) Tawam (3.3%) Cleveland Clinic Abu Dhabi (3.2%) Al Noor-Airport road (3.2%)
Cancer 1 Tawam (27.1%)Tawam Molecular Imaging Center
(10.1%)
Gulf International Cancer
Center (9.6%)SKMC (9.4%) Al Mafraq (6.4%)
Congenital anomalies 1 SKMC (22.8%) Tawam (13.9%)Cleveland Clinic Abu Dhabi
(5.7%)The Heart Medical Center (4.8%) Manzil Home Health Services (4.5%)
Benign and borderline neoplasms 1 Cleveland Clinic Abu Dhabi (12.8%) Tawam (7.4%) SKMC (6.3%) Burjeel (6.2%) Healthpoint (5.6%)
Perinatal conditions Tawam (7.7%) Danat Al Emarat Hospital For Women & Childern (7.3%)Berlin Medical & Neurological Rehabilitation (6.7%)SKMC (4.5%)

Population
Providers Payers Claims
Financing Episodes
39
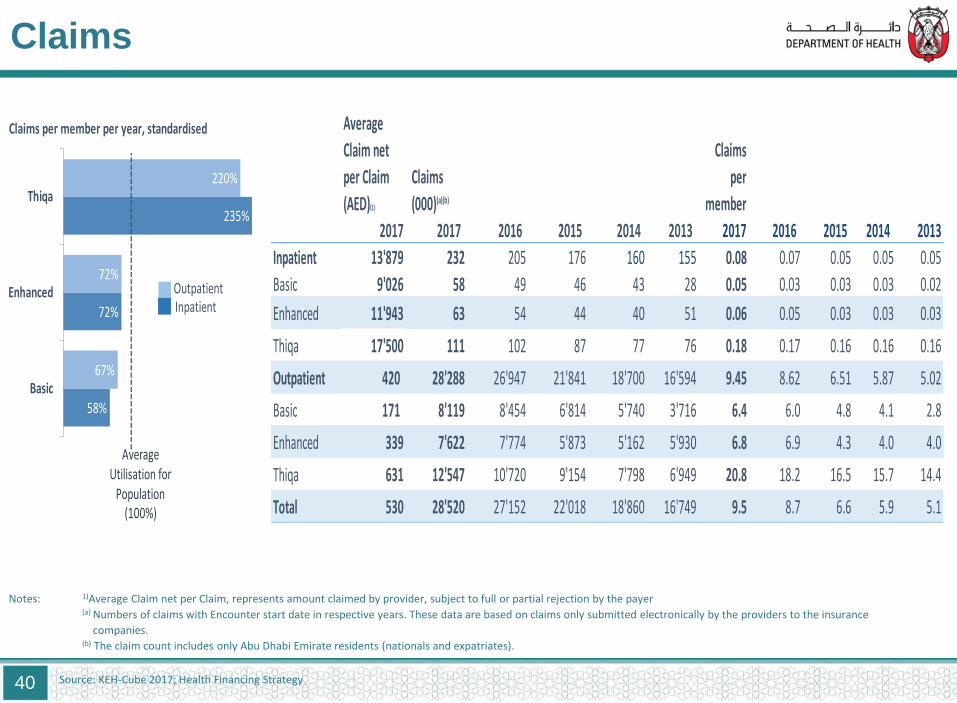
Claims
Notes: 1)Average Claim net per Claim, represents amount claimed by provider, subject to full or partial rejection by the payer (a) Numbers of claims with Encounter start date in respective years. These data are based on claims only submitted electronically by the providers to the insurance
companies.
(b) The claim count includes only Abu Dhabi Emirate residents (nationals and expatriates).
Source: KEH-Cube 2017; Health Financing Strategy 40
Average
Claim net
per Claim
(AED)(1)
Claims
(000)(a)(b)
Claims
per
member
2017 2017 2016 2015 2014 2013 2017 2016 2015 2014 2013
Inpatient 13'879 232 205 176 160 155 0.08 0.07 0.05 0.05 0.05
Basic 9'026 58 49 46 43 28 0.05 0.03 0.03 0.03 0.02
Enhanced 11'943 63 54 44 40 51 0.06 0.05 0.03 0.03 0.03
Thiqa 17'500 111 102 87 77 76 0.18 0.17 0.16 0.16 0.16
Outpatient 420 28'288 26'947 21'841 18'700 16'594 9.45 8.62 6.51 5.87 5.02
Basic 171 8'119 8'454 6'814 5'740 3'716 6.4 6.0 4.8 4.1 2.8
Enhanced 339 7'622 7'774 5'873 5'162 5'930 6.8 6.9 4.3 4.0 4.0
Thiqa 631 12'547 10'720 9'154 7'798 6'949 20.8 18.2 16.5 15.7 14.4
Total 530 28'520 27'152 22'018 18'860 16'749 9.5 8.7 6.6 5.9 5.1
Claims per member per year, standardised
58%
72%
235%
67%
72%
220%
Basic
Enhanced
Thiqa
Average Utilisation for
Population(100%)
OutpatientInpatient

Population
Providers Payers Claims
Financing Episodes
41

Payer members
Definitions: The Basic Product: for expats with limited income in accordance with the threshold set by the Regulations and dependents of non- Nationals who are not eligible to be covered by the expats employment based insurance.
The Enhanced Products: for expats above the income threshold set by the Regulations for the Basic Product.
Notes: (a) Average Premium per contract, more than 1 contract per member was noted which causes higher contracts count compared to members.
(b) Market share applies to Enhanced products, most of the payers reported Enhanced members from other Emirates were excluded in 2014- 2017 to reflect Abu Dhabi members .
(c) The 2015, 2016 and 2017 member count included Abu Dhabi residents only from both nationals and expatriates, 2017 count of Contracts is based on active contracts at the end of the year 31st December 2017
Source: KEH-Cube 2017; Health Financing Strategy 42
Abu Dhabi Residents
Members
Market Share(a) 2017(c) 2016 2015 2014 2013 2012 2011 2010
Change from
2016-2017
Contracts
2017
Average
Premium 2017(c)
Total 2'994'603 3'125'912 3'356'804 3'185'523 3'307'365 3'163'795 2'812'307 2'671'391 -131'309 3'480'043
Thiqa 603'511 587'592 554'786 497'511 482'452 457'845 448'143 422'239 15'919 616'948
Basic 1'274'785 1'406'200 1'421'899 1'386'448 1'335'680 1'341'405 1'306'931 1'204'418 -131'415 1'355'753 860
Total Enhanced 100.0% 1'116'307 1'132'120 1'380'119 1'301'564 1'489'233 1'364'545 1'057'233 1'044'734 -15'813 1'507'342 5'220
Daman 49.6% 553'297 543'666 522'022 551'468 596'056 457'637 324'083 299'089 9'631 864'176 5'918
ADNIC 7.1% 79'428 27'904 34'938 79'958 130'674 141'486 149'904 151'654 51'524 114'651 10'179
National Life Insurance 7.0% 78'142 36'917 12'224 41'225 80'888 3'173
Al Dhafra 3.9% 43'821 96'198 174'122 136'005 159'353 192'635 71'009 12'590 -52'377 44'828 904
RAK 3.0% 33'392 10'248 20'196 13'484 11'228 8'331 8'966 10'508 23'144 33'523 1'421
Union 2.9% 32'393 43'519 37'509 21'118 3'882 4'092 1'344 -11'126 40'684 1'426
Oman 2.6% 29'032 57'177 42'601 118'703 142'373 167'933 73'423 171'478 -28'145 35'312 4'498
Al Hilal Takaful 2.2% 24'210 24'765 80'518 37'152 33'147 26'809 20'964 11'075 -555 25'234 1'812
Al Khazna 2.0% 22'827 20'441 23'123 17'933 19'877 20'039 11'532 78'147 2'386 26'713 4'615
Watania Insurance 1.9% 21'025 20'296 26'055 729 21'065 2'362
Insurance House - PSC 1.7% 19'278 16'163 27'536 13'458 32'007 25'834 3'115 19'439 2'428
ALICO 1.6% 18'331 35'747 67'811 26'339 13'161 11'350 8'566 10'384 -17'416 24'838 4'907
EIC 1.6% 18'213 29'383 22'223 21'378 20'091 20'849 29'691 17'721 -11'170 19'234 2'783
Orient 1.6% 17'769 29'098 43'538 30'424 41'257 34'580 30'476 26'742 -11'329 18'240 4'079
Takaful Emarat 1.4% 15'566 13'254 19'419 8'115 28'795 25'365 316 1'600 2'312 15'694 1'584
Al Sagr 1.4% 15'353 9'835 22'850 13'542 18'938 19'741 15'327 5'518 17'720 2'404
Abu Dhabi Takaful 1.4% 15'104 16'209 30'032 13'864 16'304 14'086 22'233 1'131 -1'105 16'525 4'342
AXA 1.1% 12'772 20'536 44'556 41'691 13'281 11'938 22'532 886 -7'764 14'115 5'732
NoorTakaful 1.1% 12'660 11'353 4'095 9'040 5'828 5'376 1'625 2'094 1'307 12'660 2'137
Al Ain Ahlia 0.8% 9'141 9'009 11'175 9'191 12'049 8'441 4'154 24'419 132 9'447 7'059
Arabian Scandinavian 0.6% 6'157 4'831 2'858 7'379 4'730 4'496 26 29 1'326 6'297 1'537
Zurich 0.4% 4'880 8'233 3'302
Alliance 0.4% 4'747 634 693 2'512 2'546 2'266 463 14'822 4'113 4'750 1'370
Qatar 0.4% 4'197 17'336 30'652 11'359 7'293 7'691 11'569 6'305 -13'139 4'229 3'356
Saudi Arabian 0.3% 3'434 6'934 10'298 10'394 3'408 3'656 2'602 -3'500 3'531 7'302
Al Buhaira 0.3% 3'121 1'007 4'866 18'382 40'842 30'479 61'983 49'838 2'114 3'570 3'179
United 0.3% 3'049 5'641 4'619 4'694 12'736 9'409 4'012 825 -2'592 3'092 4'499
NGI 0.2% 2'639 2'347 481 957 1'462 957 1'026 2'798 292 2'646 1'290
Aman 0.2% 2'064 2'909 3'602 2'345 4'956 4'663 4'595 286 -845 2'671 3'156
Dubai Insurance Co. 0.2% 1'881 2'218 1'918 2'710 1'843 1'547 337 170 -337 3'837 5'314
Al-Ittihad 0.1% 1'627 867 2'201 3'197 4'355 4'292 3'588 760 1'632 3'653
Dar Al Takaful Insurance 0.1% 1'122 1'678 3'088 -556 1'137 2'512
Mediterranean and Gulf Insurance 0.1% 1'121 2'018 7'651
Dubai National 0.1% 1'011 780 7'107 758 193 65 231 1'026 9'334
Jordan Insurance 0.1% 898 624 27 274 924 6'314
Salama 0.1% 873 795 1'769 1'679 1'735 1'508 688 622 78 992 6'678
Methaq Takaful 0.0% 477 5'772 843 103 517 386 20'659 17'002 -5'295 499 5'919
Green Crescent 0.0% 365 1'252 5'575 15'898 26'593 24'969 43'894 70'881 -887 367 8'093
Al Fujairah 0.0% 323 41 3'473 6'910 7'584 5'676 4'099 282 323 4'941
Arabia 0.0% 303 629 343 1'709 4'867 4'660 1'660 1'076 -326 305 5'005
Al Wathba 0.0% 201 3'637 28'731 33'738 57'760 52'140 52'034 48'038 -3'436 202 6'915
Royal and Sun Alliance 0.0% 63 470 2'452 3'069 2'133 1'560 946 1'381 -407 75 10'075
Non Abu Dhabi Residents 2017
Thiqa 238'025
Enhanced 380'455
Suplemental Products 2017
Thiqa TopUp 100'169
Enhanced Upgrade 2'564
International Visitors 41'302

Payer claims
Definitions: The Basic Product: for expats with limited income in accordance with the threshold set by the Regulations and dependents of non- Nationals who are not eligible to be covered by the expats employment based insurance.
The Enhanced Products: for expats above the income threshold set by the Regulations for the Basic Product.
Notes: (a) Claim net represents amount claimed by provider, subject to full or partial rejection by the payer. (b) Days to Remit is measured as “average number of days to submit AED 1 from first Claim Submission Date to first Remittance Date”.
(c) The claim count includes only Abu Dhabi Emirate residents (nationals and expatriates).
Source: KEH-Cube 2017; Health Financing Strategy 43
ClaimNet (a)Claim Count
2017 (c) 2016 2015 2014 2013 2012
Change from
2016-2017
Days to Remit
2017 (b)
Average ClaimNet
per Claim 2017
Claims per
Member 2017
Total 28'565'080 27'165'992 22'088'070 19'043'412 17'782'905 19'697'798 1'399'088 67 530 9.5
Thiqa 12'669'134 10'821'820 9'241'034 7'875'644 7'024'912 7'172'991 1'847'314 70 779 21
Basic 8'181'017 8'502'200 6'860'002 5'783'124 3'743'442 5'003'845 -321'183 49 234 6.4
Total Enhanced 100.0% 7'714'929 7'841'972 5'987'034 5'384'644 7'014'551 7'520'962 -127'043 70 434 6.9
Daman 66.0% 4'660'510 4'889'458 4'216'773 3'405'916 4'090'029 2'252'887 -228'948 60 474 8.4
ADNIC 8.6% 663'799 547'638 429'766 908'067 1'058'255 1'222'810 116'161 53 433 8.4
Oman 3.9% 290'345 290'324 355'103 491'444 551'458 562'436 21 48 450 10.0
National Life Insurance 2.6% 263'326 137'889 15'753 1 125'437 103 324 3.4
Al Hilal Takaful 1.8% 205'457 287'371 85'519 31'844 138'692 361'405 -81'914 120 300 8.5
ArabOrient 1.8% 135'000 159'631 126'776 92'588 74'212 199'362 -24'631 71 443 7.6
Saudi Arabian 1.7% 100'621 109'225 79'940 70'883 56'061 217'453 -8'604 96 552 29
Qatar 1.5% 127'971 102'643 15'249 4'692 67'303 128'935 25'328 89 389 30
Al Ain Ahlia 1.2% 96'377 50'748 12'575 10'074 61'529 61'549 45'629 71 428 10.5
EIC 1.2% 123'073 90'135 17'557 5'984 108'924 55'824 32'938 77 335 6.8
Insurance House - PSC 1.2% 106'471 94'892 26'821 12'877 119'361 182'950 11'579 111 387 5.5
Abu Dhabi Takaful 1.1% 106'247 93'857 16'435 5'996 58'967 405'007 12'390 81 356 7.0
Union 1.0% 137'779 118'479 82'763 21'324 7'622 87'894 19'300 110 236 4.3
Watania 0.9% 103'490 66'827 29'275 6'452 40'763 112'711 36'663 89 292 4.9
Al Dhafra 0.8% 101'659 143'352 50'484 1'199 159 118'810 -41'693 129 272 2.3
Al Khazna 0.8% 94'824 165'850 73'699 45'621 35'942 128'679 -71'026 106 283 4.2
RAK 0.5% 69'085 35'617 11'064 6'642 51'362 33'468 116 264 2.1
Al Sagr 0.5% 51'630 50'017 50'303 31'844 34'561 224'897 1'613 114 309 3.4
Takaful Emarat 0.4% 46'630 73'868 29'501 7'459 46'244 129'503 -27'238 62 272 3.0
NoorTakaful 0.3% 29'808 24'592 8'871 23'002 20'762 55'980 5'216 81 355 2.4
Dubai Insurance Co. 0.3% 22'480 24'911 30'213 16'917 9'275 98'569 -2'431 50 431 12.0
NGI 0.3% 32'091 42'176 2'498 8'949 9'272 33'881 -10'085 61 261 12.2
Lebanese 0.2% 16'362 3 360 153 14'318 16'359 53 497 3.4
Arabian Scandinavian 0.2% 25'706 12'097 16'786 9'092 12'183 49'575 13'609 63 239 4.2
Methaq Takaful 0.1% 13'454 8'128 3'075 2'360 3'582 20'679 5'326 94 372 28
United 0.1% 16'439 8'497 2'285 1'579 1'236 7'134 7'942 67 301 5.4
Al Buhaira 0.1% 10'921 11'110 6'759 2'703 1'073 -189 121 451 3.5
Salama 0.1% 7'666 6'186 4'199 3'263 2'426 137'486 1'480 107 504 8.8
Al Wathba 0.1% 8'807 124'632 111'120 50'991 212'637 5'110 -115'825 178 365 44
Aman 0.1% 9'014 12'346 7'384 3'200 42'656 96'501 -3'332 175 326 4.4
Al-Ittihad 0.1% 6'142 6'143 4'332 2'961 12'020 228'045 75 462 3.8
Dubai National 0.1% 5'817 3'460 10'385 1'539 651 32'147 2'357 85 453 5.8
JIC 0.1% 5'709 3'089 1'116 69 28'622 2'620 84 426 6.4
Alliance 0.1% 7'248 3'008 6'598 10'556 9'510 123 4'240 77 235 1.5
Green Crescent 0.0% 3'916 11'378 20'420 55'232 38'706 8'739 -7'462 84 416 10.7
Arabia 0.0% 3'232 2'817 3'554 12'724 16'402 46'693 415 113 487 10.7
DAT 0.0% 4'019 11'186 4'445 272 15'475 -7'167 114 318 3.6
Royal and Sun Alliance 0.0% 1'009 16'817 13'257 13'286 10'370 96'126 -15'808 49 635 16.0
Medgulf 0.0% 470 - 736 0.4
ALICO 0.0% 168 290 317 194 93 -122 100 344 0.0
Al Fujairah 0.0% 149 1'266 4'020 4'470 5'062 13'455 -1'117 102 294 0.5
AXA 0.0% 8 19 44 18 8 11'366 50 4'819 0.0

Population
Providers Payers Claims
Financing Episodes
44

Number of Contracts 2016
Number of Contracts 2017
Enhanced plans premiums
Source: KEH-Cube 2017 and Products Search Engine Database; Health Financing Strategy
Definitions: The Basic Product: for expats with limited income in accordance with the threshold set by the Regulations and dependents of non- Nationals who are not eligible to be covered by the expats employment based insurance.
The Enhanced Products: for expats above the income threshold set by the Regulations for the Basic Product.
Notes: This data is only for Enhanced products reflecting current market status of insurance premiums and include Abu Dhabi residents only
2017 count of contracts is based on active contracts at the end of the year 31st December 2017
Ave
rage
Gro
ss P
rem
ium
45
Ave
rage
Gro
ss P
rem
ium

Basic plans premiums
Source: KEH-Cube 2017 and Products Search Engine Database; Health Financing Strategy
Definitions: The Basic Product: for expats with limited income in accordance with the threshold set by the Regulations and dependents of non- Nationals who are not eligible to be covered by the expats employment based insurance.
Notes: This data is only for Basic product reflecting current market status of insurance premiums and include Abu Dhabi residents only
2017 count of Contracts is based on active contracts at the end of the year 31st December 2017
Ave
rage
Gro
ss P
rem
ium
fo
r B
asic
Pro
du
ct
Number of Contracts
46

47
Enhanced plans limits by category
Notes: This data is only for Enhanced products
About 7% of the Enhanced plans contracts are excluded due to non compliance with reporting of benefits information
2017 count of contracts is based on active contracts at the end of the year 31st December 2017
(a) “Other” include other not listed percentages of coverage such as 60%, 70% and 85%
Source: KEH-Cube 2017and Products Search Engine Database; Health Financing Strategy Analysis
Mem
ber
%Coverage
Outside Network
100% Coverage6%
50% Coverage14%
80% Coverage32%
(a)Other 3%
GeographicCoverage
+ Home Country35%
+ International 39%
+ Other Emirates In/Outpatient20% of total
members
+ Other Emirates Emergency 7%
250'000 AED 33% of total
members
500'000 AED 32%
300,00 AED17%
Other 12%
Annual Limit AED
1'000'000 AED 5%
0% Coverage 45% of total
members