ABSTRACT whis.guide is intended to ... - files.eric.ed.gov · 41!. A. are a waste of both the...
21
DOCUMENT RESUME ID 178 332 SI 029 262 AUTHOR Schlenker, Richard M.; Perry, Constance N. TITLE A Writing Guide fer Stu'dent-Oceanography Laboratory and Field Research Reports. PUB DATE Oct 79 NOTE 2-1p. EDRS PRICE MF01/PCO1 Plus Postage. DESCRIFIORS Composition. Skills (Literary) ; Earth Science; *Environmint; Expository Writing; Language Arts; *Oceanology); *Scientific Literacy; *Technical Writing; *Writing; Writing Skills ABSTRACT whis.guide is intended to improve the writing and -composition skills of oceanography Students but it may te applied to other written scientific co um mpcsitions. Discussed is the dccónting i of laboratory and 'field nvestigations during the activity. A suggested format for the research reptrt is.presented with discubsions of each secticn. A segment is devoted to rtips for writing a good report. Sample short reports are included in the guide. (RE) 411 * Repro4uctions supplied by EDRS are the hest that can be made * * . from the original document. * ***********************************************************************
Transcript of ABSTRACT whis.guide is intended to ... - files.eric.ed.gov · 41!. A. are a waste of both the...

DOCUMENT RESUME
ID 178 332 SI 029 262
AUTHOR Schlenker, Richard M.; Perry, Constance N.TITLE A Writing Guide fer Stu'dent-Oceanography Laboratory
and Field Research Reports.PUB DATE Oct 79NOTE 2-1p.
EDRS PRICE MF01/PCO1 Plus Postage.DESCRIFIORS Composition. Skills (Literary) ; Earth Science;
*Environmint; Expository Writing; Language Arts;*Oceanology); *Scientific Literacy; *TechnicalWriting; *Writing; Writing Skills
ABSTRACTwhis.guide is intended to improve the writing and
-composition skills of oceanography Students but it may te applied toother written scientific co ummpcsitions. Discussed is the dccónting
iof laboratory and 'field nvestigations during the activity. Asuggested format for the research reptrt is.presented withdiscubsions of each secticn. A segment is devoted to rtips for writinga good report. Sample short reports are included in the guide.(RE)
411
* Repro4uctions supplied by EDRS are the hest that can be made ** . from the original document. ************************************************************************
t
.4
. A IIRIPANG GUIDE FOR STUDENT'OCEANOGRAPHY
LABORATORY AND FIELD RESEARCH REPORTS
S DEPARTMENT OF HEALTH,EDUCATION &WELFARENATIONAL INSTITUTE OF
EDUCATION
THiS DOCUMENT HAS BEEN REPRO-DUCED E *ACT'. v AS RECEIVED FROMTHE PERSON OR ORGANIZATION ORIGIN-ATING IT POINTS OF vIEwOOPNJONSSTATED 00 NOT NECESSARIL Y REPRE-SENT OF F IC IAL NATIONAL INSTITuTEEDUCATION Fri T(ON OR poi ICY
"PERMMSION TO REMIDOUCE THISMKrERIAL HAS 'BEEN GRAMED BY
%Char& 5/4491*.ee
TO THE EDUCATIONAL RESOURCESINFORMATION CENTER (ERIC)."
Richard M..SchlenkerDepartment of Arts & Sciences
Maine Maritime AcademyCastine, Maine 04421
NZ, &.
Constance M..PerryCollege of Education
5:11University of Maine
N.) Orono, Maine 04473
/-114October 1979
4 4
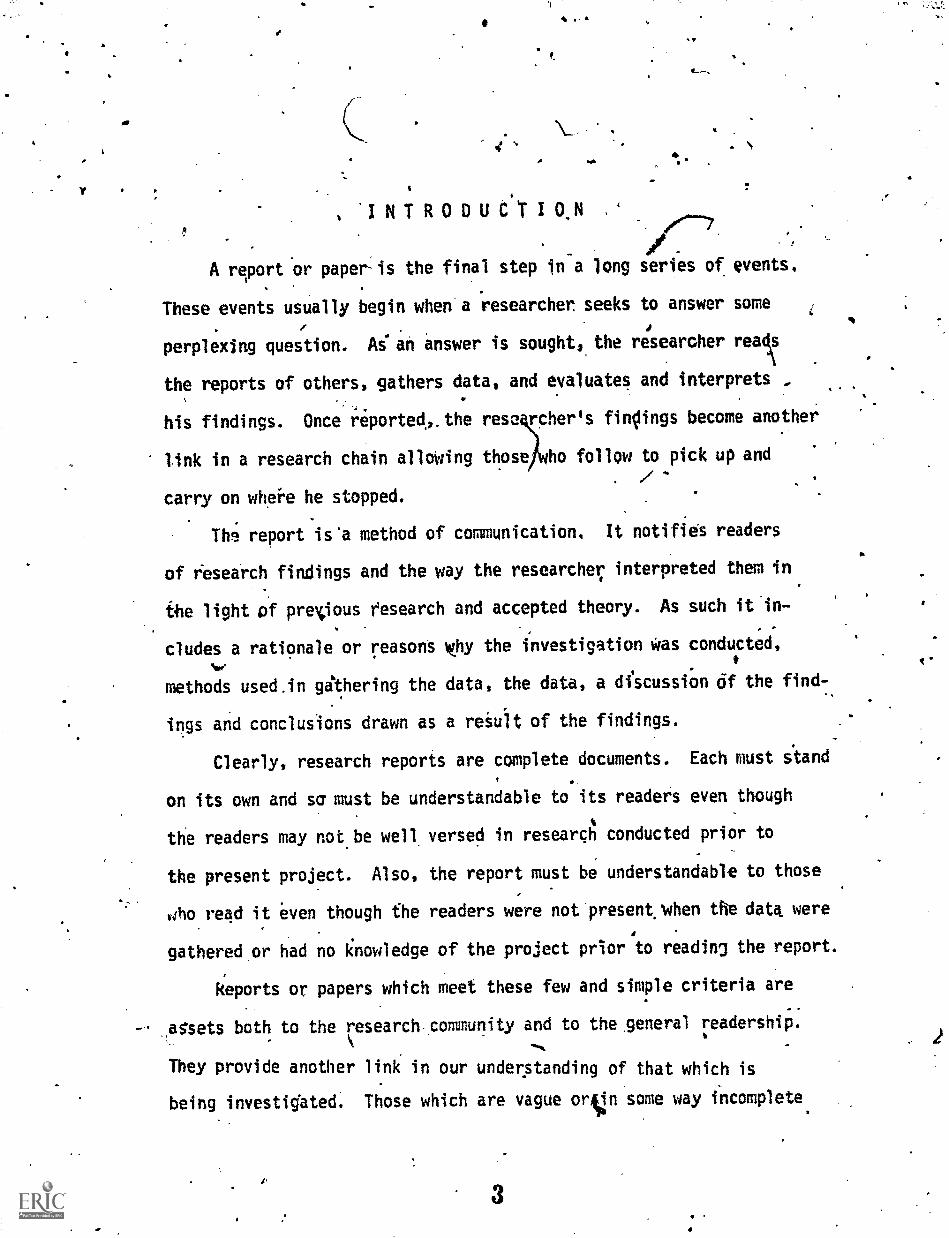
INTRODUCTIQN
A report or paper-is the final step in a long series of events.
These events usually begin when a researcher seeks to answer some
. / ..
perplexing question. Ai" an answer is sought, the researcher reals
the reports of others, gathers data, and evaluates and interprets ,
..
his findings. Once reported.the rese rcher's finOings become another
link in a research chain allowing thosed)14
ho follow to pick up and
.c " .
carry on whei-e he stopped.
Th e! report is'a method of communication. It notifies readers
of r'esearch findings and the way the researcher interpreted them in
ihe light of previous research and accepted theory. As such it in-
cludes a rationale or reasons why the investigation was conducted,
methods used.in githering the data, the data, a dfscussion of the find-.
ings and conclusions drawn as a reSult of the findings.
Clearly, research reports are complete documents. Each must s'tand
on its own and sa must be understandable to its readers even though
the readers may not be well versed in researgA conducted prior to
the present project. Also, the report must be understandable to those
aho read it iven though fhe readers were not present;when the data were
gathered or had no knowledge of the project prior to readin3 the report.
Reports or papers which meet these few and simple criteria are
asets both to the research community and to the general readership.
They provide another link in our understanding of that which is
being investigated. Those which are vague orsIn some way incomplete

41!.
A
.are a waste of both the writer's and the reader's time.. As a research
report writer, therefore, you-must always itrive for excellence.
.PURPOSE. or THE GUIDE
Generally, science contenf CoUrSes include a weekly laboratory:
session. During laboratory sessions students cOnduct'experiments
chosen to support and.to amplify important conceptual inateridl. pre-.
sented in lecture "sessions.
A maAor portion of each experiment is the data-gathering phase.4
The data which amgathered become points of.departure and theoreti- .
cally,lead students to generalizations supporting letturematerial.,
Once integrated, laboratory,generalizations and lecture nipterial pro- .
vide a more well-rounded picture of a stibject than'is possible if
either were conducted in isolation. However, recent evidetice.oulpests- .
this schema to be idealistic. In reality many students,, especiaTly,
when required only to answer a few brief questions about laboratory'
exercises show little if anylearning gain from laboratory exper -
iences.
Additional problems seem to surface when students spend )1taily ,m
laboratory sessionsitreating experiments superficially. Students
show inability to manipulate data, interpret.data, use library and
other reference sources, draw conclusions based upon observations,
present data in 'graphic formats-, and paramount of all; inability to
express themselves in writing. Yet, such skills.are all objectives .
4

3
. of a laboratcry'program.
_Many of these deficiencies, however, are greatly reduced and the
.cl
siudent's.exPvrtfse concomitantly increased when a formal research
report qlust be written following the completion of each laboratory
activity.
This guide was specifically written for. use by. Oceanography stu-
dents but its p/inciOes may be applied to all )aboratory and fieldj.
investigations.
CONDUCT OF LABORATORY AND FIELD INiESTIGATIONS
Periods of time spent in field and laboratory investigations
generally are devoted to equipment setup rd data gathering. It is
important that investigators be able to review these periods after
they are over. Field notebooks are kept specifjcally for thii pun:
pose.
Field notebooks aretas the name suggests, notebooks used in
either the field or laboratory: They are a hand-written collect-ion
of qotes,taken'at the moment observations are made. They should
include all information relevant to an investigation or whi6 might
have some bearing upon an investigation's outcome. For example, a
section iovering a specific field or laboratory data gathering ses-
,
sion might incrude the date; tiffe of day observations were made,
weather conditions at the time 1;,f the.observations (temperature,
height of the tide, cloud cover, sea conditions); equipment employed
in data gathering tasks; how the equipment was employed (ske*hes
0
5
Nova

4
of equipment setups), numbers and names of people engaged in the in-.
vestigation and the actual data which were collected during the ses-.
sion. Field notebooks shouldinot be written'at some time atter the
data gathering has concluded. Recollections of the past are often
vague, lacking the crisp details of the present.
The .information contained'in the field.notebook becomes the
basis for the majority 6f the investigator's field or laboratory 14-
search report.. P6Orl9. or inadeouatqly kept field notebooks necessar-
ily lead to poor or inadequate final reports.4
RESEARCH REPORT FORMAT
Research reports shodld contain at least.the following sections.
Each section of each report should be preceeded by its respective
heading.
TITLE: The title must be comprehensive, and 'reflect the con-
tents of the report. This is the first item seen by a proSpective
reader (except when an abstract is included see below); and that
part which tells the reader whether from his or her p6spective the
report should be read.
INTRODUCTION: This section includes a rationale for the inti-gation (why was the research undertaken, what question or questians
were to be answered, or what problem wis to be solved), the history
of the problem or question (what have other researchers found ift this
area - is there an accepted theory to .be substantiated or disproved),'.
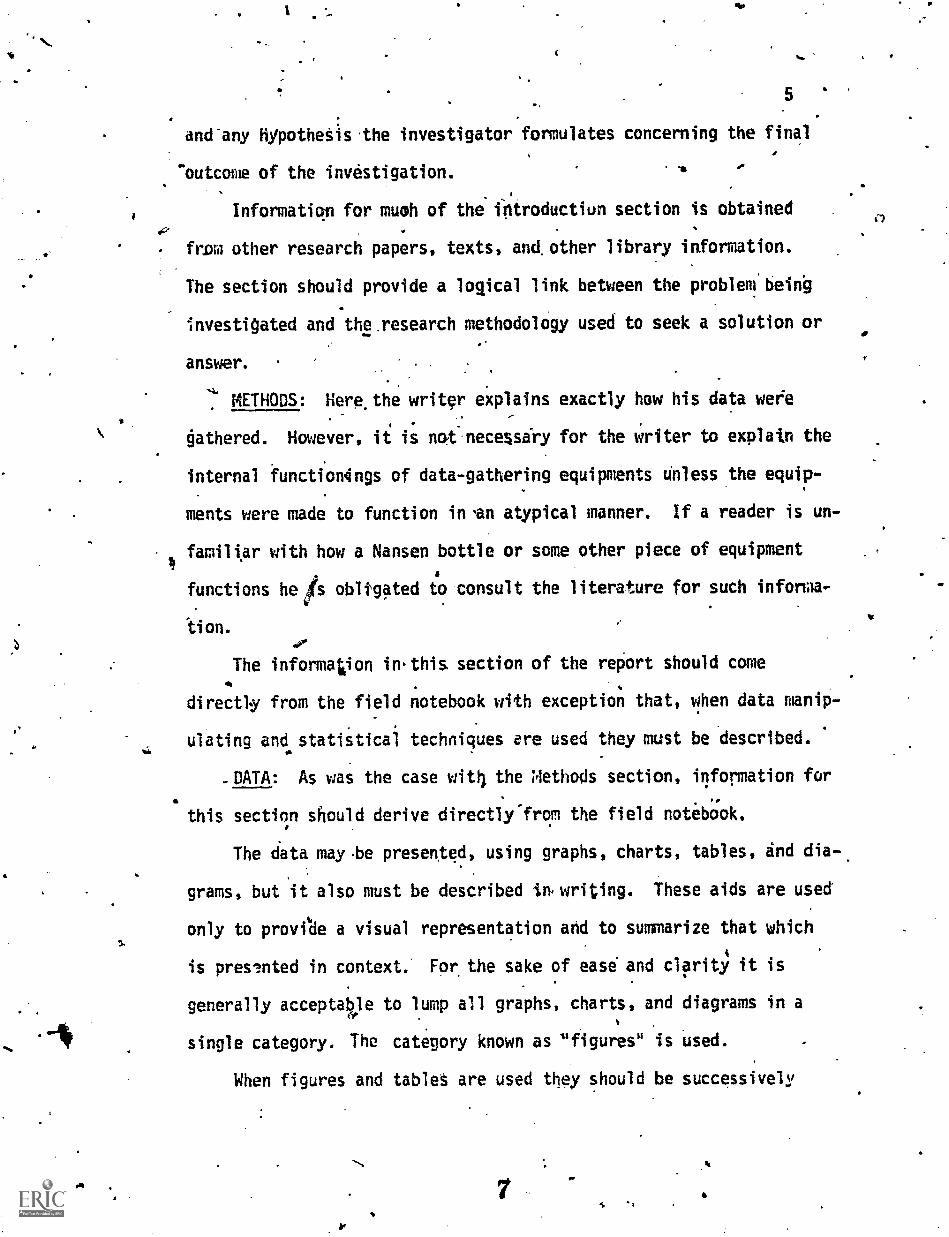
and-any hypothetis.the investigator formulates concerning the final
"outcome of the investigation. 11,
Information for muoh of the fotroductiun section is obtained
from other research papers, texts, and, other library information.
The section should provide a logical link between the problem beidg
investigated and th2 research methodology used to seek a solution or
answer.
METHODS: Here.the writer explains exactly how his data weee
§athered. However, it is not necessiry for the writer to explain the
internal function4ngs of data-gathering equipments Unless the equip-.
ments were made to function in ian atypical manner. If a reader is un-
familiar with how a Nansen bottle or some other piece of equipmenta
functions he is obltgated to consult the literature for such informa-
tion.
The information in.this section of the report should come
directly from the field notebook with exception that, when data manip-
ulating and statiiticai techniques are used they must be described.
_DATA: As was the case wit4 the Methods section, information for
this section should derive directly-from the field notebook.
The data may .be presented, using graphs, charts, tables, and dia-.
grams, but it also must be described im writing. These aids are used
only to provrde a visual representation and to summarize that which
is pres?nted in context. For the sake of ease' and cipritg it is
generally acceptaVe to lump all graphs, charts, and diagrams in a
single category. The category known as "figures" is used.
When figures and tablet are used they should be successively

41.
-*
numbered and,each should liave its own title. If a report contains
more than one table:the first is labeled Table 1, the second Table 2,
and so on (the same is true of figures). Each tqle should reflect
the exact contents of the table or figure and each should be drawn
inLaecordance with the guidance of a style manual. Three such
manuals are listed.in the Reference section of this guide, and
others may be found in the College Library.
DISCUSSION: The..investigator's data are discussed in this section.
Hypotheses formulated in the early stages of the investigation should
be considéred here. It may be advantageous here to compare your find-
ings to those of others. If comparisons are made between your re7
Search and the findings of other investigators then those others
must be cited context'and their respective reports listed in the
References se'ctiop of your report (see sample reports below). In any
event, be as brief and straightforward as possible. This is not the
place to describe everysthiag that has trinspired thus far in the in-
vestigation.
iou may use tables-and figures in this Section; however, if used,
they should summarize the results of data manipulations.
CONCLUSIONS: In this section student researchers should draw .
conclusions based upon their findings. The writer may wish to conclude,
based upon interpretations of the study's data that the findings support
those of other specific studies or agree with or disagree with accepted
theory. Ip investigations designed to exemplify a theory, where the
A findings did not exactly support the theory the writer may wish to draw
8
a
re.
conclusions refleiting the possibility that experimental error con-
trillota to a theory's lack of support. .
Although beginning student laboratpry and field'investVators
tend to conclude that experiments Worked nicely Oft were a successt
This practice'should be 'avoided At all costs. Research-regprt read-
ers are the ones who decide upon the success or failure of an investi-
gation. ,Further,,determinations of this nature norMally depend upon
the quality of a presentation. Failure to6mention experimental error
or some other salient feature of an investigation may lead readers tf
conclude the research endedrin failure.
REFERENCES: This section contains all references cited in(con-
text. Citations are listed alphabetically by authors' last names.
The remainder of the citation should be consistent with a style manual
(see examples provided below).
SUMMARY OR,ABSTRACT: Generafly speaki,ng, summaries. Ifreceed refee-
ences sections while-abstracts preceed' titles. Whatever the case,
this section is but a.few brief.mtences describing the investigation's
methips, findings, and conclusions.
AIDS TO WRITING A GOOD REPORT
Tense and Person. Reports are written in standard English. They'
should be written in the third person and since the writing concerns
investigations already cotpleted, the past tense is always used.
Abbreviations. While the use of some abbreviations such as those
for millimeters, cubic eentimeters, kilpmeters, and the like are

.1generally acceptable in research report writipg,,others :ve not, As
.1"
a vide, all wdrds in the text of a report shouldbe spelled out in
iull. 1
Proof Reading. Perhaps the most overlooked area by beginning
student research report writers is that of,proof reading. Pry;.
reading-helps to locate misspellings, typographical errqrs, poor sen-
tence structure, and improper grammar - measurably increasing a
_report's quolity,
Colleague Reading. Colleague reading is perhaps the final sttp
prior to preparation of a final draft. In this step, your relport is
given to a colleague who is generally unfamiliar with your investiga-
tion. If that person, can read and understand what you.have done then
the-report till probably be clear to the general readership. If your
colleague.has'difficulty with the report, ittshould be 4hanged accord-
A
E.
As a further_guide to your colleague, remembgr one essential Mark
of a good written report is that WW1 allow the study to be repli-
cated without additional information.
, SAMPLE PROBLEMS
15ITUATION I. Three.species of periwinkles have been observed in
the vicinity of Castine, Maine, There appears V be a preponder-
ence of the common periwinkle Littorina littorea and fewer numbers .
respectively of the smootp periwinkle Littorina obtusata and the
rough periwinkle Littorina saxatilis. .However, at tw; locaticins there

9
appeared to be fewer of the former species and greater numbers of
the latter two species.
As a researcher, you see4 to resolve the issue by answering
two questions. Those questions are: ,(1) Which species of periwinkle
has the greatest population density in the Castine, Maine vicinity?
(2) How do the findings relaied.to the first question compare with
pop4lation densities in the periwinkleS' geograpfilical range?
THE LITERATUREjl'he first step is to consult the literatbre.' cf.
Here the researcher hopes to locate related findings of other
reseaethers: Two such related references were quickly located:
They were: El) Schith, A. B. and Jones, C. D. Population deniities
of three periwinkle' species in the littoral zone at Penobs.cott Maine.
The Blue Hill Biolo5lbal Review, 1896, 25 (8), 38-40. The authors
of this article conclude4 that in the MicIlitto-al zone adjacent toise
Penobscot, Maine the common periwinkle was.th,-.! most prolific species;
(2).Schultz and Schlitz, Biology of the Maine Coast. New York:
MacMillan:1977. The authors of the text stated that fhe most pro-,
lific periwinkle In Maine's lower littoret-zone is the commoeperi-f
winkle.
THE STUDY. -.A transect waS made every 200 meters along the
Castine, Maine shoreline from west to east, with the first located
at Dices Head. In all, 10 transects were taken, each when 'the tide
was mean lowi Four equallyspaced ko square areas were sampled
along each transect. The first of these 4 areas was situated adia-,
IMO
cent to the mean high-water mark and the fourth adjacent.to the
mean low-water mark. The second and third sampling:areas were
. . . /"N.
. ./. /,a ,,- ,,,-
C 0:.
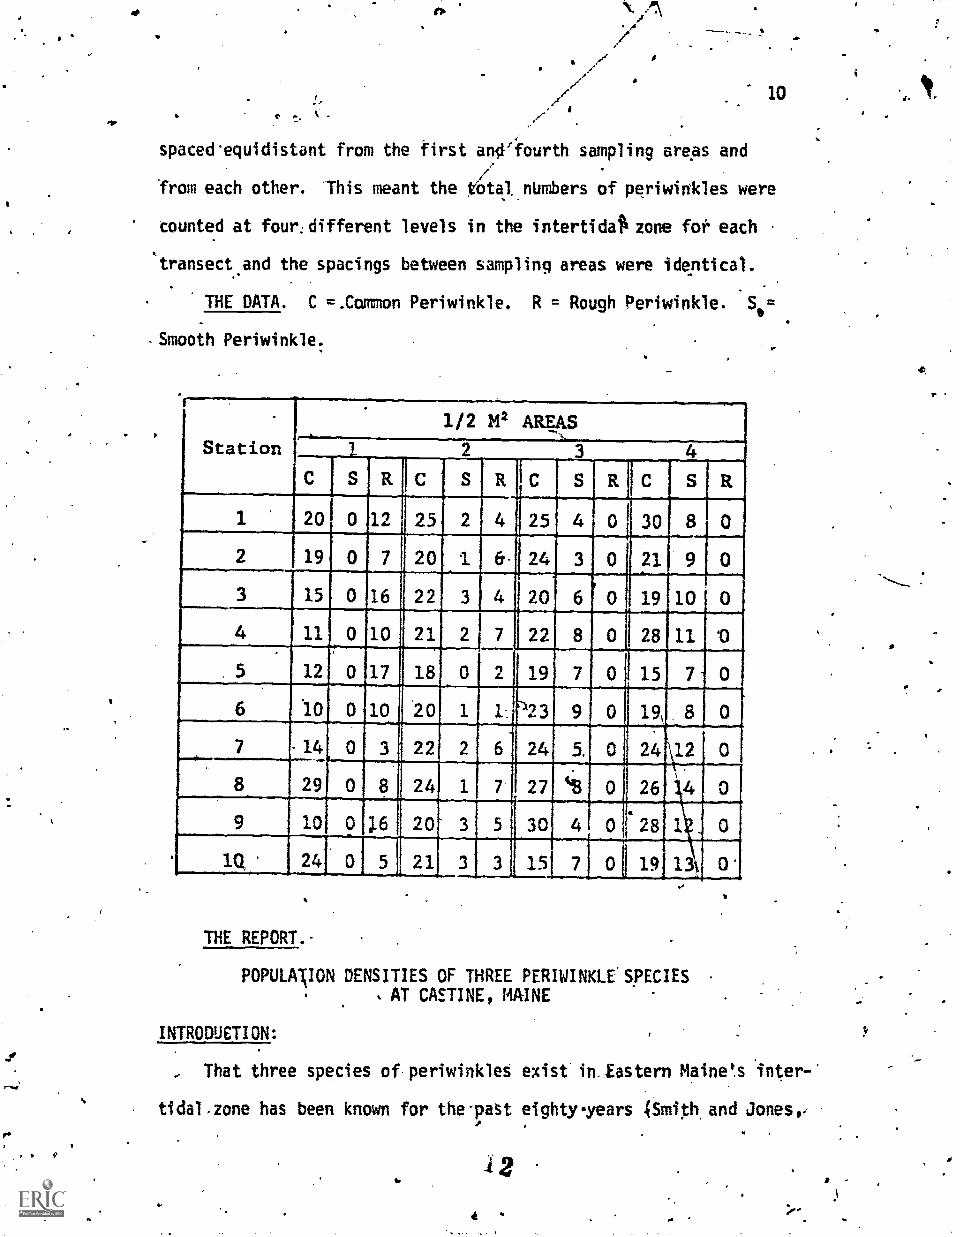
spaced'equidistant from the first anir'fourth sampling areas anda
a
10
from each other. 'This meant the 6tal.nUmbers of periwinkles were
counted at four:different levels in the intertidailkzone for each
transect and the spacings between sampling areas were identical.
THE DATA. C =.Common Periwinkle. R . Rough Periwinkle. Sw=
Smooth Periwinkle.
THE REPORT.-
POPULAIION DENSITIES OF THREE PERIWINKLE.SpECIESAT CASTINE, MAINE
eg.
INTRODUCTION:
That three species of periwinkles exist in iastern Maine's *inter-
tidal-zone has been known for the-past eighty-years 4Smixh and Jones,,
I.

1896). However, which species is most prolific throughout the zone
remains in doubt (Smith and Jones, 1896; Schultz and Schlitz, 1977).
Smith and Jones (1896) found the commonrperiainkle to be the largest
group In the middle littoral zone at Penobscot, Mine while Schultz
and Schlitz (1977) suggested this to be the most Oolitic species
in the low portions of the intertidal zon4ralong Maine's cdast.
Recent Aservations in the Castine, Maine area have suggested
the common periwinkle ppulation denslty to be greater at all levels
within the intertidal zone than the population densities of either
the sinooth or the rough periwinkle. However, observations at two
locations have turned up greater numbers of smooth and rough rather
than common peV:iwinkles. Therefore, it was decided, using controlled
conditions, to ascertain the validity of these observations. Is theq
common periwinkle indeed the most prolific of the periwinkle species?
Further, the common,periwinkle was hypothesized to be the'most pro-0
lific periwinkle species at all levels of the intertidal zone at
Castine', Maine.
METHODS:
The data were collected,from 10 transects spaced 200 meters apart,
The transecttmwere numbered successively from west to east, extended
from the mean high-water line to the mean low-water line.(a distance
of 4 meters at Castine) and transect number one was located at Dtces
Head.1
Periwinkles were counted at four equally spaced11/2 m2 areas with-
in each transect and the first 1/2 m2 area was located adjacent to
the mean high-water mark. 1h this manner, a total of 40 individual
4 3

1/2 m2 areas were sampled during the conduzt of the tudy.
DATA:
inThe data are presented in Tab\ I. In the Table, "C" represents
the common periwinkle, "S" - the smooth periwinkle, and "R" - the
12
rough periwinkle.
The common periwinkle'exhibited the greatest population density
at all leels within the intertidal zone. Smooth periwinkles wereA
'not found at the higheit level within the zone but increased in
ni.212...grs as the depth below the mean high-water mark increased. Mem-
,
bers of the rough periwinkle species were not encountered in the
lower portions of the zone. Further, their numbers-were found to
increase as the depth below the mean high-water mark decreased.
TABLE 1
Numbers of Periwinkles by Species Counted in 10 Transects
1/2 METER 2
-STATION NO. CSRCSRCSRCSR
1 2
SPECIES
3
T0
E.A
1
2
3
4
5
6
7
8
9
10*
20
19
15
11
12
10
14
19
10
24
0
0
0
0
0
10
0
0
0
12
7
16
10
17
10
3
8
16
5
25
20
22
21
18
20
22
24
20
21
2
1
3'
2
02191
2
1
-3
2
4
6
4
7
1
6
7
5
3
25
24
20
22
23
24
27
30
i5
4
3
6
8
7
9
5
8
4
0
0
0
0
0
0
0
0
0
0
30
21
19
28
15
19
24
26
28
19
8
9
10
11
7
8".
12 .
14.,i2
13
0
0
0
0
0
0
0

13
DISCUSSION:
The original hypothesis was accepted. `The common periwinkle
was found to be the mbst proljic periwinkle species.at Casne
MAine. The numbers of individuals in the common species per unit
Area seem fairly constant throughout the intelidal zone. See
%le
Figure I.
M .25
AN. 20
P EO N 15PU IL T 10A Y
0
C*
c s t2 3
Increasing depth below mean higli-water by 1/2 mI2,
FIGURE -1
MEAN POPULATION DENSITIES 0 F COMMON: ROUGH, AND SMOOTH PERIWINKLES.t1
AT FOUR DEIITHS BELOW THE MEAN HIGH-WATER MARK.
The findings suggest the second most abundatI species in the
higher intertidal zone to be the rough periwinkle and the smooth peri-
winkle in the lower portion of the zone. These! -findings also suggest
an inability on the part of rough periwinkle to intrude into the
lower intertidal zone.and the smooth Periwinkle to intrude into the
higher reaches of the zone.
14
CONCLUSION:
The findings of this study were 'consistent with thoseeof Smith
and Jones (1896) and Schultz and Schlitz (1977). The common peri-.
winkle is the most abundant.spiecies in the middle and lower interti-
dal regions at Castine, Maine.
Four further conclusions were drawn concerning periwinkle popula-
tion densities at Castine: .(1) the most abundant species in the nhigh
intertidal zone is the...common periwinkle; (2) the population of common
periwinkles is equally dispersed th'roughout the intertidal zone; (3)
the second most abundant species in the upper intetidal zone is the
rough periwinkle; (4) the second most abundant periwinkle species in
the lovier intertidal zone is the smootti.periwinkle.
Whether or not conclusions 'three or four are generalizable to a
broader geographic area.awaits additional research.
REFERENCES:
Schultz, A. B. & Schlitz, B. C. Biology of the maine coast. New York:
MacMillan, 1977.
Smith, A. B., & Jones, C. D. Population densities of three periwinkle
species in the midlittoral.zone at penobscot, maine. The Blue Hill
Biological Review, 1896, 25 (8), 38-40.
SITUATION 2. National Ocean Survey.chart 13309 shows soundings In
the Casting, Maine harbor to vary from one to another, However, these
data are not sufficient if maximum use is to be made of Castine Harbor.
In order to afford mariners, fishermen and others the opportunity to use
the harbor to its utmost a scale model of the harbor bottom is required.
A search of the literature in th s regard reveale4 the only work ever to

15
have been accomplished in Castine Harbor O6r the Bagaduce River estuary
was reported on chart 13309. Therefore, a preliminarrstudy isto be
...
-codducted. ,aq
. 4. I
The primary Qbjective in preliminary studies is' to investigate .prob-
lems which.might be encountered in actually attempting to build a model-
of the Bagaduce River estuary area adjacent to Castine's town deck. The
objecifive will be accomplished by making one bottom profile leading away
from the towm dock at 900 relative to the dock and then correcting that,
profile to mean low water.
TITLc
PROBLEMS ENCOUNTERED IN MAKING A SINGLE BOTTOM PROFILE ON.THE CASTINE,MAINE HARBOR AND ADJACENT BAGADUCE ESTUARY AREA ..
INTRODUCTION
Making maximum use of harbdrs and estuaries requirel extensive know-..
ledge of bbttom profiles as well as other parameters. While salinity,.a
current and temperature data are available for Castine, Maine harbor and
the adjacent Bagaduce Estuary the only information conce'rning bottom con-
tours in this area derives from National Ocean Survey soundings: While
soundings are sufficient for general navigatton they do not allow the,A
harbor to be used to the maximum extent possible. Therefore, town admin-
istrators cided to investigate the feasibility of developing a. model of
the ocean bo tom in the area.
The investigators felt efforts to complete a rapid feasibiltty.study
would be hampered in several ways. It we's. hypothesized that (1).data col-
lection would be hampered by Vidal currents, wind speed and direction and
wave height; (2) reduction* of data to reflect mean low water (MLW) would

16
be made dffficult Oy the amount of time required to transet the estuarY
while collecting bottom profiles.
METHODS'# .
Preliminary study data were gathered in the.following manner. A bot-.
tom profile was made across the estuary at an angle 90° to the face of the4 jk
Castine, Maine town dock.by recording fathometer on the research vessel
-
Panthalas.
The research vessel was operated at its slowest possible speed and
held on course by following'maneuvering signals provided from shore. Ac-
cordingly, a surveyor's transet was setup on the town dock at latitude
440 23'N and longtitude 68° 47.6'W and sighted.at an angle 52° west rela-
tive to nun buoy 2 in the Bagaduce River. The transet operator sighted on
a transet staff a fixed amidships at the stern of the research vessel.
When the crnss hair of the transet was on the transet staff the vessel tos
on jig proper track line and when deviation occured the boat coxswain was
signaled to modify his course.
Signaling was accomplished through the use of flags. Directions were
given to the flagman by the transet operator. If the vessel devjated to
the left of its intended trackline the flag operator held a flag to the1
right of his body and horizontal to the dock until the vesserresumed its-
proper course. Once a proper course was resumed the flag was held. over the
flagman's head in line with his body profile.
Tide data were collected from a tide staff whose zero mark was set at
mean low water. The vessel's time -of departure froM the'dock was noted and
tide height reading taken at.that moment. Similar readings were taken at46,
the moment the vessel reached- the oppositesidePf the estuary. The end
8

17
positions of the track line were obtained by the intersection of sighting
lines,taken from the
compass. Die points
were uted to compute
DATA
vessel. The sightings were taken.with a hand.bearinge %
of intersection on national ocean survey chart'13309
actual latitude and longitude of the end poirrts,
Fifteen minutes were required to.transet the course, a distance of
1.2 nautical miles. The tide was ebbing during the operation and was found
to drop 22 cm from its 211 ab.ove MLW at the" time of the vessel's departure
from the town dock.
Figure 1 shows the bottom profile obtained from the fathometer print-
out. The profile shown in the Figure has been corrected to MLW. This pro-
file is similar.to that obtained on the ivturn voyage when its was attempt-
ed to obtain a mirror image of the trip across the estuary.
INSERT FIGURE 1 HERE t.I
The investigation was conducted beginning at 10:15 eastern standard
time July 4, 1979. The.sky was cloudless,, the wind steady at 5 knots in
an easterly direction and the surface of the water broken by a 15cm chop
.
running east.
DISCUSSION
Several problems were Encountered while collecting the data. Although
it-was anticipated that an easterly Wind and surface chop might have compen-
sated for the westerly flow ebb tidal current, the vessel was found to.wan-
der to the west of its intended track line. Correction of westerly devia-
tions caused the course to momentarily deviate e-st of the track line during
9

416
ach correction phase. The result was a meandering and somewhaesinusoidal
. rather than a straight track line with east west deviations greater to the
west than the east.
` Exact position location at the end'of the track line was confounded
by the ebbing tide. An attempt was made to hold the vessel in position
while sightings were made but some westward drift was noted.
CONCLUSiONS
Weather conditions At the time the data were gathered allow accept-.
ance of the first hypothesis. No evidence however was accumulated lead-,
ing to the acceptance of the second hypothesis. It is, therefore, reject-
ed.
Prior to embarking upon data collection for the actual model building
task an additional preliminary study should tie conducted. A profilr should
be made during a slack water period. This would reduce interference from
tidal flow to a minimum (when the tide shifts there is water movement in
the oppWte direction). In this way the problems created bY weather alone
,can best be evaluated. It may be that for accuracy sake the contours may be
taken only ori windless days and during slack water periods.
REFERENCES
National Ocean Survey Chart No. 13309.
STYLE GUIDE
American Psychological Association Publication Manual of the AmericanPsychological Association. Wdshington: American Psychological-Association, 1974.
Campbell, W. G., Form and Style im Thesis Writing.Mifflin Company, 1954.
Campbell, W. G., and Ballou, S.V., Form and Style.Mifflin Company, 1974.
2 0
Boston: Hou hton
Boston: Houghton

FIGURE 1
BOTTOM
BOTTOM PROFILE OFTHE B:AGf.DUCE ESTUARY BEGINNING AT THE CASTI
MAINE TOWN DOCK.
21