Abstract - openstarts.units.it · la compromissione dello scambio gassoso. Attualmente, l’unico...
95
Transcript of Abstract - openstarts.units.it · la compromissione dello scambio gassoso. Attualmente, l’unico...

Abstract
High Frequency Percussive Ventilation (HFPV) is a non-conventional ventilatory
modality which has proven highly effective in patients with severe gas exchange
impairment. However, at the present time, HFPV ventilator provides only airway pressure
measurement. The airway pressure measurements and gas exchange analysis are currently
the only parameters that guide the physician during the HFPV ventilator setup and
treatment monitoring. The evaluation of respiratory system resistance and compliance
parameters in patients undergoing mechanical ventilation is used for lung dysfunctions
detection, ventilation setup and treatment effect evaluation. Furthermore, the pressure
measured by ventilator represents the sum of the endotracheal tube pressure drop and the
tracheal pressure. From the clinical point of view, it is very important to take into account
the real amount of pressure dissipated by endotracheal tube to avoid lung injury. HFPV is
pressure controlled logic ventilation, thus hypoventilation and hyperventilation cases are
possible because of tidal volume variations in function of pulmonary and endotracheal tube
impedance.
This thesis offers a new approach for HFPV ventilator setup in accordance with
protective ventilatory strategy and optimization of alveolar recruitment using estimation of
the respiratory mechanics parameters and endotracheal pressure drop. Respiratory system
resistance and compliance parameters were estimated, firstly in vitro and successively in
patients undergoing HFPV, applying least squares regression on Dorkin high frequency
model starting from measured respiratory signals. The Blasius model was identified as the
most adequate to estimate pressure drop across the endotracheal tube during HFPV. Beside
measurement device was developed in order to measure respiratory parameters in patients
undergoing HFPV.
The possibility to tailor HFPV ventilator setup, using respiratory signals
measurement and estimation of respiratory system resistance, compliance and endotracheal
tube pressure drop, provided by this thesis, opens a new prospective to this particular
ventilatory strategy, improving its beneficial effects and minimizing ventilator-induced
lung damage.
Sommario
La ventilazione percussiva ad alta frequenza (HFPV, High Frequency Percussive
Ventilation) è stata impiegata con successo in diverse malattie polmonari che determinano
la compromissione dello scambio gassoso. Attualmente, l’unico parametro fornito dal
ventilatore è la misura della pressione erogata dal ventilatore mentre la misurazione della
pressione e l'analisi degli scambi gassosi sono in questo momento gli unici parametri che
guidano il medico durante l'impostazione del ventilatore e durante il monitoraggio del
trattamento HFPV. La valutazione della resistenza e della compliance del sistema
respiratorio nei pazienti sottoposti a ventilazione meccanica può essere utilizzata per il
rilevamento delle disfunzioni polmonari, per le impostazioni del ventilatore e per la
valutazione dell'effetto del trattamento. Tuttavia, la presenza del tubo endotracheale
determina un’impedenza aggiuntiva, che va a sommarsi a quella del sistema respiratorio, e
che modifica la pressione misurata dal ventilatore. Dal punto da vista clinico è importante
conoscere il valore reale della caduta di pressione dovuta al tubo endotracheale per evitare
un sovra- o sotto- trattamento. Essendo l’HFPV una ventilazione a pressione controllata,
sono possibili casi di ipoventilazione e iperventilazione a causa di variazioni del volume
corrente in funzione dell’impedenza del sistema respiratorio e del tubo endotracheale.
Questa tesi propone un approccio personalizzato per l'impostazione del ventilatore
HFPV in conformità con la strategia ventilatoria protettiva e per ottimizzare il
reclutamento alveolare utilizzando la stima dei parametri della meccanica respiratoria e
della caduta di pressione dovuta al tubo endotracheale. La resistenza e la compliance del
sistema respiratorio sono state stimate, prima in vitro e successivamente in pazienti
sottoposti all’HFPV, applicando il metodo dei minimi quadrati sul modello ad alta
frequenza di Dorkin a partire dai segnali respiratori misurati. Il modello di Blasius è stato
identificato come il più adeguato per stimare la caduta di pressione attraverso il tubo
endotracheale durante la HFPV. Al fine di misurare i parametri respiratori nei pazienti
sottoposti ad HFPV è stato sviluppato un dispositivo di misura al letto del paziente.
La possibilità di personalizzare l'impostazione del ventilatore HFPV, utilizzando la
misura di segnali respiratori e la stima della resistenza, della compliance e della caduta di

pressione dovuta al tubo endotracheale, apre una nuova prospettiva per questa particolare
strategia ventilatoria, migliorando i suoi effetti benefici e riducendo al minimo danni
iatrogeni.
Contents
Introduction .............................................................................................................................. 1
Chapter 1 Respiratory system and Artificial Ventilation.................................................... 3
1.1 Respiratory system ............................................................................................................ 3
1.2 Respiratory mechanics functional models ........................................................................ 4
1.3 Artificial ventilation .......................................................................................................... 9
1.3.1 Conventional ventilation........................................................................................... 10
1.3.2 High frequency ventilation ....................................................................................... 13
Chapter 2 High Frequency Percussive Ventilation ............................................................ 16
2.1 HFPV ventilator .............................................................................................................. 17
2.2 Impact of mechanical load on pressure flow and volume delivery during HFPV .......... 24
2.3 HFPV clinical applications ............................................................................................. 31
Chapter 3 In vitro estimation of respiratory parameters during HFPV ......................... 34
3.1 Respiratory signal measurement during HFPV .............................................................. 34
3.2 In vitro estimation of viscoelastic parameters during HFPV during HFPV .................. 37
3.2.1 Material and methods ............................................................................................... 40
3.2.2 Results ...................................................................................................................... 43
3.2.3 Discussion ................................................................................................................. 45
Chapter 4 Estimation of pressure drop across endotracheal tubes during HFPV ......... 46
4.1 In vitro estimation of pressure drop across endotracheal tubes during HFPV ............... 49
4.1.1 Material and methods ............................................................................................... 49
4.1.2 Results ...................................................................................................................... 53
4.1.3 Discussion ................................................................................................................. 56
Index
4.2 In vitro estimation of pediatric endotracheal tube pressure drop .................................... 59
4.2.1 Results ...................................................................................................................... 60
4.2.2 Discussion ................................................................................................................. 62
4.3 In vitro estimation of tracheal pressure by Genetic programing ..................................... 63
Chapter 5 Respiratory parameters measurements in patients undergoing HFPV ......... 66
5.1 Material and methods ...................................................................................................... 67
5.1.1 Bedside acquisition system and respiratory parameters estimation ......................... 67
5.1.2 Conventional ventilation protocol ............................................................................ 71
5.1.3 High frequency percussive ventilation protocol ....................................................... 71
5.2 Results ............................................................................................................................. 73
5.3 Discussion ....................................................................................................................... 76
Conclusions ............................................................................................................................. 80
Bibliography ........................................................................................................................... 81

1
Introduction
Artificial ventilation and intubation are lifesaving therapies frequently used in
patients with acute respiratory failure. High frequency percussive ventilation (HFPV) is an
advanced ventilatory strategy which has proven highly effective in case of severe gas
exchange impairment. HFPV associates the beneficial aspects of conventional mechanical
ventilation with those of high-frequency ventilation. This particular high frequency
ventilation modality delivers a series of high-frequency sub-tidal volumes, by pulsatile
flow, in combination with low-frequency breathing cycles. Consequently HFPV improves
gas exchange encompassing two complementary ventilatory mechanisms: convective and
diffusive, corresponding to high frequency oscillations and pressure controlled
conventional ventilation, respectively.
HFPV ventilator VDR-4® (Percussionaire Corporation, USA) provides convective
and diffusive cardiopulmonary support to most critical patients, from neonates through
pediatrics to adult patients. At the present time, HFPV ventilator monitoring unit provides
only airway pressure measurement and corresponding peak and mean airway pressures.
Thus these pressure measurements and gas exchange analysis are only parameters that
guide the physician during the treatment setup and monitoring. On the other side pressure,
flow and volume delivered by HFPV depend on viscoelastic parameters of the respiratory
system. HFPV is not an intuitive ventilatory modality and the absence of valuable
information during the treatment, as delivered tidal volume, respiratory system resistance
and compliance, produces disaffection among the physicians.
Assessment of respiratory system viscoelastic parameters and tidal volume delivery
play an important role in the management of severe hypoxemic patients undergoing
artificial ventilation. The evaluation of respiratory resistance and compliance parameters is
very important in order to detect and understand lung dysfunctions, decide therapeutic
measures, evaluate effect of the treatment, improve patient–ventilator interaction and
prevent ventilator induced complications.
Furthermore, the airway pressure measured by HFPV ventilator represents the sum
of the endotracheal tube pressure drop and the tracheal pressure dissipated to inflate lung.
Introduction
2
The estimation of pressure drop across endotracheal tube may be very useful to the
clinician to avoid lung injury or alveolar de-recruitment.
The clinical efficacy of an artificial ventilator is directly related to the physician’s
overall medical knowledge and ability to effectively setup ventilation treatment. Avoiding
the baro and volu-trauma is the cornerstone of the protective ventilation strategy. At the
same time from a clinical point of view, alveolar de-recruitment must be avoided, so
recruitment maneuvers are frequently necessary to keep the lung open. Presently it is not
possible to evaluate the delivered tidal volume, respiratory mechanics parameters,
endotracheal pressure drop and the alveolar recruitment effect in patients undergoing
HFPV treatment.
The aim of this doctoral thesis was to personalize HFPV ventilator setup in
accordance with protective ventilatory strategy and optimization of alveolar recruitment by
providing tools for estimation of the main respiratory parameters and endotracheal pressure
drop.
The first chapter describes respiratory system, gas exchange and artificial
ventilation principles and techniques.
HFPV technique and ventilator description, effects of respiratory system impedance
on pressure, flow and volume delivered by HFPV and the main clinical applications of
HFPV systems are reported in the second chapter.
In the third chapter an appropriate method for estimation of respiratory system
viscoelastic resistive and compliance parameters was identified.
An adequate model for estimation of endotracheal tube pressure drop over time was
proposed and identified in Chapter 4.
Respiratory parameters measurement in patients undergoing HFPV and the results
of ventilator setup based on such measurements and estimations are reported in Chapter 5.
A proper acquisition system for bedside measurement of pressure, flow and volume
during this particular ventilation strategy was designed and developed in this work. The
study was performed in collaboration between Department of Engineering and
Architecture of University of Trieste and Department of Perioperative Medicine, Intensive
Care and Emergency of Cattinara Hospital of University of Trieste.
3
Chapter 1 – Respiratory system and
Artificial Ventilation
1.1 Respiratory system
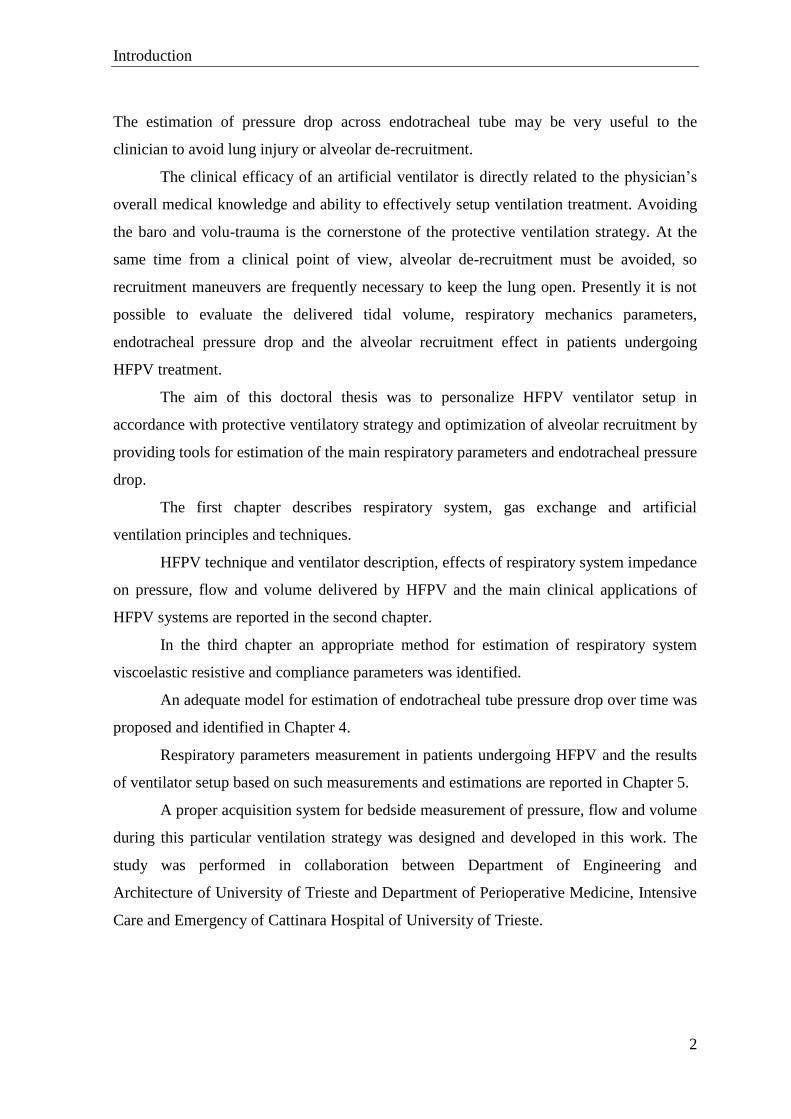
The primary function of the respiratory system is to ensure the gas exchange of
oxygen and carbon dioxide between the environment air and the blood, thus providing the
necessary supply of oxygen to the body and removing the carbon dioxide. The respiratory
system, which allows gases to transfer by convective and diffusive processes between the
atmospheric air and blood, is constituted by two functionally different anatomical parts:
The airways, where the air and gases contained in it are conveyed inside or
outside the body, during the processes of inspiration and expiration,
respectively;
The lungs, where gas exchange occurs with the blood at the level of alveoli.
The oxygen rich air enters in the respiratory system through the mouth and the nose
and passes through the larynx and the trachea which splits into two smaller tubes called the
bronchi. Subsequently the each primary bronchus divides generating the bronchial tubes,
which lead directly into the lungs where they divide into many smaller tubes which
connect to tiny sacs surrounded by capillaries, called alveoli. The breathed in oxygen
passes into the alveoli and then diffuses through the capillaries into the arterial blood. At
the same time, the carbon dioxide rich blood from the veins releases its carbon dioxide into
the alveoli, which is breathe out through the same path.
Figure 1.1 Respiratory system tracheobronchial tree.
Chapter 1 – Respiratory system and Artificial ventilation
4
In spontaneous breathing, the lungs can expand and retract by the action of the
respiratory muscles (diaphragm, intercostal muscles and abs), even if, during a quiet
breathing, inspiration is almost entirely due to the lowering of the diaphragm while
exhalation is a consequence of the elastic return, once the diaphragm is released. The
mechanisms that allow a patient to be ventilated with artificial ventilator are different from
those of spontaneous breathing.
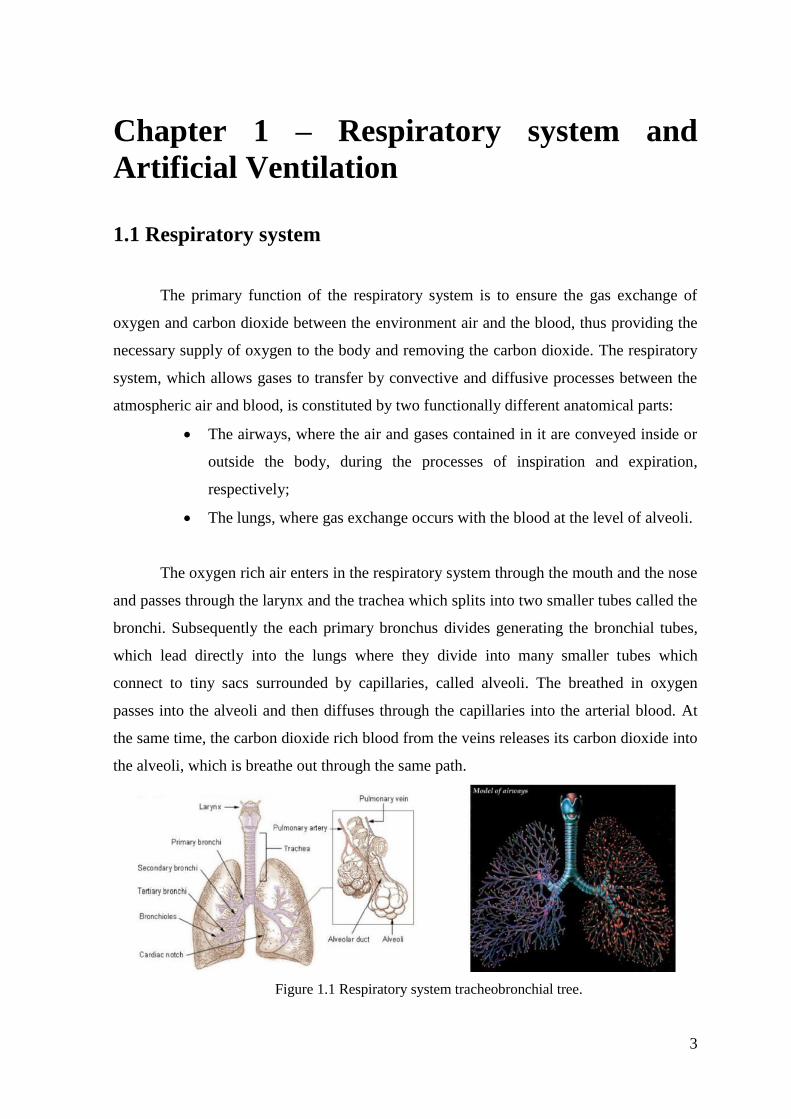
Figure 1.2 Weibel model of the tracheobronchial tree [1]
The respiratory system lung from morphological point of view can be seen as a tree
structure (tracheobronchial tree) that starts from the trachea and divides progressively until
reaching the alveolar sacs. An ideal morphological model of the tracheobronchial -
bronchial was proposed by Weibel [1]. The Weibel model consists of 24 identified
generations (Figure 1.2). The first seventeen (i.e. trachea and the sixteen subsequent
ramifications) are forming the conduction zone, while the last seven generations constitute
the respiratory area, site of gas exchange with the cardiocirculatory system. Movement of
gases in the respiratory airways occurs mainly by convection to the fifteenth generation,
while beyond the fifteenth generation, gas diffusion is relatively more important.
1.2 Respiratory mechanics functional models
In the study of respiratory mechanics is essentially the search for a simple but
useful mechanical behavior model of respiratory system [2]. Although the respiratory
mechanics is not the only process involved in breathing, it is however a fundamental aspect

Chapter 1 – Respiratory system and Artificial ventilation
5
of respiratory function, widely studied in physiology and carefully evaluated in the clinic
to determine the pathophysiologic conditions of patients. Given the complexity of the
system, respiratory mechanics studies draw considerable advantages from the use of simple
models to describe the main functional characteristics of the respiratory system.
Respiratory mechanics models describe the mechanical behaviour of the respiratory system
exposed to pressure, flow and volume variations over the course of inspiration and
expiration. The relation among them is described by the equation of motion for the
respiratory system, derived from force-balance equation. The pressure applied on proximal
airways is balanced with opposing pressures arising from several factors which include
elastic forces within the lung and chest wall, viscous forces due to flow of gas along the
airways and lung and chest wall tissues, and inertial forces. The elastic, viscous and inertial
properties of respiratory system can be described by compliance (C), resistance (R) and
inertance (I) parameters, respectively.
In respiratory physiology, lung compliance (C) describes the willingness of the
lungs to distend, and elastance (E) the willingness to return to the resting position [3].
Compliance is defined by the following equation:
𝐶 =𝑉
𝑃𝑉 [L cmH2O
-1]
where V is change in volume, and PV is change in pressure. The inverse of compliance is
elastance (E= 1/C). The static pressure-volume relationship is nonlinear, presenting lower
static compliance at the extremes of lung volume [4].
The respiratory system resistance represent viscous resistance offered to the
airflow:
𝑅 =𝑃𝑅
�̇� [cmH2O L
-1 s]
where V̇ is airflow and PR is pressure drop to friction. In airways and lungs, both laminar
and turbulent flows are present. In case of turbulent flow pressure-flow relationship is
nonlinear. Resistance may be present in the conducting airways or endotracheal tube, in the
lung tissue, and in the tissues of the chest wall. The expiratory resistance is usually higher
than inspiratory resistance because of the smaller more distensible airways are more open
during inspiration. [4].

Chapter 1 – Respiratory system and Artificial ventilation
6
The respiratory system inertance describes pressure changes during volume
acceleration:
𝐼 =𝑃𝐼
�̈� [cmH2O L
-1 s
2]
where V̈ is volume acceleration and PI pressure variation during volume acceleration.
Inertance has traditionally been excluded from the low frequency models.
The systems of different physical nature that are governed by the same equations
(more precisely, by equations having the same formal structure) can be observed in a
similar way, according to a criterion introduced by Maxwell in the nineteenth century,
which is now useful to use in the most varied fields of physics and its applications. Thus
the mechanical systems can be represented as electrical networks. In particular the analogy
between the behaviour of an electrical oscillator - RLC circuit and a mechanical oscillator.
The respiratory system presents properties of resistance, compliance, and inertance
analogous to the electrical properties of resistance, capacitance, and inductance [5].
Despite the respiratory system complexity, the breathing dynamics have been
satisfactory represented, for the clinical purposes, by a single-compartment linear model
consisting of a rigid tube and a compliant balloon [6-8] (Figure 1.3).
Figure 1.3 Respiratory system modelled as a rigid tube and a compliant balloon single,
corresponding to airflow resistance and compliance, respectively [2].

Chapter 1 – Respiratory system and Artificial ventilation
7
This model, described by following equation motion, consists of a single resistance
(representing the endotracheal tube and the airways) and a compliance (representing the
lungs and chest wall) [2]:
𝑃(𝑡) =1
𝐶· 𝑉(𝑡) + 𝑅 · �̇�(𝑡)
where P(t) the pressure applied to the respiratory system, V(t) is the pulmonary volume
and V̇(t) is the airflow. This first-order model can be applied both during spontaneous
ventilation and during constant flow passive ventilation. The electrical analog model is
reported in Figure 1.4.
Figure 1.4 First-order single compartment linear model [5].
The more complex two-compartment viscoelastic Otis [9], Mead [10] and Mount
[11] models provide a more accurate description of the mechanical behavior of the
respiratory system. The Otis model (Figure 1.5) describes pulmonary inhomogeneities and
parallel gas redistribution between two lungs [9].
Figure 1.5 Otis model [5].
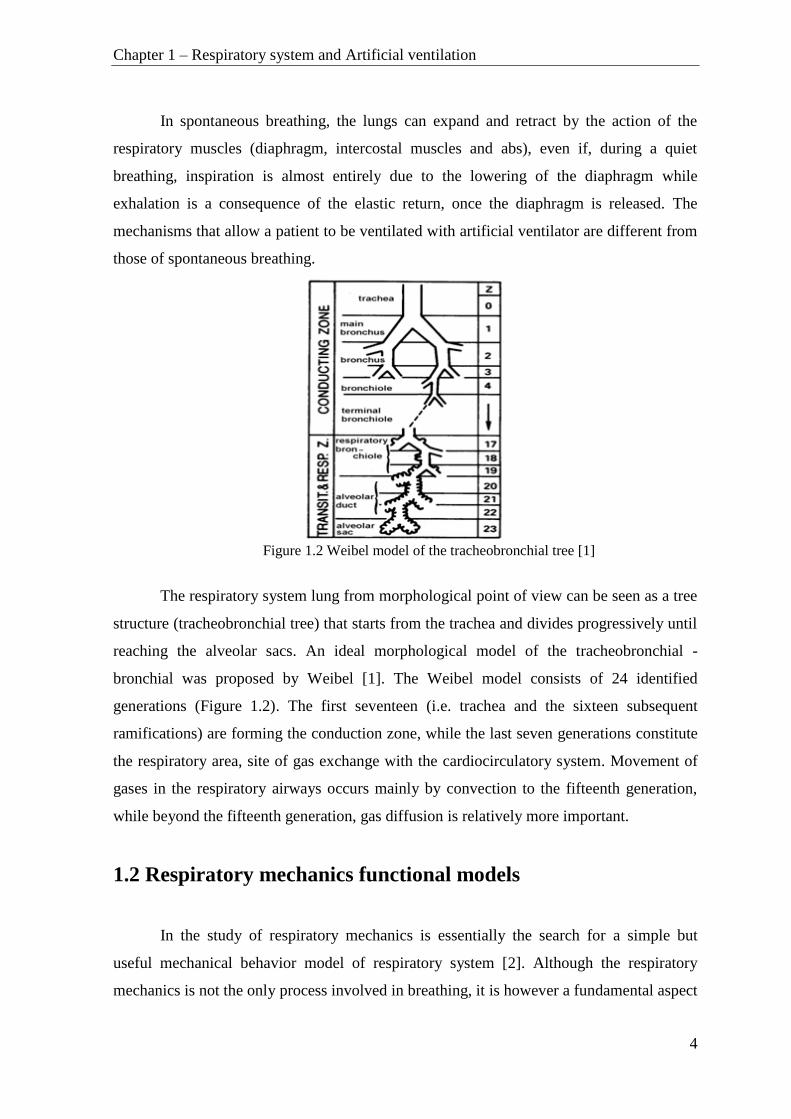
The Mead model (Figure 1.6) describes homogeneous lungs with central airway
compliance and subsequent series gas redistribution [10]. In this model respiratory
Chapter 1 – Respiratory system and Artificial ventilation
8
mechanics is described by central resistance (R1) in a series with parallel coupled central
compliance (E1) and a series with compliance (E2) and resistance (R2).
Figure 1.6 Mead model for homogeneous lung with serial gas redistribution [5].
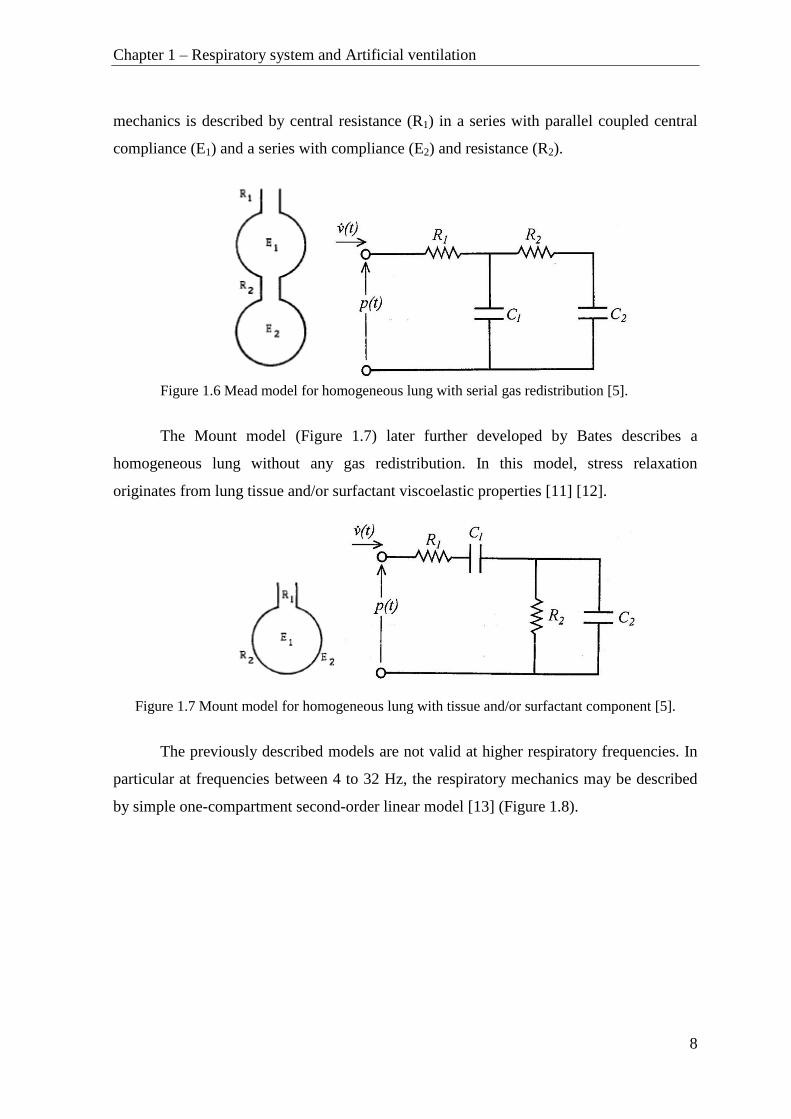
The Mount model (Figure 1.7) later further developed by Bates describes a
homogeneous lung without any gas redistribution. In this model, stress relaxation
originates from lung tissue and/or surfactant viscoelastic properties [11] [12].
Figure 1.7 Mount model for homogeneous lung with tissue and/or surfactant component [5].
The previously described models are not valid at higher respiratory frequencies. In
particular at frequencies between 4 to 32 Hz, the respiratory mechanics may be described
by simple one-compartment second-order linear model [13] (Figure 1.8).
Chapter 1 – Respiratory system and Artificial ventilation
9
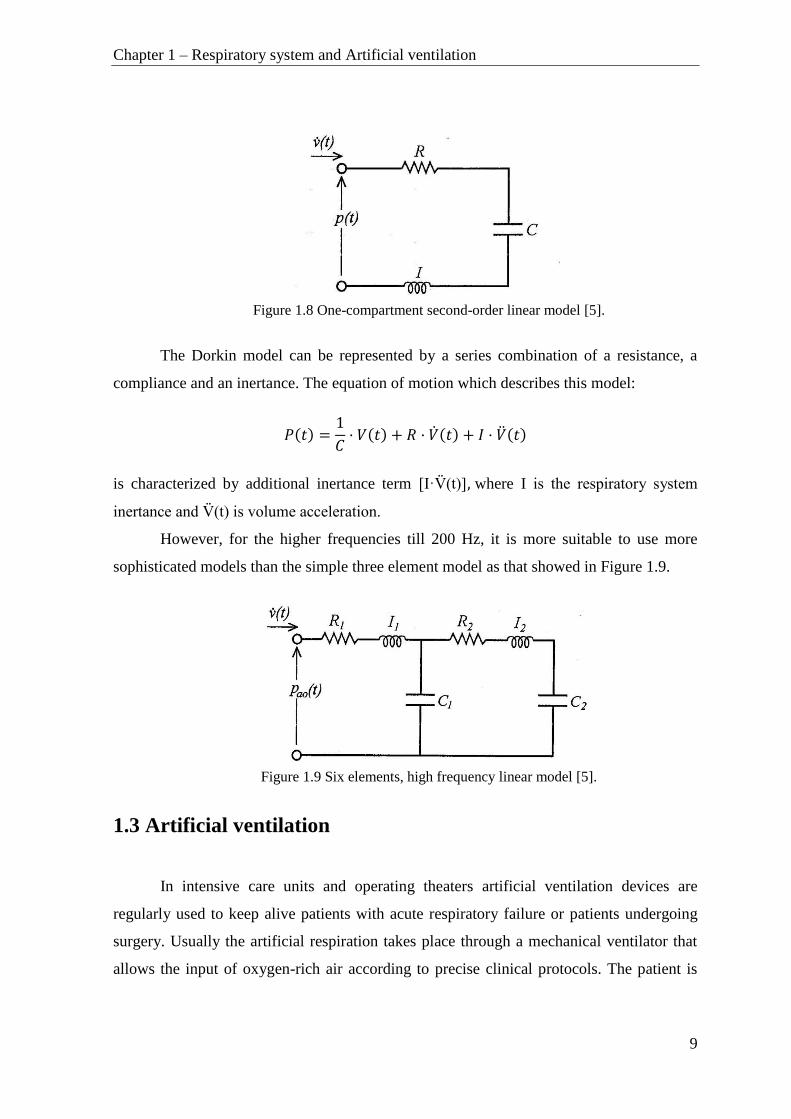
Figure 1.8 One-compartment second-order linear model [5].
The Dorkin model can be represented by a series combination of a resistance, a
compliance and an inertance. The equation of motion which describes this model:
𝑃(𝑡) =1
𝐶· 𝑉(𝑡) + 𝑅 · �̇�(𝑡) + 𝐼 · �̈�(𝑡)
is characterized by additional inertance term [I·V̈(t)], where I is the respiratory system
inertance and V̈(t) is volume acceleration.
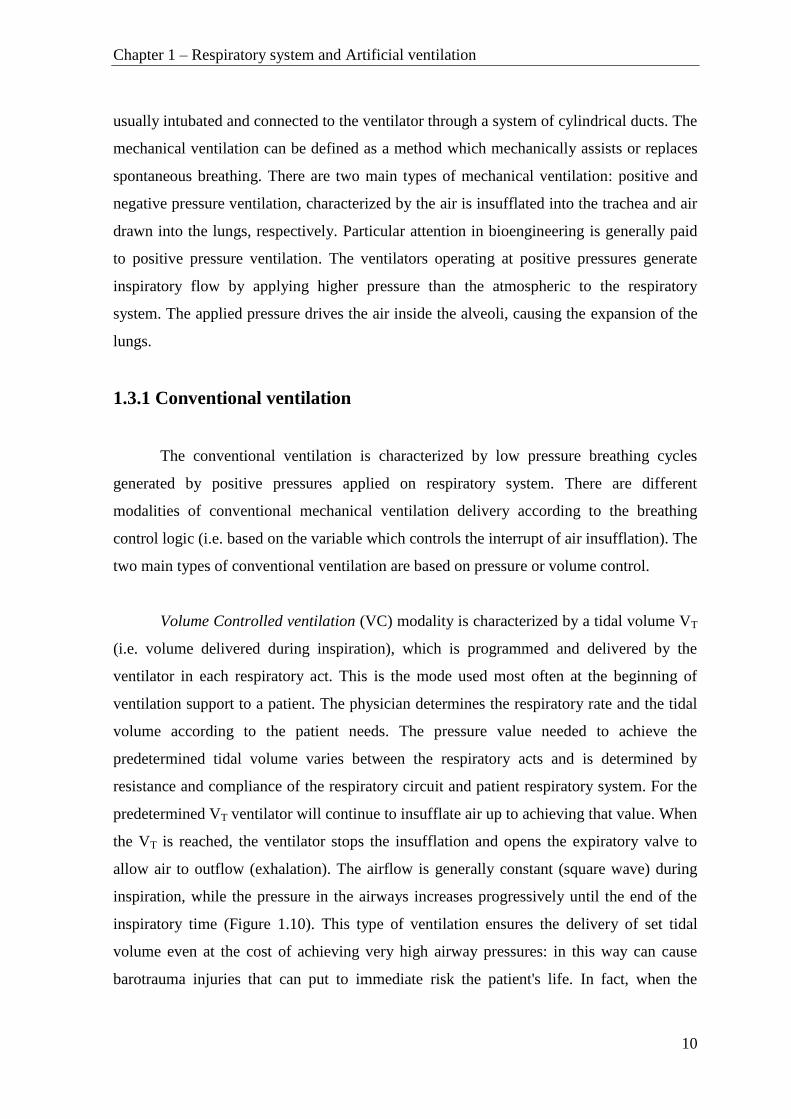
However, for the higher frequencies till 200 Hz, it is more suitable to use more
sophisticated models than the simple three element model as that showed in Figure 1.9.
Figure 1.9 Six elements, high frequency linear model [5].
1.3 Artificial ventilation
In intensive care units and operating theaters artificial ventilation devices are
regularly used to keep alive patients with acute respiratory failure or patients undergoing
surgery. Usually the artificial respiration takes place through a mechanical ventilator that
allows the input of oxygen-rich air according to precise clinical protocols. The patient is
Chapter 1 – Respiratory system and Artificial ventilation
10
usually intubated and connected to the ventilator through a system of cylindrical ducts. The
mechanical ventilation can be defined as a method which mechanically assists or replaces
spontaneous breathing. There are two main types of mechanical ventilation: positive and
negative pressure ventilation, characterized by the air is insufflated into the trachea and air
drawn into the lungs, respectively. Particular attention in bioengineering is generally paid
to positive pressure ventilation. The ventilators operating at positive pressures generate
inspiratory flow by applying higher pressure than the atmospheric to the respiratory
system. The applied pressure drives the air inside the alveoli, causing the expansion of the
lungs.
1.3.1 Conventional ventilation
The conventional ventilation is characterized by low pressure breathing cycles
generated by positive pressures applied on respiratory system. There are different
modalities of conventional mechanical ventilation delivery according to the breathing
control logic (i.e. based on the variable which controls the interrupt of air insufflation). The
two main types of conventional ventilation are based on pressure or volume control.
Volume Controlled ventilation (VC) modality is characterized by a tidal volume VT
(i.e. volume delivered during inspiration), which is programmed and delivered by the
ventilator in each respiratory act. This is the mode used most often at the beginning of
ventilation support to a patient. The physician determines the respiratory rate and the tidal
volume according to the patient needs. The pressure value needed to achieve the
predetermined tidal volume varies between the respiratory acts and is determined by
resistance and compliance of the respiratory circuit and patient respiratory system. For the
predetermined VT ventilator will continue to insufflate air up to achieving that value. When
the VT is reached, the ventilator stops the insufflation and opens the expiratory valve to
allow air to outflow (exhalation). The airflow is generally constant (square wave) during
inspiration, while the pressure in the airways increases progressively until the end of the
inspiratory time (Figure 1.10). This type of ventilation ensures the delivery of set tidal
volume even at the cost of achieving very high airway pressures: in this way can cause
barotrauma injuries that can put to immediate risk the patient's life. In fact, when the

Chapter 1 – Respiratory system and Artificial ventilation
11
airway pressure reaches the predetermined safety limit insufflation ceases and the valve
that allows the exhalation opens allowing the intrathoracic pressure to descend. The case
maximum pressure reaching is the only situation in which volume controlled ventilation
not guarantees the programmed VT.
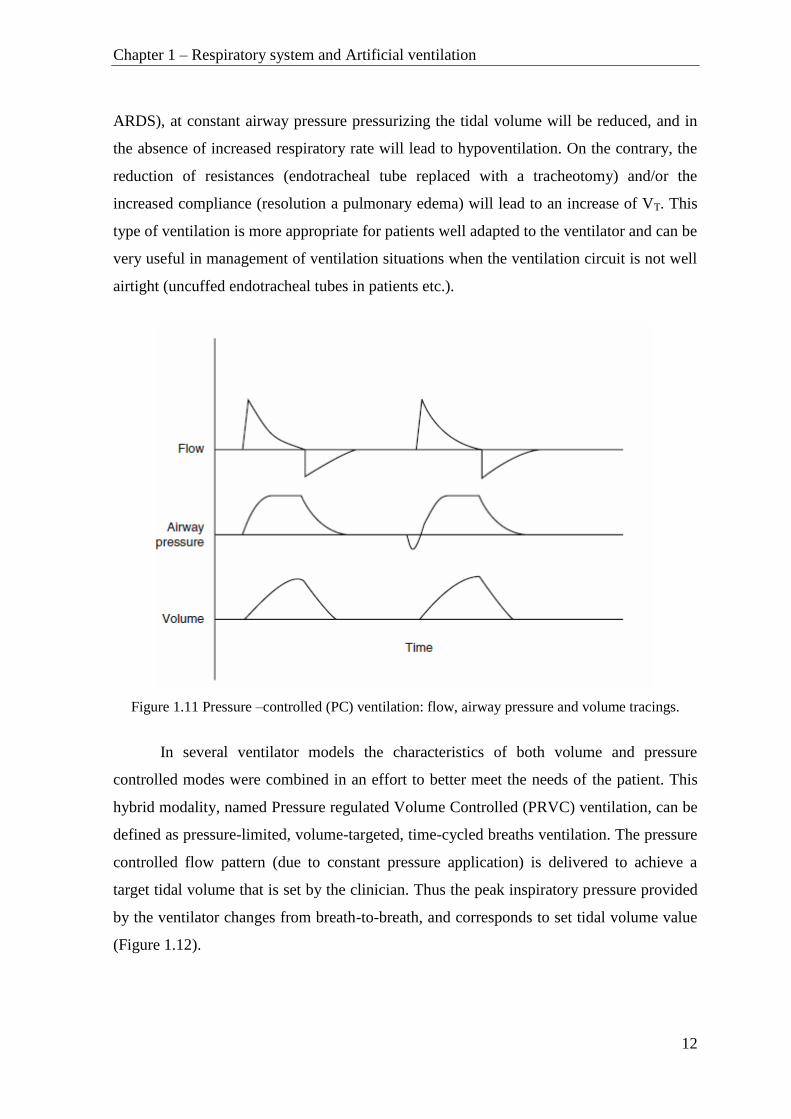
Figure 1.10 Volume-controlled (VC) ventilation: flow, airway pressure and volume tracings.
Pressure Controlled ventilation (PC) mode is characterized by a predetermined
peak inspiratory pressure (PIP - Peak inspiratory pressure), which is programmed on the
ventilator. The ventilator insufflates air up to the value of set pressure. In correspondence
with this limit, the ventilator will stop insufflation and open the valve to allow air to escape
(exhalation). During this mode, cases of hypoventilation and hyperventilation are possible
because of tidal volume variations in function of pulmonary impedance.
The pressure remains constant during the entire inhalation, in the same time the
flow rate rise up to the maximum value and then decreases progressively with the filling of
the lungs. The ventilator ensures that the airway pressure does not exceed the set value.
This should reduce the risks of barotrauma, and achieve a better oxygenation thanks to the
fact that the inspiratory flow is decelerated. It should be underlined that the ventilator in
this modality does not guarantee the delivered VT. In fact, if the airway resistance increase
(bronchospasm, obstruction of the tube) and/or if the compliance is reduced (worsening
Chapter 1 – Respiratory system and Artificial ventilation
12
ARDS), at constant airway pressure pressurizing the tidal volume will be reduced, and in
the absence of increased respiratory rate will lead to hypoventilation. On the contrary, the
reduction of resistances (endotracheal tube replaced with a tracheotomy) and/or the
increased compliance (resolution a pulmonary edema) will lead to an increase of VT. This
type of ventilation is more appropriate for patients well adapted to the ventilator and can be
very useful in management of ventilation situations when the ventilation circuit is not well
airtight (uncuffed endotracheal tubes in patients etc.).
Figure 1.11 Pressure –controlled (PC) ventilation: flow, airway pressure and volume tracings.
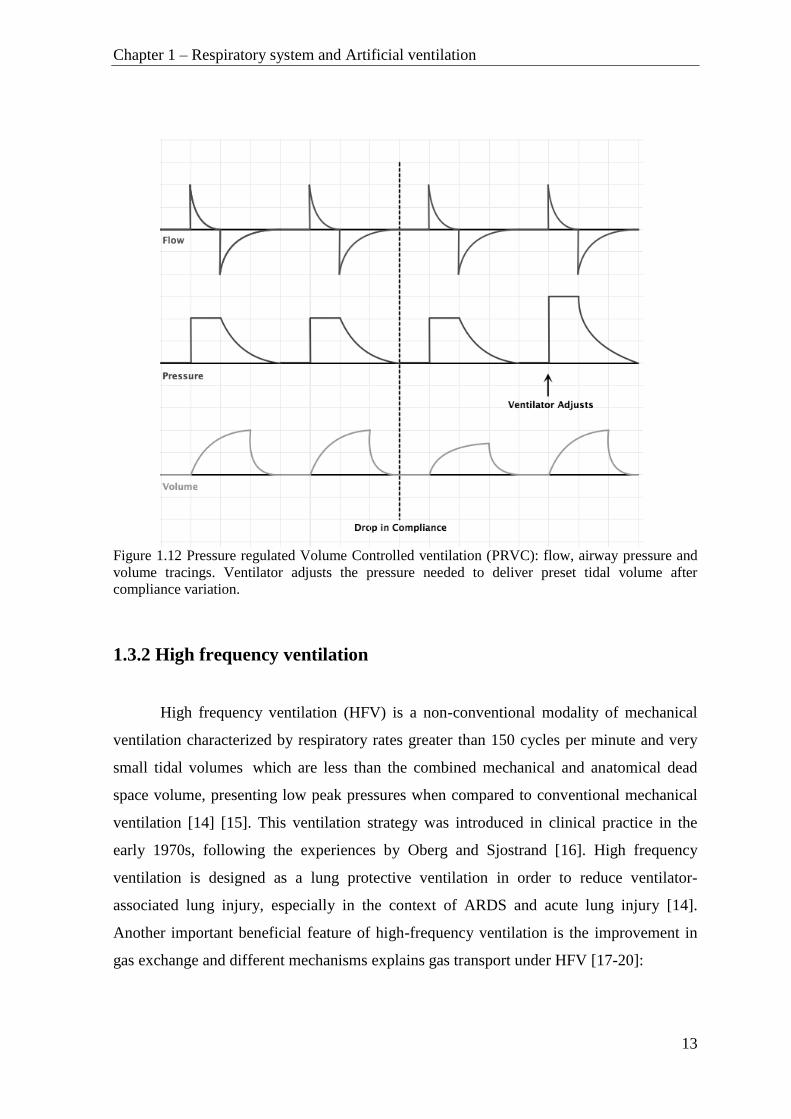
In several ventilator models the characteristics of both volume and pressure
controlled modes were combined in an effort to better meet the needs of the patient. This
hybrid modality, named Pressure regulated Volume Controlled (PRVC) ventilation, can be
defined as pressure-limited, volume-targeted, time-cycled breaths ventilation. The pressure
controlled flow pattern (due to constant pressure application) is delivered to achieve a
target tidal volume that is set by the clinician. Thus the peak inspiratory pressure provided
by the ventilator changes from breath-to-breath, and corresponds to set tidal volume value
(Figure 1.12).
Chapter 1 – Respiratory system and Artificial ventilation
13
Figure 1.12 Pressure regulated Volume Controlled ventilation (PRVC): flow, airway pressure and
volume tracings. Ventilator adjusts the pressure needed to deliver preset tidal volume after
compliance variation.
1.3.2 High frequency ventilation
High frequency ventilation (HFV) is a non-conventional modality of mechanical
ventilation characterized by respiratory rates greater than 150 cycles per minute and very
small tidal volumes which are less than the combined mechanical and anatomical dead
space volume, presenting low peak pressures when compared to conventional mechanical
ventilation [14] [15]. This ventilation strategy was introduced in clinical practice in the
early 1970s, following the experiences by Oberg and Sjostrand [16]. High frequency
ventilation is designed as a lung protective ventilation in order to reduce ventilator-
associated lung injury, especially in the context of ARDS and acute lung injury [14].
Another important beneficial feature of high-frequency ventilation is the improvement in
gas exchange and different mechanisms explains gas transport under HFV [17-20]:

Chapter 1 – Respiratory system and Artificial ventilation
14
Direct bulk flow can promote gas exchange by traditional mechanisms of
convective on bulk flow;
Taylorian dispersion can produce a mixing of fresh and residual gas in the
centre of the airway, increasing the amount of gas exchange that would
occur from simple bulk flow;
Pendelluft effect resulting from variation in regional resistance and
compliance causes some regions to fill and empty more rapidly than others,
yielding a net gas flow between them;
Asymmetric velocity profiles, or coaxial flow, directs gas in the centre of
the airway lumen further into the lung while gas on the margin (close to the
wall) moves out toward the mouth;
Cardiogenic mixing secondary to mechanical agitation from the contracting
heart adds to gas mixing, especially in the peripheral lung units in close
proximity to the heart;
Molecular diffusion may play an important role in mixing gas in the
smallest bronchioles and alveoli.
High frequency ventilation may be used alone, or in combination with conventional
mechanical ventilation. There are different high frequency ventilation techniques,
characterized by the delivery system and the expiratory phase modality [14] [15]:
High Frequency Oscilatory Ventilation (HFOV) is characterized by high
frequencies oscillatory flow (210 - 900 cycles per minute) with both inhalation and
exhalation maintained by active pressures. In this HFV technique the pressure oscillates
around the constant baseline pressure, equal in this case to mean airway pressure and to
positive end-expiratory pressure (PEEP). The gas is insufflated into the lung during
inspiration, and then drawn out during expiration. The tidal volumes are very low, and
usually lower than the dead space of the lung. This technique is used in adult and
especially in neonates patients reduce lung injury, or to prevent further lung injury [21].
High Frequency Jet Ventilation (HFJV) uses an endotracheal tube adaptor in place
for the standard one. A high pressure jet flow, of brief duration (about 0.02 seconds) and

Chapter 1 – Respiratory system and Artificial ventilation
15
high respiratory rate (4-11 Hz), goes through the adaptor into the patient airways. Low
tidal volumes ≤ 1 mL/Kg are delivered during HFJV and the expiratory phase is passive.
In order to achieve optimal exhalation this ventilators utilize different I:E ratios from 1:1.1
to 1:12. In addition, conventional mechanical breaths are sometimes used to aid in
reinflating the lung. The ventilator induced lung injury during this HFV modality is
reduced by 20%.
HFFI High Frequency Flow Interruption (HFFI) is very similar to HFJV but it
differs in delivery mechanism. HFFI gas delivery is usually based on rotating bar with a
small opening placed in the path of a high pressure gas. During the rotation of the bar the
opening lines-up with the gas flow, and a brief pulse of gas enters in the airway. The
maximum pulse frequency is 15 Hz.
High Frequency Positive Pressure Ventilation (HFPPV) is technique which
employs a conventional ventilator at the upper frequency range of the device in order to
deliver HFV. HFPPV modality, rarely used any more in clinical practice, delivers a
conventional breath. The delivered tidal volumes are usually higher respect to other HFV
modalities.
High Frequency Percussive Ventilation (HFPV) is based on high frequency
pulsatile flow combined HFV with time cycled pressure controlled ventilation, and will be
described in detail in the Chapter 2.
16
Chapter 2 – High Frequency Percussive
Ventilation
High Frequency Percussive Ventilation (HFPV) is an advanced ventilatory strategy
which administrates small sub-tidal volumes, or percussions, at higher than conventional
frequencies. High frequency ventilation was introduced in the clinical practice in the early
seventies while HFPV mode was developed and introduced by F. M. Bird in the early
1980's and initially used for the treatment of burn patients with acute respiratory failure
due to smoke inhalation [22].
HFPV associates the beneficial aspects of conventional mechanical ventilation with
those of high-frequency ventilation [23]. This particular high frequency oscillation
ventilation modality delivers a series of high-frequency sub-tidal volumes, by pulsatile
flow (200-900 cycles/min), in combination with low-frequency breathing cycles (10-15
cycles/min). Consequently HFPV encompasses two complementary ventilatory
mechanisms convective and diffusive, corresponding to high frequency oscillations and
pressure controlled conventional ventilation, respectively. HFPV acts as a rhythmic cyclic
ventilation with physically servoed flow regulation, which produces a controlled staking
tidal volume by pulsatile flow [23]. HFPV pressure, flow and volume characteristic
tracings during a single respiratory cycle are depicted in Figure 2.1. During inspiratory
phase lung volumes are progressively increased in controlled stepwise fashion by
repetitively diminishing sub-tidal volume deliveries. Depending on the respiratory system
elastance an oscillatory plateau can be reached and maintained during inspiration. The
ranking part of the volume curve is principally responsible for the convection of the gas
delivery. The plateau phase favors the diffusion of the gases, so allowing better gas
exchange and favoring secretions removal [24]. The expiratory phase is completely
passive. HFPV, like other HFV techniques, offers an advantage over conventional
ventilation by providing an adequate oxygenation at lower airway pressure and tidal
volume, therefore reducing the risk of barotrauma and volutrauma in acute lung injury and
acute respiratory distress syndrome patients.

Chapter 2 - High Frequency Percussive Ventilation
17
Figure 2.1 Pressure, flow and volume tracings during a single respiratory cycle of High
frequency percussive ventilation.
2.1 HFPV ventilator
The only ventilator that delivers HFPV is the Volumetric Diffusive Respirator
VDR-4® (Percussionaire Corporation , Sandpoint, Idaho, USA). This ventilator provides
diffusive\convective cardiopulmonary support to most critical patients, from neonates
through pediatrics to adult patients [25]. The VDR-4® ventilator generates high frequency
pulsatile flow using a pneumatically powered, pressure limited, time cycled flow
interrupter together with phasitron device, flow amplifier which represents the interface
between the patient and the ventilator [22] [25] [26].

Chapter 2 - High Frequency Percussive Ventilation
18
Figure 2.2 HFPV system (right) and its schematic diagram [22] (left).
Figure 2.2 represents a schematic diagram of HFPV system, which consists of a
ventilator, high and low pressure inspiratory circuits, phasitron, nebulization system,
volume reservoir and expiratory circuit. The ventilator is fed by oxygen and air sources,
and the high pressure inspiratory circuit originates from it. The high pressure circuit
consists of non-compliant tubing which connects high pressure pneumatic generator to the
high pressure inspiratory port of phasitron. The low pressure circuit connects ventilator,
volume reservoir and ambient air to low pressure inspiratory port of phasitron through
nebulizator and humidifier downstream from one another. The phasitron is also connected
through exhalation port to the expiratory circuit and equipped with the side-port, located
nearby the endotracheal tube connection, for the real-time measurement of the pressure
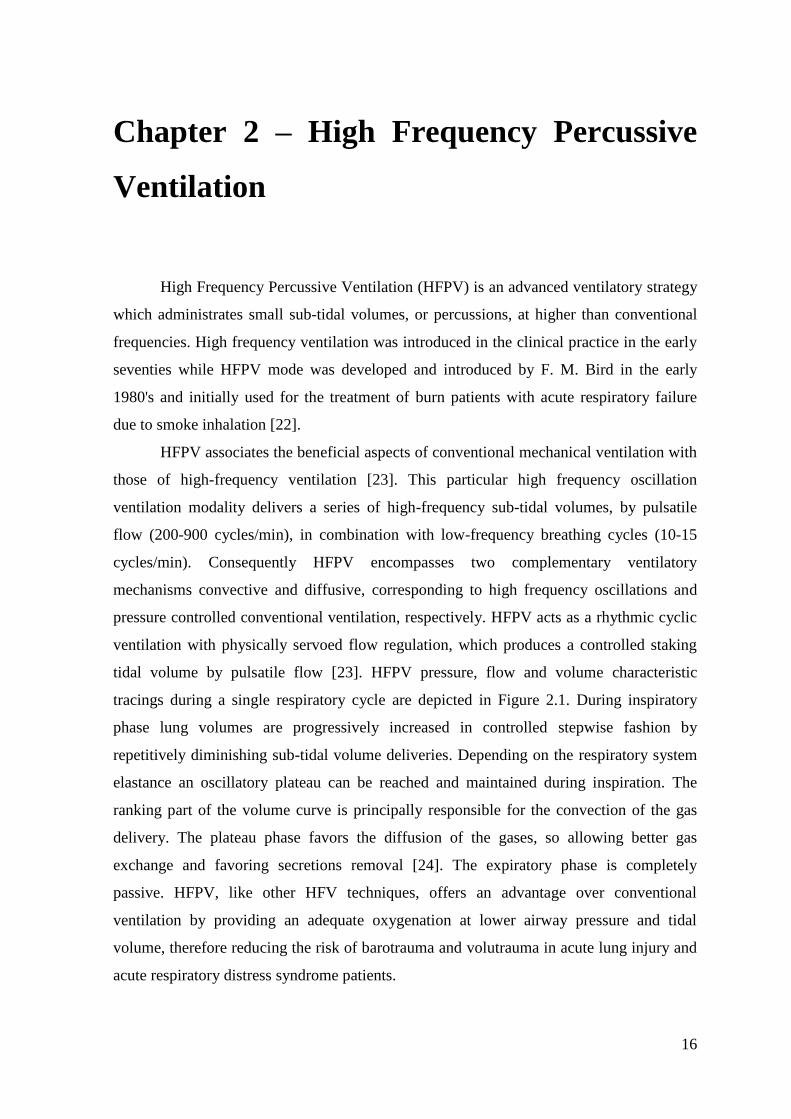
delivered to the patient. The nebulization system (Figure 2.3) is connected to a volume
reservoir and linked to an accessory line which delivers a high-pressure flow synchronized
pulse flow delivered to the phasitron [22]. This system allows administration of
bronchodilators, mucolytics, and pulmonary vasodilators [27], and together with the
humidification system provides to the inspiratory circuit a gaseous mixture heated with
100% humidity.
Chapter 2 - High Frequency Percussive Ventilation
19
Figure 2.3 Nebulization system: Drug injection port (system for the delivery of drugs); Standard IV
refill port (accessory line); Inflow from reservoir of regulators (connection to the reservoir);
Counterpulsing flow from Percussionator (flow from the ventilator); Augmentation tube (low-
pressure inspiratory flow); Automatic refill float (drugs containing reservoir); Nebulizer Power (
accessory line) [22].
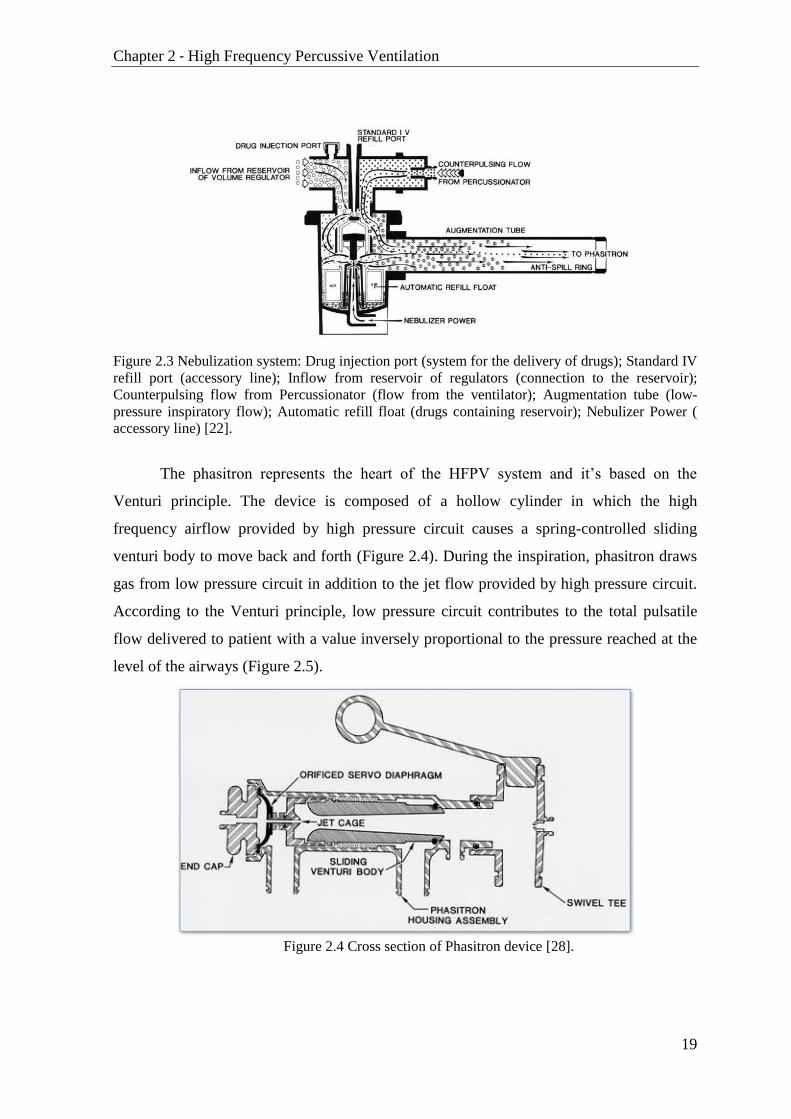
The phasitron represents the heart of the HFPV system and it’s based on the
Venturi principle. The device is composed of a hollow cylinder in which the high
frequency airflow provided by high pressure circuit causes a spring-controlled sliding
venturi body to move back and forth (Figure 2.4). During the inspiration, phasitron draws
gas from low pressure circuit in addition to the jet flow provided by high pressure circuit.
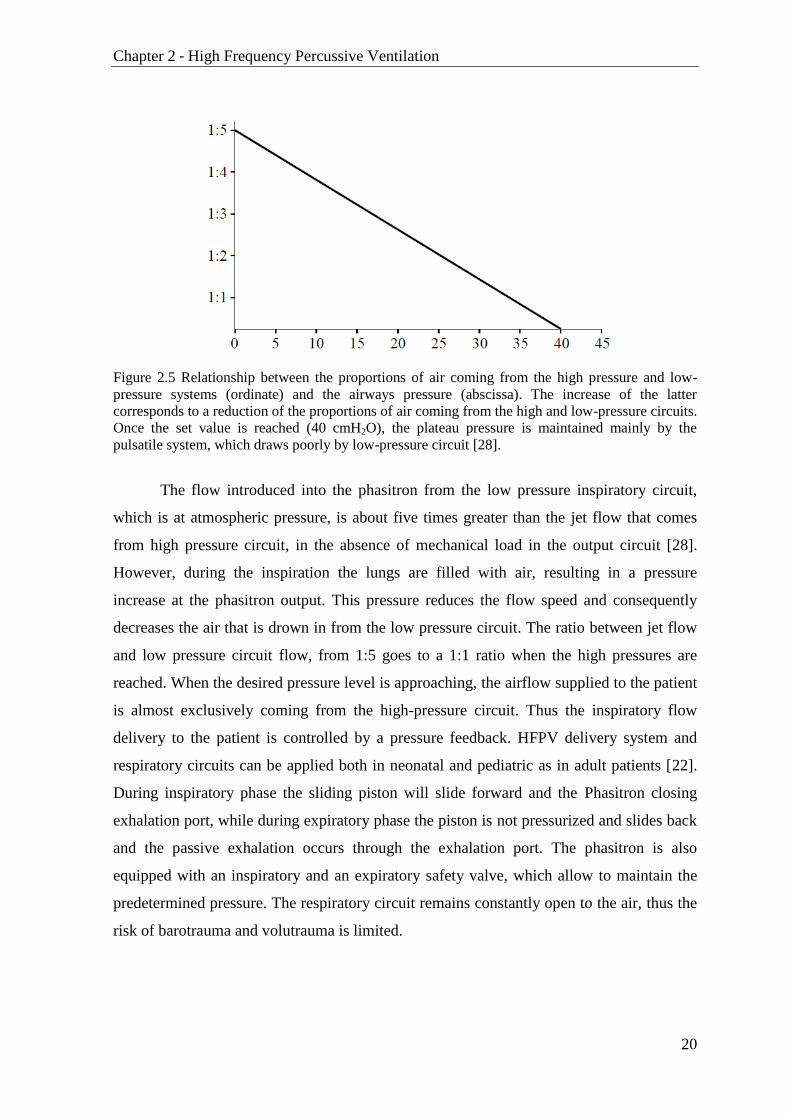
According to the Venturi principle, low pressure circuit contributes to the total pulsatile
flow delivered to patient with a value inversely proportional to the pressure reached at the
level of the airways (Figure 2.5).
Figure 2.4 Cross section of Phasitron device [28].
Chapter 2 - High Frequency Percussive Ventilation
20
Figure 2.5 Relationship between the proportions of air coming from the high pressure and low-
pressure systems (ordinate) and the airways pressure (abscissa). The increase of the latter
corresponds to a reduction of the proportions of air coming from the high and low-pressure circuits.
Once the set value is reached (40 cmH2O), the plateau pressure is maintained mainly by the
pulsatile system, which draws poorly by low-pressure circuit [28].
The flow introduced into the phasitron from the low pressure inspiratory circuit,
which is at atmospheric pressure, is about five times greater than the jet flow that comes
from high pressure circuit, in the absence of mechanical load in the output circuit [28].
However, during the inspiration the lungs are filled with air, resulting in a pressure
increase at the phasitron output. This pressure reduces the flow speed and consequently
decreases the air that is drown in from the low pressure circuit. The ratio between jet flow
and low pressure circuit flow, from 1:5 goes to a 1:1 ratio when the high pressures are
reached. When the desired pressure level is approaching, the airflow supplied to the patient
is almost exclusively coming from the high-pressure circuit. Thus the inspiratory flow
delivery to the patient is controlled by a pressure feedback. HFPV delivery system and
respiratory circuits can be applied both in neonatal and pediatric as in adult patients [22].
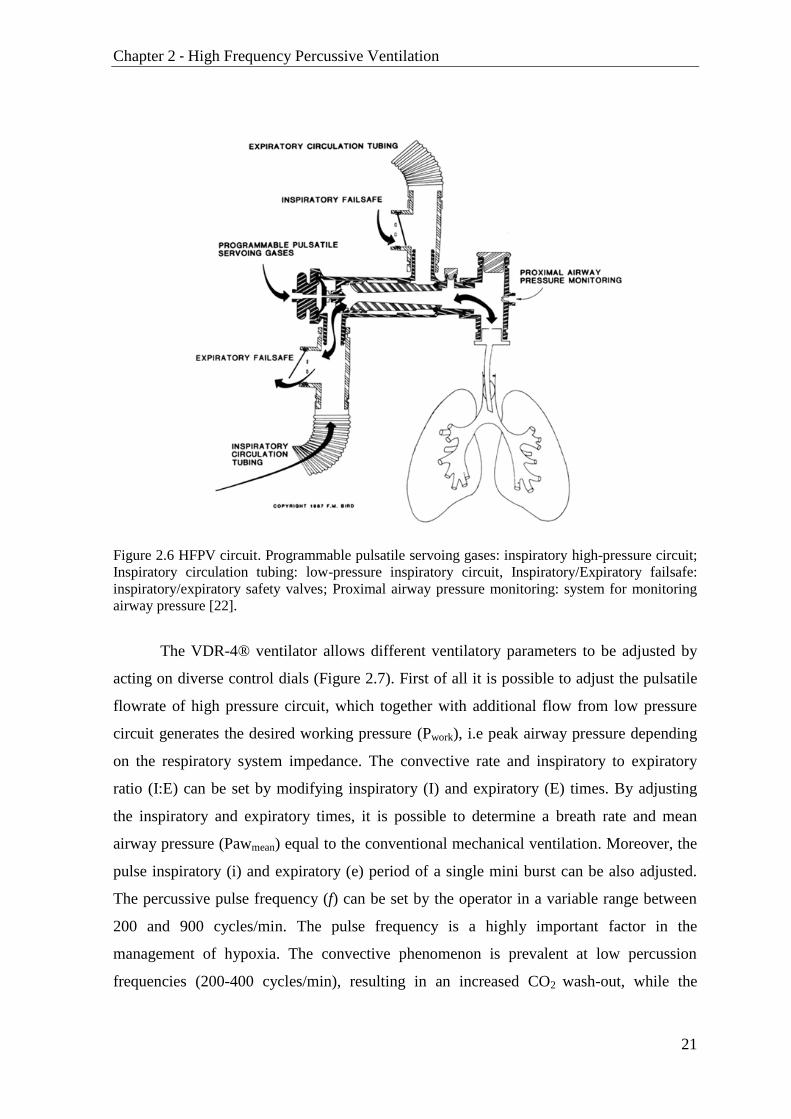
During inspiratory phase the sliding piston will slide forward and the Phasitron closing
exhalation port, while during expiratory phase the piston is not pressurized and slides back
and the passive exhalation occurs through the exhalation port. The phasitron is also
equipped with an inspiratory and an expiratory safety valve, which allow to maintain the
predetermined pressure. The respiratory circuit remains constantly open to the air, thus the
risk of barotrauma and volutrauma is limited.
Chapter 2 - High Frequency Percussive Ventilation
21
Figure 2.6 HFPV circuit. Programmable pulsatile servoing gases: inspiratory high-pressure circuit;
Inspiratory circulation tubing: low-pressure inspiratory circuit, Inspiratory/Expiratory failsafe:
inspiratory/expiratory safety valves; Proximal airway pressure monitoring: system for monitoring
airway pressure [22].
The VDR-4® ventilator allows different ventilatory parameters to be adjusted by
acting on diverse control dials (Figure 2.7). First of all it is possible to adjust the pulsatile
flowrate of high pressure circuit, which together with additional flow from low pressure
circuit generates the desired working pressure (Pwork), i.e peak airway pressure depending
on the respiratory system impedance. The convective rate and inspiratory to expiratory
ratio (I:E) can be set by modifying inspiratory (I) and expiratory (E) times. By adjusting
the inspiratory and expiratory times, it is possible to determine a breath rate and mean
airway pressure (Pawmean) equal to the conventional mechanical ventilation. Moreover, the
pulse inspiratory (i) and expiratory (e) period of a single mini burst can be also adjusted.
The percussive pulse frequency (f) can be set by the operator in a variable range between
200 and 900 cycles/min. The pulse frequency is a highly important factor in the
management of hypoxia. The convective phenomenon is prevalent at low percussion
frequencies (200-400 cycles/min), resulting in an increased CO2 wash-out, while the

Chapter 2 - High Frequency Percussive Ventilation
22
diffusive phenomenon is more significant at high percussion frequencies (600-900
cycles/min) [22].
Figure 2.7 VDR-4® HFPV ventilator and Monitron® pressure wave form analyzer [28].
2.8 HFPV pressure curve during a single respiratory cycle and settable features

Chapter 2 - High Frequency Percussive Ventilation
23
The positive end-expiratory pressure (PEEP) can be also adjusted and can have
constant or oscillating flow pattern (Oscillatory PEEP). During the inspiratory phase the
additional convective contribution can be provided through the convective pressure rise
(Figure 2.9). Through the air-oxygen blender dial it is possible to set the fraction of
inspired oxygen FiO2. Thus, by acting on these ventilatory parameters it is possible to set
the desired HFPV ventilation pattern.
Figure 2.10 Pressure curves during HFPV. The tele-inspiratory phase of the second act has a
pressure increase caused by a supplementary flow set by the operator. This option allows, for the
same inspiratory time (I), an increase in the volume delivered due to convection [22].
The ventilation monitoring unit Monitron® provided together with the HFPV
VDR-4® ventilator is exclusively based on airway pressure signal recordings. The airway
pressure is recorded at the patient output of phasitron and is displayed on monitoring
device together with parameters extracted from pressure signal (Figure 2.11). The device
provide information about I:E and i:e ratio, low frequency breath rate (i.e convective rate),
inspiration and expiration time, percussive frequency, peak and mean airway pressure, as
also positive end expiratory pressure. These parameter readings are used by physician or
therapist during the ventilation setup and later on during ventilation monitoring.

Chapter 2 - High Frequency Percussive Ventilation
24
Figure 2.11 Display of HFPV monitoring unit Monitron® [28].
2.2 Impact of mechanical load on pressure flow and volume
delivery during HFPV
HFPV delivery system together with phasitron modulates flow administration,
therefore it is important to evaluate how the generated pressure, flow and volume change
in face of different lung loads. Lucangelo et al studied the effects of mechanical load on
pressure, flow and volume delivered by high-frequency percussive ventilation using a
single-compartment lung simulator with varying elastic and resistive loads [15][29].
Respiratory signals in the output of ventilator were recorded maintaining the
selected ventilatory settings of the HFPV device, while resistance (R) and elastance (E)
values were modified. The percussive frequency was 500 cycles/min, the mini-burst i/e
ratio was 1:2.75, while the convective ventilation rate amounted to 10 cycles/min, and the
I/E ratio equalled 1:1.25. The expiratory phase was passive. The pulsatile flowrate dial was
kept constant during the experiment. The initial setting was: E = 20 cmH2O/L, R = 0
cmH2O/L/s. Ventilator delivery was evaluated in 15 different combinations of three elastic
(E = 20, 50, 100 cmH2O/L), and five resistive loads (R = 0, 5, 20, 50, 200 cmH2O/L/s).
Chapter 2 - High Frequency Percussive Ventilation
25
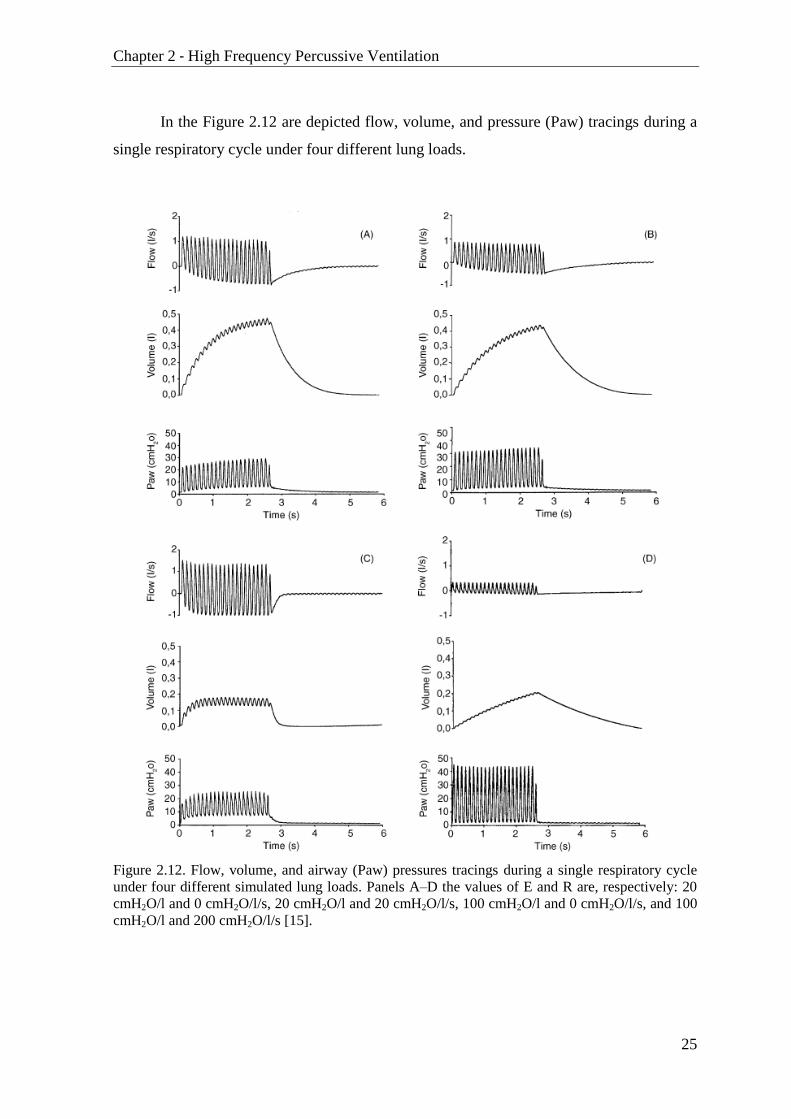
In the Figure 2.12 are depicted flow, volume, and pressure (Paw) tracings during a
single respiratory cycle under four different lung loads.
Figure 2.12. Flow, volume, and airway (Paw) pressures tracings during a single respiratory cycle
under four different simulated lung loads. Panels A–D the values of E and R are, respectively: 20
cmH2O/l and 0 cmH2O/l/s, 20 cmH2O/l and 20 cmH2O/l/s, 100 cmH2O/l and 0 cmH2O/l/s, and 100
cmH2O/l and 200 cmH2O/l/s [15].

Chapter 2 - High Frequency Percussive Ventilation
26
Maintaining the same elastance value, resistance increase resulted in flow reduction
(Figure 2.12 A-B). This is due to the fact that higher airway resistance produces higher
airway pressures and flow decreases as a consequence of phasitron pressure feedback. This
phenomenon is even more noticeable comparing pressure e flow considering extreme
resistance values (Figure 2.12 C-D). In all cases during initial part of inspiration the
positive peak flow was definitely higher than the negative (Figure 2.12). Thus in this phase
the quantity of air introduced into the system is greater than the volume washed out of it.
The tidal volume rises till it reaches a plateau at the end of inspiration phase, in which the
absolute values of the positive and the negative peak flows are very similar, and the net
flow approaches zero (Figure 2.13).
Figure 2.13 Volume and flow traces during a single inspiration. Cumulative input-volume (Vin),
cumulative output-volume (Vout), total cumulative volume Vtot and plateau period Tplateau are
also depicted in the top panel. Figure modified from [29].
These flow oscillations during the plateau phase may be useful for gas exchange,
but they do not increase the inspired volume, so the final tidal volume value VT is reached
in this phase. In the case of low resistance and high elastance the plateau phase in the
Chapter 2 - High Frequency Percussive Ventilation
27
volume curve was reached much earlier during inspiration and had greater duration of the
plateau (Figure 2.12 C).
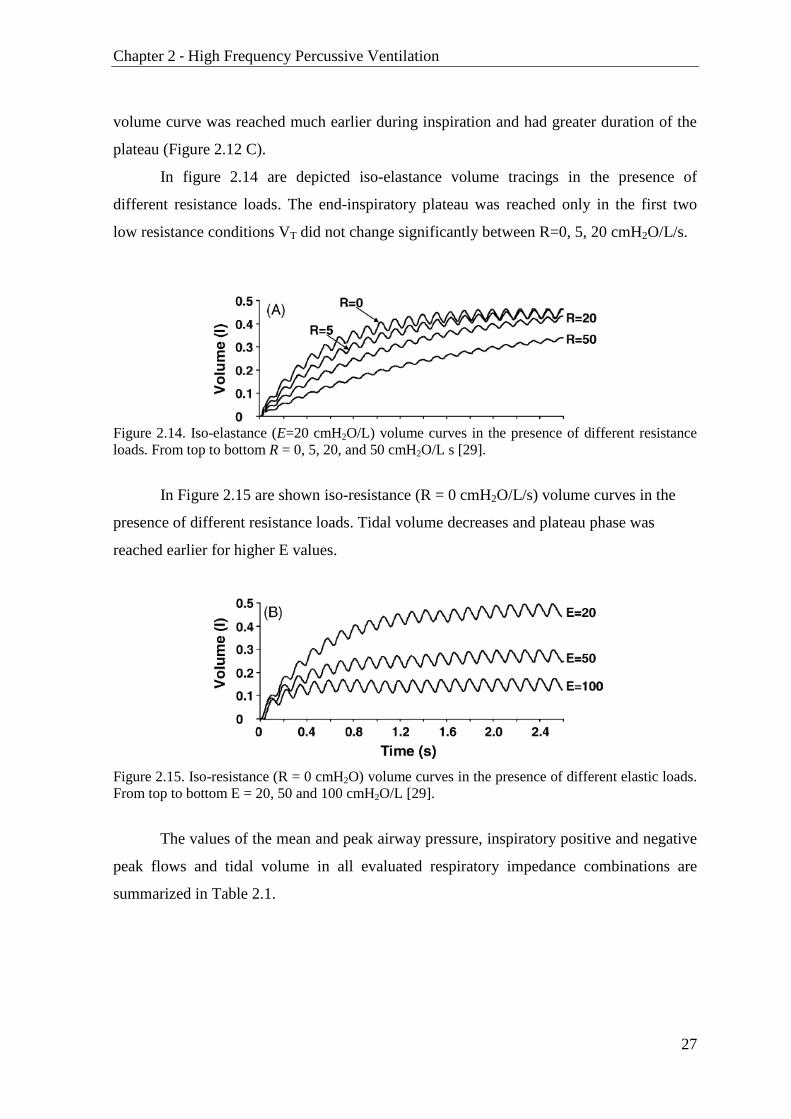
In figure 2.14 are depicted iso-elastance volume tracings in the presence of
different resistance loads. The end-inspiratory plateau was reached only in the first two
low resistance conditions VT did not change significantly between R=0, 5, 20 cmH2O/L/s.
Figure 2.14. Iso-elastance (E=20 cmH2O/L) volume curves in the presence of different resistance
loads. From top to bottom R = 0, 5, 20, and 50 cmH2O/L s [29].
In Figure 2.15 are shown iso-resistance (R = 0 cmH2O/L/s) volume curves in the
presence of different resistance loads. Tidal volume decreases and plateau phase was
reached earlier for higher E values.
Figure 2.15. Iso-resistance (R = 0 cmH2O) volume curves in the presence of different elastic loads.
From top to bottom E = 20, 50 and 100 cmH2O/L [29].
The values of the mean and peak airway pressure, inspiratory positive and negative
peak flows and tidal volume in all evaluated respiratory impedance combinations are
summarized in Table 2.1.
Chapter 2 - High Frequency Percussive Ventilation
28
R cmH2O L
-1 s
E cmH2O L
-1 Pawm
cmH2O Pawpeak
cmH2O VPpeak
L s-1
VNpeak
L s-1
VT
mL
0 20 6.91 26.68 1.59 -1.03 465
0 50 7.09 26.55 1.54 -1.03 269
0 100 7.17 26.54 1.54 -1.03 163
5 20 7.57 29.22 1.21 -0.78 470
5 50 7.63 29.82 1.23 -0.79 258
5 100 7.75 28.90 1.22 -0.83 141
20 20 8.23 34.36 0.87 -0.53 437
20 50 8.26 34.75 0.88 -0.56 215
20 100 8.32 34.49 0.88 -0.59 120
50 20 8.60 39.06 0.56 -0.32 257
50 50 8.87 39.72 0.57 -0.37 162
50 100 8.83 39.75 0.57 -0.41 96
200 20 9.27 44.84 0.33 -0.16 205
200 50 9.34 45.43 0.34 -0.19 164
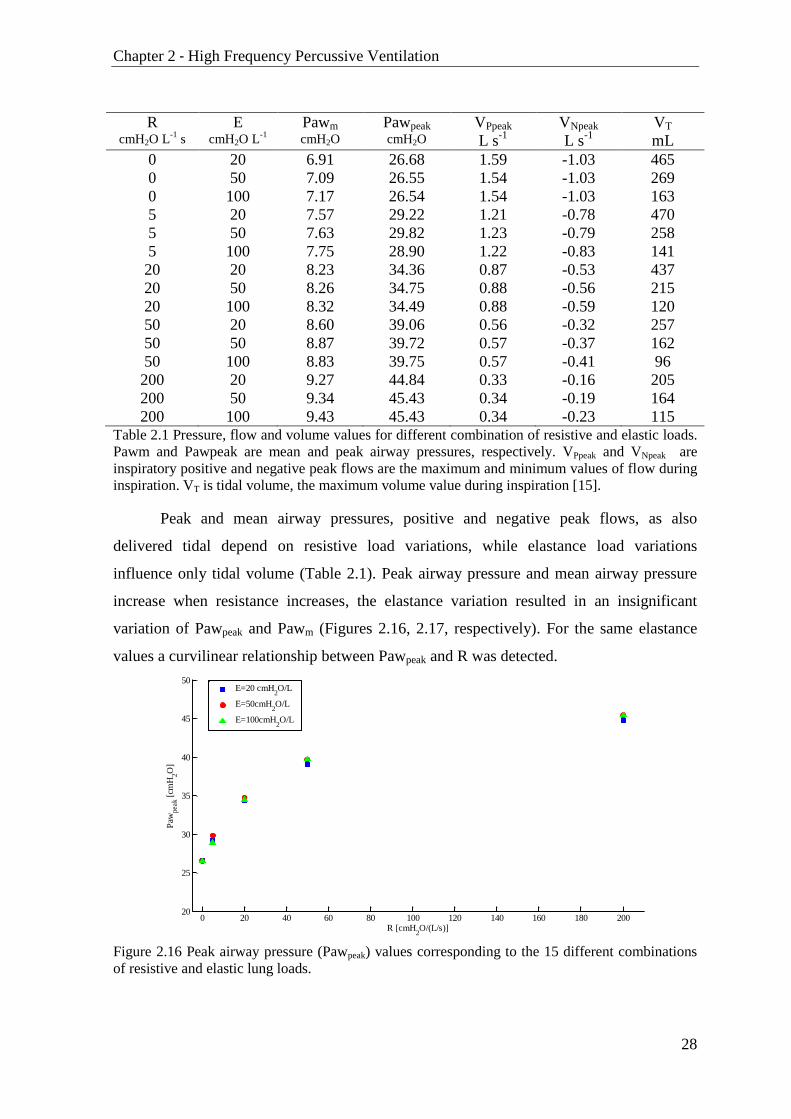
200 100 9.43 45.43 0.34 -0.23 115 Table 2.1 Pressure, flow and volume values for different combination of resistive and elastic loads.
Pawm and Pawpeak are mean and peak airway pressures, respectively. VPpeak and VNpeak are
inspiratory positive and negative peak flows are the maximum and minimum values of flow during
inspiration. VT is tidal volume, the maximum volume value during inspiration [15].
Peak and mean airway pressures, positive and negative peak flows, as also
delivered tidal depend on resistive load variations, while elastance load variations
influence only tidal volume (Table 2.1). Peak airway pressure and mean airway pressure
increase when resistance increases, the elastance variation resulted in an insignificant
variation of Pawpeak and Pawm (Figures 2.16, 2.17, respectively). For the same elastance
values a curvilinear relationship between Pawpeak and R was detected.
Figure 2.16 Peak airway pressure (Pawpeak) values corresponding to the 15 different combinations
of resistive and elastic lung loads.
0 20 40 60 80 100 120 140 160 180 20020
25
30
35
40
45
50
R [cmH2O/(L/s)]
Paw
peak [
cmH
2O
]
E=20 cmH
2O/L
E=50cmH2O/L
E=100cmH2O/L
Chapter 2 - High Frequency Percussive Ventilation
29
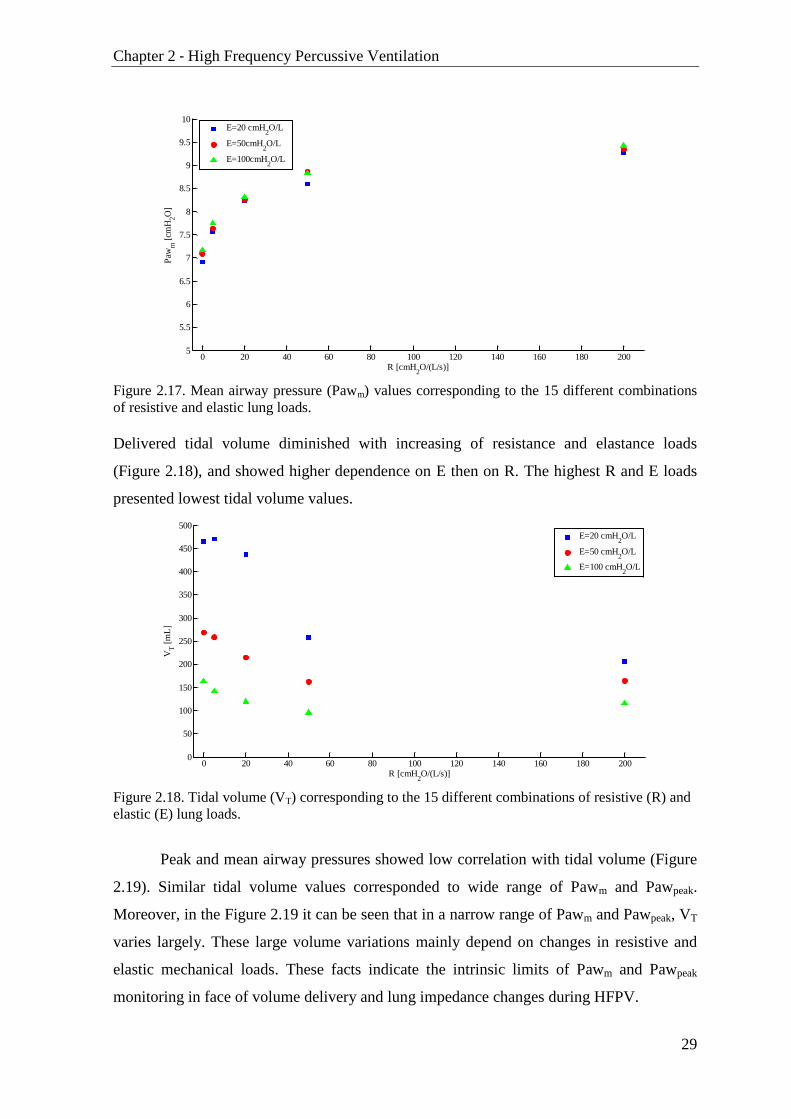
Figure 2.17. Mean airway pressure (Pawm) values corresponding to the 15 different combinations
of resistive and elastic lung loads.
Delivered tidal volume diminished with increasing of resistance and elastance loads
(Figure 2.18), and showed higher dependence on E then on R. The highest R and E loads
presented lowest tidal volume values.
Figure 2.18. Tidal volume (VT) corresponding to the 15 different combinations of resistive (R) and
elastic (E) lung loads.
Peak and mean airway pressures showed low correlation with tidal volume (Figure
2.19). Similar tidal volume values corresponded to wide range of Pawm and Pawpeak.
Moreover, in the Figure 2.19 it can be seen that in a narrow range of Pawm and Pawpeak, VT
varies largely. These large volume variations mainly depend on changes in resistive and
elastic mechanical loads. These facts indicate the intrinsic limits of Pawm and Pawpeak
monitoring in face of volume delivery and lung impedance changes during HFPV.
0 20 40 60 80 100 120 140 160 180 2005
5.5
6
6.5
7
7.5
8
8.5
9
9.5
10
R [cmH2O/(L/s)]
Paw
m [
cmH
2O
]
E=20 cmH
2O/L
E=50cmH2O/L
E=100cmH2O/L
0 20 40 60 80 100 120 140 160 180 2000
50
100
150
200
250
300
350
400
450
500
R [cmH2O/(L/s)]
VT [
mL
]
E=20 cmH
2O/L
E=50 cmH2O/L
E=100 cmH2O/L

Chapter 2 - High Frequency Percussive Ventilation
30
Figure 2.19. Tidal Volume (VT) plotted versus Pawm (left panel) and Pawpeak (right panel) in 15
different R and E experimental conditions.
Tidal volume during a HFPV is provided as the difference between delivered
pulsatile input and output volumes, thus some amount of gas is washed out of the lungs
throughout inspiration washing carbon dioxide out of it and moving oxygen in. This could
be very important in case of short diffusive ventilation time. From the clinical point of
view it is also important to evaluate the effects of respiratory system impedance on
washout volume during HFPV in terms of tidal volume and lung washout parameters:
cumulative input-volume (Vin), cumulative output-volume (Vout), total cumulative volume
Vtot and plateau period Tplateau corresponding to the mathematical integration of positive
and negative flow during inspiration, total volume delivered by ventilator during
inspiration and duration of plateau phase, respectively (Figure 2.13). The elastic or
resistive loading modulates HFPV delivery a way that washout volume increases when
time allowed for diffusive ventilation decreases and vice versa [29]:
High turnover gas in the lung with VT/Vtot from to 8.7 to 42.5 %. This ratio
increases with R, while decreases with E
VT does not change significantly in lower resistances (R=0-20 cmH2O/L/s), while
either Vtot, Vin and Vout decreases progressively as R increases
Tplateau/I increases and VT/Vtot as alsoVT decreases with increasing of E
6.5 7 7.5 8 8.5 9 9.550
100
150
200
250
300
350
400
450
500
VT [
mL
]
Pawm
[cmH2O]
25 30 35 40 45 5050
100
150
200
250
300
350
400
450
500
VT [
mL
]
Pawpeak
[cmH2O]

Chapter 2 - High Frequency Percussive Ventilation
31
2.3 HFPV clinical applications
The earliest use of HFPV occurred in the treatment of closed head injury [30] and
patients with acute respiratory distress syndrome (ARDS) caused by burns and smoke
inhalation [31] [32]. HFPV was successfully used for treatment of newborns with hyaline
membrane disease and/or ARDS [33-35]. HFPV was also employed in patients with
neuromuscular disease [36] and in patients with acute respiratory failure following chest
trauma [37]. Over the years, HFPV has proven highly effective in severe hypoxemic non
responders to conventional mechanical ventilation [38]. The efficacy of HFPV has been
demonstrated also in removing bronchial secretions under diverse conditions [39].
This non-conventional ventilatory modality was found effective in physiotherapy of
cystic fibrosis patents, during a pilot study which compared the effects of HFPV with those
of conventional chest physiotherapy [40].
The outcome studies are limited because HFPV is being more used in clinical
situations when other conventional ventilator modes have not achieved the targeted
oxygenation and ventilation goals [27]. The study which involved 24 patients with acute
respiratory failure showed that during the HFPV treatment the best combined effect on
clearance of CO2 and improvement of hypoxia is reached at percussion frequency of 500
cycles/min [41]. Comparing conventional ventilation and HFPV in seven patients with
severe respiratory distress at equal airway peak pressure and FiO2 lung gas exchange in
terms of partial pressure of oxygen in the blood (PaO2) improved significantly [42]. HFPV
has been also recently inserted among the ventilatory strategies to use in severe hypoxemic
respiratory failure [43].
HFPV was also employed during surgery [44] [45]. HFPV enabled adequate gas
exchange during the surgical bronchial repair in a patient with one lung [44]. During
thoracotomy, the nondependent lung was ventilated with HFPV to avoid hypoxemia in 22
patients and results were compared to other patients which 22 received continuous positive
airway pressure (CPAP). HFPV improved oxygenation in one-lung ventilation during
pulmonary resection and postoperatively, it decreased the length of stay and increased the
mobilization and removal of endobronchial secretions in comparison with CPAP [45].
Most recently, Lucangelo et al. reported that early short-term application of HFPV
improved gas exchange in 35 hypoxemic patients who did not respond to 12h conventional
Chapter 2 - High Frequency Percussive Ventilation
32
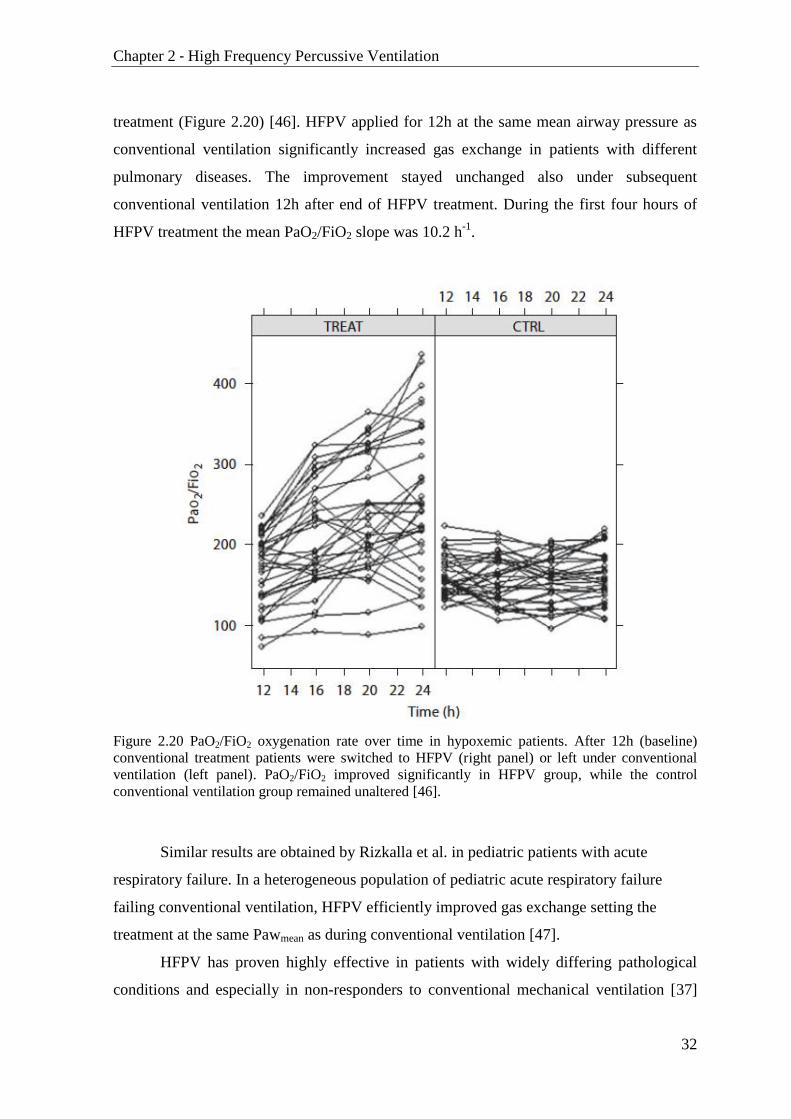
treatment (Figure 2.20) [46]. HFPV applied for 12h at the same mean airway pressure as
conventional ventilation significantly increased gas exchange in patients with different
pulmonary diseases. The improvement stayed unchanged also under subsequent
conventional ventilation 12h after end of HFPV treatment. During the first four hours of
HFPV treatment the mean PaO2/FiO2 slope was 10.2 h-1
.
Figure 2.20 PaO2/FiO2 oxygenation rate over time in hypoxemic patients. After 12h (baseline)
conventional treatment patients were switched to HFPV (right panel) or left under conventional
ventilation (left panel). PaO2/FiO2 improved significantly in HFPV group, while the control
conventional ventilation group remained unaltered [46].
Similar results are obtained by Rizkalla et al. in pediatric patients with acute
respiratory failure. In a heterogeneous population of pediatric acute respiratory failure
failing conventional ventilation, HFPV efficiently improved gas exchange setting the
treatment at the same Pawmean as during conventional ventilation [47].
HFPV has proven highly effective in patients with widely differing pathological
conditions and especially in non-responders to conventional mechanical ventilation [37]

Chapter 2 - High Frequency Percussive Ventilation
33
[46] [47]. However in these cases HFPV setup was based only on Pawmean and gas
exchange analysis without considering real delivered tidal volume, respiratory resistance
and compliance and tracheal tube pressure drop parameters. Pawmean is weakly correlated
with VT and respiratory resistance and compliance modify HFPV delivery, thus for tool for
measuring and estimation of this parameters is required for a personalized HFPV ventilator
setup in order to improve the treatment in the safe way.
34
Chapter 3 – In vitro estimation of
respiratory parameters during HFPV
HFPV monitoring system currently is based exclusively on airway pressure
measurement. The airway pressure tracings, peak and mean airway pressures, together with
gas exchange analysis, at the present time are the only parameters that guide the physician
during the HFPV treatment [46]. These parameters provide only partial information about
HFPV treatment setup and its clinical effectiveness. In patients under diverse mechanical
ventilation techniques the information on gas exchange alone may not suffice [46]. HFPV
is not an intuitive ventilatory modality and the absence of valuable information during the
treatment, as delivered tidal volume, respiratory system resistance and compliance,
produces disaffection among the physicians [48]. Thus, knowing these parameters is
necessary for a personalized HFPV setup in order to improve beneficial aspects of this
non-conventional ventilatory strategy. To overcome aforementioned limitation the
measurement of pressure, flow and volume respiratory signals together with tools for
estimation of resistance and compliance parameters during HFPV are needed.
Pressure Paw(t) and flow V̇(t) may be measured using appropriate pressure and
flow transducers, placing them between phasitron and endotracheal tube. Volume and
volume acceleration can be calculated by numerical integration and derivation of acquired
flow signal, respectively. On the contrary, respiratory mechanics parameters are not
directly measurable.
3.1 Respiratory signal measurement during HFPV
High frequency percussive ventilation is characterized by high frequency pulsatile
oscillations of pressure and flow respiratory signals. Monitoring devices widely used in
conventional mechanical ventilation, which is characterized by low frequency respiratory
signals, are not designed for monitoring of respiratory parameters undergoing this high
frequency ventilatory modality. Slow response time of transducer and low sampling

Chapter 3 – In vitro estimation of respiratory parameters during HFPV
35
frequency present the limit of these devices. In fact, Riscica et al. demonstrated that such
devices in case of HFPV are generating errors in pressure flow and especially volume
measurement, so they are not adequate in these ventilatory conditions [49]. Therefore, for a
correct measurement of respiratory parameters undergoing HFPV a wide bandwidth
measurement system is required using new generation high sensitivity and low response
time.
The range of pressure measurements is defined by the absolute pressures reached
during HFPV ventilation in the patients upper respiratory tract that have order of
magnitude of some tens of cmH2O. In this work pressures were measured by ASCX01DN
unipolar pressure transducers (Honeywell, USA), which measures pressure in the range of
0-70 cmH2O and has a response time of 0.1 ms. (Figure 3.1)
Figure 3.1 The ASCX01DN differential and gauge pressure transducer.
The flow signal V̇ was measured by Fleisch pneumotachograph (Figure 3.2), which
converts flow in a differential pressure, successively measured by high sensibility
differential pressure transducer. The typical flow values generated by HFPV are lower than
2 L/s. Fleisch pneumotachograph Type 2 (Lausanne, Switzerland), characterized by
maximum advisable flow of 2.5 L/s and dead space of 35mL, was used.
Figure 3.2 Fleisch pneumotachograph (left) and its cross sections (right)

Chapter 3 – In vitro estimation of respiratory parameters during HFPV
36
The flow values up to 2 L/s correspond to differential pressures up to 0.66 cmH2O
in output of Fleisch type 2 pneumotachograph. High sensitivity, amplified differential low
pressure (±0.63 cmH2O) and fast response (0.5 ms) transducer 0.25INCH–D-4V (ALL
SENSORS, USA) was used to measure differential pressure present across the
pneumotachograph.
Figure 3.3 Low differential pressure transducer 0.25INCH–D-4V
0.25INCH–D-4V transducer provides a ratiometric 4-volt output, with reduced
output off set errors owing to change in temperature, stability to warm-up, stability to long
time period, and position sensitivity. The sensor uses a silicon, micromachined, stress
concentration enhanced structure to provide a very linear output to measured pressure.
These calibrated and temperature compensated sensors give an accurate and stable output
over a wide temperature range.
The transducers were interfaced with a suitable conditioning boards designed and
produced during this work at Biomedical Instrumentation and Signal Processing
Laboratory at University of Trieste. The respiratory signals were filtered with a second
order Butterworth low pass filters and sampled at 2kHz by using either PCI-6023E or NI-
USB6009 (National Instruments, Austin, USA) data acquisition board with 12 and 14 bit
resolution, respectively. Volume (V) was calculated by numerical integration [50]. Volume
acceleration (V̈) was calculated by numerical differentiation of the air flow using low-noise
Lanczos differentiator described by the following equation:
where fs is the sampling frequency and n the sample index.
The reliability of respiratory signal measurement, using described devices, was
assessed in vitro. The volume measurement error lower than 3%.
))3n(V)3n(V(3))2n(V)2n(V(2)1n(V)1n(V28
f)n(V s

Chapter 3 – In vitro estimation of respiratory parameters during HFPV
37
3.2 In vitro estimation of viscoelastic parameters during HFPV
Assessment of respiratory mechanics viscoelastic parameters can play a central role
in the management of acute respiratory failure (ARF) patients undergoing artificial
ventilation [2] [8]. ARF is characterized by a rapid deterioration in pulmonary gas
exchange that may be due either to alterations in the mechanical properties of the
respiratory system leading to ventilation–perfusion mismatching or shunt, or to
neuromuscular insufficiency causing alveolar hypoventilation [8]. Valuation of respiratory
function and mechanics is very important in order to [8]:
understand the pathophysiology of the disease underlying ARF;
assess the status and progress of the disease;
provide guidelines for therapeutic measures (positive end-expiratory
pressure, bronchodilators, fluids);
improve patient–ventilator interaction;
prevent ventilator-related complications;
plan the discontinuation of mechanical ventilation.
The rapid airway occlusion technique is regularly used for evaluation of respiratory
mechanics parameters in patient undergoing conventional ventilation [51] [52]. Technique
is based on brief occlusion, during constant flow inflation, applied at the end of expiration
end expiratory occlusion, EEO) or at the end of the inspiration (end inspiratory occlusion,
EIO). EEO provides only a measure of auto-PEEP (i.e. intrinsic positive end-expiratory
pressure PEEPi), while a EIO provides measurement of most respiratory mechanics
parameters (R, C, PEEP). In the latter the occlusion is applied right before the end of the
inspiration and results in an immediate airway pressure drop from a peak preassure (Ppeak)
to a lower value (P1) followed by slow decay reaching the plateau value (Pplat) in a few
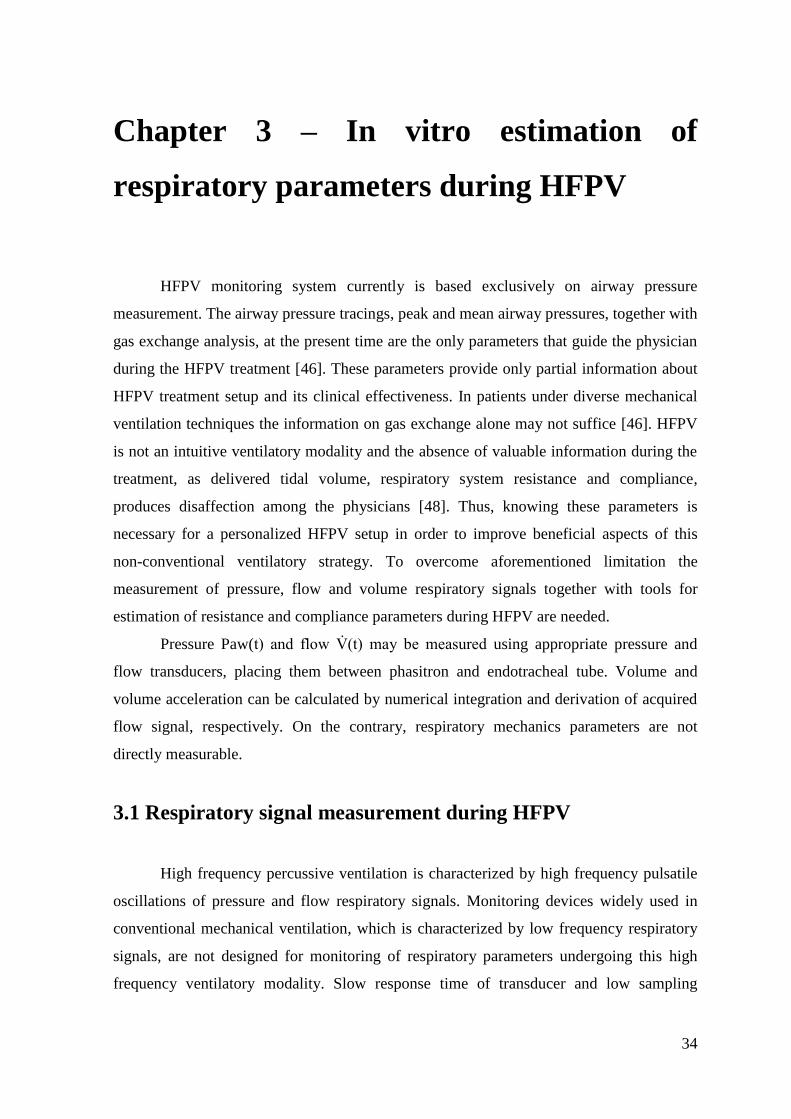
seconds [53] (Figure 3.4).
Chapter 3 – In vitro estimation of respiratory parameters during HFPV
38
Figure 3.4 Pressure (a) and flow (b) tracings during end inflation occlusion procedure [53].
The pressure fall from Ppeak to Pplat is due to the total resistance Rtot which can be
calculated as:
𝑅𝑡𝑜𝑡 =𝑃𝑝𝑒𝑎𝑘 − 𝑃𝑝𝑙𝑎𝑡
�̇�
where V̇ is a constant flow value.
The static elastance Est can be also calculated from these maneuvers:
𝐸𝑠𝑡 =𝑃𝑝𝑙𝑎𝑡 − 𝑃𝐸𝐸𝑃𝑖
𝑉𝑇
where VT is tidal volume value immediately preceding the occlusion.
However, the occlusion technique for estimation of respiratory mechanic
parameters requires either ventilators adequately equipped (i.e Paw, V̇, V measurement
and occlusion valve) or additional equipment (i.e. pneumotachograph, pressure transducer,
occlusion valve) inserted in line to the ventilator circuit. The occlusion method interferes

Chapter 3 – In vitro estimation of respiratory parameters during HFPV
39
with the ventilator settings and ventilation pattern. Moreover, the occlusion method
requires a constant flow, resulting inapplicable during HFPV, characterized by high
frequency pulsatile flow.
An alternative method for assessment of respiratory mechanics is the parametric
identification of respiratory system model starting from pressure and flow respiratory
signals measurements. This method provides estimation of dynamic resistance, elastance
and PEEP. The model usually used for this application in conventional ventilation is the
first-order model of respiratory mechanics. The dynamics of breathing for clinical purposes
can be satisfactory represented by a single-compartment model consisting of a single
resistance and compliance [6] [7].
This method applied using the least square fitting with the first order model keeping
resistance and compliance constant over the whole breathing cycle presented acceptable
results undergoing conventional ventilation [54]. This technique, currently limited to
patients without any respiratory activity, during controlled mechanical ventilation present a
simple and robust tool for routine clinical use in the intensive care unit [8].
In case of high frequency ventilation the respiratory mechanics is more properly
described by Dorkin high frequency model, which approximates the respiratory mechanics
function at high frequencies taking into account inertance [13]:
𝑃𝑎𝑤(𝑡) = 𝐸 · 𝑉 + 𝑅 · �̇�(𝑡) + 𝐼 · �̈�(𝑡) + 𝑃0
where, at every time t, Paw(t) represents the pressure applied to the respiratory system,
V(t) is the pulmonary volume, V̇(t) is the airflow and V̈(t) represents the volume
acceleration; P0 represents the pressure offset (i.e. PEEP). The resistance R, elastance E
and inertance I parameters describe respectively the viscous, elastic and inertial mechanical
properties of respiratory system. This three element model is suitable for everyday clinical
practice because of its simplicity, immediate physiological interpretation of its parameters
and its sensitivity to changes in lung mechanics.
In a previous study of our group [48], respiratory parameters during HFPV were
estimated in vitro, at different percussive frequencies only at a working pressure (Pwork) of
30cmH2O. In order to assess this method in different ventilatory settings before application
in patients undergoing HFPV in this work the previous research was to extend in the new
study [55], estimating respiratory parameters by parametric identification, also to different

Chapter 3 – In vitro estimation of respiratory parameters during HFPV
40
Pwork that are commonly applied in clinical practice. Using the aforementioned linear
model in 81 different experimental set-up combinations of working pressures, percussive
frequencies, resistive and elastic lung loads, we verified the goodness of the model and of
the identification method. The parameters were estimated by least squares method starting
from measured pressure and flow signals, considering inspiratory phase exclusively in
order to simulate the effective clinical condition.
3.2.1 Material and methods
Figure 3.5 Schematic diagram of experimental set-up.
The experimental setup used in this study is shown in Figure 3.5. High Frequency
Percussive Ventilation of the lung simulator was provided by a volumetric diffusive
respirator (VDR-4®; Percussionaire Corporation, USA) through the Phasitron®. A
ventilator circuit was connected via a dedicated connector to the pressure and flow sensors;
the distal part of the latter was linked to the described physical model of respiratory
system. A physical model of respiratory system was provided by a single-compartment
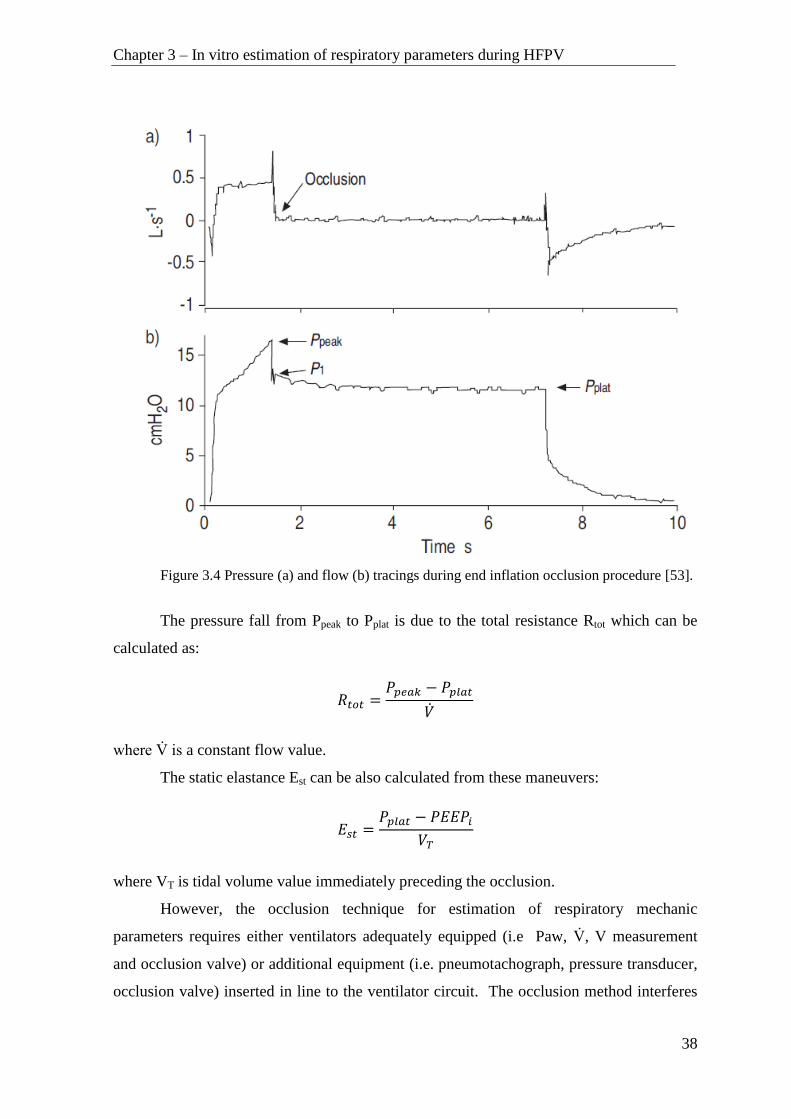
lung simulator (ACCU LUNG, Fluke Biomedical, USA) with 1L capacity (Figure 3.6).
The lung model consist of an elastomer bellow between two plates, different springs
Chapter 3 – In vitro estimation of respiratory parameters during HFPV
41
stretched between the top and bottom plate to simulate different compliance and resistors
with different orifice diameters used to create varying levels of airway resistance. The
accuracy of the fixed resistance was 20% up to 2 L/s, and the accuracy of the fixed
compliance was 10% up to 500 mL of tidal volume, while the inertance can be considered
negligible.
Figure 3.6 ACCU Test-Lung
Lung simulator loads were chosen to represent normal subjects, obstructive and
restrictive patients, and ventilator settings were chosen to represent usual clinical
application range. In our measurements the lung simulator was set according to the
combinations of resistive loads R of 5 and 20 cmH2O/(L/s) and elastic loads E of 20, 50
and 100 cmH2O/L (corresponding to compliance values of 50, 20 and 10 cmH2O L–1
,
respectively).
The VDR-4® ventilator was set to pulse inspiratory/expiratory (i/e) duration ratio
of 1:1, and the overall inspiratory and expiratory duration (I/E) ratio of 1:1. The tele-
inspiratory work pressure Pwork was set to 20, 30 and 40 cmH2O, while the percussive
frequency f was set to 300, 500 and 700 cycles/min.
Measurements of respiratory signals were performed for the 81 possible
combinations of resistive and elastic loads, percussive frequencies, and work pressures
during three successive respiratory cycles. The measurement of flow signal V̇(t) was
performed using Fleisch pneumotachograph (Type 2, Switzerland) connected to a
differential pressure transducer (0.25 INCH-D-4V, All Sensors, USA). The pressure signal
Paw(t) was measured using a differential pressure transducer (ASCX01DN, Honeywell,
USA). Data were acquired at a sampling frequency of 2000Hz with 12 bit resolution (PCI-
Chapter 3 – In vitro estimation of respiratory parameters during HFPV
42
6023E, National Instruments, USA). Volume V(t) and volume acceleration V̈(t) were
calculated respectively by numerical integration and differentiation of flow.
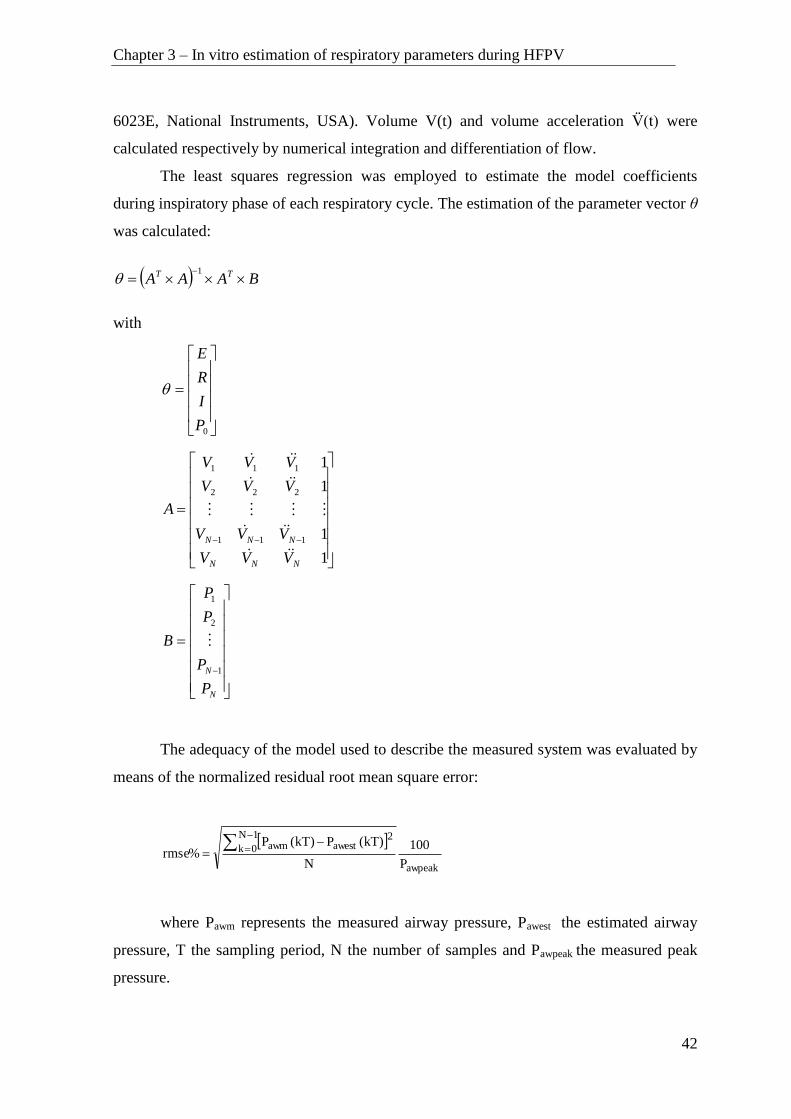
The least squares regression was employed to estimate the model coefficients
during inspiratory phase of each respiratory cycle. The estimation of the parameter vector θ
was calculated:
BAAA TT 1
with
0P
I
R
E
1
1
1
1
111
222
111
NNN
NNN
VVV
VVV
VVV
VVV
A
N
N
P
P
P
P
B
1
2
1
The adequacy of the model used to describe the measured system was evaluated by
means of the normalized residual root mean square error:
awpeak
1N
0k
2awestawm
P
100
N
)kT(P)kT(P%rmse
where Pawm represents the measured airway pressure, Pawest the estimated airway
pressure, T the sampling period, N the number of samples and Pawpeak the measured peak
pressure.
Chapter 3 – In vitro estimation of respiratory parameters during HFPV
43
3.2.2 Results
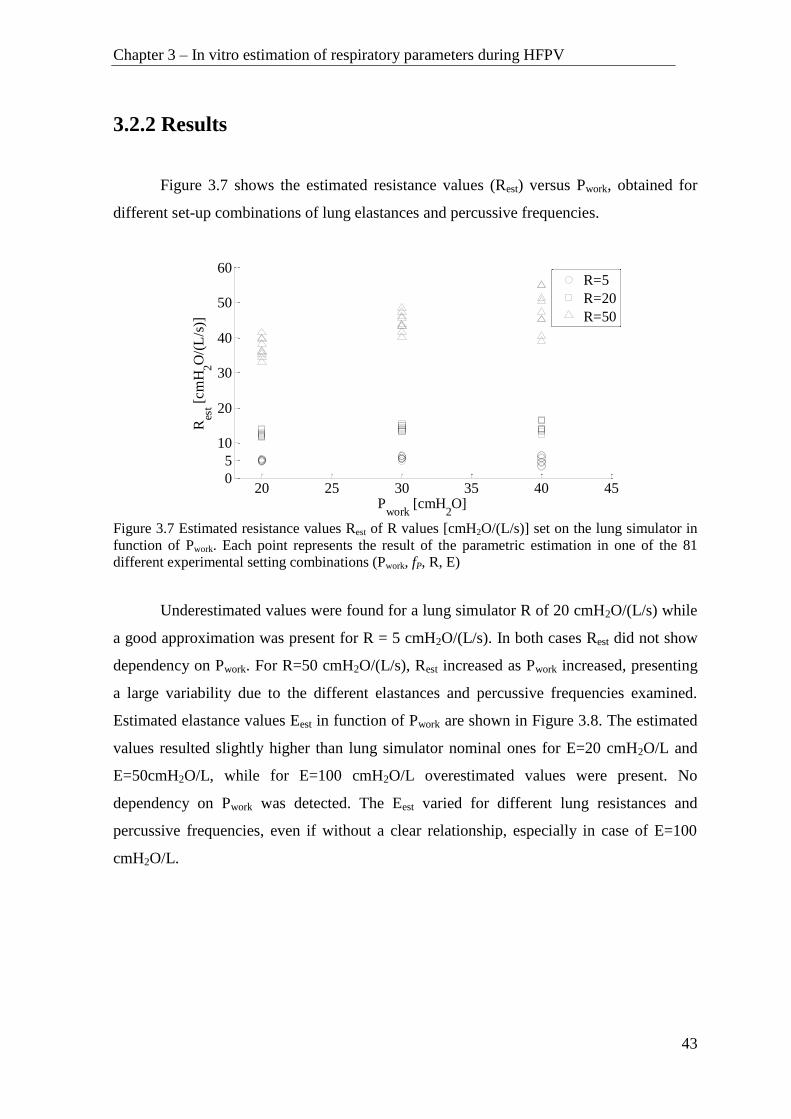
Figure 3.7 shows the estimated resistance values (Rest) versus Pwork, obtained for
different set-up combinations of lung elastances and percussive frequencies.
Figure 3.7 Estimated resistance values Rest of R values [cmH2O/(L/s)] set on the lung simulator in
function of Pwork. Each point represents the result of the parametric estimation in one of the 81
different experimental setting combinations (Pwork, fP, R, E)
Underestimated values were found for a lung simulator R of 20 cmH2O/(L/s) while
a good approximation was present for R = 5 cmH2O/(L/s). In both cases Rest did not show
dependency on Pwork. For R=50 cmH2O/(L/s), Rest increased as Pwork increased, presenting
a large variability due to the different elastances and percussive frequencies examined.
Estimated elastance values Eest in function of Pwork are shown in Figure 3.8. The estimated
values resulted slightly higher than lung simulator nominal ones for E=20 cmH2O/L and
E=50cmH2O/L, while for E=100 cmH2O/L overestimated values were present. No
dependency on Pwork was detected. The Eest varied for different lung resistances and
percussive frequencies, even if without a clear relationship, especially in case of E=100
cmH2O/L.
20 25 30 35 40 450
20
50
60
5
10
30
40
Pwork
[cmH2O]
Res
t [cm
H2O
/(L
/s)]
R=5
R=20
R=50

Chapter 3 – In vitro estimation of respiratory parameters during HFPV
44
Figure 3.8 Estimated elastance values Eest of E values [cmH2O/L] set on the lung simulator in
function of Pwork. Each point represents the result of parametric estimation in one of the 81 different
experimental setup combinations (Pwork, fP, R, E).
Figure 3.9 Example of the measured pressure Pawm curve and the relative comparison with the
estimated Pawest curve for R=5cmH2O/(L/s), E=100cmH2O/L, f =500cycles/min and
Pwork=20cmH2O
The estimated inertance values were very low and were considered negligible.
Figure 3.9 shows an example of the measured Pawm and the relative comparison
with the estimated Pawest. Comparing estimated and measured pressures, low rmse% values
(4.95+1.51)% were found among the 81 considered combinations.
20 25 30 35 40 450
50
100
150
20
Pwork
[cmH2O]
Ees
t [cm
H2O
/L]
E=20
E=50
E=100
0 0.5 1 1.5 2 2.50
5
10
15
20
25
Pre
ssure
[cm
H2O
]
Time [s]
P
awm
Pawest

Chapter 3 – In vitro estimation of respiratory parameters during HFPV
45
3.2.3 Discussion
This in vitro study study aimed to estimate respiratory mechanics parameters during
HFPV under different working pressures, percussive frequencies and imposed resistive and
elastic lung loads. For such purpose we estimated parameters of the Dorkin linear model
by least squares method, from inspiratory pressure and flow signals. The estimated R and E
parameters generally showed low dependency on Pwork. On the other hand, these estimated
parameters showed an increasing dependence on f and E for higher imposed R values and
on f and R for higher imposed E values. The values obtained with the parameter estimation
procedure were generally near to the nominal ones assessed on the lung simulator.
However, the estimated resistance presented underestimation for higher values of
simulated R (i.e. R = 20 and 50 cmH2O/(L/s)). This could be due to the fact that the
resistance of lung simulator partially depends on the flow, as reported in the
manufacturer’s specifications. The airway resistance simulated by orifice exhibits
nonlinear characteristics, in regards to pressure change as a function of flow.
On the contrary, elastance parameters obtained by parametric identification were
slightly higher than the value set on lung simulator, especially for E=100 cmH2O/L. In the
latter case the differences respect to the set values did not present a clear relationship with
fP and R, but only a large spread.
Even though some estimated values of R and E did not match the setup ones, it is
important to underline the fact that the low rmse% values confirm the adequacy of the
model to describe over time the measured system. This fact leads to the assumption that the
differences may be mainly due to an imperfect match between nominal and effective
values of the lung simulator undergoing high frequency pulsatile flow.
The estimated inertia coefficients were negligible, probably because of the absence
of endotracheal tube in the ventilatory circuit. In fact, the presence of endotracheal tube the
inertance effect would be more significant [56].
The performed in vitro study under different ventilatory conditions encouraged the
further clinically assessment of this method in patients undergoing HFPV.
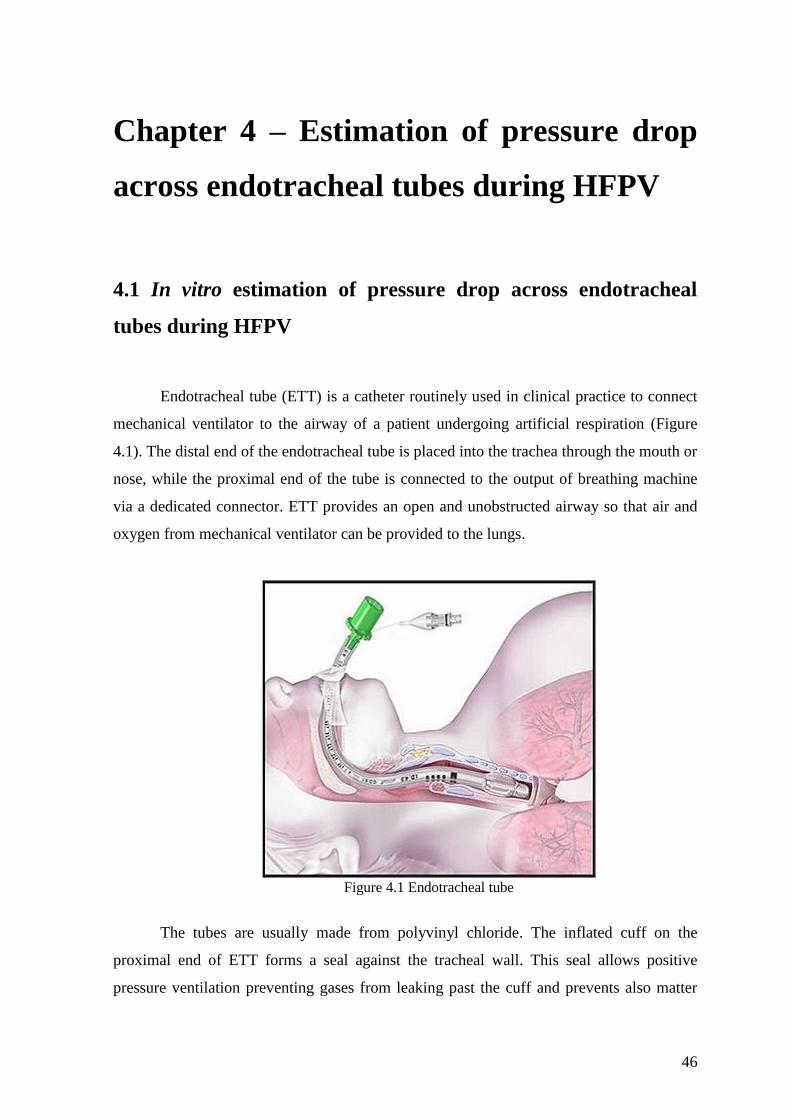
46
Chapter 4 – Estimation of pressure drop
across endotracheal tubes during HFPV
4.1 In vitro estimation of pressure drop across endotracheal
tubes during HFPV
Endotracheal tube (ETT) is a catheter routinely used in clinical practice to connect
mechanical ventilator to the airway of a patient undergoing artificial respiration (Figure
4.1). The distal end of the endotracheal tube is placed into the trachea through the mouth or
nose, while the proximal end of the tube is connected to the output of breathing machine
via a dedicated connector. ETT provides an open and unobstructed airway so that air and
oxygen from mechanical ventilator can be provided to the lungs.
Figure 4.1 Endotracheal tube
The tubes are usually made from polyvinyl chloride. The inflated cuff on the
proximal end of ETT forms a seal against the tracheal wall. This seal allows positive
pressure ventilation preventing gases from leaking past the cuff and prevents also matter

Chapter 4 – Estimation of pressure drop across endotracheal tubes during HFPV
47
such as regurgitated gastric contents going into the trachea. The EET size (i.e. tube inner
diameter) is chosen based on the patient's body size, with grater sizes used for adults and
adolescents and the smaller sizes used for pediatric and neonatal patients.
The presence of ETT during mechanical ventilation contributes an additional
mechanical load to the respiratory system impedance, causing different pressure values at
the proximal and the distal end of the ETT (Figure 4.2) [57] [58]. The airway pressure
measured (Paw) by ventilator represents the sum of the endotracheal tube pressure drop
(ΔPETT) and the tracheal pressure (Ptr) dissipated to inflate lung.
Figure 4.2 Pressure drop across endotracheal tube
From the clinical point of view it is of paramount importance to take into account
the real amount of pressure used to overcome the tube impedance to avoid acute lung
injury and an erroneous estimate of the volume delivered to the patient [59]. While the
pressure at the ventilator end of the EET can be measured easily, measuring the tracheal
pressure of a patient is more difficult and, in every day clinical practice, such a measure
cannot be done invasively. For this reason, HFPV requires a model for accurately
estimating endotracheal tube pressure drop value based solely on non-invasive flow
measurements.

Chapter 4 – Estimation of pressure drop across endotracheal tubes during HFPV
48
The ETT pressure-flow relationship, for various kinds of endotracheal tubes, was
widely studied in conventional ventilation [59-67]. Several approaches for estimation of
endotracheal tube pressure drop based on flow dependent model and flow measurement
have been developed. Under certain conditions, e.g., laminar low flow, the pressure-flow
relationship characterizing endotracheal tubes may be considered linear [60] [61], and the
relationship between ∆PETT and flow V̇ yields tube resistance Rtube.
∆𝑃𝐸𝑇𝑇(𝑡) = 𝑅𝑡𝑢𝑏𝑒 · �̇�(𝑡)
However, in most cases a non-linear pressure-flow relationship has been found. In
such cases this relationship has been generally described as:
∆𝑃𝐸𝑇𝑇(𝑡) = 𝐾1 · �̇�(𝑡) + 𝐾2 · �̇�2(𝑡)
or
∆𝑃𝐸𝑇𝑇(𝑡) = 𝑎 · �̇�𝑏(𝑡)
where, at any time (t), V̇(t) represents flow, K1 and K2 are the Rohrer’s constants [62], and
a and b are constants that define the power function relating ∆PETT(t) and V̇(t) [59] [63-65].
Moreover, instead of the previous flow–dependent Rohrer’s or power equations, the
Blasius’ formula for circular tubes has also been used to estimate in vitro adult and
neonatal ∆PTT [66] [67]:
∆𝑃𝐸𝑇𝑇(𝑡) = 𝐾𝑏 · �̇�1.75(𝑡)
where the Kb coefficient depends on tube geometry and physical gas properties [66] [67].
During high frequency ventilation (HFV) the aforementioned approaches do not
properly describe the pressure-flow relationship in endotracheal tubes possibly owing to
turbulence and the presence of mechanical inertance (I) pertaining to the tubes. Indeed,
under high-frequency oscillatory ventilation (HFOV) inertance was taken into
consideration [68]. The pressure drop due to inertial effects is directly proportional to
volume acceleration (V̈).
HFPV is characterized by high frequency pulsatile flow during inspiration.

Chapter 4 – Estimation of pressure drop across endotracheal tubes during HFPV
49
Although HFPV has been increasingly used in the clinical practice, the mechanical
behaviour of endotracheal tubes under this type of ventilation has not been described yet.
Thus, in order to characterize in vitro pressure drop across the endotracheal tube
during HFPV, the modelling of ETT pressure drop-flow relationship under different
working pressures, percussive frequencies, and added resistive and elastic loads was
performed in this work [69].
4.1.1 Material and methods
In order to perform in vitro study the experimental laboratory bench setup was built
(Figure 4.3). A physical model of respiratory system was provided by a single-
compartment lung simulator (ACCU LUNG, Fluke Biomedical, Everett, WA, USA). In
this study the lung simulator was set according to all the combinations of resistive loads
(R), namely, 5 and 20 cmH2O L-1
s and elastic loads (E): 20, 50, and 100 cmH2O L-1
.
Figure 4.3 Experimental set-up. Paw and Ptr pressures measured before and after the endotracheal
tube (ETT), respectively. V̇ is flow measured by Fleisch pneumotachograph.
The lung simulator was connected to a Fleisch pneumotachograph (Type 2,
Lausanne, Switzerland) linked to a differential pressure transducer (0.25 INCH-D-4V, All

Chapter 4 – Estimation of pressure drop across endotracheal tubes during HFPV
50
Sensors, Morgan Hill, CA, USA) for the measurement of airflow. Its other extremity was
attached to a tube with a sideport for the measurement of tracheal pressure (Ptr) by means
of a differential pressure transducer (ASCX01DN, Honeywell, Morristown, NJ, USA).
Endotracheal tube sizes 6.5, 7.5 and 8 (Rusch, Germany) were indwelled into the artificial
trachea. Their cuffs were inflated to avoid leaks. These tubes sizes were chosen because
they are the most frequently used in adolescent and adult patients. Another differential
pressure transducer followed (ASCX01DN, Honeywell, Morristown, NJ, USA) for the
measurement of airway pressure (Paw). Finally, a high-frequency percussive ventilator
(VDR-4, Percussionaire Corporation, Sandpoint, ID, USA) was linked to the circuit.
The VDR-4 ventilator was set to deliver a pulse inspiratory/expiratory (i/e) duration
ratio of 1:1, and inspiratory and expiratory duration (I/E) ratio of 1:1. The tele-inspiratory
work pressure (PWork), i.e., peak inspiratory pressure measured by the VDR-4® ventilator,
was progressively increased in 5 cmH2O steps from 20 to 45 cmH2O, resulting in different
airflow rates. The percussive frequency was set to 300, 500 and 700 cycles/min.
Measurements were performed for all 108 possible combinations of loads, frequencies, and
work pressures for each endotracheal tube size. Each measurement setting included three
respiratory cycles. The signals were sampled at 2 kHz by a 12-bit acquisition board (PCI-
6023E, National Instruments, Austin, TX, USA) and fed into a low-pass second order
Butterworth filter (cut-off frequency 35 Hz).
Volume acceleration (V̈) was calculated by numerical differentiation of the air flow
using low-noise Lanczos differentiator described by the following equation:
))3n(V)3n(V(3))2n(V)2n(V(2)1n(V)1n(V28
f)n(V s
where fs is sampling frequency and n is sample index.
ΔPETT was calculated by subtracting Ptr from Paw during the inspiratory phase
exclusively.
ΔPETT was characterized during the inspiratory phase of the breathing cycle by
parametric identification of coefficients pertaining to the three proposed models, defined
according to the following equations:
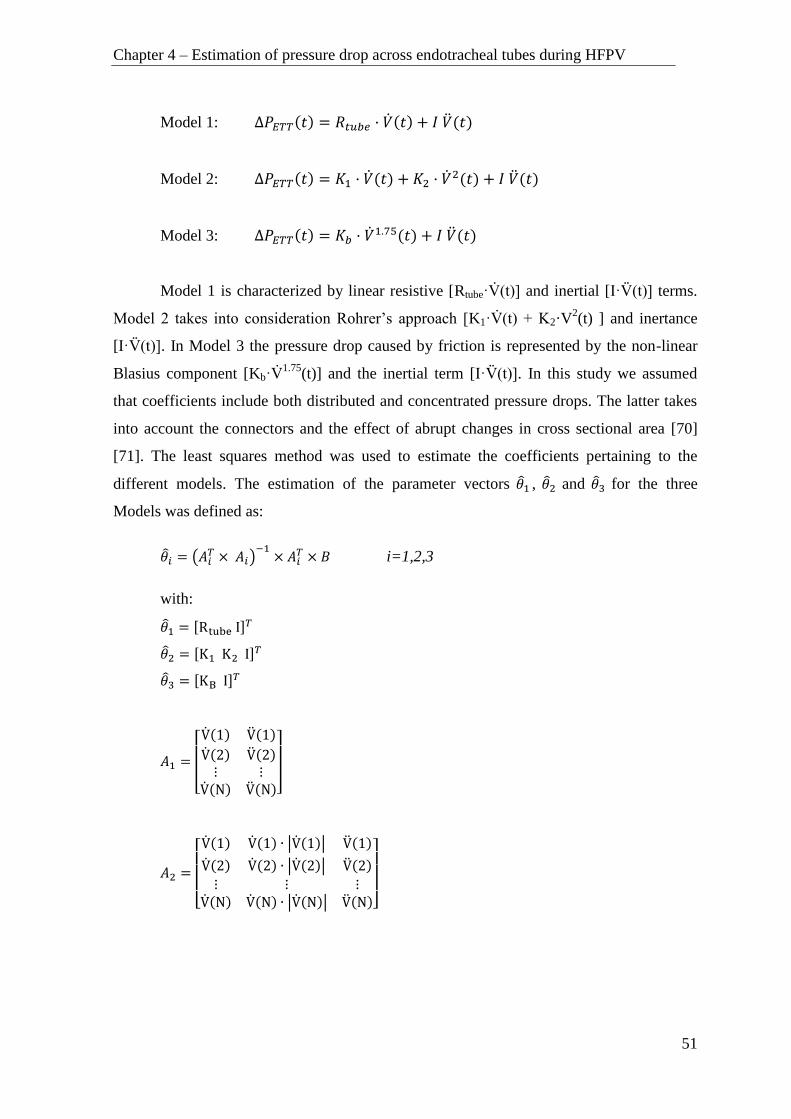
Chapter 4 – Estimation of pressure drop across endotracheal tubes during HFPV
51
Model 1: ∆𝑃𝐸𝑇𝑇(𝑡) = 𝑅𝑡𝑢𝑏𝑒 · �̇�(𝑡) + 𝐼 �̈�(𝑡)
Model 2: ∆𝑃𝐸𝑇𝑇(𝑡) = 𝐾1 · �̇�(𝑡) + 𝐾2 · �̇�2(𝑡) + 𝐼 �̈�(𝑡)
Model 3: ∆𝑃𝐸𝑇𝑇(𝑡) = 𝐾𝑏 · �̇�1.75(𝑡) + 𝐼 �̈�(𝑡)
Model 1 is characterized by linear resistive [Rtube·V̇(t)] and inertial [I·V̈(t)] terms.
Model 2 takes into consideration Rohrer’s approach [K1·V̇(t) + K2·V2(t) ] and inertance
[I·V̈(t)]. In Model 3 the pressure drop caused by friction is represented by the non-linear
Blasius component [Kb·V̇1.75
(t)] and the inertial term [I·V̈(t)]. In this study we assumed
that coefficients include both distributed and concentrated pressure drops. The latter takes
into account the connectors and the effect of abrupt changes in cross sectional area [70]
[71]. The least squares method was used to estimate the coefficients pertaining to the
different models. The estimation of the parameter vectors 𝜃1 , 𝜃2 and 𝜃3 for the three
Models was defined as:
𝜃𝑖 = (𝐴𝑖𝑇 × 𝐴𝑖)
−1× 𝐴𝑖
𝑇 × 𝐵 i=1,2,3
with:
𝜃1 = [Rtube I]𝑇
𝜃2 = [K1 K2 I]𝑇
𝜃3 = [KB I]𝑇
𝐴1 =
[ V̇(1) V̈(1)
V̇(2) V̈(2)⋮ ⋮
V̇(N) V̈(N)]
𝐴2 =
[ V̇(1) V̇(1) ∙ |V̇(1)| V̈(1)
V̇(2) V̇(2) ∙ |V̇(2)| V̈(2)
⋮ ⋮ ⋮V̇(N) V̇(N) ∙ |V̇(N)| V̈(N)]
Chapter 4 – Estimation of pressure drop across endotracheal tubes during HFPV
52
𝐴3 =
[ V̇(1) ∙ |V̇(1)|
0.75V̈(0)
V̇(2) ∙ |V̇(2)|0.75
V̈(1)
⋮ ⋮
V̇(N) ∙ |V̇(N)|0.75
V̈(N)]
𝐵 = [∆PETT(1) ∆PETT(2) … ∆PETT(N)]𝑇
The matrix elements V̇(n) , V̈(n), ΔPETT (n), where n = 1,2, … N is the sample index , N
is the number of acquired samples for each experimental setting and tube.
As indicator of the adequacy of the model used to describe the measured system,
the residual root mean square error (RMSE) was calculated:
N
(kT)ΔP(kT)ΔPRMSE
1N
0k
2TTeTTm
where ΔPETTm and ΔPETTe represent the measured and estimated ΔPETT, respectively, N is
the number of samples, and T represents the sampling period.
Endotracheal tubes display an inertial fluid dynamic component proportional to the
volume acceleration (V̈), particularly evident during high frequency ventilation, which also
consumes energy in terms of pressure drop. Inertance (I) was estimated for each
endotracheal tube according to:
I = ρL A-1
where ρ is the gas density, L the tube length and A the cross-sectional area [72].
The RMSE and inertance pertaining to the three models were compared. The
normal distribution of the data and the homogeneity of the variances were assured by the
Kolmogorov-Smirnov (with Lilliefors’ correction) and Levene median tests, respectively.
One-way ANOVA was then applied and since statistically significant values were found,
Bonferroni’s post hoc test was used to assess differences among the three models. α = 5%.
Statistical analysis was performed using Statistica 6.1 software (StatSoft, Vigonza, Italy).
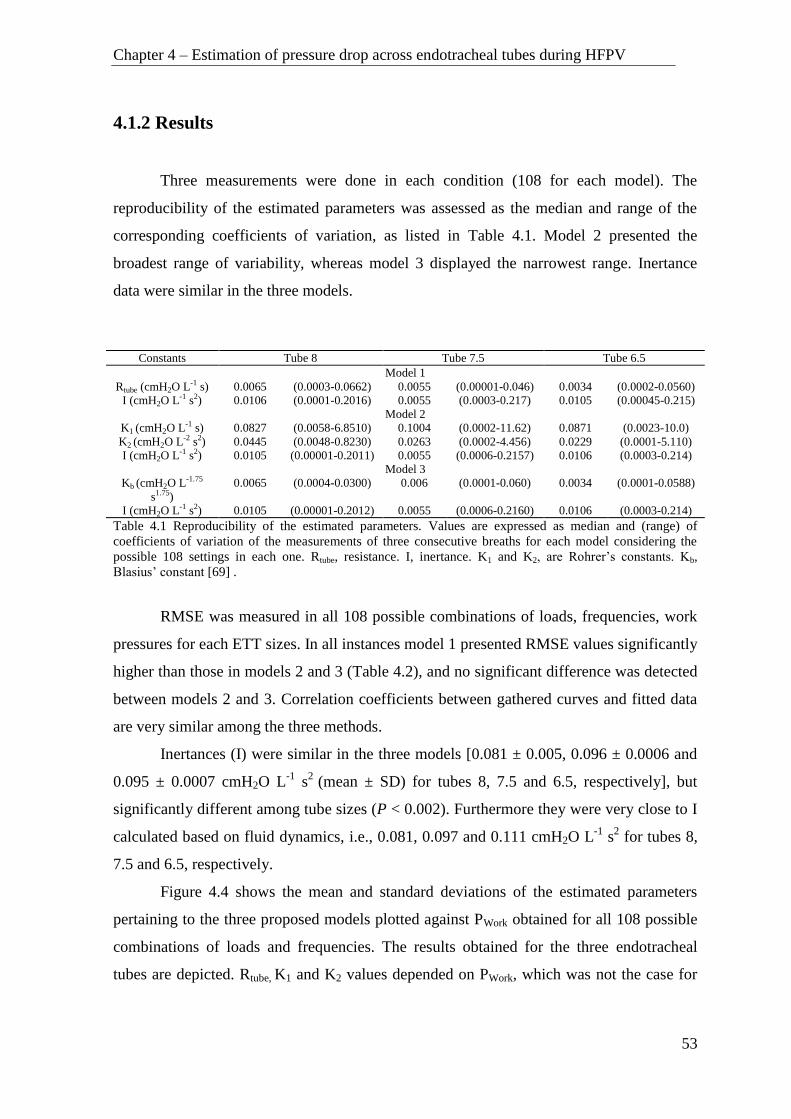
Chapter 4 – Estimation of pressure drop across endotracheal tubes during HFPV
53
4.1.2 Results
Three measurements were done in each condition (108 for each model). The
reproducibility of the estimated parameters was assessed as the median and range of the
corresponding coefficients of variation, as listed in Table 4.1. Model 2 presented the
broadest range of variability, whereas model 3 displayed the narrowest range. Inertance
data were similar in the three models.
Constants Tube 8 Tube 7.5 Tube 6.5
Model 1
Rtube (cmH2O L-1 s) 0.0065 (0.0003-0.0662) 0.0055 (0.00001-0.046) 0.0034 (0.0002-0.0560)
I (cmH2O L-1 s2) 0.0106 (0.0001-0.2016) 0.0055 (0.0003-0.217) 0.0105 (0.00045-0.215)
Model 2
K1 (cmH2O L-1 s) 0.0827 (0.0058-6.8510) 0.1004 (0.0002-11.62) 0.0871 (0.0023-10.0)
K2 (cmH2O L-2 s2) 0.0445 (0.0048-0.8230) 0.0263 (0.0002-4.456) 0.0229 (0.0001-5.110)
I (cmH2O L-1 s2) 0.0105 (0.00001-0.2011) 0.0055 (0.0006-0.2157) 0.0106 (0.0003-0.214)
Model 3
Kb (cmH2O L-1.75
s1.75)
0.0065 (0.0004-0.0300) 0.006 (0.0001-0.060) 0.0034 (0.0001-0.0588)
I (cmH2O L-1 s2) 0.0105 (0.00001-0.2012) 0.0055 (0.0006-0.2160) 0.0106 (0.0003-0.214)
Table 4.1 Reproducibility of the estimated parameters. Values are expressed as median and (range) of
coefficients of variation of the measurements of three consecutive breaths for each model considering the
possible 108 settings in each one. Rtube, resistance. I, inertance. K1 and K2, are Rohrer’s constants. Kb,
Blasius’ constant [69] .
RMSE was measured in all 108 possible combinations of loads, frequencies, work
pressures for each ETT sizes. In all instances model 1 presented RMSE values significantly
higher than those in models 2 and 3 (Table 4.2), and no significant difference was detected
between models 2 and 3. Correlation coefficients between gathered curves and fitted data
are very similar among the three methods.
Inertances (I) were similar in the three models [0.081 ± 0.005, 0.096 ± 0.0006 and
0.095 ± 0.0007 cmH2O L-1
s2
(mean ± SD) for tubes 8, 7.5 and 6.5, respectively], but
significantly different among tube sizes (P < 0.002). Furthermore they were very close to I
calculated based on fluid dynamics, i.e., 0.081, 0.097 and 0.111 cmH2O L-1
s2 for tubes 8,
7.5 and 6.5, respectively.
Figure 4.4 shows the mean and standard deviations of the estimated parameters
pertaining to the three proposed models plotted against PWork obtained for all 108 possible
combinations of loads and frequencies. The results obtained for the three endotracheal
tubes are depicted. Rtube, K1 and K2 values depended on PWork, which was not the case for

Chapter 4 – Estimation of pressure drop across endotracheal tubes during HFPV
54
the Kb value. Furthermore, Rtube, K1 and K2 values presented higher variability than the Kb
parameter.
_________________________________________________________________
Model Tube 8 Tube 7.5 Tube 6.5
_________________________________________________________________
RMSE (cmH2O)
1 1.097±0.38 1.661±0.57 1.720±0.57
2 0.915±0.29 1.330±0.35 1.330±0.30
P = 0.00011 P < 0.00001 P < 0.00001
3 0.933±0.28 1.400±0.38 1.038±0.32
P = 0.00062 P = 0.00007 P < 0.00001
Correlation coefficient
1 0.964 (0.895 - 0.994) 0.958 (0.886 - 0.990) 0.970 (0.911 - 0.991)
2 0.974 (0.906 - 0.995) 0.969 (0.893 - 0.993) 0.980 (0.916 - 0.994)
3 0.973 (0.906 - 0.995) 0.970 (0.895 - 0.993) 0.981 (0.914 - 0.995)
________________________________________________________________
Table 4.2 Root mean square errors and correlation coefficients between
experimental and fitted curves. Mean ± SD of 108 different experimental
conditions (three measurements per condition) of root mean square errors (RMSE)
and median (range) of correlation coefficients. Model 1 assumes a linear
relationship between pressure and flow; model 2 introduces a flow-dependent
quadratic equation; and model 3 incorporates the term V̇1.75
. P values describe
difference between models 2 and 3 versus model 1. No significant difference was
detected between models 2 and 3 [69].
Figure 4.4 Estimated model constants plotted against working pressure (PWork). (a) linear model (#1), Rtube,
Newtonian flow resistance. (b and c) model #2, K1 and K2, Rohrer’s coefficients. (d) Blasius’ constant, Kb
(model #3). Each data point is the average of 18 estimated model constants encompassing two and three
resistive and elastic loads, respectively, and 3 percussive frequencies. Bars, + or – SD. Open squares, circles
and triangles represent tubes 6.5, 7.5, and 8.0, respectively [69].
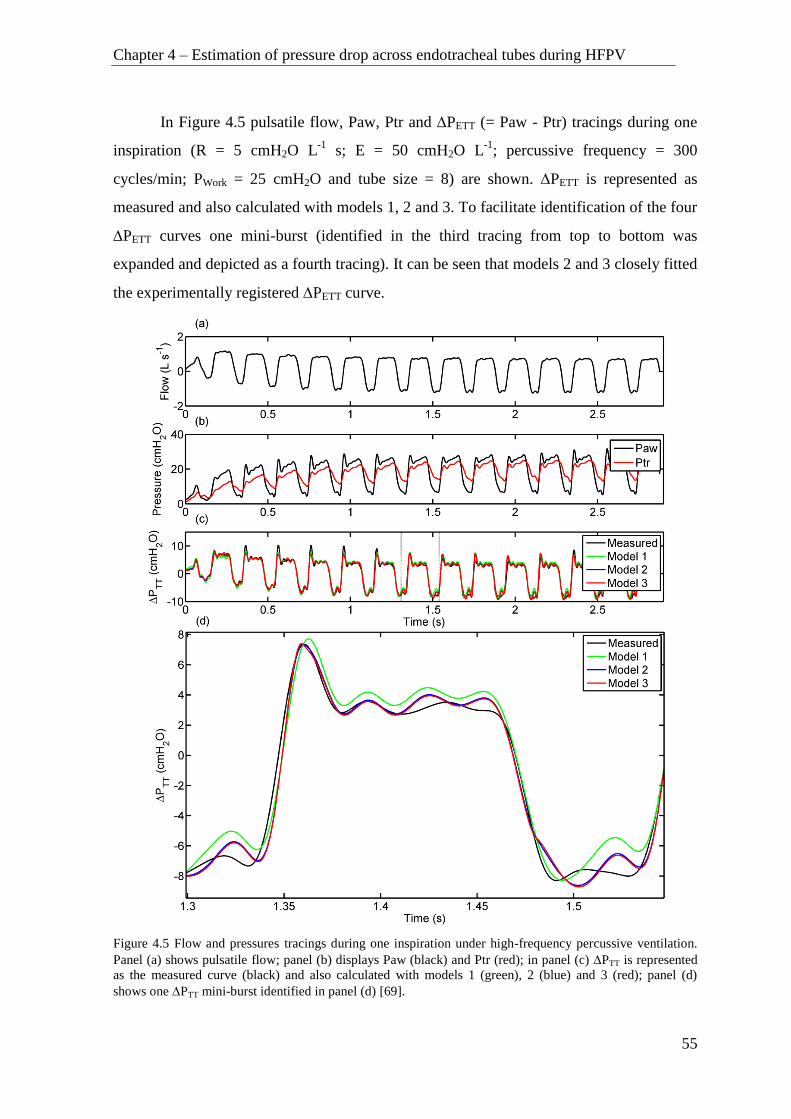
Chapter 4 – Estimation of pressure drop across endotracheal tubes during HFPV
55
In Figure 4.5 pulsatile flow, Paw, Ptr and PETT (= Paw - Ptr) tracings during one
inspiration (R = 5 cmH2O L-1
s; E = 50 cmH2O L-1
; percussive frequency = 300
cycles/min; PWork = 25 cmH2O and tube size = 8) are shown. PETT is represented as
measured and also calculated with models 1, 2 and 3. To facilitate identification of the four
PETT curves one mini-burst (identified in the third tracing from top to bottom was
expanded and depicted as a fourth tracing). It can be seen that models 2 and 3 closely fitted
the experimentally registered PETT curve.
Figure 4.5 Flow and pressures tracings during one inspiration under high-frequency percussive ventilation.
Panel (a) shows pulsatile flow; panel (b) displays Paw (black) and Ptr (red); in panel (c) PTT is represented
as the measured curve (black) and also calculated with models 1 (green), 2 (blue) and 3 (red); panel (d)
shows one PTT mini-burst identified in panel (d) [69].

Chapter 4 – Estimation of pressure drop across endotracheal tubes during HFPV
56
Medians and ranges of the 108 measured pressure drops across each tube (PETT)
during the inspiratory phase of the mini-bursts were also calculated: 9.28 (4.95-12.93),
9.48 (5.05-13.47), and 10.04 (5.62-16.97) cmH2O for tubes 8, 7.5 and 6.5, respectively.
4.1.3 Discussion
This study aimed at identifying the most adequate model and respective calculated
parameters for estimating the pressure drop across endotracheal tubes during high
frequency percussive ventilation under different working pressures, percussive frequencies,
and resistive and elastic loads. For such purpose three models were evaluated: a linear (1)
and two non-linear models (2 and 3), all of them taking into account inertance and both
distributed and concentrated pressure losses. So far the modeling of pressure losses across
endotracheal tubes in the face of HFPV has not been reported.
From the clinical point of view the real time estimation of endotracheal tube
contribution to pressure losses within the breathing system is of paramount importance.
Frequently the physician can only assess the pressure delivered by the ventilator, usually
measured before the tubing ensemble (endotracheal tube included) linking the ventilator to
the patient. This pressure does not represent that actually delivered to the patient. If the
latter pressure is too high, barotraumas may ensue [73]. Thus, a tool that can provide
information about the endotracheal tube flow-dependent resistance during HFPV and that
could also be implemented in future monitoring systems is wanted.
Three simple common models relating ΔPETT and flow were tested. Model 1
assumes a linear relationship between pressure and flow; model 2 introduces a flow-
dependent quadratic equation; and model 3 incorporates the term V̇1.75
. Inertance is
included in all three models since the ventilatory mode is based on high-frequency
pulsatile flow. Using two and three diverse resistive and elastic loads, respectively, three
percussive pressures, and six working pressures, 108 different combinations were
generated, and three breathing cycles were measured in each one of them. The smallest
variability among the measurements of the estimated parameters was presented by model
3, while model 2 depicted the broadest range of results (Table 4.1).
To the experimental pressure and flow curves the three aforementioned models
were fitted using the least square method. The similarity between the correlation

Chapter 4 – Estimation of pressure drop across endotracheal tubes during HFPV
57
coefficients (Table 4.2) would suggest that the three models adequately fitted the
experimental data. However, considering that RMSE is a measure of the differences
between values estimated by a model and the values actually observed in an experiment,
we used it to evaluate the goodness of our fittings. Table 4.2 shows that Model 1 presented
significantly higher RMSE than Models 2 and 3, and that the latter did not differ between
them. Thus, the former is not as accurate as the latter, possibly due to turbulence, a term
not included in Model 1, as previously reported [66] [67] [72]. Furthermore, Models 2 and
3 seem to present the same predictive power. Following the parsimony principle we have
to consider Model 3 more convenient than Model 2 [74]. Model 2 is frequently used in
respiratory physiology to describe pressure-flow relationships. Blasius’ formula was used
to determine the effect of mucus deposition on the effective diameter of endotracheal tubes
in patients [67], and to calculate in vitro the pressure drop along pediatric endotracheal
tubes under constant flow [66]. The latter study reports that a linear model can adequately
describe flow-pressure relationship under laminar flow, but when turbulence ensues,
Blasius’ formula represents a better descriptor of the system [66]. On the other hand, in a
pediatric study with high-frequency oscillation, Blasius’ and Rohrer’s formulas resulted
inaccurate to calculate pressure drop across endotracheal tubes based on measured flows
[68]. Hence, our study fitted experimentally generated pressure and flow signals with a
linear and two non-linear models and estimated Rtube K1, K2, Kb and I.
The estimated coefficients are plotted against PWork (Figure 4.4). The wider the tube
the smaller is the SD in all instances and the smaller are the estimated coefficients, except
for K1. The large variability of estimated Rohrer’s coefficients has also been previously
reported [68]. Additionally, Kb does not depend on PWork, in opposition to the other
coefficients. Finally, Kb presents the smallest SD. Indeed, the overall means±SDs were
5.57±0.34, 7.46±0.84; and 10.51±0.87 cmH2O L-1.75
s1.75
for tubes 8.0, 7.5 and 6.5,
respectively. The corresponding coefficients of variation were 0.061, 0.11, 0.08. The
median values did not differ appreciably from the means. It should be stressed that each
point represents data collected with two resistive and three and elastic loads, and three
pulsatile frequencies, i.e., each point is a lumped value. Taken together these results
strongly suggest that estimated Kb is the most robust resistance-related coefficient
calculated in our study.
Other models [65] under conventional mechanical ventilation take into

Chapter 4 – Estimation of pressure drop across endotracheal tubes during HFPV
58
consideration the asymmetry between inspiratory and expiratory phases, expressed by their
exponents K2. In HFPV each inspiration comprises many mini-bursts, which in our case
presented frequencies amounting to 300, 500 and 700 cycles/min. Each mini-burst
represents one mini-inspiration and a mini-expiration [15] [29]. In their study [65] the
results are expressed considering inspiration and expiration separately. In our case, we
have inspiratory and expiratory phases in each mini-burst plus the whole cycle inspiration
and expiration, which would result in a series of values possibly difficult to be handled and
understood in clinical practice. Furthermore, the aforementioned models do not take into
consideration inertance, which represents an important mechanical component in high-
frequency ventilation, as seen in Figure 4.6.
Because inertial forces are negligible during tidal breathing they are usually
disregarded in curve fitting [6]. However inertance may became important during fast
breathing, which is the case in HFPV. For this reason we included an inertial term in our
models, as also reported in other studies [48] [68] [72] [75] [76]. In Figure 4.6 the
measured PETT was split into its inertance-dependent (PETTI) and resistive-dependent
(PETTR) components. The former plays a major role during rapid changes in PETT,
whereas the latter responds for the slower variations in PETT, corresponding to the phases
where gas accelerations are high and small, respectively. Once again there is no single
value for the contributions of either I or R to PETT. This finding applies to all settings.
Figure 4.6 The measured PTT (black line) and its inertance-dependent (blue line PTTI) and
resistive-dependent (green line PTTR) components are shown for two complete mini-bursts (R = 5
cmH2O L-1
s; E = 50 cmH2O L-1
; percussive frequency = 300 cycles/min; PWork = 25 cmH2O and
tube size = 8).
Chapter 4 – Estimation of pressure drop across endotracheal tubes during HFPV
59
In the present study the estimated inertances did not vary among the models, thus
rendering inertia not responsible for the differences in fitting the models to the
experimental data using the same tube. However, possibly due to geometric factors [72]
[75] [76], inertance varied in the present work according to tube size.
Considering that for each tube size only Model 3 is characterized by two constant
coefficients (resistance- and inertia-dependent), it may be very useful for the clinician:
using two constants and the flow value he/she may be able to estimate the average pressure
lost owing to the endotracheal tube as:
∆PTT(t) = 5.57 V̇
1.75(t) + 0.081 V̈(t)
(tube 8)
∆PTT (t) = 7.46 V̇
1.75(t) + 0.096 V̈(t)
(tube 7.5)
∆PTT(t) = 10.51 V̇
1.75(t) + 0.095 V̈(t)
(tube 6.5)
This study present some limitations: (a) results were gathered under HFPV; (b)
resistive and elastic loads, pulsatile frequency were constrained within specific ranges; (c)
clinical limitations may also arise: curvature of the tube, its partial blockage due to mucus
and/or condensed water vapour, and connectors. In conclusion, the method provided by
this work allows the rapid calculation of the pressure drop across endotracheal tubes in
high-frequency percussive ventilation.
4.2 In vitro estimation of pediatric endotracheal tube pressure
drop
Endotracheal tubes are also regularly used in pediatric patients undergoing HFPV.
In these cases the estimation of pressure drop becomes even more important because of
frailty of pediatric patients and because of greater pressure drop between the proximal and
the distal end of the pediatric ETT, because of smaller inner diameter. Consequently the
previous study was extended to the tube regularly used in pediatric cases [77]. The
experimental setup and acquisition device (Figure 4.3) used in the previous study, were
also used to collect pressure and flow data for the examined pediatric ETT (size 5.5, Rusch,
Germany, ID = 5.5 mm, length = 29.5 cm). The respiratory signals were acquired in 108

Chapter 4 – Estimation of pressure drop across endotracheal tubes during HFPV
60
different experimental conditions combining different Pwork, f, R and E. Work pressure
(Pwork) was varied from 20 to 45 cmH2O with increasing steps of 5 cmH2O. The percussive
frequency (f) was set to 300, 500 and 700 cycles/min. The lung simulator was set
according to the combinations of resistive loads (R) 5 and 20 cmH2O/L/s and elastic loads
(E) 20, 50, and 100 cmH2O /L.
4.2.1 Results
The estimated inertance (I) was identical in all three models 0.126±0.009
cmH2O/L/s2 and did not present particular dependence on working conditions.
Figure 4.7 shows the mean and standard deviations of the parameters of the three
evaluated models versus Pwork, obtained for different combinations of lung elastances and
percussive frequencies.
Figure 4.7. Mean±1SD of the parameters of the three proposed models versus Pwork [77].
The values of Rtube were higher at lower lung resistance R; K2 parameter also
showed a similar behavior up to 30 cmH2O of Pwork. On the other hand, K1 and KB
parameters did not show a significant dependency on lung resistance. However, in the
Model 1, Rtube slightly increased as the Pwork increased from 20 to 35 cmH2O. In the Model
15 20 25 30 35 40 45 500
10
20
30
PWork
(cmH2O)
Rtu
be (
cmH
2O
/(L
/s))
Model 1
R=5cmH2O/(L/s)
R=20cmH2O/(L/s)
15 20 25 30 35 40 45 500
10
20
30
PWork
(cmH2O)
K1 (
cmH
2O
/(L
/s))
Model 2
15 20 25 30 35 40 45 500
10
20
30
PWork
(cmH2O)
K2 (
cmH
2O
/(L
/s)2
)
Model 2
15 20 25 30 35 40 45 500
10
20
30
PWork
(cmH2O)
KB(c
mH
2O
/(L
/s)1
.75)
Model 3
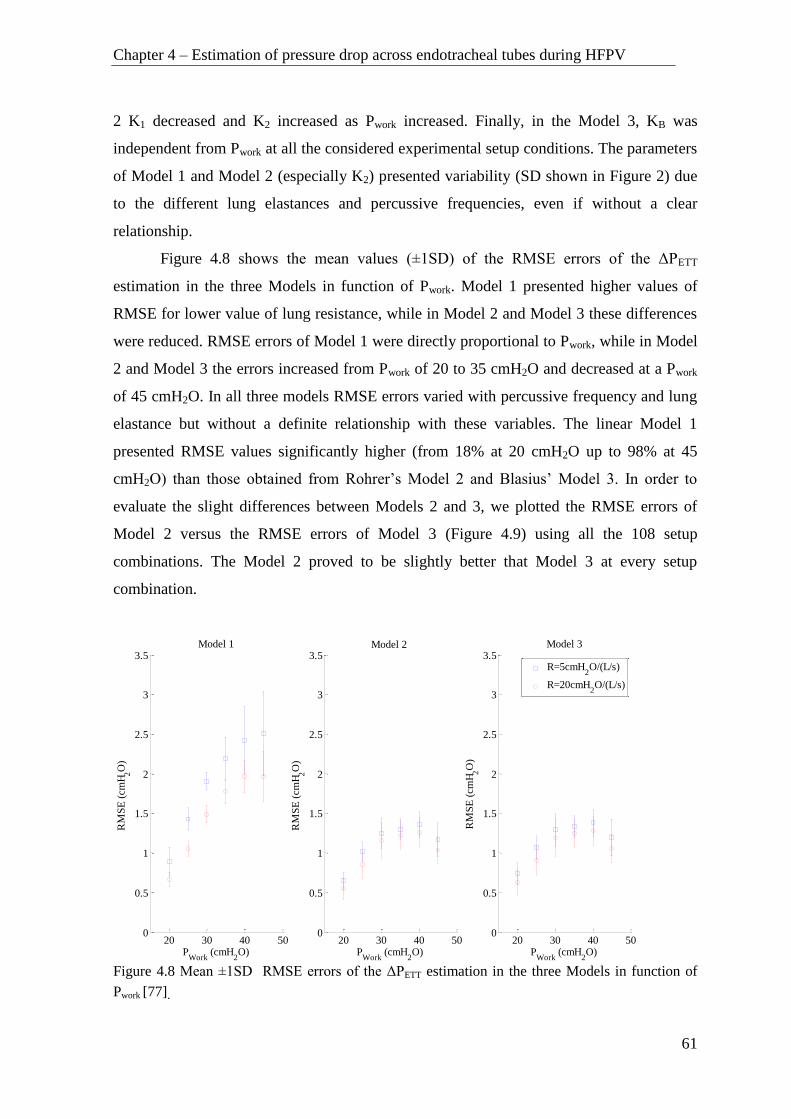
Chapter 4 – Estimation of pressure drop across endotracheal tubes during HFPV
61
2 K1 decreased and K2 increased as Pwork increased. Finally, in the Model 3, KB was
independent from Pwork at all the considered experimental setup conditions. The parameters
of Model 1 and Model 2 (especially K2) presented variability (SD shown in Figure 2) due
to the different lung elastances and percussive frequencies, even if without a clear
relationship.
Figure 4.8 shows the mean values (±1SD) of the RMSE errors of the ΔPETT
estimation in the three Models in function of Pwork. Model 1 presented higher values of
RMSE for lower value of lung resistance, while in Model 2 and Model 3 these differences
were reduced. RMSE errors of Model 1 were directly proportional to Pwork, while in Model
2 and Model 3 the errors increased from Pwork of 20 to 35 cmH2O and decreased at a Pwork
of 45 cmH2O. In all three models RMSE errors varied with percussive frequency and lung
elastance but without a definite relationship with these variables. The linear Model 1
presented RMSE values significantly higher (from 18% at 20 cmH2O up to 98% at 45
cmH2O) than those obtained from Rohrer’s Model 2 and Blasius’ Model 3. In order to
evaluate the slight differences between Models 2 and 3, we plotted the RMSE errors of
Model 2 versus the RMSE errors of Model 3 (Figure 4.9) using all the 108 setup
combinations. The Model 2 proved to be slightly better that Model 3 at every setup
combination.
Figure 4.8 Mean ±1SD RMSE errors of the ΔPETT estimation in the three Models in function of
Pwork [77].
20 30 40 500
0.5
1
1.5
2
2.5
3
3.5Model 1
PWork
(cmH2O)
RM
SE
(cm
H2O
)
20 30 40 500
0.5
1
1.5
2
2.5
3
3.5
PWork
(cmH2O)
RM
SE
(cm
H2O
)
Model 2
20 30 40 500
0.5
1
1.5
2
2.5
3
3.5
PWork
(cmH2O)
RM
SE
(cm
H2O
)
Model 3
R=5cmH
2O/(L/s)
R=20cmH2O/(L/s)

Chapter 4 – Estimation of pressure drop across endotracheal tubes during HFPV
62
4.2.2 Discussion
This study aimed at identifying the most adequate model and parameters for
estimating the pressure drop of pediatric endotracheal tube ΔPETT during HFPV under
different working pressures, percussive frequencies and resistive and elastic lung loads. As
in a previous adult ETT study we considered the linear Model 1 and the non-linear Models
2 and 3, all of them taking into account inertance and both distributed and concentrated
pressure losses. The estimated inertance values were identical in all the models
(0.126±0.009 cmH2O/L/s2) and slightly smaller than theoretical value (0.152 cmH2O/L/s
2)
for the examined ETT.
Figure 4.9 RMSE errors of Model 2 versus the RMSE errors of Model 3 [77].
The linear Model 1 presented RMSE values significantly higher than those obtained
from the two non-linear Models, especially at the highest working pressures. This is
probably due to the fact that Model 1 does not consider the presence of turbulent flow, that
introduces non linearity in pressure-flow relationship. This phenomenon particularly
occurs in presence of high values of pulsatile flow; thus we considered the linear model
unable to describe properly ΔPETT during HFPV.
In Model 2 coefficients K1 and K2 showed strong dependency on Pwork and in
addition they presented a meaningful variability related to different lung elastances and
percussive frequencies. The large variability of Rohrer’s coefficients was also present in
the case of pediatric HFOV, as reported in [68]. On the other hand, results showed that the
Blasius’ Model 3 coefficient KB was widely independent from the setup conditions as well
as from the Pwork, differently from the parameters of the other models, even if it presented a
0.4 0.6 0.8 1 1.2 1.4 1.6
0.4
0.6
0.8
1
1.2
1.4
1.6
RMSE - Model 3 (cmH2O)
RM
SE
- M
od
el
2 (
cm
H2O
)

Chapter 4 – Estimation of pressure drop across endotracheal tubes during HFPV
63
very slightly higher estimation error than Model 2. Thus this model seems to be the best
approximation of the non-linear behavior of the considered pediatric ETT. The results of
this study were broadly similar to those obtained in previous adult ETT study [69]. Blasius
coefficient was significantly higher than those estimated for adult and adolescent tubes,
due to the smaller inner diameter. This simple Blasius model may be implemented as a
clinical tool for the estimation of ΔPETT and consequently for the evaluation of tracheal
pressure signal during pediatric HFPV.
4.3 In vitro estimation of tracheal pressure by Genetic
programing
Endotracheal pressure drop was also modeled in terms of tracheal pressure (Ptr)
estimation using automatic generation of models by Genetic programing (GP) [78]. GP is a
method for automatically generating solutions, in the form of computer programs and
formulas, inspired by biological evolution. In this subchapter, is described synthesis of
such tracheal pressure model by means of GP. This study was conducted in collaboration
with Machine Learning Lab. of Department of Engineering and Architecture of University
of Trieste. The results obtained by GP-generated models were compared to the results
obtained by fluid dynamics based models used in previous study [69].
GP has been used in a wide range of applications as, electricity price prediction
[79] and text mining [80]. In GP, a population of computer programs is generated at
random starting from a predefined set of building blocks. Each of these programs
constitutes a candidate solution for the problem and is called an individual. The process is
based on a predefined fitness function for the problem to be solved. This function
quantifies the performance of any given candidate solution for that problem. Usually, the
fitness of an individual is computed on a set of solved instances of the problem (the
learning corpus) by comparing—in terms of some predefined performance index— the
solutions provided by the individual against the known correct solutions.
A GP execution consists in an evolutionary search structured as follows: (i)
compute the fitness of each individual; (ii) construct new individuals by applying certain
genetic operators (such as “crossover” and “mutation”) to the individuals with highest

Chapter 4 – Estimation of pressure drop across endotracheal tubes during HFPV
64
fitness; (iii) construct a new population composed of individuals with highest fitness and
new individuals as created at the previous step. These steps constitute a generation. This
process is iterated until either a solution with perfect fitness is found or some termination
criterion is satisfied, e.g., a predefined maximum number of generations have evolved.
Usually, the population size is kept constant across all generations.
In many scenarios of practical interest, each GP individual represents a formula
rather than a more general computer program. The formula is represented as an abstract
syntax tree, where a branch node is an element taken from a predefined functions set and a
leaf node is an element taken from a predefined terminal set (terminal set and function set
constitute the building blocks mentioned above). The function set may contain
mathematical functions like the arithmetic operators whereas the terminal set usually
contains constants and variables.
In this work GP models were generated by executing the evolutionary search and
applying the genetic operators crossover and mutation, starting from initialized formulas
using predefined functions (+, -, ·, ÷, exp and power) and terminal (Paw, V̇, V̈, Pwork, f,
constants) set. As a result of the evolutionary search, minimizing both mean square error
(MSE) and the individual size (i.e. the number of nodes in order to enforce parsimony
principle) a series of five models for each tube was produced. These models can be
represented as nonlinear function of the above mentioned functions and variables:
𝑃𝑡𝑟 = 𝑓(Paw, V̇, V̈, Pwork, 𝑓, α)
where α is the set of random constants uniformly distributed in [0.01 10].
GP searches were performed using a tool developed by Machine Learning Lab of
University of Trieste [79] [80]. In this study were used dataset consisting of in vitro
measured respiratory signals pressure and flow signals for tubes sizes 6.5 and 7.5, acquired
in a previous study [69].
The mean square errors obtained by GP-based models are reported in Table 4.3.
The GP-generated models presented good predicting performance in all the repetitions,
with the only exception of the fourth repetition for tube size 7.5 (Table 4.3). The GP
models generally presented lower error values (corresponding to a better estimation of the
tracheal pressure) than those of fluid dynamics models but are considerably more complex

Chapter 4 – Estimation of pressure drop across endotracheal tubes during HFPV
65
(more than 100 elements) than fluid dynamics models. Considering the median and range
values of the inspiratory pressure drop (i.e. 10.04 (5.62–16.97) cmH2O for tube 6.5 and
9.48 (5.05–13.47) cmH2O for tube 7.5 [69]) from the clinical point of view both
approaches adequately fit the experimental data. The difference between fitting errors
obtained implementing two approaches is not clinically relevant.
Repetitions
MSE [cmH2O2]
Tube size 6.5 Tube size 7.5
1 1.01 0.9
2 0.78 1.06
3 0.76 1.03
4 0.82 3.21
5 0.84 1.03
Mean 0.84 1.44
Table 4.3 MSE obtained by GP generated models averaging on all the combinations of different
working pressures, percussive frequencies and added mechanical resistive and elastic loads [78].
The computational complexity and the non-direct interpretability of the parameters
of models generated by genetic programing make their application very difficult in
everyday clinical practice. Moreover, the partitioning between resistive and inertance
components is not allowed. On the other hand, for each tube size the Blasius model is
characterized by only two constant coefficients (resistance dependent and inertia
dependent). Therefore, the contribution of resistive and inertance components is easily
interpretable in this model. Thus, by using of Blasius coefficients and the flow value the
pressure drop and consequently the tracheal pressure can be calculated rapidly.
The physician can use this information to avoid potential iatrogenic lung damage
due to not adequate pressure and volume delivery. In this way lung hyper and hypo-
inflation is prevented and the HFPV ventilator setup can be tailored to the real patient
requirement.
66
Chapter 5 - Respiratory parameters
measurements in patients undergoing
HFPV
The pressure measurements and gas exchange analysis are currently the only
variables that guide the physician during the HFPV ventilator setup. Evaluation of
respiratory system resistance and compliance parameters in patients undergoing
mechanical ventilation is used for lung dysfunctions detection, ventilation setup and
treatment effect evaluation. The estimation of across endotracheal tube pressure drop may
be very useful to the clinician to avoid over-treatment and associated lung injury or under-
treatment (e.g. alveolar de-recruitment). Avoiding the baro and volu-trauma is the
cornerstone of the protective ventilatory strategy, which requires also a measurement of the
tidal volume delivered to the patient. At the same time from a clinical point of view
alveolar de-recruitment must be avoided, so recruitment maneuvers are frequently
necessary to keep the lung open. Presently, it is not possible to evaluate the delivered tidal
volume, respiratory resistance and compliance parameters, endotracheal pressure drop and
the alveolar recruitment effect in patients undergoing HFPV treatment.
In previous chapters, the in vitro methods developed for estimation of respiratory
system viscoelastic parameters and endotracheal pressure drop were described. In this
Chapter the results concerning the application of these methods in some cases of patients
undergoing HFPV are described. By using new bedside respiratory signals measurements,
personalized ventilator setup was realized, in order to tailor HFPV treatment to the specific
patient’s needs.

Chapter 5 – Respiratory parameters measurement in patients undergoing HFPV
67
5.1 Material and Methods
The in vivo study was conducted in patients receiving HFPV for failure of
conventional ventilation at General Intensive Care Unit (ICU) of Cattinara Hospital,
University of Trieste. Ten patients (eight male) aged between 60 and 83 years were
prospectively studied. The group encompassed patients presenting chest trauma (n = 2),
sepsis (n = 3), bacterial pneumonia (n = 4), neurogenic pulmonary edema (n = 1).This
study was performed during a standardized HFPV clinical protocol without interfering
with patients care and under the supervision of a physician not involved in the study. The
information obtained by the data acquisition and the consequent ventilator setup variations
were applied in agreement with the physician. The study posed no added risk to the patient
and did not interfere with usual patient care.
5.1.1 Bedside acquisition system and respiratory parameters estimation
Respiratory signals in patients undergoing HFPV were acquired and processed with
a device suitably designed and developed, in this work, for bedside use (Figure 5.1). The
pressure signal Paw was acquired through pressure sensor (ASCX01DN, Honeywell,
USA), while the flow signal (V̇) was acquired using Fleisch pneumotachograph (Type 2,
Lausanne, Switzerland) linked to a differential pressure transducer (0.25 INCH-D-4V, All
Sensors, USA). Conditioning boards in addition to transducers mount a DC/DC converter
for power supply of sensors and a second-order Butterworth low-pass filters (cut-off
frequency of 300 Hz). The pressure and flow signals were sampled at 2 kHz by a 14 bit
acquisition board (NI USB-6009, National Instruments, Austin, TX, USA) connected to a
PC notebook. The volume (V) and volume acceleration (V̈) were calculated by numerical
integration and differentiation of flow, respectively.
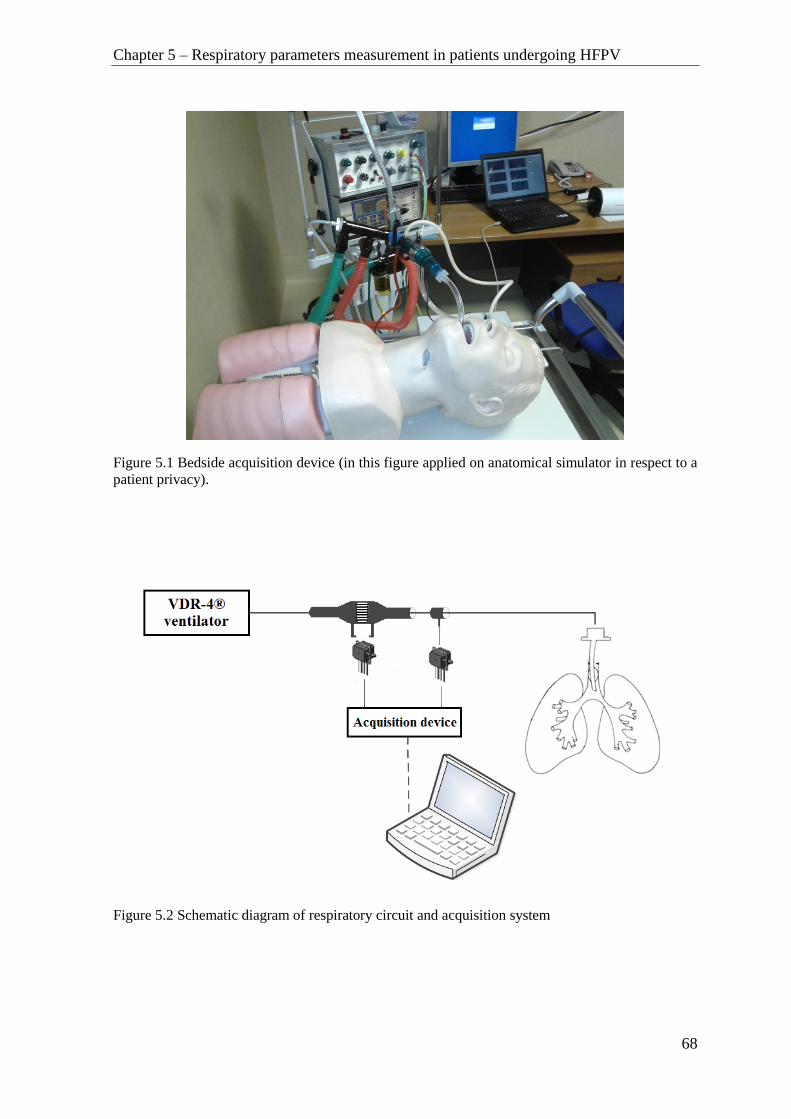
Chapter 5 – Respiratory parameters measurement in patients undergoing HFPV
68
Figure 5.1 Bedside acquisition device (in this figure applied on anatomical simulator in respect to a
patient privacy).
Figure 5.2 Schematic diagram of respiratory circuit and acquisition system
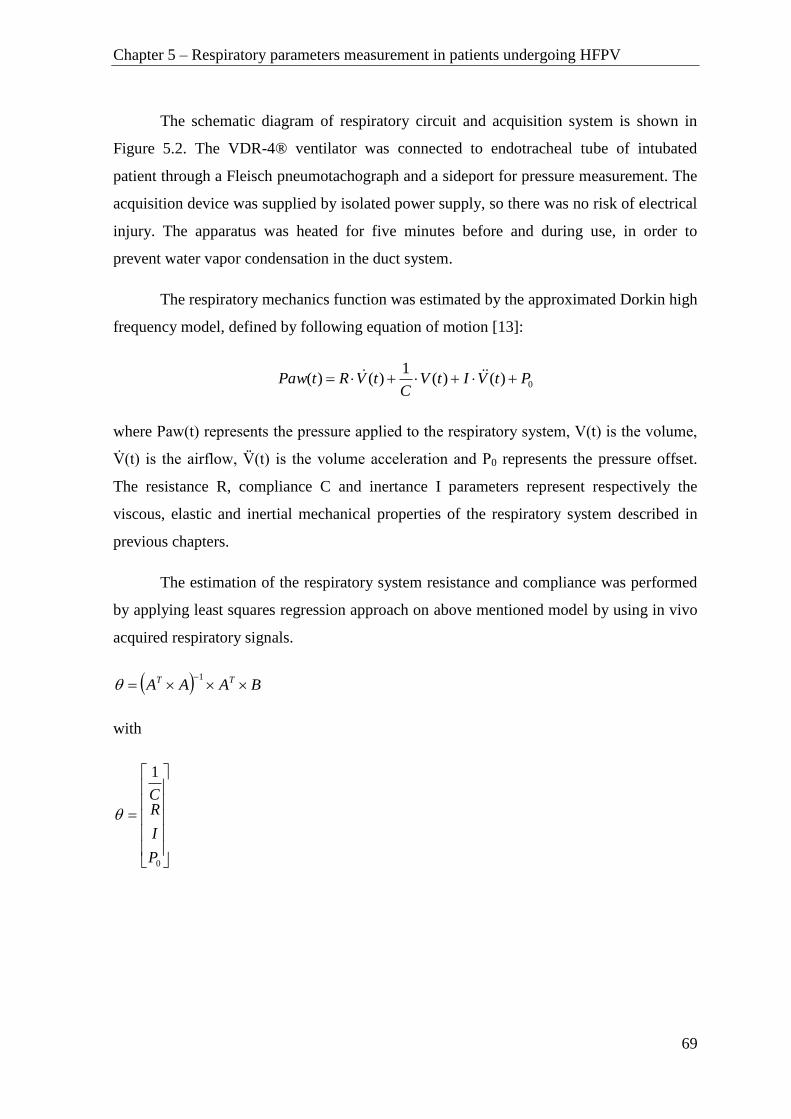
Chapter 5 – Respiratory parameters measurement in patients undergoing HFPV
69
The schematic diagram of respiratory circuit and acquisition system is shown in
Figure 5.2. The VDR-4® ventilator was connected to endotracheal tube of intubated
patient through a Fleisch pneumotachograph and a sideport for pressure measurement. The
acquisition device was supplied by isolated power supply, so there was no risk of electrical
injury. The apparatus was heated for five minutes before and during use, in order to
prevent water vapor condensation in the duct system.
The respiratory mechanics function was estimated by the approximated Dorkin high
frequency model, defined by following equation of motion [13]:
0)()(1
)()( PtVItVC
tVRtPaw
where Paw(t) represents the pressure applied to the respiratory system, V(t) is the volume,
V̇(t) is the airflow, V̈(t) is the volume acceleration and P0 represents the pressure offset.
The resistance R, compliance C and inertance I parameters represent respectively the
viscous, elastic and inertial mechanical properties of the respiratory system described in
previous chapters.
The estimation of the respiratory system resistance and compliance was performed
by applying least squares regression approach on above mentioned model by using in vivo
acquired respiratory signals.
BAAA TT 1
with
0
1
P
I
RC

Chapter 5 – Respiratory parameters measurement in patients undergoing HFPV
70
1
1
1
1
111
222
111
NNN
NNN
VVV
VVV
VVV
VVV
A
N
N
Paw
Paw
Paw
Paw
B
1
2
1
The adequacy of the model used to describe respiratory system in patients
undergoing HFPV was evaluated by means of residual root mean square error RMSE%
(representing the difference between measured and estimated Paw) expressed as a
percentage of the measured peak pressure Pawpeak
peak
N
k estmeas
PawN
kTPawkTPawRMSE
100)()(%
1
0
2
where Pawmeas represents the measured airway pressure, Pawest the estimated airway
pressure, T the sampling period, N the number of samples and Pawpeak the measured peak
pressure.
The endotracheal pressure drop (ΔPETT) was calculated applying Blasius model on
measured flow signal:
)()()( 75.1 tVItVKtP TBETT
where KB e IT are the resistance and inertance coefficients, respectively. The KB and IT
used in this study were those previously obtained in previous study reported in Chapter 4.

Chapter 5 – Respiratory parameters measurement in patients undergoing HFPV
71
5.1.2 Conventional ventilation protocol
During the first 12 h after admission to the ICU the patients underwent
conventional mechanical ventilation (CV). All patients were initially ventilated in volume
controlled mode with tidal volume (VT) set in accordance to protective ventilatory strategy,
i.e. VT ≤ 8 mL/Kg predicted body weight (PBW) . The predicted body weight was
calculated using the following equations suggested by “The Acute Respiratory Distress
Syndrome Network” [81]
PBW = 50 + 0.91 · (h -152.4) for males
PBW = 45.5 + 0.91 · (h -152.4) for females
where h is height in centimeterts.
During CV the positive end-expiratory pressure (PEEP) and inspired oxygen
fraction (FiO2) were selected to obtain arterial oxygen saturation (SaO2) of 90% or more.
After 12 hours of CV arterial blood gas was analyzed and the patients that present ratio
between pressure oxygen level and inspired oxygen fraction (PaO2/FiO2) of 200 or less or
greater than 200 but with an increase below 20% in relation to the admission value were
shifted to HFPV, as non-responders to CV.
5.1.3 High frequency percussive ventilation protocol
HFPV was set up similarly to CV by using the same inspiratory-expiratory time
ratio (I:E), mean airway pressure (Pawmean) and PEEP. The percussive frequency of
pulsatile flow was set to 500 cycles/min, and the pulse inspiratory and expiratory ratio (i:e)
was fixed to 1. After a short stabilization period of 10 minutes, the measurement of
respiratory parameters pressure, flow and volume was performed and the R, C and ΔPETT
parameters were estimated.
The measured tidal volume was compared to the one measured during CV, at the
same Pawmean. In case the tidal volume was above the protective limit (i.e. VT>8 mL/Kg
PBW), the flow was reduced on the VDR-4®. When the safety tidal volume was reached
the measurement was repeated.

Chapter 5 – Respiratory parameters measurement in patients undergoing HFPV
72
A mini recruitment maneuver was then applied in the form of peak airway pressure
increment by the calculated ΔPETT value. A new measurement of respiratory parameters
was performed in order to assess the variations in respiratory system and verify if the tidal
volume is within the safety limits.
During the following 12 hours the patient was ventilated maintaining these
ventilator settings and every 4 hours blood samples were collected for gas analysis and the
PaO2/FiO2 ratio was calculated. At the end of 12 hours of HFPV treatment the patients
returned to CV.
Figure 5.3 Experimental timeline. HFPV was substituted for CV in patients who did not respond to
conventional treatment after 12 hours. HFPV was set up similarly to CV by using the same
inspiratory-expiratory time ratio (I:E), mean airway pressure (Pawmean) and PEEP. ◊- measurement
of respiratory parameters; □ - ΔPTT pressure increment; ○- PaO2/FiO2 arterial blood gas analysis
Figure 5.4 From top to bottom: Pressure (airway pressure Paw – full line, calculated ΔPETT - dotted
line), Flow and Volume during an inspiratory phase of a single respiratory cycle

Chapter 5 – Respiratory parameters measurement in patients undergoing HFPV
73
5.2 Results
In Figure 5.4 are shown the tracings of airway pressure, flow and volume measured in a
patient undergoing HFPV. In the top panel calculated ΔPETT is also depicted. The
comparison between tidal volumes measured during the transition from CV to HFPV at the
same at the same Pawmean is reported in table 5.1.
Patient Pawmean
(cmH2O)
VT CV
(mL)
VT HFPV
(mL)
VT/Kg PBW
CV
(mL/Kg PBW)
VT/Kg PBW
HFPV
(mL/Kg PBW)
1 10 440 530 7.33 8.83*
2 14 500 520 6.25 6.50
3 15 610 630 7.18 7.41
4 12 450 620 6.43 8.86*
5 12 400 390 5.97 5.82
6 11 500 840 5.56 9.33*
7 17 520 480 6.50 6.00
8 10 380 415 6.13 6.69
9 9 510 490 6.14 5.90
10 15 500 420 6.41 5.38
Table 5.1 Comparison of tidal volume delivery between CV and HFPV at the same Pawmean.* - patients that
exceeded the upper safety volume limit. Results partially presented in [82].
During the transition from CV to HFPV in 30% of examined patients was detected that VT
exceeded the upper safety limit of 8 mL/Kg PBW as shown in table 5.1. In two cases the
upper limit was 10% exceeded (8.83 and 8.86 mL/Kg PBW), while in third case the
increment was more important, reaching 9.33 mL/Kg PBW. In all three cases VT was
immediately decreased to safety range by acting on HFPV setup.
Once achieved the safety volume range, the PETT was estimated, and the pressure
increment perturbation was applied. In Figure 5.4 the measured airway pressure curve is
compared to corresponding curve estimated with Dorkin model. Comparing estimated and
measured airway pressures low RMSE% (5.55+1.74)% values were found in all patients.
Moreover, as can be seen in Figure 5.4 the proposed method well estimates also PEEP
value. The measured tidal volume, and the estimated resistance and compliance values
before (VT, R, C) and after (VT’, R’, C’) the application of PETT increment are reported in
Table 5.2.
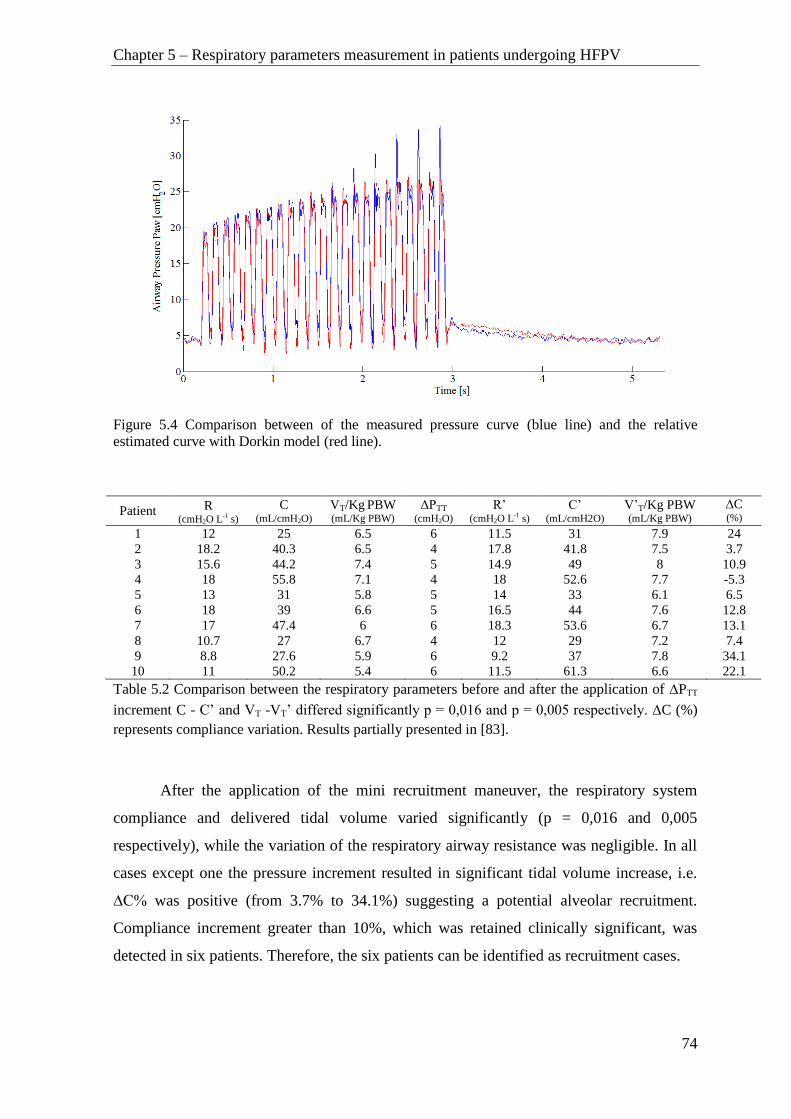
Chapter 5 – Respiratory parameters measurement in patients undergoing HFPV
74
Figure 5.4 Comparison between of the measured pressure curve (blue line) and the relative
estimated curve with Dorkin model (red line).
Patient R (cmH2O L-1 s)
C (mL/cmH2O)
VT/Kg PBW (mL/Kg PBW)
ΔPTT
(cmH2O)
R’ (cmH2O L-1 s)
C’ (mL/cmH2O)
V’T/Kg PBW
(mL/Kg PBW) ∆C (%)
1 12 25 6.5 6 11.5 31 7.9 24
2 18.2 40.3 6.5 4 17.8 41.8 7.5 3.7
3 15.6 44.2 7.4 5 14.9 49 8 10.9
4 18 55.8 7.1 4 18 52.6 7.7 -5.3
5 13 31 5.8 5 14 33 6.1 6.5
6 18 39 6.6 5 16.5 44 7.6 12.8
7 17 47.4 6 6 18.3 53.6 6.7 13.1
8 10.7 27 6.7 4 12 29 7.2 7.4
9 8.8 27.6 5.9 6 9.2 37 7.8 34.1
10 11 50.2 5.4 6 11.5 61.3 6.6 22.1
Table 5.2 Comparison between the respiratory parameters before and after the application of PTT
increment C - C’ and VT -VT’ differed significantly p = 0,016 and p = 0,005 respectively. C (%)
represents compliance variation. Results partially presented in [83].
After the application of the mini recruitment maneuver, the respiratory system
compliance and delivered tidal volume varied significantly (p = 0,016 and 0,005
respectively), while the variation of the respiratory airway resistance was negligible. In all
cases except one the pressure increment resulted in significant tidal volume increase, i.e.
∆C% was positive (from 3.7% to 34.1%) suggesting a potential alveolar recruitment.
Compliance increment greater than 10%, which was retained clinically significant, was
detected in six patients. Therefore, the six patients can be identified as recruitment cases.

Chapter 5 – Respiratory parameters measurement in patients undergoing HFPV
75
On the other side, in only one patient the pressure increment resulted in compliance
decrease suggesting a potential alveolar over-distention. An intermediate behavior
characterized by the compliance increment lower than 10% occurred in three patients. In
these cases the perturbation maneuver did not affected compliance. At the same time in all
patients, the tidal volume values remained within the safety limits (Table 5.2).
Figure 5.5 PaO2/FiO2 values in the ten patients at the ICU admission (initial observation), HFPV
enrollment (after 12 hours), four, eight and twelve hours of HFPV treatment, respectively. The
exact PaO2/FiO2 values are represented by circles, connected with dotted lines for each patient. Full
line represents the mean and 1SD values among patients. Results partially presented in [83]
In Figure 5.5 PaO2/FiO2 values before and during the HFPV treatment are reported. The
gas exchange did not differ from initial observation to HFPV enrollment. After the first
four hours of HFPV, PaO2/FiO2 increased significantly (mean slope = 12.1 h-1
). On the
whole the mean slope of the 12 hours HFPV treatment was 5.8 h-1
, compared to 1 h-1
obtained during previous 12 hours of conventional treatment.

Chapter 5 – Respiratory parameters measurement in patients undergoing HFPV
76
5.3 Discussion
This in vivo study aimed to personalize HFPV treatment using non-invasive
measurements and parameter estimation. The study was performed in ten non-responder
patients after 12 hours of conventional ventilation. HFPV initially was setup at the same
mean airway pressure of volume controlled CV.
The delivered tidal volume at the same mean airway pressure differed between
volume controlled CV and HFPV (Table 5.1). For this reason Pawmean cannot be
considered a reliable parameter for the monitoring of tidal volume changes during
transition from CV to HFPV. These results confirm intrinsic limits of Pawmean monitoring
already reported in a previous in-vitro study [29]. Moreover, in three cases the delivered
tidal volume exceeded significantly the upper safety limit of 8 mL/Kg PBW, violating the
protective ventilatory strategy. This indicates that the volume measurement is mandatory
during HFPV setup.
The estimated R and C values identified different lung conditions giving the
information about viscoelastic properties when the patients complied with protective
ventilatory strategy. The low RMSE% values obtained during parameter identification
confirm the adequacy of the high frequency Dorkin model to describe over time the
respiratory mechanics in patients undergoing HFPV.
After the assessment of appropriate tidal volume, a pressure increment (ΔPETT) was
performed. This mini recruitment maneuver perturbation produced in six patients (2 chest
trauma, 3 sepsis and 1 pneumonia) a significant increment (≥10%) of compliance without
compromising the patient’s safety VT’≤8 mL/Kg PBW (Table 5.2). This behavior is
characteristic of alveolar recruitment and it can be described as a shift from low inflation
zone to linear zone in the pressure–volume curve (Figure 5.6).

Chapter 5 – Respiratory parameters measurement in patients undergoing HFPV
77
Figure 5.6 Characteristic inspiratory limb of a P-V curve. LIP and UIP represent lower and upper
inflation point respectively. Three segments of P-V curve are defined by these points: Low
inflation zone below the LIP, linear zone between LIP and UIP and over-distention zone above UIP
The elastic lung properties can suddenly change when alveolar recruitment or de-
recruitment occurs. From a clinical point of view alveolar de-recruitment must be avoided
in order to keep the lung open. In the five of six recruitment cases the etiology of the acute
hypoxemia is not related to direct lung injury.
On the other hand, in one patient with stiff lungs due to bilateral pneumonia the
pressure increment produced an increase in VT and at the same time, a decrease in
compliance, resulting in an undesired over-distention. Finally the other three patients (2
pneumonia and 1 neurogenic pulmonary edema) presented an intermediate respiratory
mechanics behavior corresponding to linear part of P-V curve (Figure 5.6). In this case a
volume increment resulted in poor compliance variation as expected in subjects suffering
hypoxemia due to primitive lung lesions. On the contrary, the resistance did not change
significantly after perturbation in all patients. In fact the airway resistance mainly depends
on the presence of secretions and their mobilization is a known, but not immediate, feature
of HFPV [84].
The aforementioned variations of respiratory mechanics should be
pathophysiologically understood by considering the pressure volume relationship during
Chapter 5 – Respiratory parameters measurement in patients undergoing HFPV
78
mechanical ventilation. The pressure-volume curve (P-V) of the respiratory system is not
linear; it usually assumes a characteristic sigmoidal shape, with a central linear part where
C is higher and two inflection points respectively located at the beginning (LIP) and at the
end of the curve (UIP) (Figure 5.6) [85] [86]. These points represent the pressures at which
recruitment and de-recruitment begin and end. At the beginning the P-V curve is flat and
reflects very low compliance. For inspiratory pressures below the inspiratory LIP, the
increase in lung volume is mainly due to aeration of normally poorly aerated areas, while
when the airway pressure increases above the LIP recruitment starts [86]. The following
linear segment is characterized by a steeper slope due to Gaussian distribution of
recruitment pressures [87] and represents the maximum compliance. The UIP indicates the
end of the massive recruitment and beginning of alveolar over-distension segment in which
compliance decreases. It is important to detect the beginning of this segment in order to
avoid over-distension. Thus the tidal volume ventilation is desirable in the central zone of
the P-V tracing, between the two inflexion points [86], in order to maximize alveolar
recruitment and to minimize ventilatory induced lung injury. These considerations confirm
the clinical relevance of the pressure and volume monitoring as also the clinical relevance
of the viscoelastic respiratory system parameters estimation.
Blood gas analyses were recorded before and during the HFPV treatment and the
PaO2/FiO2 ratio did not differ from initial observation to HFPV enrollment, as expected in
non-responder patients. During the first four hours of the HFPV treatment, after the mini
recruitment maneuver, the mean slope of PaO2/FiO2 was 12.1 h-1,
compared to 10.2 h-1
obtained in the previous HFPV study based only on Pawmean setup [46] without ΔPETT
compensation. This increment is clinically relevant particularly because obtained in
accordance within the limits defined by protective ventilatory strategy. However, these
preliminary results should be confirmed in future study.
The in vivo study results suggest that is of paramount importance to evaluate VT, R
and C during HFPV to avoid under and over-treatment. The clinical studies demonstrated
that HFPV as a pressure controlled logic ventilation promotes alveolar recruitment [46]
[88]. The alveolar recruitment becomes particularly evident after at least 12 hours of
continuous HFPV treatment [46].The possibility to early optimize the pressure volume
relationship in safe way represents an important result, and can improve the positive effect

Chapter 5 – Respiratory parameters measurement in patients undergoing HFPV
79
of high frequency ventilation, minimizing iatrogenic lung damage. However, it is
important to underline that the tidal volume delivery should be chosen considering also the
heterogeneity of underlying lung injury typically present in these patients. Thus, it is very
important that VT be tailored, based on compliance value, in patients with acute lung injury
and acute respiratory distress syndrome. Deans et al point out that although some patients,
such as those with poor compliance and high airway pressures, would benefit from very
low tidal volume, others with less severe lung injury may require larger volumes to
maintain ventilation and avoid alveolar collapse during conventional mechanical
ventilation [89]. Furthermore, it was reported that the effect of changing tidal volume on
mortality is dependent on initial pulmonary compliance [89]. Patients with higher
compliances did poorly if VT was lowered, while the patients with relatively lower
compliances did well if VT was lowered. These findings agree with the idea that HFPV
ventilator setup should be tailored on the main respiratory parameters taking into account
the disease severity [90] [91].
80
Conclusions
High frequency percussive ventilation demonstrated over the years its high
effectiveness in the treatment of critical hypoxemic patients. However, the HFPV
ventilator setup is presently chosen basing only on pressure measurements and gas
exchange information. From a clinical point of view it is important to evaluate respiratory
system viscoelastic parameters during the ventilator setup in order to avoid under or over-
treatment.
This thesis offers a new approach for HFPV ventilator setup in accordance with
protective ventilatory strategy and optimization of alveolar recruitment using estimation of
the respiratory mechanics parameters and endotracheal pressure drop. Respiratory system
resistance and compliance were estimated, firstly in vitro and successively in patients
undergoing HFPV, applying least squares regression on Dorkin high frequency model,
starting from measured respiratory signals. Moreover, the Blasius model was identified as
the most adequate to estimate pressure drop across the endotracheal tube during HFPV.
Beside measurement device was developed in order to measure respiratory parameters in
patients undergoing HFPV.
The possibility to tailor HFPV ventilator setup, using respiratory signals
measurement and estimation of resistance, compliance and pressure drop across
endotracheal tube, provided by this thesis, open a new prospective to this particular
ventilatory strategy, improving its beneficial effects and minimizing ventilator-induced
lung damage.

81
Bibliography
1. Weibel ER, “Morphometry of the human lung” Berlin: SpringerVerlag. 1963
2. Tobin MJ, Van de Graaff WB. “Monitoring of lung mechanics and work of
breathing” In: Tobin MJ, ed. “Principles and Practice of Mechanical Ventilation”
McGraw-Hill, New York, 1994, pp. 967–1003
3. Grinnan, DC, Truwit JD. “Clinical review: respiratory mechanics in spontaneous
and assisted ventilation” Critical Care. 2005; 9(5):472
4. Johnson AT. “Biomechanics and Exercise Physiology” New York, Wiley. 1991
5. Avanzolini G, Barbini P, Costantino ML, Pedotti A, Rossi A. “Bioingegneria del
sistema respiratorio” Bologna: Pàtron Editore. 2001
6. Rodarte JR, Rehder K. “Dynamics of respiration” In Macklem PT, Mead J,
“Handbook of Physiology. The Respiratory System. Mechanics of Breathing”
Bethesda: The American Physiological Society, 1986:131–44
7. Bates JHT, Rossi A, Milic-Emili J. “Analysis of the behaviour of the respiratory
system with constant inspiratory flow” J Appl Physiol. 1985; 58:1840–1848
8. Polese G, Serra A, Rossi A. “Respiratory mechanics in the intensive care unit” In
“European respiratory monograph” 2005; 31:195
9. Otis AR, McKerrow CB, Bartlett RA, Mead J, Mcllroy MB, Selverstone NJ,
Radford EP Jr. “Mechanical factors in distribution of pulmonary ventilation” J.
AppI. Physiol. 1956; 8:427-443
10. Mead J. “Contribution of compliance of airways to frequency dependent behavior
of lungs” J. AppI. Physiol. 1969; 26: 670-673
11. Mount LE. “The ventilation flow resistance and compliance of rat lungs” J.
Physiol. Lond. 1955; 127:157-167
12. Bates JHT, Brown KA, Kochi T. “Respiratory mechanics in the normal dog
determined by expiratory flow interruption” J. Appl. Physiol. 1989; 67: 2276-2285
13. Dorkin HL, Lutchen KR, Jackson AC. “Human respiratory input impedance from 4
to 200 Hz: physiological and modeling considerations” J Appl Physiol. 1988;
64:823-31
Bibliography
82
14. Krishnan JA, Brower RG. “High-frequency ventilation for acute lung injury and
ARDS” Chest. 2000; 118(3): 795–807
15. Lucangelo U, Antonaglia V, Zin WA, Fontanesi L, Peratoner A, Bird FM, Gullo A.
“Effects of mechanical load on flow, volume and pressure delivered by high-
frequency percussive ventilation” Respir Physiol Neurobiol. 2004; 142(1):81-91
16. Oberg PA, Sjostrand U. “Studies of blood-pressure regulation” Acta Physiol.
Scand. 1969; 75.3: 287-300
17. Chang H.K. “Mechanisms of gas transport during ventilation by high frequency
oscillations” J. Appl. Physiol. , 1984; 56:553– 563
18. Drazen JM, Kamm RD, Slutsky AS. “High-frequency ventilation” Physiol. Rev.
1984; 64:505–543.
19. Slutsky AS. “Mechanisms affecting gas transport during high frequency
oscillations” Crit. Care Med. 1984; 12:713–717
20. Froese AB, Bryan AC, “High frequency ventilation” Am. Rev. Respir. Dis. 1987;
135, 1363–1374
21. Fort P, Farmer C, Westerman J, Johannigman J, Beninati W, Dolan ., Derdak S
“High-frequency oscillatory ventilation for adult respiratory distress syndrome--a
pilot study” Critical care medicine. 1997; 25 (6): 937-947
22. Lucangelo U, Fontanesi L, Antonaglia V, Pellis T, Berlot G, Liquori G, Bird FM,
Gullo A. “High Frequency Percussive Ventilation (HFPV) Principles and
techinique” Minerva Anestesiol, 2003; 69:841-51
23. Salim A, Martin M. “High-frequency percussive ventilation” Critical care medicine
2005; 33:241-245
24. Lucangelo U, Gramaticopolo S; Fontanesi L. “High-frequency percussive
ventilation” In: “Respiratory System and Artificial Ventilation” Springer: Milan
2008; p. 237-244.
25. Product information. Percussionaire Corporation. Sandopoint, ID, USA,1997
26. Branson RD. “High frequency ventilators” in Branson et al, “Respiratory care
equipment”, Philadelphia: Lippincott; 1995: 446-58
27. Kunugiyama SK, Schulman CS. “High-frequency percussive ventilation using the
VDR-4 ventilator: an effective strategy for patients with refractory hypoxemia”
AACN advanced critical care, 2012, 23.4: 370-380

Bibliography
83
28. The VDR®-4 manual of understanding. Percussionaire Corporation, 2009.
29. Lucangelo U., Antonaglia V, Zin W A, Berlot G, Fontanesi L, Peratoner A, Gullo
A “Mechanical loads modulate tidal volume and lung washout during high-
frequency percussive ventilation” Respiratory physiology & neurobiology. 2006;
150.1: 44-51
30. Hurst JM, Branson RD, De Haven CB. “The role of high-frequency ventilation in
posttraumatic respiratory insufficiency” J Trauma 1987; 27:236 –242
31. Lentz CW, Peterson HD. “Smoke inhalation is a multilevel insult to the pulmonary
system” Curr Opin Pulm Med 1997; 3:221–226
32. Reper P, Dankaert R, Van Hille F, Van Laeke P, Duinslaeger L, Vanderkelen A.
“The usefulness of combined high-frequency percussive ventilation during acute
respiratory failure after smoke inhalation” Burns 1998; 24:34–38
33. Campbell PJ, Chilton HW, Garvey PA, Gupta JM. “Volumetric diffuse respirator
use in neonatal respiratory failure” J. Paediatr. Child Health. 1991; 27, 31–33
34. Velmahos GC, Chan LS, Tatevossian R, Cornwell EE, Dougherty WR, Escudero J,
Demetriades D “High-frequency percussive ventilation improves oxygenation in
patients with ARDS” 1999; Chest 116:440–446
35. Spapen H, et al. “High-frequency percussive ventilation in severe acute respiratory
distress syndrome: A single center experience” Journal of anaesthesiology, clinical
pharmacology. 2014, 30.1: 65
36. Soudon P. Mechanical ventilation by tracheostomy in neuromuscular disease:
experience and evaluation. Eur Respir Rev 1993; 3:300-4
37. Hurst JM, Branson RD, DeHaven CB. The role of high-frequency ventilation in
post-traumatic respiratory insufficiency. J Trauma 1987; 27:236-42
38. Paulsen SM, Killyon GW, Barillo DJ. “High frequency percussive ventilation as a
salvage modality in adult respiratory distress syndrome: a preliminary study” Am
Surg 2002; 68:852–856
39. K. Deakins and R. L. Chatburn, “A comparison of intrapulmonary percussive
ventilation and conventional chest physiotherapy for the treatment of atelectasis in
the pediatric patient,” Respiratory care. , 2002; vol. 47, no. 10, pp. 1162–1167
Bibliography
84
40. Natale JE, Pfeifle J, Homnick DN. “Comparison of intrapulmonary percussive
ventilation and chest physiotherapy. A pilot study in patients with cystic fibrosis.
Chest” 1994; 105:1789-93
41. Lucangelo U. “High Frequency Percussive Ventilation” in Gullo, “Anaesthesia
pain, intensive care and emergency medicine” APICE, Proceedings of the 15th
postgraduate course in critical care medicine. Berlin: Springer – Verlag; 2001: 163-
71
42. Gallagher JT, Boysen PG, Davidson DD, Miller JR, Leven SB. High frequency
percussive ventilation compared with mechanical ventilation. Crit Care Med 1989;
17:364-6
43. Esan A, Hess DR, Raoof S, George L, Sessler CN. Severe hypoxemic respiratory
failure: part 1--ventilatory strategies. Chest 2010; 137:1203-16
44. Lucangelo U, Zin WA, Antonaglia V, Gramaticopolo S, Maffessanti M, Liguori G,
Cortale M, Gullo A. High-frequency percussive ventilation during surgical
bronchial repair in a patient with one lung. Br J Anaesth 2006; 96:533-6
45. Lucangelo U, Antonaglia V, Zin WA, Confalonieri M, Borelli M, Columban M,
Cassio S, Batticci I, Ferluga M, Cortale M, Berlot G. High-frequency percussive
ventilation improves perioperatively clinical evolution in pulmonary resection. Crit
Care Med 2009; 37:1663-9
46. Lucangelo U, Zin WA, Fontanesi L, Antonaglia V, Peratoner A, Ferluga M, Marras
E, Borelli M, Ciccolini M, Berlot G. “Early short-term application of high-
frequency percussive ventilation improves gas exchange in hypoxemic patients”
Respiration 2012; 84:369-76
47. Rizkalla NA, Dominick CL, Fitzgerald JC, Thomas NJ, Yehy N. “High-frequency
percussive ventilation improves oxygenation and ventilation in pediatric patients
with acute respiratory failure” 2014; Journal of critical care, 29(2): 314-e1.
48. Riscica F, Lucangelo U, Ferluga M, Accardo A. “In vitro measurements of
respiratory mechanics during HFPV using a mechanical lung model” Physiological
measurement. 2011; 32(6): 637-48
49. Riscica F, Lucangelo U, Accardo A. “Development of an innovative instrument for
the online characterization of high frequency percussive ventilators” Proceedings of

Bibliography
85
the World Congress on Medical Physics and Biomedical Engineering, September
7-12, 2009, Munich, Germany. Berlin: Springer; 2009:480-3.
50. Shaw A, Gregory NL, Davis PD, Patel K. “Flow-volume integrator for respiratory
studies” Med Biol Eng. 1976; 14(6):695-6
51. Rossi A, Gottfried SB, Higgs BD, Zocchi L, Grassino A, Milic-Emili J.
“Respiratory mechanics in mechanically ventilated patients with respiratory
failure” J Appl Physiol. 1985; 58(6):1849-58
52. Bernasconi M, Ploysongsang Y, Gottfried SB, Milic-Emili J, Rossi A. “Respiratory
compliance and resistance in mechanically ventilated patients with acute
respiratory failure” Intensive Care Med. 1988; 14(5):547-53
53. Nucci G, Mergoni M, Polese G, Cobelli C, Rossi A. On-line monitoring of
respiratory mechanics. In: Brusasco V, Macklem PT, Pedotti A, eds. Mechanics of
Breathing. Milan, Springer-Verlag, 2002: 327–336.
54. Volta CA, Marangoni E, Alvisi V, et al. Respiratory mechanics by least squares
fitting in mechanically ventilated patients: application on flow-limited COPD
patients. Intensive Care Med 2002; 28: 48–52
55. Ajcevic M, Accardo A, Fornasa E, Lucangelo U. “Estimation of Respiratory
Mechanics Parameters during HFPV” In XIII Mediterranean Conference on
Medical and Biological Engineering and Computing. 2014; pp. 591-594 Springer
International Publishing.
56. Accardo A, Ajcevic M, Lucangelo U. “Flow Resistance Estimation of
Endotracheal Tube during High Frequency Percussive Ventilation: Preliminary
Results” In: World Congress on Medical Physics and Biomedical Engineering May
26-31, 2012, Beijing, China. Springer Berlin Heidelberg, 2013. p. 20-23.
57. Bersten AD, Rutten AJ, Veding AE, Skowronski GA. “Additional work of
breathing imposed by endotracheal tubes, breathing circuits, and intensive care
ventilators” Crit Care Med. 1987; 17:671–7
58. Bolder PM, Healy TEJ, Bolder AR, Beatty PCW, Kay B. “The extra work of
breathing through adult endotracheal tubes” Anesth Analg. 1986; 65:853–9
59. Rocco PRM, Zin WA. “Modelling the mechanical effects of tracheal tubes in
normal subjects” Eur Respir J. 1995; 8:121–6
Bibliography
86
60. Conti G, De Blasi R A, Lappa A, Ferretti A, Antonelli M, Bufi M, Gasparetto A.
“Evaluation of respiratory system resistance in mechanically ventilated patients: the
role of the endotracheal tube” Intensive Care Med. 1994; 20:421–4
61. Zin WA, Pengelly LD, Milic-Emili J. “Active impedance of respiratory system in
anesthetized cats” J Appl Physiol. 1982; 53:149–57
62. Rohrer F. “Der Stroemungswiderstand in den menschlichen atemwegen und der
Einfluss der unregelmaessigen verzweigung des bronchialsystems auf den
atmungsverlauf in verschiedenen lungenbezirken” Pfluegers Arch Gesamte
Physiol. Menschen Tiere. 1915; 162:225–59
63. Rossi A, Gottfried S B, Higgs B D, Zocchi L, Grassino A, Milic-Emili J.
“Respiratory mechanics in mechanically ventilated patients with respiratory
failure” J Appl Physiol. 1985; 58:1849–58
64. Lorino AM, Beydon L, Mariette C, Dahan E, Lorino H. “A new correction
technique for measuring respiratory impedance through endotracheal tube” Eur
Respir J. 1996; 9:1079–86
65. Guttmann J, Eberhard L, Fabry B, Bertschmann W, Wolff G. “Continuous
calculation of intratracheal pressure in tracheally intubated patients”
Anesthesiology. 1993; 79:503–13
66. Jarreau PH, Louis B, Dassieu G, Desfrere L, Blanchard PW, Moriette G, Isabey D,
Harf A. “Estimation of inspiratory pressure drop in neonatal and pediatric
endotracheal tubes” J Appl Physiol. 1999; 87:36–46
67. Lofaso F, Louis B, Brochard L, Harf A, Isabey D. “Use of the Blasius resistance
formula to estimate the effective diameter of endotracheal tubes” Am Rev Respir
Dis. 1992; 146:974–9
68. Shumann S, Krappitz M, Moeller K, Hentschel R, Braun G, Guttmann J. “Pressure
loss caused by pediatric endotracheal tubes during high frequency oscillation
ventilation” Respir Physiol Neurobiol. 2008; 162:132–7
69. Ajčević M, Lucangelo U, Ferluga M, Zin WA, Accardo A. “In vitro estimation of
pressure drop across tracheal tubes during high-frequency percussive ventilation”
Physiological measurement. 2014; 35(2):177- 88.
70. Chang HK, Mortola JP. “Fluid dynamic factors in tracheal pressure measurement” J
Appl Physiol. 1981; 51:218–25

Bibliography
87
71. Loring SH, Elliot EA, Drazen JM. “Kinetic energy loss and convective acceleration
in respiratory resistance measurements” Lung. 1979; 156:33–42
72. Sullivan M, Paliotta J, Saklad M. “Endotracheal tube as a factor in measurement of
respiratory mechanics” J Appl Physiol. 1976; 41:590–2
73. Gammon RB, Shin MS, Buchalter SE. “Pulmonary barotrauma in mechanical
ventilation. Patterns and risk factors” Chest. 1992; 102:568–72
74. Khattree R, Naik DN. “Computational Methods in Biomedical Research” Boca
Raton: Chapman and Hall. 2008
75. Guttmann J, Kessler V, Mols G, Hentschel R, Haberthuer C, Geiger K.
“Continuous calculation of intratracheal pressure in the presence of pediatric
endotracheal tubes” Crit Care Med. 2000; 28:1018–26
76. Peslin R, Fredberg JJ. “Oscillation mechanics of the respiratory system” in
Macklem PT, J Mead J, “Handbook of Physiology. The Respiratory System.
Mechanics of Breathing”, Bethesda: The American Physiological Society,
1986:145–78
77. Ajcevic M, Accardo A, Fornasa E, Lucangelo U. “Estimation of pressure drop in
pediatric endotracheal tubes during HFPV” In: Signal Processing Conference
(EUSIPCO), 2013 Proceedings of the 21st European. IEEE, 2013. p. 1-5.
78. Ajcevic M, De Lorenzo A, Accardo A, Bartoli A, Medvet E. “A novel estimation
methodology for tracheal pressure in mechanical ventilation control” In: Image and
Signal Processing and Analysis (ISPA), 2013 8th International Symposium on.
IEEE, 2013. p. 695-699.
79. A. Bartoli, G. Davanzo, A. De Lorenzo, and E. Medvet, “Gp based electricity price
forecasting,” in Genetic Programming, ser. Lecture Notes in Computer Science, S.
Silva, J. Foster, M. Nicolau, P. Machado, and M. Giacobini, Eds. Springer Berlin
Heidelberg, 2011, vol. 6621, pp. 37–48.
80. A. Bartoli, G. Davanzo, A. De Lorenzo, M. Mauri, E. Medvet, and E. Sorio,
“Automatic generation of regular expressions from examples with genetic
programming,” in Proceedings of the fourteenth international conference on
Genetic and evolutionary computation conference companion. ACM, 2012, pp.
1477–1478.

Bibliography
88
81. De Campos T, et al. “Ventilation with lower tidal volumes as compared with
traditional tidal volumes for acute lung injury and the acute respiratory distress
syndrome. The Acute Respiratory Distress Syndrome Network.” N Engl J Med.
2000; 342(18):1301-8
82. Ajčević M, Lucangelo U, Accardo A. “In Vivo Measurements of Respiratory
Parameters during HFPV” In: 6th European Conference of the International
Federation for Medical and Biological Engineering. Springer International
Publishing, 2015. p. 472-475
83. Ajčević, M; Lucangelo U, Accardo A. “Tailoring of HFPV Treatment by
Respiratory Parameters Measurement” In: 16th Nordic-Baltic Conference on
Biomedical Engineering. Springer International Publishing, 2015. p. 9-12
84. Hall JJ, Hunt JL, Arnoldo BD, Purdue GF (2007) Use of high-frequency percussive
ventilation in inhalation injuries. J Burn Care Res 28:396–400
85. Albaiceta GM, Blanch L, Lucangelo U. “Static pressure-volume curves of the
respiratory system: were they just a passing fad?” Curr Opin Crit Care. 2008;
14(1):80-6
86. Correger E, Murias G, Chacon E, Estruga A, Sales B, Lopez-Aguilar J, Montanya
J, Lucangelo U, Garcia-Esquirol O, Villagra A, Villar J, Kacmarek RM, Burgueño
MJ, Blanch L. “Interpretation of ventilator curves in patients with acute respiratory
failure” Med Intensiva. 2012; 36(4):294-306.
87. Pelosi P, Goldner M, McKibben A et al (2001) Recruitment and derecruitment
during acute respiratory failure: an experimental study. American journal of
respiratory and critical care medicine 164(1):122-130
88. Kunugiyama SK, Schulman CS. “High-frequency percussive ventilation using the
VDR-4 ventilator: an effective strategy for patients with refractory hypoxemia”
AACN Adv Crit Care. 2012; 23(4):370-80.
89. Deans KJ, Minneci PC, Cui X, Banks SM, Natanson C, Eichacker PQ. “Mechanical
ventilation in ARDS: One size does not fit all*” Critical care medicine. 2005;
33(5):1141-1143.
90. Marini JJ, Gattinoni L. “Ventilatory management of acute respiratory distress
syndrome: A consensus of two” Crit Care Med. 2004; 1:250–255

Bibliography
89
91. Ricard JD. “Are we really reducing tidal volume—And should we?” Am J Respir
Crit Care Med. 2003; 10:1297–1298