ABSTRACT direction of Dr. Michael Gamcsik.)
102
ABSTRACT JIANG, XIAO. A Tumor-on-a-chip for Studying Cancer Metastasis under Oxygen Gradient. (Under the direction of Dr. Michael Gamcsik.) Cancer cells cultured in a low oxygen atmosphere which models hypoxic regions of tumors often show increased metastatic potential. Many studies concerning the relationship between cancer metastatic potential and oxidative stress have been done. The PDMS microfluidic device has the ability to create and maintain an oxygen gradient over its microchannels, thus is more and more commonly used to study oxygen gradient and cell metastasis. In this thesis, the design of a tumor-on-a-chip PDMS device is described. In this design, a gas channel layer sits directly above a cell channel layer. The gas channel layer enables the control of oxygen level and the creation of spatial heterogeneity of oxygen concentration in the media of the cell channel layer. The cell channel layer functions as an invasion assay with cells trespassing Matrigel blocked, capillary sized invasion channels. MCF7-0 and MDA-MB-231 cancer cells have been cultured in the device in order to determine the effect of oxygen content and an oxygen gradient on cell metastasis. Tygon tubing is commonly used as a liquid delivery component in microfluidic device. In many microfluidic designs, cells are seeded and later perfused with growth media through the same Tygon tubing. However, this tubing could cause problems with cell viability. This thesis shows that cells trapped in this tubing can die from anoxia and release toxic factors into the perfusate. Experiments were performed to determine if lactic acid that is produced by mammalian cells during anaerobic respiration is produced in sufficient quantities in the anoxic cells in the Tygon tubing to have a negative effect on cell growth. The results show that a 20 mM lactic acid leads slower the growth of MDA-MB-231 cancer cells.
Transcript of ABSTRACT direction of Dr. Michael Gamcsik.)

ABSTRACT
JIANG, XIAO. A Tumor-on-a-chip for Studying Cancer Metastasis under Oxygen Gradient. (Under the
direction of Dr. Michael Gamcsik.)
Cancer cells cultured in a low oxygen atmosphere which models hypoxic regions of tumors often show
increased metastatic potential. Many studies concerning the relationship between cancer metastatic potential
and oxidative stress have been done. The PDMS microfluidic device has the ability to create and maintain
an oxygen gradient over its microchannels, thus is more and more commonly used to study oxygen gradient
and cell metastasis. In this thesis, the design of a tumor-on-a-chip PDMS device is described. In this design,
a gas channel layer sits directly above a cell channel layer. The gas channel layer enables the control of
oxygen level and the creation of spatial heterogeneity of oxygen concentration in the media of the cell
channel layer. The cell channel layer functions as an invasion assay with cells trespassing Matrigel blocked,
capillary sized invasion channels. MCF7-0 and MDA-MB-231 cancer cells have been cultured in the device
in order to determine the effect of oxygen content and an oxygen gradient on cell metastasis.
Tygon tubing is commonly used as a liquid delivery component in microfluidic device. In many
microfluidic designs, cells are seeded and later perfused with growth media through the same Tygon tubing.
However, this tubing could cause problems with cell viability. This thesis shows that cells trapped in this
tubing can die from anoxia and release toxic factors into the perfusate. Experiments were performed to
determine if lactic acid that is produced by mammalian cells during anaerobic respiration is produced in
sufficient quantities in the anoxic cells in the Tygon tubing to have a negative effect on cell growth. The
results show that a 20 mM lactic acid leads slower the growth of MDA-MB-231 cancer cells.

A Tumor-on-a-chip for Studying Cancer Metastasis under Oxygen Gradient
by
Xiao Jiang
A thesis submitted to the Graduate Faculty of
North Carolina State University
in partial fulfillment of the
requirements of the Degree of
Master of Science
Biomedical Engineering
Raleigh, North Carolina
2014
APPROVED BY:
Christine Grant Gleen Walker
Michael Gamcsik
Chair of Advisory Committee

ii
BIOGRAPHY
Xiao Jiang was born in Beijing, China, on July 15th
, 1990. He attained his primary, middle and high school
in Beijing. Later, he went to Zhejiang University in Hangzhou, China in August, 2008. He studied biology
and got a Bachelor degree of biological Science at the College of Life Science in Zhejiang University in
July, 2012. In the August of 2011, he came to North Carolina State University, U.S. as a student in 3+X
program. After studying in the UNC/NCSU Joint Department of Biomedical Engineering for half a year, he
was officially admitted as a graduate student pursuing the Master Degree of Biomedical Engineering at
North Carolina State University.
In his undergraduate study, Xiao worked with Pro. Chengxin Fu from Zhejiang University. He studied
systematic evolution of the plant in the family Smilacaceae, and the in vitro propagation of the plant
Tetrastigma hemsleyanum Diels et Gilg. In his graduate study, Xiao worked with Dr. Michael Gamcsik
from North Carolina State University. He studied cancer metastasis with microfluidic device. He
participated in the fabrication of “Tumor-on-a-Chip” (toac) microfluidic device and successfully grew cells
with this device. He also studied the use of Tygon tubing in this toac device and its effect on cell viability.

iii
ACKNOWLEDGEMENTS
I would like to acknowledge everyone who has contributed to this research. I would like to thank my
advisor, Dr. Gamcsik, for the opportunity to work under his tutelage, and further for his patience,
mentorship, kindness and guidance, without which I could not have completed this work. I would also like
to thank Dr. Walker, for his constant instruction and encouragement. I would like to thank Dr. Miguel
Acosta for working with me together on this research, giving me a lot of encouragements and good ideas. I
would also like to thank Eason Huang, for giving me instruction of this research. I would also like to thank
Ms. Staphaine Tetter, Ms. Vindhya Kunduru, Dr. Rex Jeffries and everyone else that has helped me in my
graduate study. I would also like to thank my committee for your time and effort in ensuring I could
succeed in this endeavor.
I would also like to thank my friends who came with me here from China, for their helps without which I
would have a hard time to adapt the life here. Finally, I must acknowledge my parents who have gave birth
to me, raised me as I am, always being considerate and supported me for education.

iv
LIST OF CONTENTS
LIST OF FIGURES .................................................................................................................................. vi
Chapter 1. Literature Review ..................................................................................................................... 1
1.1 Breast Cancer ....................................................................................................................................... 1
1.2 Hypoxia in Tumor ............................................................................................................................... 2
1.3 Hypoxia Inducible Factors ................................................................................................................... 4
1.4 Cancer Metastasis ................................................................................................................................ 6
1.5 Cancer Metastasis Models ................................................................................................................... 7
1.6 Cancer Stem Cells ............................................................................................................................. 10
1.7 Oxidative Stress and Cancer Metastasis ............................................................................................ 12
1.8 Models to Study Oxidative Stress in Tumor ...................................................................................... 14
1.9 Conventional and Microfluidic Cancer Cell Invasion Assay ............................................................. 18
1.10 Lactic Acid and Cancer Metastasis .................................................................................................. 21
Chapter 2. Long Term Cell Culture in PDMS Microfluidic Device and the Use of Tygon○R Tubing in
the Media Deliver System ....................................................................................................................... 23
2.1 Introduction ....................................................................................................................................... 23
2.2 Materials and Methods ...................................................................................................................... 28
2.3 Results ............................................................................................................................................... 33

v
2.4 Discussion ......................................................................................................................................... 39
Chapter 3. A Tumor-on-a-Chip for Studying Oxygen Gradient Induced Breast Cancer Cell Metastasis
................................................................................................................................................................... 42
3.1 Introduction ....................................................................................................................................... 42
3.2 Materials and Methods ...................................................................................................................... 45
3.3 Results ............................................................................................................................................... 57
3.4 Discussion ......................................................................................................................................... 68
Chapter 4. Conclusion ............................................................................................................................. 72
References ............................................................................................................................................... 74
Chapter 1 ................................................................................................................................................. 74
Chapter 2 ................................................................................................................................................. 91
Chapter 3 ................................................................................................................................................... 92

vi
LIST OF FIGURES
Figure 1.1 Periodicity of intermittent hypoxia ........................................................................................... 3
Figure 1.2 Raymond’s device with oxygen diffusion layer. ...................................................................... 18
Figure 2.1 Diagram of three different cell growth media delivery systems. .............................................. 25
Figure 2.2 The effect of flow rate on cell culture within a microfluidic system ...................................... 27
Figure 2.3 Diagram of three different microfluidic cell culture systems ................................................. 31
Figure 2.4 MDA-MB-231 cells cultured in off-chip, on-chip and on-top devices .................................. 33
Figure 2.5 MDA-MB-231 cells cultured in PM and DM. ......................................................................... 35
Figure 2.6 The growth rate of MDA-MB-231 cells cultured in NM, PM and DM. .................................. 36
Figure 2.7 MDA-MB-231 cells cultured in PM (C,D) and DM (A,B) ...................................................... 37
Figure 2.8 Growth rate of MDA-MB-231 cells with normal and lactic acid media ................................ 38
Figure 2.9 Comparison of growth rate of MDA-MB-231 cells in NM and LA ....................................... 39
Figure 3.1 Invasion/migration assays in a classic Transwell chamber are performed under non-varying
pO2 ......................................................................................................................................................... 44
Figure 3.2 Overview of the Tumor-on-a-chip ........................................................................................... 44
Figure 3.3 Cell channel master fabrication diagram for tumor-on-a-chip ................................................. 48
Figure 3.4 Diagram of the gas channel master and cell channel master .................................................... 49
Figure 3.5 Tumor-on-a-chip fabrication diagrams .................................................................................... 51

vii
Figure 3.6 Diagram for Matrigel filling in on-top designed tumor-on-a-chip device ................................ 53
Figure 3.7 The media delivery designs for tumor-on-a-chip device .......................................................... 55
Figure 3.8 The diagram of tumor-on-a-chip .............................................................................................. 58
Figure 3.9 Matrigel filling affected by Tygon tubing at the air channel inlet .......................................... 59
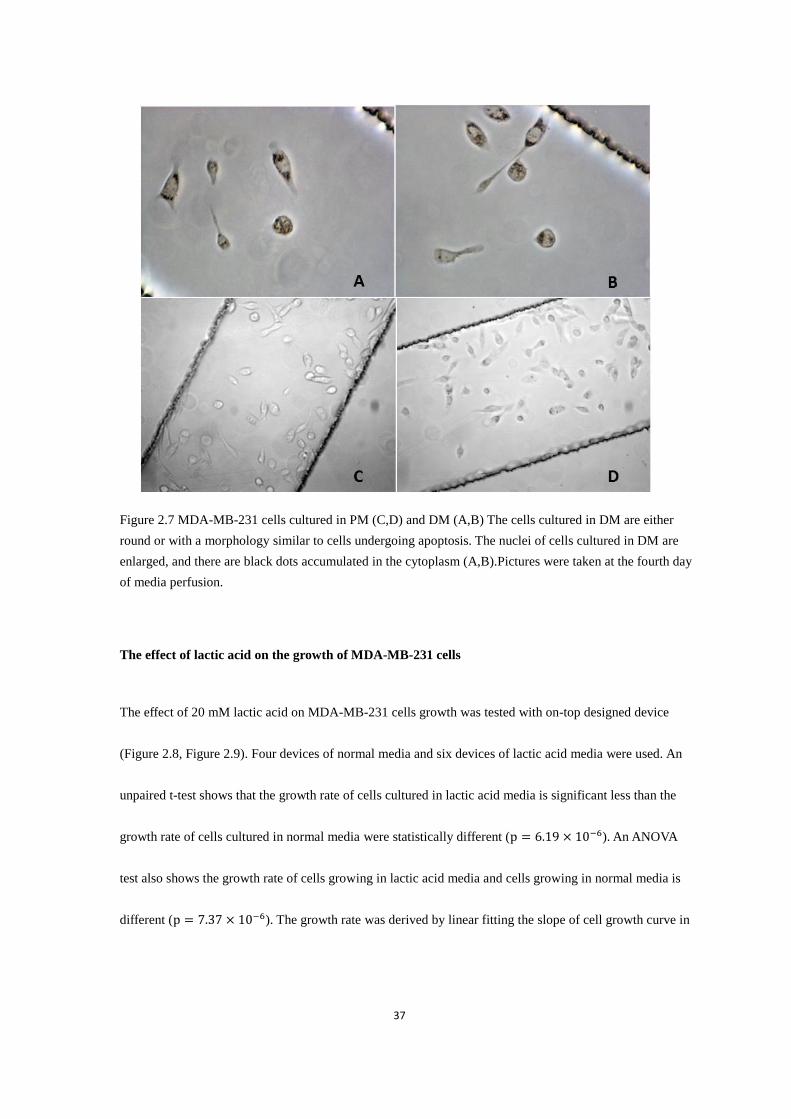
Figure 3.10 Diagram shows that cells growing in the reservoir of on-chip designed device .................... 61
Figure 3.11 COMSOL simulation for the spatial distribution of oxygen landscape across the entire device
................................................................................................................................................................... 62
Figure 3.12 The effect of flow rate on cell culture with tumor-on-a-chip ............................................... 63
Figure 3.13 The comparison of aggressiveness between MCF7-0 and MDA-MB-231 cell line ............... 65
Figure 3.14 Photograph of MDA-MB-231 cells (top) and MCF7-0 cells (bottom, stained) growing in the
device ........................................................................................................................................................ 66
Figure 3.15 Comparison of cell growth in tumor-on-a-chip (toac) and in traditional cell culture flask .. 68
Figure 3.16 Diagram shows that cells remaining in the channel inlet after cell seeding ........................... 70
Figure 3.17 Diagram shows the introduction of a U shape flow to was the cells remained in the PDMS
inlet after cell seeding .............................................................................................................................. 70

1
Chapter 1. Literature Review
1.1 Breast Cancer
Breast cancer originates in breast tissue, which is composed of the milk producing lobules, the ducts
connecting lobules to the nipple, and fatty, connective and lymphatic tissue(8)
. Breast cancer constitutes
many subtypes with diverse malignant grade(97)
. Most breast cancers begin in the cells of lobules or the
ducts. Those that stay within the lobules or ducts are non-invasive, also called carcinoma in situ, and those
that spread into normal tissue are invasive cancers(126)
. The progression of breast cancer can be classified by
how far it has spread, from stage 0, non-invasive breast cancer to stage IV, invasive breast cancer that has
spread beyond breast tissue and nearby lymph node to distant organs, such as lung, bone and brain(163)
.
Breast cancer is the most common malignancy among women (122,168)
. According to the estimate of the
American Cancer Society, the number of new cases of invasive breast cancer in America in the year of 2011
was 230,480 and the number of new cases of in situ breast cancer was 57,650(8)
. In addition to its
pervasiveness, breast cancer is also highly invasive. Even though the earlier detection and the use of
systemic adjuvant treatment have increased the survival rates, still half of the patients develop
metastases(122)
. Most of the patients who die of breast cancer are not killed by the primary tumor, but are
killed by its metastasis to distant organs(24,182)
. Studies have shown that the increased lymph node
involvement has a negative effect on percentage of relative survival, and is independent of tumor
size(41)
. Though lymph node involvement has been a prognostic criterion indicative of worse outcome
and aggressive disease, it is notable that lymph node metastasis would not necessarily lead to distant
metastasis(98)
. Commonly, breast cancers metastasize to lung, liver, bone and brain(85)
.

2
1.2 Hypoxia in Tumors
Hypoxia is the reduction of oxygen tension below the normal level for a specific tissue caused by the
imbalance between oxygen delivery and oxygen consumption(118,122)
. Hypoxia may occur when a tumor
outgrows its blood supply. Though tumors usually induce blood vessel growth (angiogenesis) to support
their expansion, the blood vessels developed in tumors are often abnormal functionally and structurally(120)
.
The blood vessels in a solid tumor are not evenly distributed, and the center of the tumor often has less
vascular density(153)
. Also, some tumor microvessels contain very few to no red blood cells(54)
. Thus, solid
tumors often consist of regions of chronic hypoxia, where the oxygen tension is limited by diffusion, and
regions of intermittent hypoxia, where the aberrant blood vessel shut off temporally followed by
reperfusion(97,120)
. The portion of intermittent hypoxia in tumor is significant, and there is study showing
that up to 20% cells in human cervical squamous cell carcinoma tumors experience intermittent hypoxia
over periods of several hours(15)
. The oxygen tensions of several cancer types have been measured, showing
values between 0~20 mmHg in tumor tissues, which are significantly lower than 24~66 mmHg, which is
measured from adjacent normal tissues(25,165,173)
. Dewhirst in 1998 measured the pO2 in mouse tumors. The
results suggest that the temporal fluctuation in pO2 is a common phenomenon in tumors, and the
hypoxia/re-oxygenation turnover occurs at a rate of 4-7 events per hour (53)
. More and more studies have
been done to elucidate the periodicity of hypoxia, and the results suggest that there exist two frames (Figure
1.1). There are fluctuations in pO2 of one to three cycles per hour(36,54,110)
, and a more prolonged time scale
where fluctuations happen on a day to day basis( 28,161)
.
3
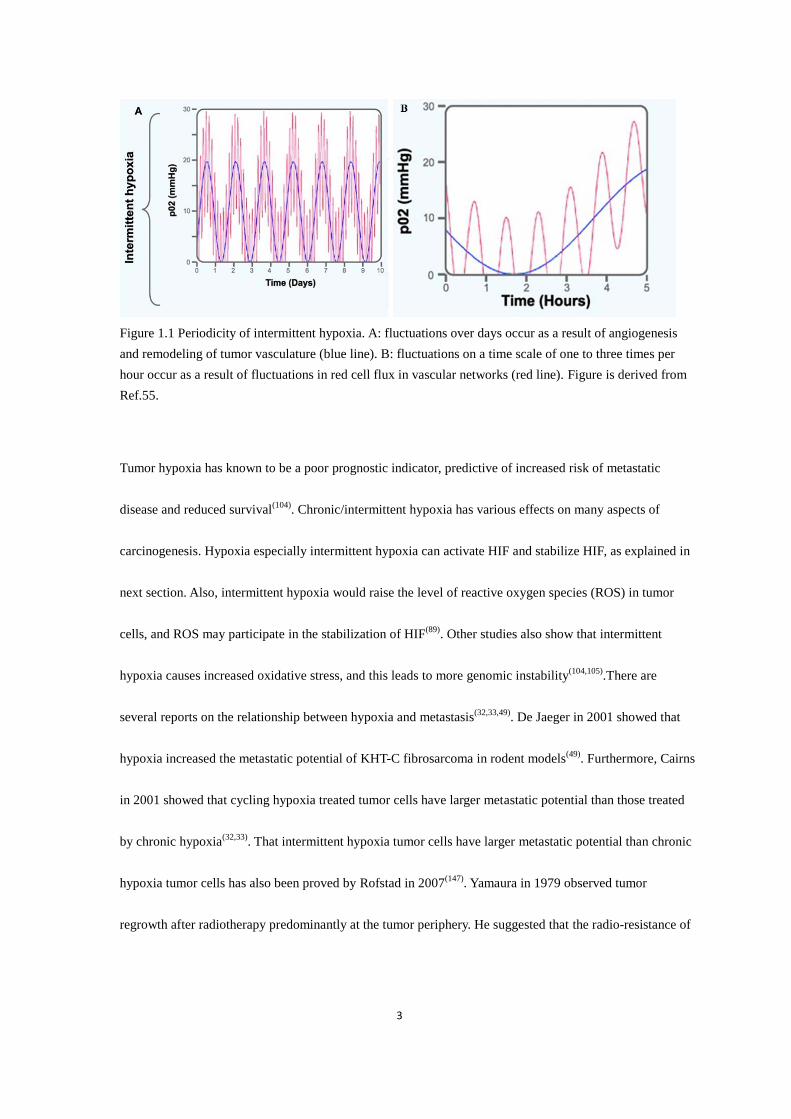
Figure 1.1 Periodicity of intermittent hypoxia. A: fluctuations over days occur as a result of angiogenesis
and remodeling of tumor vasculature (blue line). B: fluctuations on a time scale of one to three times per
hour occur as a result of fluctuations in red cell flux in vascular networks (red line). Figure is derived from
Ref.55.
Tumor hypoxia has known to be a poor prognostic indicator, predictive of increased risk of metastatic
disease and reduced survival(104)
. Chronic/intermittent hypoxia has various effects on many aspects of
carcinogenesis. Hypoxia especially intermittent hypoxia can activate HIF and stabilize HIF, as explained in
next section. Also, intermittent hypoxia would raise the level of reactive oxygen species (ROS) in tumor
cells, and ROS may participate in the stabilization of HIF(89)
. Other studies also show that intermittent
hypoxia causes increased oxidative stress, and this leads to more genomic instability(104,105)
.There are
several reports on the relationship between hypoxia and metastasis(32,33,49)
. De Jaeger in 2001 showed that
hypoxia increased the metastatic potential of KHT-C fibrosarcoma in rodent models(49)
. Furthermore, Cairns
in 2001 showed that cycling hypoxia treated tumor cells have larger metastatic potential than those treated
by chronic hypoxia(32,33)
. That intermittent hypoxia tumor cells have larger metastatic potential than chronic
hypoxia tumor cells has also been proved by Rofstad in 2007(147)
. Yamaura in 1979 observed tumor
regrowth after radiotherapy predominantly at the tumor periphery. He suggested that the radio-resistance of

4
the tumor cells at the periphery might be related to transient hypoxia, because that temporary vascular stasis
in the tumor periphery has been occasionally observed before the irradiation(185)
. The radio-resistance effect
of cycling hypoxia on tumor cells has been proved later by Hsieh. This study showed that U87 glioma cells
treated with cycling hypoxia have higher levels of HIF-1 and are more radio-resistant than those treated
with uninterrupted hypoxia(89)
. In conclusion, hypoxia especially intermittent hypoxia increases the
metastatic potential and therapy resistance of tumor cells. It also affects many other processes of cancer
development through HIF and ROS and other mechanisms. Thus, it is important to study the effect of
chronic/intermittent hypoxia on tumor cells.
1.3 Hypoxia Inducible Factors
There are many defensive responses that tumor cells use to fight hypoxic stress. Tumor cells may stop
proliferation, reduce energy consumption, rely more on glycolysis and release survival and proangiogenic
factors(120)
. Many of these responses are regulated by a sequence specific DNA binding transcription factor,
Hypoxia Inducible Factor (HIF), which has been recognized as a key modulator of transcriptional response
to hypoxic stress and also plays a key role in many crucial aspects of cancer biology(120,154)
. HIF-1 has been
found in all metazoan species analyzed to date(154)
. HIFs are heterodimers consist of a HIFαsubunit and a
HIFβsubunit, the former of which is regulated by oxygen and the latter is stably transcribed.
The basic model to illuminate how HIF responses to cellular oxygen availability change is through
hydroxylation of both HIFα and factor inhibiting HIF1α(FIH1)(120,154)
. The hydroxylation of HIFαis
mediated by prolyl hydroxylase domain enzymes (PHDs), which are 2-oxoglutarate- and iron- dependent
dioxygenases. With oxygen as a direct substrate, PHDs are able to sense the cellular oxygen level, thus

5
couple the HIF activity with oxygen availability. In normoxic conditions, PHDs hydroxylate HIF at
conservative proline residues, thus mark it for proteosomal destruction by the von Hippel-Lindau protein
(pVHL) complex; in hypoxic conditions, PHDs’ activity is diminished and HIFαstabilized(95,120)
. Studies
have shown that tumor cell mitochondria produce reactive oxygen species (ROS) in severe oxygen
deprivation. ROS could also antagonize PHD activity by oxidizing the Fe(II) in the hydroxylases’ catalytic
center(79,106)
.
In hypoxic conditions, without hydroxylation, HIFαis stabilized, thus it is able to dimerize with HIFβ and
relocate into nuclei. Dimerization is necessary to enable binding to the specific hypoxia response elements
(HRE) in a gene’s promoter region. The HIF dimer interacts with its coactivators and start transcription of
the targeted gene(106)
. HIF targets about 100~200 genes that protect cells from low O2 stress(95)
. In hypoxic
conditions, cells have limited oxygen and cannot utilize the tricarboxylic acid cycle and oxidative
phosphorylation pathway to metabolize glucose and to generate energy. Along with other factors such as
proto-oncogene c-Myc, HIF1αguides the metabolic shift from the tricarboxylic acid cycle to glycolysis.
These effects directly enhance glycolysis and block glycolytic end products from entering the
mitochondria(76,120)
. Another effect of HIF on tumor cell survival is reducing reactive oxygen species (ROS),
which has been observed to be elevated in many types of cancer especially under hypoxia (7,98)
. Under
hypoxia, ROS are suggested to be generated at the site of complex III of the electron transport chain,
through unknown mechanisms(79)
. Though ROS are believed to play roles in many of the signal
mechanisms for tumor progression, it can damage DNA and RNA and oxidize polyunsaturated fatty acids as
well as amino acid residues in proteins. Though many studies have been done, we still don’t know the
6
whole picture of how HIF, ROS and other angiogenic factors interact in hypoxic tumor cells, or the roles
they play in cancer metastasis.
1.4 Cancer Metastasis
Nearly 90% of cancer associated mortality is caused by metastatic disease. Cancer metastasis has always
been under close scrutiny, yet it remains the most poorly understood part of cancer pathology. Metastatic
dissemination of cancer contains the following main steps. The first is intravasation, in which cancer cells
invade the surrounding tissue and enters a blood or lymphatic vessel. Secondly, carried by the circulatory
system (primarily blood vessels), metastatic cancer cells are arrested by the size restriction of the small
capillary at distant tissues. The next step is extravasation, in which the trapped cancer cells exit from the
bloodstream to the parenchyma of the tissue. Tumor cell extravasation could happen via diverse
mechanisms. After being trapped in the blood vessel, adherent tumor cells may invade through the
intracellular junction of endothelial cells (paracellular route) or else, they may penetrate through the
endothelial cell body (transcellular route)(98,109)
. Some tumor cells secrete products that stimulate
endothelial cell retraction, whereas other tumor cells proliferate within the vessel lumen and finally rupture
the vessel itself(5,87,109)
. Recent studies have shown that a distinct population of CD11b+ macrophages may
mediate the extravasation process(140)
. Finally, the extravasated cancer cells need to survive at the new site,
proliferate and form a new macroscopic secondary tumor(34)
. After gaining access to the underlying tissue
parenchyma, tumor cells establish reciprocal signaling networks with stromal cells to promote their
growth(109)
. To meet the increasing metabolic demands for unrestrained cell division, tumor cells synthesize
proangiogenic signals that orchestrate microvascular endothelial cells to form new vascular networks(109)
.

7
It has been long recognized that cancer metastasis is intrinsically an ineffective process, in which only less
than 0.01% of circulating tumor cells finally succeed in forming secondary tumors(60,109)
. The first steps of
metastasis—arrest in tissue and extravasation appears to occur with high efficiency, yet the following step
—the outgrowth to form macroscopic metastasis was considered to be the limiting step of the
process(31,35,119)
. The temporal duration of the metastatic process could be as long as decades. Metastatic
cancer cells could enter a dormant state, thus metastasis may relapse years after the primary tumor has been
removed. Recently, Yachida et al. performed a quantitative analysis for the timing of the genetic evolution
of pancreatic cancer. Their result indicated that there is at least a decade between the occurrence of the
initiating mutation and the birth of the parental, non-metastatic founder cell. At least five more years are
required for the development of metastatic ability and patients die an average of two years thereafter(184)
.
1.5 Cancer Metastasis Models
In 1965, Leighton hypothesized that metastases arise from definite genetically determined subpopulations
in primary tumors(112,178)
. By injecting B16 melanoma cells intravenously into mouse, Fidler in 1973 found
that metastatic tumor cells have greater metastatic potential than the primary tumor cells from which the
metastasis arises(61)
. In 1977, Fidler et al. also observed variant metastatic potentials from intravenously
injecting in vitro clones of a parental culture of murine malignant melanoma cells into mouse(62)
. These
observations support the theory that tumor cells are heterogeneous, and in any tumor there exist
subpopulations which are more apt to generate secondary metastasis. Moreover, Fidler further suggested
that these subpopulations evolve during later stage of tumorigenesis, in which rare cells from low metastatic
potential primary tumor cells acquire metastatic capacity through additional somatic mutations(62,178)
. There
8
is also a spontaneous metastasis model suggested later, where all tumor cells have the ability to form
metastasis(179)
. Except for the spontaneous model, different hypotheses have been put forward to elucidate
the discrepancies observed in experiments concerning the presumed selective nature of the metastatic
phenotype(71,72,81,99,100,115,116,151)
.
The research concerning cancer stem cells allows us to speculate about a new model of metastatic process.
Since stem cells already possess the capability of self-renewal and differentiation, it is likely that cancer
stem cells arise from malignant mutation of normal stem cells rather than from differentiated cells within
the organ that undergoes de-differentiation and adapt a stem cell phenotype. Furthermore, normal stem cells
are the longest lived cell, thus believed to have a greater likelihood of accumulating mutations(90)
. Based on
the expression of estrogen receptor, Dontu proposed a stem cell model of mammary carcinogenesis, which
suggested that mutations occurring in differentiated progenitor cells might form a non-metastatic good
prognosis breast carcinoma, whereas mutations occurring in stem cells might lead to breast stem cell that
generates poor-prognosis tumors(56,178)
.
More and more evidence has shown that rather than developing alone, cancer cells interact with their
environment in tumorigenesis(11,19,134,156,159,166)
. It is likely that during tumor progression, there is a selection
of specific phenotypes in cells composing the tumor microenvironment that co-evolves with the primary
tumor(134)
. Carcinoma cells live in a complex microenvironment composed of the extracellular matrix
(ECM), diffusible growth factors and cytokines, and a variety of non-epithelial cell types, including
vasculature associated cells (endothelial cells, pericytes and smooth muscle cells), inflammatory cells

9
(lymphocytes, macrophages and mast cells), and fibroblasts(18)
. The structural scaffold in this
microenvironment is ECM, which is produced by stromal fibroblasts and epithelial cells. The ECM serves
as the support that separates fibroblasts and epithelial cells, and also the medium that delivers nutrients and
various signaling molecules(18,19)
. Under normal conditions, epithelial cells form intact, polymerized sheets,
and communicate with their neighboring cells through different types of cell junctions and with other types
of cells through signaling molecules. These communications between the epithelial cells themselves and the
fibroblasts and other types of cells create a dynamic equilibrium where the cells maintain a normal,
differentiated phenotype(19)
, and can even keep epithelial cells with oncogenic mutations at bay(51,65)
.
Carcinoma cells (believed to evolve from pre-cancerous epithelial cells that have acquired multiple genetic
mutations(174)
, however, can gradually break the equilibrium by releasing signals that induce angiogenesis,
ECM alteration, fibroblast proliferation and inflammatory cell recruitment(18)
. This cancer modified stroma
then creates a context that promotes tumor growth, immigration, and protects it from immune attack(19)
. It
has been suggested that tumor expansion and the progression to advanced stages of the disease requires the
co-evolution of both cancer cells and cancer stroma(156)
, as their association changes along with the
malignancy(19)
. For example inflammatory response associated with tissues wounding can produce tumors
or accelerate the development of epithelial cancers(11,19)
. In the activation of tumorigenesis, the ECM is
remodeled by mesenchymal cells such as myofibroblasts. This process is believed to promote carcinoma
progression through a variety of mechanisms(159, 166)
. The carcinoma-associated fibroblasts (CAFs) can
affect tumor progression in an autocrine or/and paracrine manner(18)
. CAFs express various growth factors,
cytokines and ECM proteins, and many of these factors and proteins are related to carcinogenesis(1,9,22,148,149)
.
CAFs can also induce epithelial-mesenchymal transition (EMT)(52,165)
, stimulate myrofibroblasts

10
generation(50)
, produce autocrine mitogens(27,93)
, suppress CD+8 T and NK cells
(67,77,167), promote distant
metastasis(63)
, and affect many other aspects in tumorigenesis(173)
. Karnoub in 2007 has shown that the
mesenchymal stem cells in CAFs could enhance breast cancer metastatic potential in a paracrine fashion(9)
.
Inflammation is another critical component of tumor progression. Tumor cells utilize some of the signaling
molecules from the innate immune system to provoke its growth and metastasis(45)
. Malignant cells can
dodge immune surveillance by reducing their own endogenous tumor antigen(13)
or by modulating the
inhibitory natural killer receptor function thus down-regulating the lytic activity of tumor-specific cytotoxic
T lymphocytes(19,73)
. Studies regarding squamous epithelial carcinoma(44,46)
, pancreatic carcinoma(17)
, and
mammary tumors(114)
have shown that inflammatory cells such as mast cells promote tumorigenesis by
inducing MMPs production(19,45,57,66)
. Matrix metalloproteinases (MMPs) are zinc-dependent
endopeptidases that break down the ECM, thereby promoting the invasion of metastatic cancer cells and
bone marrow derived cells into the tissue. The invasion of these cells is a key process to metastasis.
1.6 Cancer Stem Cells
A stem cell is characterized by its ability to self-renew and to give rise to different types of cells. As early as
1937, Furth has shown that a single tumor cell can initiate a tumor in a new recipient mouse(69)
. It has been
long documented that most tumors have a clonal (single cell) origin(58,59,120,128)
and contain cancer cells with
heterogeneous phenotypes(5,84)
. Though heterogeneity in tumors could arise from mutations during tumor
progression, the variable expression of normal differentiation markers by cancer cells suggests that this
heterogeneity might also come from aberrant differentiation(144)
. Moreover, many studies have shown that

11
only a small proportion of cancer cells in a tumor have the ability to proliferate in culture or give rise to
new tumors in mouse models(20,58,59,128,144)
. By injecting thymidine-3 H into mouse which bears well
differentiated squamous cell carcinoma, Pierce in 1971 showed that the radiolabel appeared first in
undifferentiated areas and differentiated area failed to form tumors in compatible hosts(137,138)
. Thus, it is
likely that there exist tumorigenic cancer cells which can indefinitely proliferate and produce
phenotypically diverse progeny cancer cells. These cancer cells undergo processes analogous to
self-renewal and differentiation of normal stem cells(144)
. Similar to the process in which normal stem cells
differentiate into phenotypically diverse progeny with limited proliferative potential, it is argued that cancer
stem cells undergo epigenetic changes, giving rise to phenotypically diverse nontumorigenic cancer cells
that compose the bulk of cells in a tumor(155)
. Recent work has also suggested that cancer stem cells (CSCs)
explains the tumor’s therapy resistance. CSCs isolated from tumors originating in the breast and other
tissues exhibit resistance to chemotherapy and radiation(96,136,
150)
.
From the early nineties, substantial evidence supports the existence of CSCs. Studies have shown that
cancer stem cells are rare(20,43,111)
. Many surface markers have been used to characterize cancer stem
cells( 3,48,74,129,145,159)
. In the studies that characterize CSCs, the cancer cells sorted by CSC markers could
initiate secondary tumors with small cell numbers. The transplanted tumors were able to reproduce at least
some of the heterogeneity of the original tumors(43)
. However, there are also a lot of caveats to the CSC
hypothesis. First of all, most of the studies to identify CSC are based on the difference of only two or three
surface markers. It has not been determined whether there is other heterogeneity presents in primary tumor
which has not been reproduced in transplanted tumors. Furthermore, some CSC markers such as CD34 and

12
CD38 are first extensively validated in the identification of normal hematopoietic stem cells, thus fitted the
identification of leukemia stem cells(20,111)
. These markers however, are not well characterized in most
tissues that develop tumors, and some of them for instance CD133 has been revealed to be widely expressed
in many organs(157)
. As a result, they may not be as effective in CSC characterization(142,155)
. In conclusion,
the cancer stem cell model has only been carefully tested on a small subset of tumors. There is still a lot of
work to be done to explore the CSC hypothesis. It seems that not all kinds of tumors would follow the
cancer stem cell model, or the character required to distinguish cancer stem cell in some tumors (such as
melanoma) has not been identified.
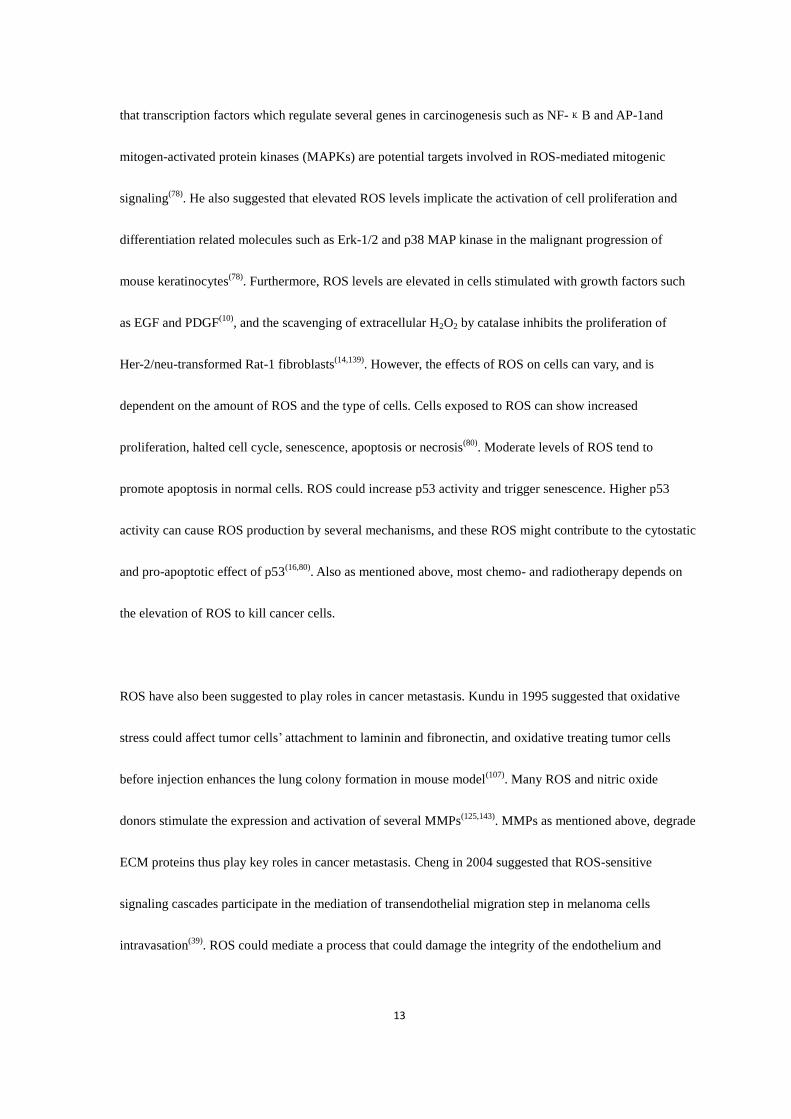
1.7 Oxidative Stress and Cancer Metastasis
As mentioned above, reactive oxygen species (ROS) and reactive nitrogen species (RNS) had been shown
to modulate many processes of cancer development(80,181)
. There are studies as early as 1984 showing that
exposing mouse fibroblasts to ROS leads to malignant transformation(179)
. Also, John in 2004 has found that
mtDNA mutations that affect mitochondrial functions and inhibit oxidative phosphorylation can increase
ROS, which later contributes to tumorigenicity in prostate cancer(187)
. ROS could cause structural alterations
in DNA, for example base pair mutations, rearrangements, deletions, insertions and sequence
amplification(80)
. This could be cancerogenic when the mutation leads to the inactivation or loss of the
second wild-type allele of a mutated proto-oncogene or tumor-suppressor gene(179,180)
. Moreover, ROS
could affect cytoplasmic and nuclear signal transduction pathways(29,30 ,152)
. Evidence suggests that
transformed cells use ROS signals to drive proliferation and other events required for tumor progression(135)
.
Low levels of ROS play an important role in normal cell proliferation(29)
. Gupta et al. in 1999 has suggested
13
that transcription factors which regulate several genes in carcinogenesis such as NF-κB and AP-1and
mitogen-activated protein kinases (MAPKs) are potential targets involved in ROS-mediated mitogenic
signaling(78)
. He also suggested that elevated ROS levels implicate the activation of cell proliferation and
differentiation related molecules such as Erk-1/2 and p38 MAP kinase in the malignant progression of
mouse keratinocytes(78)
. Furthermore, ROS levels are elevated in cells stimulated with growth factors such
as EGF and PDGF(10)
, and the scavenging of extracellular H2O2 by catalase inhibits the proliferation of
Her-2/neu-transformed Rat-1 fibroblasts(14,139)
. However, the effects of ROS on cells can vary, and is
dependent on the amount of ROS and the type of cells. Cells exposed to ROS can show increased
proliferation, halted cell cycle, senescence, apoptosis or necrosis(80)
. Moderate levels of ROS tend to
promote apoptosis in normal cells. ROS could increase p53 activity and trigger senescence. Higher p53
activity can cause ROS production by several mechanisms, and these ROS might contribute to the cytostatic
and pro-apoptotic effect of p53(16,80)
. Also as mentioned above, most chemo- and radiotherapy depends on
the elevation of ROS to kill cancer cells.
ROS have also been suggested to play roles in cancer metastasis. Kundu in 1995 suggested that oxidative
stress could affect tumor cells’ attachment to laminin and fibronectin, and oxidative treating tumor cells
before injection enhances the lung colony formation in mouse model(107)
. Many ROS and nitric oxide
donors stimulate the expression and activation of several MMPs(125,143)
. MMPs as mentioned above, degrade
ECM proteins thus play key roles in cancer metastasis. Cheng in 2004 suggested that ROS-sensitive
signaling cascades participate in the mediation of transendothelial migration step in melanoma cells
intravasation(39)
. ROS could mediate a process that could damage the integrity of the endothelium and
14
promote cancer cell invasion(172)
. Moreover, studies concerning lysyl oxidase (LOX) have shown that LOX
facilitates migration and cell-matrix adhesion formation in invasive breast cancer cells through a hydrogen
peroxide–mediated mechanism(133)
. Furthermore, ROS participate in many growth factor signal pathways
which stimulate proliferation, migration, and tube formation of endothelial cells(101,169)
. In a study
concerning the metastasis of cancer cells exposed to hepatic ischemia-reperfusion, ROS and RNS have been
shown to kill weakly metastasis cancer cells. This may help to select more metastatic cancer cells in those
invading through the tumor stroma and entering the oxygen rich circulatory system(94)
.
It is well known that a large amount of ROS are generated during reperfusion of post-ischemic tissue(203)
. As
a result, ROS are also present in a hypoxic solid tumor, especially in the intermittent hypoxia region. What’s
more, ROS levels could also be elevated when metastatic cancer cells are exposed to oxidative stress as
they migrated into the oxygen rich blood vasculature(6)
. Along with the HIF mentioned in section 1.3, ROS
are suggested to cooperate in cancerogenic transformation, cancer cell proliferation, angiogenesis, the
generation and maintenance of cancer stem cells and cancer cell metastasis.
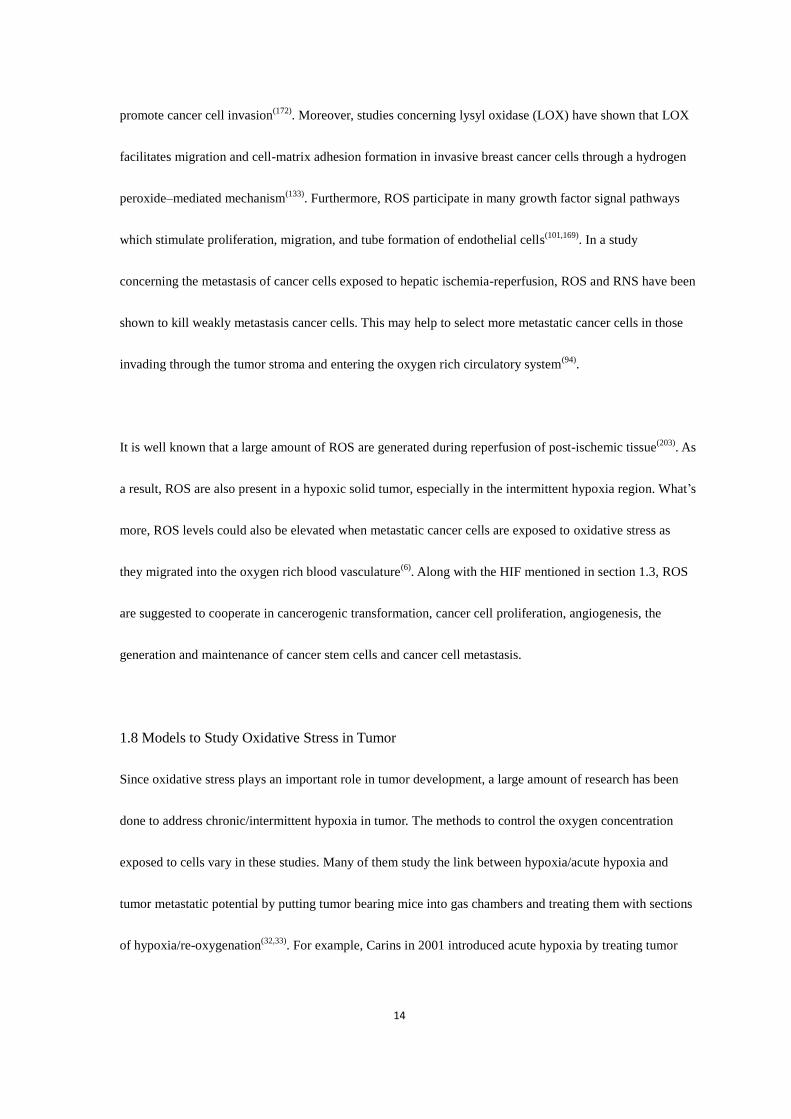
1.8 Models to Study Oxidative Stress in Tumor
Since oxidative stress plays an important role in tumor development, a large amount of research has been
done to address chronic/intermittent hypoxia in tumor. The methods to control the oxygen concentration
exposed to cells vary in these studies. Many of them study the link between hypoxia/acute hypoxia and
tumor metastatic potential by putting tumor bearing mice into gas chambers and treating them with sections
of hypoxia/re-oxygenation(32,33)
. For example, Carins in 2001 introduced acute hypoxia by treating tumor

15
bearing mice with 12 cycles of 10-minute exposure to 5–7% O2; balance N2/10 minute air once per day, 7
days per week(32)
. Though they have got significant results which suggest an increased number of
spontaneous microscopic metastases in the mice treated with acute hypoxia, it is arguable whether the
tumors in mice are exposed to the same periodic oxygen level changes as their hosts do. Also, hypoxia
would have systemic effects on the hosts, for example an overall rise in lactic acid levels, and these would
also affect the metastatic result. It is hard to sort this effect out of the effect on tumor cells. Other methods
that introduce oxygen level changes in vivo are based on cutting the blood supply of tumors. Parkins in
1995 studied ischemic/reperfusion injury on tumors by using a metal D clamp. The clamp tightens across
the skins surrounding the superficial tumor thus makes the tumor hypoxic(131)
. Toshikazu in 1994 infused a
transient embolic agent (degradable starch microspheres, DSMs) into tumor vessels to study the anti-tumor
effect of ischemic/reperfusion injury. The DSMs occluded the tumor vessels for 40 minutes(186)
. However, it
is hard to introduce cycling hypoxia with short period with these in vivo methods, and it is also hard to
know whether the hypoxic levels introduced by these methods are relevant to those observed in vivo.
Moreover, the clamp and embolism approach are not suitable to study cancer metastasis, for they disrupt the
important intravasation process. These in vivo approaches also fail to control hypoxia levels, periodicity and
spatial variation.
Except for the in vivo studies mentioned above, a lot of in vitro studies also involve the controlling of
oxygen content in atmospheres above cultured tumor cells. One traditional method is to put cells directly
into conventional gas variable incubators with atmosphere created by a certain gas mixture. This method is
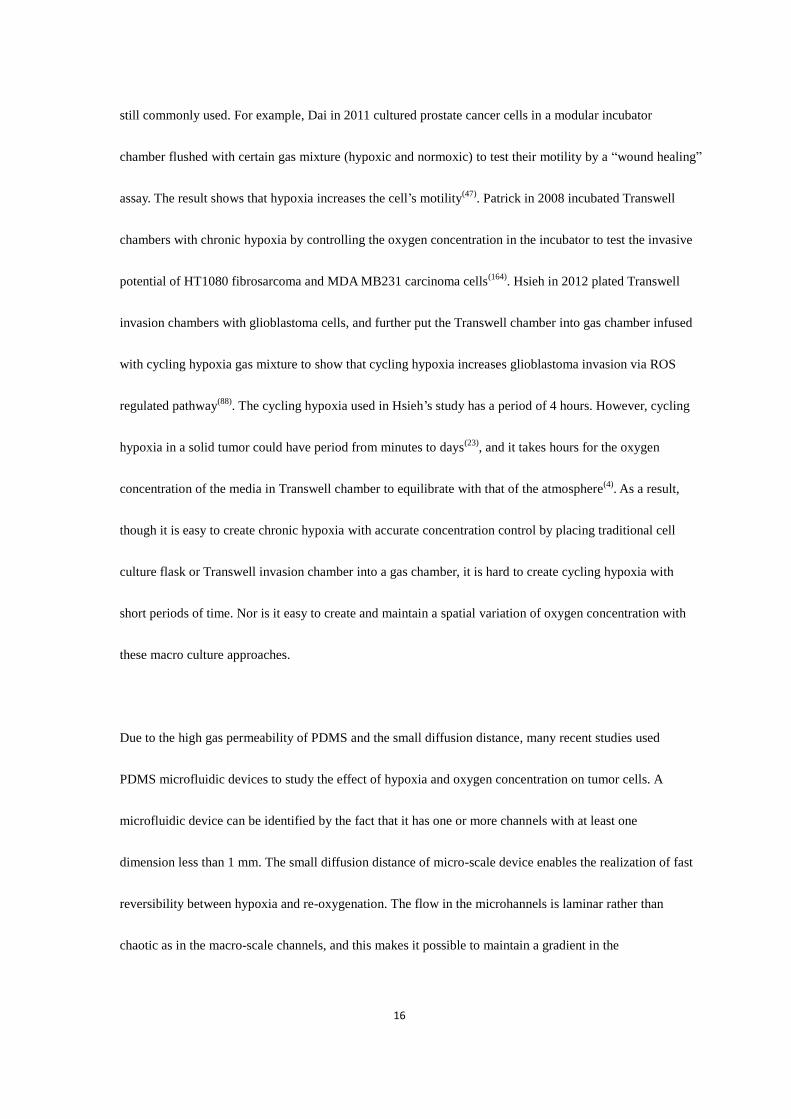
16
still commonly used. For example, Dai in 2011 cultured prostate cancer cells in a modular incubator
chamber flushed with certain gas mixture (hypoxic and normoxic) to test their motility by a “wound healing”
assay. The result shows that hypoxia increases the cell’s motility(47)
. Patrick in 2008 incubated Transwell
chambers with chronic hypoxia by controlling the oxygen concentration in the incubator to test the invasive
potential of HT1080 fibrosarcoma and MDA MB231 carcinoma cells(164)
. Hsieh in 2012 plated Transwell
invasion chambers with glioblastoma cells, and further put the Transwell chamber into gas chamber infused
with cycling hypoxia gas mixture to show that cycling hypoxia increases glioblastoma invasion via ROS
regulated pathway(88)
. The cycling hypoxia used in Hsieh’s study has a period of 4 hours. However, cycling
hypoxia in a solid tumor could have period from minutes to days(23)
, and it takes hours for the oxygen
concentration of the media in Transwell chamber to equilibrate with that of the atmosphere(4)
. As a result,
though it is easy to create chronic hypoxia with accurate concentration control by placing traditional cell
culture flask or Transwell invasion chamber into a gas chamber, it is hard to create cycling hypoxia with
short periods of time. Nor is it easy to create and maintain a spatial variation of oxygen concentration with
these macro culture approaches.
Due to the high gas permeability of PDMS and the small diffusion distance, many recent studies used
PDMS microfluidic devices to study the effect of hypoxia and oxygen concentration on tumor cells. A
microfluidic device can be identified by the fact that it has one or more channels with at least one
dimension less than 1 mm. The small diffusion distance of micro-scale device enables the realization of fast
reversibility between hypoxia and re-oxygenation. The flow in the microhannels is laminar rather than
chaotic as in the macro-scale channels, and this makes it possible to maintain a gradient in the

17
microchannels. Also, with PDMS device, it is possible to create an oxygen gradient over tens of microns
distance, which conventional gas variable incubators cannot(68)
. These spatial gradients are to be expected in
a tumor cell migrating into a blood vessel. For example, Oppegard in 2009 developed a microfabricated
insert to control oxygen tension temporally (in minutes) and spatially (in millimetres) in a well plate
commonly used for cell cultures(130). Raymond in 2009 controlled the oxygen gradient in
microchannels by controlling the gas mixture in the proximal gas channels. The oxygen molecule in
gas channels diffuses through PDMS membrane and equilibrates with the dissolved oxygen
concentration in the microchannels filled with media (Figure 1.2) (108)
. Joe in 2010 developed an open
well cell culture chamber with a PDMS substrate. This design allows the delivery of microgradients of
oxygen concentration without exposing cells to mechanical stresses or reducing culture volumes inside
microfluidic culture chambers(117)
. In conclusion, there are more and more in vitro hypoxia tumor
models developed with PDMS microfluidic device. These devices have the ability to introduce small
scale temporal and spatial control of oxygen concentration on cells, thus has advantages over the
traditional approaches such as conventional gas variable incubator.

18
Figure 1.2 Raymond’s device with oxygen diffusion layer. (a) Schematic diagram of microfluidic
oxygenator. The device consists of two PDMS layers (gas and medium) that contain molded microchannels.
The multiplexor and O2 gradient generator are contained in the gas layer, while the DO sensors are
contained in the medium channels. (b) Fabricated microfluidic oxygenator. (c) Micrograph of the
multiplexor and the oxygen concentration gradient generator; Figure is derived from Ref.108
1.9 Conventional and Microfluidic Cancer Cell Invasion Assay
As mentioned above, the PDMS microfluidic device enables us to create and maintain temporal and spatial
variation changes of oxygen concentration. The next thing to be done is to combine a micro-scale, PDMS
based invasion assay with the oxygen delivery part. Conventional cell migration assays consist of Boyden
chamber and the “wound healing” assay. The wound-healing assay is simple, inexpensive, and one of the

19
earliest developed methods to study directional cell migration in vitro(146)
. Basically, a wound healing assay
is first creating a “wound” in a cell monolayer, then monitoring how long it takes for the cells to close the
wound. This assay has been adapted into a microfluidic system. Huang in 2011designed a microfluidic
device which can partially digest a confluent cell sheet using parallel laminar flows in the presence of
protease trypsin to quantify the effect of ethanol on MCF-7 human breast cancer cells(91)
. Also, a similar
device has been used by Andries in 2010 to study endothelial cell migration(171)
. However, neither is the
wound healing assay a quantitative approach, nor is it suitable to mimic the process in which tumor cells
invade through the basement membrane.
The basement membrane is a thin continuous sheet which separates epithelial tissues from adjacent stroma
and forms barrier that blocks the passage of cells and macro molecules(2)
. Tumor cell invasion of basement
membranes is a crucial step in cancer metastasis(2)
. A type of Boyden chamber, a commercial product called
a Transwell invasion chamber, contains two medium-filled compartments separated by a microporous
membrane. Cells are placed in the upper compartment and are allowed to migrate through the porous
membrane to the lower compartment(38)
.By staining and counting the cells that have traversed
the membrane and grown on the lower surface, Transwell chambers can achieve a quantitative assessment
of cancer cell migration. Albin in 1987 coated the porous membrane with Matrigel as a mock basement
membrane to test the invasive potential of tumor cells(2)
. This design has been widely used to assess cell
aggressiveness, and the Matrigel coated Transwell chamber is also commercially available(38)
. However,
these Transwell chambers also have its drawbacks. Firstly, the counting step is laborious. Moreover, due to
the large surface area of the insert membrane, only a number of fields can be chosen from the whole insert

20
membrane area and counted. Since the cells placed on the upper surface of the insert membrane do not
spread uniformly, the cells traversing the pores and growing on the lower surface would also be
non-uniformly distributed. This non-homogeneity could bring errors to the counting
result(113,124,160)
.Furthermore, the cells which have traversed the insert membrane could detach from it into
the bottom of the well. These cells are mostly neglected during the counting step(160)
.
The idea of the Transwell chamber has been adapted into many microfluidic designs to study cancer
metastasis(37 ,42)
. Chung in 2009 developed a microfluidic platform to evaluate and quantify capillary growth
and endothelial cell migration. In this design, side channels connected to the main channels are blocked
with collagen, and the cells growing in the main channel migrate into these collagen scaffolds(42)
. Chaw in
2007 developed a microfluidic device with micro gaps connected to two micro-channels. Cells cultured in
one channel migrate through the capillary-like micro gaps to the other channel(37)
. Another similar device is
developed by Irimia in 2007. In this design two main channels are connected by many microchannels as
migration paths(92)
.The side channels and micro gaps of these designs are similar to the pores of the insert
membrane of Transwell chamber. Nevertheless, these microfluidic devices have advantages over Transwell
chamber. The cells in the transparent PDMS device can be accurately counted, thus the instability and
inaccuracy problem of Transwell chamber qualification is solved. Moreover, microfluidic device has many
advantages over macro culture device, for example the small requirement of samples, high throughput, low
cost, accurate environment control, versatility in design, and potential for parallel operation and for
integration with other miniaturized devices(158)
. Many microfluidic devices with other designs have also
been developed(40,177)
. For example, Cheng in 2007 developed a microfluidic device made with hydrogel.

21
This device allows cells migrate freely from the hydrogel based channels without the restriction of a pre-set
path(40)
.
1.10 Lactic Acid and Cancer Metastasis
Measurement of tumor pH reveals that the pH of tumor is about 0.5 lower than that of normal tissue(127)
.The
acidity in tumor has been suggested to be caused by the Warburg effect(127)
. A high rate of aerobic glycolysis
results in the production of large amounts of lactic acid compared to normal tissue(127)
. The Warburg effect
is defined by a shift in energy production from oxidative phosphorylation to glycolysis in tumor cells(70)
.
This effect has been suggested to be advantageous to tumor cells in its microenvironment and also a
fundamental property of tumor cells(70,102)
. However, a new model about tumor metabolism——“the reverse
Warburg effect”, has been put forward by Pavlides et al in 2009. Pavlides’ group suggested that epithelial
cancer cells induce Warburg effect in neighboring stromal fibroblast cells. The stromal cells secrete lactate
and pyruvate into the tumor stroma, then epithelial cancer cells take up this energy-rich metabolites and use
them in the mitochondrial TCA cycle, thereby promoting efficient energy production(132)
. Bonuccelli et al in
2010 showed that 3-hydroxy-butyrate (a ketone body of the end product of aerobic glycolysis) increases
tumor growth by ~2.5-fold(21)
.
Lactic acid has been suggested to be a key player in tumor metabolism(86)
. A recent study suggests that
lactic acid functions as an intrinsic inflammatory mediator that promote chronic inflammation in tumor
microenvironments(183)
. Also, the low pH in tumor microenvironment results in a reduction of cytotoxic
T-cell function, thus helps tumor to escape immune surveillance(64)
. Moreover, many studies suggest that

22
lactic acid could enhance tumor cell motility(21,75)
and triggers VEGF production by endothelial cells, thus
promoting angiogenesis(12)
. Also, clinical results show that the content of lactic acid is in negative
correlation with disease-free patient survival(176)
, and is in positive correlation with the incidence of
metastasis(175, 187)
.

23
Chapter 2. Long Term Cell Culture in PDMS Microfluidic Device and the Use of
Tygon○R Tubing in the Media Deliver System
Tygon tubing is commonly used as a liquid delivery component in microfluidic devices. In many
microfluidic designs, cells are seeded and later perfused with growth media through the same Tygon tubing.
However, this tubing could cause problems with cell viability. The experiments outlined in this chapter
show that cells trapped in this tubing can die from anoxia and release toxic factors into the perfusate.
Experiments were performed to determine if lactic acid that is produced by mammalian cells during
anaerobic respiration is produced in sufficient quantities in the anoxic cells in the Tygon tubing to have a
negative effect on cell growth. The results show that a 20 mM lactic acid leads to slower growth of
MDA-MB-231 cancer cells.
2.1 Introduction
Culturing cells in microfluidic systems enables us to more accurately control the environmental cues(4)
.
However, there are a lot of challenges for long-term cell culture in microfluidic devices. For example, the
geometry, the method of nutrient delivery, the avoidance of air bubbles, the control of flow rate, the
substrate treatment for cell attachment (if culturing attached cells), the prevention of media evaporation
etc.(2,4,7)
. Because microfluidic chambers only hold a small volume of media, the question of whether cells
could get enough nutrients between media replenishments should be considered in the design of
microfluidic device. Air bubbles can accumulate in long term cell culture and their surface tension makes
them stick to the inner surface of micro-scale channels. The presence of air bubbles not only blocks the
fluidic path and distorts the flow, but also can damage the cells at the liquid-gas interface(9)
. Furthermore,
24
the substrate commonly used in the fabrication of microfluidic devices is glass, which does not support cell
attachment without coating with serum or fibronectin.
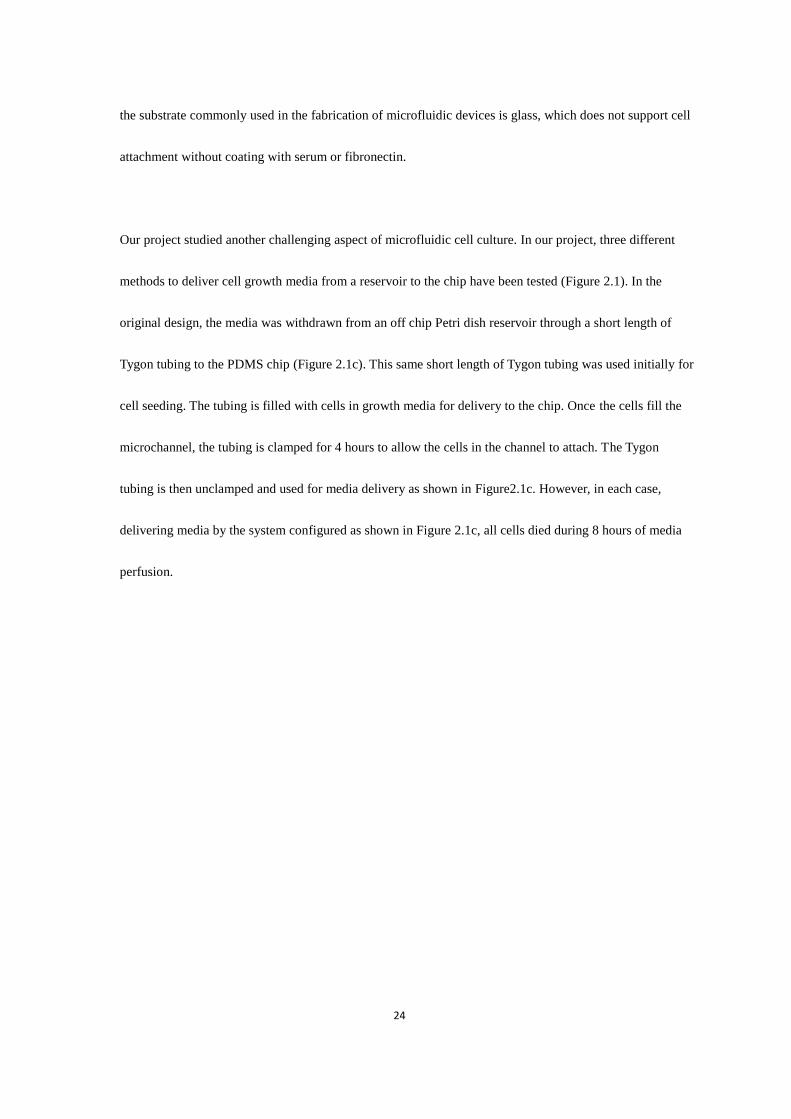
Our project studied another challenging aspect of microfluidic cell culture. In our project, three different
methods to deliver cell growth media from a reservoir to the chip have been tested (Figure 2.1). In the
original design, the media was withdrawn from an off chip Petri dish reservoir through a short length of
Tygon tubing to the PDMS chip (Figure 2.1c). This same short length of Tygon tubing was used initially for
cell seeding. The tubing is filled with cells in growth media for delivery to the chip. Once the cells fill the
microchannel, the tubing is clamped for 4 hours to allow the cells in the channel to attach. The Tygon
tubing is then unclamped and used for media delivery as shown in Figure2.1c. However, in each case,
delivering media by the system configured as shown in Figure 2.1c, all cells died during 8 hours of media
perfusion.

25
Several possibilities may explain the result. The first is that the flow rate is not suitable for the cells
growing in the micro channels. Culturing cells under flow, rather than in static culture dish brings in the
concept of shear stress. That some cells are exposed to shear stress in vivo due to blood flow could be
important to the tissue development. For example, during embryonic development, the embryonic stem
cells (ES) are exposed to shear flow from the tissue fluid or blood caused by the beating heart(8)
. Studies
have shown that fluid stress could induce Flk-1-positive embryonic stem cells differentiation into vascular
Figure 2.1 Diagram of three different cell growth media delivery systems. (a): on-top design, reservoir
was made of PDMS cylinder which set on top of the channel inlet; (b): on-chip design, a hole was cut
into the PDMS for use as a media reservoir; (c): off-chip design, media was stored in the Petri dish and
delivered through a short length of Tygon tubing. The clamp was closed for 4 hours for cells in the chip
to attach, while the remaining cells used for seeding are trapped in the Tygon tubing.

26
endothelial cells in vitro(8)
. However, under microfluidic dynamic cell culture, the choice of flow rate is not
straightforward. On the one hand, microfluidic devices have significantly higher cell surface area to volume
ratios than those traditional culture devices. This means that the nutrients in media would be depleted
rapidly and the waste products would accumulate(7)
. The solution to this problem is to increase flow rate.
On the other hand, a fast flow rate could increase the shear stress to a higher level than cells could tolerate.
The shear stress in a microfluidic channel could be estimated by equation 2.1 (2)
:
τ =6𝑞𝜇
𝜔ℎ2 2.1
In whichτis the shear stress, q is the volumetric flow rate, μis the viscosity of cell culture media, ωis
the channel width, ℎ is the channel height. Given the viscosity is 7.987 × 10⁻⁴𝑃𝑎 ∙ 𝑠 (adapted from ref.
2), the channel width is 400 μm, the channel height is 50 μm, with a flow rate of 1 μL/min gives a shear
stress of τ = 0.7987 𝑑𝑦𝑛𝑒 𝑐𝑚2⁄ . According to previous studies most cells are viable up to a shear stress of
1 dyne/cm2 (4, 5)
. The flow rate used in microfluidic cell culture should be above the threshold that the cells
get enough nutrients and below the threshold that the cells can tolerate the shear stress (Figure 2.2).

27
Figure 2.2 The effect of flow rate on cell culture within a microfluidic system (derived from Ref.5)
Different flow rates were evaluated ranging from 0.03 μl/min to 1 μL/min in the off-chip design (Figure
2.1c). But with each flow rate, the cells still die during 8 hours of perfusion. However, cells could be
successfully cultured using the configuration shown in Figure 2.1a and Figure2.1b. The biggest difference
between the designs shown in Figure 2.1a and Figure 2.1b and that of Figure 2.1c is the elimination of the
need for Tygon tubing to deliver cell culture media. As the calculation shows, shear stress is not likely a
problem for the flow-rate we use. Alternatively, if shear is not a problem, another hypothesis is that the
tubing used to deliver the media is toxic to the cells. Tygon tubing is commonly used in microfluidic cell
culture system and is considered biocompatible. However, the Tygon tubing has a low permeability to
oxygen, so it is possible that in the 4~6 hours static period when downstream cells attach to the substrate
within the device, cells trapped in the tubing can die from anoxia and release toxic components into the
surrounding media. This media containing potentially toxic components from dead cells, will be referred as
“dead cell conditioned media”.
28
Experiments described below confirm the negative effect of the “dead cell conditioned media” on cells
downstream in the microfluidic channel. A possible cytotoxic component of the dead cell conditioned media
is lactic acid. Mammalian cells produce large amount of lactic acid during anaerobic respiration. Moreover,
cancer cells are unique that under aerobic or anaerobic conditions, cancer cells predominantly produce
energy by a high rate of glycolysis resulting in production of high levels of lactic acid in the cytosol(10)
. A
hypothesis is that during the 4 hours’ static period that is used to allow cells to attach to the substrate, the
cells in the Tygon tubing produce a high level of lactic acid. Once perfusion is restarted, this high level of
lactic acid is toxic to the cells in channel. Studies on cell micro-culture have shown that lactic acid
accumulates quickly in a micro well to a level of 10 mM after a 48 hours culture(7)
. Thus, it is likely that the
lactic acid concentration is high in the tubing where media volume is very small. Studies on the effect of
lactate on malignant cells shows that a level of 20 mM lactate increases cell invasion in a Transwell
chamber assay(3)
. Yet no negative effect of lactate on cell growth has been published.
2.2 Materials and Methods
Device fabrication
The PDMS microfluidic devices used in these experiments consisted of a single 50 μm high, 400 μm
wide rectangular channel. The device was fabricated by standard soft-lithography techniques with an SU8
photoresist silicon master. The PDMS microfluidic device was sterilized by a 24 hours soak in 70% ethanol
followed by a 24 hours soak in DI water, to remove the uncured PDMS oligomers. After oven drying, the
PDMS device was plasma bonded to a clean glass slide. More details about the fabrication process can be
found in Chapter 3.

29
Three designs were tested to deliver growth media to cells growing in the microchannel. One connected the
PDMS channel to a 30mm Petri dish as media reservoir with Tygon tubing (off-chip design, Figure 2.3c).
Another design used a media reservoir fabricated by cutting a hole with a cylindrical punch at one end of
the channel on PDMS (on-chip design, Figure 2.3b). This reservoir held about 300 μL volume. The last
was bonding a hollow PDMS cylinder on top of the channel inlet as media reservoir, which held about 1 ml
volume (on-top design, Figure 2.3a).
Cell seeding and cell culture
MDA-MB-231 human breast cancer cells were used to test the effect of dead cell conditioned media and
lactic acid containing media on cell growth. Cells were cultured in T75 flasks in DMEM + 10% FBS cell
culture media until they had grown to 70% confluency before use. Cells were harvested by trypsin from the
T75 flask, counted and seeding media was prepared with a density of approximately 1 million cells per
milliliter. The glass substrate of all the devices used was incubated with serum containing growth media for
24 hours prior to cell seeding to enhance the cell attachment. For the off-chip device (Figure 2.3c), cells
were seeded by gravity through the Tygon tubing from the outlet (syringe pump side, downstream, Figure
2.3c) to the inlet (reservoir side, upstream, Figure 2.3c). When cells came out of the upstream Tygon tubing
into the Petri dish reservoir, the Tygon tubing was clamped at both upstream and downstream section to
stop the flow and allow the cells in the microchannel to attach. Fresh cell culture media was replenished to
the Petri dish reservoir. For the on-chip and on-top design (Figure 2.3b, Figure 2.3a), seeding media was
added into reservoir. Cells flowed from reservoir to the outlet Tygon tubing by gravity. The downstream

30
Tygon tubing was clamped to stop seeding and let the cells attach. Fresh cell culture media was replenished
to the reservoir after the remaining cells in it were washed off.
For all the designs the clamp remained closed for 4 hours to let the cells attach in a 37℃ incubator after
cell loading. After 4 hours, the clamp was open, the downstream tubing was connected to a media filled
syringe via a tubing connecter made form a syringe tip, and the media was drawn from the reservoir by a
withdrawing syringe pump at a speed of 0.05μL/min. All devices were placed in a large Petri dish covered,
and kept in a 37℃ incubator. PBS was poured into the Petri dish to prevent evaporation. For the on chip
and on-top devices, the media in reservoir was replenished twice a day. Cell numbers were counted twice a
day by microscopic examination of the microchannels.

31
Dead cell conditioned media and Lactic acid/lactate media
A large volume of dead cell conditioned media was prepared by filling a long length of Tygon tubing with
cell seeding media (approximately 2 ml). The Tygon tubing was clamped at both ends and put into
incubator for 6 hours. After 6 hours the media was collected into a 15 ml conical tube by pushing air into
one end of the tubing with a syringe. The media was diluted with fresh cell culture media at a ratio of 1:1 to
Figure 2.3 Diagram of three different microfluidic cell culture systems; (a) on-top design, media was stored
in the reservoir made from PDMS cylinder bonded on top of the channel inlet. Cells were introduced from
the reservoir to outlet tubing during the cell seeding process, and the clamp was closed for 4 hours to allow
cells to attach. (b) on-chip design, media was stored in the reservoir made by cutting a hole in the PDMS
chip. The cell seeding process is similar to that of the on-top design. (c) off-chip design, media was stored in
the reservoir made from the Petri dish. Cells were introduced from downstream Tygon tubing to the
upstream Tygon tubing. Both clamps were closed during the cell attachment process.

32
exclude the effect of nutrient depletion. The diluted media was centrifuged for 5 minutes to remove any
remaining live cells, dead cells and cell debris. A small volume of uncentrifuged media was mixed with 3
ml cell culture media in a 30 mm Petri dish, which was put in the incubator to test the viability of any
collected cells. As a control, normal culture media was diluted with PBS at a ratio of 1:1 to compare with
the diluted dead cell media.
To explore the possible cytotoxic factors in dead cell conditioned media, 20 mM lactic acid in normal cell
culture media were used to study its effect on cell growth. To test whether the effect of lactic acid on cell
growth came from lactate or its acidity, sodium hydroxide solution was used to adjust the pH of 20 mM
lactic acid culture media to 7.8, whereas the unadjusted 20 mM lactic acid has a pH of 6.59. The adjusted
lactic acid media was also used in comparison with original 20 mM lactic acid culture media. Lactic acid
media was made by dissolving L-lactic acid (SigmaTM
) powder in normal cell growth media. The media
was sterilized by a syringe filter.
MDA-MB-231 cells test for dead cell conditioned media
Three on-top devices were used for each group. Normal media was 1:1 diluted with PBS (PM) as a control.
Dead cell conditioned media (DM) was used to see its effect on the growth of MDA-MB-231 cells. Both
PM and DM were introduced into the device once the cells were attached and after the perfusion started.
Cell numbers were counted once a day.

33
The effect of acidity
On top designed devices and MDA-MB-231 cells were used to test the effect of acidity. 20 mM lactic acid
media (pH=6.95) and pH adjusted lactate media (pH=7.8) was used. Normal media was used as control.
2.3 Results
Cell growth in on-chip on-top and off-chip designed device
The growth of MDA-MB-231 cells in on-top, on-chip and off-chip designed device is studied. Each device
design has three replications. The cell number in each device is shown in Figure 2.4. The result shows that
most of the cells growing in the off-chip devices die within 10 hours of media perfusion, while cells
growing in on-chip and on-top designed device survived the three day culture period.
Figure 2.4 MDA-MB-231 cells cultured in off-chip, on-chip and on-top devices. Most of the cells in the
off-chip device die within the first 10 hours of media perfusion.

34
MDA-MB-231 cells test for dead cell conditioned media
PBS diluted media, PM, was used to test whether that if the effect of dead media on cell growth is caused
by nutrient depletion. The on-top device with PM shows that MDA-MB-231 cells grow well in this
half-diluted media, and the growth rate of cells cultured with PM has no significant difference from the
growth rate of those grow in normal media (Figure 2.5, Figure 2.6). However, the cells cultured in DM
hardly grow, and begin to die quickly after 40 hours of media perfusion (Figure 2.5). A Student’s t-test
shows that the growth rate of cells cultured in DM is significantly different form the growth rate of those
cultured in NM and PM (Figure 2.6). At the end of this experiment, the pictures of cells cultured in DM and
cells cultured in PM were taken with the microscope camera. Most of the cells left in DM are round. Some
of them have a huge amount of black dots in cytoplasm. Also, the enlarged nuclei of these cells are
characteristic of cells undergoing apoptosis (Figure 2.7).

35
Figure 2.5 MDA-MB-231 cells cultured in PM and DM. The cells cultured with PM grow well in the
microchannels, while cells cultured in DM grow very slowly at the first 40 hours media perfusion and start
to die after that. PM: PBS diluted media; DM: dead cell conditioned media.

36
Figure 2.6 The growth rate of MDA-MB-231 cells cultured in NM, PM and DM. There is no significant
difference between NM and PM cultured cells. The growth of cells cultured in DM is significantly slower
than those cultured in NM and PM. NM: normal media; PM: PBS diluted media; DM: dead cell conditioned
media.*:p<0.05; **p<0.01
37
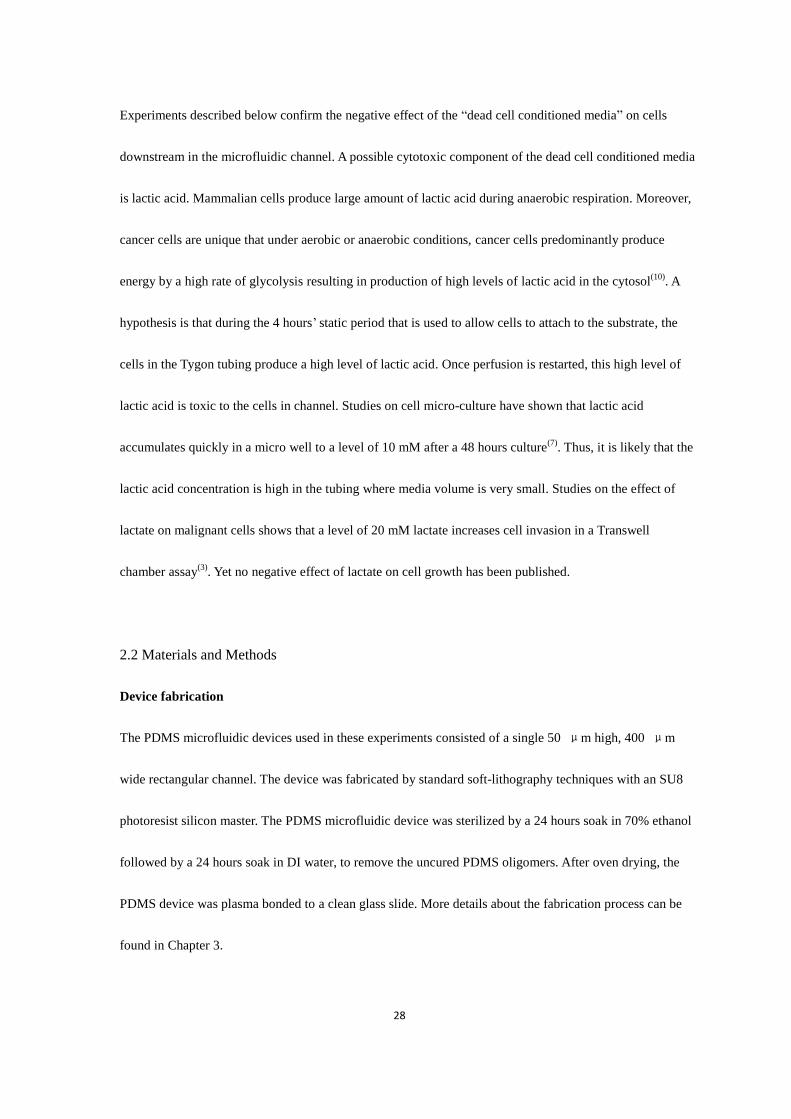
Figure 2.7 MDA-MB-231 cells cultured in PM (C,D) and DM (A,B) The cells cultured in DM are either
round or with a morphology similar to cells undergoing apoptosis. The nuclei of cells cultured in DM are
enlarged, and there are black dots accumulated in the cytoplasm (A,B).Pictures were taken at the fourth day
of media perfusion.
The effect of lactic acid on the growth of MDA-MB-231 cells
The effect of 20 mM lactic acid on MDA-MB-231 cells growth was tested with on-top designed device
(Figure 2.8, Figure 2.9). Four devices of normal media and six devices of lactic acid media were used. An
unpaired t-test shows that the growth rate of cells cultured in lactic acid media is significant less than the
growth rate of cells cultured in normal media were statistically different (p = 6.19 × 10⁻⁶). An ANOVA
test also shows the growth rate of cells growing in lactic acid media and cells growing in normal media is
different (p = 7.37 × 10⁻⁶). The growth rate was derived by linear fitting the slope of cell growth curve in

38
Excel. The cell growth curve was derived by the natural logarithm of cell number over time (Figure 2.8).
Cells were counted and fed once a day. It can also be observed that the cells grown in lactic acid media
grow slower after 60 hours perfusion, especially in the rear section of the channel (Figure 2.8). It is possible
that the cells in the channel produce waste that further affects their growth.
Figure 2.8 Growth rate of MDA-MB-231 cells with normal and lactic acid media. Y axis is derived by the
natural logarithm of the cell number.
4
4.5
5
5.5
6
6.5
7
7.5
8
8.5
0 20 40 60 80 100 120
ln (
cell
nu
mb
er)
hours after perfusion
NM
LA

39
Figure 2.9 Comparison of growth rate of MDA-MB-231 cells in NM and LA. The result shows that
MDA-MB-231 cells grow faster in NM. NM: normal media; LA: lactic acid media; p<0.01
2.4 Discussion
The negative effect of dead media on cell growth suggests that in micro-scale cell culture, the method used
to deliver media is important, especially in the design where the media is delivered from an off-chip
reservoir to the cell culture device through Tygon tubing. Since switching tubing could introduce air
bubbles which are destructive to cells in the channel, most of the procedures should avoid disconnecting
and reconnecting tubing into the device after the channels are filled with media. Air bubbles in
microchannels are fatal to cells because the liquid-air interface could rupture cells when they flow through
the channel. However, the cell seeding method we use for the off-chip devices leads to a large amount of
cells trapped in the Tygon tubing used for media delivery (i.e. the upstream Tygon tubing shown in Figure
2.3c). Our results show that these cells trapped in the media delivery tubing cause a negative effect on the
viability of the cells in the microchannel. Another explanation, such as the formation of air bubbles in the

40
media delivery Tygon tubing when the temperature changes from room temperature to the temperature in
the incubator, could also explain the cell death in the microchannel of off-chip designed device after
perfusion started. However, these air bubbles are seldom observed in the off-chip devices. Due to the
difficulty in accurately controlling the amount of cells that are seeding into the device by gravity, it is hard
to eliminate the cells trapped in the media delivery Tygon tubing in these off-chip devices. As a result,
on-chip and on-top devices are preferred, because these two designs link the media reservoir directly to the
cell culture microchannel. MDA-MB-231 cells could be successfully cultured in on-top designed and
on-chip designed devices.
“Dead cell conditioned media” is made with Tygon tubing to prove the hypothesis mentioned above. The
results show that dead cell conditioned media also has a negative effect on the viability if cells on-top and
on-chip devices when this media is placed in these reservoirs. The reason that the dead cell conditioned
media is fatal to downstream cells is not fully explored. There is the likelihood that cells may release some
pro-apoptosis signal and/or digestive enzymes during apoptosis/necrosis. It is also likely that cells produce
a huge amount of aerobic metabolic waste before dying from oxygen depletion, increasing the media acidity
and producing an adverse environment for downstream cells. Interestingly, it is believed that aerobic
respiration waste seems to have a positive effect on cancer cells. Previous studies have shown that lactate
could increase epithelial cancer cell migration and promote a cancer stem cell phenotype(1)
, which indicates
poor clinical outcomes(1,3)
. Though lactate has not been found to promote tumor growth, 3-hydroxy-butyrate
(a ketone body) which is also an end product of aerobic glycolysis, significantly promotes tumor growth in
vivo due to the “reverse Warburg effect”(1,3,6)
. Our studies show that lactate/lactic acid has a negative effect

41
on tumor growth, but not as severe as dead cell conditioned media. However, it is not necessarily
contradictory to previous results suggesting aerobic metabolism waste boosts tumor growth(3)
, since
different culture methods are used and different molecules are tested. The effect of lactic acid’s acidity is
hard to test, because lactic acid induced pH changes in the media will be buffered by the carbon dioxide in
the incubator. In 15 minutes the color of lactic acid media turns from yellow to light pink, indicating a rise
in pH. As a result, it is hard to test the effect of acidity of lactic acid in our PDMS microfluidic device under
carbon dioxide atmospheres. The comparison of growth rate between cells grown in lactic acid media and
pH adjusted lactic acid media shows no significant difference. In conclusion, cell death observed in off-chip
designed device has been confirmed. What needs to be further studied is the substance in the dead cell
conditioned media that causes cell death in the microchannels.

42
Chapter 3. A Tumor-on-a-Chip for Studying Oxygen Gradient Induced Breast
Cancer Cell Metastasis
The first chapter discussed the role of hypoxia in cancer metastasis. Cancer cells cultured in a low oxygen
atmosphere which models hypoxic regions of tumors often show increased metastatic potential. In this
chapter, the design of a tumor-on-a-chip PDMS device is described. In this design, a gas channel layer sits
directly above a cell channel layer. The gas channel layer enables the control of oxygen level and the
creation of spatial heterogeneity of oxygen concentration in the media of the cell channel layer. The cell
channel layer functions as an invasion assay with cells trespassing Matrigel blocked, capillary sized
invasion channels. The oxygen gradient created by our device is experienced by a metastasizing cancer cell
as it migrates from the hypoxic tumor channel into the oxygen-rich vasculature channel. With an on top
reservoir sits on the device, the media is withdrawn through the cell culture channel, and is replenished each
day. Ideally, the cells can be cultured for as long as necessary. MCF7-0 and MDA-MB-231 cancer cells
have been cultured in the device in order to determine the effect of oxygen content and an oxygen gradient
on cell metastasis.
3.1 Introduction
As introduced in Chapter 1, solid tumors often contain regions of hypoxia with pO2 less than 10 mmHg(7,20)
.
Moreover, the chaotic blood vessel structure in tumors creates a fluctuation of oxygen level between
moderate hypoxia to nearly anoxia, with cycling periods from minutes to days(2,13)
. More and more studies
have suggested that hypoxia and hypoxia/re-oxygenation are related to aggressive behavior and therapy
resistance, and promote a cancer stem like phenotype(8,11,17,19)
. Since the study of hypoxia is important to

43
fully understand the cancer metastasic process, extensive research has been done concerning the effect of
hypoxia on cancer cell aggressiveness. Many of these in vitro studies involve the use of Boyden chambers
or Transwell○R chambers placed in a hypoxic or normoxic conditions(6,9,18)
, and in vivo studies involve
tumor clamping, transit embolization or directly putting tumor-bearing mice in hypoxia/re-oxygenation
cycles(3,15,22)
. However, for different reasons, these studies cannot accurately control the oxygen level
experienced by the tumor cells. It takes hours for the oxygen level in the media of Boyden chambers to
equilibrate to that of the atmosphere. This means that such a method is not able to reproduce the periodic
changes characteristic of cycling hypoxia, which has cycles ranging from minutes to hours to days(7)
.
Boyden and Transwell chambers also are unable to model the transition from low to high oxygen level
experienced when a cell leaves the hypoxia environment tumor environment and intravasates into the
oxygen-rich circulatory system (Figure 3.1). The oxygen-rich circulatory system has been shown to be
cytotoxic to ‘weakly metastatic’ cells(10)
.
To better mimic the oxygen level experienced by cancer cells in a solid tumor, a double layer PDMS
microfluidic device was designed (Figure 3.2 C, D). The tumor-on-a-chip is based on a previously
published design which studied cancer cell metastasis thorough blood capillaries(4,5)
. The tumor-on-a-chip
device adapted this design with capillary-sized, Matrigel-blocked perpendicular migration channels joining
two cell channels. The cell channels and the migration channels on the bottom cell channel layer function as
an invasion assay allowing cancer cells to migrate through an extracellular matrix. The Matrigel blocked, 10
micron sized migration channels resemble the Matrigel coated porous insert of a

44
Figure 3.1 Invasion/migration assays in a classic Transwell chamber are performed under non-varying pO2.
Figure 3.2 Overview of the Tumor-on-a-chip. A: A cancer cell experiences three regions of changing pO2
upon migrating from the tumor and penetrating the circulatory system. B: A sketch of the time dependence
of the change in pO2 across these regions. C: A top view of the device showing migration of cells from low
to high oxygen regions. D: A cross section of the tumor-on-a-chip that can mimic these changes in pO2
across these regions.
Transwell chamber(24)
(Figure 3.1, Figure 3.2C). However, our device has the advantages over the Transwell
chamber in that the number of all the cells in the channel could be accurately counted, whereas the
Transwell chamber are difficult to qualify(25,26,27)
. For example, only individual fields could be counted in a

45
single Transwell chamber. This could lead to erroneous result, if the cells are not spread uniformly(26)
.
Moreover, the cells which have traversed the pores and then detached the filter of the Transwell chamber
are often neglected(26)
. Finally, an oxygen gradient cannot be achieved with a Transwell chamber assay.
The high gas permeability of PDMS and the micron scale distance between cells and gas sources achieved
by multilayer lithography techniques enables rapid gas diffusion, thus creating and maintaining the desired
oxygen landscape across the cell culture channels(1,12,14,16)
. This difference in pO2 resembles that
experienced by metastatic cancer cell when it migrates from the hypoxic tumor into the oxygen-rich
vasculature (Figure 3.2). With these two characteristics put together, the tumor-on-a-chip device provides us
an innovative, promising method to delineate the mechanism of cancer metastasis under hypoxia, boosting
the emerging research of tissue-on-a-chip(23)
. Both of the effect of chronic hypoxia and intermittent hypoxia
could be studied with this tumor-on-a-chip device. The metastatic cells which invade through the migration
channels could be collected. Then the cell’s response to hypoxia and oxidative stress, for example the
expression of HIF-1α, osteopontin, VEGF and MMP1 markers could be analyzed.
3.2 Materials and Methods
Device fabrication
The tumor-on-a-chip device was fabricated with standard soft-lithography techniques. The master for each
channel was fabricated by spin coating SU8 photoresist on to a silicon wafer. The air channel master
required only a single coating and a single UV exposure, while the cell and migration channels demanded a
second coating on top of the first developed migration channel layer (Figure 3.3, Figure 3.4).

46
In fabrication of the cell channel master, the migration channel patterns were fabricated first. The first step
was to spin coat SU8 3010 on to a clean silicon wafer at a speed of 3000 rpm for 30 seconds with a spin
coater. This yielded a 10 microns layer of SU8 on the silicon wafer (Figure 3.3A). After the spin coating,
the wafer needed to be pre-expose baked. The wafer was first baked at 65℃ for 5 minutes on a hotplate to
flatten the SU8 and then transferred to 95℃ hotplate to bake for another 15 minutes to volatilize the
solvent in the SU8. All the baking should be conducted in a vent hood and with a cover on the hotplate. The
following step was UV exposure, where the SU8 was exposed to UV light, crosslinking and forming the
patterns we need to fabricate the PDMS device (Figure 3.3B). The pre-expose baked wafer was then
covered by the migration channel mask, which blocked UV light except at the patterns channels. The
exposure time was 50 seconds. A UV filter was put on top of the wafer and the mask to filter out unwanted
wavelengths. The next step was post-expose bake, where the solvent was further volatilized from the SU8
and the adhesion between patterns and wafers was strengthened. The post-expose bake required 2 minutes
at 65℃ and 15 minutes at 95℃. The wafer was left on the hotplate which had been turned off after
post-expose baking until fully cooled. Then the wafer was gently submerged into SU8 developer for 5
minutes without swirling the dish to develop (Figure 3.3C). The developer dissolves the uncrosslinked SU8
on the wafer, only the crosslinked patterns were left. The developed master was hard baked by covered
baking on a 150 ℃ hotplate for 40 minutes to harden the patterns. The master was then left on the hotplate
which had been turned off to gradually cool down to room temperature to prevent heat shock that can
separate the patterns and wafer.

47
The cell channel patterns were built on top of the migration channel patterns. The wafer with migration
channels pre-made was again spun coat with a 50 microns layer SU8, by spin coating SU8 2050 at 3000
rpm for 30 seconds with spin coater (Figure 3.3D). This was followed by pre-expose bake at 65℃ for 3
minutes followed by 95℃ for 10 minutes. Then, a cell channel mask was put on top of the wafer and
aligned with the migration channel patterns. The alignment was done by firstly taping the wafer on top of a
hard paper board. The cell channel mask was then taped on to the same paper board on top of the wafer,
with the alignment squares of the mask and of the patterns on the wafer co-registered (Figure 3.4). The
alignment was checked by microscopic examination. If the alignment was unacceptable, the alignment step
was repeated, until the migration channels patterns were aligned with the cell channels patterns on the mask.
After alignment, the SU8 on the master was exposed with UV light for 35 seconds, with UV filter on top
(Figure 3.3E). The development step is followed by the post-expose bake step, at 65℃ for 3 minutes and
95℃ for 10 minutes. The post-expose baked and then cooled master was submerged in SU8 developer for
7 minutes, the developer dish is gently swirled during the development to help dissolve the uncrosslinked
SU8 (Figure 3.3F). The last step is the hard bake, at 150℃ for 40 minutes. After fabrication, the cell
channel master was silanized by Trichloro(ctyl)silane to facilitate the release of PDMS in the following
steps.
The gas channel master was fabricated with similar process, except it only required a single spin coating
and a single UV exposure. Briefly, a layer of 100 microns SU8 was spun coat on top of a clean master wafer
with spin coating SU8 2050 at 1720rpm for 30 seconds in spin coater. The pre-expose bake was at 65℃ for
5 minutes and at 95℃ for 20 minutes. The exposure time was 40 seconds with mask and UV filter on top

48
of the master. The post-expose bake was at 65℃ for 5 minutes and at 95℃ for 10 minutes. The
development was conducted after the master was cooled after baking, by submerging the master in the SU8
developer for 10 minutes with gently swirling of the developer dish. At last, the gas channel master
fabrication was finished by hard baking at 150℃ for 40 minutes and then cooling down slowly.
A. Spin coating 1
B. UV exposure
C. Develop 1
D. Spin coating 2
E. UV exposure
F. Develop 2
Figure 3.3 Cell channel master fabrication diagram for tumor-on-a-chip; Cell channel pattern was
stacked on top of the migration channel pattern, by a second spin coating of SU8 photoresist

49
Figure 3.4 Diagram of the gas channel master and cell channel master. The red arrows show the locations of
the alignment squares. The alignment squares were used in aligning the cell channel mask and migration
channel patterns during cell channel master fabrication, as well as in aligning the gas channel PDMS chip
and cell channel PDMS layer.
PDMS silicone elastomer was mixed with curing agent in a 10:1 ratio. The mixing was done with a plastic
fork and continued for 5 minutes to ensure a complete mix. After mixing, the uncured, pre-mixed PDMS
was put into a desiccator to get rid of the air bubbles trapped in PDMS by vacuum. An gas channel layer
was fabricated by pouring 27.5 grams uncured, pre-mixed PDMS on to an aluminum foil disk containing air
channel master (Figure 3.4) and then baking on a hotplate at 90℃ for 1 hour. The finished gas channel
layer was drilled with six holes at the alignment squares (As the alignment squares in Figure 3.4) to help the
gas diffusion in the following binding step. The cell channel layer was made by spin coating uncured,
pre-mixed PDMS on to cell channel master at 890 rpm for 1 minute to get a desired thickness of 100
microns. The PDMS was left in room temperature for 10 minutes to flatten out the uncured PDMS, then
baked at 90℃ for 1 hour (Figure 3.5A,B).

50
The bonding of the gas channel layer to the cell channel layer was performed by a “stamping technique”.
Uncured PDMS was spun coat on a clean silicon wafer at 3000 rpm for 30 seconds to yield an ultrathin
layer of approximately 25 microns (Figure 3.5C). The gas channel layer was stamped on top of this uncured
PDMS, and then placed on top of cell channel layer (Figure 3.5D). The uncured, stamped PDMS on the
bottom of the gas channel layer serves as a glue to bind the gas channel layer to the cell channel layer
(Figure 3.5E). The position of the gas channel layer was corrected by aligning the alignment squares
designed on both layers (As in Figure 3.4). After removing the air bubbles trapped between these two layers
via vacuum, the two layers were baked at 90℃ for 1 hour to finish bonding (Figure 3.5F). Due to the
thinness of the cell channel layer and the glue binding layer, uncured PDMS was poured around the bonded
device, baked at 90 ℃ for 1 hour to help the release of the device from the master. The finished device was
soaked in 70% ethanol for 24 hours followed by in DI water for 24 hours to remove the uncured PDMS
oligomer. The cleaned device was dried by baking in oven at 80℃ for 2 hours, then bonded to clean glass
slide by plasma treatment.

51
Figure 3.5 Tumor-on-a-chip fabrication diagrams. The gas channel layer was stamped (D,E) on the ultrathin
PDMS layer as glue, and then bonded to cured cell channel layer.
Matrigel filling
Matrigel is a gelatinous protein mixture that stays fluid at low temperature and gels at higher temperature.
Thawed, cold-Matrigel was double diluted with serum-free DMEM, and kept cold before use. A cold
tumor-on-a-chip device was kept on an ice pack. Cold Tygon tubing was connected to the four gas channel
outlets and two cell channel outlets at the opposite site of the reservoir (Figure 3.6A). Matrigel was
withdrawn to a cold 1 ml syringe. After the plunger was taken off, Matrigel was introduced to the cell
channel through the tubing via gravity. The gravity potential difference is created by raising the syringe
above the device about six inches (Figure 3.6B). After the Matrigel filled one side of the cell channel and
came out of the outlet, the whole device was kept in refrigerator for 20 minutes (or, overnight) until the

52
capillary effect filled the migration channels. Then cold cell culture media was put into the reservoir, and
the tubing used to introduce Matrigel was lowered, so that the flow direction reversed to wash off the
Matrigel in cell channel (Figure 3.6 C). The migration channels retain the Matrigel. Finally, the device was
warmed to 37℃ in an incubator for 24 hours to crosslink Matrigel in the migration channels and provide a
thin protein coating the glass substrate.

53
Figure 3.6 Diagram for Matrigel filling in on-top designed tumor-on-a-chip device; A: Tubing were
connected to the four air channel outlets and the two cell channel outlets opposite to the reservoir. B:
Chilled Matrigel was introduced through the Tubing that has been raised higher than the device.
Matrigel fills the main channel and by capillary action is drawn into the migration channels. C: Once the
migration channels were filled, cold media was poured into the reservoir while the Tygon tubing is
lowered down to change the flow direction. The cold media flowed into the cell channel and washed
Matrigel off the cell channel leaving the migration channels filled. The black arrows show the flow
direction. The cell channel which was left empty at B and C was named circulatory channel

54
Media delivery
Three media delivery designs were tested (Figure 3.7). The first was off-chip design, in which media was
stored in a 3mm Petri dish and withdrawn to the device through Tygon tubing (Figure 3.7C). The second
design was on-chip design, where a hole was punched by a puncher at one of cell channel outlet before the
device was bonded to glass. After bonding to glass, the media was stored in this on-chip reservoir and
withdrawn through the cell channel (Figure 3.7A). The third one is the on-top design, in which a PDMS
cylinder was made with two different sized punchers, stamped on to uncured PDMS as glue and then
bonded to the device around the channel outlets at one end. In this design two cell channel outlets and two
air channel outlets at one end of the device were included in the reservoir (Figure 3.7B, Figure 3.6A).
Media was stored in the on top reservoir and withdrawn through the cell channel. For all the designs media
was withdrawn by a syringe pump.

55
Gas atmosphere control
Hypoxia was set as 1% oxygen(21)
. Gas mixtures of 95% air/5% CO2 (Normoxia gas) or 1% O2/5% CO2/94%
N2 (Hypoxia gas) were delivered to the gas channels at a flow rate of 5 mL/min via mass flow controllers
(Aalborg, Model GFC17). Gas mixing and flow rates were regulated using these flow controllers under
computer control using a custom LabView-based program.
Mathematical Model of Oxygen Distribution
Steady-state oxygen gradients generated within the device were predicted by finite element analysis of
oxygen diffusion based on Fick's equations using COMSOL 4.2 software. In our models, the oxygen
Figure 3.7 The media delivery designs for tumor-on-a-chip device; A: on-chip design, a hole
was cutting at one cell channel outlet as media reservoir; B: on-top design, a PDMS cylinder
was bonded on top of the device; C: off-chip design, a 30mm Petri dish was used to hold media.

56
diffusion coefficient within PDMS is 2.15 × 10⁻⁹ 𝑚2
𝑠⁄ . The atmosphere surrounding the device was set to
20% oxygen. Gas channels contained 20% or 1% oxygen.
Glass cleaning
The glass substrate used for tumor-on-a-chip was first cleaned with ethanol and DI water and dried in an
oven at 110℃. The glass was then soaked in FisherbrandTM
chromic-sulfuric acid cleaning solution
overnight. The soaked glass was washed with DI water for multiple times and further sonicated in water
bath, then baked dry again with same method before use.
Cell seeding and cell culture
MDA-MB-231 and MCF7-0 breast cancer cells were cultured in our tumor-on-a-chip device. Cells were
harvested by trypsinization after they had grown to 70% confluency in T75 flask in DMEM + 10% FBS cell
culture media. Seeding media was prepared to a density of approximately 1 million cells per millimeter. The
glass substrate of all the devices used was incubated with serum containing growth media for 24 hours prior
to cell seeding to enhance the cell attachment. For the off-chip device, cells were seeded by gravity through
the Tygon tubing from the outlet (syringe pump side, downstream) to inlet (reservoir side, upstream). When
cells came out of the upstream Tygon tubing into the Petri dish reservoir, the Tygon tubing was clamped at
both upstream and downstream section to stop flow and let the cells in channel settle and attach to the glass
surface. Fresh cell culture media was replenished to the Petri dish reservoir. For the on-chip and on-top
design, seeding media was added into reservoir. Cells flowed from reservoir to the outlet Tygon tubing by
gravity. The downstream Tygon tubing was clamped to stop flow and let the cells settle and attach. Fresh

57
cell culture media was replenished to the reservoir after removal of the remaining cells. The cell-free
channel (i.e. the circulatory channel as the empty channel in Figure 3.7) that was left empty during Matrigel
filling was filled with media via gravity after the cells attached.
For all the designs the clamp remained closed for 4 hours to let the cells attach in a 37℃ incubator after
cell loading. After 4 hours, the clamp was opened, the downstream tubing was connected to a media filled
syringe via a tubing connecter made form a syringe tip, and the media was drawn from media reservoir by a
withdrawing syringe pump. Different flow rates ranges from 0.05-0.14 μL/min were tested. The entire
device was contained within a Petri dish and was kept in 37℃ incubator. PBS was poured into the Petri
dish to prevent evaporation. For the on-chip and on-top devices, the media in the reservoirs were
replenished once a day. Cell numbers were counted by microscopic examination once a day.
3.3 Result
Device fabrication
The fabricated tumor-on-a-chip device is shown in Figure 3.8. The two cell channels (400(width)Ⅹ
50(height)Ⅹ30000(length)μm) are connected perpendicularly by parallel migration channels (10Ⅹ10Ⅹ
400μm). 50μm above the cell channels, are two air channels (800Ⅹ100Ⅹ30000μm) separated by 300μ
m. The two air channels overlay the cell channels and protrude 50μm into the migration channels, to help
the creation of an oxygen gradient.

58
Matrigel filling
Gravity was used to introduce Matrigel into one of the cell channels. It takes about 2 minutes for Matrigel
to flow through the channel and finally comes out of the cell channel outlet and forms a droplet on top of
PDMS. However, the migration channels are barely filled at this point. The device then is taken to the
refrigerator to let the capillary effect to fill the migration channels while the surface tension will hold the
Matrigel at the end of migration channels from entering the other empty cell channels.
Figure 3.8 The diagram of tumor-on-a-chip. (top) the dimension and position of cell channels and
airchannels; (bottom) photos of a fabricated device.

59
Figure 3.9 Matrigel filling affected by Tygon tubing at the air channel inlet; black arrow shows the position
of tubing. The tubing plugged the nearby matrigel inlet slowing the filling of the migration channels.
The time needed to fill the migration channels is roughly 20 minutes, without Tygon tubing plugged into the
gas channels. However, the device with Tygon tubing connected to the gas channel requires significantly
longer time for the capillary effect to work. The time ranges from 2 hours to some of the devices, to 8 hours.
Experiments show that the Tygon tubing plugged into the gas channel outlet near the Matrigel inlet affects
the filling efficiency (Figure 3.9). The reason why the tubing in the nearby gas channel would affect
migration channel filling is not clear. It could be that the insertion of the Tygon tubing deforms the PDMS
near the outlet for the cell channel, thus makes the filling process slower.

60
Media delivery
As explained in Chapter 2, off-chip design in which cell is trapped in Tygon tubing is problematic is not
suitable for cell culture. On-chip and on-top design both work. However, due to the seeding method we use,
there are some cells left in the media reservoirs after washing. Untreated PDMS does not support cell
attachment but glass does. So in the on-chip design, there are a lot of cells growing in the reservoir’s glass
bottom and it could deplete the media in the reservoir after 3 days (Figure 3.10), whereas in on top design
the PDMS bottom does not support cell growth. In conclusion, the on-chip design is chosen for
experiments.
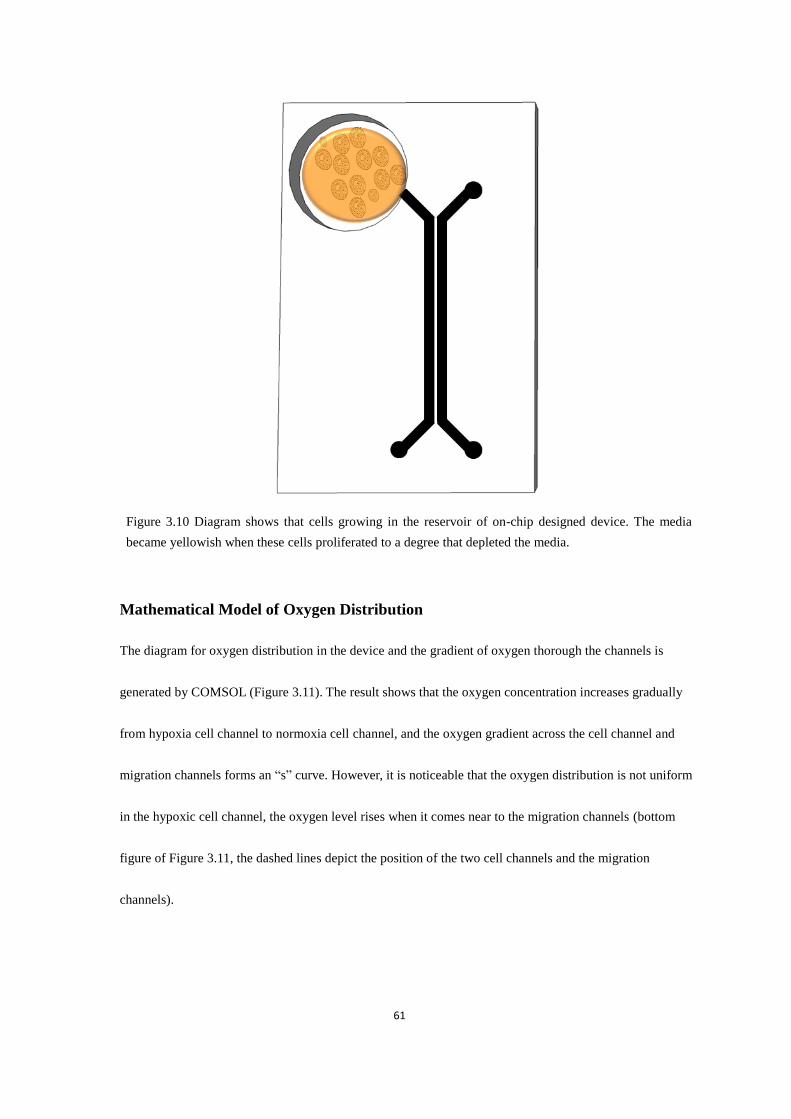
61
Mathematical Model of Oxygen Distribution
The diagram for oxygen distribution in the device and the gradient of oxygen thorough the channels is
generated by COMSOL (Figure 3.11). The result shows that the oxygen concentration increases gradually
from hypoxia cell channel to normoxia cell channel, and the oxygen gradient across the cell channel and
migration channels forms an “s” curve. However, it is noticeable that the oxygen distribution is not uniform
in the hypoxic cell channel, the oxygen level rises when it comes near to the migration channels (bottom
figure of Figure 3.11, the dashed lines depict the position of the two cell channels and the migration
channels).
Figure 3.10 Diagram shows that cells growing in the reservoir of on-chip designed device. The media
became yellowish when these cells proliferated to a degree that depleted the media.

62
Figure 3.11 COMSOL simulation for the spatial distribution of oxygen landscape across the entire device.
The oxygen content ranges from 1% (blue) to 20% (red) (top). For the regions just above the glass surface,
where the cells will be located, the oxygen level increases gradually from the hypoxic cell channel to
normoxic cell channel, forming an “s” shaped curve.

63
Cells growth under different flow rates
The flow rates of 0.07 μL/min and 0.14μL/min were used to study the effect of growth media flow on the
growth of MCF7-0 and MDA-MB-231 cells (Figure 3.12). A growth rate was derived by determining the
slope of the linear portion of a plot of the natural logarithm of cell number versus time, using the line fitting
function of EXCEL. The results show that MCF7-0 cells grow better with the higher flow rate, and
MDA-MB-231 cells grow better with a lower flow rate. Therefore, MDA-MB-231 cells seem to be more
sensitive to media flow than MCF7-0 cells do. Based on this findings, all of the following experiment use a
flow rate of 0.14μL/min for the growth of MCF7-0, and a flow rate of 0.05μL/min for the growth of
MDA-MB-231cells.
Figure 3.12 The effect of flow rate on cell culture with tumor-on-a-chip; The plot shows that MDA-MB-231
cells grow better under slower flow rate.

64
Metastatic potential between MCF7-0 and MDA-MB-231 cell lines under normoxia
MCF7-0 cells and MDA-MB-231 cells were cultured in tumor-on-a-chip device without gas flow to
compare their metastatic potential. The migration channels were blocked with Matrigel. During a 52 hours
culture, there are no MCF7-0 cells migrating through the migration channels while quite a lot of
MDA-MB-231 cells, around 300 cells in average have migrated through the migration channels.
(Figure3.13, Figure 3.14) Since the syringe pump could only been set at a single flow rate, the flow rate
was set to 0.07μL/min. The device used for this study was on-chip designed device. Figure 3.12 shows the
growth of both cell lines as well as the number of MDA-MB-231 cells that migrated. Three devices for each
of the two cell lines were used. The number of cells that migrated cells among the three MDA-MB-231 cell
loaded devices range from 117 to 909. Since the cells that have already traversed the migration channel to
the circulatory channel would keep proliferating in that channel and cannot be distinguished during
counting, the aggressiveness could be overestimated.

65
Figure 3.13 The comparison of aggressiveness between MCF7-0 and MDA-MB-231 cell line; There are
around 300 MDA-MB-231 cells migrated in average during the 52 hours culture period, while no MCF7-0
cells traverse the migration channels.

66
Figure 3.14 Photograph of MDA-MB-231 cells (top) and MCF7-0 cells (bottom, stained) growing in the
device. MDA-MB-231 cells transvers the migration channels while MCF7-0 cells don’t.

67
Comparison of growth rate between cells grow in the microfluidic device and in a standard tissue
culture flask
The same passage of MCF7-0 cells were seeded into a microfluidic device and a standard polystyrene tissue
culture flask to compare the growth rates. The flow rate in the device was set to 0.14μL/min. The cells
from the same passage were seeded into ten T25 flasks with 87,000 cells per flask. Two of the flasks were
trypsinized each day and the cells per flask were counted to generate the growth curve. The result shows
that the grow rate of MCF7 cells cultured in tumor-on-a-chip device and that cultured in traditional cell
culture flask are comparable (Figure 3.15). Since the cell number in tumor-on-a-chip device was counted by
eye using the microscope, it would get harder when the cells grew to more than three thousand. As a result
the count after 60 hours of perfusion may underscore the number of cells in the channel.
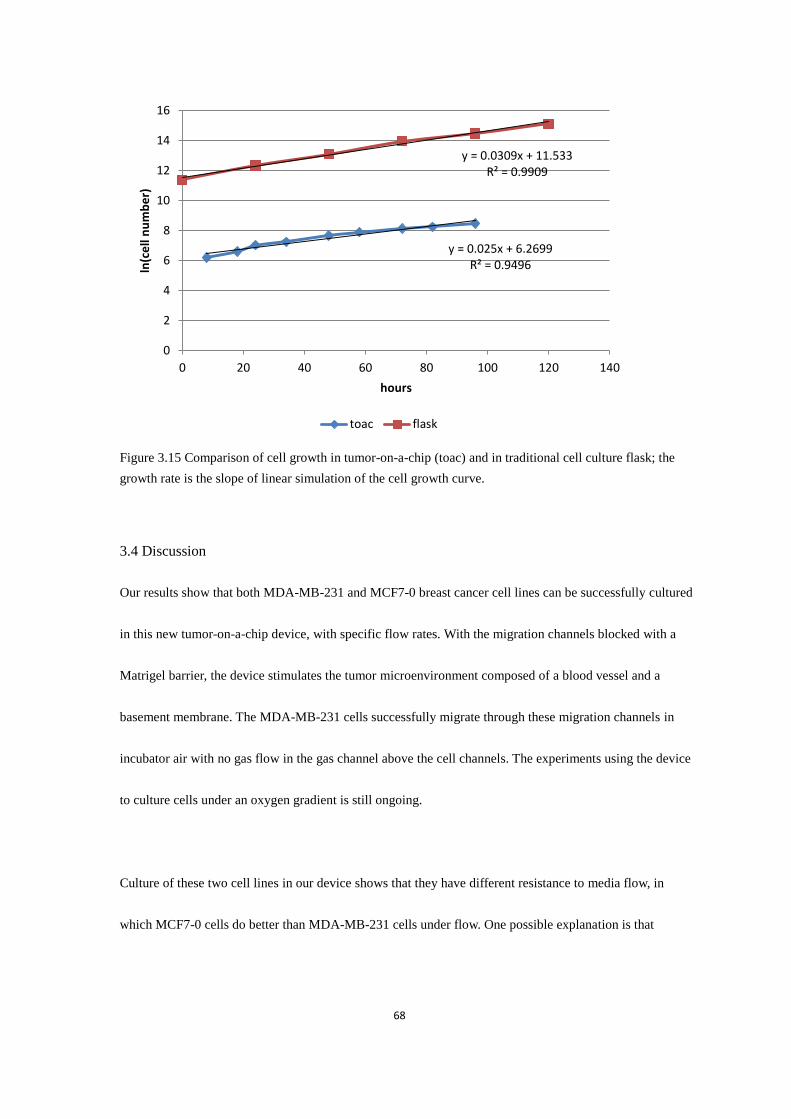
68
Figure 3.15 Comparison of cell growth in tumor-on-a-chip (toac) and in traditional cell culture flask; the
growth rate is the slope of linear simulation of the cell growth curve.
3.4 Discussion
Our results show that both MDA-MB-231 and MCF7-0 breast cancer cell lines can be successfully cultured
in this new tumor-on-a-chip device, with specific flow rates. With the migration channels blocked with a
Matrigel barrier, the device stimulates the tumor microenvironment composed of a blood vessel and a
basement membrane. The MDA-MB-231 cells successfully migrate through these migration channels in
incubator air with no gas flow in the gas channel above the cell channels. The experiments using the device
to culture cells under an oxygen gradient is still ongoing.
Culture of these two cell lines in our device shows that they have different resistance to media flow, in
which MCF7-0 cells do better than MDA-MB-231 cells under flow. One possible explanation is that
y = 0.025x + 6.2699 R² = 0.9496
y = 0.0309x + 11.533 R² = 0.9909
0
2
4
6
8
10
12
14
16
0 20 40 60 80 100 120 140
ln(c
ell
nu
mb
er)
hours
toac flask

69
MDA-MB-231 and MCF7-0 cells have different morphology when they attach to the glass substrate.
MDA-MB-231 cells are more enlongated while MCF7-0 cells are often shaped as a polygon. As a result
MDA-MB-231 cells may be exposed to more shear stress than MCF7-0 cells under equivalent flow.
Numerous studies have used MDA-MB-231 and MCF-7 breast cancer cells to represent more and less
aggressive breast cancer cell models with the MDA-MB-231 cells representing an aggressive cancer cell
and the MCF-7 cells representing a less aggressive cancer cell(28)
. Another possibility is that that
MDA-MB-231 cells are known to be more aggressive and that may indicates that they may have fewer
connecting proteins such as integrin to anchor them onto substrate, thus are easier to get flushed out of the
channel at higher flow rates.
Another problem is the cells growing in the area where the hole is punched at the channel inlet in PDMS
could deplete the nutrients in media. After cells are seeded in the device, there are still many cells remaining
in the PDMS hole between channel inlet and reservoir of the on-top device, even after those left in reservoir
have been washed off (Figure 3.16). These cells attach to the glass bottom below the reservoir and would
compete for nutrients with cells downstream in the channel during

70
media perfusion. An approach to fix this problem could be silanizing the glass locally so that cells won’t
stick to that area, or introducing extra tubing in front of the entrance of the overlapped cell channel part. So
that we can produce a U shape flow to flush the cells out of the hole area after cell seeding without
disturbing those in channel (Figure 3.17).
Figure 3.17 Diagram shows the introduction of a U shape flow to was the cells remained in the PDMS inlet
after cell seeding,
Figure 3.16 Diagram shows that cells remaining in the channel inlet after cell seeding

71
The next step is to culture the two breast cancer cell lines under an oxygen gradient. Then, we can compare
the aggressiveness of the cells with and without an oxygen gradient. Preliminary work has been done with
MDA-MB-231 cells culturing in device under oxygen gradient. However, the growth rate of these cells is
significantly slower than the control. Yet this is expected, for the cells have got used to culture under
normoxia thus an oxygen level as low as 1% requires time for the cells to adapt. Even though the growth
rate was slower, after five days under hypoxia a higher percentage of MDA-MB-231 cells migrated through
the channel compared to these cells grown under the incubator atmosphere. There are about 50%
MDA-MB-231 cells have traversed the migration channels in the device with oxygen gradient, while only
around 10% MDA-MB-231 cells have in the device with incubator atmosphere. This indicates hypoxia
increases the aggressiveness of the MDA-MB-231 cells. The experiment is still ongoing, to further confirm
and explore the behavior of cells cultured under oxygen gradient.

72
Chapter 4. Conclusions
The work of this thesis concerns the development of microfluidic device that more accurately mimics the in
vivo tumor microenvironment. The tumor-on-chip device functions as an invasion assay with Matrigel
blocked channels and, at the same time, could control the temporal and spatial oxygen concentration. Thus,
it enables us to model the cancer cell migration from its hypoxic, unstable microenvironment to the oxic
environment of the circulatory system in a single, compact in vitro device. The work described in this thesis
provides the first evidence to show that MDA-MB-231 and MCF7-0 breast cancer cells could be
successfully cultured in tumor-on-a-chip device with media perfusion for a long term. Moreover, these cells
show correspondent aggressive behavior by traversing the Matrigel blocked migration channels.
This work also determined the optimal flow rates to culture these two breast cancer cell lines. In the study
of comparing different media delivery methods, the cell seeding method we use on off-chip reservoir device
has been found to cause cell death downstream in channel. The exploration of its causes reveals that the
cells trapped in the media delivery tubing could release substances toxic to cells. Indeed, the methods to set
up a PDMS microfluidic cell culture system and to seed cells varies from study to study, but the
biocompatible Tygon tubing is commonly used, and the situation described above may happen often in
off-chip reservoir design. This may be able to explain why most studies use on-chip reservoirs to culture
cells in PDMS microfluidic device. Our results provide a possible reason that using on-chip reservoir design
is more successful in maintaining cell growth in microfluidic devices.

73
Much effort was spent in optimizing the steps for Matrigel filling of the migration channels in the
tumor-on-a-chip device. The filling procedure is affected by the hydrophilicity of the device. Since the
PDMS device is bonded to glass via plasma treating, the PDMS is temporarily made hydrophilic during this
process. As time passes the PDMS surface reverts back to hydrophobic property and the Matrigel filling is
more difficult. Moreover, Matrigel is a biological product, its protein content and character changes from
batch to batch. Therefore, the filling efficiency would be unstable due to the variety of the Matrigel’s
surface tension and viscosity. To make the Matrigel filling process and also the master fabrication process
easier, our group are currently making a new design of the tumor-on-a-chip device. The migration channels
are replaced with two lines of individual pillars. These pillars are separated with a specific distance thus
form an unclosed channel for Matrigel. Ideally, the surface tension could hold the Matrigel at the front edge
of the pillars. We also introduce an outlet and an inlet at the Matrigel channel so that the Matrigel can be
filled directly, rather than by capillary effect as in the previous design. A newly designed device which
contains pillars separated by 50 microns was tested and it shows promising result in Matrigel filling
experiments. This new design can avoid the time-consuming 3D master fabrication step, Matrigel washing
step, and can also study the path followed by cells when they migrate through the Matrigel, rather than likes
that in the previous design where cells have a set migration path. Also in the future, we could put endothelia
cells in the circulatory channel, which would make our device a more representative model for what
happens in the tumor in vivo.

74
REFERENCES
Chapter 1
1. Aghi, M., Cohen, K. S., Klein, R. J., Scadden, D. T., and Chiocca, E. A. Tumor stromal-derived
factor-1 recruits vascular progenitors to mitotic neovasculature, where microenvironment influences
their differentiated phenotypes. Cancer Research 2006, 66(18), 9054-9064.
2. Albini, A., Iwamoto, Y., Kleinman, H. K., Martin, G. R., Aaronson, S. A., Kozlowski, J. M., and
McEwan, R. N. A rapid in vitro assay for quantitating the invasive potential of tumor cells. Cancer
Research 1987, 47(12), 3239-3245.
3. Al-Hajj, M., Wicha, M. S., Benito-Hernandez, A., Morrison, S. J., and Clarke, M. F. Prospective
identification of tumorigenic breast cancer cells. Proceedings of the National Academy of Sciences
2003, 100(7), 3983-3988.
4. Allen, C. B., Schneider, B. K., and White, C. W. Limitations to oxygen diffusion and equilibration in in
vitro cell exposure systems in hyperoxia and hypoxia. American Journal of Physiology-Lung Cellular
and Molecular Physiology 2001, 281(4), L1021-L1027.
5. Al-Mehdi, A. B., Tozawa, K., Fisher, A. B., Shientag, L., Lee, A., and Muschel, R. J. Intravascular
origin of metastasis from the proliferation of endothelium-attached tumor cells: a new model for
metastasis. Nature Medicine 2000, 6(1), 100-102.
6. Ambrosio, G., Tritto, I., and Chiariello, M. The role of oxygen free radicals in preconditioning. Journal
of Molecular and Cellular Cardiology 1995, 27(4), 1035-1039
7. Ambrosone C.B. Oxidants and antioxidants in breast cancer. Antioxid. Redox Signal 2000, 2: 903–917
8. American Cancer Society. Breast Cancer Facts and Figures 2011-2012. Atlanta: American Cancer
Society, Inc.
9. Ao, M., Franco, O. E., Park, D., Raman, D., Williams, K., and Hayward, S. W. Cross-talk between
paracrine-acting cytokine and chemokine pathways promotes malignancy in benign human prostatic
epithelium. Cancer Research 2007, 67(9), 4244-4253.
10. Bae, Y. S., Sung, J. Y., Kim, O. S., Kim, Y. J., Hur, K. C., Kazlauskas, A., and Rhee, S. G.
Platelet-derived growth factor-induced H2O2 production requires the activation of phosphatidylinositol
3-kinase. Science Signaling 2000, 275(14), 10527.

75
11. Barcellos-Hoff, M. H., and Ravani, S. A. Irradiated mammary gland stroma promotes the expression of
tumorigenic potential by unirradiated epithelial cells. Cancer Research 2000, 60(5), 1254-1260.
12. Baumann, F., Leukel, P., Doerfelt, A., Beier, C. P., Dettmer, K., Oefner, P. J.,and Hau, P. Lactate
promotes glioma migration by TGF-β2–dependent regulation of matrix metalloproteinase-2.
Neuro-oncology 2009, 11(4), 368-380.
13. Beatty, G. L., and Paterson, Y. IFN-γ can promote tumor evasion of the immune system in vivo by
down-regulating cellular levels of an endogenous tumor antigen. The Journal of Immunology 2000,
165(10), 5502-5508.
14. Benhar, M., Engelberg, D., and Levitzki, A. ROS, stress-activated kinases and stress signaling in cancer.
EMBO reports 2002, 3(5), 420-425.
15. Bennewith, K. L., and Durand, R. E. Quantifying transient hypoxia in human tumor xenografts by flow
cytometry. Cancer Research 2004, 64(17), 6183-6189.
16. Bensaad, K., and Vousden, K. H. Savior and slayer: the two faces of p53. Nature Medicine 2005,
11(12), 1278-1279.
17. Bergers, G., Brekken, R., McMahon, G., Vu, T. H., Itoh, T., Tamaki, K., and Hanahan, D. Matrix
metalloproteinase-9 triggers the angiogenic switch during carcinogenesis. Nature Cell Biology 2000,
2(10), 737-744.
18. Bhowmick, N. A., Neilson, E. G., and Moses, H. L. Stromal fibroblasts in cancer initiation and
progression. Nature 2004, 432(7015), 332-337.
19. Bissell, M. J., and Radisky, D. Putting tumours in context. Nature Reviews Cancer 2001, 1(1), 46-54.
20. Bonnet, D., and Dick, J. E. Human acute myeloid leukemia is organized as a hierarchy that originates
from a primitive hematopoietic cell. Nature Medicine 1997, 3(7), 730-737.
21. Bonuccelli, G., Tsirigos, A., Whitaker-Menezes, D., Pavlides, S., Pestell, R. G., Chiavarina, B., and
Lisanti, M. P. Ketones and lactate “fuel” tumor growth and metastasis: Evidence that epithelial cancer
cells use oxidative mitochondrial metabolism. Cell Cycle 2010, 9(17), 3506-3514.
22. Bleul, C. C., Fuhlbrigge, R. C., Casasnovas, J. M., Aiuti, A., and Springer, T. A. A highly efficacious
lymphocyte chemoattractant, stromal cell-derived factor 1 (SDF-1). The Journal of Experimental
Medicine 1996, 184(3), 1101-1109.

76
23. Braun, R. D., Lanzen, J. L., and Dewhirst, M. W. Fourier analysis of fluctuations of oxygen tension and
blood flow in R3230Ac tumors and muscle in rats. American Journal of Physiology-Heart and
Circulatory Physiology 1999, 277(2), H551-H568.
24. Britta Weigelt, Johannes L. Peterse and Laura J. van’t Veer. Breast Cancer Metastasis: Makers and
Models, Nature 2005, 5: 591-602
25. Brizel DM, Rosner GL, Prosnitz LR and Dewhirst MW. Patterns and Variability of Tumor
Oxygenation in Human Soft Tissue Sarcomas, Cervical Carcinomas, and lymph node metastases. Int J
Radiat Oncol Biol Phys 1995, 32(4): 1121–1125.
26. Brown, L. F., Berse, B., Van De Water, L., Papadopoulos-Sergiou, A., Perruzzi, C. A., Manseau, E. J.,
and Senger, D. R. Expression and distribution of osteopontin in human tissues: widespread association
with luminal epithelial surfaces. Molecular Biology of the Cell 1992, 3(10), 1169.
27. Bruna, A., Darken, R. S., Rojo, F., Ocaña, A., Peñuelas, S., Arias, A., and Seoane, J. High TGFβ-Smad
activity confers poor prognosis in glioma patients and promotes cell proliferation depending on the
methylation of the PDGF-B gene. Cancer Cell 2007, 11(2), 147-160.
28. Brurberg KG, Skogmo HK, Graff BA, Olsen DR, Rofstad EK. Fluctuations in pO2 in poorly and
well-oxygenated spontaneous canine tumors before and during fractionated radiation therapy.
Radiother Oncol 2005, 77: 220–6
29. Burdon, R. H. Superoxide and hydrogen peroxide in relation to mammalian cell proliferation. Free
Radical Biology and Medicine 1995, 18(4), 775-794.
30. Buttke, T. M., Sandstrom, P. A. Oxidative stress as a mediator of apoptosis. Immunology Today 1994,
15(1), 7-10.
31. Cameron, M. D., Schmidt, E. E., Kerkvliet, N., Nadkarni, K. V., Morris, V. L., Groom, A. C., and
MacDonald, I. C. Temporal progression of metastasis in lung: cell survival, dormancy, and location
dependence of metastatic inefficiency. Cancer Research 2000, 60(9), 2541-2546.
32. Cairns, R. A., Kalliomaki, T., and Hill, R. P. Acute (cyclic) hypoxia enhances spontaneous metastasis of
KHT murine tumors. Cancer Research 2001, 61(24), 8903-8908.
33. Cairns, R. A., Hill, R. P. Acute hypoxia enhances spontaneous lymph node metastasis in an orthotopic
murine model of human cervical carcinoma. Cancer Research 2004, 64(6), 2054-2061.
34. Chaffer, C. L., and Weinberg, R. A. A perspective on cancer cell metastasis. Science 2011, 331(6024),
1559-1564.

77
35. Chambers, A. F., Groom, A. C., and MacDonald, I. C. Metastasis: dissemination and growth of cancer
cells in metastatic sites. Nature Reviews Cancer 2002, 2(8), 563-572.
36. Chaplin, D. J., Durand, R. E., and Olive, P. L. Acute hypoxia in tumors: implications for modifiers of
radiation effects. International Journal of Radiation Oncology* Biology* Physics 1986, 12(8),
1279-1282.
37. Chaw, K. C., Manimaran, M., Tay, E. H., and Swaminathan, S. Multi-step microfluidic device for
studying cancer metastasis. Lab on a Chip 2007, 7(8), 1041-1047.
38. Chen, H. C. Boyden chamber assay. In Cell Migration 2005(pp. 15-22). Humana Press.
39. Cheng, G. C., Schulze, P. C., Lee, R. T., Sylvan, J., Zetter, B. R., and Huang, H. Oxidative stress and
thioredoxin-interacting protein promote intravasation of melanoma cells. Experimental Cell Research
2004, 300(2), 297-307.
40. Cheng, S. Y., Heilman, S., Wasserman, M., Archer, S., Shuler, M. L., and Wu, M. A hydrogel-based
microfluidic device for the studies of directed cell migration. Lab on a Chip 2007, 7(6), 763-769.
41. Christine L. Carter, Phd, Mph,Carol Allen, Phd,T and Donald E. Henson, Md. Relation of Tumor Size,
Lymph Node Status, and Survival in 24,740 Breast Cancer Cases, Cancer 1989, 63: 181-187
42. Chung, S., Sudo, R., Mack, P. J., Wan, C. R., Vickerman, V., and Kamm, R. D. Cell migration into
scaffolds under co-culture conditions in a microfluidic platform. Lab on a Chip 2009, 9(2), 269-275.
43. Clevers, H. The cancer stem cell: premises, promises and challenges. Nature Medicine 2011, 313-319.
44. Coussens, L. M., Raymond, W. W., Bergers, G., Laig-Webster, M., Behrendtsen, O., Werb, Z., and
Hanahan, D. Inflammatory mast cells up-regulate angiogenesis during squamous epithelial
carcinogenesis. Genes and Development 1999, 13(11), 1382-1397.
45. Coussens, L. M., Werb, Z. Inflammation and cancer. Nature 2002, 420(6917), 860-867.
46. Coussens, L. M., Werb, Z. Inflammatory Cells and Cancer Think Different!. The Journal of
Experimental Medicine 2001, 193(6), F23-F26.
47. Dai, Y., Bae, K., Siemann, D. W. Impact of hypoxia on the metastatic potential of human prostate
cancer cells. International Journal of Radiation Oncology* Biology* Physics 2011, 81(2), 521-528.

78
48. Dalerba, P., Dylla, S. J., Park, I. K., Liu, R., Wang, X., Cho, R. W., and Clarke, M. F. Phenotypic
characterization of human colorectal cancer stem cells. Proceedings of the National Academy of
Sciences 2007, 104(24), 10158-10163.
49. De Jaeger K, Kavanagh MC, Hill RP. Relationship of hypoxia to metastatic ability in rodent tumours.
Br. J. Cancer. 2001, 84:1280–1285.
50. De Palma, M., Murdoch, C., Venneri, M. A., Naldini, L., and Lewis, C. E. Tie2-expressing monocytes:
regulation of tumor angiogenesis and therapeutic implications. Trends in Immunology 2007, 28(12),
519-524.
51. Deng, G., Lu, Y., Zlotnikov, G., Thor, A. D., and Smith, H. S. Loss of heterozygosity in normal tissue
adjacent to breast carcinomas. Science 1996, 274(5295), 2057-2059.
52. Derynck, R., Akhurst, R. J. Differentiation plasticity regulated by TGF-β family proteins in
development and disease. Nature Cell Biology 2007, 9(9), 1000-1004.
53. Dewhirst, M. W., Braun, R. D., and Lanzen, J. L. Temporal changes in pO< sub> 2</sub> of R3230Ac
tumors in fischer-344 rats. International Journal of Radiation Oncology* Biology* Physics 1998, 42(4),
723-726.
54. Dewhirst, M. W., Kimura, H., Rehmus, S. W., Braun, R. D., Papahadjopoulos, D., Hong, K., and
Secomb, T. W. Microvascular studies on the origins of perfusion-limited hypoxia. The British Journal
of Cancer 1996. Supplement, 27, S247.
55. Dewhirst, M. W. Intermittent hypoxia furthers the rationale for hypoxia-inducible factor-1 targeting.
Cancer Res 2007, 67(3), 854-855.
56. Dontu, G., El-Ashry, D., and Wicha, M. S. Breast cancer, stem/progenitor cells and the estrogen
receptor. Trends in Endocrinology and Metabolism 2004, 15(5), 193-197.
57. Fang, K. C., Wolters, P. J., Steinhoff, M., Bidgol, A., Blount, J. L., and Caughey, G. H. Mast cell
expression of gelatinases A and B is regulated by kit ligand and TGF-β. The Journal of Immunology
1999, 162(9), 5528-5535.
58. Fearon, E. R., Vogelstein, B. Clonal analysis of human colorectal tumors. Science 1987, 238(4824),
193-197.
59. Fialkow, P. J. Clonal origin of human tumors. Annual Review of Medicine 1979, 30(1), 135-143.

79
60. Fidler, I. J. Metastasis: quantitative analysis distribution and fate of tumor emboli labeled with 125
I-5-iodo-2’-deoxyuridine, J Natl Cancer Inst 1970, 45: 773-782
61. Fidler, I. J. Selection of successive tumour lines for metastasis. Nature 1973, 242(118), 148-149.
62. Fidler, I. J., and Kripke, M. L. Metastasis results from preexisting variant cells within a malignant
tumor. Science 1977, 197(4306), 893-895.
63. Fidler, I. J., and Hart, I. R. Biological diversity in metastatic neoplasms: origins and implications.
Science 1982, 217(4564), 998-1003.
64. Fischer, K., Hoffmann, P., Voelkl, S., Meidenbauer, N., Ammer, J., Edinger, M., and Kreutz, M.
Inhibitory effect of tumor cell–derived lactic acid on human T cells. Blood 2007, 109(9), 3812-3819.
65. Frame, S., Balmain, A. Integration of positive and negative growth signals during< i> ras</i> pathway
activation< i> in vivo</i>. Current Opinion in Genetics and Development 2000, 10(1), 106-113.
66. Frank, B. T., Rossall, J. C., Caughey, G. H., and Fang, K. C. Mast cell tissue inhibitor of
metalloproteinase-1 is cleaved and inactivated extracellularly by α-chymase. The Journal of
Immunology 2001, 166(4), 2783-2792.
67. Friese, M. A., Wischhusen, J., Wick, W., Weiler, M., Eisele, G., Steinle, A., and Weller, M. RNA
interference targeting transforming growth factor-β enhances NKG2D-mediated antiglioma immune
response, inhibits glioma cell migration and invasiveness, and abrogates tumorigenicity in vivo.
Cancer Research 2004, 64(20), 7596-7603.
68. Funamoto, K., Zervantonakis, I. K., Liu, Y., Ochs, C. J., Kim, C., and Kamm, R. D. A novel
microfluidic platform for high-resolution imaging of a three-dimensional cell culture under a controlled
hypoxic environment. Lab on a Chip 2012, 12(22), 4855-4863.
69. Furth, J., Kahn, M. C., Breedis, C. The transmission of leukemia of mice with a single cell. The
American Journal of Cancer 1937, 31(2), 276-282.
70. Garber, K. Energy boost: the Warburg effect returns in a new theory of cancer. Journal of the National
Cancer Institute 2004, 96(24), 1805-1806.
71. García Olmo, D., Garcia Olmo, D. C., Ontanon, J., Martinez, E., and Vallejo, M. Tumor DNA
circulating in the plasma might play a role in metastasis. The Hypothesis of the Genometastasis.
Histology and histopathology 1999, 14(4), 1159-1164.

80
72. Garcı́a-Olmo, D., Garcı́a-Olmo, D. C., Ontañón, J., and Martinez, E. Horizontal transfer of DNA and
the" genometastasis hypothesis". Blood 2000, 95(2), 724-725.
73. Gati, A., Guerra, N., Giron-Michel, J., Azzarone, B., Angevin, E., Moretta, A., and Caignard, A. Tumor
cells regulate the lytic activity of tumor-specific cytotoxic T lymphocytes by modulating the inhibitory
natural killer receptor function. Cancer Research 2001, 61(8), 3240-3244.
74. Ginestier, C., Hur, M. H., Charafe-Jauffret, E., Monville, F., Dutcher, J., Brown, M., and Dontu, G.
ALDH1 is a marker of normal and malignant human mammary stem cells and a predictor of poor
clinical outcome. Cell Stem Cell 2007, 1(5), 555-567.
75. Goetze, K., Walenta, S., Ksiazkiewicz, M., Kunz-Schughart, L. A., and Mueller-Klieser, W. Lactate
enhances motility of tumor cells and inhibits monocyte migration and cytokine release. International
Journal of Oncology 2010, 39(2), 453-463.
76. Gordan, J. D., Thompson, C. B., and Simon, M. C. HIF and c-Myc: sibling rivals for control of cancer
cell metabolism and proliferation. Cancer Cell 2007, 12(2), 108-113
77. Gorelik, L., Flavell, R. A. Abrogation of TGFβ signaling in T cells leads to spontaneous T cell
differentiation and autoimmune disease. Immunity 2000, 12(2), 171-181.
78. Gupta, A., Rosenberger, S. F., and Bowden, G. T. Increased ROS levels contribute to elevated
transcription factor and MAP kinase activities in malignantly progressed mouse keratinocyte cell lines.
Carcinogenesis 1999, 20(11), 2063-2073.
79. Guzy RD, Schumacker PT: Oxygen sensing by mitochondria at complex III: the paradox of increased
reactive oxygen species during hypoxia. Exp Physiol 2006, 91:807-819
80. Halliwell, B. Oxidative stress and cancer: have we moved forward?. Biochem. J 2007, 401, 1-11.
81. Harris, J. F., Chambers, A. F., Hill, R. P., and Ling, V. Metastatic variants are generated spontaneously
at a high rate in mouse KHT tumor. Proceedings of the National Academy of Sciences 1982, 79(18),
5547-5551.
82. Hattori, K., Heissig, B., Wu, Y., Dias, S., Tejada, R., Ferris, B., and Rafii, S. Placental growth factor
reconstitutes hematopoiesis by recruiting VEGFR1+ stem cells from bone-marrow microenvironment.
Nature Medicine 2002, 8(8), 841-849.
83. Heissig, B., Hattori, K., Dias, S., Friedrich, M., Ferris, B., Hackett, N. R., and Rafii, S. Recruitment of
stem and progenitor cells from the bone marrow niche requires MMP-9 mediated release of kit-ligand.
Cell 2002, 109(5), 625-637.

81
84. Heppner, G. H. Tumor heterogeneity. Cancer Research 1984, 44(6), 2259-2265.
85. Hess, K. R., Varadhachary, G. R., Taylor, S. H., Wei, W., Raber, M. N., Lenzi, R., and Abbruzzese, J. L.
Metastatic patterns in adenocarcinoma. Cancer 2006, 106(7), 1624-1633.
86. Hirschhaeuser, F., Sattler, U. G., and Mueller-Klieser, W. Lactate: a metabolic key player in cancer.
Cancer Research 2011, 71(22), 6921-6925.
87. Honn, K. V., Tang, D. G., Grossi, I., Duniec, Z. M., Timar, J., Renaud, C., and Marnett, L. J. Tumor
cell-derived 12 (S)-hydroxyeicosatetraenoic acid induces microvascular endothelial cell retraction.
Cancer Research 1994, 54(2), 565-574.
88. Hsieh, C. H., Chang, H. T., Shen, W. C., Shyu, W. C., and Liu, R. S. Imaging the impact of Nox4 in
cycling hypoxia-mediated U87 glioblastoma invasion and infiltration. Molecular Imaging and Biology
2012, 14(4), 489-499.
89. Hsieh, C. H., Lee, C. H., Liang, J. A., Yu, C. Y., and Shyu, W. C. Cycling hypoxia increases U87
glioma cell radioresistance via ROS induced higher and long-term HIF-1 signal transduction activity.
Oncology Reports 2010, 24(6), 1629-1636.
90. Huang, E. H., Heidt, D. G., Li, C. W., and Simeone, D. M. Cancer stem cells: a new paradigm for
understanding tumor progression and therapeutic resistance. Surgery 2007, 141(4), 415-419.
91. Huang, Xiaowen, Li Li, Qin Tu, Jianchun Wang, Wenming Liu, Xueqin Wang, Li Ren, and Jinyi Wang.
On-chip cell migration assay for quantifying the effect of ethanol on MCF-7 human breast cancer cells.
Microfluidics and Nanofluidics 2011, 10(6), 1333-1341.
92. Irimia, D., Charras, G., Agrawal, N., Mitchison, T., and Toner, M. Polar stimulation and constrained
cell migration in microfluidic channels. Lab on a Chip 2007, 7(12), 1783-1790.
93. Jennings, M. T., and Pietenpol, J. A. The role of transforming growth factor β in glioma progression.
Journal of Neuro-oncology 1998, 36(2), 123-140.
94. Jessup JM, Battle P, Waller H, Edmiston KH, Stolz DB, Watkins SC, Locker J, Skena K. Reactive
nitrogen and oxygen radicals formed during hepatic ischemia-reperfusion kill weakly metastatic
colorectal cancer cells. Cancer Res 1999; 59: 1825-1829
95. Kaelin Jr, William G. The von Hippel–Lindau tumour suppressor protein: O2 sensing and cancer.
Nature Reviews Cancer 2008, 8(11): 865-873
82
96. Kakarala, M., Wicha, M. S. Implications of the cancer stem-cell hypothesis for breast cancer
prevention and therapy. Journal of Clinical Oncology 2008, 26(17), 2813-2820.
97. Karnoub, A. E., Dash, A. B., Vo, A. P., Sullivan, A., Brooks, M. W., Bell, G. W., and Weinberg, R. A.
Mesenchymal stem cells within tumour stroma promote breast cancer metastasis. Nature 2007,
449(7162), 557-563.
98. Kawaguchi, T., Nakamura, K. Analysis of the lodgement and extravasation of tumor cells in
experimental models of hematogenous metastasis. Cancer and Metastasis Reviews 1986, 5(2), 77-94.
99. Kerbel, R. S., Waghorne, C., Man, M. S., Elliott, B., and Breitman, M. L. Alteration of the tumorigenic
and metastatic properties of neoplastic cells is associated with the process of calcium
phosphate-mediated DNA transfection. Proceedings of the National Academy of Sciences 1987, 84(5),
1263-1267.
100. Kerbel, R. S., Waghorne, C., Korczak, B., Lagarde, A., and Breitman, M. L. Clonal dominance of
primary tumours by metastatic cells: genetic analysis and biological implications. Cancer Surveys
1987, 7(4), 597-629.
101. Kim, Y. M., Kim, K. E., Koh, G. Y., Ho, Y. S., and Lee, K. J. Hydrogen peroxide produced by
angiopoietin-1 mediates angiogenesis. Cancer Research 2006, 66(12), 6167-6174.
102. Kim, J. W., Dang, C. V. Cancer's molecular sweet tooth and the Warburg effect. Cancer Research 2006,
66(18), 8927-8930.
103. Klaunig JE, Xu Y, Isenberg JS, Bachowski S, Kolaja KL, Jiang J, Stevenson DE, Walborg EF, Jr. The
role of oxidative stress in chemical carcinogenesis. Environ. Health Perspect 1998; 106(Suppl 1): 289–
295
104. Kalliomaki TM, McCallum G, Lunt SJ, Wells PG, Hill RP. Analysis of the effects of exposure to acute
hypoxia on oxidative lesions and tumour progression in a transgenic mouse breast cancer model. BMC
Cancer. 2008, 8:151.
105. Kalliomaki TM, McCallum G, Wells PG, Hill RP. Progression and metastasis in a transgenic mouse
breast cancer model: effects of exposure to in vivo hypoxia. Cancer Lett. 2009, 282:98–108
106. Klimova, T., N. S. Chandel. Mitochondrial complex III regulates hypoxic activation of HIF. Cell Death
and Differentiation 2008,15 (4): 660-666

83
107. Kundu, N., Zhang, S., and Fulton, A. M. Sublethal oxidative stress inhibits tumor cell adhesion and
enhances experimental metastasis of murine mammary carcinoma. Clinical and Experimental
Metastasis 1995, 13(1), 16-22.
108. Lam, R. H., Kim, M. C., and Thorsen, T. Culturing aerobic and anaerobic bacteria and mammalian cells
with a microfluidic differential oxygenator. Analytical Chemistry 2007, 81(14), 5918-5924.
109. Langley, R. R., Fidler, I. J. The seed and soil hypothesis revisited—The role of tumor‐stroma
interactions in metastasis to different organs. International Journal of Cancer 2011, 128(11),
2527-2535.
110. Lanzen J, Braun RD, Klitzman B, Brizel D, Secomb TW, Dewhirst MW. Direct demonstration of
instabilities in oxygen concentrations within the extravascular compartment of an experimental tumor.
Cancer Res 2006, 66: 2219–23
111. Lapidot, T., Sirard, C., Vormoor, J., Murdoch, B., Hoang, T., Caceres-Cortes, J., and Dick, J. E. A cell
initiating human acute myeloid leukaemia after transplantation into SCID mice. Nature 1994, 367:
645-648
112. Leighton, J. Inherent malignancy of cancer cells possibly limited by genetically differing cells in the
same tumour. Acta Cytol 1965, 9, 138-140.
113. Li, Y. H., Zhu, C. A modified Boyden chamber assay for tumor cell transendothelial migration in vitro.
Clinical and Experimental Metastasis 1999, 17(5), 423-429.
114. Lin, E. Y., Nguyen, A. V., Russell, R. G., and Pollard, J. W. Colony-stimulating factor 1 promotes
progression of mammary tumors to malignancy. The Journal of Experimental Medicine 2001, 193(6),
727-740.
115. Ling, V., Chambers, A. F., Harris, J. F., and Hill, R. P. Quantitative genetic analysis of tumor
progression. Cancer and Metastasis Reviews 1985, 4(2), 173-192.
116. Ling, L. J., Wang, S., Liu, X. A., Shen, E. C., Ding, Q., Lu, C., and Wang, F. A novel mouse model of
human breast cancer stem-like cells with high CD44+ CD24-/lower phenotype metastasis to human
bone. Chin Med J (Engl) 2008, 121(20), 1980-1986.
117. Lo, J. F., Sinkala, E., and Eddington, D. T. Oxygen gradients for open well cellular cultures via
microfluidic substrates. Lab on a Chip 2010, 10(18), 2394-2401.
84
118. Lundgren K, Holm C and Landberg G. Hypoxia and Breast Cancer: prognostic and therapeutic
implications. Cell Mol Life Sci 2007, 64: 3233-3247
119. Luzzi, K. J., MacDonald, I. C., Schmidt, E. E., Kerkvliet, N., Morris, V. L., Chambers, A. F., and
Groom, A. C. Multistep nature of metastatic inefficiency: dormancy of solitary cells after successful
extravasation and limited survival of early micrometastases. The American Journal of Pathology 1998,
153(3), 865-873.
120. Majmundar, Amar J., Waihay J. Wong, and M. Celeste Simon. Hypoxia-inducible factors and the
response to hypoxic stress. Molecular Cell 2010, 40(2): 294-309
121. Makino, S. Further evidence favoring the concept of the stem cell in ascites tumors of rats. Annals of
the New York Academy of Sciences 1956, 63(5), 818-830.
122. Manuela Milani, Adrian L. Harris. Targeting Tumour Hypoxia in Breast Cancer, European Journal Of
Cancer 2008, 44: 2766-2773
123. Moldovan, L., Irani, K., Moldovan, N. I., Finkel, T., and Goldschmidt-Clermont, P. J. The actin
cytoskeleton reorganization induced by Rac1 requires the production of superoxide. Antioxidants and
Redox Signaling 1999, 1(1), 29-43.
124. Muir, D., Sukhu, L., Johnson, J., Lahorra, M. A., and Maria, B. L. Quantitative methods for scoring cell
migration and invasion in filter-based assays. Analytical Biochemistry 1993, 215(1), 104-109.
125. Nelson, K. K., Melendez, J. A. Mitochondrial redox control of matrix metalloproteinases. Free Radical
Biology and Medicine 2004, 37(6), 768-784.
126. "Non-inasive or Invasive Breast Cancer." BREASTCANCER.ORG. Breastcancer.org, 19 Sept. 2012.
Web. 16 Apr. 2013. http://www.breastcancer.org/symptoms/diagnosis/invasive
127. Newell, K., Franchi, A., Pouysségur, J., and Tannock, I. Studies with glycolysis-deficient cells suggest
that production of lactic acid is not the only cause of tumor acidity. Proceedings of the National
Academy of Sciences 1993, 90(3), 1127-1131.
128. Nowell, P. C.A minute chromosome in human chronic granulocytic leukemia. Science 1960, 132,
1497.
129. O’Brien, C. A., Pollett, A., Gallinger, S., and Dick, J. E. A human colon cancer cell capable of
initiating tumour growth in immunodeficient mice. Nature 2006, 445(7123), 106-110.

85
130. Oppegard, S. C., Nam, K. H., Carr, J. R., Skaalure, S. C., and Eddington, D. T. Modulating temporal
and spatial oxygenation over adherent cellular cultures. PloS One 2009, 4(9), e6891.
131. Parkins, C. S., Dennis, M. F., Stratford, M. R., Hill, S. A., and Chaplin, D. J. Ischemia reperfusion
injury in tumors: the role of oxygen radicals and nitric oxide. Cancer Research 1995, 55(24),
6026-6029.
132. Pavlides, S., Whitaker-Menezes, D., Castello-Cros, R., Flomenberg, N., Witkiewicz, A. K., Frank, P. G.,
and Lisanti, M. P. The reverse Warburg effect: aerobic glycolysis in cancer associated fibroblasts and
the tumor stroma. Cell Cycle 2009, 8(23), 3984-4001.
133. Payne, S. L., Fogelgren, B., Hess, A. R., Seftor, E. A., Wiley, E. L., Fong, S. F., and Kirschmann, D. A.
Lysyl oxidase regulates breast cancer cell migration and adhesion through a hydrogen peroxide–
mediated mechanism. Cancer Research 2005, 65(24), 11429-11436.
134. Peinado, H., Lavotshkin, S., and Lyden, D. The secreted factors responsible for pre-metastatic niche
formation: old sayings and new thoughts. In Seminars in cancer biology (Vol. 21, No. 2, pp. 139-146).
Academic Press 2011.
135. Petros, J. A., Baumann, A. K., Ruiz-Pesini, E., Amin, M. B., Sun, C. Q., Hall, J., and Wallace, D. C.
mtDNA mutations increase tumorigenicity in prostate cancer. Proceedings of the National Academy of
Sciences of the United States of America 2005, 102(3), 719-724.
136. Phillips, T. M., McBride, W. H., and Pajonk, F. The response of CD24−/low/CD44+ breast cancer–
initiating cells to radiation. Journal of the National Cancer Institute 2006, 98(24), 1777-1785.
137. Pierce, G. B., Wallace, C. Differentiation of malignant to benign cells. Cancer Research 1971, 31(2),
127-134.
138. Pierce, G. B., Speers, W. C. Tumors as caricatures of the process of tissue renewal: prospects for
therapy by directing differentiation. Cancer Research 1988, 48(8), 1996-2004.
139. Preston, T. J., Muller, W. J., and Singh, G. Scavenging of extracellular H2O2 by catalase inhibits the
proliferation of HER-2/Neu-transformed rat-1 fibroblasts through the induction of a stress response.
Journal of Biological Chemistry 2001, 276(12), 9558-9564.
140. Qian, B., Deng, Y., Im, J. H., Muschel, R. J., Zou, Y., Li, J., and Pollard, J. W. A distinct macrophage
population mediates metastatic breast cancer cell extravasation, establishment and growth. PLoS One
2009, 4(8), e6562.

86
141. Quintana, E., Shackleton, M., Sabel, M. S., Fullen, D. R., Johnson, T. M., and Morrison, S. J. Efficient
tumour formation by single human melanoma cells. Nature 2008, 456(7222), 593-598.
142. Quintana, Elsa Mark Shackleton, Hannah R. Foster, Douglas R. Fullen, Michael S. Sabel, Timothy M.
Johnson, and Sean J. Morrison. "Phenotypic heterogeneity among tumorigenic melanoma cells from
patients that is reversible and not hierarchically organized." Cancer Cell 2010, 18 (5): 510-523.
143. Rajagopalan, S., Meng, X. P., Ramasamy, S., Harrison, D. G., and Galis, Z. S. Reactive oxygen species
produced by macrophage-derived foam cells regulate the activity of vascular matrix metalloproteinases
in vitro. Implications for atherosclerotic plaque stability. Journal of Clinical Investigation 1996, 98(11),
2572.
144. Reya, T., Morrison, S. J., Clarke, M. F., and Weissman, I. L. Stem cells, cancer, and cancer stem cells.
Nature 2001, 414(6859), 105-111.
145. Ricci-Vitiani, L., Lombardi, D. G., Pilozzi, E., Biffoni, M., Todaro, M., Peschle, C., and De Maria, R.
Identification and expansion of human colon-cancer-initiating cells. Nature 2006, 445(7123), 111-115.
146. Rodriguez, L. G., Wu, X., and Guan, J. L. Wound-healing assay. In Cell Migration 2005 (pp. 23-29).
Humana Press.
147. Rofstad EK, Galappathi K, Mathiesen B, Ruud EB. Fluctuating and diffusion-limited hypoxia in
hypoxia-induced metastasis. Clin. Cancer Res. 2007, 13:1971–1978.
148. Ronnov-Jessen, L., Petersen, O. W., and Bissell, M. J. Cellular changes involved in conversion of
normal to malignant breast: importance of the stromal reaction. Physiological Reviews 1996, 76(1),
69-125.
149. Rosenthal, E., McCrory, A., Talbert, M., Young, G., Murphy‐Ullrich, J., and Gladson, C. Elevated
expression of TGF‐β1 in head and neck cancer–associated fibroblasts. Molecular Carcinogenesis
2004, 40(2), 116-121.
150. Sakariassen, P. Ø., Immervoll, H., and Chekenya, M Cancer stem cells as mediators of treatment
resistance in brain tumors: status and controversies. Neoplasia (New York, NY) 2007, 9(11), 882.
151. Schmidt, S. M., Schag, K., Müller, M. R., Weck, M. M., Appel, S., Kanz, L., and Brossart, P. Survivin
is a shared tumor-associated antigen expressed in a broad variety of malignancies and recognized by
specific cytotoxic T cells. Blood 2003, 102(2), 571-576.
87
152. Schumacker, P. T. Reactive oxygen species in cancer cells: live by the sword, die by the sword. Cancer
Cell 2006, 10(3), 175-176.
153. Secomb, T. W., Hsu, R., Dewhirst, M. W., Klitzman, B., and Gross, J. F. Analysis of oxygen transport
to tumor tissue by microvascular networks. International Journal of Radiation Oncology* Biology*
Physics 1993, 25(3), 481-489.
154. Semenza, Gregg. L. HIF-1: upstream and downstream of cancer metabolism. Current Opinion in
Genetics and Development, 2010, 20(1), 51-56
155. Shackleton, M., Quintana, E., Fearon, E. R., and Morrison, S. J. Heterogeneity in cancer: cancer stem
cells versus clonal evolution. Cell 2009, 138(5), 822-829.
156. Shimoda, M., Mellody, K. T., and Orimo, A. Carcinoma-associated fibroblasts are a rate-limiting
determinant for tumour progression. In Seminars in cell and developmental biology 2010(Vol. 21, No.
1, pp. 19-25). Academic Press.
157. Shmelkov, S. V., Butler, J. M., Hooper, A. T., Hormigo, A., Kushner, J., Milde, T., and Rafii, S. CD133
expression is not restricted to stem cells, and both CD133+ and CD133–metastatic colon cancer cells
initiate tumors. The Journal of Clinical Investigation 2008, 118(6), 2111.
158. Sia, S. K., Whitesides, G. M. Microfluidic devices fabricated in poly (dimethylsiloxane) for biological
studies. Electrophoresis 2003, 24(21), 3563-3576.
159. Singh, S. K., Hawkins, C., Clarke, I. D., Squire, J. A., Bayani, J., Hide, T., and Dirks, P. B.
Identification of human brain tumour initiating cells. Nature 2004, 432(7015), 396-401.
160. Sieuwerts, A. M., Klijn, J. G., and Foekens, J. A. Assessment of the invasive potential of human
gynecological tumor cell lines with the in vitro Boyden chamber assay: influences of the ability of cells
to migrate through the filter membrane. Clinical and Experimental Metastasis 1997, 15(1), 53-62.
161. Sorg BS, Moeller BJ, Donovan O, Cao Y, Dewhirst MW. Hyperspectral imaging of hemoglobin
saturation in tumor microvasculature and tumor hypoxia development. J Biomed Opt 2005, 10: 44004.
162. Stackpole, C. W. Distinct lung-colonizing and lung-metastasizing cell populations in B16 mouse
melanoma. Nature 1981, 298,798-80
163. "Stages of Breast Cancer." BREASTCANCER.ORG. Breastcancer.org, 19 Sept. 2012. Web. 16 Apr.
2013. http://www.breastcancer.org/symptoms/diagnosis/stages

88
164. Subarsky P, Hill RP. Graded hypoxia modulates the invasive potential of HT1080 fibrosarcoma and
MDA MB231 carcinoma cells. Clin Exp Metastasis 2008; 25: 253-264
165. Thiery, J. P. Epithelial–mesenchymal transitions in development and pathologies. Current Opinion in
Cell Biology 2003, 15(6), 740-746.
166. Thiery, J. P., Acloque, H., Huang, R. Y., and Nieto, M. A. Epithelial-mesenchymal transitions in
development and disease. Cell 2009, 139(5), 871-890.
167. Thomas, D. A., Massagué, J. TGF-β directly targets cytotoxic T cell functions during tumor evasion of
immune surveillance. Cancer Cell 2005, 8(5), 369-380.
168. T. Gohongi, D. Fukumura, Y. Boucher, C.O. Yun, G.A. Soff, C. Compton, T. Todoroki, R.K. Jain.
Tumor-host interactions in the gallbladder suppress distal angiogenesis and tumor growthinvolvement
of transforming growth factor beta1. Nat. Med.1999, 5: 1203–1208
169. Ushio-Fukai, M. Redox signaling in angiogenesis: role of NADPH oxidase. Cardiovascular Research
2006, 71(2), 226-235.
170. Vaage, J. Metastasizing potentials of mouse mammary tumors and their metastases. International
Journal of Cancer 1988, 41(6), 855-858.
171. Van der Meer, A. D., Vermeul, K., Poot, A. A., Feijen, J., and Vermes, I. A microfluidic wound-healing
assay for quantifying endothelial cell migration. American Journal of Physiology-Heart and
Circulatory Physiology 2010, 298(2), H719-H725.
172. Van Wetering, S., van Buul, J. D., Quik, S., Mul, F. P., Anthony, E. C., ten Klooster, J. P., and Hordijk, P.
L. Reactive oxygen species mediate Rac-induced loss of cell-cell adhesion in primary human
endothelial cells. Journal of Cell Science 2002, 115(9), 1837-1846.
173. Vaupel P, Hockel M, Mayer A. Detection and Characterization of Tumor Hypoxia Using PO2
Histography. Antioxid Redox Signal 2007, 9(8): 1221–1235.
174. Vogelstein, B., Kinzler, K. W. Cancer genes and the pathways they control. Nature Medicine 2004,
10(8), 789-799.
175. Walenta, S., Wetterling, M., Lehrke, M., Schwickert, G., Sundfør, K., Rofstad, E. K., and
Mueller-Klieser, W. High lactate levels predict likelihood of metastases, tumor recurrence, and
restricted patient survival in human cervical cancers. Cancer Research 2000, 60(4), 916-921.

89
176. Walenta, S., and Mueller-Klieser, W. F. Lactate: mirror and motor of tumor malignancy. In Seminars in
radiation oncology 2004 (Vol. 14, No. 3, pp. 267-274). WB Saunders.
177. Wang, L., Zhu, J., Deng, C., Xing, W. L., and Cheng, J. An automatic and quantitative on-chip cell
migration assay using self-assembled monolayers combined with real-time cellular impedance sensing.
Lab on a Chip 2008, 8(6), 872-878.
178. Weigelt, B., Peterse, J. L., and van't Veer, L. J. Breast cancer metastasis: markers and models. Nature
Reviews Cancer 2005, 5(8), 591-602.
179. Weitzman, S. A., Weitberg, A. B., Clark, E. P., and Stossel, T. P. Phagocytes as carcinogens: malignant
transformation produced by human neutrophils. Science 1985, 227(4691), 1231-1233.
180. Wiseman, H., Kaur, H., and Halliwell, B. DNA damage and cancer: measurement and mechanism.
Cancer Letters 1995, 93(1), 113-120.
181. Wiseman, H., and Halliwell, B. Damage to DNA by reactive oxygen and nitrogen species: role in
inflammatory disease and progression to cancer. Biochem 1996. J, 313, 17-29.
182. Wong, Carmen Chak-Lui, Daniele M. Gilkes, Huafeng Zhang, Jasper Chen, Hong Wei, Pallavi
Chaturvedi, Stephanie I. Fraley, Hypoxia-inducible factor 1 is a master regulator of breast cancer
metastatic niche formation. Proceedings of the National Academy of Sciences 2011, 108(39):
16369-16374.
183. Yabu, M., Shime, H., Hara, H., Saito, T., Matsumoto, M., Seya, T. and Inoue, N. IL-23-dependent
and-independent enhancement pathways of IL-17A production by lactic acid. International
Immunology 2010, 23(1), 29-41.
184. Yachida, S., Jones, S., Bozic, I., Antal, T., Leary, R., Fu, B., and Iacobuzio-Donahue, C. A. Distant
metastasis occurs late during the genetic evolution of pancreatic cancer. Nature 2010, 467(7319),
1114-1117.
185. Yamaura, H., and Matsuzawa, T. Tumour regrowth after irradiation: an experimental approach.
International Journal of Radiation Biology 1979, 35(3), 201-219.
186. Yoshikawa, T., Kokura, S., Oyamada, H., Iinuma, S., Nishimura, S., Kaneko, T., and Kondo, M.
Antitumor effect of ischemia-reperfusion injury induced by transient embolization. Cancer Research
1994, 54(19), 5033-5035.

90
187. Ziebart, T., Walenta, S., Kunkel, M., Reichert, T. E., Wagner, W., and Mueller-Klieser, W. Metabolic
and proteomic differentials in head and neck squamous cell carcinomas and normal gingival tissue.
Journal of Cancer Research and Clinical Oncology 2011, 137(2), 193-199.
91
Chapter 2
1. Bonuccelli, G., Tsirigos, A., Whitaker-Menezes, D., Pavlides, S., Pestell, R. G., Chiavarina, B., and
Lisanti, M. P. Ketones and lactate “fuel” tumor growth and metastasis: Evidence that epithelial cancer
cells use oxidative mitochondrial metabolism. Cell Cycle 2010, 9(17), 3506-3514.
2. Chen, Development of Microfluidic Devices for Long-term Cell Culture and High-Throughput Clonal
Analysis (Doctoral dissertation, The University of New South Wales).2012
3. Goetze, K., Walenta, S., Ksiazkiewicz, M., Kunz-Schughart, L. A., and Mueller-Klieser, W. Lactate
enhances motility of tumor cells and inhibits monocyte migration and cytokine release. International
Journal of Oncology 2011, 39(2), 453-463.
4. Kim, L., Toh, Y. C., Voldman, J., and Yu, H. A practical guide to microfluidic perfusion culture of
adherent mammalian cells. Lab on a Chip 2007, 7(6), 681-694.
5. Kim, L. Y. Microfluidic perfusion culture for controlling the stem cell microenvironment (Doctoral
dissertation, Massachusetts Institute of Technology).2008
6. Martinez-Outschoorn, U. E., Prisco, M., Ertel, A., Tsirigos, A., Lin, Z., Pavlides, S., and Lisanti, M. P.
Ketones and lactate increase cancer cell “stemness,” driving recurrence, metastasis and poor clinical
outcome in breast cancer: achieving personalized medicine via Metabolo-Genomics. Cell Cycle 2011,
10(8), 1271-1286.
7. Su, X., Theberge, A. B., January, C. T., and Beebe, D. J. Effect of Microculture on Cell Metabolism
and Biochemistry: Do Cells Get Stressed in Microchannels?. Analytical Chemistry 2013, 85(3),
1562-1570.
8. Yamamoto, K., Sokabe, T., Watabe, T., Miyazono, K., Yamashita, J. K., Obi, S., and Ando, J. Fluid
shear stress induces differentiation of Flk-1-positive embryonic stem cells into vascular endothelial
cells in vitro. American Journal of Physiology-Heart and Circulatory Physiology 2005, 288(4),
H1915-H1924.
9. Sung, J. H., Shuler, M. L. Prevention of air bubble formation in a microfluidic perfusion cell culture
system using a microscale bubble trap. Biomedical Microdevices 2009, 11(4), 731-738.
10. Alfarouk, K. O., Muddathir, A. K., and Shayoub, M. E. Tumor acidity as evolutionary spite. Cancers
2011, 3(1), 408-414.

92
Chapter 3
1. Adler M, Polinkovsky M, Gutierrez E, Groisman A. Generation of oxygen gradients with arbitrary
shapes in a microfluidic device. Lab Chip 2010; 10: 388-391.
2. Braun, R. D., Lanzen, J. L., and Dewhirst, M. W. Fourier analysis of fluctuations of oxygen tension
and blood flow in R3230Ac tumors and muscle in rats. American Journal of Physiology-Heart and
Circulatory Physiology 1999, 277(2), H551-H568.
3. Cairns RA, Hill RP. Acute hypoxia enhances spontaneous lymph node metastasis in an orthotopic
murine model of human cervical carcinoma. Cancer Res 2004; 64: 2054-2061.
4. Chaw KC, Manimaran M, Tay FEH, Swaminathan S. A quantitative observation and imaging of single
tumor cell migration and deformation using a multi-gap microfluidic device representin the blood
vessel. Microvasc Res 2006; 72: 153-160.
5. Chaw KC, Manimaran M, Tay EH, Swaminathan S. Multi-step microfluidic device for studying cancer
metastasis. Lab Chip 2007; 7: 1041-1047.
6. Dai Y, Bae K, Siemann DW. Impact of hypoxia on the metatatic potential of human prostate cancer
cells. Int J Radiat Oncol Biol Phys 2011; 81: 521-528
7. Dewhirst, M. W., Cao, Y., and Moeller, B. Cycling hypoxia and free radicals regulate angiogenesis and
radiotherapy response. Nature Reviews Cancer 2008, 8(6), 425-437.
8. Hill RP, Marie-Egyptienne DT, Hedley DW. Cancer stem cells, hypoxia and metastasis. Semin Radiat
Oncol 2009; 19: 106-111.
9. Hsieh, C. H., Chang, H. T., Shen, W. C., Shyu, W. C., and Liu, R. S. Imaging the impact of Nox4 in
cycling hypoxia-mediated U87 glioblastoma invasion and infiltration. Molecular Imaging and Biology
2012, 14(4), 489-499.
10. Jessup JM, Battle P, Waller H, Edmiston KH, Stolz DB, Watkins SC, Locker J, Skena K. Reactive
nitrogen and oxygen radicals formed during hepatic ischemia-reperfusion kill weakly metastatic
colorectal cancer cells. Cancer Res 1999; 59: 1825-1829.
11. Kim HJ, Lee HJ, Jun JI, Choi SG, Kim H, Chung CW, Kim IK, Park IS, Chee HJ, Kim HR, Jung YK.
Intracellular cleavage of osteopontin by caspase-8 modulates hypoxia/reoxygenation cell death through
p53. Proc Natl Acad Sci U S A 2009; 106: 15326-15331.

93
12. Kim, M. C., Lam, R. H., Thorsen, T., and Asada, H. H. Mathematical analysis of oxygen transfer
through polydimethylsiloxane membrane between double layers of cell culture channel and gas
chamber in microfluidic oxygenator. Microfluidics and Nanofluidics 2013, 1-12.
13. Kimura, H., Braun, R. D., Ong, E. T., Hsu, R., Secomb, T. W., Papahadjopoulos, D., and Dewhirst, M.
W. Fluctuations in red cell flux in tumor microvessels can lead to transient hypoxia and reoxygenation
in tumor parenchyma. Cancer Research 1996, 56(23), 5522-5528.
14. Oppegard SC, Nam KH, Carr JR, Skaalure SC, Eddington DT. Modulating temporal and spatial
oxygenation over adherent cellular cultures. PLoS ONE 2009; 4: e6891.
15. Parkins CS, Dennis MF, Stratford MRL, Hill SA, Chaplin DJ. Ischemia-reperfusion injury in tumors:
The role of oxygen radicals and nitric oxide. Cancer Res 1995; 55: 6026-6029.
16. Polinkovsky M, Gutierrez E, Levchenko A, Groisman A. Fine temporal control of the medium gas
content and acidity and on-chip generation of series of oxygen concentrations for cell cultures. Lab on
a Chip 2009; 9: 1073-1084.
17. Said HM, Katzer A, Flentje M, Vordermark D. Response of the plasma hypoxia marker osteopontin to
in vitro hypoxia in human tumor cells. Radiother Oncol 2005; 76: 200-205.
18. Subarsky P, Hill RP. Graded hypoxia modulates the invasive potential of HT1080 fibrosarcoma and
MDA MB231 carcinoma cells. Clin Exp Metastasis 2008; 25: 253-264
19. Vaupel P, Mayer A, Hockel M. Tumor hypoxia and malignant progression. Methods Enzymol 2004;
381: 335-354
20. Vaupel P, Hockel M, Mayer A. Detection and Characterization of Tumor Hypoxia Using PO2
Histography. Antioxid Redox Signal 2007, 9(8): 1221–1235.
21. Vaupel, P. Metabolic microenvironment of tumor cells: a key factor in malignant progression. Exp
Oncol 2010, 32(3), 125-127.
22. Yoshikawa T, Kokura S, Oyamada H, Iinuma S, Nishimura S, Kaneko T, Naito Y, Kondo M. Antitumor
effect of ischemia-reperfusion injury induced by transient embolization. Cancer Res 1994; 54:
5033-5035.
23. Young, E. Cells, Tissues, and Organs on Chips: Challenges and Opportunities for the Cancer Tumor
Microenvironment. Integr. Biol.2013
24. Boyden, S. The chemotactic effect of mixtures of antibody and antigen on polymorphonuclear
leucocytes. The Journal of Experimental Medicine 1962, 115(3), 453-466.

94
25. Sieuwerts, A. M., Klijn, J. G., and Foekens, J. A. Assessment of the invasive potential of human
gynecological tumor cell lines with the in vitro Boyden chamber assay: influences of the ability of
cells to migrate through the filter membrane. Clinical and Experimental Metastasis 1997, 15(1), 53-62.
26. Muir, D., Sukhu, L., Johnson, J., Lahorra, M. A., and Maria, B. L. Quantitative methods for scoring
cell migration and invasion in filter-based assays. Analytical Biochemistry 1993, 215(1), 104-109.
27. Li, Y. H., and Zhu, C. A modified Boyden chamber assay for tumor cell transendothelial migration in
vitro. Clinical and Experimental Metastasis 1999, 17(5), 423-429.
28. Zhong, M., Shen, Y., Zheng, Y., Joseph, T., Jackson, D., and Foster, D. A. Phospholipase D prevents
apoptosis in v-Src-transformed rat fibroblasts and MDA-MB-231 breast cancer cells. Biochemical and
Biophysical Research Communications 2008, 302(3), 615-619.