About the research - Rural Bank · Jan Feb Mar Apr May Jun Jul Aug Sep Oct Nov Dec 5yr ave 2016...
12
Transcript of About the research - Rural Bank · Jan Feb Mar Apr May Jun Jul Aug Sep Oct Nov Dec 5yr ave 2016...

This report is intended to provide general information on a particular subject or subjects and is not an exhaustive treatment of such subject(s).The information herein is believed to be reliable and has been obtained from public sources believed to be reliable. Rural Bank Limited, ABN 74 083 938416 AFSL / Australian Credit Licence 238042 makes no representation as to or accepts any responsibility for the accuracy or completeness of information contained in this report. Any opinions, estimates and projections in this report do not necessarily reflect the opinions of Rural Bank and are subject to change without notice. Rural Bank has no obligation to update, modify or amend this report or to otherwise notify a recipient thereof in the event that any opinion, forecast or estimate set forth therein, changes or subsequently becomes inaccurate. This report is provided for informational purposes only. The information contained in this report does not take into account your personal circumstances and should not be relied upon without consulting your legal, financial, tax or other appropriate professional.© Copyright Rural Bank Ltd ABN 74 083 938 416 and Bendigo and Adelaide Bank Ltd ABN 11 068 049 178 (RBL19327) (11/18)
About the research
The Australian Cattle Annual Review includes data and outlooks on factors affecting Australian and international cattle markets, such as production, seasonal conditions, prices and demand. Significant effort has been taken to secure the most recent data available.
About Ag Answers
Ag Answers is a specialist insights division of Rural Bank. Recognising that good information is the key to making good business decisions, Ag Answers provides research and analysis into commodities, farmland values, farm business performance and topical agricultural issues to enable farmers to make informed decisions.
About Rural Bank
Rural Bank has been a wholly-owned subsidiary of Bendigo and Adelaide Bank Limited since 2010. It is the only Australian-owned and operated dedicated agribusiness bank in the country, providing exceptional financial services, knowledge and leadership for Australian farmers to grow.
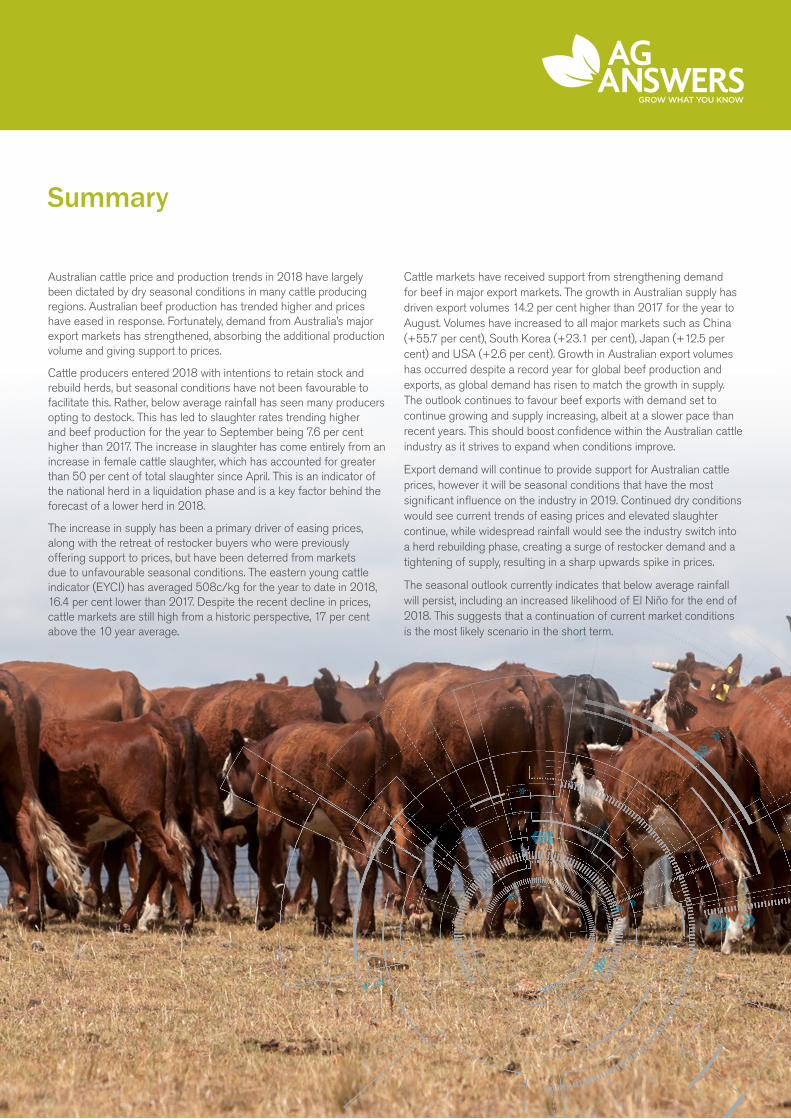
Australian cattle price and production trends in 2018 have largely been dictated by dry seasonal conditions in many cattle producing regions. Australian beef production has trended higher and prices have eased in response. Fortunately, demand from Australia’s major export markets has strengthened, absorbing the additional production volume and giving support to prices.
Cattle producers entered 2018 with intentions to retain stock and rebuild herds, but seasonal conditions have not been favourable to facilitate this. Rather, below average rainfall has seen many producers opting to destock. This has led to slaughter rates trending higher and beef production for the year to September being 7.6 per cent higher than 2017. The increase in slaughter has come entirely from an increase in female cattle slaughter, which has accounted for greater than 50 per cent of total slaughter since April. This is an indicator of the national herd in a liquidation phase and is a key factor behind the forecast of a lower herd in 2018.
The increase in supply has been a primary driver of easing prices, along with the retreat of restocker buyers who were previously offering support to prices, but have been deterred from markets due to unfavourable seasonal conditions. The eastern young cattle indicator (EYCI) has averaged 508c/kg for the year to date in 2018, 16.4 per cent lower than 2017. Despite the recent decline in prices, cattle markets are still high from a historic perspective, 17 per cent above the 10 year average.
Cattle markets have received support from strengthening demand for beef in major export markets. The growth in Australian supply has driven export volumes 14.2 per cent higher than 2017 for the year to August. Volumes have increased to all major markets such as China (+55.7 per cent), South Korea (+23.1 per cent), Japan (+12.5 per cent) and USA (+2.6 per cent). Growth in Australian export volumes has occurred despite a record year for global beef production and exports, as global demand has risen to match the growth in supply. The outlook continues to favour beef exports with demand set to continue growing and supply increasing, albeit at a slower pace than recent years. This should boost confidence within the Australian cattle industry as it strives to expand when conditions improve.
Export demand will continue to provide support for Australian cattle prices, however it will be seasonal conditions that have the most significant influence on the industry in 2019. Continued dry conditions would see current trends of easing prices and elevated slaughter continue, while widespread rainfall would see the industry switch into a herd rebuilding phase, creating a surge of restocker demand and a tightening of supply, resulting in a sharp upwards spike in prices.
The seasonal outlook currently indicates that below average rainfall will persist, including an increased likelihood of El Niño for the end of 2018. This suggests that a continuation of current market conditions is the most likely scenario in the short term.
Summary

Seasonal conditions
Australian cattle producers have been challenged by dry conditions in 2018 with significant rainfall deficiencies recorded in many cattle regions, particularly New South Wales and Queensland. After a dry autumn and winter, spring has so far provided no relief, just the driest September on record for Australia. The year to date has also been very warm with the second warmest average maximum temperature on record.
The combination of low rainfall and warm temperatures has reduced soil moisture and led to deteriorating pasture conditions. Supplementary feed costs have also been affected by poor seasonal conditions. The 2018/19 grain season is expected to yield the smallest winter crop production in a decade. This is forecast to keep supplementary feed costs high.
Many producers have responded to seasonal conditions by reluctantly reducing herd sizes, putting a halt to the herd rebuilding activity that began in late 2016. Producers will be focused on managing their remaining stock until conditions improve but will be eagerly awaiting significant and widespread rainfall to allow them to resume herd rebuilding. Northern producers in particular will be looking for a good wet season to improve their prospects for 2019. The anticipation of conditions that will allow for herd rebuilding makes seasonal conditions the major factor driving the cattle industry outlook.
Recent rainfall deciles Aug to Oct 2018
Source: Bureau of Meteorology, 2018
Rainfall Decile Ranges
Highest on record
Very much above average
Above average
Average
Below average
Very much below average
lowest on record
10
8-9
4-7
2-3
1
Cha
nce
of e
xcee
ding
med
ian
rain
fall
(%)
Chance of above median rainfall outlook Dec 2018 to Feb 2019
Source: Bureau of Meteorology, 2018
80
75
70
65
60
55
50
45
40
35
30
25
20

Production – Australia
Australian beef production is higher in 2018, 7.6 per cent above 2017 for the year to September. Production growth has been driven by elevated slaughter levels, up 9.5 per cent year-on-year, a result of destocking in many regions. The increase in cattle slaughter is being driven entirely by an increase in female slaughter, up 21.8 per cent compared to a 0.8 per cent decline for bulls, bullocks and steers. This has led to female cattle slaughter accounting for 53 per cent of national slaughter between April to September. A percentage of female cattle slaughter above 47 per cent is often associated with periods of decline in Australia’s cattle herd, as observed in 2014 and 2015.
Increased slaughter will lead to a decline in the Australian cattle herd in 2018, down to 27.4 million as forecasted by Meat and Livestock Australia. This is two per cent lower than 2017 which was the first year of herd growth since 2013. The current herd is 6.5 per cent below the peak of 29.3 million set in 2013, however it is not considered low from a historic perspective, at only 1.1 per cent below
the average herd size of 27.7 million between 2003 and 2012. The industry will be aspiring to rebuild the herd towards 29 million when seasonal conditions allow in order to capture some of the opportunity arising from growing global beef consumption.
The outlook for Australian production is heavily dependent on seasonal conditions. The intent from many producers will be to resume herd rebuilding once significant rainfall is received. The northern wet season will be pivotal for northern cattle producers to determine stocking rates going into 2019. If conditions improve, it is expected that supply will tighten to allow for herd rebuilding, after which production will increase from the expanding herd. A poor northern wet season and continued low rainfall in southern areas would result in further destocking and a continued trend of higher year-on-year slaughter. The longer that dry conditions persist, the further the herd will have to rebuild and the slower the rebuild will be given the declining number of female cattle available for breeding.
‘000
tonn
es c
wt
‘000
tonn
es c
wt
230
210
900
800
700190
400
300
100
500
600
150
170
200
110
90
130
050
70
Australian beef production for Jan-Sep 2018 was 7.6 per cent higher than 2017
2018 beef production is higher in all states except SA
MayApr
Jun
Jan
AugJu
l
Sep Oct
Nov
DecFeb
Mar
20165yr ave Jan-Sep 2016
Cattle herd (LHS)
2017 Jan-Sep 2017
Cattle slaughter (RHS)
2018 Jan-Sep 2018
Data: MLAData: MLA
The Australian cattle herd is forecast to decline two per cent in 2018 due to a nine per cent increase in annual slaughter
NSWQLD VIC TAS SAWA
Data: Meat and Livestock Australia (MLA) f = MLA forecast
mill
ion
head
mill
ion
head
sla
ught
ered
20 0
21 1
22 2
23 3
24 4
25 5
27 7
26 6
28 8
29 9
30 10
20
07
201
6
20
03
201
2
20
08
201
8f
20
04
201
3
20
01
20
00
20
09
201
1
20
05
201
4
20
02
201
0
201
7
20
06
201
5

Production – International
Australian beef is being exported into a highly competitive global marketplace. This year marks a new record for global beef production at 62.9 million tonnes (USDA), a two per cent increase on 2017. The 2018 record won’t last long with production forecast to push further into record territory in 2019, albeit increasing at a slower rate of 1.2 per cent. Beef production is expected to increase in all of the top ten producing countries in 2018, of which six will achieve record production volumes which they are expected to eclipse with further growth in 2019. Despite contributions from all major producers, global production growth is overwhelmingly driven by the world’s two largest beef producers, the USA and Brazil.
The greater volume of beef being produced in the world is flowing through to exports, which are expected to increase by 5.9 per cent in 2018 to a new record high of 10.6 million tonnes. Growth in exports in 2018 has come from Brazil, Argentina, Australia and the USA, while exports from India, the second largest beef exporter, are expected to decline by 10 per cent. Global beef exports are forecast to increase by only 0.2 per cent in 2019, despite production growth. A reduction in exports from Australia (-5.2 per cent) is expected to contribute to the slowdown in growth, however it is anticipated this will be offset by greater volumes shipped from Brazil (+4.8 per cent) and Argentina (+15 per cent).
Beef production in the USA has been growing after a period of active herd rebuilding since 2015. Production for the year to September was 2.9 per cent higher than 2017 and on track to finish the year at a record high of 12.3 million tonnes (USDA). Production is expected to increase by a further 3.6 per cent in 2019. It appears that the US herd is nearing a peak and could be returning to a herd reduction phase. Production has been increasing from an expanding herd, but increased slaughter from herd liquidation would further boost supply. US beef exports for the year to September were 13.3 per cent higher than 2017, a result of increased supply. Exports from the USA are higher to South Korea (+43 per cent) and Japan (+6.3 per cent) where US beef competes directly with Australia. Annual exports for
2018 are expected to be a record 1.4 million tonnes, up 10.6 per cent from 2017. An increase in domestic consumption has also absorbed some of the additional production. US beef exports are forecast to increase by a further 2.6 per cent in 2019. With expectations of lower Australian exports in 2019, this new record volume out of the US is likely to result in the US capturing more of Australia’s market share in Japan and South Korea.
Brazilian beef production is also in expansion mode, expected to increase by 3.7 per cent in 2018 before expanding by a further three per cent in 2019. Growth in production is largely due to improving efficiency from an increasing national herd, which has grown at a steady 2.9 per cent each year since 2009. Production has been growing at a faster rate than domestic consumption, creating a greater surplus of beef available to be exported. Brazil is a major competitor to Australian beef exports in China. After exporting very low volumes of beef to China in 2014, Brazil is now the largest supplier of imported beef to China with 22 per cent market share, and benefitting from more competitive prices compared to Australia.
milli
on to
nnes
‘000
tonn
es
14 25
12
15
20
4
10
10
2
8
0
5
0
6
World beef production to increase by 1.2 per cent in 2019, led by USA and Brazil
World beef exports to increase by 0.2 per cent in 2019, led by Brazil and Argentina
201
3
201
3
201
4
201
4
201
0
201
0
201
5
201
5
201
6
201
6
201
7
201
7
201
8e
201
8e
201
9f
201
9f
201
1
201
1
201
2
201
2
USA USAChinaBrazil BrazilAustralia AustraliaIndia IndiaArgentina ArgentinaEU New Zealand
Data: United States Department of Agriculture (USDA) e = USDA estimate, f = USDA forecast
Data: United States Department of Agriculture (USDA) e = USDA estimate, f = USDA forecast

Demand and trade
Australian beef exports have increased in 2018 due to a combination of increased volume available for export as a result of higher cattle slaughter, and growing global demand for beef. For the eight months to August 2018, beef export volume was 14.2 per cent higher than 2017, with increases shared across Australia’s five major export markets. Surprisingly, the average unit value of Australian beef exports has increased by 1.2 per cent, despite the extra volume being exported from Australia and competing exporters. This has built upon the high export unit values of the last three years, indicating very strong demand. Export competitiveness is also being assisted by a low Australian dollar. The dollar has been easing for most of 2018 and averaged 71 US cents in October. The combined growth of volume and unit value has resulted in a year to date increase in export value of 15.7 per cent to $5.58 billion.
The outlook for beef demand remains favourable with global beef imports forecast to increase by 3.7 per cent in 2019. This would build upon the 5.4 per cent growth expected to be achieved in 2018, which would be a record high volume. China is driving much of this growth, accounting for 120,000 of the additional 356,000 tonnes forecasted to be shipped in 2019. Import demand from Australia’s key export markets of Japan (+1.8 per cent), USA (+2.4 per cent) and South Korea (+0.9 per cent) is also forecasted to continue growing in 2019.
China has been the stand-out export market this year, importing 53 per cent more beef from Australia compared to 2017. At the current rate of growth, China could surpass South Korea as Australia’s third most valuable export market for beef by the end of the year. China is expected to continue growing as a beef import market, with the USDA forecasting Chinese imports to increase by 10 per cent in 2019 as the gap between consumption and domestic production widens. This creates growing opportunities for Australian beef exporters, but also competitive pressure from Brazil, Argentina and New Zealand.
South Korea has re-emerged as a growth market for Australian beef exports after declining in 2017. Exports to South Korea for the year
to date have increased by 23.1 per cent in value, driven by a 13.6 per cent increase in volume and 7.3 per cent lift in average export unit value. Despite this growth, Australia is losing market share to the US which held 48.9 per cent of the South Korean beef import in the first seven months of 2018, compared to Australia’s 44.1 per cent market share. US beef is the preferred choice in South Korea due to competitive pricing, assisted by a 5.3 per cent tariff advantage over Australia. Both countries have free trade agreements with South Korea which include the phasing out of tariffs on beef, however the US agreement is two years ahead of Australia on tariff reductions. Australian beef exports also become subject to a safeguard tariff of 40 per cent for exports beyond 164,046 tonnes which is expected to be triggered in November, as it was in 2017, rendering Australian beef more uncompetitive compared to US beef. Nonetheless, South Korea will remain an important market for Australian beef exports in 2019.
Japan is Australia’s most valuable market for beef exports and is set to become a $2 billion export market in 2018, a mark not reached since 2008. Exports have grown by 14 per cent in value for the year to August, largely due to a 12.5 per cent increase in export volume. The US is the other major beef exporter to Japan, however unlike South Korea, Australia holds a tariff advantage over the US in Japan. This advantage is set to widen under the Japan Australia Economic Partnership Agreement, and will improve further under the Comprehensive and Progressive Trans-Pacific Partnership which will see an acceleration of tariff reductions when it comes into effect in 2019. This should further improve the competitiveness of Australian beef into the growing Japanese market.
The US has increased its purchasing of Australian beef in 2018 after being a declining market for exports in the 2016 and 2017. The value of exports was 2.6 per cent higher for the year to August, due to a combination of increased volume and average unit value. Improved economic conditions in the US saw beef consumption increase, absorbing some of growth in domestic production but also requiring an increase in imports. This is set to continue in 2019 with imports forecast to grow by 2.4 per cent.
‘000
tonn
es s
wt
‘000
tonn
es
250 16
200
8
12
150
4
100
00
50
Beef export volumes from Australia are trending higher to all major markets
World beef imports to increase by 3.7 per cent in 2019, led by China and Hong Kong
201
3
201
4
201
0Japan USA China IndonesiaSouth Korea 2
015
201
6
201
7
201
8e
201
9f
201
1
201
2
Jan-Aug 2016 USAJan-Aug 2017 China Hong Kong South KoreaJan-Aug 2018 Japan
Data: MLAData: MLA

Export markets – country detail
Destination country 2015 2016 2017 2017 Change
2017 % Share
Jan-Aug 2017
Jan-Aug 2018
2018 YTD Change
Volume of beef exported (‘000 tonnes swt)
World 1,317 1,048 1,050 0.2% 675 771 14.2%
Japan 279 262 290 10.4% 27.6% 188 212 12.5%
USA 418 240 231 -3.6% 22.0% 156 158 1.2%
South Korea 182 196 162 -17.2% 15.5% 104 118 13.6%
China 151 98 117 18.5% 11.1% 71 109 53.4%
Indonesia 40 64 57 -10.3% 5.5% 38 47 22.7%
Value of beef exported (A$millions)
World 9,296 7,401 7,451 0.7% 4,817 5,576 15.7%
Japan 1,887 1,810 1,991 10.0% 26.7% 1,304 1,487 14.0%
USA 3,076 1,727 1,673 -3.1% 22.5% 1,140 1,170 2.6%
South Korea 1,244 1,359 1,099 -19.2% 14.7% 697 858 23.1%
China 1,006 670 833 24.2% 11.2% 514 800 55.7%
Indonesia 244 347 284 -18.3% 3.8% 186 225 21.1%
Unit value of beef exported (average A$/tonne)
World 7,065 7,068 7,090 0.3% 7,124 7,206 1.2%
Japan 6,756 6,913 6,862 -0.7% 6,909 6,969 0.9%
USA 7,397 7,278 7,218 -0.8% 7,274 7,408 1.8%
South Korea 6,826 6,918 6,784 -1.9% 6,743 7,237 7.3%
China 6,607 6,816 7,149 4.9% 7,203 7,291 1.2%
Indonesia 6,106 5,396 4,924 -8.8% 4,807 4,752 -1.1%
Data: GTIS swt = shipped weight
Destination country 2015 2016 2017 2017 Change
2017 % Share
Jan-Aug 2017
Jan-Aug 2018
2018 YTD Change
Number of live cattle exported (‘000 head)
World 1,258 1,068 827 -22.5% 519 663 27.7%
Indonesia 616 606 510 -15.8% 61.6% 337 366 8.6%
Vietnam 354 192 166 -13.6% 20.1% 116 134 15.4%
China 33 38 41 6.5% 4.9% 17 53 211.9%
Value of live cattle exported (A$millions)
World 1,298 1,323 1,067 -19.4% 669 819 22.4%
Indonesia 544 691 594 -13.9% 55.7% 398 382 -4.1%
Vietnam 403 286 241 -15.5% 22.6% 169 196 16.2%
China 62 66 74 12.7% 7.0% 31 98 221.4%
Unit value of live cattle exported (average A$/head)
World 1,050 1,248 1,297 3.9% 1,298 1,237 -4.7%
Indonesia 887 1,130 1,176 4.1% 1,193 1,063 -10.9%
Vietnam 1,161 1,499 1,462 -2.5% 1,465 1,446 -1.3%
China 1,910 1,802 1,922 6.6% 1,929 1,908 -1.1%
Prices
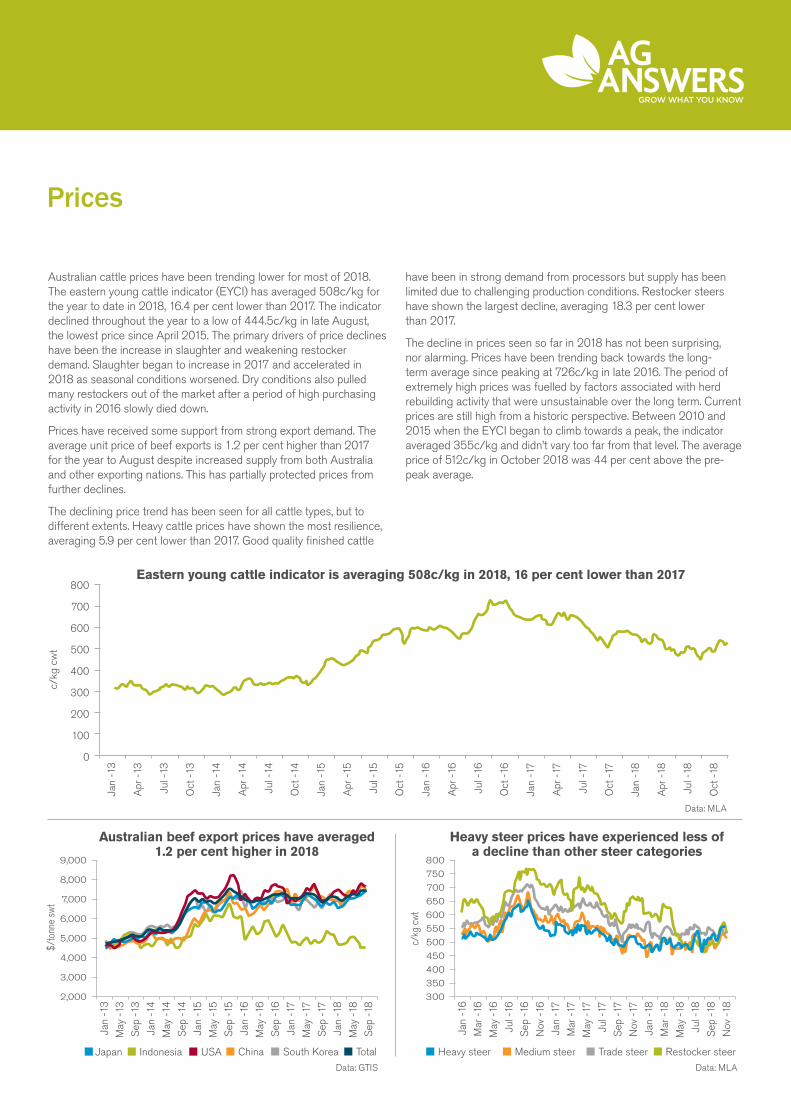
Australian cattle prices have been trending lower for most of 2018. The eastern young cattle indicator (EYCI) has averaged 508c/kg for the year to date in 2018, 16.4 per cent lower than 2017. The indicator declined throughout the year to a low of 444.5c/kg in late August, the lowest price since April 2015. The primary drivers of price declines have been the increase in slaughter and weakening restocker demand. Slaughter began to increase in 2017 and accelerated in 2018 as seasonal conditions worsened. Dry conditions also pulled many restockers out of the market after a period of high purchasing activity in 2016 slowly died down.
Prices have received some support from strong export demand. The average unit price of beef exports is 1.2 per cent higher than 2017 for the year to August despite increased supply from both Australia and other exporting nations. This has partially protected prices from further declines.
The declining price trend has been seen for all cattle types, but to different extents. Heavy cattle prices have shown the most resilience, averaging 5.9 per cent lower than 2017. Good quality finished cattle
have been in strong demand from processors but supply has been limited due to challenging production conditions. Restocker steers have shown the largest decline, averaging 18.3 per cent lower than 2017.
The decline in prices seen so far in 2018 has not been surprising, nor alarming. Prices have been trending back towards the long- term average since peaking at 726c/kg in late 2016. The period of extremely high prices was fuelled by factors associated with herd rebuilding activity that were unsustainable over the long term. Current prices are still high from a historic perspective. Between 2010 and 2015 when the EYCI began to climb towards a peak, the indicator averaged 355c/kg and didn’t vary too far from that level. The average price of 512c/kg in October 2018 was 44 per cent above the pre-peak average.
$/to
nne
swt
c/kg
cw
t
9,000 800
8,000700
750
4,000400
450
7,000 650
3,000350
6,000550
600
2,000 300
5,000 500
Australian beef export prices have averaged 1.2 per cent higher in 2018
Heavy steer prices have experienced less of a decline than other steer categories
Eastern young cattle indicator is averaging 508c/kg in 2018, 16 per cent lower than 2017
Data: MLA
Data: MLAData: GTIS
c/kg
cw
t
0
100
200
300
400
500
700
600
800
Oct
-14
May
-15
Mar
-17
Oct
-16
Oct
-13
Jan
-14
Jul -
16
Oct
-15
Jan
-15
Sep
-15
May
-17
Apr
-17
Jan
-14
May
-14
Sep
-16
Jan
-16
Apr
-13
May
-13
Mar
-16
Jan
-13
Jan
-13
Jan
-16
Apr
-15
Jan
-16
Jul -
17
May
-16
Sep
-17
Sep
-16
Nov
-17
Jan
-17
Jan
-18
May
-17
Mar
-18
Sep
-17
May
-18
Jan
-18
Jul -
18
May
-18
Sep
-18
Sep
-18
Nov
-18
Jul -
17
Apr
-14
Sep
-14
Nov
-16
Apr
-16
Jul -
13
Sep
-13
May
-16
Jul -
15
Oct
-17
Jan
-18
Apr
-18
Jul -
18
Oct
-18
Jan
-17
Jul -
14
Jan
-15
Jan
-17
Jul -
16
Japan China Medium steer Trade steer Restocker steerHeavy steerIndonesia TotalSouth KoreaUSA

Prices – outlook
The outlook for cattle prices is highly dependent on seasonal conditions, particularly in Queensland and northern NSW. This is the primary factor affecting the outlook given that many producers are waiting for conditions that will allow them to resume herd rebuilding, while dealing with the challenge of maintaining existing herds while dry conditions persist.
Prices are likely to continue easing for as long as dry conditions persist, with ongoing elevated slaughter and weak demand for young cattle. A poor wet season in northern regions would be a key contributor to this by further restricting stocking rates, leading to another rise in slaughter rates and low demand from restockers and feeders. This scenario, which seems likely under the current climate outlook, would potentially see the EYCI follow the lower 68 per cent confidence interval of the Rural Bank forecast model. The downwards pressure on prices could be partially offset and supported by a favourable outlook from an export perspective, with strong demand from China, Japan and South Korea expected to be able to absorb any increase in production.
It seems inevitable that cattle markets will see a dramatic turn once significant and widespread rainfall is received. An improvement in seasonal conditions would see the industry switch back into a herd rebuilding phase, which would include stock retention rather than stock turnoff and a surge in demand from restockers to add to processor and feedlot buyers. This is what was observed in 2015 and 2016 and sparked a surge in prices to record levels. Although the market is likely to start this change in trend from a higher price level than 2015, there is no guarantee that prices will return to a level above 700c/kg but could follow the upper 95 per cent confidence interval of the Rural Bank forecast model.
The expected rise in cattle prices following widespread rainfall will reward producers who will have young stock to sell, and those who have been able to manage herds through dry conditions, but also challenge producers purchasing young stock to begin rebuilding herds.
Eastern young cattle indicator
Data: MLA, Rural Bank forecast
c/kg
cw
t
100
200
300
400
500
700
600
800
May
-13
Jan
-16
Jan
-12
Sep
-14
Sep
-13
Sep
-16
May
-12
Jan
-15
May
-11
Jan
-11
Jan
-14
Jan
-17
Sep
-12
May
-15
Sep
-11
May
-14
May
-17
Sep
-17
Jan
-18
May
-18
Sep
-18
Jan
-19
May
-19
May
-16
Jan
-13
Sep
-15
95% confidence interval68% confidence interval

Prices – state detail
Data: MLA, Reserve Bank of Australia cwt - carcass weight lwt - live weight
State Type Price 20th
November November 2017 Five year average 80Th percentile 20Th percentile
Young cattle indicators (C/KG cwt)EYCI 525 578 512 619 361WYCI 549 572 551 631 469
Saleyard Indicators (C/KG Lwt)NSW Trade steer 296 305 287 333 208
Medium steer 271 282 263 306 197Medium cow 201 220 194 229 157Heavy steer 290 282 266 302 203
Qld Trade steer 310 293 271 322 200Medium steer 286 295 252 295 195Medium cow 234 220 195 232 161Heavy steer 306 290 258 295 205
SA Trade steer 258 266 269 322 199Medium steer 270 280 271 312 229Medium cow 200 230 189 233 133
Tas Trade steer 296 306 260 317 188Medium cow 186 218 190 233 146
Vic Trade steer 277 301 280 331 207Medium steer 278 283 264 310 194Medium cow 199 214 198 233 156Heavy steer 287 282 268 310 202
WA Trade steer 308 310 291 316 249Medium steer 269 261 275 304 244Medium cow 200 184 199 223 171Heavy steer 262 238 260 287 229
Live export cattle (C/KG lwt)NT Light feeder steers 330 330 297 340 248
USA prices90CL import price (Ac/kg cif) 560 619 596 647 553
Feeder steers (Usc/lb lwt) 148 158 170 213 142Australian dollar
AUD/USD 0.73 0.76 0.79 0.86 0.74
Primary sources:Bureau of Meteorology, 2018, Australian NDVI standardised anomaly map, accessed November 2018.Bureau of Meteorology, 2018, Australian rainfall decile map, accessed November 2018.Bureau of Meteorology, 2018, Australian rainfall outlook map, accessed November 2018.Bureau of Meteorology, 2018, Australian relative soil moisture map, accessed November 2018.Global Trade Information Service, 2018, Global Trade Atlas, accessed November 2018.Meat and Livestock Australia, 2018, Statistics Database, accessed November 2018.Meat and Livestock Australia, 2018, Industry Projections Australian Cattle – October Update, accessed October 2018.United States Department of Agriculture, 2018, Livestock and Poultry: World Markets and Trade, accessed October 2018.United States Department of Agriculture, 2018, Red meat and poultry production, accessed November 2018.United States Department of Agriculture, 2018, Monthly U.S. Livestock and Meat Trade by Country, accessed November 2018.

For report enquiries:
AG ANSWERSP 1300 796 101 E [email protected]
For banking enquiries:
RURAL BANK P 1300 660 115 W ruralbank.com.au
ELDERSP 1300 618 367E [email protected]