About the authors - epi.org.uk · performance of disadvantaged pupils in England and the gap...
40
1
Transcript of About the authors - epi.org.uk · performance of disadvantaged pupils in England and the gap...

1

2
About the authors
John Jerrim is Professor of Social Statistics at UCL Institute of Education. He conducted all PISA-
related statistical analysis for this publication, and contributed to the writing of the report.
Toby Greany is Professor of Leadership and Innovation at UCL Institute of Education. He provided
the summary of the international evidence on closing socio-economic achievement gaps.
Natalie Perera is Executive Director at EPI. She provided editorial oversight of this report and wrote
the executive summary and policy conclusions
Acknowledgements
The authors are grateful to Jo Hutchinson and David Laws for their comments on the report.
About the Education Policy Institute
The Education Policy Institute is an independent, impartial, and evidence-based research institute
that aims to promote high quality education outcomes, regardless of social background. We achieve
this through data-led analysis, innovative research and high-profile events.
Education can have a transformative effect on the life chances of young people, enabling them to
fulfil their potential, have successful careers, and grasp opportunities. As well as having a positive
impact on the individual, good quality education and child wellbeing also promotes economic
productivity and a cohesive society.
Through our research, we provide insight, commentary, and a constructive critique of education
policy in England – shedding light on what is working and where further progress needs to be made.
Our research and analysis spans a young person's journey from the early years through to entry to
the labour market.
Our core research areas include:
Benchmarking English Education
School Performance, Admissions, and Capacity
Early Years Development
Vulnerable Learners and Social Mobility
Accountability, Assessment, and Inspection
Curriculum and Qualifications
Teacher Supply and Quality
Education Funding
Higher Education, Further Education, and Skills
Our experienced and dedicated team works closely with academics, think tanks, and other research
foundations and charities to shape the policy agenda.

3
This publication includes analysis of the National Pupil Database (NPD):
www.gov.uk/government/collections/national-pupil-database
The Department for Education is responsible for the collation and management of the NPD and is the
Data Controller of NPD data. Any inferences or conclusions derived from the NPD in this publication
are the responsibility of the Education Policy Institute and not the Department for Education.
Published in April 2018, Education Policy Institute.
ISBN: 978-1-909274-56-3
This work is licensed under a Creative Commons Attribution-NonCommercial-ShareAlike 4.0
International License. For more information, visit: creativecommons.org

4
Contents
Foreword ................................................................................................................................................. 5
Executive summary ................................................................................................................................. 6
Key findings ......................................................................................................................................... 6
Performance in mathematics.............................................................................................................. 6
Performance in reading ...................................................................................................................... 7
Policy implications .............................................................................................................................. 7
Part One: Introduction & methodology .................................................................................................. 9
Results ................................................................................................................................................... 13
Mathematics ..................................................................................................................................... 15
Reading ............................................................................................................................................. 19
Overall variation and socio-economic attainment gaps ................................................................... 22
Part Two: What can we learn from other countries about reducing socio-economic achievement
gaps? ..................................................................................................................................................... 24
Which countries should we compare ourselves with, and why? ..................................................... 24
A framework for addressing equity issues ........................................................................................ 25
Conclusions and policy implications ..................................................................................................... 37
Appendix A: Estimated FSM rates for countries’ PISA samples ............................................................ 38
Appendix B: Alternative results using old GCSE grades ........................................................................ 39

5
Foreword
The Education Policy Institute has been pleased to partner with Professors John Jerrim and Toby
Greany at the UCL Institute of Education, to consider the size of the "disadvantage gap" in English
education; how this compares with other advanced countries - including the "World Leading"
education nations; and what may explain England's relative performance.
This is the third and final report in a partnership between the Institute of Education and EPI to
benchmark England against other "higher income" countries, using the PISA education statistics.
Our aim has been to provide a more balanced and fair assessment of England's comparative
strengths and weaknesses than is often presented in the public discourse about education quality in
England, and to measure gaps between English performance and that in other countries in terms
that are easily comprehensible to an English audience - i.e. in GCSE equivalents.
We hope that this fairer assessment of English performance will improve the quality of debate, lead
to more focus on areas where English performance is genuinely poor (for example, the scale of the
overall attainment gap in England), help understand where our performance is strong or closer to
average, and stimulate debate about what we can learn from the nations who top the tables and
particularly those which succeed in delivering both equity and excellence.
We are, once again, particularly grateful to John Jerrim and Toby Greany. We welcome responses to
this and the earlier reports in this series.
Rt. Hon. David Laws
Executive Chairman, Education Policy Institute

6
Executive summary
In this third report by the Institute of Education and the Education Policy Institute, we study the
performance of disadvantaged pupils in England and the gap between those pupils and their peers.
We compare England’s performance on both measures to other, developed countries.
The definition of ‘disadvantaged pupils’ in England, used in this report, is those eligible for Free
School Meals (FSM). As this measure relates to pupils in England only, we estimate a similar group of
disadvantaged pupils in other countries using the Economic, Social and Cultural Status (ESCS) index
used in the PISA 2015 study. Using these estimations, we find that England has an FSM rate of 10.5
per cent, the 8th lowest of all countries included in this study.1 Iceland has the lowest estimated
proportion of FSM pupils, at 8.1 per cent.
Key findings
Performance in mathematics
The average maths GCSE grade of disadvantaged pupils in England is around 3.8. This is
lower than a ‘pass’ under the new GCSE arrangements and, on this measure, England is
positioned 25th of the 44 nations in the report.
This is around a third of a grade lower than many other Western nations including Estonia,
Canada, the Netherlands and Ireland and more than half a grade lower than in the leading
Asian nations of Macao, Singapore, Hong Kong, Taiwan and Japan.
The gap between disadvantaged pupils and their peers in England is equivalent to one
whole GCSE grade. This places England at 27 out of 44 jurisdictions in terms of the size of
the socio-economic gap.
The gap is notably smaller in some high performing countries including Estonia (0.71 of a
grade), Hong Kong (0.85) and Norway (0.84). However, other high performing countries (in
terms of overall performance in PISA), have a higher gap, including China and Singapore
where the gap is equivalent to 1.2 of a GCSE grade.
There is also a long tail of underperformance amongst disadvantaged pupils in England. Only
10 per cent of FSM pupils in England achieved the equivalent GCSE maths score of 7 to 9 (or
an A-A* under the old system), compared to 18 per cent of disadvantaged pupils in
Singapore. Conversely, 40 per cent of FSM pupils failed to reach a grade 4 (the new GCSE
pass mark), compared to an estimated 28 per cent in Singapore.
1 This figure is lower the Department for Education’s reported data as the PISA sample includes privately educated pupils and is not a perfectly representative sample of England’s state school population.
7
Performance in reading
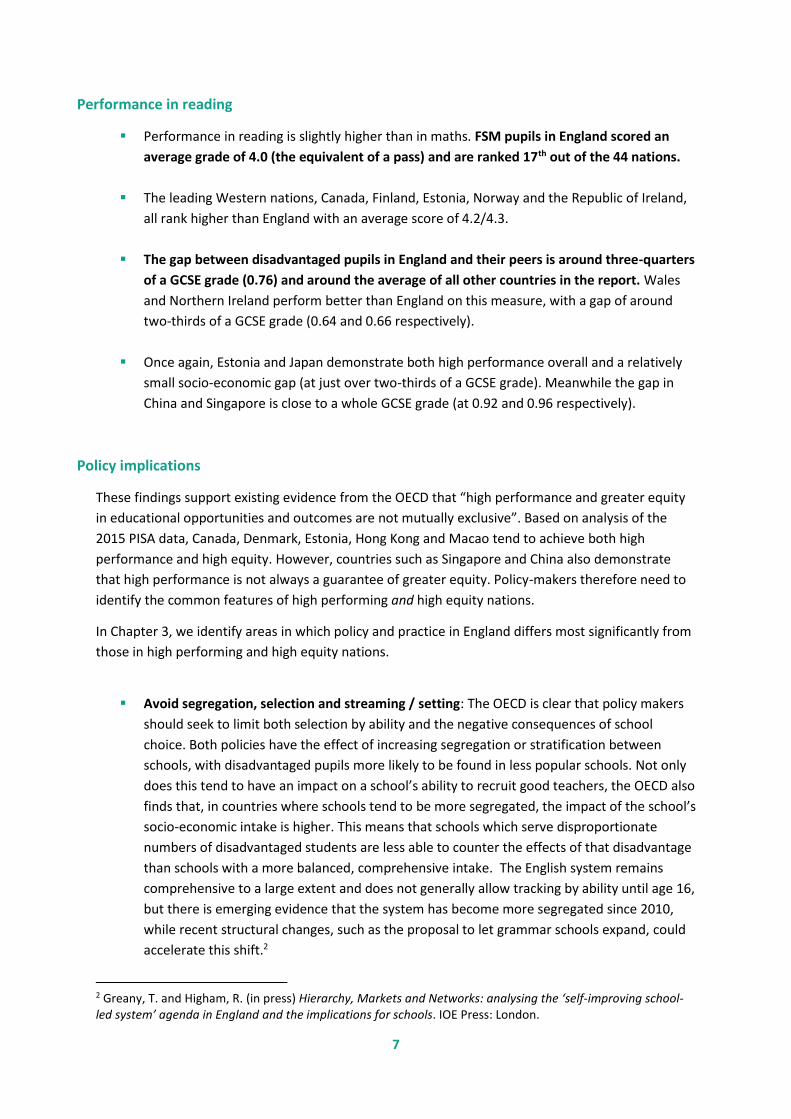
Performance in reading is slightly higher than in maths. FSM pupils in England scored an
average grade of 4.0 (the equivalent of a pass) and are ranked 17th out of the 44 nations.
The leading Western nations, Canada, Finland, Estonia, Norway and the Republic of Ireland,
all rank higher than England with an average score of 4.2/4.3.
The gap between disadvantaged pupils in England and their peers is around three-quarters
of a GCSE grade (0.76) and around the average of all other countries in the report. Wales
and Northern Ireland perform better than England on this measure, with a gap of around
two-thirds of a GCSE grade (0.64 and 0.66 respectively).
Once again, Estonia and Japan demonstrate both high performance overall and a relatively
small socio-economic gap (at just over two-thirds of a GCSE grade). Meanwhile the gap in
China and Singapore is close to a whole GCSE grade (at 0.92 and 0.96 respectively).
Policy implications
These findings support existing evidence from the OECD that “high performance and greater equity
in educational opportunities and outcomes are not mutually exclusive”. Based on analysis of the
2015 PISA data, Canada, Denmark, Estonia, Hong Kong and Macao tend to achieve both high
performance and high equity. However, countries such as Singapore and China also demonstrate
that high performance is not always a guarantee of greater equity. Policy-makers therefore need to
identify the common features of high performing and high equity nations.
In Chapter 3, we identify areas in which policy and practice in England differs most significantly from
those in high performing and high equity nations.
Avoid segregation, selection and streaming / setting: The OECD is clear that policy makers
should seek to limit both selection by ability and the negative consequences of school
choice. Both policies have the effect of increasing segregation or stratification between
schools, with disadvantaged pupils more likely to be found in less popular schools. Not only
does this tend to have an impact on a school’s ability to recruit good teachers, the OECD also
finds that, in countries where schools tend to be more segregated, the impact of the school’s
socio-economic intake is higher. This means that schools which serve disproportionate
numbers of disadvantaged students are less able to counter the effects of that disadvantage
than schools with a more balanced, comprehensive intake. The English system remains
comprehensive to a large extent and does not generally allow tracking by ability until age 16,
but there is emerging evidence that the system has become more segregated since 2010,
while recent structural changes, such as the proposal to let grammar schools expand, could
accelerate this shift.2
2 Greany, T. and Higham, R. (in press) Hierarchy, Markets and Networks: analysing the ‘self-improving school-led system’ agenda in England and the implications for schools. IOE Press: London.
8
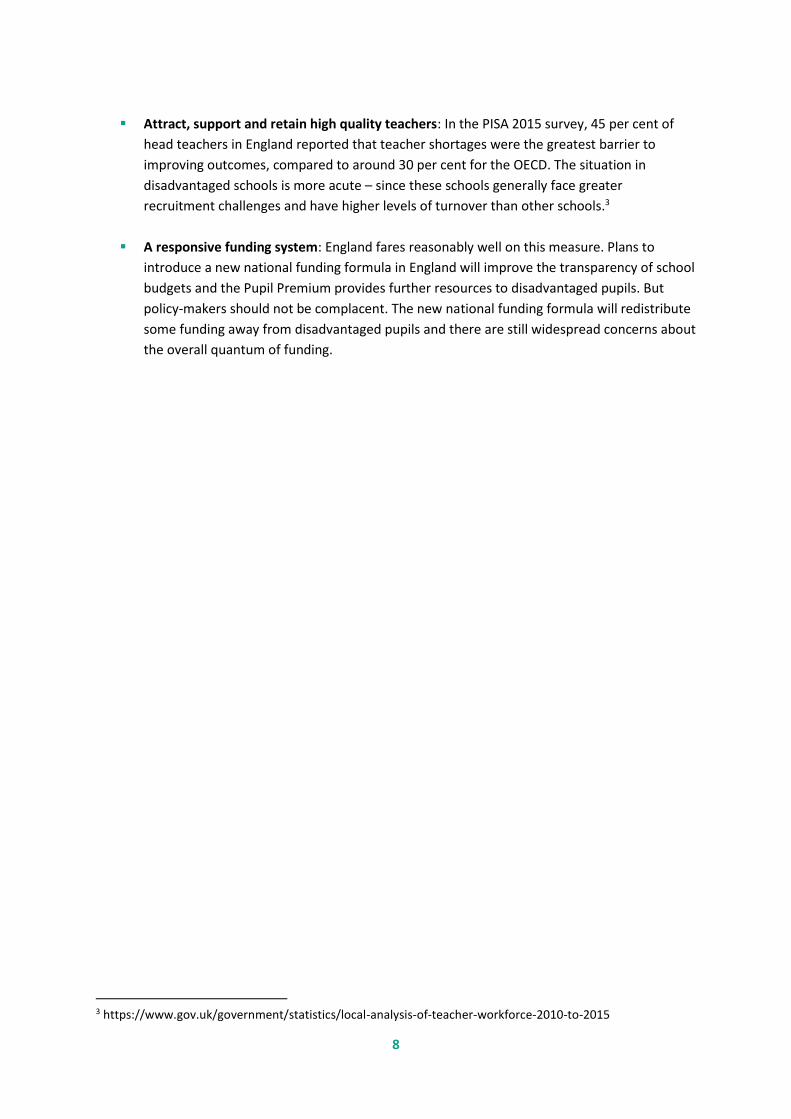
Attract, support and retain high quality teachers: In the PISA 2015 survey, 45 per cent of
head teachers in England reported that teacher shortages were the greatest barrier to
improving outcomes, compared to around 30 per cent for the OECD. The situation in
disadvantaged schools is more acute – since these schools generally face greater
recruitment challenges and have higher levels of turnover than other schools.3
A responsive funding system: England fares reasonably well on this measure. Plans to
introduce a new national funding formula in England will improve the transparency of school
budgets and the Pupil Premium provides further resources to disadvantaged pupils. But
policy-makers should not be complacent. The new national funding formula will redistribute
some funding away from disadvantaged pupils and there are still widespread concerns about
the overall quantum of funding.
3 https://www.gov.uk/government/statistics/local-analysis-of-teacher-workforce-2010-to-2015

9
Part One: Introduction & methodology
Introduction
This is the third in a series of EPI reports using international educational assessment data to explore
how England compares with the world leading education nations for the performance of school-age
children in reading and mathematics. In earlier reports we found that:
Based on a sample of pupils who participated in the OECD’s Programme for International
Student Assessment (PISA) in 2015 in maths, GCSE maths scores for pupils in England would
need to increase by around two-thirds of a grade on average, in order to match the top
five performing jurisdictions. The average attainment of the top five nations in reading was
equivalent to a GCSE points score of 4.9, only slightly higher than the average grade for
England’s PISA participants, at 4.7.4
The Government’s ‘expected standard’ in Key Stage 2 mathematics is broadly in line with the
average performance of the top-performing countries. In the five top-performing nations, it
was estimated that an average of 90 per cent of pupils would have achieved the expected
standard, compared to 75 per cent of England’s Trends in Mathematics and Science Study
(TIMSS) sample. The variation in TIMSS scores in England was significantly higher than that
of many other countries included in the study. In the top-performing nations, the difference
between the highest and lowest attaining pupils was around 16.2 points; in England, it was
18.6 points.5
In this paper, we investigate the socio-economic gap in secondary school pupils’ academic
achievement using the PISA 2015 dataset, which has been linked to the National Pupil Database
(NPD). Our goal is to estimate how disadvantaged pupils would achieve in England’s GCSE
examinations for mathematics and reading. This in turn leads us to develop a new set of ‘World Class
benchmarks’ which we hope will help policymakers determine the education standards that we
should be expecting of disadvantaged pupils in this country – both in terms of their absolute
performance and the size of ‘gap’ relative to more advantaged peers.
Using PISA to assess the performance of disadvantaged pupils
In 2000, the Organisation for Economic Co-Operation and Development (OECD) undertook the first
in a series of international benchmarking tests, the Programme for International Student Assessment
(PISA). Taking place every three years, PISA assesses 15-year-olds from OECD and other participant
countries and economies in mathematics, reading and science. In the latest PISA study, conducted in
December 2015, 72 jurisdictions participated – including all 35 OECD countries and 37 partner
countries and economies.6
PISA collects a range of background information on students that can be used to assess differences
in attainment across those from different socio-economic background. Students report on their
parent’s highest level of education, their occupational status, and answer several questions about
4 Jerrim, J., Andrews, J. and Perera, N., ‘English Education: World Class?’, August 2017. 5 Jerrim, J., Perera, N. and Sellen, P., ‘English Education: World Class in Primary?’, December 2017. 6 OECD, ‘PISA Results 2015: Volume I’, December 2016.

10
the presence, and number of, certain possessions in their home (including books and other goods).
This information is summarised by the OECD in their index of economic, social and cultural status
(ESCS) to provide a means of comparing participating students internationally (i.e. the index is a
continuous proxy measure for socio-economic background relative to students across all countries in
PISA, not relative to the rest of a student’s own country).7 This information can be used to estimate
how performance in PISA varies across students from different backgrounds, and how the
importance of socio-economic background varies across different countries.
The Trends in Mathematics and Science Study (TIMSS) is conducted by the International Association
for the Evaluation of Educational Achievement (IEA). It takes place every four years and attempts to
measure the knowledge and skills relative to an internationally-determined mathematics and
science curriculum for pupils in both Year 5 (4th grade) and Year 9 (8th grade).8 The IEA’s Progress in
International Reading Literacy Study (PIRLS) is conducted every five years, and assesses the reading
comprehension of 4th grade students.9 It was considered whether such studies could be used here to
compare attainment gaps for younger pupils than those participating in PISA. However, TIMSS and
PIRLS collect less information on students’ backgrounds than PISA, particularly for countries (such as
England) where parents have not been surveyed in addition to students. Therefore, this study
focuses on PISA results.10 The IEA should consider improving the socio-economic background
information recorded in TIMSS and PIRLS to support research into the drivers of primary-age pupil
performance.
Linked NPD-PISA database
We use the data from the most recent PISA cycle in 2015. While PISA 2000 to 2012 were all paper-
based tests, computer-based assessment was implemented in PISA 2015 for the first time. A two-
stage sample design was used to collect the data. Schools were first sampled with probability
proportional to size, and then pupils randomly selected from within. A total of 5,194 pupils from 206
schools in England participated in PISA 2015, which reflects official response rates of 92 percent at
the school level and 88 percent at the pupil level11. In England, almost every participating pupil is
within the same year group (Year 11), which is not the case in most other countries with variable
school starting dates and the use of grade repetition12. This is similar to the response rates achieved
in most other countries, and is fully compliant with the standards set by the OECD. Further details on
the comparison of GCSE grades for the PISA 2015 sample for England compared to the national
7 OECD, ‘PISA 2015 results: Volume III’, April 2017, pp. 251. 8 Mullis, I. V. S., Martin, M. O., Foy, P., & Hooper, M., ‘TIMSS 2015 International Results in Mathematics’, 2016. 9 Mullis, I. V. S., Martin, M. O., Foy, P., & Hooper, M., ‘PIRLS 2016 International Results in Reading’, 2017. 10 Where parents are not surveyed, the ‘Home Educational Resources’ measure is based only on the number of books in the home (in 5 categories), the availability of an internet connection or the student having their own room, and the highest education of their parent. This provides less informative variation across students, particularly in England. In TIMSS 2015, the IEA’s report divides students into three groups, with ‘Many’, ‘Some’ or ‘Few’ Resources; for grade 8 students in the mathematics assessment, 19% of England’s students had ‘Many’ resources, 76% had ‘Some’ resources, whilst just 5% had ‘Few’. 11 School-level response rates in England were 83 percent before replacement schools were included and 92 percent after. 12 PISA draws an age-based sample, meaning all pupils are around age 15/16 at the time of the assessment. In England the timing of the assessment means almost all the selected pupils are within Year 11. However, in other countries, pupils of this age are spread across different school year groups.

11
grade distribution based upon data from all Year 11 pupils is provided in Annex A. Throughout our
analysis, we apply the final pupil response weights to take the complex PISA survey design into
account.
The PISA 2015 sample for England has been linked to the National Pupil Database (NPD), which
includes administrative data on pupils’ backgrounds along with their performance on national
examinations. Critically, this includes pupils’ GCSE grades. A successful link has been made for 4,914
pupils (95 percent of the sample)13. The total number of pupils with valid information on GCSE
mathematics grades is 4,778 pupils (92 percent of the sample) and 4,735 pupils (91 percent of the
original sample) for English Language grades.
Imputation of GCSE grades and FSM status
Our empirical methodology is based around multiple imputation. The PISA-NPD file for England
includes both children’s PISA test scores (plausible values) and their scores in the Key Stage 2 test /
GCSE grades. We append to this the public use PISA datafile for all other comparator countries.
Hence, we have a set of variables (PISA) which are observed for all participating pupils in all
countries, and another set of variables (GCSE grades) which are only observed for pupils in England.
The fact that GCSE grades are not observed in other countries is treated as a missing data problem,
which we attempt to solve via multiple imputation. In other words, we predict how well children in
other countries would have done had they taken GCSE exams, based upon how they performed on
the PISA 2015 test. This prediction is based upon the relationship between PISA and GCSE grades in
England. One advantage of using multiple imputation by chained equations is that we are able to
retain in our analysis even those pupils in England whose GCSE data could not be matched. Hence all
pupils who participated in PISA 2015 in England are included in our results. This includes pupils in
independent schools.
Our imputation model applies multiple imputation by chained equations (MICE). The chained models
include the Economic, Social and Cultural Status (ESCS) index, a binary indicator for FSM eligibility,
GCSE grades14 and PISA achievement levels (based upon the first plausible value) as a set of dummy
variables. The final pupil weight is applied, with the imputation models run separately for England in
combination with each comparator country. In a previous report, we have run further robustness
tests, and found that results do not change substantially if a more complex imputation model is
estimated, or if raw PISA scores (percentage correct) rather than scaled.15
The above imputation process means that, for each participating country, we have generated a set
of synthetic FSM indicators and GCSE grades. We use these synthetic variables throughout our
analysis in order to produce an estimate of (i) the average performance of a group comparable to
FSM pupils in each country and (ii) the size of the FSM gap. From these results, we can infer how
13 Independent school pupils were less likely to have linked GCSE data than state school pupils. Although the high overall linkage rate should mean that this has only a relatively minor impact upon our results, the multiple imputation methodology we shall describe in the following section should further limit any potential bias due to linkage not being possible. 14 In our results section, when we report the proportion of children achieving each grade, our imputation model has treated GCSE grades as a categorical variable. When we reported average numeric grades, the imputation model has treated GCSE grades as a linear continuous variable. 15 Jerrim, J., Andrews, J. and Perera, N., ‘English Education: World Class?’, August 2017.

12
England’s GCSE grades needs to change for low-income (FSM) pupils, so that this country becomes
one of the world’s leading education systems for socio-economically disadvantaged pupils.
Although in this research we are attempting to benchmark GCSEs against the PISA study, it is
important to recognise that these two assessments differ in non-trivial ways. First, whereas GCSEs
measure pupils’ knowledge, understanding and application of material taught within national
curricula, PISA focuses more upon the application of skills in ‘real-life’ situations. Second, previous
analysis of the PISA test questions found that they typically require a greater amount of reading than
GCSE examinations, particularly in science.16 Third, the tests are taken around six months apart, with
Year 11 pupils first taking PISA in November/December 2015 and then sitting their GCSEs in
May/June 2016. Fourth, whereas GCSES continue to be implemented using pen and paper, PISA
2015 was a computer-based assessment. Finally, GCSEs are a ‘high-stakes’ test for pupils and schools
who have a great deal riding upon the results. This is not the case for PISA, which is a low-stakes test,
with the results having little direct implications for pupils or schools.
The main implication of these differences is that, although PISA scores and GCSE grades will be
positively correlated, it is unlikely that there will be an exact relationship. Indeed, previous research
has suggested that demographic groups perform differently across these two assessments.17 There
will consequently be an element of uncertainty in our results, and the benchmarks we set for
England to become a world-leading country. Nevertheless, given that PISA scores and GCSE grades
correlated at around 0.7 to 0.8 (author’s calculations), our results will provide reasonably good
approximations as to how England’s PISA scores are likely to change for a given increase in GCSE
grades.
16 Ruddock, G., Clausen-May, T., Purple, C., and Ager, R., ‘Validation Study of the PISA 2000, PISA 2003 and TIMSS-2003 International Studies of Pupil Attainment’, 2006, DfES Research Report 772, Slough: NFER. 17 Jerrim, J. and Wyness, G., ‘Benchmarking London in the PISA Rankings’, February 2016

13
Results
For context, Figure 1.1 provides some descriptive information on the countries included in this
report. This includes details on average performance in the PISA for reading and mathematics,
variation in performance (difference in scores between the 10th and 90th percentiles), and the
magnitude of the gap in mathematics performance (difference in scores between the most and least
advantaged socio-economic group – as defined by the top and bottom quartile of the ESCS index).
The red shading indicates a statistically significant worse performance than England, while blue
shading indicates a significantly better performance. The use of ‘*’ indicates figures that are
statistically significantly different from England at the five percent level.
Annex A presents the outcome of the imputation procedure in terms of the FSM classification of
PISA participants. The proportion of the PISA sample estimated to be registered for FSM in England
is 10.5 per cent. This is lower than the rates reported in Department for Education statistics,
reflecting that the PISA sample includes independent school pupils and is not perfectly
representative of England’s state school population. England’s FSM rate is the 8th lowest of the
countries included in this study. Iceland has the lowest estimated proportion, at 8.1 per cent.
Reflecting that the ESCS captures more information about home environments than income, and is
not a linear measure, the variation in FSM equivalent rates is smaller than might be expected based
on the variation in GDP per capita of the countries included: 33 of 44 countries considered have
estimated FSM rates lower than 15 per cent. Mexico, Vietnam and Turkey have the highest
estimated rates, all at over 25 per cent but less than 30 per cent. In most countries there are a
reasonable number of students classified as FSM in the PISA sample for the purposes of analysis.
However, in Wales, Northern Ireland, Scotland, Norway and Iceland there are fewer than 400 in this
category, so for such countries there will be more uncertainty in attainment results, and in the
classification of FSM-equivalent rates too.

14
Figure 1. Key indicators across selected countries 18
Country
Mathematics Reading
Average PISA maths
score
Gap between
highest and lowest
achievers
Socio-economic
gap
Average PISA
reading score
Gap between
highest and lowest
achievers
Socio-economic
gap
Singapore 564* 247 98* 535* 257 108*
Hong Kong 548* 232 52* 527* 220* 46*
Macao 544* 204* 34* 509* 212* 34*
Taiwan 542* 266* 94 497 240 84
Japan 532* 227* 79 516* 238* 77
China 531* 276* 117* 494 283* 129*
South Korea 524* 258 92 517* 251 76
Switzerland 521* 247 91 492 254 96*
Estonia 520* 209* 68 519* 226* 65*
Canada 516* 227* 67* 527* 238* 70
Netherlands 512* 237 79 503 262 89
Denmark 511* 209* 69 500 225* 73
Finland 511* 210* 73 526* 239* 75
Slovenia 510* 228* 73 505 239* 77
Belgium 507* 255 104* 599 263 105*
Germany 506* 230* 89 509* 258 93
Poland 504* 226* 79 506 231* 83
Ireland 504* 206* 76 521* 222* 78
Norway 502* 219* 67* 513* 255 62*
Austria 497 247 89 485* 265 98*
New Zealand 495 238 88 509* 274* 94
Sweden 494 233 89 500 262 86
Australia 494 242 85 503 265* 88
England 493 245 81 500 254 79
France 493 249 110* 499 293* 122*
Northern Ireland 493 204* 75 497 220* 73
Czech Republic 492 235 107* 487* 262 110*
Portugal 492 249 97* 498 240* 92
Scotland 491 219* 73 493 235* 69
Italy 490 241 78 485* 244 82
Iceland 488 241 62* 482* 256 54*
Spain 486* 220* 83 496 224* 79
Luxembourg 486* 244 111* 481* 279* 125*
Latvia 482* 200* 67* 488* 221* 67
Wales 478* 201* 53* 477* 219* 48*
Hungary 477* 246 114* 470* 255 118*
Slovak Republic 475* 247 95 453* 271* 106*
Israel 470* 269* 91 479* 295* 93
United States 470* 230* 86 497 259 78
Greece 454* 234 78 467* 256 93
Turkey 420* 212* 59* 428* 213* 61
Mexico 408* 193* 56* 423* 202* 68
18 Figures based upon PISA mathematics unless otherwise stated. Comparisons in this report do not include Chile, Kuwait, South Africa, Morocco and Jordan.

15
Mathematics
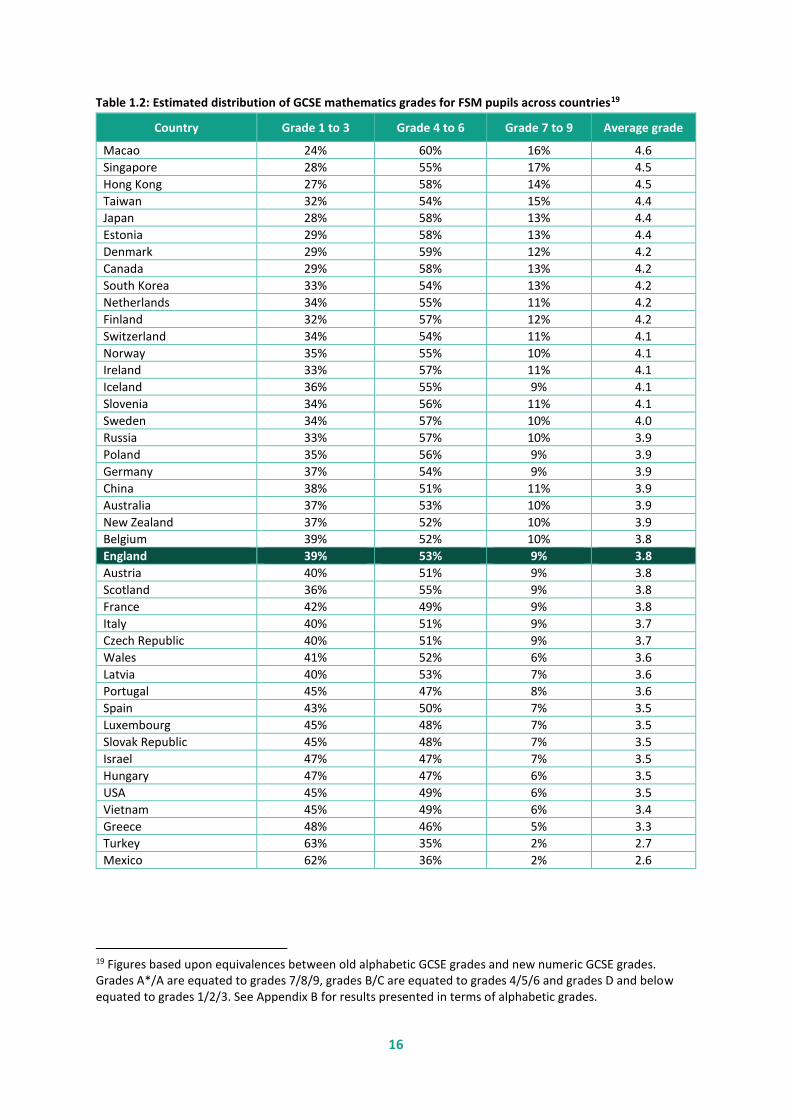
Figure 1.2 illustrates the estimated distribution of GCSE mathematics grades for FSM pupils across
countries. This includes the proportion of FSM pupils reaching grades 9 to 7 (A* or A), 6 to 4 (B or C)
and 3 to U (D and below), along with the estimated average grade. England sits firmly in the middle
of this table, with the average GCSE mathematics grade achieved by FSM pupils around 3.8. This is
more than half a grade lower than in the leading East Asian nations of Macao, Singapore, Hong Kong,
Taiwan and Japan, where the average GCSE mathematics grade of their disadvantaged pupils is
around 4.5.
Moreover, there are a number of Western nations where low-income pupils perform better than
their peers in England, such as Estonia (average FSM maths grade of 4.4), Canada (4.2), the
Netherlands (4.2), Ireland (4.1) and Switzerland (4.1). Consequently, a significant increase in GCSE
mathematics performance – of at least a third of a grade – is needed amongst FSM pupils for
disadvantaged young people in England to match their peers in these parts of the world.
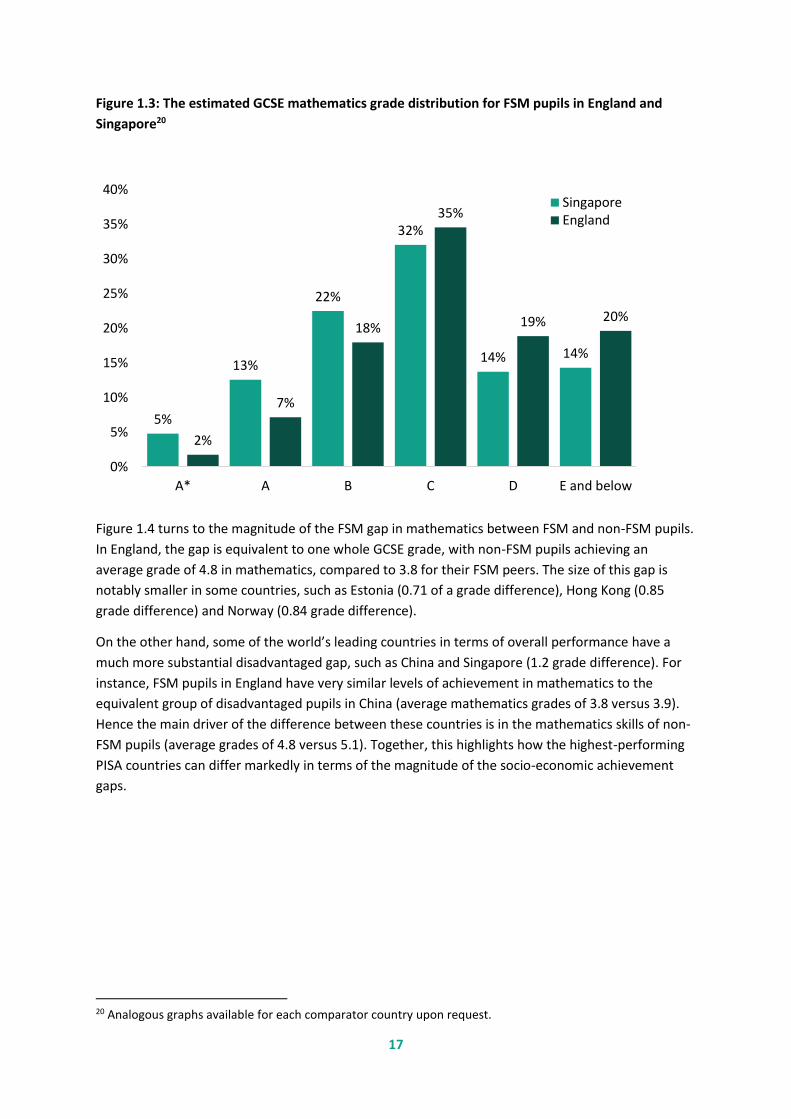
Annex B provides a set of alternative results based upon the old GCSE alphabetic grades. Moreover,
we have produced a graph comparing the GCSE grade distribution for FSM pupils in England to each
of the comparator countries. An example comparing England to Singapore is presented in Figure 1.3
(analogous graphs for other countries available upon request). This illustrates how less than 10 per
cent of FSM pupils in England achieve a GCSE A or A* (7 to 9) grade, compared to an estimated 18
per cent of disadvantaged pupils in Singapore. Equally, around 40 percent of FSM pupils in England
fail to reach grade C (grade 4) in mathematics, compared to an estimated 28 percent in Singapore.
16
Table 1.2: Estimated distribution of GCSE mathematics grades for FSM pupils across countries19
Country Grade 1 to 3 Grade 4 to 6 Grade 7 to 9 Average grade
Macao 24% 60% 16% 4.6
Singapore 28% 55% 17% 4.5
Hong Kong 27% 58% 14% 4.5
Taiwan 32% 54% 15% 4.4
Japan 28% 58% 13% 4.4
Estonia 29% 58% 13% 4.4
Denmark 29% 59% 12% 4.2
Canada 29% 58% 13% 4.2
South Korea 33% 54% 13% 4.2
Netherlands 34% 55% 11% 4.2
Finland 32% 57% 12% 4.2
Switzerland 34% 54% 11% 4.1
Norway 35% 55% 10% 4.1
Ireland 33% 57% 11% 4.1
Iceland 36% 55% 9% 4.1
Slovenia 34% 56% 11% 4.1
Sweden 34% 57% 10% 4.0
Russia 33% 57% 10% 3.9
Poland 35% 56% 9% 3.9
Germany 37% 54% 9% 3.9
China 38% 51% 11% 3.9
Australia 37% 53% 10% 3.9
New Zealand 37% 52% 10% 3.9
Belgium 39% 52% 10% 3.8
England 39% 53% 9% 3.8
Austria 40% 51% 9% 3.8
Scotland 36% 55% 9% 3.8
France 42% 49% 9% 3.8
Italy 40% 51% 9% 3.7
Czech Republic 40% 51% 9% 3.7
Wales 41% 52% 6% 3.6
Latvia 40% 53% 7% 3.6
Portugal 45% 47% 8% 3.6
Spain 43% 50% 7% 3.5
Luxembourg 45% 48% 7% 3.5
Slovak Republic 45% 48% 7% 3.5
Israel 47% 47% 7% 3.5
Hungary 47% 47% 6% 3.5
USA 45% 49% 6% 3.5
Vietnam 45% 49% 6% 3.4
Greece 48% 46% 5% 3.3
Turkey 63% 35% 2% 2.7
Mexico 62% 36% 2% 2.6
19 Figures based upon equivalences between old alphabetic GCSE grades and new numeric GCSE grades. Grades A*/A are equated to grades 7/8/9, grades B/C are equated to grades 4/5/6 and grades D and below equated to grades 1/2/3. See Appendix B for results presented in terms of alphabetic grades.
17
Figure 1.3: The estimated GCSE mathematics grade distribution for FSM pupils in England and
Singapore20
Figure 1.4 turns to the magnitude of the FSM gap in mathematics between FSM and non-FSM pupils.
In England, the gap is equivalent to one whole GCSE grade, with non-FSM pupils achieving an
average grade of 4.8 in mathematics, compared to 3.8 for their FSM peers. The size of this gap is
notably smaller in some countries, such as Estonia (0.71 of a grade difference), Hong Kong (0.85
grade difference) and Norway (0.84 grade difference).
On the other hand, some of the world’s leading countries in terms of overall performance have a
much more substantial disadvantaged gap, such as China and Singapore (1.2 grade difference). For
instance, FSM pupils in England have very similar levels of achievement in mathematics to the
equivalent group of disadvantaged pupils in China (average mathematics grades of 3.8 versus 3.9).
Hence the main driver of the difference between these countries is in the mathematics skills of non-
FSM pupils (average grades of 4.8 versus 5.1). Together, this highlights how the highest-performing
PISA countries can differ markedly in terms of the magnitude of the socio-economic achievement
gaps.
20 Analogous graphs available for each comparator country upon request.
5%
13%
22%
32%
14% 14%
2%
7%
18%
35%
19% 20%
0%
5%
10%
15%
20%
25%
30%
35%
40%
A* A B C D E and below
SingaporeEngland

18
Figure 1.4: The estimated gap in average GCSE mathematics grades between FSM and non-FSM pupils across
countries21
Country Not FSM pupils FSM pupils FSM gap
Macao 5.3 4.6 -0.71
Estonia 5.1 4.4 -0.71
Iceland 4.9 4.1 -0.77
Ireland 4.9 4.1 -0.82
Russia 4.8 3.9 -0.83
Norway 5.0 4.1 -0.84
Hong Kong 5.3 4.5 -0.85
Latvia 4.5 3.6 -0.85
Mexico 3.5 2.6 -0.86
Wales 4.5 3.6 -0.87
Japan 5.2 4.4 -0.87
Poland 4.8 3.9 -0.89
Turkey 3.6 2.7 -0.90
Netherlands 5.1 4.2 -0.90
Sweden 4.9 4.0 -0.90
South Korea 5.1 4.2 -0.92
Finland 5.1 4.2 -0.92
Northern Ireland 4.7 3.8 -0.93
Denmark 5.2 4.2 -0.93
Vietnam 4.4 3.4 -0.94
Slovenia 5.0 4.1 -0.94
Canada 5.2 4.2 -0.95
Australia 4.9 3.9 -0.96
New Zealand 4.8 3.9 -0.98
Scotland 4.8 3.8 -0.99
Italy 4.7 3.7 -0.99
England 4.8 3.8 -0.99
Czech Republic 4.7 3.7 -1.00
Taiwan 5.4 4.4 -1.00
France 4.8 3.8 -1.01
Greece 4.3 3.3 -1.02
Austria 4.9 3.8 -1.03
Switzerland 5.2 4.1 -1.03
Germany 5.0 3.9 -1.04
Slovak Republic 4.6 3.5 -1.05
Spain 4.6 3.5 -1.08
Israel 4.6 3.5 -1.08
USA 4.5 3.5 -1.09
Hungary 4.6 3.5 -1.10
Portugal 4.7 3.6 -1.17
Belgium 5.0 3.8 -1.19
China 5.1 3.9 -1.21
Singapore 5.7 4.5 -1.22
Luxembourg 4.8 3.5 -1.24
21 Figures refer to estimated average numeric GCSE grade on the 1 to 9 scale.

19
Reading
Figure 1.5 provides results for FSM pupils estimated GCSE grades in their home language (i.e. English
in the case of England). The average GCSE English grade for the FSM group in England is estimated to
be 4.0, which is similar to the all-country average of 3.9. This is nevertheless below the leading
countries for the language skills of disadvantaged pupils, such as Canada, Finland, Estonia, Norway
and the Republic of Ireland. In these comparator nations, the average GCSE grade of disadvantaged
pupils is estimated to be around 4.2/4.3.
Again, England compares reasonably well relative to some of the other countries included in our
comparison, such as Italy (average home language grade of 3.8), France (3.7) and high-performing
China (3.5). Overall, this indicates that FSM pupils’ performance in GCSE English is generally similar
to the language skills of disadvantaged young people in many other countries, including some with
high levels of average performance.
In Figure 1.6 we turn our attention to the gap in home language skills between FSM and non-FSM
pupils. In England, the difference between these groups is approximately three-quarters of a GCSE
English Language grade. This is of similar magnitude to the all-country average of 0.80. Interestingly,
Wales and Northern Ireland are estimated to have a slightly smaller FSM gap than England, with a
difference of around two-thirds of a grade. This puts these nations towards the top of the table, with
amongst the smallest estimated socio-economic gaps in pupils’ English skills. Other countries with a
relatively small gap, but who are also high performers (in terms of overall average scores across all
pupils), are Estonia and Japan. At the other extreme is countries like Singapore, France, Spain and
China, where the estimated gap between disadvantaged and not-disadvantaged pupils is
approaching a whole GCSE grade. Nevertheless, taken together, Figures 1.5 and 1.6 paint a
reasonably optimistic picture of the GCSE English Language performance of England’s FSM pupils.

20
Figure 1.5: Estimated distribution of GCSE home language grades for FSM pupils across countries22
Country Grade 1 to 3 Grade 4 to 6 Grade 7 to 9 Average grade
Canada 32% 54% 13% 4.3
Finland 34% 53% 13% 4.3
Estonia 35% 54% 11% 4.2
Ireland 35% 54% 11% 4.2
Norway 33% 53% 13% 4.2
Northern Ireland 33% 53% 14% 4.1
Japan 38% 51% 11% 4.1
Singapore 39% 49% 12% 4.1
Hong Kong 36% 53% 11% 4.1
New Zealand 40% 49% 10% 4.0
Macao 37% 53% 10% 4.0
Iceland 37% 51% 11% 4.0
Scotland 41% 49% 11% 4.0
South Korea 37% 53% 10% 4.0
Russia 38% 53% 10% 4.0
Denmark 37% 52% 11% 4.0
England 40% 50% 10% 4.0
Netherlands 39% 50% 11% 4.0
Australia 41% 49% 10% 4.0
Sweden 40% 49% 11% 4.0
Poland 40% 51% 9% 4.0
Slovenia 40% 50% 10% 3.9
Germany 40% 49% 11% 3.9
Wales 42% 50% 7% 3.9
Taiwan 41% 50% 9% 3.9
Belgium 43% 47% 9% 3.9
Switzerland 45% 47% 8% 3.9
USA 45% 47% 8% 3.8
Austria 44% 47% 8% 3.8
Italy 46% 45% 9% 3.8
Czech Republic 45% 46% 9% 3.7
Latvia 44% 48% 7% 3.7
France 46% 45% 9% 3.7
Israel 48% 44% 8% 3.7
Portugal 47% 46% 8% 3.7
Spain 48% 45% 7% 3.7
Luxembourg 53% 41% 6% 3.6
Greece 52% 42% 6% 3.5
Hungary 53% 41% 6% 3.5
China 53% 41% 6% 3.5
Vietnam 51% 45% 4% 3.4
Slovak Republic 32% 41% 6% 3.4
Turkey 32% 35% 3% 3.0
Mexico 65% 33% 2% 2.9
22 Figures based upon equivalences between old alphabetic GCSE grades and new numeric GCSE grades. Grades A*/A are equated to grades 7/8/9, grades B/C are equated to grades 4/5/6 and grades D and below equated to grades 1/2/3. See Appendix B for results presented in terms of alphabetic grades.

21
Figure 1.6: The estimated gap in average GCSE home language grades between FSM and non-FSM pupils
across countries23
Country Not FSM pupils FSM pupils FSM gap
Macao 4.6 4.0 -0.57
Wales 4.5 3.9 -0.64
Estonia 4.9 4.2 -0.66
Northern Ireland 4.8 4.1 -0.66
Vietnam 4.1 3.4 -0.68
Russia 4.7 4.0 -0.68
Scotland 4.7 4.0 -0.68
Japan 4.8 4.1 -0.68
Poland 4.7 4.0 -0.69
Iceland 4.7 4.0 -0.71
Taiwan 4.6 3.9 -0.72
Latvia 4.4 3.7 -0.72
Hong Kong 4.8 4.1 -0.72
South Korea 4.8 4.0 -0.75
Turkey 3.7 3.0 -0.75
England 4.7 4.0 -0.76
Ireland 4.9 4.2 -0.76
Canada 5.1 4.3 -0.77
Austria 4.6 3.8 -0.79
Finland 5.1 4.3 -0.79
New Zealand 4.8 4.0 -0.79
Mexico 3.7 2.9 -0.80
Italy 4.6 3.8 -0.80
Czech Republic 4.6 3.7 -0.80
Netherlands 4.8 4.0 -0.81
Norway 5.0 4.2 -0.82
Slovenia 4.8 3.9 -0.83
Switzerland 4.7 3.9 -0.84
Australia 4.8 4.0 -0.84
Sweden 4.8 4.0 -0.84
Greece 4.4 3.5 -0.84
Belgium 4.7 3.9 -0.85
Slovak Republic 4.3 3.4 -0.87
USA 4.7 3.8 -0.88
Germany 4.8 3.9 -0.89
Portugal 4.6 3.7 -0.89
Israel 4.6 3.7 -0.89
Hungary 4.4 3.5 -0.90
Denmark 4.9 4.0 -0.91
China 4.4 3.5 -0.92
Spain 4.6 3.7 -0.92
France 4.7 3.7 -0.96
Singapore 5.1 4.1 -0.96
Luxembourg 4.6 3.6 -1.02
23 Figures refer to estimated average numeric GCSE grade on the 1 to 9 scale.

22
Overall variation and socio-economic attainment gaps
There are many sources of variation in educational attainment. As reported in OECD (2016), in PISA’s
2015 science assessment, 12.9 per cent of the variation in student performance within countries was
associated with socio-economic status.24 As Figure 1.7 highlights, for mathematics, countries with
greater overall range in performance (comparing the 10th and 90th percentiles) also tend to have a
larger estimated FSM gap, with a 0.65 correlation. From this perspective, England’s FSM gap is in line
with what would be expected given its overall variation in educational performance, with its
combination of FSM gap and the gap between high and low performers close to the line of best fit.
Figure 1.7. The relationship between the high/low achievement gap and the simulated FSM gap across
countries (mathematics)
Notes: Horizontal axis refers to the difference in PISA mathematics scores between the 10th and 90th percentile.
Vertical axis provides the estimated FSM gap in mathematics scores across countries. Cross-country correlation
is 0.65. Analogous results for reading available upon request.
In contrast, as Figure 1.8 highlights, including all countries considered in this study, there is no strong
correlation between countries’ estimated FSM gaps and the average performance of its pupils. If
Turkey and Mexico are excluded, there is a slight negative correlation (of 0.15), with countries with
higher average scores also having smaller FSM gaps on average. It is not the case that developing an
education system which prevents large socio-economic gaps precludes the establishment of strong
overall educational standards.
24 OECD, ‘PISA Results 2015: Volume I’, December 2016.
England
0.6
0.7
0.8
0.9
1
1.1
1.2
1.3
180 190 200 210 220 230 240 250 260 270 280
FSM gap
Gap between highest and lowest achievers

23
Figure 1.8. The relationship between average PISA scores and the simulated FSM gap across countries
(mathematics)
Notes: Horizontal axis refers to the average PISA mathematics scores. Vertical axis provides the estimated FSM
gap in mathematics scores across countries. Cross-country correlation is -0.01 (-0.15 when the two outliers,
Turkey and Mexico, are excluded). Analogous results for reading available upon request.
England
0.6
0.7
0.8
0.9
1
1.1
1.2
1.3
400 420 440 460 480 500 520 540
FSM gap
Average PISA score

24
Part Two: What can we learn from other countries about
reducing socio-economic achievement gaps?
Which countries should we compare ourselves with, and why?
The evidence presented in the previous sections highlights why achieving equity is a priority for
every school system. Across OECD countries, almost one in every five students does not reach a
basic minimum level of skills, while students from low socio-economic backgrounds are twice as
likely to be low performers. These factors can lead to higher levels of school drop-out and are linked
to long-term negative impacts for individuals and societies; for example in terms of health, crime
and employment. But it is also the case that some school systems achieve much better levels of
equity and overall performance than others. As the OECD states: “PISA consistently finds that high
performance and greater equity in educational opportunities and outcomes are not mutually
exclusive”.25
Using the OECD’s definition, equity has two aspects: i) inclusion, meaning that that all individuals
reach at least a basic minimum level of skills, and ii) fairness, meaning that personal or social
circumstances such as gender, ethnic origin or family background, are not obstacles to achieving
educational potential.26 While the focus in this report on socio-economic gaps might be seen to
relate most closely to fairness, in practice it encompasses both aspects. This is particularly true
when we consider what England can learn from other countries, where some countries that appear
to be strong performers are actually weak on inclusion – for example where high proportions of
young people are not included in the PISA assessments because they are not enrolled in school. One
example is China, where only 64 per cent of all 15 year-olds in the four participating regions were
included in the PISA 2015 assessments.
Taking such factors in to consideration, it is worth asking which systems around the world can be
seen as strong on both excellence and equity. Any such analysis must recognise the dangers in
comparing different systems, especially given the complex cultural and contextual differences that
exist between countries.27 It is also important to recognise that school and education-specific
reforms can only make so much difference, and so must sit within a wider integrated, long-term
approach to addressing disadvantage spanning multiple areas of public policy.28 Nevertheless, there
is value in asking how and why different systems perform differently in these important areas and
what the implications might be for England.
25 OECD (2016), PISA 2015 Results (Volume I): Excellence and Equity in Education, PISA, OECD Publishing, Paris. p.206. 26 OECD (2012), Equity and Quality in Education: Supporting Disadvantaged Students and Schools, OECD Publishing. 27 Coffield, F. (2012) Why the McKinsey reports will not improve school systems, Journal of Education Policy, 27 (1), 131–149. 28 Wilkinson, R. and Pickett, K. (2010) The Spirit Level: why equality is better for everyone. Penguin: London.

25
Based on its analysis of PISA 2015, the OECD pinpoints Canada, Denmark, Estonia, Hong Kong and
Macao as systems that achieve high performance and high equity overall.29 In addition, Figure 1.1
above highlights a number of other countries, such as Japan, Finland, Slovenia, Germany, Poland,
Ireland and Norway which achieve significantly higher than England and that are also more equitable
in one or more respect.30 This section of the report focusses mostly on evidence from Canada and
the northern European countries given their similarities to England in terms of geography, size,
history and/or economic development. Where appropriate, we also draw on examples from East
Asian systems that are among the highest performing in PISA and also high on equity, such as Japan,
Hong Kong and Macao. The evidence is drawn from a focussed search for literature and evidence of
policies and practices in these systems, drawing in particular on analyses and comparisons based on
PISA.
A framework for addressing equity issues
This section focusses specifically on school and education-related policies and approaches, in
particular at secondary level, given that these can be seen to relate most closely to PISA outcomes.
But it is important to remember that addressing disadvantage in education requires investment from
the early years through to at least upper secondary level, and in alignment with wider policies, for
example aimed at reducing child poverty, improving health and well-being and integrating migrant
families. For example, the impact of high quality early years provision is well proven, with the
greatest impact being for children from disadvantaged backgrounds.31 Yet, in many systems around
the world, children from disadvantaged homes are the least likely to engage in such provision, due
to issues of funding and access. By contrast, Macao and Japan – two of the high performing, high
equity systems listed above - stand out as systems where advantaged and disadvantaged children
are equally likely to attend high quality early years settings.32 In Denmark, almost all 4-year-olds are
enrolled in early childhood education (98 per cent in 2011, above the OECD average of 82 per cent),
and a mandatory assessment of language development has been introduced for all three-year-olds
since 2010 in order to diagnose and address possible language problems before children start school
at age 7.33
Turning to schools and education-related policies, the first point to make is that different policy
approaches are correlated with different outcomes. The OECD states unambiguously that: “The way
education systems are designed has an impact on student performance. More specifically, some
systemic practices, such as early tracking, repetition, certain school choice schemes or low quality
29 OECD (2016), PISA 2015 Results (Volume I): Excellence and Equity in Education, PISA, OECD Publishing, Paris. p.208. 30 This list includes all the countries shown in Table 1 that achieve significantly higher than England in maths and/or reading and that also achieve significantly better than England in terms of the gap between highest and lowest achievers and/or the socio-economic gap in one or other subject. 31 Field, F. (2010) The Foundation Years: preventing poor children becoming poor adults: The report of the Independent Review on Poverty and Life Chances. London: HM Government. 32 OECD (2016), PISA 2015 Results (Volume II): Policies and Practices for Successful Schools, PISA, OECD Publishing, Paris. p.44. 33 OECD (2013) Education Policy Outlook: Denmark. OECD Publishing: Paris.

26
vocational education and training tend to amplify social and economic disadvantages and are
conducive to school failure”.34
Building on these insights, we draw on a framework developed by the OECD for addressing equity in
education, which focuses on two areas: eliminating system level practices that hinder equity whilst
also providing additional support for the most disadvantaged schools.35 We focus most attention on
the areas where policy and practice in England currently differs most significantly from practices in
the high performing and high equity countries identified above.
Eliminating system level practices that hinder equity
The OECD suggests the following approaches for eliminating system level practices that hinder
equity:
i) Make funding strategies responsive to students’ and schools’ needs
ii) Manage school choice to avoid segregation and increased inequities
iii) Eliminate grade repetition
iv) Eliminate early tracking/streaming/ability-grouping and defer student selection to upper
secondary level
The OECD also argues for designing equivalent upper secondary education pathways (e.g. academic
and vocational) in order to ensure high completion rates post-16, but for reasons of space we do not
address this priority here.
Make funding strategies responsive to students’ and schools’ needs
The current funding picture for schools in England is undoubtedly challenging. There are widespread
concerns about the overall quantum of funding, with the latest analysis finding that around 40 per
cent of maintained schools will struggle to meet the cost of teacher pay pressures in 2018-19 (likely
to rise to half of all schools by 2019-20).36 The impact of the new National Funding Formula being
introduced in 2018-19 will be different in different areas, but it will certainly impact negatively on
many schools with high levels of deprivation that have enjoyed more generous funding in the past.
Nevertheless, based on its analysis of the new funding formula, the Education Policy Institute
concludes that: “the Department is right to proceed with a new schools funding formula and… it has
resisted pressure to skew funding significantly towards the lowest funded areas, which might have
been politically convenient but which would have shifted significant amounts of money away from
disadvantaged areas, where attainment gaps are large”.37 The significant funding provided through
the Pupil Premium (£2.4bn in 2017-18), which is specifically tied to addressing the needs of children
34 OECD (2012), Equity and Quality in Education: Supporting Disadvantaged Students and Schools, OECD Publishing. p.38. 35 OECD (2012), Equity and Quality in Education: Supporting Disadvantaged Students and Schools, OECD Publishing. 36 Andrews, J. and Lawrence, T. (2018) School funding pressures in England. London: Education Policy Institute 37 Perera, N. Andrews, J. and Sellen, P. (2017) The implications of the National Funding Formula for Schools. London: Education Policy Institute.

27
on Free School Meals, provides further resources for schools to address disadvantage, although this
has been held at a flat per-pupil rate since 2015.
In view of these points, it is arguable that England’s funding model is reasonably well aligned with
the OECD recommendation above, and with practices in high performing and high equity systems.
The OECD draws on responses from head teachers to categorise participating countries in PISA on an
Index of Shortage of Educational Resources. It then distinguishes between responses from head
teachers in more and less advantaged schools, using the ESCS measure described above.38 The
United Kingdom overall comes out well in this analysis, meaning that disadvantaged schools are
more likely than advantaged schools to state that they have sufficient resources. However, an
analysis of responses from head teachers in England shows that heads in Ofsted grade 3 and 4
schools (Requires Improvement and Inadequate) were less positive about the physical infrastructure
of their schools and about their access to educational resources.39
Eliminate grade repetition
Grade repetition, where students who fail end of year exams are required to repeat a year of
schooling, remains a common practice in many school systems around the world. However, there is
strong evidence that such practices are detrimental to children’s long term outcomes.40 Such
approaches have not been a common feature of practice in England for many years and so the level
of grade repetition reported in PISA 2015 in England is almost negligible and well below the
international average.41 Several of the high performing systems where such practices remain
common are working to reduce this; for example, grade repetition decreased by at least 10% in
Macao between 2009 and 2015.42
Manage school choice to avoid segregation, defer student selection to upper secondary level
and eliminate streaming/setting by ability
The following section focusses on strategies to support schools with large proportions of
disadvantaged children, but policy should seek first and foremost to reduce such segregation
between schools. This requires attention to school choice and admissions policies, in particular
selection by aptitude or ability. The OECD is clear that policy makers should seek to limit both school
choice (or, at least, its negative consequences) and selection by ability at an early age.
38 OECD (2016), PISA 2015 Results (Volume I): Excellence and Equity in Education, PISA, OECD Publishing, Paris. p.206. p.231. 39 Jerrim, J. and Shure, N. (2016) Achievement of 15-Year-Olds in England: PISA 2015 National Report. London: Department for Education. p.136. 40 Hattie, J. (2008) Visible Learning: a synthesis of over 800 meta-analyses relating to achievement. London: Routledge. 41 OECD (2016), PISA 2015 Results (Volume I): Excellence and Equity in Education, PISA, OECD Publishing, Paris. p.206. p.232. 42 OECD (2016), PISA 2015 Results (Volume II): Policies and Practices for Successful Schools, PISA,
OECD Publishing, Paris. p.18.

28
School choice policies (which enable parents to select their preferred school and which introduce
new schools, such as free schools, to increase choice) are distinct from policies which track or select
students by ability or aptitude (for example, between grammar and secondary modern schools on
the basis of the 11+ exam in parts of England). Nevertheless, the effect of both policies can be to
increase segregation or stratification between schools, with disadvantaged students more likely to
be found in less popular schools (in choice-based systems) or less academic schools (in schools which
select by ability at an early age).43 As a result, these less popular and less academic schools can face
greater challenges in terms of recruiting high quality teachers or securing improved student
outcomes. Furthermore, the OECD finds that: “in countries where schools tend to be more
segregated, the impact of the school’s socio-economic intake is higher”44, meaning that schools
which serve disproportionate numbers of disadvantaged students are less able to counter the
effects of that disadvantage than schools with a more balanced, comprehensive intake.
Where schools are segregated in this way there are generally wide levels of variation in performance
between schools, because schools are serving very different populations and struggle to counteract
these ‘selection effects’. This can be seen in Figure 2.1 below, which shows levels of between and
within school variation across participating PISA countries. It shows that systems such as the
Netherlands, Germany and Singapore, which have differing levels of overall performance but which
all apply early tracking (i.e. selection by ability) for students, all have high levels of between school
variation. Similarly, systems such as Chile, which has historically applied market-based choice
mechanisms, also have higher than average levels of between school variation.
By contrast, most of the systems highlighted above for being high on both performance and equity,
such as Estonia, Finland, Denmark and Canada, have comprehensive admissions models (with limited
or no parental choice) and do not permit early tracking or selection by ability. Figure 2.1 shows that
the systems with comprehensive admissions models and no early tracking also have lower levels of
between school variation than both the OECD average and England (although they also tend to have
higher levels of within school variation, because their schools must address wider ability ranges than
in selective systems).
The district of Nijmegen in the Netherlands provides one interesting example of how to secure
comprehensive admissions. The district has adopted a central subscription system to assign
students to primary schools since 2009, with a share of 30 per cent of disadvantaged students in
each school. All the primary schools have agreed on the system: in the event of oversubscription,
priority is given to siblings and children who live nearby but subsequent priority is given to either
advantaged or disadvantaged students, in order to reach the required balance, by lottery system.45
43 OECD (2012), Equity and Quality in Education: Supporting Disadvantaged Students and Schools, OECD Publishing. p.58-59. 44 OECD (2012), Equity and Quality in Education: Supporting Disadvantaged Students and Schools, OECD Publishing. p.107. 45 OECD (2012), Equity and Quality in Education: Supporting Disadvantaged Students and Schools, OECD Publishing. p.69.

29
However, as ever, the picture is complex and there are no simple solutions. There are countries
shown in Figure 2.1, such as Latvia, that have lower levels of between school variation than the UK,
but that score significantly lower than us overall and in relation to equity. Equally, Japan is a system
that performs better than England both overall and in terms of the gap between the highest and
lowest achievers, yet it has above average levels of between school variation because schools
compete with each other and can choose to apply any selection criteria they wish for admissions.46
The UK’s level of between school variation is below the OECD average. This reflects the fact that the
system remains comprehensive to a large extent and does not allow tracking by ability until age 16,
except in areas where there are grammar schools. However, there is emerging evidence that the
system in England has become more segregated since 2010,47 while the recent structural changes,
such as enabling academies to act as their own admissions authority and the proposal to let
grammar schools expand, could accelerate this shift. Evidence indicates that some popular schools
are engaged in ‘cream-skimming’, to attract more advantaged children, and that increasing numbers
of more challenging children are being ‘off-rolled’, as schools seek to enhance their performance in
the accountability framework.48 Recent analysis suggests that increasing numbers of vulnerable
young people – around 48,000 in 2015-16 - are being placed in Alternative Provision schools, often
following permanent exclusion from mainstream schools.
A separate, but linked issue is whether and how students are streamed or grouped by ability within
individual schools. Such practices are often adopted by schools as a way of addressing within school
variation - shown on the left hand side of Figure 2.1 - on the basis that such setting allows for
differentiated forms of teaching and curricula for different ability levels. Such practices are near
universal in England, with 99 per cent of PISA participants set in some subjects, but much less so in
some other school systems – for example, in Finland, 58 per cent of PISA participants were grouped
by ability in 2015. There is good evidence that while such practices can benefit higher attaining
students, they tend to impact negatively on middle and lower attaining students.49 This can impact
negatively on social justice because of the tendency for certain types of students to be placed in
bottom sets: for example, one recent large scale study in England identified that privileged students
(White, middle class) were most likely to be in top sets whereas working-class and Black students
were more likely to be in bottom sets.50 There is also evidence that students in lower sets are often
less well taught and develop negative self-concepts around their own learning and abilities, although
the EEF highlights studies which indicate ways to address such outcomes, such as reducing the size
46 OECD (2015) Education Policy Outlook: Japan. OECD Publishing. 47 Greany, T. and Higham, R. (in press) Hierarchy, Markets and Networks: analysing the ‘self-improving school-
led system’ agenda in England and the implications for schools. IOE Press: London.
48 Nye, P. (2017) Who’s left: the main findings Education DataLab blog article available at: https://educationdatalab.org.uk/2017/01/whos-left-the-main-findings/ accessed 29.3.18 49 Setting or streaming. Education Endowment Foundation Evidence Summary. https://educationendowmentfoundation.org.uk/evidence-summaries/teaching-learning-toolkit/setting-or-streaming/ accessed 6.4.18 50 Archer, L. Francis, B. Miller, S. Taylor, B. Tereshchenko, A. Mazenod, A. Pepper, D. Travers, M. (2018) The
symbolic violence of setting: A Bourdieusian analysis of mixed methods data on secondary students’ views
about setting. British Educational Research Journal, 44:1, pp119-140.

30
of the lowest attaining groups and assigning high-performing teachers to these groups.
Nevertheless, the OECD argues that policy makers should seek to limit the use of streaming and
ability-grouping within schools, for example by only allowing it within core subjects and/or by
ensuring that schools adopt temporary and flexible approaches which allow for regular reviews and
movement between groups.51
Figure 2.1 Variations in science performance in PISA 2015, between and within schools (from OECD, 2016:
266)
51 OECD (2012), Equity and Quality in Education: Supporting Disadvantaged Students and Schools, OECD Publishing.

31
Identifying and supporting the most disadvantaged schools
The OECD argues for five focussed strategies in this area52:
i) Strengthen and support school leadership
ii) Stimulate a supportive school climate and environment for learning
iii) Attract, support and retain high quality teachers to work in these schools
iv) Ensure effective classroom learning strategies
v) Prioritise linking schools with parents and communities.
In the following sections we briefly review key international learning and implications for England
under each of these headings.
Strengthen and support school leadership
It is clear from a range of research that effective leadership has an impact on student outcomes.53
Robinson et al’s meta-review highlights that leaders make the greatest difference to improved pupil
outcomes through promoting and participating in professional learning for teachers – reminding us
that leadership is first and foremost a process of influence.54
Several recent studies have examined the ways in which different school systems are working to
strengthen and support school leadership.55 Some of the world’s highest performing school systems
are looking beyond rigid competency based approaches to defining and developing leadership. For
example, the National Institute of Education in Singapore uses complexity theory to guide the design
of its Leaders in Education Programme: using extended in-school projects and action research as a
way to develop challenging, dynamic and open ended learning experiences which can develop
genuine systemic thinkers for schools.56
52 OECD (2012), Equity and Quality in Education: Supporting Disadvantaged Students and Schools, OECD Publishing. 53 Day, C., Sammons, P., Hopkins, D., Harris, A., Leithwood, K., Gu, Q., Brown, E., Ahtaridou, E. and Kington, A.
(2009) The impact of school leadership on pupil outcomes: Final report. Nottingham: Department for Education.
54 Robinson, V., Hohepa, M. and Lloyd, D. (2009) School leadership and student outcomes: identifying what
works and why: Best evidence synthesis. Wellington, New Zealand: Ministry of Education.
55 For example: Breakspear S, Peterson A, Alfadala A, Khair M, (2017) Developing Agile Leaders of Learning:
school leadership policy for dynamic times, WISE Foundation: Doha and Fluckiger, B., Lovett, S., and Dempster, N., (2014) Judging the quality of school leadership learning programmes: an international search, Professional Development in Education, 40:4, 561-575.
56 Jensen B, Downing P, and Clark A, (2017) Preparing to Lead: Lessons in Principal Development from High-Performing Education Systems. Washington, DC: National Center on Education and the Economy.

32
England has invested heavily in development programmes and support for school leadership over
the past 15 years, so this could be seen as an area of historic strength.57 In both PISA and TALIS,
school leaders in England report that they focus more time and attention on school self-evaluation,
promoting collaborative cultures and improving the quality teaching and learning than in most other
high performing systems.58 However, recent developments in England – most obviously the closure
of the National College for Teaching and Leadership, with the associated loss of a national focus for
leadership development policy - have raised concerns for some observers.59
Stimulate a supportive school climate and environment for learning
The focus in this area is on creating a culture of high expectations in all schools, but particularly
those facing high levels of disadvantage, coupled to targeted support for both academic and
personal development where required. Again, there has been a significant focus on these issues in
England over many years, for example through the establishment of ‘floor targets’ and an emphasis
on progress in the accountability framework, and through different area-based and school-to-school
intervention and support programmes, such as the London and City Challenges, the work of National
Leaders of Education and, most recently, the expansion of academy sponsorship via Multi-Academy
Trusts.
The summary of Ontario’s approach to school improvement in Box 1 provides one example of a
sustained and successful programme of support for primary and secondary schools in this area.
Another example comes from Estonia, which has enacted various ways of supporting weaker
students and ensuring equity and inclusiveness in its education system. A yearly development
interview for each student is required and schools must implement appropriate measures for
students with unsatisfactory year-end marks. Hot school lunches, study books and learning materials
have been provided for free to students in basic education since 2006 in an effort to promote equal
access to education. All schools in Estonia must have coordinators who provide services to students
with special needs. A directive adopted in 2007 mandates additional personalised support to prevent
students from dropping out of education. Such support includes special needs education, speech
therapy, psychological assistance and social pedagogical counselling. These services are provided
through study counselling centres, which have been in place since 2008 and are accessed by rural as
well as urban schools.60
57 Supovitz, J. (2014). Building a Lattice for School Leadership: The Top to Bottom Rethinking of Leadership
Development in England. Research Report (#RR-83). Philadelphia: Consortium for Policy Research in Education, University of Pennsylvania.
58 Micklewright, J. Jerrim, J. Vignoles, A. Jenkins, A. Allen, R. Ilie, S. Bellarbre, B, Barrera, F. and Hein, C. (2014)
Teachers in England’s Secondary Schools: Evidence from TALIS 2013 Research report. Institute of Education, University of London. Jerrim, J. and Shure, N. (2016) Achievement of 15-Year-Olds in England: PISA 2015 National Report. London: Department for Education.
59 See, for example: Dunford, J. (2017) 'By doing away with the National College, school leaders' influence on education policy is being minimised' TES opinion piece https://www.tes.com/news/school-news/breaking-views/doing-away-national-college-school-leaders-influence-education accessed 28.3.18 60 OECD (2016) Strong performers in PISA 2015 – Estonia. OECD Publishing.

33
It remains to be seen whether England’s approach to improving its most disadvantaged schools
through a combination of MAT sponsorship, school to school support and the focus on Opportunity
Areas will prove successful. Building on four years of analysis focussed in particular on impact for
disadvantaged students, Hutchings and Francis conclude that there is significant variability within
and between academy chains (MATs), but that “the main picture is one of a lack of transformative
change over the period.”61
Supporting school improvement in Ontario, Canada
In Ontario, the Focused Intervention Program provides targeted support to primary schools that
have “experienced particular difficulties in achieving continuous improvement”, measured through
results on provincial assessments of reading, writing, and mathematics (grades 3 and 6). The
programme funds are used for professional development, additional student and professional
learning resources, literacy and numeracy coaches, and teacher release time for collaboration and
additional training. Schools selected for participation in the programme tend to be those serving
disadvantaged communities, with a relatively high percentage of students with special education
needs or an above-average range of educational challenges. Between 2002/03 to 2010/11, the
number of schools with fewer than 34% of students achieving at provincial standard in grade 3
reading was reduced by two thirds (from 19% to 6%), showing significant success in reducing the
number of primary schools in which students fail.
Since 2003, Ontario has also implemented the Student Success / Learning to 18 Strategy in order to
increase graduation rates and post-secondary outcomes. The strategy was introduced in phases,
beginning with leadership capacity to promote strong leadership in schools and school boards and to
change school culture to achieve long-term systemic improvement. At the school-board level, a new
senior leadership role was created, the Student Success Leader, while at school level the Student
Success Teacher role was created to provide support to students at risk of dropping out. In addition,
secondary schools established Student Success Teams, consisting of school leaders, Student Success
Teachers and staff. These teams track and address the needs of students who are disengaged, and
also work to establish quality learning experiences for all students.
Additionally, as part of the Ontario School Effectiveness Framework (2013), schools set up an
improvement-planning process and decide how and when they will achieve the goals they select. The
objective is to improve student achievement levels by enhancing the way the curriculum is
delivered, creating positive environments for learning, and increasing the degree to which parents
are involved in children’s learning.
According to the Final Report of the Evaluation of the Ontario Ministry of Education’s Student
Success / Learning to 18 Strategy, developing good leadership at all levels – Ministry, school board,
and school level – coupled with extensive capacity building were key to the success of the reform. In
2011/12, Ontario had a high-school graduation rate of 83%, a 15 percentage point improvement
since 2003/04.
61 Hutchings, M. & Francis, B. (2017) Chain Effects 2017: The impact of academy chains on low income students. London: Sutton Trust. p.5

34
Adapted from OECD, 2012:118 and OECD, Education Policy Outlook – Canada, 2015:11
Attract, support and retain high quality teachers to work in these schools
It is widely acknowledged that England faces a growing challenge to recruit and retain high quality
teachers.62 In the PISA 2015 survey, 45% of headteachers in England reported that ‘teacher
shortages’ were the greatest barrier to improving outcomes, compared to around 30 per cent for the
OECD and the top-performing countries as a group.63 This issue is often most acute in parts of the
country that face the greatest challenges, such as the Opportunity Areas that are often isolated with
no obvious mechanisms for recruiting and deploying new teachers. For example, analysis of the
School Workforce Census in England indicates that schools with the highest proportion of free
school meals-eligible pupils have more than twice as many unqualified teachers as those with the
lowest proportion.64
The OECD is clear that “the most successful education systems select the best candidates for the
teaching profession, retain qualified teachers and ensure that they are constantly improving by
participating in professional development activities”.65 It argues that countries which combine
equity and high performance are effective in designing mechanisms to attract competent and
qualified teachers to disadvantaged schools, although it recognises that this can be complex to
address.
There is surprisingly little robust research into different models for initial teacher education and
deployment, in particular for disadvantaged schools. Menter et al analyse a range of models and
highlight the strength of the Finnish approach, where practical school experience forms a significant
component of initial teacher education, partly because universities operate actual ‘teaching schools’
which enable a close alignment of university and school experience.66 A recent development has
been the focus on ‘research informed clinical practice’, for example at the University of Melbourne
in Australia, which ‘seek(s) to integrate practical engagement in schools with research-based
knowledge in carefully planned and sequenced ways’.67
Beyond initial teacher education, the ongoing development and retention of teachers is clearly
critical, with issues such as pay, autonomy, workload and career progression all contributing to
62 House of Commons Education Select Committee (2017) Retention and recruitment of teachers. London. 63 Jerrim, J. and Shure, N. (2016) Achievement of 15-Year-Olds in England: PISA 2015 National Report. London: Department for Education. 64 Whittaker, F. (2016) ‘Grammars taking poorer pupils could face higher teacher turnover’. Schools Week: https://schoolsweek.co.uk/grammars-taking-poorer-pupils-could-face-higher-teacher-turnover/ accessed 28.3.18. 65 OECD (2016), PISA 2015 Results (Volume II): Policies and Practices for Successful Schools, PISA,
OECD Publishing, Paris. p. 45. 66 Menter, M. Hulme, M. Elliot D. and Lewin, J. (2010) Literature review on teacher education in the 21st
Century. Scottish Government.
67 Cordingley, P. (2014) ‘The contribution of research to teachers’ professional learning and development’, Research and Teacher Education: the BERA-RSA Inquiry

35
whether or not teaching is seen to be a rewarding profession. Approaches to teacher development
and status have been studied in several of the countries that score most highly on PISA, such as
Shanghai and Singapore, where there are formal career structures for teachers with pathways from
class subject teacher through to Municipal subject leader.68 Korea is also interesting in this respect
because low socio-economic status students in Korea are actually more likely than high socio-
economic status’ students to be taught by high quality mathematics teachers, as measured by
characteristics such as: full certification, mathematics or mathematic education major and at least 3
years of experience. Multiple incentives are offered to candidates who work in high need schools in
Korea, for example through additional salary payments, smaller class sizes, less instructional time,
additional credit towards future promotion to administrative positions, and the ability to choose the
next school where they work.69
Looking more specifically at the school systems referenced above as high on both performance and
equity, they do generally have strong systems and cultures for teacher development and reward.
For example, in Denmark, teachers are considered to be trusted professionals (with self-efficacy
above the TALIS average), lower-than-average annual teaching hours (650 compared to the OECD
average of 790) and good salary conditions. At upper secondary, Danish teachers must hold a
master's degree in a specific subject area and then complete a one-year in-service teacher-training
course.70
Ensure effective classroom learning strategies
Much has been researched and written about effective classroom pedagogy and it is not the purpose
of this report to rehearse these debates in detail.
What is notable from the analyses of PISA is that, on average across OECD nations and in a majority
of systems (including the UK), students in socio-economically advantaged schools spend more time
in science lessons than their peers in disadvantaged schools. Furthermore, across PISA countries,
students score 5 points higher in science for every additional hour of regular science teaching per
week after accounting for socio-economic status.71 In Denmark, for example, the number of days of
instruction in general programmes at primary, lower and upper secondary level of education is
among the highest in OECD countries (200 days compared to the OECD average of 183-185 days
depending on the level of education) and is combined with an above-average number of annual
instruction hours for students in primary and lower secondary.72
68 Jensen, B. Sonnemann, J. Roberts-Hull, K. and Hunter, A. (2016) Beyond PD: Teacher Professional Learning in
High-Performing System. Washington, DC: National Center on Education and the Economy. 69 OECD (2012), Equity and Quality in Education: Supporting Disadvantaged Students and Schools, OECD Publishing. p.135. 70 OECD (2014) Education Policy Outlook: Denmark. OECD Publishing. p. 10. 71 OECD (2016), PISA 2015 Results (Volume II): Policies and Practices for Successful Schools, PISA,
OECD Publishing, Paris. p. 211-212. 72 OECD (2014) Education Policy Outlook: Denmark. OECD Publishing. p. 10.

36
Prioritise linking schools with parents and communities.
Policy in England since 2010 has focussed on school and teaching-related reforms, with the wider
Extended Schools and Every Child Matters agenda pursued by the previous Labour government
largely abandoned. Indeed, Multi-Academy Trusts - the key vehicle now used by policy makers to
support the majority of lower performing schools – are not required to retain any form of local
governance for the schools they support. This is in contrast to most of the other high performing
and high equity systems listed above, where disadvantaged schools are usually encouraged and
supported to engage with parents and communities.
For example, Nova Scotia, in Canada, has introduced a SchoolsPlus program since 2011. This is a
collaborative inter-agency approach to supporting children and their families, with the school as the
centre of service delivery. Students and their caregivers get help more quickly, through referral to a
wide range of specialist and community services, including crisis intervention, youth mental health,
after-school programming, parent and family supports, sexual health, and child care.73 In the
Netherlands, extended schools include other services for children, such as childcare providers,
health and welfare services, and sports and cultural institutions. These schools mostly serve
disadvantaged students. The purpose of this cooperation is to promote children’s development by
offering them help where necessary with problems at school or in their home setting, as well as by
offering additional activities (e.g., culture, sport), with which they normally have little contact; and in
some cases, additional instruction. The concept of the community school comes from an initiative by
local stakeholders such as municipalities, school boards and welfare services.74
Interestingly, recent research with Charter Management Organisations (CMO), which are similar to
MATs in the US (Glazer et al, 2016), indicates that even where the CMO has originally focussed on
classroom and school-focussed strategies for turning round schools in disadvantaged communities, it
has usually had to become more engaged with the community over time in order to secure
legitimacy in the eyes of parents.75
73 OECD (2015) Education Policy Outlook – Canada. OECD Publishing. 74 OECD (2012), Equity and Quality in Education: Supporting Disadvantaged Students and Schools, OECD Publishing. p. 126. 75 Massell, D., Glazer, J. and Malone, M. (2016) “This is the big leagues” – Charter-led turnaround in a non-charter world. Tennessee Consortium on Research, Evaluation and Development.

37
Conclusions and policy implications
Comparing the performance of disadvantaged pupils across different countries, England sits firmly in
the middle of this table, with the average GCSE mathematics grade achieved by FSM pupils around
3.8. However, this is more than half a grade lower than in the leading East Asian nations of Macao,
Singapore, Hong Kong, Taiwan and Japan.
There are a number of Western nations where low-income pupils perform better than their peers in
England, such as Estonia, Canada, the Netherlands, Ireland and Switzerland. Consequently, a
significant increase in GCSE mathematics performance – of at least a third of a grade – is needed
amongst FSM pupils for disadvantaged young people in England to match their peers in these parts
of the world.
The average GCSE English grade for the FSM group in England is estimated to be 4.0, which is similar
to the all-country average of 3.9, but below the leading countries for the language skills of
disadvantaged pupils, such as Canada, Finland, Estonia, Norway and the Republic of Ireland. Overall,
however, England compares reasonably well relative to some of the other countries included in our
comparison. The performance of FSM pupils in England, in GCSE English, is generally similar to the
language skills of disadvantaged young people in many other countries, including some with high
levels of average performance.
In England, the difference between these groups is approximately three-quarters of a GCSE English
Language grade. This is of similar magnitude to the all-country average of 0.80. Wales and Northern
Ireland are estimated to have a slightly smaller FSM gap than in England, with a difference of around
two-thirds of a grade. This puts these nations towards the top of Figure 1.6, with amongst the
smallest estimated socio-economic gaps in pupils’ English skills.
Other countries with a relatively small gap, but who are also high performers (in terms of overall
average scores across all pupils), are Estonia and Japan. At the other extreme is countries like,
Singapore, France, Spain and China, where the estimated gap between disadvantaged and not-
disadvantaged pupils is approaching a whole GCSE grade.
Countries with greater overall range in performance also tend to have a larger estimated FSM gap.
From this perspective, England’s FSM gap is in line with what would be expected given its overall
variation in educational performance.
There is no strong correlation between countries’ estimated FSM gaps and the average performance
of its pupils. It is not the case that developing an education system which prevents large socio-
economic gaps precludes the establishment of strong educational standards overall. If policy makers
in England want to replicate some of the best practice from leading nations, it needs to focus on
creating a responsive funding strategy, eliminating selection and the negative impact of school
choice and incentivising the recruitment and retention of high quality teachers in the most
disadvantaged schools.

38
Appendix A: Estimated FSM rates for countries’ PISA samples
A1: Number and proportion of PISA participants allocated to ‘FSM’ and ‘non-FSM’ groups
Country Non-FSM FSM % FSM
Iceland 3099 272 8.1%
Norway 4961 495 9.1%
Sweden 4917 541 9.9%
Canada 18060 1998 10.0%
Wales 3095 356 10.3%
Denmark 6422 739 10.3%
Finland 5272 610 10.4%
England 4648 546 10.5%
Scotland 2776 335 10.8%
Belgium 8599 1052 10.9%
Switzerland 5200 660 11.3%
Israel 5849 749 11.4%
Estonia 4941 646 11.6%
Netherlands 4757 628 11.7%
Northern Ireland 2119 282 11.7%
Singapore 5395 720 11.8%
New Zealand 3986 534 11.8%
Ireland 5051 690 12.0%
Japan 5840 807 12.1%
Germany 5708 796 12.2%
Austria 6148 859 12.3%
Russia 5285 751 12.4%
Australia 12621 1909 13.1%
South Korea 4846 735 13.2%
Slovenia 5521 885 13.8%
Luxembourg 4565 734 13.9%
USA 4916 796 13.9%
Slovak Republic 5465 885 13.9%
Italy 9952 1631 14.1%
Greece 4746 786 14.2%
Czech Republic 5890 1004 14.6%
France 5203 905 14.8%
Taiwan 6560 1148 14.9%
Hungary 4792 866 15.3%
Hong Kong 4528 831 15.5%
Latvia 4027 842 17.3%
Macao 3699 777 17.4%
Poland 3669 809 18.1%
Spain 5519 1217 18.1%
China 7957 1884 19.1%
Portugal 5853 1472 20.1%
Mexico 5474 2094 27.7%
Vietnam 4154 1672 28.7%
Turkey 4149 1746 29.6%
Median 5126 796 12.8%

39
Appendix B: Alternative results using old GCSE grades
Table B1: Alphabetic GCSE mathematics grades for FSM pupils by country
Country A Star A B C D E and below
Singapore 5% 13% 22% 32% 14% 14%
Macao 4% 12% 26% 35% 13% 11%
Hong Kong 3% 11% 23% 35% 14% 13%
Taiwan 4% 10% 21% 33% 15% 17%
Canada 3% 10% 22% 36% 15% 14%
Estonia 3% 10% 23% 35% 16% 13%
Japan 4% 10% 23% 35% 16% 13%
South Korea 3% 10% 21% 34% 16% 17%
Denmark 3% 9% 23% 36% 16% 14%
Finland 2% 9% 21% 35% 17% 14%
Switzerland 3% 9% 22% 33% 16% 18%
Russia 2% 9% 21% 36% 18% 15%
Norway 2% 8% 20% 35% 17% 17%
Netherlands 3% 8% 21% 34% 17% 17%
Ireland 2% 8% 20% 37% 17% 16%
China 3% 8% 18% 34% 17% 21%
Slovenia 2% 8% 20% 36% 17% 16%
Australia 2% 8% 19% 34% 18% 20%
New Zealand 3% 8% 18% 34% 19% 18%
Italy 2% 7% 17% 34% 19% 21%
Sweden 2% 7% 20% 36% 17% 16%
Scotland 2% 7% 19% 36% 18% 18%
Poland 2% 7% 19% 37% 17% 18%
England 2% 7% 18% 35% 19% 20%
Belgium 2% 7% 19% 32% 18% 21%
France 2% 7% 17% 32% 19% 23%
Germany 2% 7% 20% 34% 18% 18%
Czech Republic 2% 7% 17% 33% 19% 21%
Austria 2% 7% 18% 32% 18% 22%
Iceland 3% 6% 19% 36% 18% 18%
Northern Ireland 2% 6% 18% 37% 18% 19%
Portugal 2% 6% 15% 32% 20% 24%
Latvia 1% 6% 16% 37% 19% 21%
Luxembourg 2% 5% 15% 33% 20% 25%
Spain 1% 5% 15% 36% 21% 22%
Israel 1% 5% 15% 32% 20% 27%
Slovak Republic 1% 5% 15% 33% 20% 25%
Wales 1% 5% 16% 36% 22% 20%
Hungary 1% 5% 14% 33% 21% 26%
Vietnam 1% 5% 13% 35% 21% 25%
USA 1% 5% 14% 35% 19% 26%
Greece 1% 4% 13% 33% 21% 27%
Mexico 0% 2% 9% 27% 25% 37%
Turkey 0% 2% 8% 27% 24% 39%
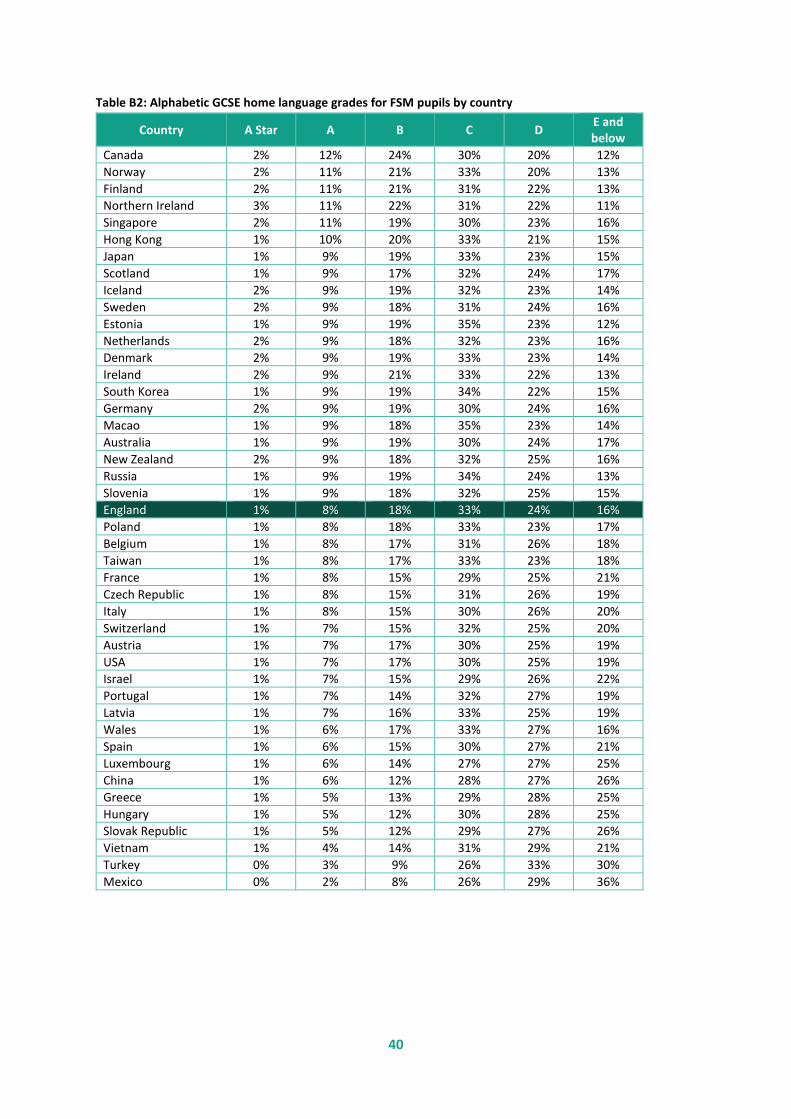
40
Table B2: Alphabetic GCSE home language grades for FSM pupils by country
Country A Star A B C D E and below
Canada 2% 12% 24% 30% 20% 12%
Norway 2% 11% 21% 33% 20% 13%
Finland 2% 11% 21% 31% 22% 13%
Northern Ireland 3% 11% 22% 31% 22% 11%
Singapore 2% 11% 19% 30% 23% 16%
Hong Kong 1% 10% 20% 33% 21% 15%
Japan 1% 9% 19% 33% 23% 15%
Scotland 1% 9% 17% 32% 24% 17%
Iceland 2% 9% 19% 32% 23% 14%
Sweden 2% 9% 18% 31% 24% 16%
Estonia 1% 9% 19% 35% 23% 12%
Netherlands 2% 9% 18% 32% 23% 16%
Denmark 2% 9% 19% 33% 23% 14%
Ireland 2% 9% 21% 33% 22% 13%
South Korea 1% 9% 19% 34% 22% 15%
Germany 2% 9% 19% 30% 24% 16%
Macao 1% 9% 18% 35% 23% 14%
Australia 1% 9% 19% 30% 24% 17%
New Zealand 2% 9% 18% 32% 25% 16%
Russia 1% 9% 19% 34% 24% 13%
Slovenia 1% 9% 18% 32% 25% 15%
England 1% 8% 18% 33% 24% 16%
Poland 1% 8% 18% 33% 23% 17%
Belgium 1% 8% 17% 31% 26% 18%
Taiwan 1% 8% 17% 33% 23% 18%
France 1% 8% 15% 29% 25% 21%
Czech Republic 1% 8% 15% 31% 26% 19%
Italy 1% 8% 15% 30% 26% 20%
Switzerland 1% 7% 15% 32% 25% 20%
Austria 1% 7% 17% 30% 25% 19%
USA 1% 7% 17% 30% 25% 19%
Israel 1% 7% 15% 29% 26% 22%
Portugal 1% 7% 14% 32% 27% 19%
Latvia 1% 7% 16% 33% 25% 19%
Wales 1% 6% 17% 33% 27% 16%
Spain 1% 6% 15% 30% 27% 21%
Luxembourg 1% 6% 14% 27% 27% 25%
China 1% 6% 12% 28% 27% 26%
Greece 1% 5% 13% 29% 28% 25%
Hungary 1% 5% 12% 30% 28% 25%
Slovak Republic 1% 5% 12% 29% 27% 26%
Vietnam 1% 4% 14% 31% 29% 21%
Turkey 0% 3% 9% 26% 33% 30%
Mexico 0% 2% 8% 26% 29% 36%