About TCS' Global Consulting Practice - · PDF fileas good as its supply chain management...
62
All content / information present here is the exclusive property of Tata Consultancy Services Limited (TCS). The content / information contained here is correct at the time of publishing. No material from here may be copied, modified, reproduced, republished, uploaded, transmitted, posted or distributed in any form without prior written permission from TCS. Unauthorized use of the content / information appearing here may violate copyright, trademark and other applicable laws, and could result in criminal or civil penalties. Copyright © 2015 Tata Consultancy Services Limited About Tata Consultancy Services (TCS) Tata Consultancy Services is an IT services, consulting and business solutions organization that delivers real results to global business, ensuring a level of certainty no other firm can match. TCS offers a consulting-led, integrated portfolio of IT and IT-enabled infrastructure, engineering and assurance services. This is delivered TM through its unique Global Network Delivery Model , recognized as the benchmark of excellence in software development. A part of the Tata Group, India’s largest industrial conglomerate, TCS has a global footprint and is listed on the National Stock Exchange and Bombay Stock Exchange in India. For more information, visit us at www.tcs.com IT Services Business Solutions Consulting TCS Design Services M 01 15 I I I About TCS' Global Consulting Practice TCS' Global Consulting Practice (GCP) is a key component in how TCS delivers additional value to clients. Using our collective industry insight, technology expertise, and consulting know-how, we partner with enterprises worldwide to deliver integrated end-to-end IT enabled business transformation services. By tapping our worldwide pool of resources - onsite, offshore and near-shore, our high caliber consultants leverage solution accelerators and practice capabilities, balanced with our knowledge of local market demands, to enable enterprises to effectively meet their business goals. GCP spearheads TCS' consulting capacity with consultants located in North America, UK, Europe, Asia Pacific, India, Ibero-America and Australia. Measuring Supply Chain Performance Retail Operations Benchmarking and Excellence Survey 2015
Transcript of About TCS' Global Consulting Practice - · PDF fileas good as its supply chain management...

All content / information present here is the exclusive property of Tata Consultancy Services Limited (TCS). The content / information contained here is correct at the time of publishing. No material from here may be copied, modified, reproduced, republished, uploaded, transmitted, posted or distributed in any form without prior written permission from TCS. Unauthorized use of the content / information appearing here may violate copyright, trademark and
other applicable laws, and could result in criminal or civil penalties. Copyright © 2015 Tata Consultancy Services Limited
About Tata Consultancy Services (TCS)
Tata Consultancy Services is an IT services, consulting and business solutions organization that delivers real results to global business, ensuring a level of certainty no other firm can match. TCS offers a consulting-led, integrated portfolio of IT and IT-enabled infrastructure, engineering and assurance services. This is delivered
TMthrough its unique Global Network Delivery Model , recognized as the benchmark of excellence in software development. A part of the Tata Group, India’s largest industrial conglomerate, TCS has a global footprint and is listed on the National Stock Exchange and Bombay Stock Exchange in India.
For more information, visit us at www.tcs.com
IT ServicesBusiness SolutionsConsulting
TCS
Des
ign
Serv
ices
M
01
15
II
I
About TCS' Global Consulting Practice
TCS' Global Consulting Practice (GCP) is a key component in how TCS delivers additional value to clients. Using our collective industry insight, technology expertise, and consulting know-how, we partner with enterprises worldwide to deliver integrated end-to-end IT enabled business transformation services.
By tapping our worldwide pool of resources - onsite, offshore and near-shore, our high caliber consultants leverage solution accelerators and practice capabilities, balanced with our knowledge of local market demands, to enable enterprises to effectively meet their business goals.
GCP spearheads TCS' consulting capacity with consultants located in North America, UK, Europe, Asia Pacific, India, Ibero-America and Australia.
Measuring Supply Chain Performance
Retail Operations Benchmarkingand Excellence Survey 2015
Contents
1. Introduction: Supply Chains Make or Break Retailers 1
2. Scope of This Study 8
3. Methodology Used for This Study 12
4. Executive Summary 16
5. Retailers’ Strategic Focus Areas for FY 2015-16 24
6. Detailed Survey Findings: Process and KPI Benchmarks 32
Fashion 32
Department Stores 46
Food and Grocery 60
Consumer Durables and Information Technology (CDIT) 74
Other Retailers – Books, Gifts, and Pharmacy 88
7. Multichannel Readiness 100
8. Views of 3PL Providers 104
9. Benchmarks from Global Retailers 106
10. Appendix 110
1
Supply Chains Make or Break Retailers
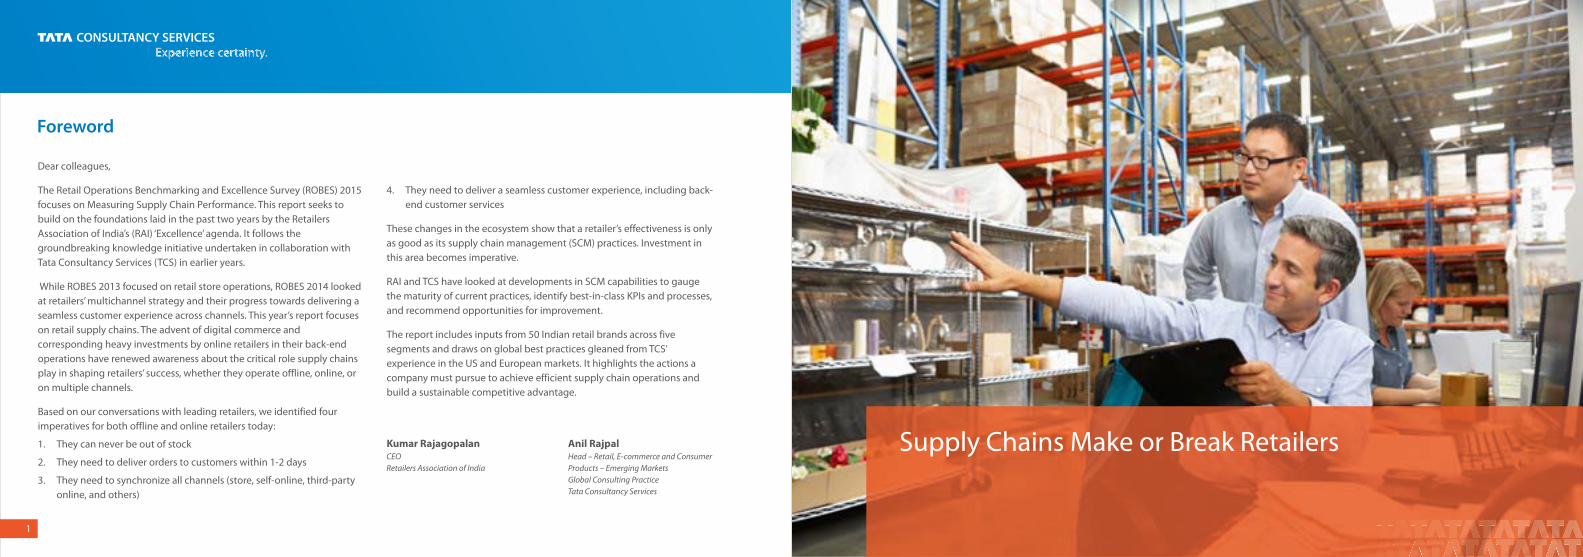
Foreword
Dear colleagues,
The Retail Operations Benchmarking and Excellence Survey (ROBES) 2015 focuses on Measuring Supply Chain Performance. This report seeks to build on the foundations laid in the past two years by the Retailers Association of India’s (RAI) ‘Excellence’ agenda. It follows the groundbreaking knowledge initiative undertaken in collaboration with Tata Consultancy Services (TCS) in earlier years.
While ROBES 2013 focused on retail store operations, ROBES 2014 looked at retailers’ multichannel strategy and their progress towards delivering a seamless customer experience across channels. This year’s report focuses on retail supply chains. The advent of digital commerce and corresponding heavy investments by online retailers in their back-end operations have renewed awareness about the critical role supply chains play in shaping retailers’ success, whether they operate offline, online, or on multiple channels.
Based on our conversations with leading retailers, we identified four imperatives for both offline and online retailers today:
1. They can never be out of stock
2. They need to deliver orders to customers within 1-2 days
3. They need to synchronize all channels (store, self-online, third-party online, and others)
4. They need to deliver a seamless customer experience, including back-end customer services
These changes in the ecosystem show that a retailer’s effectiveness is only as good as its supply chain management (SCM) practices. Investment in this area becomes imperative.
RAI and TCS have looked at developments in SCM capabilities to gauge the maturity of current practices, identify best-in-class KPIs and processes, and recommend opportunities for improvement.
The report includes inputs from 50 Indian retail brands across five segments and draws on global best practices gleaned from TCS’ experience in the US and European markets. It highlights the actions a company must pursue to achieve efficient supply chain operations and build a sustainable competitive advantage.
Kumar RajagopalanCEORetailers Association of India
Anil RajpalHead – Retail, E-commerce and Consumer Products – Emerging MarketsGlobal Consulting PracticeTata Consultancy Services
3
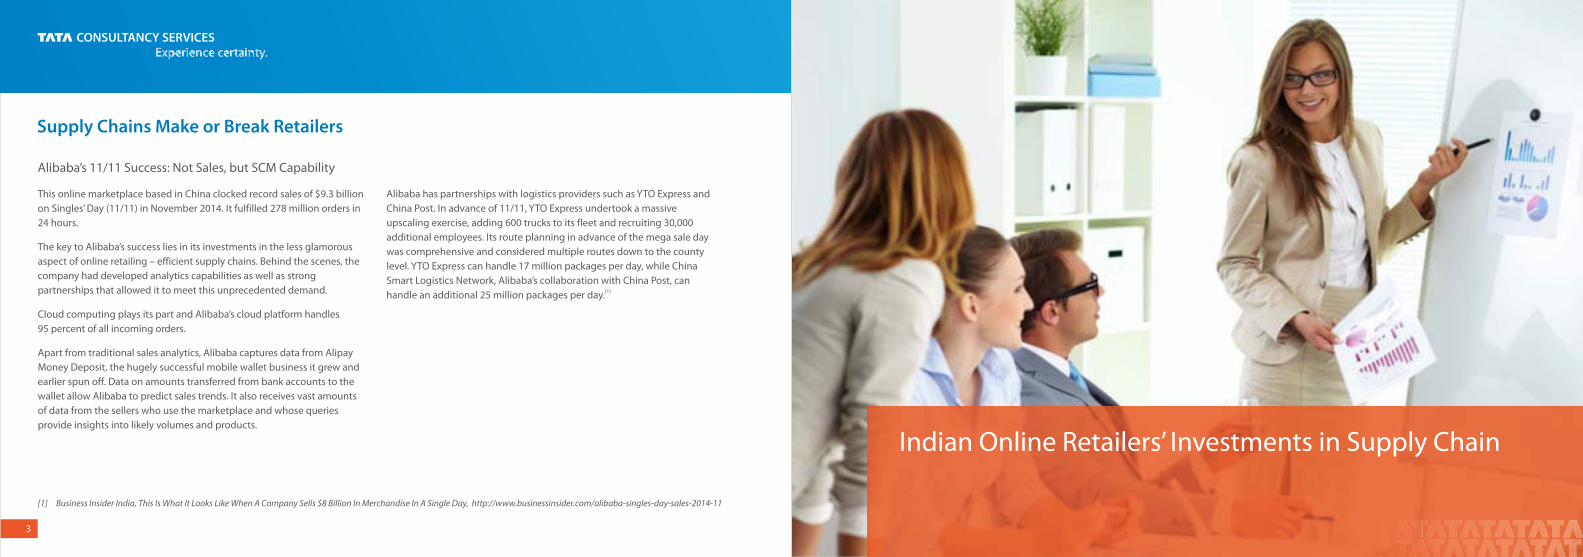
[1 ] Business Insider India, This Is What It Looks Like When A Company Sells $8 Billion In Merchandise In A Single Day, http://www.businessinsider.com/alibaba-singles-day-sales-2014-11
Alibaba’s 11/11 Success: Not Sales, but SCM Capability
This online marketplace based in China clocked record sales of $9.3 billion on Singles’ Day (11/11) in November 2014. It fulfilled 278 million orders in 24 hours.
The key to Alibaba’s success lies in its investments in the less glamorous aspect of online retailing – efficient supply chains. Behind the scenes, the company had developed analytics capabilities as well as strong partnerships that allowed it to meet this unprecedented demand.
Cloud computing plays its part and Alibaba’s cloud platform handles 95 percent of all incoming orders.
Apart from traditional sales analytics, Alibaba captures data from Alipay Money Deposit, the hugely successful mobile wallet business it grew and earlier spun off. Data on amounts transferred from bank accounts to the wallet allow Alibaba to predict sales trends. It also receives vast amounts of data from the sellers who use the marketplace and whose queries provide insights into likely volumes and products.
Alibaba has partnerships with logistics providers such as YTO Express and China Post. In advance of 11/11, YTO Express undertook a massive upscaling exercise, adding 600 trucks to its fleet and recruiting 30,000 additional employees. Its route planning in advance of the mega sale day was comprehensive and considered multiple routes down to the county level. YTO Express can handle 17 million packages per day, while China Smart Logistics Network, Alibaba’s collaboration with China Post, can
[1]handle an additional 25 million packages per day.
Indian Online Retailers’ Investments in Supply Chain
Supply Chains Make or Break Retailers

[2] Business Today, Profitable business model is a must for e-commerce firms, says PwC Director, http://businesstoday.intoday.in/story/pwc-on-indian-ecommerce-business-model-flipkart-jabong/1/209399.html
[3] The Economic Times, Will spend over $100 million on supply chain this year: Rohit Bansal, Snapdeal, http://articles.economictimes.indiatimes.com/2014-09-19/news/54108911_1_supply-chain-ecommerce-logistics-snapdeal
[4] Business Standard, Where will Flipkart spend its $1 billion?,http://www.business-standard.com/article/companies/where-will-flipkart-spend-its-1-billion-114072400152_1.html
Supply Chain is the Unglamorous Backbone of Retail
5
Supply Chains Make or Break Retailers
n The Indian e-commerce industry is expected to have an aggregated spend of $950 to $1,900 million each year between 2017-2020 on infrastructure, logistics, and warehousing, according to a study by
[2]ASSOCHAM and PwC.
n Snapdeal is making an estimated supply chain investment [3]of $100-125 million in FY 2014-15.
n After successfully raising $1 billion, Flipkart is expected to invest in [4]warehouse automation technologies such as Robotics.
Globally, customers now expect an 'Alibaba shopping performance' every day, from all retailers.

7
Observations
Manual processes in warehouse although warehouse management
is a high focus area
Imperatives
Automation initiatives such as use of robotics, conveyer belts, sorting techniques, WMS, and WCS to overcome manual process
constraints should be looked into
Implications
Meeting the expectations of a multichannel customer of low order
fulfillment time is a challenge
Supplier management is very low on maturity with 75 percent relying on
informal connect, 15 percent having fill rates of over 90 percent and 12 percent using
ASNs
Increase supplier collaborationby sharing of inventory data and delivery plans, adherence to delivery and quality standards, forecast accuracy, technology
integration
This adversely impacts customer service, quality, sales, and multichannel integration
Order (purchase) management is a challenge between buyers, vendors, and
logistics providers
Online dashboard for order management allows buyers to announce
orders, vendors to finalize orders, transport companies to pick up orders
This is vital in the digital erawith smaller order sizes and faster
fulfillment cycles
Multichannel retail initiatives remain slow, but the advent of e-commerce
has added urgency for digital experiments in SCM
Investment in supply chain infrastructure and systems will enable
real-time inventory visibility, forecast accuracy, and flexible returns
Poor channel integration, OOS, and higher markdowns along with loss of
customers preferring multichannel options
New KPIs are barely tracked – examples are cost per order, same day delivery, and
channel specific days of inventory
Data-centric supply chainwith focus on digital era metrics need to
be adopted by retailers
Online costs need to be measured or else this might amplify inefficiencies in
both offline and online models
Scope of This Study
Supply Chain is the Unglamorous Backbone of Retail

9
This comprehensive retail supply chain benchmarking study is the first of its kind in India and considers the following parameters:
Strategic Focus Areas
Key PerformanceIndicators (KPIs)
1
Process Maturity
2 3
Inventory
WarehousePeople
TransportationSuppliers
ProcessMaturity
The objective of our study was to understand the current status of retail supply chains. We have taken a three-dimensional view to answer three key questions for the Indian retailer.
n What are the industry benchmarks?
n What should the best practices be?
n In what direction is the industry moving?
The report considers these specific areas:
n Areas of strategic focus areas for FY 2015-16
n KPIs and process in five functional areas: Inventory, Warehouse, Suppliers, Transportation, People
10
Scope of This Study

11
The respondents represent a cross-section of the retail industry in India. Varied in size, segment, and multichannel contribution, they offer a snapshot of the current dynamics of the retail sector and suggest what its future may look like. The research sample included senior management (CXOs and MDs), heads of operations, and directors. 50 retail organizations provided over 1,500 data points.
The survey was conducted across five broad retail segments:
n Fashion, including apparel, footwear, and accessories
n Department stores
n Food and grocery
n Consumer durables and information technology (CDIT)
n Other retailers including books, gifts, pharmacy formats
The survey also captures, through interviews, the views and best practices of third-party logistics (3PL) providers.
Methodology Used for This Study

13
Data for the Retail Operations Benchmarking and Excellence Study was gathered through a survey designed and conducted by TCS in collaboration with RAI. This survey is based on TCS’ framework for operations benchmarking.
The survey was conducted in both online and offline modes, which included personal interviews conducted by TCS’ retail consultants with retail CXOs, most of whom are RAI members. Data was collected based on retail segments. Vertical segmentation in the study provided a cross-sectional view of the retail landscape. Fashion was the largest segment at 48 percent of the sample. The survey also included interviews with 3PL players to capture their views.
Findings from TCS’ survey - ‘Interconnected Retail: Transforming Retail Supply Chain for Omnichannel Retailing’ at Handelskongress 2014, Berlin, with more than 100 responses, are also included to provide a global perspective.
All company-specific data remains strictly confidential and only industry aggregates are discussed in this report. The numbers and percentages quoted in the report have been rounded off to the nearest integer.
14
n TCS’ Process Maturity Framework was used:
n Process maturity was defined from Level 1 (L1), being lowest maturity, to Level 4 (L4), being highest maturity or ‘Gold Standard’.
n Scores were allocated to each level of maturity, which ranged from 25 to 100 percent.
n Based on their overall performance, survey respondents were categorized as laggards (below average score) or leaders (above average score).
n One-to-one, in-depth interactions with CXOs captured data and insights.
The research sample included senior management (CXOs and MDs), heads of operations, and directors. 50 retail brands provided over 1,500 data points.
TCS Process Maturity Framework
100%
75%
50%
25%
Level 4
Level 3
Level 2
Level 1
Unified customer marketing and relationship program
Overlapping programs (common promotions)
Channel-specific programs
Store-based CRM program
Scor
es
Example: Customer Experience
Methodology Used for This Study

Executive Summary

1817
The survey results suggest that supply chain maturity in the Indian retail industry is low. All the five processes covered in this report score 64 percent or less. While warehouse management is more mature in comparison to other functions, areas such as supplier integration and inventory management present significant scope for improvement.
The top supply chain challenges for retailers in FY 2015-16 will be in the areas of inventory reduction, and warehouse and transportation efficiency. This is also reflected in their technology investment plans.
More than 50 percent of respondents stated their readiness for the introduction of a Goods and Services Tax (GST), where new legislation is expected soon.
Multichannel readiness is still lacking, with only 10 percent reporting it as a focus area. Retailers do not seem to have real-time inventory and order visibility on their radar for the coming year despite the phenomenal growth of online retail in India.
Sustainability practices are low among the priorities of Indian retailers, while performance improvement and efficiency are higher priorities.
Technology integration with suppliers is low and is seen as low priority by most respondents. Supplier fill rates and quality are still perceived as challenges. Only 10 percent of respondents have mandatory certifications for their suppliers and conduct quality audits. Lack of supplier evolution is cited as a reason for this.
Inventory norms and policies are still not mature. Nearly half of the respondents do not use systems to manage their inventory scientifically.
Department stores show greater maturity than other retail segments.
The retail industry’s supply chain maturity is low, with each of the five processes covered scoring less than 64 percent.
Warehouse management is the most mature function, scoring 64 percent, and is viewed as the top strategic priority by most retailers.
Transport management is second at 54 percent, but its maturity can be attributed to 3PL partners, as this function is usually outsourced.
People management at 50 percent, inventory management at 49 percent, and supplier management scoring 37 percent are all low on maturity, though retailers consider inventory management a strategic priority area.
Process Maturity – Industry Benchmark Scores
49%
64%
54%
37%
50%
0%
20%
40%
60%
80%Inventory
Warehouse
TransportSupplier
People
Executive Summary – Key Takeaways Executive Summary – Industry Maturity

19
Poor integration and limited collaboration with suppliers indicates that supplier management remains a challenge, and retailers do not view this as a near-term priority.
Comparisons drawn between supply chain maturity and other retail areas such as store operations and multichannel (evaluated as part of ROBES 2013 and 2014 studies respectively), show that supply chain processes are low in maturity although they are considered the backbone of retail. Whereas the highest score in supply chain is 64 percent, the highest process maturity in store operations was 82 percent and in multichannel,
[5]75 percent.
Retail supply chain exhibits low maturity compared to other retail functions.
“The current supply chain maturity in the retail industry can be well compared to the diversity of the country demographics and the digital divide. This means the technologically advanced, financially rich are moving at a very fast pace; the followers are learning fast and taking measures to catch up to speed and maturity; while the laggards may run out of time to catch up and need support right from strategic to financial aspects."
Amit Gourwar,Head - Logistics, Infinity Retail Limited (Croma)
[5] Indian Retail Operations Benchmarking and Excellence Survey 2013, www.tcs.com/SiteCollectionDocuments/White%20Papers/Consulting-Whitepaper-Indian-Retail-Operations Benchmarking-Excellence-Survey-0113-1.pdf; Retail Operations Benchmarking and Excellence Survey 2014, The State of Multichannel Retail, www.tcs.com/SiteCollectionDocuments/White%20Papers/Retail-Operations-Benchmarking-Excellence-Survey-2014_State-of-Multichannel-Retail_02-14-2.pdf
“The current supply chain maturity in the retail industry can be well compared to the diversity of the country demographics and the digital divide. This means the technologically advanced, financially rich are moving at a very fast pace; the followers are learning fast and taking measures to catch up to speed and maturity; while the laggards may run out of time to catch up and need support right from strategic to financial aspects.’’
Amit Gourwar,Head – Logistics, Infiniti Retail Limited (Croma)
Inventory
Leaders
Laggards
67%
33%
49%
Benchmark
Transportation
Leaders
Laggards
56%
44%
54%
Benchmark
Supplier
Leaders
Laggards
54%
46%
37%
Benchmark
Warehouse
Leaders
Laggards
69%
31%
64%
Benchmark
People
Leaders
Laggards
54%
46%
50%
Benchmark
Scope for Sharingof Best Practices
Medium
HighMedium
Low Medium
20
Executive Summary – Industry Maturity Executive Summary – Supply Chain Process Maturity Is Low
Average score of a function
% of respondents scoring above average
% of respondents scoring below average
21 22
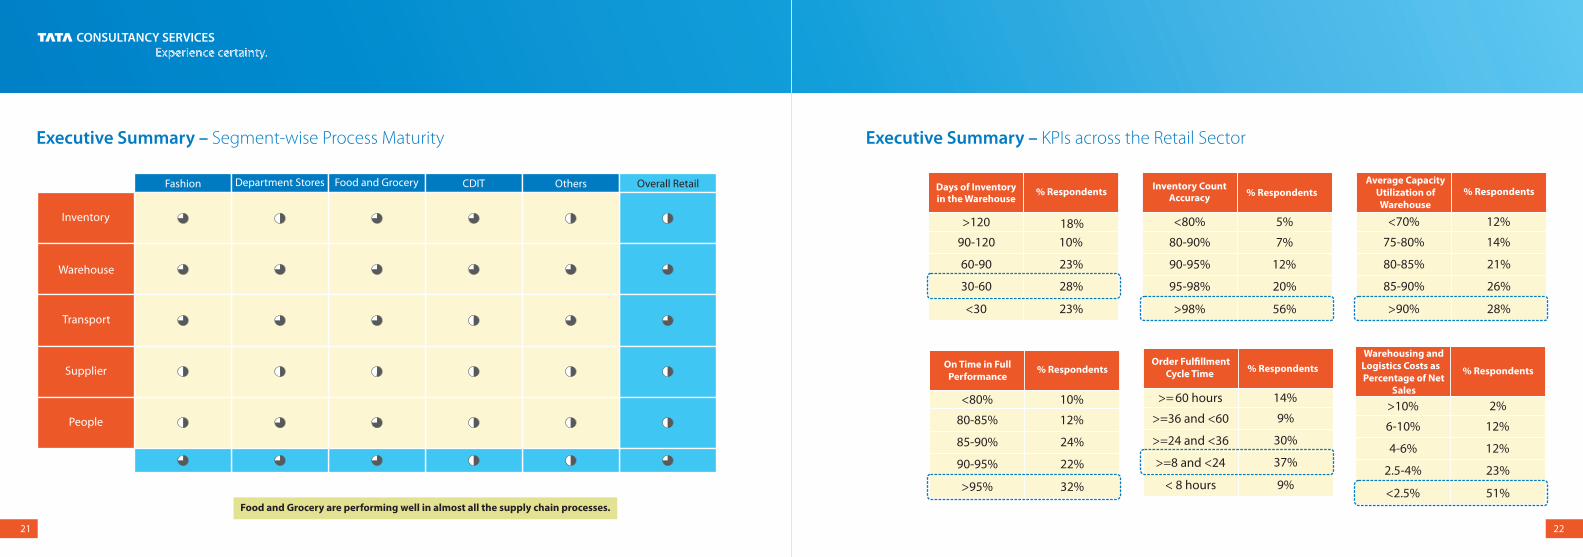
Food and Grocery are performing well in almost all the supply chain processes.
Inventory
Fashion Department Stores Food and Grocery CDIT Others Overall Retail
Warehouse
Transport
Supplier
People
Days of Inventoryin the Warehouse
% Respondents
>120 18%
90-120 10%
60-90 23%
30-60 28%
<30 23%
Inventory CountAccuracy % Respondents
<80% 5%
80-90% 7%
90-95% 12%
95-98% 20%
>98% 56%
Average Capacity Utilization of Warehouse
% Respondents
<70% 12%
75-80% 14%
80-85% 21%
85-90% 26%
>90% 28%
On Time in Full Performance
% Respondents
<80% 10%
80-85% 12%
85-90% 24%
90-95% 22%
>95% 32%
Order Fulfillment Cycle Time % Respondents
>= 60 hours 14%
>=36 and <60 9%
>=24 and <36 30%
>=8 and <24 37%
< 8 hours 9%
Warehousing and Logistics Costs as Percentage of Net
Sales
% Respondents
>10% 2%
6-10% 12%
4-6% 12%
2.5-4% 23%
<2.5% 51%
Executive Summary – Segment-wise Process Maturity Executive Summary – KPIs across the Retail Sector

23
Returns on Dispatches
% Respondents
>20% 2%
15-20% 5%
10-15% 7%
5-10% 18%
0-5% 68%
Shrinkage in Supply Chain
% Respondents
>3% 2%
2-3% 7%
1-2% 2%
0.5-1% 19%
<0.5% 69%
Supplier Fill Rate % Respondents
<60% 3%
60-70% 10%
70-80% 28%
80-90% 40%
>90% 18%
Average PO Lead Time
% Respondents
>30 days 32%
10-30 days 27%
3-10 days 25%
1-3 days 11%
<1 day 5%
Average Annual Training Hours
% Respondents
<10 hours 26%
10-20 hours 28%
20-30 hours 21%
30-40 hours 15%
>40 hours 10%
Retailers’ Strategic Focus Areas for FY 2015-16
Executive Summary – KPIs across the Retail Sector

Strategic Focus Areas in the Retail Supply Chain
Top Challenges for FY 2015-16Cross Segment (% Respondents)
14%
13%
12%
11%
8%
Technologysystems
Cost cutting,Sourcing, Adaptingfor Multichannel
Coping withthe pace ofchange
Transportefficiency
Warehouseefficiency
Inventoryreduction
19%
Inventory reduction and warehouse efficiency are the top challenges in the supply chain for FY 2015-16.
“The organized retail sector in India is growing, so the role of the supply chain becomes more important as it needs to be more responsive and adaptive to customers’ demand. There is also a need for the supply chain to be more cost efficient and collaborative to win the immense competition in this sector.”
Reeja Sujoy,Head – Supply Chain
The Mobile Store
25 26
Focus Areas for Technology Investment
Inventory and warehouse management top the agenda for technology investments in the supply chain for FY 2015-16.
Focus Areas for Technology Investment
0% 5% 10% 15% 20% 25%
Inventory management
Warehouse management
Warehouse automation
Demand planning
Distributed order management
RFID
Productivity tools
Shelf ready merchandise
24%
19%
13%
9%
1%
11%
5%
19%

27 28
The Goods and Services Tax (GST) is a proposed comprehensive tax levy on manufacture, sale and consumption of goods and services at national level in India, which will be replacing all indirect state and central taxes. The implication of GST assures a single taxation system in the entire country for all goods and services making tax compliance easier and more effective.
The majority of retailers who responded feel that GST will improve their supply chain efficiency by allowing them to consolidate small scattered depots into larger distribution centers, thereby, enabling them to deploy state-of-the-art planning and warehousing systems. The network planning will improve as logistic providers would not consider taxes while deciding on the most cost optimized routes.
GST Readiness
“Retail supply chain is highly fragmented in India. Once GST is introduced, companies like us can make serious investments in mechanized Supply Chain to service various states given the improvements in infrastructure.”
Ashutosh Garg,Chairman, Guardian Lifecare
More than half of the retailers are prepared for GST.
18%
24%58%
Is your organization GST ready?
Yes No Partially
Multichannel Readiness
Although Amazon has created new standards for supply chain, only 10 percent of retailers are looking at multichannel adaptability as a focus area for FY 2015-16. The multichannel readiness of retailers was measured in terms of their multichannel capabilities and the features offered.
Real-time inventory and order visibility are the most important capabilities for multichannel readiness.
“The online warriors have greatly contributed to making the supply chain more agile by meeting strict SLAs.”
K Radhakrishnan,Co-founder, www.grocermax.com
Multichannel Readiness of Supply Chain
25%
28%
18%
11%
5%
11%
0%
3%
0% 5% 10% 15% 20% 25% 30%
Real time order visibility
Real time inventory visibility
Instant despatch
Click and collect at store
Charge / Penalty for deliveries
Forecast accuracy
Others(Please add your own)
Not applicable

29
Sustainability Initiatives
30
Top 10 Strategic Initiatives in Supply Chain Management
Supplier collaboration and recycling initiatives with reverse logistics top sustainability initiatives.
9%
14%
21%
23%
33%
0% 5% 10% 15% 20% 25% 30% 35%
Internal carbon footprint optimization and improvement
Responsible footprint and procurement framework
Certification / Compliance standard adherence
Reverse logistics to manage recycling
Supplier / Partner cooperation and strategic alliances to align on sustainability targets
Initiatives for Sustainability
1. Warehouse-related initiatives are the most common among retailers. This includes deployment of warehouse management systems (WMS), integration of WMS with ERP, warehouse automation, and initiatives for increasing warehouse capacity and efficiency.
2. Other initiatives taken on the warehouse front include mechanization of housekeeping, use of material handling equipment, and utilization of vertical stackers and other ways to optimize vertical space for better capacity utilization.
3. Implementation of auto-replenishment systems: Bigger and more mature retailers are using theory-of-constraints and six sigma initiatives for replenishment management.
4. Logistics initiatives include monitoring of delivery efficiency, logistics cost reduction, and transportation efficiency initiatives through network optimization.
5. Last-mile connect initiatives include partnering with logistics service providers for different areas.
6. Implementation of supplier portals is expected to improve vendor relations and provide supply chain transparency.
7. Vendor partnering and automation initiatives are planned with the aim to increase the frequency of supplies.
8. Collaboration with suppliers includes training of their staff on packaging of products.
9. Significant cost-cutting measures, including pilferage control, are taken up.
10. Some retailers are focusing on employee engagement through an improvement initiatives calendar.
Sustainability is yet to see activism from Indian retailers, as only 4 percent of retailers consider it a strategic focus area.

Detailed Survey Findings (Process and KPI Benchmarks) Fashion
34
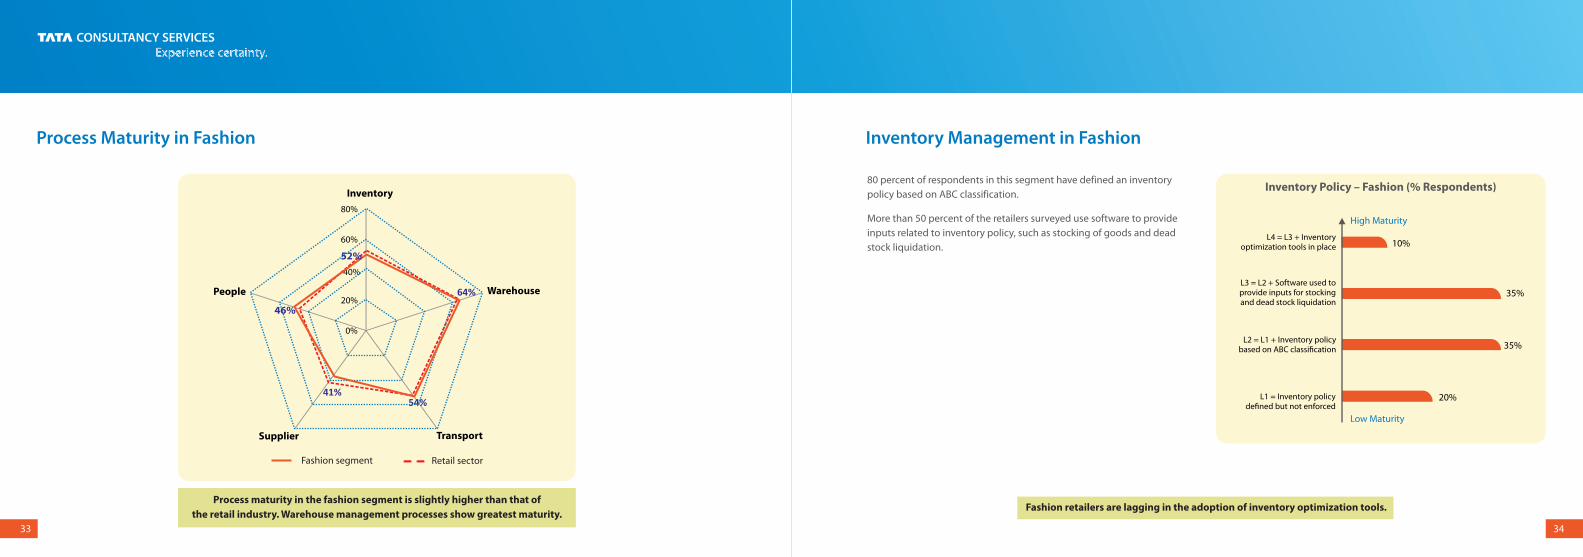
Inventory Management in Fashion
80 percent of respondents in this segment have defined an inventory policy based on ABC classification.
More than 50 percent of the retailers surveyed use software to provide inputs related to inventory policy, such as stocking of goods and dead stock liquidation.
33
Process Maturity in Fashion
64%
54%41%
0%
20%
40%
60%
80%
Inventory
Warehouse
TransportSupplier
People
Process maturity in the fashion segment is slightly higher than that of the retail industry. Warehouse management processes show greatest maturity.
Fashion retailers are lagging in the adoption of inventory optimization tools.
20%
35%
35%
10%
L1 = Inventory policy defined but not enforced
L2 = L1 + Inventory policy based on ABC classification
L3 = L2 + Software used to provide inputs for stocking and dead stock liquidation
L4 = L3 + Inventory optimization tools in place
High Maturity
Low Maturity
Inventory Policy – Fashion (% Respondents)
46%
Fashion segment Retail sector
52%

Inventory Count Accuracy
% Respondents
<80% 5%
80-90% 16%
90-95% 11%
95-98% 16%
>98% 53%
Days of Inventoryin the Warehouse
% Respondents
>120 24%
90-120 14%
60-90 24%
30-60 19%
<30 19%
Returns on Dispatches
% Respondents
>20% 5%
15-20% 5%
10-15% 5%
5-10% 29%
0-5% 57%
35
80 percent of fashion retailers report shrinkage in the supply chain at less than 0.5 percent of sales.
More than 50 percent respondents in the fashion segment have an inventory count accuracy of more than 98 percent.
A quarter of fashion retailers hold inventory for more than 120 days.
36
Warehouse Management in Fashion
Warehouse management is the most mature process for fashion retailers.
There is scope for improvement in automation. 75 percent of fashion retailers have partial automation in the warehouse (with some processes being manual and others technology-enabled). Processes are followed consistently and they deploy at least two of the following technologies: WMS, warehouse control system (WCS), Wi-Fi, and bar code scanners and radio frequency (RF) scanners.
This is consistent with the fact that a majority of the fashion retailers reported undertaking strategic initiatives like WMS deployment and automation.
None of the fashion retailers have full automation (wherein all processes are system-enabled) in the warehouse.
Inventory Management in Fashion
Automation in Warehouse – Fashion (% Respondents)
Low Maturity
10%
15%
75%
0%
L1 = Manual processes not followed consistently
L2 = Manual processes followed consistently
L3 = Processes followed consistently and at least two technologies such as WMS,
WCS, Wi-Fi, and bar code and RF scanners are present
L4 = Processes followed consistently; full automation; complete IT
infrastructure including WMS and WCS
High Maturity

37
Around 70 percent of retailers generate pick lists from WMS indicating a high level of maturity. However, 75 to 80 percent are still conducting a physical inventory count instead of cycle counts based on ABC classification.
38
Warehouse Management in Fashion
Warehouse capacity utilization is higher than 80 percent for the majority of fashion retailers.
Warehouse Management in Fashion
Low Maturity
High Maturity
10%
25%
50%
15%
L1 = Manual picking; staff not trained
L2 = Manual rules for picking; MHEused; partially trained staff
L3 = Pick list generation through WMSbut no automation; fully trained staff
L4 = Pick list generation in the RFdevice; use of rules such as wave
picking; fully trained staff
Picking in the Warehouse – Fashion (% Respondents)
10%
24%
48%
19%
L1 = No cycle count done
L2 = Physical inventory count matchedagainst system inventory randomly
L3 = Physical inventory countmatched with system inventory at
periodic intervals
L4 = Cycle count based on ABCclassification
Cycle Count – Fashion (% Respondents) “When GST is implemented, the warehousing networks are going to be optimized and the number of smaller warehouses will be replaced by bigger ones at the regional level.”
S Kumar Anavangot,Manager, Special Projects – CEOs Office – Supply Chain, Pantaloons
Order Fulfillment Cycle Time
% Respondents
>= 60 hours 25%
>=36 and <60 15%
>=24 and <36 25%
>=8 and <24 25%
< 8 hours 10%
Average Warehouse Capacity Utilization
% Respondents
<70% 5%
70-80% 14%
80-85% 19%
85-90% 29%
>90% 33%Warehousing and Logistics Costs as Percentage of Net
Sales
% Respondents
>10% 0%
6-10% 5%
4-6% 14%
2.5-4% 29%
<2.5% 52%Low Maturity
High Maturity

40
The process for tracking shipments from warehouse or distribution center (DC) to store is inefficient due to negligible use of technology, as evident from the fact that 75 percent of retailers track shipments through phone calls and matching of physical receipts.
The fashion segment has taken preliminary steps to improve this process through GPS-enabled fleets, but is still far from experimenting with radio-frequency identification (RFID) tags at the pallet or case level.
39
Transport Management in Fashion
Around 70 percent of fashion retailers use a combination of dedicated fleet and 3PL.
Around 40 percent of fashion retailers have an OTIF performance greater than 90 percent.
“Considering the rapid changes in e-commerce business in India, we need to improve the speed of logistics management through air transportation connectivity to 2nd tier towns and cities also.”
P. Sukumaran,Group Manager – Supply Chain Management,
Titan CompanyOn Time in Full
Performance% Respondents
<80% 16%
80-85% 16%
85-90% 32%
90-95% 21%
>95% 16%
Transport Management - Fashion (% Respondents)
Transport Management in Fashion
Only 10 percent of retailers have GPS-enabled fleet for tracking of shipments.
Tracking of Shipment from Warehouse/DC to Store – Fashion (% Respondents)
15%
75%
10%
0%
L1 = Ad hoc tracking of shipments
L2 = Regular tracking of shipmentthrough phone calls and matching of
physical receipts
L3 = Complete tracking of shipmentfrom source to destination through
GPS enabled fleet
L4 = L3 + Pallet-level or case-leveltracking using RFID
High MaturityL4 = L3 + Network optimization, route planning, and TMS integrated to WMS
70%
0%
25%
5%
Low Maturity
L3 = Dedicated fleet/third-party logistics and transport management systems
L2 = Long-term contracts (including in-transit insurance) with transporters
L1 = On ad hoc basis by daily rentals of trucks through agents
High Maturity
Low Maturity

41
Supplier Management in Fashion
Process maturity is low as only 38 percent of fashion retailers state that adherence to quality standards is linked to rewards and penalties for suppliers.
This is also reflected in the fact that improving supplier relationships is not a strategic priority for retailers in FY 2015-16.
Only 10 percent of retailers are at the highest level of maturity with mandatory certifications and audits on supplier facilities. Those at this level are international fashion brands bringing best practices from their parent brands.
42
Supplier integration with retailers is extremely low, as 80 percent of retailers manage orders through informal communications on phone, fax, and email.
Only 10 percent of retailers use advance shipping notices (ASN) and another 5 percent deploy supplier relationship management (SRM) systems.
Adherence of Suppliers to Quality Standards –Fashion (% Respondents)
38%
38%
14%
10%
L1 = Quality adherence process exists;not linked to rewards and penalties
L2 = Quality adherence process linkedto rewards and penalties for supplier
L3 = L2 + Mandated quality policies forsupplier facilities with certifications
L4 = L3 + Complete integration ofsupplier facilities; periodic audits
Supplier management processes have very low maturity, as these are not a strategic priority for fashion retailers.
Supplier Management in Fashion
Supplier Integration – Fashion(% Respondents)
Supplier integration through technology is critically low as only 5 percent of retailers have SRM software.
High MaturityL4 = Complete inventory visibility with
key suppliers through SRM software
Low Maturity
L3 = Pre-receiving process of ASN; pre-slotting of items
L2 = Systemic integration through EDI including ASN
L1 = Informal communicationon phone, fax, and email
10%
5%
80%
5%
High Maturity
Low Maturity

43
Supplier Management in Fashion
Only 58 percent of retailers have fill rates above 80 percent.
The average purchase order (PO) lead time is more than 30 days for almost 50 percent of retailers. It is as much as 120 days for imported SKUs for some fashion retailers.
“It is imperative to have a good supply chain to scale up the business. This implies good, strong supplier relationships, mutual understanding, and partnership in our business; suppliers are strategic partners in our growth. The key difference between retail supply chains stems from the way their suppliers are treated. We need suppliers as much they need us.”
Swaroop Chandrashekar,COO and Founder, Deepam Silks
44
People Management in Fashion
Training falls into two types: induction and periodic. Induction training addresses process and system SOPs while periodic training covers topic-based sessions such as packing and goods handling.
The average number of training hours in supply chain departments is low and employees are encouraged to participate when time permits.
Only 11 percent of retailers have supplier fill rates greater than 90 percent.
Average PO Lead time
% Respondents
>30 days 45%
10-30 days 35%
3-10 days 10%
1-3 days 10%
<1 day 0%
Supplier Fill Rate % Respondents
<60% 5%
60-70% 5%
70-80% 32%
80-90% 47%
>90% 11%
Annual Training Hours(per Employee) % Respondents
<10hours 39%
10-20hours 22%
20-30hours 17%
30-40hours 11%
>40hours 11%
Training in Supply Chain Department – Fashion(% Respondents)
55%
5%
30%
10%
L1 = Training plan for the calendar yearexists; employees encouraged to
attend training as time permits
L2 = Well-defined training plan;mandatory to attend training of at
least 40 hours per year
L3 = Well-defined training plan linked to individual competency
development plan
L4 = Employee training anddevelopment linked to manager's KRAs
High Maturity
Low Maturity

50%
15%
10%
25%
L1 = Fixed pay plus performance-based incentives linked to KRAs
L2 = Flexible pay – basket ofallowances, employee discounts
L3 = L2 + Medical reimbursement,sponsorship of higher education
L4 = L3 + Health/life/accidentinsurance for self and family
Low Maturity
High Maturity
45
People Management in Fashion
Only 25 percent of fashion retailers reach the highest level of maturity, offering benefits such as health, life, accident insurance, medical reimbursements, sponsorship for higher education, and employee discounts.
50 percent of employees working in supply chain departments receive fixed pay plus performance-based remuneration linked to KRAs.
Manpower productivity in the warehouses of fashion retailers varies from an average of 200 to 500 items per day.
People Benefits – Fashion (% Respondents)
Detailed Survey Findings (Process and KPI Benchmarks) Department Stores
“India will face the largest gap in supply chain talent across multiple levels (right from warehouse and transport staff to the senior levels of SC management). This needs to be addressed by offering Supply Chain and Logistics courses from local ITIs, Diploma schools, and Engineering colleges.”
Dr. Anil Chinnabhandar,VP, Landmark Group (Max Retail Division)

47
Process Maturity in Department Stores
Warehouse management is the most mature function in the department store segment.This segment has been faster than others to adopt multichannel strategies.
48
Inventory Management in Department Stores
Department stores report low scores for inventory management processes. 40 percent of respondents claim that inventory policy is defined but not enforced.
40 percent of respondents claim that inventory policy is defined and managed with inputs from inventory management and optimization software.
“Most traditional retailers will have to go through a learning curve. The more agile ones will focus on principles of supply chain to ensure quick and accurate deliveries.”
Shamik Vora,Vice President, The Bombay Store
Huge variation exists in process maturity for inventory management, with 60 percent of retailers at level 2 or below.
Inventory Policy – Department Stores (% Respondents)
40%
20%
0%
40%
L1 = Inventory policy defined but not enforced
L2 = L1 + Inventory policy based on ABC classification
L3 = L2 + Software used to provideinputs for stocking and dead stock
liquidation
L4 = L3 + Inventory optimization tools in place
40%
65%
53%44%
54%
0%
20%
40%
60%
80%Inventory
Warehouse
TransportSupplier
People
Department stores Retail sector
Process Maturity in Department Stores
Low Maturity
High Maturity

49
Majority of department stores have manageable inventory levels andare managing them well, as evident from high inventory count accuracy.
50
80 percent of department store retailers report supply chain shrinkage of less than 0.5 percent of sales.
40 percent of department stores hold an inventory of 30-60 days in the warehouse.
80 percent of department stores record inventory count accuracy greater than 98 percent.
Inventory Management in Department Stores
Inventory Count Accuracy
% Respondents
<80% 0%
80-90% 0%
90-95% 0%
95-98% 20%
>98% 80%
Days of Inventory in the Warehouse
% Respondents
>120 0%
90-120 20%
60-90 20%
30-60 40%
<30 20%
Returns on Dispatches
% Respondents
>20% 0%
15-20% 20%
10-15% 20%
5-10% 20%
0-5% 40%
Warehouse Management in Department Stores
Department stores have mature warehouse automation. 40 percent of respondents have full automation, where processes are followed consistently and IT infrastructure such as WMS and WCS is deployed.
With highest maturity in warehouse management processes, 40 percent ofdepartment store retailers have complete automation in their warehouses.
Automation in Warehouse – Department Stores (% Respondents)
High Maturity
L4 = Processes followed consistently; full automation; complete IT
infrastructure including WMS and WCS
Low Maturity
L3 = Processes followed consistently and at least two technologies such as
WMS, WCS, Wi-Fi, and bar code and RF scanners are present
L2 = Manual processes followed consistently
L1 = Manual processes not followed consistently 20%
40%
20%
20%

51
Warehouse Management in Department Stores
Picking in the Warehouse – Department Stores (% Respondents)
Cycle Count – Department Stores(% Respondents)
L4 = Cycle count based on ABC classification
L3 = Physical inventory count matched with system inventory at periodic intervals
L2 = Physical inventory count matched against system inventory randomly
L1 = No cycle count done 0%
60%
20%
20%
High Maturity
L4 = Pick list generation in the RF device; use of rules such as wave picking;
fully trained staff
Low Maturity
L3 = Pick list generation through WMS but no automation; fully trained staff
L2 = Manual rules for picking; MHE used; partially trained staff
L1 = Manual picking; staff not trained 20%
60%
20%
0%
80 percent of department stores have warehousing and logistics costs lower than 2.5 percent of net sales.
Warehouse Management in Department Stores
Warehousing and Logistics Costs as
Percentage of Net Sales
% Respondents
6-10% 20%
4-6% 0%
2.5-4% 0%
<2.5% 80%
Average Warehouse Capacity Utilization
% Respondents
<70% 20%
70-80% 0%
80-85% 40%
85-90% 20%
>90% 20%
Order Fulllment Cycle Time
% Respondents
>=36 and <60 0%
>=24 and <36 20%
>=8 and <24 60%
< 8 Hours 20%
52
High Maturity
Low Maturity
Most department stores use technologically-enabled picking methods and cycle count is based on ABC classification of goods.

53 54
60 percent of department stores report an OTIF performance of more than 95 percent.
Transport Management in Department Stores
Transport Management - Department Stores (% Respondents)
Tracking of Shipment from Warehouse/DC toStores – Department Stores (% Respondents)
0%
40%
60%
0%
L1 = On ad hoc basis by dailyrentals of trucks through agents
L2 = Long-term contracts (including in-transit insurance)
with transporters
L3 = Dedicated fleet/third-partylogistics and transportmanagement systems
L4 = L3 + Network optimization,route planning, and TMS integrated
to WMS
High Maturity
Low Maturity
20%
40%
20%
20%
L1 = Ad hoc tracking of shipments
L2 = Regular tracking of shipmentthrough phone calls and
matching of physical receipts
L3 = Complete tracking of shipmentfrom source to destination through
GPS enabled fleet
L4 = L3 + Pallet-level or case-leveltracking using RFID
Use of technology such as transport management system (TMS), GPS, and RFID-enabled tracking helped department stores to record high maturity.
Transport Management in Department Stores
Total returns on dispatches vary significantly across department stores:40 percent have less than 5 percent whereas 20 percent have returns of 15-20 percent.
“Retail supply chain is still not mature, especially in transportation, where everything is manual.”
Vineet Gautam,CEO, Bestseller
On Time in Full Performance
% Respondents
<80% 0%
80-85% 0%
85-90% 20%
90-95% 20%
>95% 60%
High Maturity
Low Maturity

5655
Supplier Management in Department Stores Supplier Management in Department Stores
Process maturity is low as only 40 percent of department store retailers have mandatory quality policies for supplier facilities including certifications.
60 percent of retailers link quality adherence to a rewards-penalty mechanism.
Respondents believe that supplier collaboration is tough, as suppliers need to undergo a huge evolution in terms of processes and systems, and are limited by lack of adequate resources and infrastructure. Many department stores do not enforce penalties as part of quality adherence.
Department stores have low maturity in supplier processes.
Adherence of Suppliers to Quality Standards –Department Stores (% Respondents)
40%
20%
40%
0%
L1 = Quality adherence process exists;not linked to rewards and penalties
L2 = Quality adherence process linkedto rewards and penalties for supplier
L3 = L2 + Mandated quality policies forsupplier facilities with certifications
L4 = L3 + Complete integration ofsupplier facilities; periodic audits
Low Maturity
High Maturity
The average PO lead time is more than 30 days for 80 percent of department store retailers. For the remainder, it is between 10 and 30 days.
Supplier fill rates are high and supplier integration is quite maturewith 60 percent of retailers using ASN and pre-slotting of items.
Supplier Fill Rate % Respondents
<60% 0%
60-70% 0%
70-80% 20%
80-90% 40%
>90% 40%
Supplier Integration - Department Stores (% Respondents)
L4 = Complete inventory visibility with key suppliers through SRM software
L3 = Pre-receiving process of ASN, pre-slotting of items
L2 = Systemic integration through EDI including ASN
L1 = Informal communicationon phone, fax, and email 40%
0%
60%
0%
Low Maturity
High Maturity
57 58
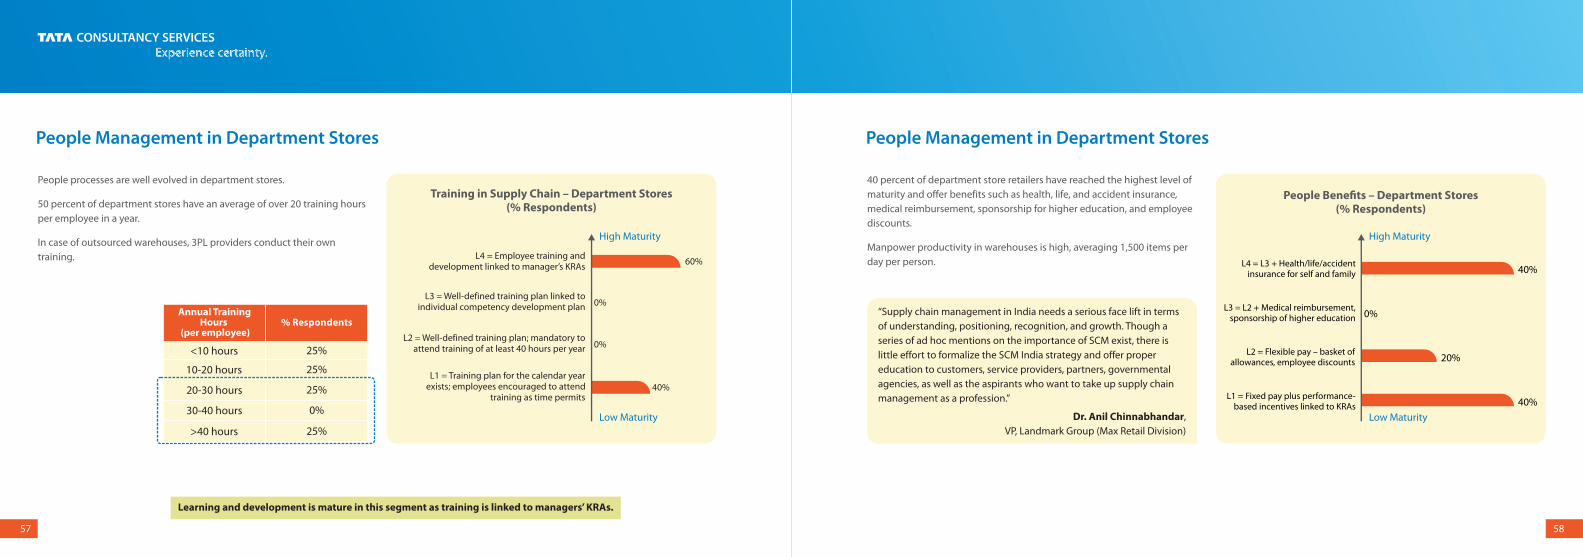
40 percent of department store retailers have reached the highest level of maturity and offer benefits such as health, life, and accident insurance, medical reimbursement, sponsorship for higher education, and employee discounts.
Manpower productivity in warehouses is high, averaging 1,500 items per day per person.
People Benefits – Department Stores(% Respondents)
People Management in Department Stores
People processes are well evolved in department stores.
50 percent of department stores have an average of over 20 training hours per employee in a year.
In case of outsourced warehouses, 3PL providers conduct their own training.
Learning and development is mature in this segment as training is linked to managers’ KRAs.
Training in Supply Chain – Department Stores (% Respondents)
30-40 hours
20-30 hours
10-20 hours
Annual Training Hours
(per employee)% Respondents
<10 hours 25%
25%
25%
0%
>40 hours 25%
People Management in Department Stores
“Supply chain management in India needs a serious face lift in terms of understanding, positioning, recognition, and growth. Though a series of ad hoc mentions on the importance of SCM exist, there is little effort to formalize the SCM India strategy and offer proper education to customers, service providers, partners, governmental agencies, as well as the aspirants who want to take up supply chain management as a profession.”
Dr. Anil Chinnabhandar,VP, Landmark Group (Max Retail Division)
40%
20%
0%
40%
L1 = Fixed pay plus performance-based incentives linked to KRAs
L2 = Flexible pay – basket ofallowances, employee discounts
L3 = L2 + Medical reimbursement,sponsorship of higher education
L4 = L3 + Health/life/accidentinsurance for self and family
L4 = Employee training and development linked to manager’s KRAs
L3 = Well-defined training plan linked to individual competency development plan
L2 = Well-defined training plan; mandatory to attend training of at least 40 hours per year
L1 = Training plan for the calendar year exists; employees encouraged to attend
training as time permits40%
60%
0%
0%
Low Maturity
High Maturity
Low Maturity
High Maturity

Detailed Survey Findings (Process and KPI Benchmarks) Food and Grocery
62
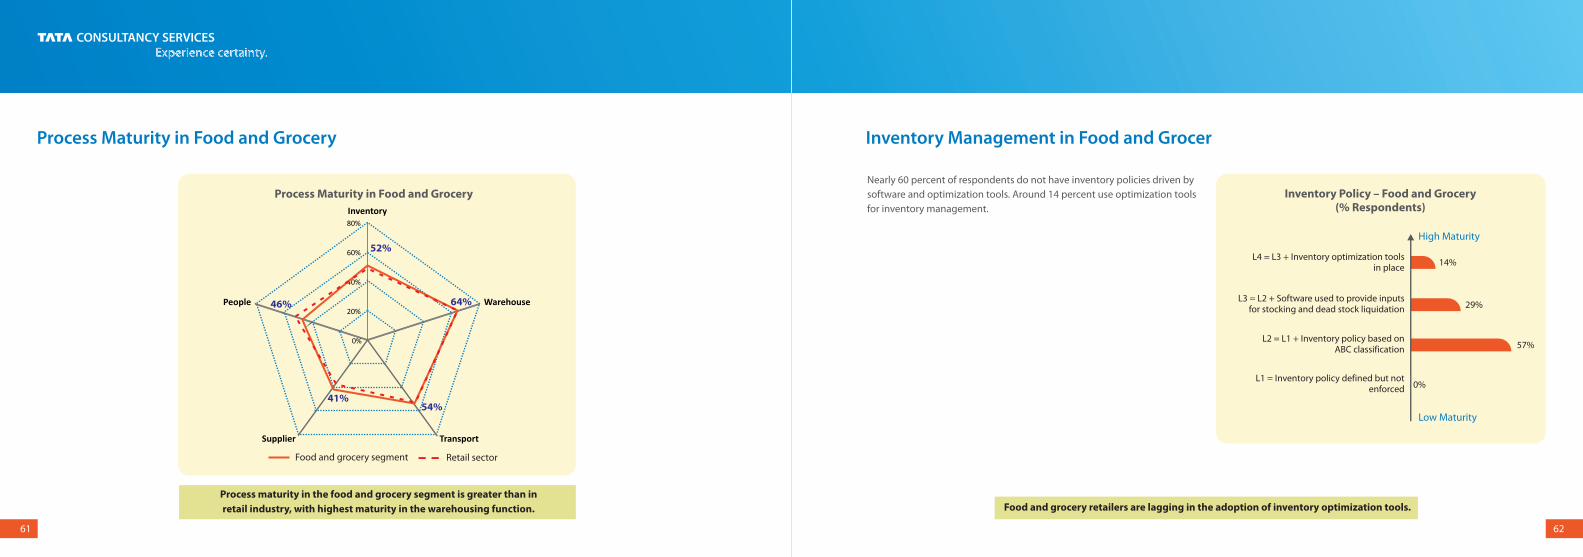
Nearly 60 percent of respondents do not have inventory policies driven by software and optimization tools. Around 14 percent use optimization tools for inventory management.
61
Process Maturity in Food and Grocery
Process maturity in the food and grocery segment is greater than inretail industry, with highest maturity in the warehousing function.
Process Maturity in Food and Grocery
0%
20%
40%
60%
80%
Inventory
Warehouse
TransportSupplier
People
Inventory Management in Food and Grocer
Food and grocery retailers are lagging in the adoption of inventory optimization tools.
Inventory Policy – Food and Grocery (% Respondents)
L4 = L3 + Inventory optimization tools in place
L3 = L2 + Software used to provide inputs for stocking and dead stock liquidation
L2 = L1 + Inventory policy based on ABC classification
L1 = Inventory policy defined but not enforced 0%
14%
29%
57%
Low Maturity
High Maturity
Food and grocery segment Retail sector
52%
64%
41%
46%
54%

63
Two-thirds of respondents have less than 30 days of inventory.
Three-quarters of respondents report inventory count accuracy greater than 95 percent.
64
Two-thirds of respondents are gradually moving towards full automation. 14 percent have already adopted complete automation for their warehouses.
Inventory Management in Food and Grocery
“Food and grocery supply chain has not been optimized, less because of technology and government laws and more due to a lack of sales demand aggregation. Where there is aggregated sales orders, supply chain investment and development will fully follow.”
K Radhakrishnan,Co-founder, www.grocermax.com
Inventory Count Accuracy
% Respondents
<80% 20%
80-90% 0%
90-95% 0%
95-98% 20%
>98% 60%
Days of Inventory in the Warehouse
% Respondents
>120 33%
90-120 0%
60 -90 0%
30 -60 0%
<30 67%
Warehouse Management in Food and Grocery
For the food and grocery segment, the highest maturity is in warehouse processesdue to adoption of technology (such as WMS, WCS, bar codes) and automation.
Automation in Warehouse – Food and Grocery(% Respondents)
14%
0%
71%
14%
L1 = Manual processes not followedconsistently
L2 = Manual processes followedconsistently
L3 = Processes followed consistently andat least two technologies such as
WMS, WCS, Wi-Fi, and bar codeand RF scanners are present
L4 = Processes followed consistently; fullautomation; complete IT infrastructure
including WMS and WCS
Low Maturity
High Maturity

>=36 and <60
>=24 and <36
>=8 and <24
6-10%
4-6%
2.5 - 4%
Warehousing and Logistics Costs as Percentage of Net
Sales
% Respondents
65
Two-thirds of respondents use advance picking techniques using RFdevices but none do cycle counting based on ABC classification.
66
50 percent of the respondents have a warehousing and logistics cost that is less than 2.5 percent of net sales value. Half the respondents have85 percent or higher warehouse capacity utilization.
43 percent of respondents report that their order fulfillment time is less than 24 hours.
Warehouse Management in Food and Grocery
Picking in the Warehouse – Food and Grocery(% Respondents)
Cycle Count – Food and Grocery (% Respondents)
Warehouse Management in Food and Grocery
% Respondents
>=60 hours 0%
14%
43%
43%
< 8 hours 0%
Average Warehouse Capacity Utilization % Respondents
<70% 17%
70-80% 17%
80-85% 17%
85-90% 33%
>90% 17%
>10% 0%
33%
0%
17%
<2.5% 50%
14%
14%
14%
58%
L1 = Manual picking; staff not trained
L2 = Manual rules for picking; MHE used;partially trained staff
L3 = Pick list generation through WMSbut no automation; fully trained staff
L4= Pick list generation in the RF device;use of rules such as wave picking;
fully trained staff
Low Maturity
High Maturity
0%
14%
86%
0%
L1 = No cycle count done
L2 = Physical inventory count matchedagainst system inventory randomly
L3 = Physical inventory count matchedwith system inventory at periodic
intervals
L4 = Cycle count based on ABCclassification
Low Maturity
High Maturity
Order Fulfilment Cycle Time

67
Two thirds of respondents have a dedicated fleet or have 3PL providers, and use transportation management systems.
Some of the respondents are considering network design and ways to improve transportation efficiency.
Transport Management in Food and Grocery
“The fresh category in food and grocery is one of the most difficult and the most profitable. It requires retailers to take pride in the category, and bring in skilled expertise in category, sourcing, and supply chain. There is no international retailer in food and grocery who does not try to be the best in this category, it's a differentiator more than any other category. Indian retailers have been slow learners here.”
K Radhakrishnan,Co-founder, www.grocermax.com
Transport management processes exhibit relatively high levels of maturity, since this function is usually outsourced to 3PLs.
Transport Management – Food and Grocery (% Respondents)
L4 = L3 + Network optimization, route planning , and TMS integrated to WMS
L3 = Dedicated fleet/third-party logistics and transport management systems
L2 = Long-term contracts (including in-transit insurance) with transporters
L1 = On ad hoc basis by daily rentals of trucks through agents 0%
0%
57%
43%
68
Almost 60 percent respondents have an OTIF performance greater than 90 percent.
Transport Management in Food and Grocery
All respondents track shipments and 40 percent have GPS-enabled fleets.
Tracking of Shipment from Warehouse/DC to Store – Food and Grocery (% Respondents)
L4 = L3 + Pallet-level or case-level tracking using RFID
L3 = Complete tracking of shipment from source to destination through
GPS enabled fleet
L2 = Regular tracking of shipment by through phone calls and matching of
physical receipts
L1 = Ad hoc tracking of shipments 0%
0%
33%
67%
On Time in Full Performance
(% Respondents)
<80% 13%
80-85% 0%
85-90% 29%
90-95% 29%
>95% 29%Low Maturity
High Maturity
Low Maturity
High Maturity

69 70
14 percent of respondents have complete integration with their suppliers.
One third of respondents have a quality adherence process linked to rewards and penalties based on supplier performance, and require suppliers to have quality and service certifications.
Supplier Management in Food and Grocery
“The ambient category in food and grocery has developed well, by using sales automation software to collect orders using handheld terminals (HHTs); this has reduced cycle time and increased accuracy and service levels.”
K Radhakrishnan,Co-founder, www.grocermax.com
Adherence of Suppliers to Quality Standards –Food and Grocery (% Respondents)
57%
0%
29%
14%
L1 = Quality adherence process exists; not linked to rewards and penalties
L2 = Quality adherence process linked to rewards and penalties for supplier
L3 = L2 + Mandated quality policiesfor supplier facilities with certifications
L4 = L3 + Complete integration ofsupplier facilities; periodic audits
People Management in Food and Grocery
67%
33%
0%
0%
L1 = Informal communication on phone, fax, and email
L2 = Systemic integration through EDI including ASN
L3 = Pre-receiving process of ASN; pre-slotting of items
L4 = Complete inventory visibility withkey suppliers through SRM software
Supplier Integration-Food and Grocery (% Respondents)
Supplier integration processes in the food and grocery segment show lowmaturity with 67 percent of respondents using only informal communication.
10 - 30 Days
3 - 10 Days
1 - 3 Days
Average PO Lead time (% Respondents)
>30 Days 14%
0%
58%
14%
<1 Day 14%
80- 90%
70% - 80%
60% - 70%
Supplier Fill Rate (% Respondents)
<60% 0%
33%
17%
50%
>90% 0%
Low Maturity
High Maturity
Low Maturity
High Maturity
71 72
People Management in Food and Grocery
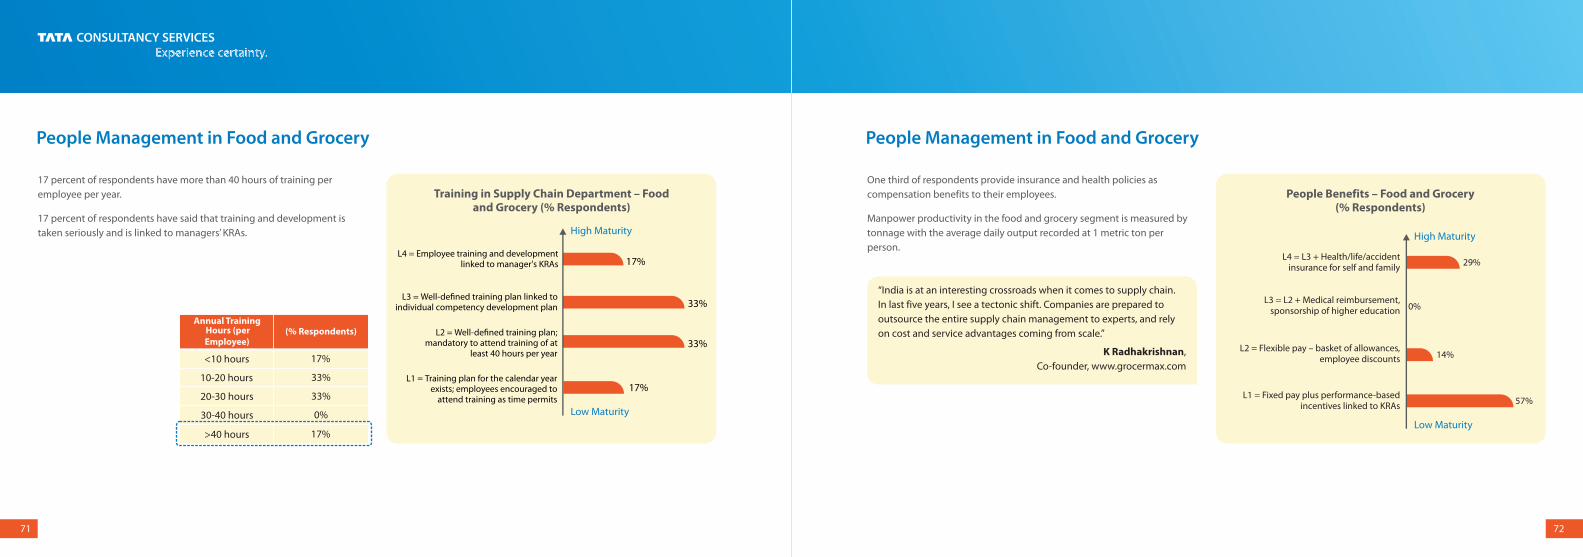
17 percent of respondents have more than 40 hours of training per employee per year.
17 percent of respondents have said that training and development is taken seriously and is linked to managers’ KRAs.
Training in Supply Chain Department – Foodand Grocery (% Respondents)
17%
33%
33%
17%
L1 = Training plan for the calendar yearexists; employees encouraged to
attend training as time permits
L2 = Well-defined training plan;mandatory to attend training of at
least 40 hours per year
L3 = Well-defined training plan linked to individual competency development plan
L4 = Employee training and developmentlinked to manager's KRAs
30-40 hours
20-30 hours
10-20 hours
Annual Training Hours (per Employee)
(% Respondents)
<10 hours 17%
33%
33%
0%
>40 hours 17%
People Management in Food and Grocery
One third of respondents provide insurance and health policies as compensation benefits to their employees.
Manpower productivity in the food and grocery segment is measured by tonnage with the average daily output recorded at 1 metric ton per person.
“India is at an interesting crossroads when it comes to supply chain. In last five years, I see a tectonic shift. Companies are prepared to outsource the entire supply chain management to experts, and rely on cost and service advantages coming from scale.”
K Radhakrishnan,Co-founder, www.grocermax.com
People Benefits – Food and Grocery (% Respondents)
L4 = L3 + Health/life/accident insurance for self and family
L3 = L2 + Medical reimbursement, sponsorship of higher education
L2 = Flexible pay – basket of allowances, employee discounts
L1 = Fixed pay plus performance-based incentives linked to KRAs 57%
29%
0%
14%
Low Maturity
High Maturity
Low Maturity
High Maturity

Detailed Survey Findings (Process and KPI Benchmarks) Consumer Durables and Information Technology (CDIT)

0%
25%
25%
50%
L1 = Inventory policy defined but not enforced
L2 = L1 + Inventory policy based on ABC classification
L3 = L2 + Software used to provideinputs for stocking and dead stock
liquidation
L4 = L3 + Inventory optimization tools in place
75
Process Maturity in CDIT
76
Fifty percent of respondents in this segment have defined an inventory policy based on ABC classification and have inventory optimization tools.
Nearly a quarter of the retailers surveyed use software to provide inputs related to inventory policy, including stocking of goods and dead stock liquidation.
Process maturity in the CDIT segment is lower than the retail industry average.Highest maturity is recorded in warehouse management processes.
Process Maturity in CDIT
CDIT segment Retail Sector
52%
62%
47%
28%
50%
0%
20%
40%
60%
80%
Inventory
Warehouse
TransportSupplier
People
Inventory Management in CDIT
“The supply chain in the country is primed for the next leap. Not only retailers but also service providers need to raise the bar and be part of the mutation that should take place now, if we are to see better standards achieved in other parts of the world.”
Lt. Col. Vijay Nair,Head – Distribution and Logistics, Reliance Retail (Digital)
CDIT retailers are adopting inventory optimization tools.
Inventory Policy – CDIT (% Respondents)
Low Maturity
High Maturity

77
Inventory Management in CDIT
Shrinkage in supply chain for almost all of the CDIT retailers surveyed is less than 1 percent of sales. Three quarters of respondents in the CDIT segment record inventory count accuracy of more than 98 percent.
A quarter of the CDIT retailers have an inventory of more than 60 days.
78
In line with the retail sector generally, warehouse management is the most mature process in the CDIT segment.
There is scope for improvement in automation as all of the CDIT retailers have partial automation in warehouse. Processes are followed consistently and they deploy at least two of the following technologies: WMS, WCS, Wi-Fi, and bar code and RF scanners.
The majority of CDIT retailers are managing their inventory well with high inventory count accuracy.
Inventory Count Accuracy
% Respondents
<80% 0%
80-90% 0%
90-95% 25%
95-98% 0%
>98% 75%
Days of Inventory in the Warehouse
% Respondents
>120 0%
90-120 0%
60-90 25%
30-60 50%
<30 25%
Returns on Dispatches
% Respondents
>20% 0%
15-20% 0%
10-15% 0%
5-10% 25%
0-5% 75%
Warehouse Management in CDIT
Automation in Warehouse – CDIT (% Respondents)
0%
0%
100%
0%
L1 = Manual processes not followedconsistently
L2 = Manual processes followedconsistently
L3 = Processes followed consistently andat least two technologies such as
WMS, WCS, Wi-Fi, and bar codeand RF scanners are present
L4 = Processes followed consistently; fullautomation; complete IT infrastructure
including WMS and WCS
All CDIT retailers have partial automation in their warehouses.
Low Maturity
High Maturity
79
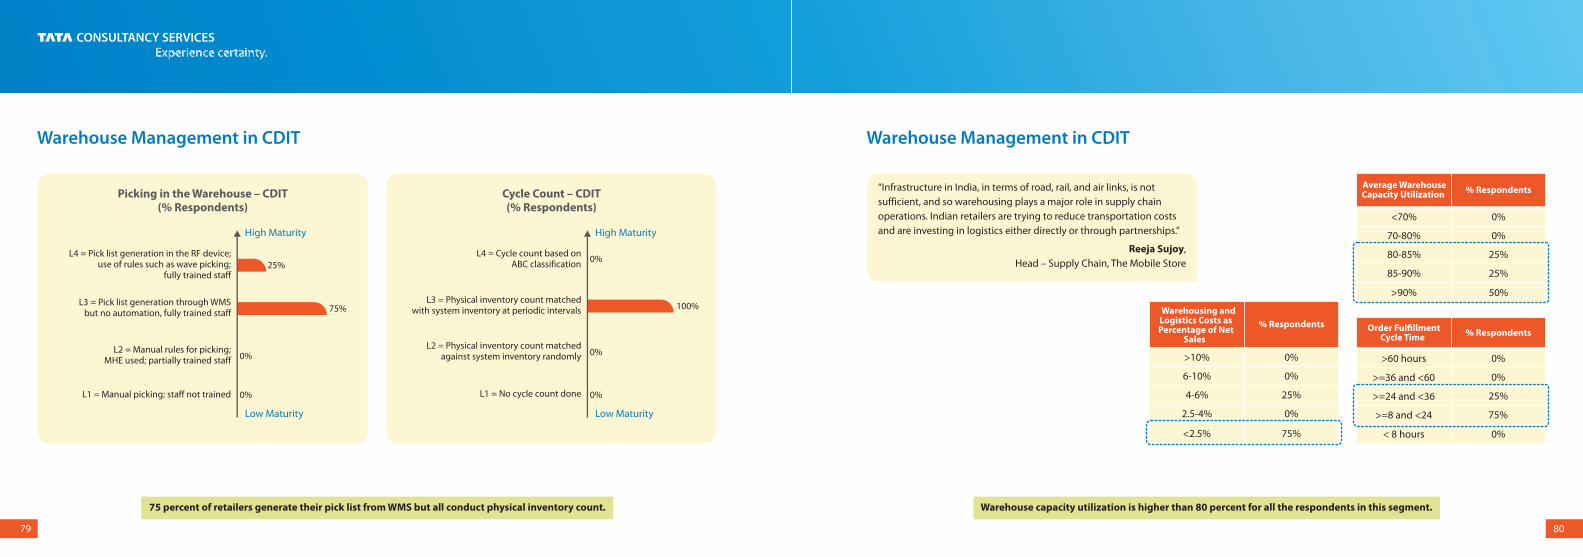
75 percent of retailers generate their pick list from WMS but all conduct physical inventory count.
80
Warehouse Management in CDIT
Picking in the Warehouse – CDIT (% Respondents)
Cycle Count – CDIT (% Respondents)
L4 = Pick list generation in the RF device; use of rules such as wave picking;
fully trained staff
L3 = Pick list generation through WMS but no automation, fully trained staff
L2 = Manual rules for picking;MHE used; partially trained staff
L1 = Manual picking; staff not trained
25%
75%
0%
0%
L4 = Cycle count based on ABC classification
L3 = Physical inventory count matched with system inventory at periodic intervals
L2 = Physical inventory count matched against system inventory randomly
L1 = No cycle count done
100%
0%
0%
0%
Warehouse Management in CDIT
“Infrastructure in India, in terms of road, rail, and air links, is not sufficient, and so warehousing plays a major role in supply chain operations. Indian retailers are trying to reduce transportation costs and are investing in logistics either directly or through partnerships.”
Reeja Sujoy,Head – Supply Chain, The Mobile Store
Warehouse capacity utilization is higher than 80 percent for all the respondents in this segment.
Average Warehouse Capacity Utilization % Respondents
<70% 0%
70-80% 0%
80-85% 25%
85-90% 25%
>90% 50%
Warehousing and Logistics Costs as Percentage of Net
Sales
% Respondents
>10% 0%
6-10% 0%
4-6% 25%
2.5-4% 0%
<2.5% 75%
Order Fulfillment Cycle Time % Respondents
>60 hours 0%
>=36 and <60 0%
>=24 and <36 25%
>=8 and <24 75%
< 8 hours 0%
Low Maturity
High Maturity
Low Maturity
High Maturity

81 82
The process for tracking of shipments from the warehouse or distribution center to the store is low on maturity with negligible use of technology. 75 percent of CDIT retailers track shipments only through phone calls and matching of manual receipts.
The CDIT segment is striving to improve this process through GPS-enabled fleet but is still far from experimenting RFID tags at pallet or case level.
Around a quarter of retailers have GPS-enabled fleet for tracking of shipments.
Transport Management in CDIT
50 percent of CDIT retailers have a combination of dedicated fleet and 3PL.
“The biggest role is that of logistics service providers, who initially led the way – but now retailers have moved ahead and are frustrated by LSPs not keeping pace.”
Lt. Col. Vijay Nair,Head – Distribution and Logistics, Reliance Retail (Digital)
Transport Management – CDIT (% Respondents)
L4 = L3 + Network optimization, route planning, and TMS integrated to WMS
L3 = Dedicated fleet/third-party logistics and transport management systems
L2 = Long-term contracts (including in-transit insurance) with transporters
L1 = On ad hoc basis by daily rentals of trucks through agents
0%
50%
0%
50%
Tracking of Shipment from Warehouse/DC to Store – CDIT (% Respondents)
L4 = L3 + Pallet-level or case-level tracking using RFID
L3 = Complete tracking of shipment from source to destination through
GPS enabled fleet
L2 = Regular tracking of shipment by through phone calls and
matching of physical receipts
L1 = Ad hoc tracking of shipments
0%
25%
0%
75%
Transport Management in CDIT
On Time in Full Performance
(% Respondents)
<80% 0%
80-85% 0%
85-90% 0%
90-95% 50%
>95% 50%Low Maturity
High Maturity
Low Maturity
High Maturity

8483
Supplier Management in CDIT
Supplier management process maturity is low. Only 33 percent of CDIT retailers state that quality policies are linked to rewards and/or penalties of suppliers.
Nearly two-thirds of respondents admitted that they do not link rewards and penalties to the quality received from suppliers.
Supplier management processes show low maturity, with two thirds of respondents at the lowest level.
Adherence of Suppliers to Quality Standards – CDIT (% Respondents)
L4 = L3 + Complete integration of supplier facilities; periodic audits
L3 = L2 + Mandated quality policies for supplier facilities with certifications
L2 = Quality adherence process linked to rewards and penalties for supplier
L1 = Quality adherence process exists; not linked to rewards and penalties
33%
0%
67%
0%
Supplier Integration – CDIT (% Respondents)
L4 = Complete inventory visibility with key suppliers through SRM software
L3 = Pre-receiving process of ASN; pre-slotting of items
L2 = Systemic integration through EDI including ASN
L1 = Informal communication onphone, fax, and email 50%
0%
50%
0%
Integration of suppliers is low, as 50 percent of retailers manage orders through informal communication on phone, fax, and email.
No respondents have gone as far as implementing SRM or undertaking pre-slotting of items based on ASN.
Supplier Management in CDIT
Supplier integration is low, as none of the respondents have SRM software.
Low Maturity
High Maturity
Low Maturity
High Maturity
85
Supplier Management in CDIT
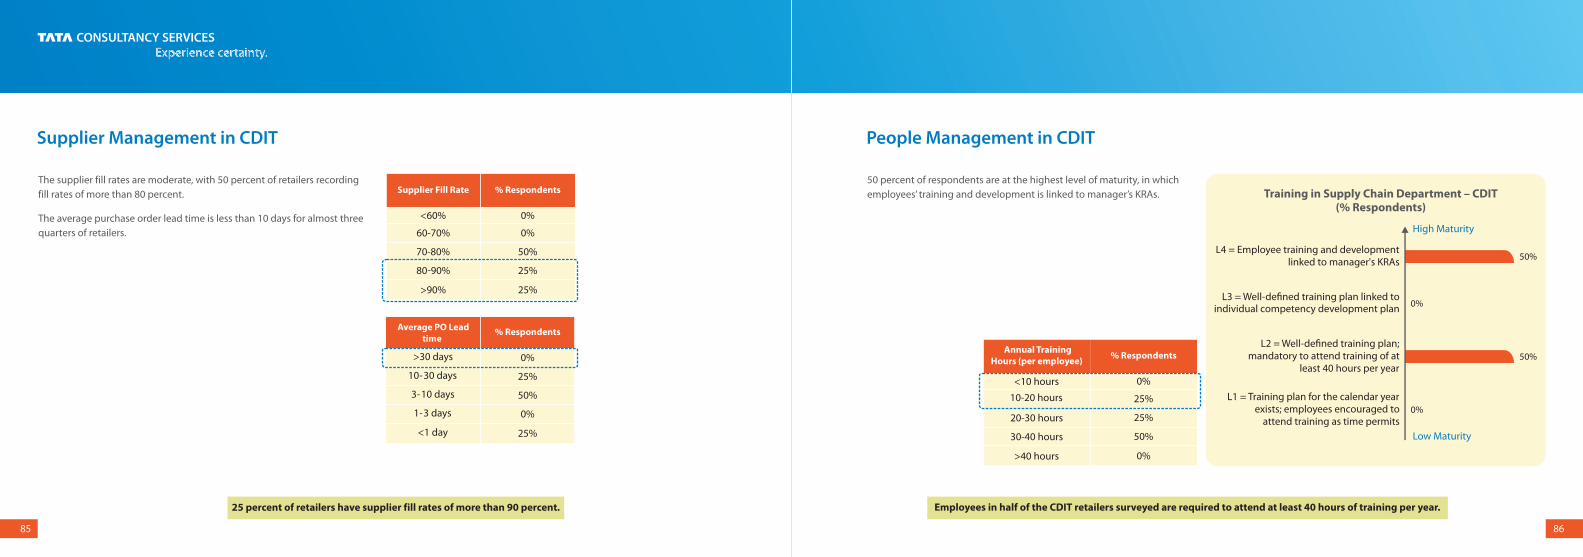
The supplier fill rates are moderate, with 50 percent of retailers recording fill rates of more than 80 percent.
The average purchase order lead time is less than 10 days for almost three quarters of retailers.
86
50 percent of respondents are at the highest level of maturity, in which employees’ training and development is linked to manager’s KRAs.
People Management in CDIT
25 percent of retailers have supplier fill rates of more than 90 percent.
Average PO Lead time
% Respondents
>30 days 0%
10-30 days 25%
3-10 days 50%
1-3 days 0%
<1 day 25%
Supplier Fill Rate % Respondents
<60% 0%
60-70% 0%
70-80% 50%
80-90% 25%
>90% 25%
Training in Supply Chain Department – CDIT (% Respondents)
Annual Training Hours (per employee)
<10 hours 0%
10-20 hours 25%
20-30 hours 25%
30-40 hours 50%
>40 hours 0%
Employees in half of the CDIT retailers surveyed are required to attend at least 40 hours of training per year.
0%
50%
L1 = Training plan for the calendar yearexists; employees encouraged to
attend training as time permits
L2 = Well-defined training plan;mandatory to attend training of at
least 40 hours per year
L3 = Well-defined training plan linked toindividual competency development plan
L4 = Employee training and developmentlinked to manager's KRAs
50%
0%
Low Maturity
High Maturity
% Respondents

87
People Management in CDIT
Only 25 percent of CDIT retailers reach the highest level of maturity, offering benefits such as health, life, and accident insurance, medical reimbursement, sponsorship for higher education, and employee discounts.
Most employees in the supply chain departments of CDIT retailers get fixed pay plus performance-based incentives linked to KRAs.
People Benefits – CDIT (% Respondents)
0%
25%
50%
25%
L1 = Fixed pay plus performance-based incentives linked to KRAs
L2 = Flexible pay – basket of allowances, employee discounts
L3 = L2 + Medical reimbursement,sponsorship of higher education
L4 = L3 + Health/life/accidentinsurance for self and family
Detailed Survey Findings (Process and KPI Benchmarks) Other Retailers – Books, Gifts, and Pharmacy
Low Maturity
High Maturity

89
Process Maturity in Other Retailers
90
Inventory Management in Other Retailers
Retailers in this segment are lagging in the adoption of inventory optimization tools.
Process Maturity in Other Retailers
44%
54%
54%
30%
39%
0%
20%
40%
60%
80%
Inventory
Warehouse
TransportSupplier
People
More than 70 percent of respondents do not have inventory policies driven by software and optimization tools.
Nearly 30 percent of respondents use optimization tools for inventory management.
“A long way to go towards acquiring efficiencies in SCM. Right from the source to the shelf, there are issues galore and unless we plug the loopholes that exist, wastages in different forms (time, money, labor, policies, taxation, transportation, systems) will continue to haunt this industry. Each of these wastages has to be tackled intensely and within a short time frame so that losses can be reduced or eliminated and accrual benefits can be passed on to the end-customer.”
G. Saisudershan,COO, Omved Lifestyle Pvt. Ltd.
Inventory Policy – Other Retailers(% Respondents)
0%
29%
14%
57%
L1 = Inventory policy defined but notenforced
L2 = L1 + Inventory policy based onABC classification
L3 = L2 + Software used to provideinputs for stocking and dead stock
liquidation
L4 = L3 + Inventory optimization toolsin place
Low Maturity
High Maturity
Process maturity in this segment is less than that of the overall industry, with highest maturity in transport and warehouse management processes.
Other retailers segment Retail Sector

92
Warehouse Management in Other Retailers
91
Inventory Management in Other Retailers
Three quarters of respondents have inventory count accuracy greater than 95 percent and shrinkage of less than 1 percent.
The tables present snapshots of KPIs in inventory management for this segment.43 percent of respondents have adopted advanced tools for warehousing processes, although none of them are completely automated.
58 percent have no automation and processes are also not followed consistently.
The majority of respondents in this segment have a low maturity level in warehouse automation.
Automation in Warehouse – Other Retailers (% Respondents)
Inventory Count Accuracy % Respondents
<80% 0%
80-90% 0%
90-95% 25%
95-98% 38%
>98% 38%
Days of Inventory in the Warehouse
% Respondents
>120 14%
90-120 0%
60-90 29%
30-60 43%
<30 14%
Shrinkage in the Supply Chain % Respondents
>3% 25%
2-3% 0%
1-2% 0%
0.5-1% 25%
<0.5% 50%
Returns on Dispatches % Respondents
>20% 0%
15-20% 0%
10-15% 14%
5-10% 0%
0- 5% 86%
0%
71%
L1 = Manual processes not followedconsistently
L2 = Manual processes followedconsistently
L3 = Processes followed consistently andat least two technologies such as
WMS, WCS, Wi-Fi, and bar code andRF scanners are present
L4 = Processes followed consistently; fullautomation; complete IT infrastructure
including WMS and WCS
14%
14%
Low Maturity
High Maturity

93
Warehouse Management in Other Retailers
Approximately 60 percent of respondents are engaged in manual processes for picking.More than 40 percent of other retailers use WMS but the level of automation is not significant.
94
14 percent of the respondents have a warehousing cost less than2.5 percent of net sales value. 28 percent have warehouse capacity utilization of more than 85 percent.
43 percent of respondents have an order fulfillment time of less than24 hours.
None of the retailers in this segment perform cycle count based on ABC classification.
Picking in the Warehouse – Other Retailers (% Respondents)
29%
0%
29%
43%
L1 = Manual picking; staff not trained
L2 = Manual rules for picking; MHEused; partially trained staff
L3 =Pick list generation through WMSbut no automation; fully trained staff
L4 = Pick list generation in the RFdevice; use of rules such as wave
picking; fully trained staff
Cycle Count – Other Retailers (% Respondents)
29%
0%
71%
L1 = No cycle count done
L2 = Physical inventory count matchedagainst system inventory
randomly
L3 = Physical inventory count matchedwith system inventory at periodic
intervals
L4 = Cycle count based on ABCclassification
0%
Warehouse Management in Other Retailers
Order Fulfillment Cycle Time % Respondents
>=60 hours 14%
>=36 and <60 0%
>=24 and <36 43%
>=8 and <24 29%
< 8 hours 14%
Average Warehouse Capacity Utilization % Respondents
<70% 29%
70-80% 29%
80-85% 14%
85-90% 14%
>90% 14%
Warehousing andLogistics Costs as
Percentage of Net Sales
% Respondents
>10% 14%
6-10% 14%
4-6% 14%
2.5 - 4% 43%
<2.5% 14%Low Maturity
High Maturity
Low Maturity
High Maturity
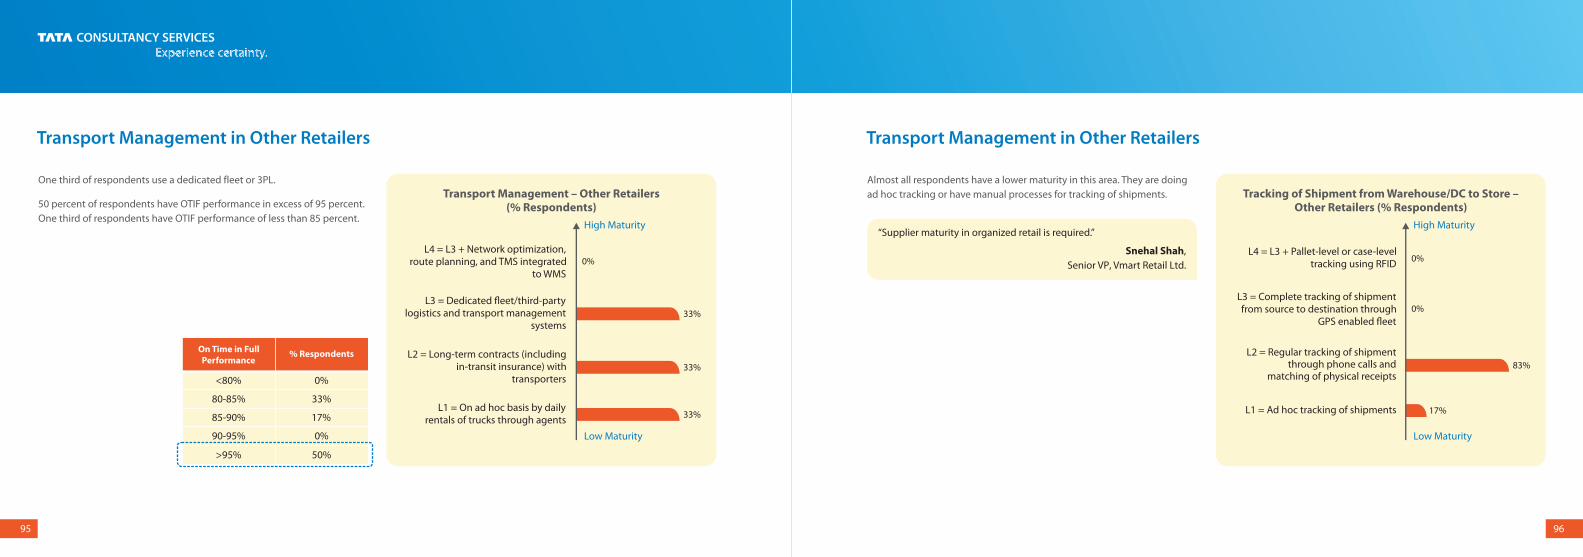
95
Transport Management in Other Retailers
96
One third of respondents use a dedicated fleet or 3PL.
50 percent of respondents have OTIF performance in excess of 95 percent. One third of respondents have OTIF performance of less than 85 percent.
Transport Management – Other Retailers (% Respondents)
33%
0%
L1 = On ad hoc basis by dailyrentals of trucks through agents
L2 = Long-term contracts (includingin-transit insurance) with
transporters
L3 = Dedicated fleet/third-partylogistics and transport management
systems
L4 = L3 + Network optimization,route planning, and TMS integrated
to WMS
33%
33%
On Time in Full Performance
% Respondents
<80% 0%
80-85% 33%
85-90% 17%
90-95% 0%
>95% 50%
Transport Management in Other Retailers
Tracking of Shipment from Warehouse/DC to Store – Other Retailers (% Respondents)
17%
83%
0%
0%
L1 = Ad hoc tracking of shipments
L2 = Regular tracking of shipmentthrough phone calls and
matching of physical receipts
L3 = Complete tracking of shipmentfrom source to destination through
GPS enabled fleet
L4 = L3 + Pallet-level or case-leveltracking using RFID
Almost all respondents have a lower maturity in this area. They are doing ad hoc tracking or have manual processes for tracking of shipments.
“Supplier maturity in organized retail is required.”
Snehal Shah,Senior VP, Vmart Retail Ltd.
Low Maturity
High Maturity
Low Maturity
High Maturity

97
Supplier Management in Other Retailers
Over 70 percent of respondents do not reward or penalize their suppliers for their quality of service.
Only 29 percent have said that they have certification policy for suppliers and also link the rewards and penalties based on supplier performance.
98
Over 80 percent are still dependent on informal modes of communication through phone, fax, or email.Other retailers score lowest for supplier management processes and have no reward-penalty clauses with suppliers.
Adherence of Suppliers to Quality Standards – Other Retailers (% Respondents)
71%
29%
0%
0%
L1 = Quality adherence processexists; not linked to rewards and
penalties
L2 = Quality adherence processlinked to rewards and penalties for
supplier
L3 = L2 + Mandated quality policiesfor supplier facilities with
certifications
L4 = L3 + Complete integration ofsupplier facilities; periodic audits
Supplier Management in Other Retailers
Supplier Integration – Other Retailers (% Respondents)
86%
14%
0%
0%
L1 = Informal communication on phone,fax, and email
L2 = Systemic integration through EDIincluding ASN
L3 = Pre-receiving process of ASN; pre-slotting of items
L4 = Complete inventory visibilitywith key suppliers through SRM software
Average PO Lead Time
% Respondents
>30 days 0%
10-30 days 38%
3-10 days 38%
1-3 days 25%
<1 day 0%
Supplier Fill Rate % Respondents
<60% 0%
60-70% 17%
70-80% 17%
80 - 90% 33%
>90% 33%
Low Maturity
High Maturity
Low Maturity
High Maturity

99
People Management in Other Retailers
Nearly 30 percent of respondents have 30-40 hours of annual training per employee.
Two thirds of retailers have a training plan and individual employees are encouraged to attend training. Only one third of respondents in the other retailers segment have linked training to the competencies of individual employees.
Training in Supply Chain Department – Other Retailers (% Respondents)
67%
33%
0%
L1 = Training plan for the calendar yearexists; employees encouraged to
attend training as time permits
L2 = Well-defined training plan;mandatory to attend training of at
least 40 hours per year
L3 = Well-defined training plan linked toindividual competency development plan
L4 = Employee training and developmentlinked to manager's KRAs 0%
Multichannel Readiness
Annual Training Hours (per employee)
% Respondents
<10 hours 14%
10-20 hours 43%
20-30 hours 14%
30-40 hours 29%
>40 hours 0%
Low Maturity
High Maturity

101
Multichannel Readiness – Buy Online Pick-up In-store
Last year’s report, ROBES 2014: The State of Multichannel Retail, revealed that retailers had begun their multichannel journey to cater to the increasingly channel-agnostic customer. Since supply chain is one of the key pillars of any multichannel initiative, this survey included some critical supply chain related questions for the non-store channels: on inventory and shipping policy as well as integrated options offered to the customer to buy online and pick up the item in store.
BOPIS Process: Retail Industry (2015)(% Respondents)
73%
12%
15%
0%
L1 = Do not offer this option
L2 = Pick, pack, and pay managedmanually after customer shows
order confirmation generated online
L3 = Pick and pack managed manually;payment through POS
L1 = Pick and pack managed bye-commerce order management
system; payment processedthrough POS
Offer BOPIS Do not offer BOPIS
ROBES 2014
ROBES 2015
18%
82%
19%
81%
The presence of BOPIS has not changed significantly since last year. 50 percent of retailers who offer BOPIS have an e-commerce order management system.
102
Most segments – fashion, CDIT, department stores, books, gifts and pharmacy retailers - sell online, but the food and grocery segment is still experimenting with the online channel and features such as real-time inventory and ‘click and collect’.
Retail supply chains are not yet ready to handle multichannel. However, in comparison to 21 percent last year, 45 percent of retailers have started fulfilling the demand from any DC this year.
The seemingly never-ending assortment challenge of online retail is driving up costs of multiple DCs. Retailers will need to unify stores (including backrooms) and DCs, and create incentives for stores to redirect traffic online. ROBES 2014: The State of Multichannel Retail revealed that collaboration between stores and the non-store channel is a key hurdle.
Multichannel readiness – Cross Channel Fulfillment
Multichannel Readiness – Cross-Channel Fulfillment
ROBES 2015 ROBES 2014
Only nine percent of respondents say that inventory is not shared across channels, as opposed to 24 percent last year.
Low Maturity
High Maturity
24%
9%
52%
45%
21%
45%
3%
0%
L1 = Channel specific supplynetwork; no inventory sharing
L2 = Channel specific supply network; inventory sharing
L3 = Demand fulfilled fromany channel out of any DC
L1 = Inventory reserved and managed by vendor

Views of 3PL Providers
103
E-tailers like Amazon and Flipkart are creating new industry standards – such as same-day delivery and flexible return policies – for the supply chain in India. Around one tenth of online players have made same-day delivery a possibility for at least some of their products. Around a third of all online retailers offer delivery in less than two days.
More mature fashion retailers are looking at a six-hour delivery window.
“Customer satisfaction will be a function of back-office support, ease of tracking, reverse logistics, packaging, and so on. These factors are different from the conventional meet and greet process and will pose a learning curve most retailers will have to go through. Offline retail will actually turn into a support base for online retail.”
Shamik Vora,Vice President, The Bombay Store
Multichannel Readiness - Shipping Policy
Shipping Policy – Non-Store(% Respondents)
16%
12%
20%
52%
L1 = Standard shipping option withdelivery SLA>5 days
L2 = Standard shipping option withdelivery SLA<5 days
L3 = L2 + Express shipping optionavailable with delivery SLA<2 days
L4 = Same-day delivery optionavailable for selected products in
selected cities
Low Maturity
High Maturity

105
This survey also included interviews with some leading 3PL providers so as to get an ‘outside-in’ view on retailers’ supply chain practices. The key insights were as follows:
n The majority of retailers rely on 3PL providers either partially or completely. In addition to logistics services, 3PLs also provide transportation management technologies to their retail customers.
n Retailers are yet to adopt advanced automation techniques to increase the throughput of their warehouses.
n While all retailers require the services of a 3PL, adoption has been the highest among fashion and CDIT retailers.
n 3PLs are unanimous in their view that retail is more complex in comparison to most other sectors, as it caters to the end-customer and hence requires better management of technology and logistics services to achieve higher service levels.
Views of 3PL Providers
Benchmarks from Global Retailers

107
TCS surveyed European retailers in 2014 to assess their supply chain [6]capabilities and readiness for omnichannel retail.
Strategy
In terms of strategic initiatives, the survey found that 53 percent had started supply chain transformation to enable omnichannel delivery. A third said that integrating with store operations is the biggest omnichannel SCM challenge. Only 23 percent of retailers now forecast demand by sales channel.
Inventory Management
n 60 percent of European retailers stated that ‘order management’ is the top priority area for them. 87 percent of respondents said they had a reduced set of inventory on the online channel. This may reflect the perceived complexity in order management.
n 47 percent offer BOPIS to customers. This compares with 88 percent of [7]the top 100 US retailers.
Benchmarks from Global Retailers – Supply Chain Takeaways from European Retailers
Warehouse and Logistics
n More than 80 percent of European retailers were still trying to figure out optimized ‘cost-to-serve’ options for different order deliveries, and lack adequate flexibility.
n 56 percent of retailers empower employees to offer options such as substitute items or alternative delivery options in instances where products are out of stock.
[6] TCS Survey – Interconnected Retail: Transforming Retail Supply Chain for Omnichannel Retailing; Respondents: 100+, Presented by Gill Hide (Head of Retail, Europe) at Handelskongress 2014 (http://www.handelskongress.de/), 19-20 November 2014, Berlin
[7] Retail Online Integration, BOPIS: Retail’s Next Frontier of Competitive Advantage, http://www.retailonlineintegration.com/article/bopis-retails-next-frontier-competitive-advantage/
Transport Management
Only 30 percent of European retailers believe that returns management and transportation is an area of concern.
Two thirds of retailers had yet to offer same-day delivery to customers; of those who did offer this service, 78 percent offered it via online/mobile channels while 68 percent offered it through stores.
Supplier Management
n 40 percent of respondents said they tracked supplier performance using a well-developed evaluation framework.
n 1 in 4 vendors is agreeable to creating ship-ready packages. It may be argued that this supports a trend towards ‘direct-to-consumer (DTC)’.
n 33 percent of vendors provided retailers with flexible delivery options, yet only 13 percent provide real-time information on schedule and content.
Global Supply Chain Perspectives – Supply Chain Takeaways from European Retailers
Technology
n 60 percent of retailers admitted that their current IT systems were not capable of providing real-time inventory in an omnichannel retail environment.
n 50 percent of retailers were working on digital solutions to enable hassle-free customer returns.
The survey found that only 20 percent of European retailers have full visibility of customer activities across the value chain, including the supply chain. The corresponding numbers of retailers in the UK and US are
[8]27 percent and 43 percent respectively.
[8] Retail Week, Analysis: Retailers link up customer services across channels, http://www.retail-week.com/multichannel/analysis-retailers-link-up-customer-services-across-channels/5060339.article#
108

Appendix

112
Respondent ProfileRetail Segment
111
Participating Brands
The logos are the property of the respective corporations.Participation from 50 retail brands across five retail segments
Respondent Profile – Retail Segment
Department stores10%
Food and Grocery17%
CDIT8%
Others (Books, Gifts, and Pharmacy)
17%
Fashion48%

113
Respondent ProfileTurnover
114
Respondent Profile – Turnover in Crore Rupees
500-100010%
1000-200015%
2000-40008%
>40005%
0-50062%
Respondent ProfileContribution of Non-store Revenue
Respondent Profile – Contribution of Non-store Revenue
Less than 1%
1% to 3%
3% to 5%
5% to 10%
>10%
0% 5% 10% 15% 20% 25% 30% 35% 40%
Respondents

115 116
Testimonials
“We need to set standards for SCM within India and benchmark these to know where we stand against competition and where we need to reach. As Supply Chain professionals, we are constantly evolving and engaged in Kaizen. Benchmarking studies such as this will exhort this community to touch benchmarks others have achieved or set higher standards.“
Lt. Col. Vijay Nair,Head – Distribution and Logistics, Reliance Retail Ltd (Digital)
“With this initiative, RAI gives a holistic overview of the supply chain management prevalent and followed by retail in the country. With a proactive approach and analytical survey, they evaluate the factors that would help retailers to devise their operational and logistic strategies. The survey also scans the market perspective, various consumer trends, and upcoming back-end functions, thus enabling retailers to make their supply chain processes robust and cost efficient.“
Rajesh Jain,MD and CEO, Lacoste India
“Excellent effort on building world class supply chain management.“
P. Sukumaran,Head - Supply Chain, Warehouse and Logistic Management,
Titan Company
“The survey is well timed and relevant given that supply chain of retail will come under pressure due to the nature of future commerce.“
Shamik Vora,Vice President, The Bombay Store
Testimonials
“The survey questions are well balanced to identify and classify the level of supply chain maturity of an organization. The pointers are similar to SCM metrics for performance evaluation and gaps analysis.“
Amit Gourwar,Logistics Head, Infinity Retail Ltd (Croma)
“ROBES 2015 could not have come a day too early. Never before in India's history has supply chain been at a greater inflection point than it is now – a combination of better and wider roads, better warehousing quality, impending GST and, more than ever, stakeholders realizing that supply chain is a strategic decider of corporate success. ROBES hopes to cover in some way all these issues to give a better insight to the road into."
K Radhakrishnan,Co-founder, www.grocermax.com
“It is an extremely good effort by RAI to seek supply chain related opinion based on scientific measuring tools. I am sure the findings will be an eye opener for the retail industry.“
G. Saisudershan,COO, Omved Lifestyle Pvt. Ltd.
“This is a very good initiative. There are no other platforms where SCM is discussed in-depth. Best practices need to be shared. However, there has to be some effort by the industry to execute on insights that come from it.“
Anjaney Bhutada,Director, Go4Fresh.com
“This survey covers the overall SCM operation of an organization in depth.“
Reeja Sujoy,Head - Supply Chain, The Mobile Store

117 118
List of Abbreviations
OTIF On Time in Full
PO Purchase Order
RAI Retailers Association of India
RF Radio Frequency
RFID Radio Frequency Identification
ROBES Retail Operations Benchmarking and Excellence Survey
SCM Supply Chain Management
SKU Stock Keeping Unit
SLA Service Level Agreement
SOP Standard Operating Procedure
SRM Supplier Relationship Management
TCS Tata Consultancy Services
TMS Transport Management System
TOC Theory of Constraints
WCS Warehouse Control System
WMS Warehouse Management System
3PL/TPL Third Party Logistics
BOPIS Buy Online Pick-up In-store
ASN Advance Shipping Notices
ASSOCHAM The Associated Chambers of Commerce and Industry of India
CDIT Consumer Durables and Information Technology
DC Distribution Center
DTC Direct-to-consumer
EDI Electronic Data Interchange
ERP Enterprise Resource Planning
GPS Global Positioning System
GST Goods and Services Tax
HHT Handheld Terminals
KPI Key Performance Indicator
KRA Key Result Area
LSP
MHE Material Handling Equipment
OOS Out of Stock
Acknowledgments
This survey covered 50 retail brands. The initiative would not have been successful without the continued support of our participating retailers and their faith in our efforts. We are deeply grateful to the leaders of these organizations for making this possible.
n We would also like to thank the entire RAI team – especially Kumar Rajagopalan (CEO), Heena Panchal (Director, Membership and Corporate Communication), Suranjana Basu (Head, Northern Region), Sophia Godinho (Manager, Marketing and Communications), Raghavendra Maiji (Manager, Southern Region), Palak Taneja (Manager, Research and Advocacy), Boishakhi Dutt (Research and Content), and Vidya Hariharan (Consultant, Knowledge Initiatives) for their support. This report would not have been possible without their untiring efforts.
n Sudip Gupta, Consultant in the Global Consulting Practice at TCS, has contributed significantly to the creation of this report.
n As we gain wider industry support, we hope to cover an even broader spectrum of Indian retail in future. We are sure the findings will be as enlightening to you as they have been for the participating retailers this year. For the five segments covered in this edition, the next survey will be an interesting status check of the initiatives they embark on today, using this report as an excellence guideline.
Logistics Service Providers

119
Authors
Anil RajpalPractice Head, Global Consulting Practice – Retail, e-commerce, and CPG
Sanjeev AthreyaManaging Consultant, Global Consulting Practice – Retail, e-commerce, and CPG
Deepali MalhotraConsultant, Global Consulting Practice – Retail, e-commerce, and CPG
Kedar MehtaManaging Consultant, Global Consulting Practice – Retail, e-commerce, and CPG
Gaurav KumarManaging Consultant, Global Consulting Practice – Retail, e-commerce, and CPG