
Abertura – Fabio: 10 min - Klabin – Relações com …ri.klabin.com.br/ptb/3245/KLABIN...
30
DEZEMBRO DE 2015 KLBN11 / KLBAY INSTITUTIONAL PRESENTATION 3Q16 KLBN11
Transcript of Abertura – Fabio: 10 min - Klabin – Relações com …ri.klabin.com.br/ptb/3245/KLABIN...
DEZEMBRO DE 2015
KLBN11 / KLBAY
INSTITUTIONAL PRESENTATION
3Q16
KLBN11
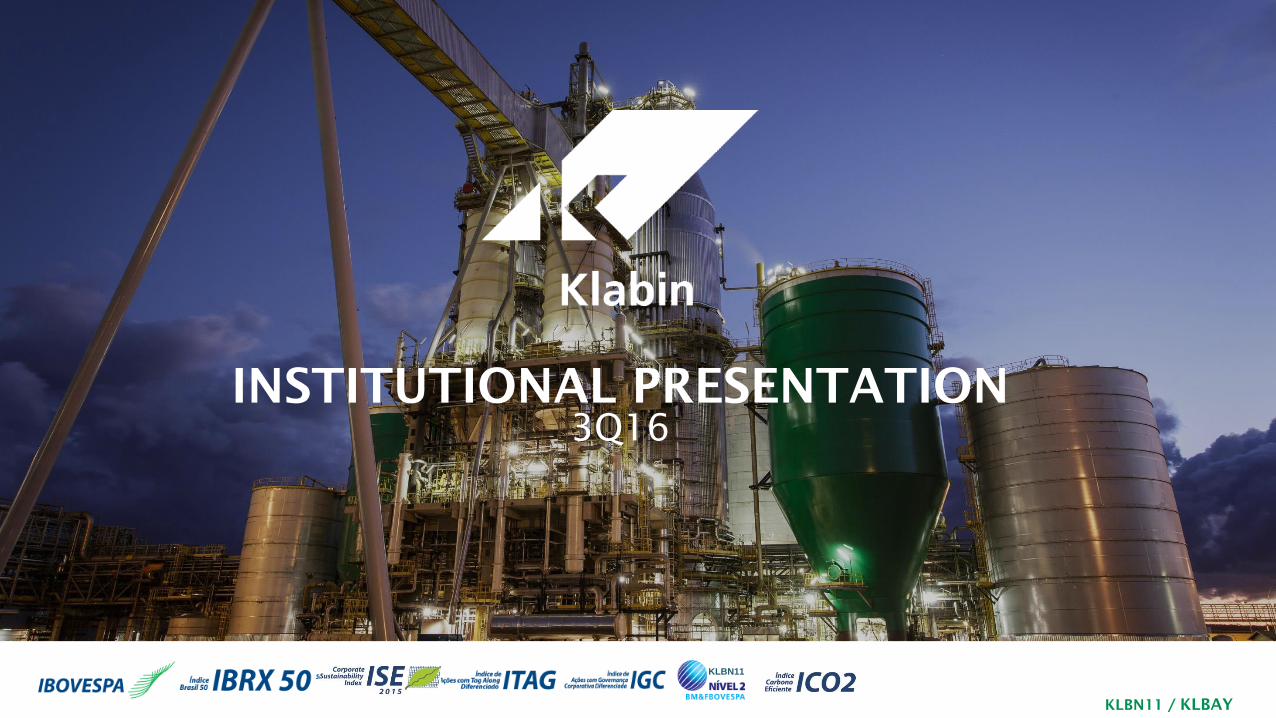
DISCLAIMER
The statements contained in this presentation related to the business outlook, operating and financial projections, and growth
prospects of Klabin S.A. are merely projections, and as such are based exclusively on the expectations of the Company’s
management concerning the future of the business.
These forward-looking statements depend substantially on the market conditions, the performance of the Brazilian economy,
the industry and international markets, and therefore are subject to change without prior notice.
This presentation on Klabin’s performance includes non-accounting and accounting data, such as operating and financial
information, as well as projections based on Management’s expectations. Note that the non-accounting data has not been
reviewed by the Company’s independent auditors.
The Company’s management believes EBITDA may provide useful information on the Company’s operating performance and
allow for comparisons with other companies in the same industry. Note however that EBITDA is not a measure established in
accordance with generally accepted accounting principles of the International Financial Reporting Standards – IFRS, and may be
defined and calculated differently by other companies.
2
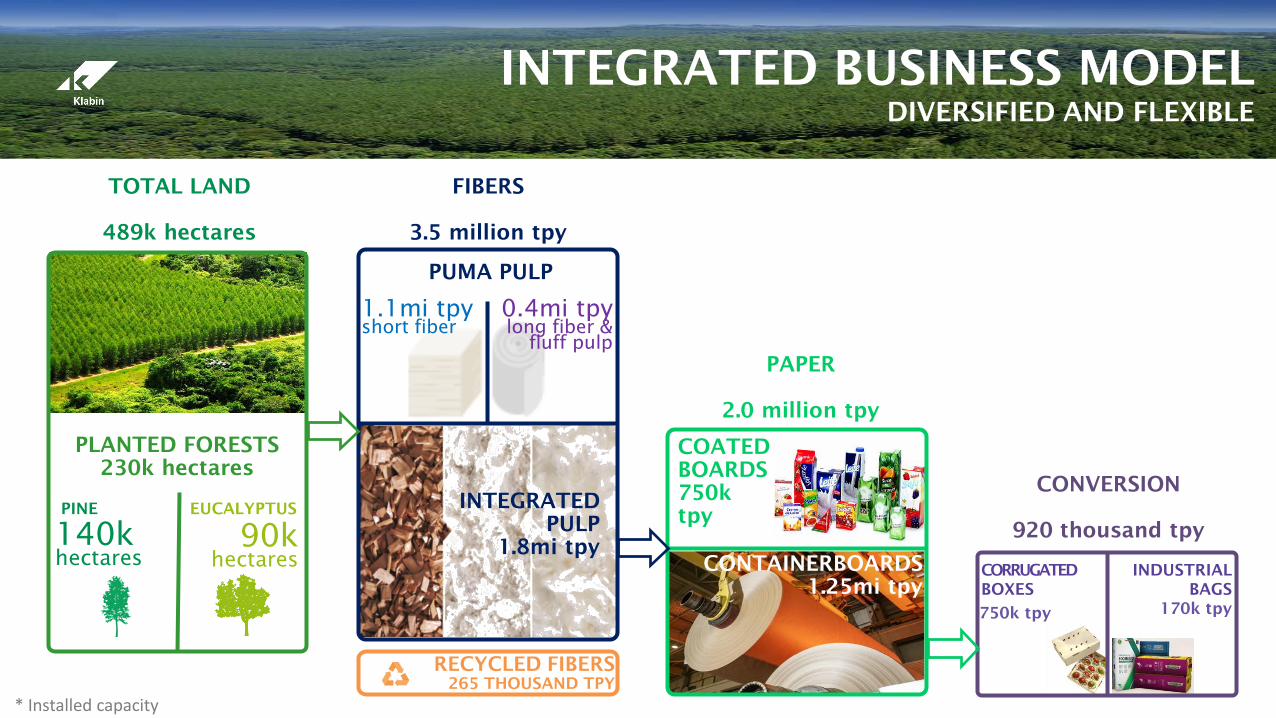
170k tpy
RECYCLED FIBERS
265 THOUSAND TPY
INTEGRATED BUSINESS MODEL
DIVERSIFIED AND FLEXIBLE
* Installed capacity
TOTAL LAND
489k hectares
140k hectares
90k hectares
PINE EUCALYPTUS
PUMA PULP
FIBERS
3.5 million tpy
1.1mi tpy short fiber
0.4mi tpy long fiber &
fluff pulp
INTEGRATED
PULP
1.8mi tpy
PAPER
2.0 million tpy
COATED
BOARDS
750k
tpy
CONTAINERBOARDS
1.25mi tpy
CONVERSION
920 thousand tpy
CORRUGATED
BOXES
INDUSTRIAL
BAGS
750k tpy
PLANTED FORESTS
230k hectares
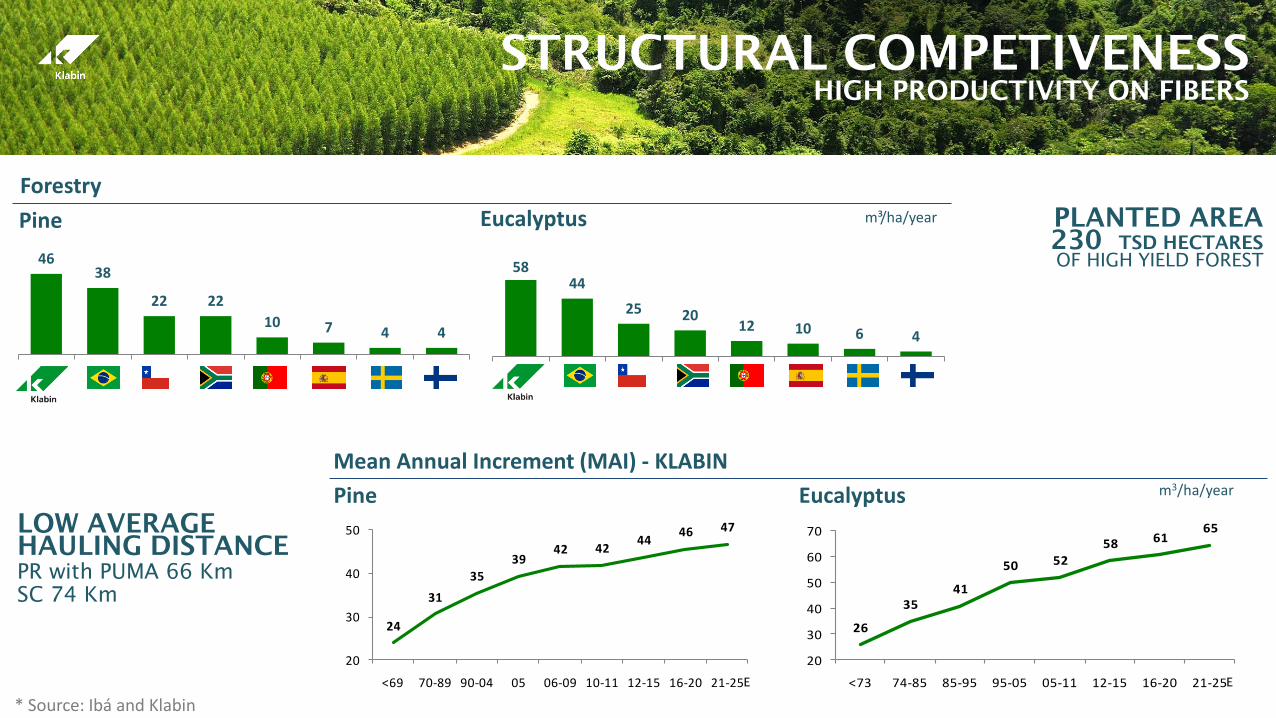
46 38
22 22
10 7 4 4
a b c d e f g
STRUCTURAL COMPETIVENESS HIGH PRODUCTIVITY ON FIBERS
24
31
35
3942 42
4446 47
20
30
40
50
<69 70-89 90-04 05 06-09 10-11 12-15 16-20 21-25
58 44
25 20 12 10 6 4
a b c d e f g
Eucalyptus m³/ha/year
Forestry
LOW AVERAGE
HAULING DISTANCE
PR with PUMA 66 Km
SC 74 Km
Mean Annual Increment (MAI) - KLABIN
PLANTED AREA
230 TSD HECTARES
OF HIGH YIELD FOREST
26
3541
50 5258 61
65
20
30
40
50
60
70
<73 74-85 85-95 95-05 05-11 12-15 16-20 21-25
m3/ha/year
Pine
Pine Eucalyptus
E E
* Source: Ibá and Klabin
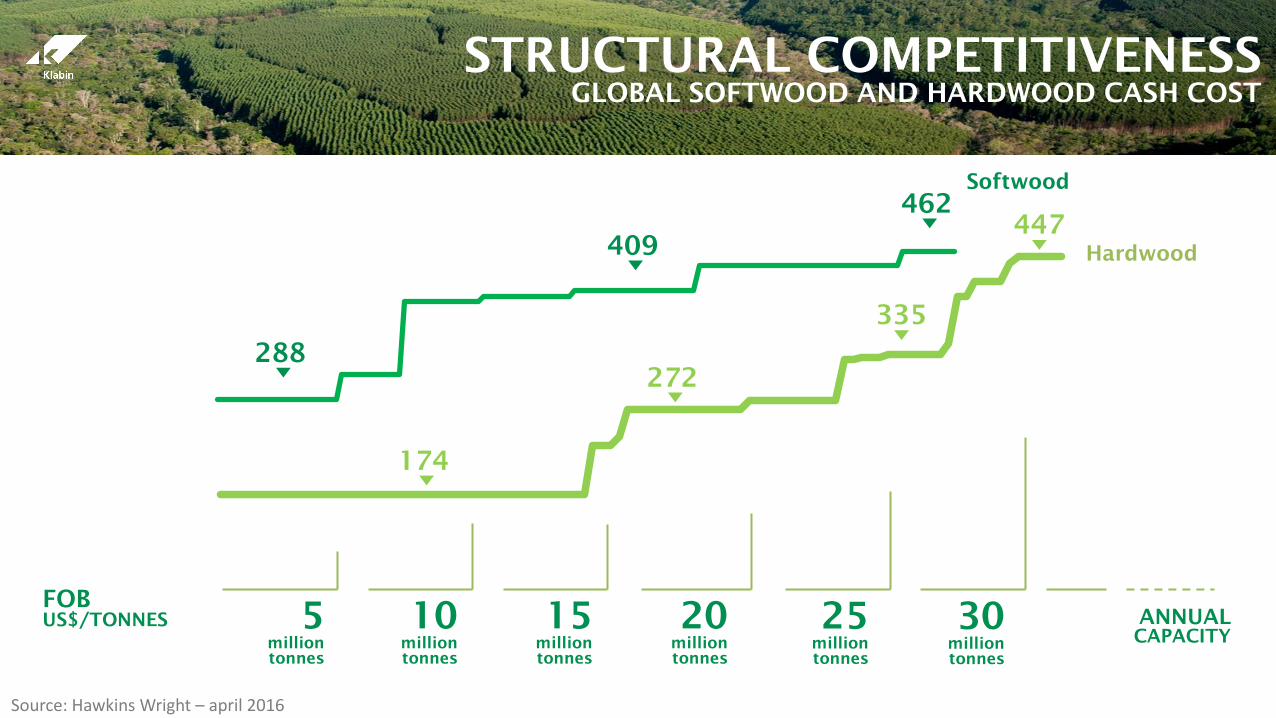
Source: Hawkins Wright – april 2016
288
447
174
409
462
272
335
5 million
tonnes
ANNUAL
CAPACITY
10 million
tonnes
15 million
tonnes
20 million
tonnes
25 million
tonnes
30 million
tonnes
FOB
US$/TONNES
Softwood
Hardwood
STRUCTURAL COMPETITIVENESS GLOBAL SOFTWOOD AND HARDWOOD CASH COST
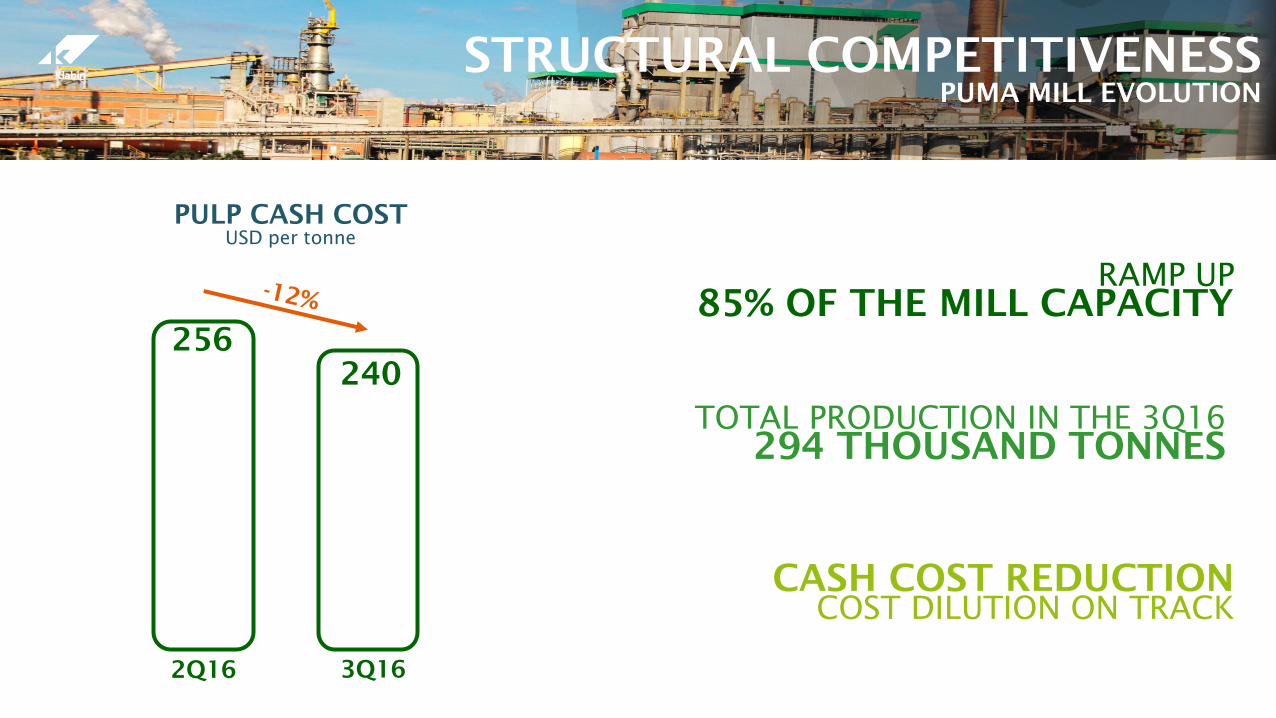
240
2Q16 3Q16
256
PULP CASH COST
USD per tonne
RAMP UP
85% OF THE MILL CAPACITY
TOTAL PRODUCTION IN THE 3Q16
294 THOUSAND TONNES
CASH COST REDUCTION
COST DILUTION ON TRACK
STRUCTURAL COMPETITIVENESS PUMA MILL EVOLUTION
production
capacity
production
cash cost
US$/tonnes
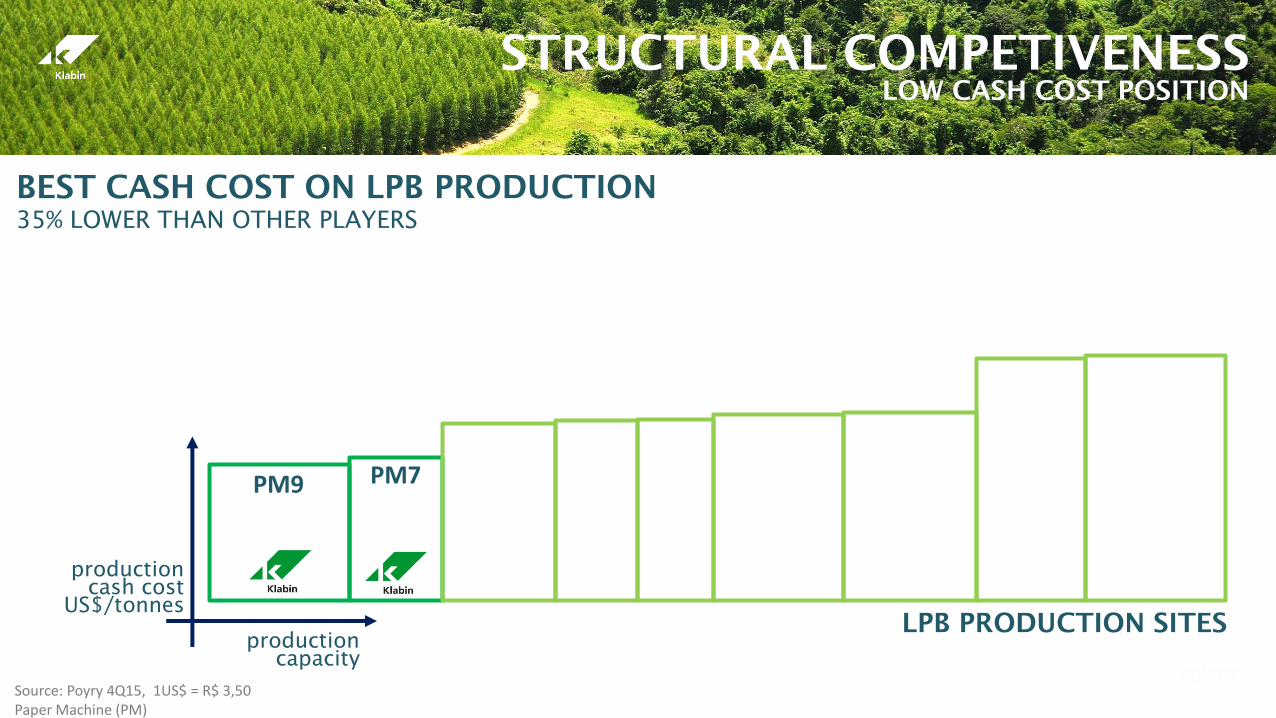
STRUCTURAL COMPETIVENESS LOW CASH COST POSITION
Source: Poyry 4Q15, 1US$ = R$ 3,50 Paper Machine (PM)
LPB PRODUCTION SITES
PM7
PM9
BEST CASH COST ON LPB PRODUCTION
35% LOWER THAN OTHER PLAYERS
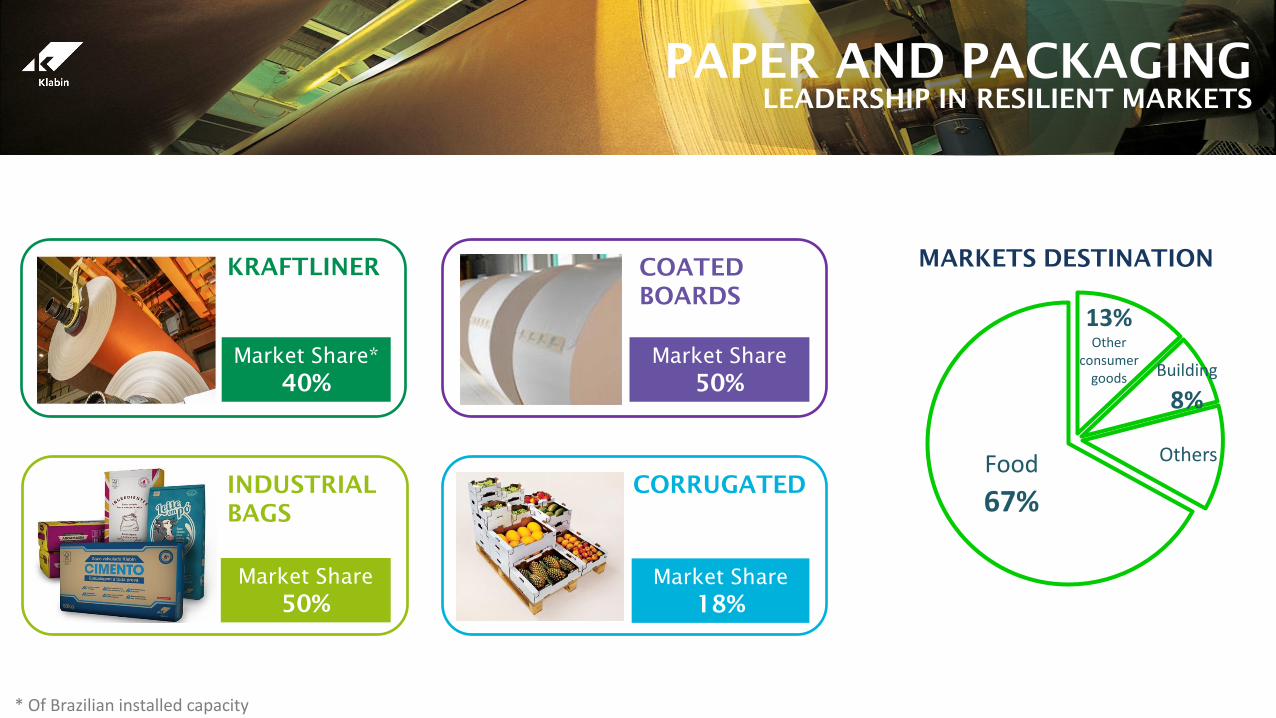
KRAFTLINER
Market Share*
40%
INDUSTRIAL
BAGS
Market Share
50%
CORRUGATED
Market Share
18%
COATED
BOARDS
Market Share
50%
PAPER AND PACKAGING LEADERSHIP IN RESILIENT MARKETS
* Of Brazilian installed capacity
13% Other
consumer goods Building
8%
Others Food 67%
MARKETS DESTINATION
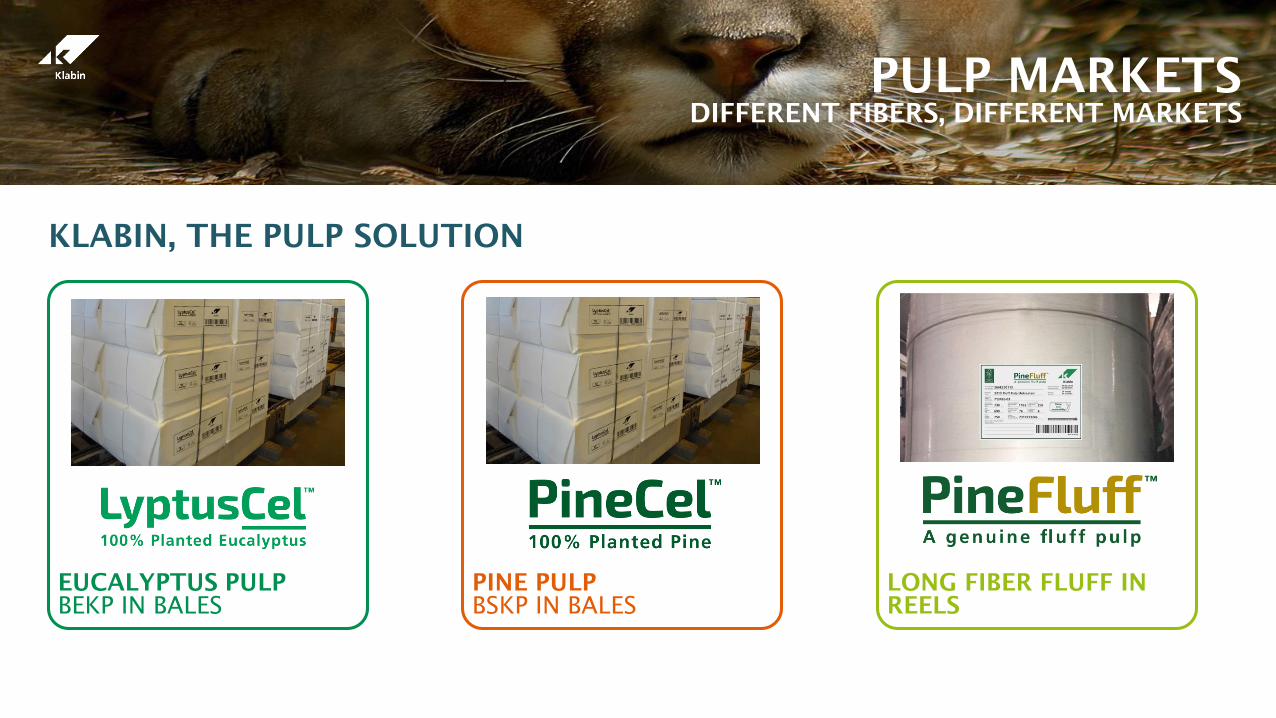
EUCALYPTUS PULP
BEKP IN BALES
PINE PULP
BSKP IN BALES
LONG FIBER FLUFF IN
REELS
PULP MARKETS DIFFERENT FIBERS, DIFFERENT MARKETS
KLABIN, THE PULP SOLUTION
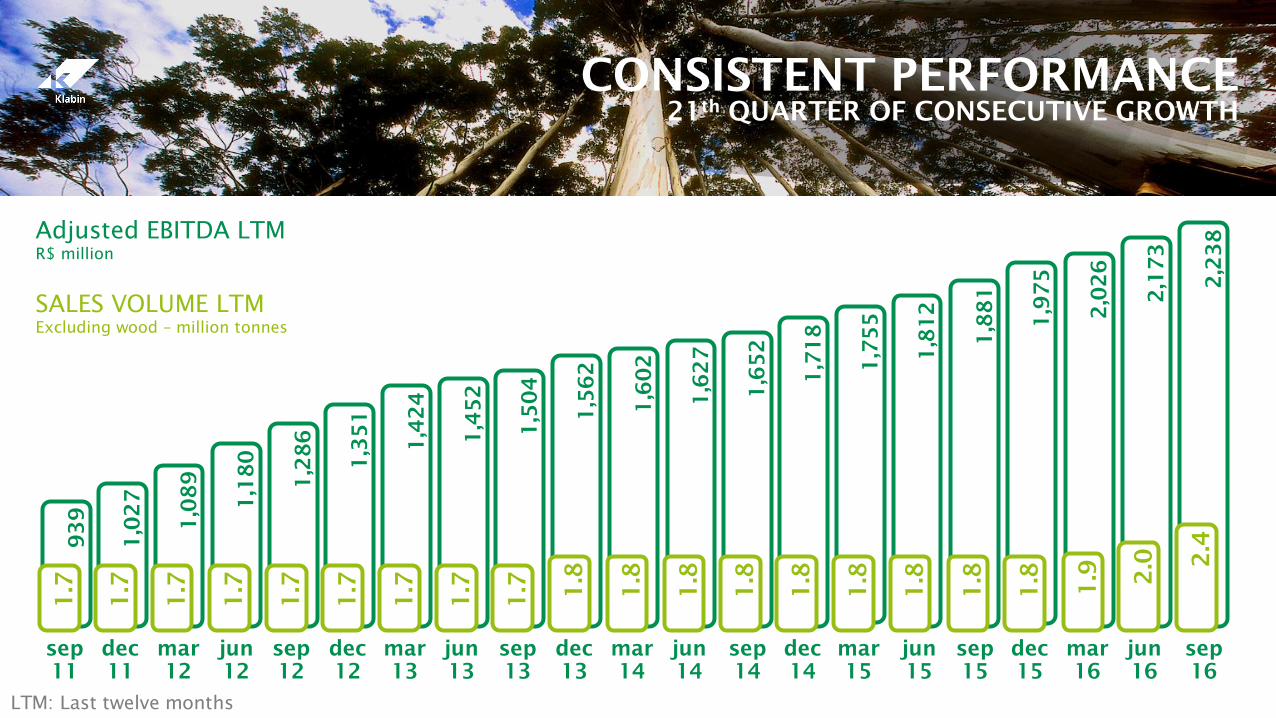
CONSISTENT PERFORMANCE 21
th QUARTER OF CONSECUTIVE GROWTH
SALES VOLUME LTM
Excluding wood – million tonnes
Adjusted EBITDA LTM
R$ million
1,0
27
dec
11
1,0
89
mar
12
93
9
sep
11
1,1
80
jun
12
1,2
86
sep
12
1,3
51
dec
12
1,4
24
mar
13
1,4
52
jun
13
1,5
04
sep
13
1,5
62
dec
13
1,6
02
mar
14
1,6
27
1.7
1.7
1.7
1.7
1.7
1.7
1.7
1.7
1.7
1.8
1.8
1.8
jun
14
1,6
52
sep
14
1,7
18
dec
14
1,7
55
mar
15
1,8
12
jun
15
1,8
81
1.8
1.8
1.8
1.8
1.8
sep
15
LTM: Last twelve months
1,9
75
1
.8
dec
15
2,0
26
1
.9
mar
16
2,1
73
2
.0
jun
16
2,2
38
2
.4
sep
16
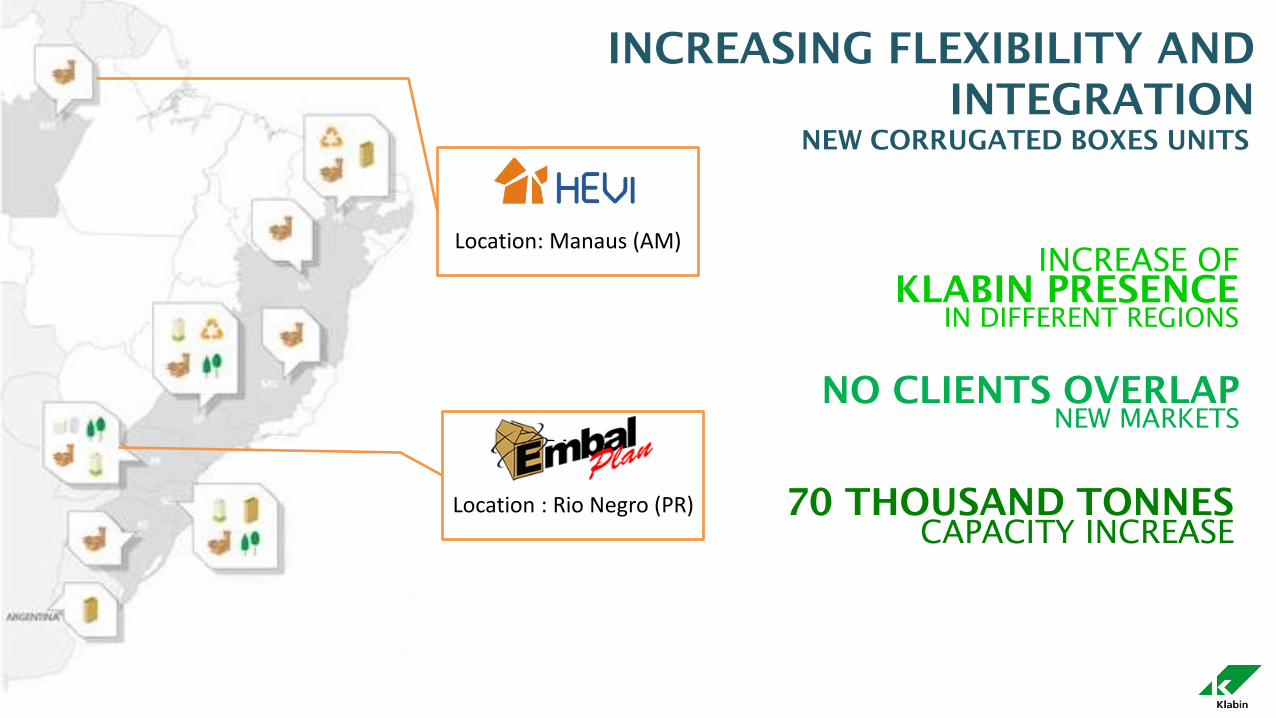
INCREASING FLEXIBILITY AND
INTEGRATION
HEVI
Location: Manaus (AM)
EMBALPLAN
Location : Rio Negro (PR)
INCREASE OF
KLABIN PRESENCE IN DIFFERENT REGIONS
NO CLIENTS OVERLAP NEW MARKETS
70 THOUSAND TONNES
CAPACITY INCREASE
NEW CORRUGATED BOXES UNITS
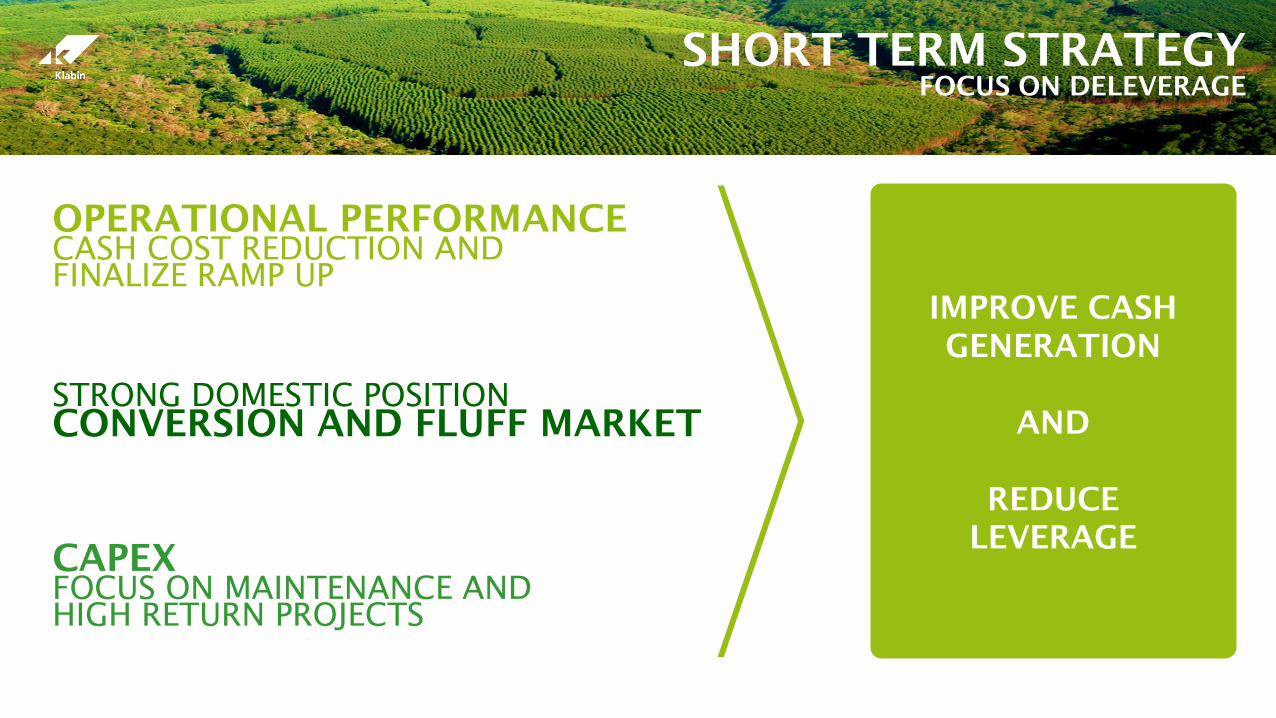
SHORT TERM STRATEGY FOCUS ON DELEVERAGE
STRONG DOMESTIC POSITION
CONVERSION AND FLUFF MARKET
CAPEX
FOCUS ON MAINTENANCE AND
HIGH RETURN PROJECTS
OPERATIONAL PERFORMANCE
CASH COST REDUCTION AND
FINALIZE RAMP UP
IMPROVE CASH
GENERATION
AND
REDUCE
LEVERAGE

FUTURE GROWTH
EXPANDING THE INTEGRATED BUSINESS MODEL
* Installed capacity
TOTAL LAND
489k hectares
140k hectares
90k hectares
PINE EUCALYPTUS
PUMA PULP
FIBERS
3.5 million tpy
1.1mi tpy short fiber
0.4mi tpy long fiber &
fluff pulp
INTEGRATED
PULP
1.8mi tpy
PAPER AND CONVERSION
FUTURE GROWTH
COATED
BOARDS
750k
tpy
170k tpy
RECYCLED FIBERS
265 THOUSAND TPY
CONTAINERBOARDS
1.25mi tpy
CORRUGATED
BOXES
INDUSTRIAL
BAGS
750k tpy
PLANTED FORESTS
230k hectares
FOCUS IN PAPER AND
PACKAGING
3Q16 RESULTS
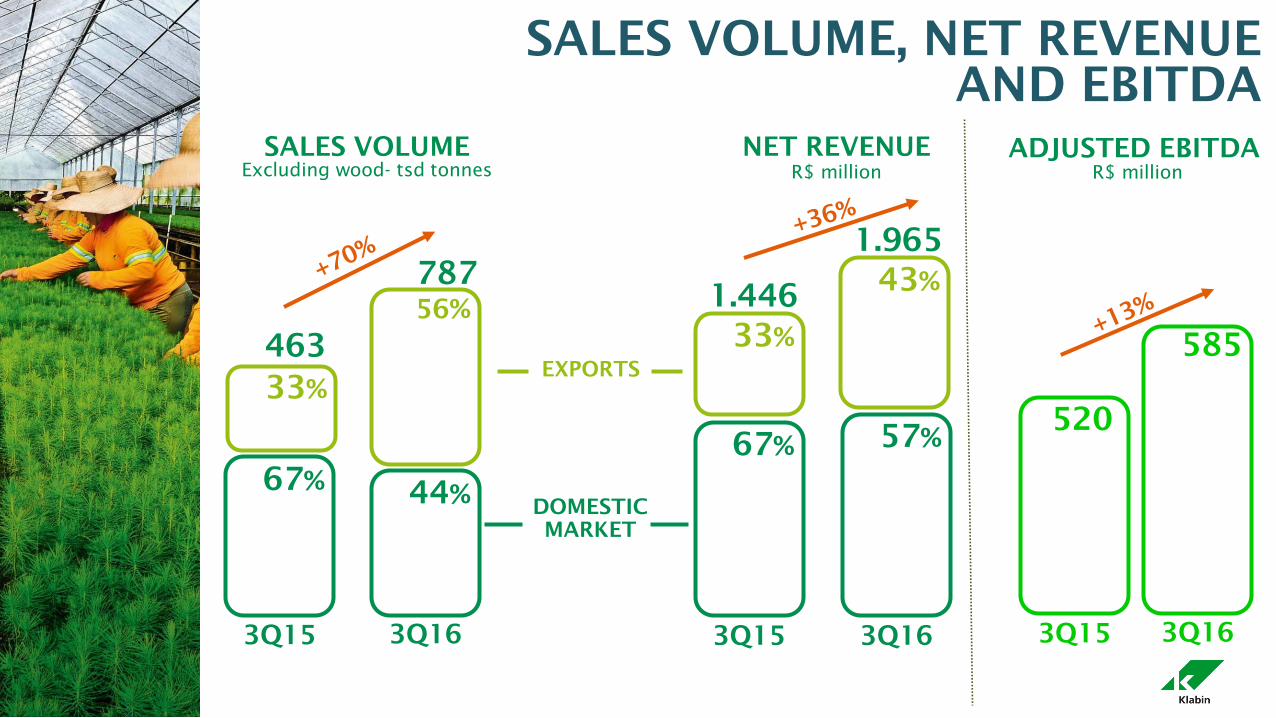
67%
33%
463
44%
56%
787
67%
33%
1.446
57%
43%
1.965
585
520
SALES VOLUME
Excluding wood- tsd tonnes
NET REVENUE
R$ million
SALES VOLUME, NET REVENUE
AND EBITDA
ADJUSTED EBITDA
R$ million
3Q15 3Q16 3Q15 3Q16 3Q15 3Q16
EXPORTS
DOMESTIC
MARKET
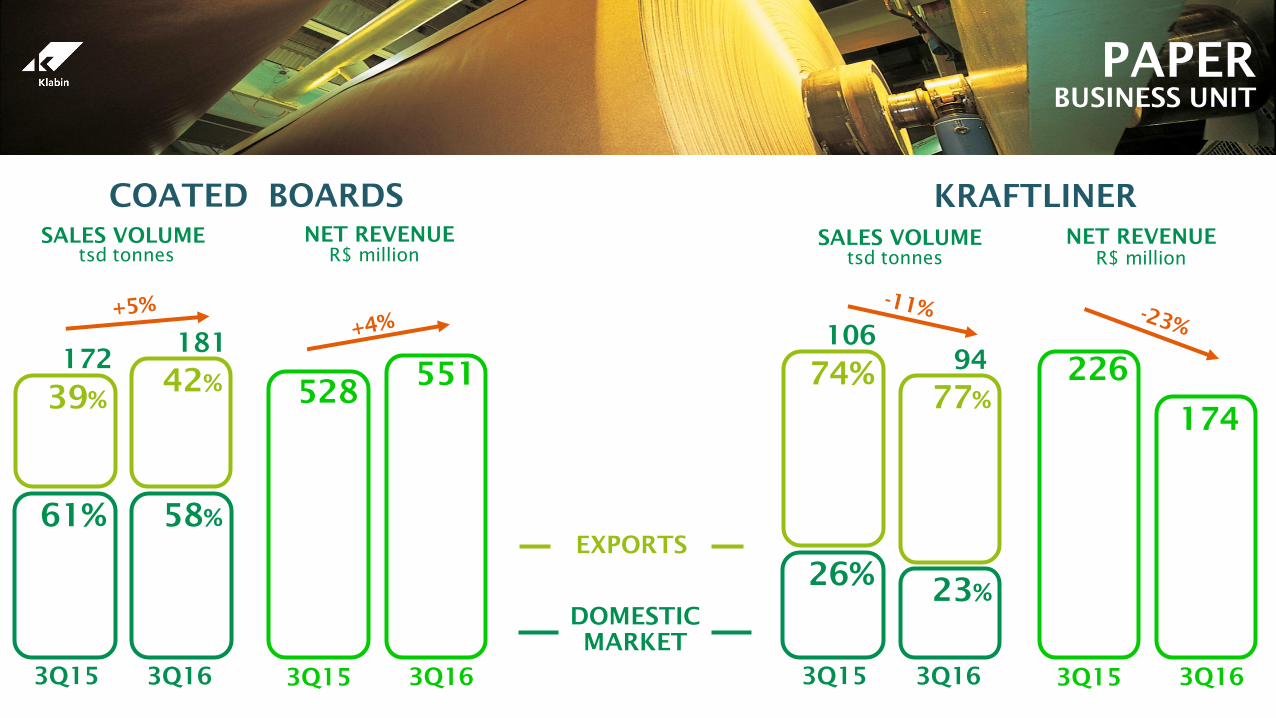
26%
74%
106
23%
77%
94
174
226
61%
39%
172
58%
42%
181
551 528
KRAFTLINER COATED BOARDS
3Q15 3Q16 3Q15 3Q16 3Q15 3Q16 3Q15 3Q16
EXPORTS
DOMESTIC
MARKET
PAPER BUSINESS UNIT
SALES VOLUME NET REVENUE SALES VOLUME NET REVENUE
tsd tonnes tsd tonnes R$ million R$ million
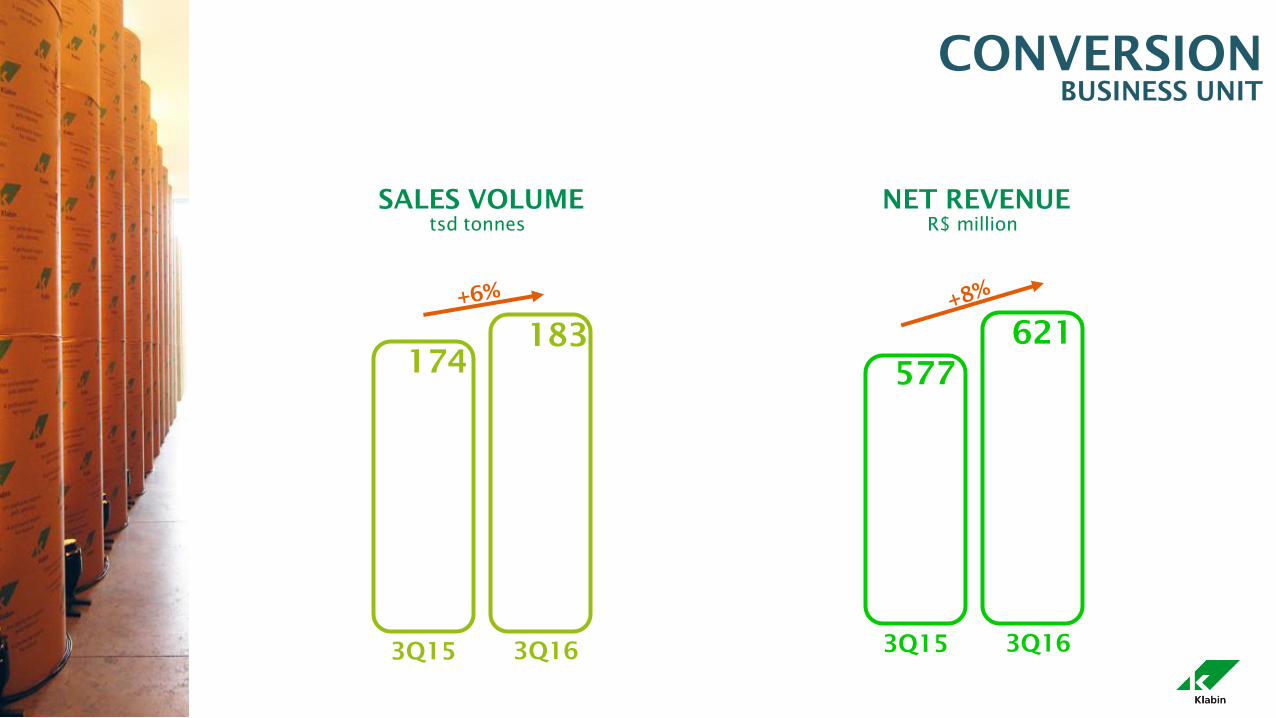
183
174
621
577
CONVERSION BUSINESS UNIT
3Q15 3Q16 3Q15 3Q16
SALES VOLUME NET REVENUE
tsd tonnes R$ million
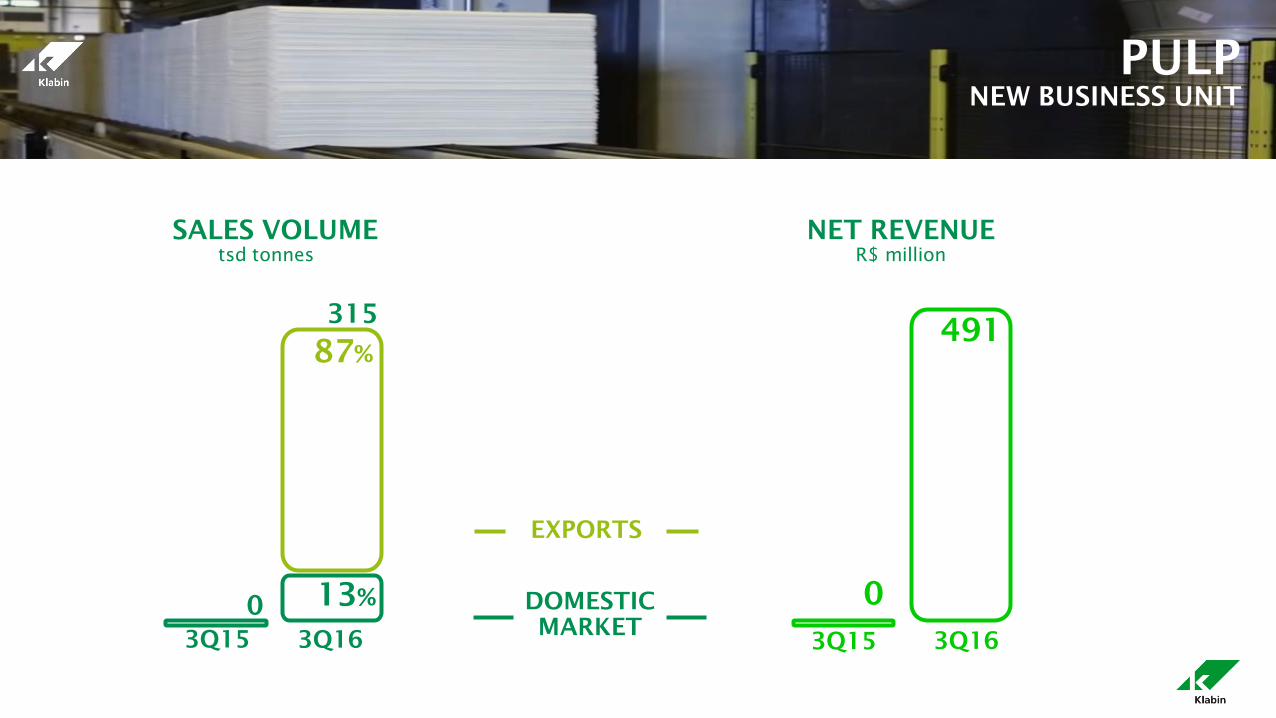
0
3Q15
13%
87%
315
3Q16 3Q15 3Q16
491
0
PULP NEW BUSINESS UNIT
EXPORTS
DOMESTIC
MARKET
SALES VOLUME NET REVENUE
tsd tonnes R$ million
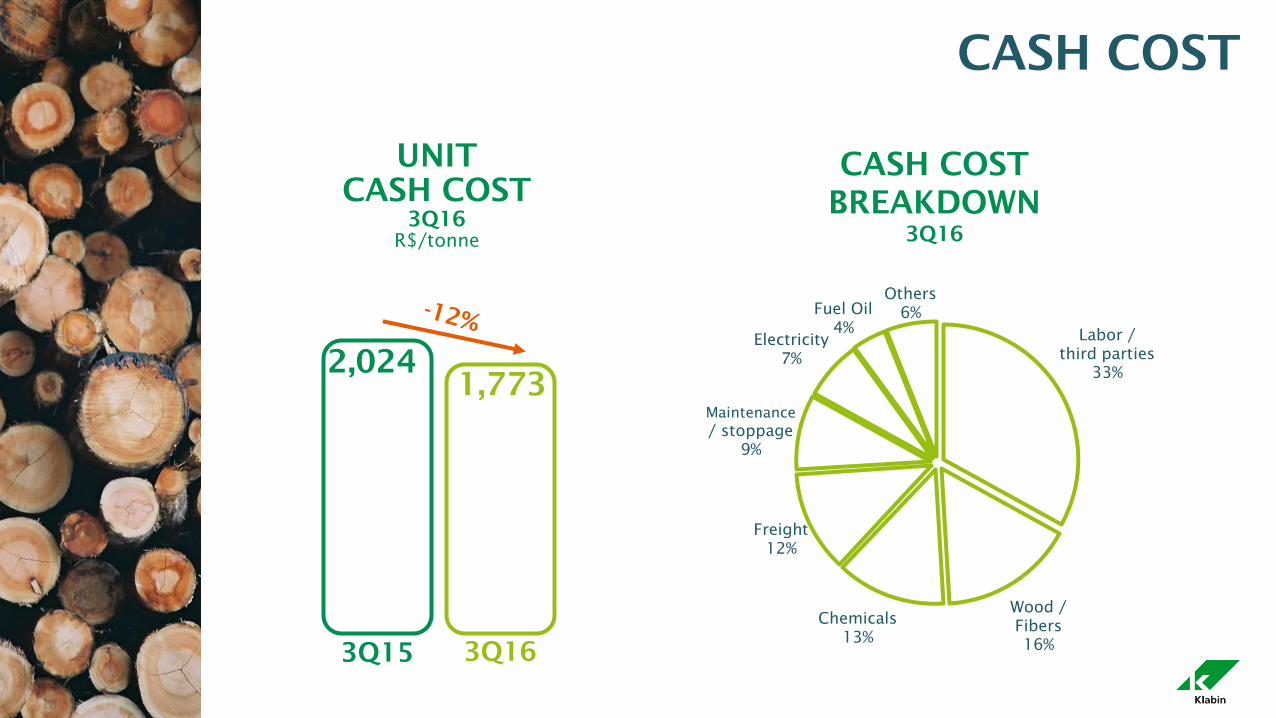
CASH COST
3Q15 3Q16
UNIT
CASH COST
3Q16
R$/tonne
Labor /
third parties
33%
Wood /
Fibers
16%
Chemicals
13%
Freight
12%
Maintenance
/ stoppage
9%
Electricity
7%
Fuel Oil
4%
Others
6%
CASH COST
BREAKDOWN
3Q16
1,773
2,024
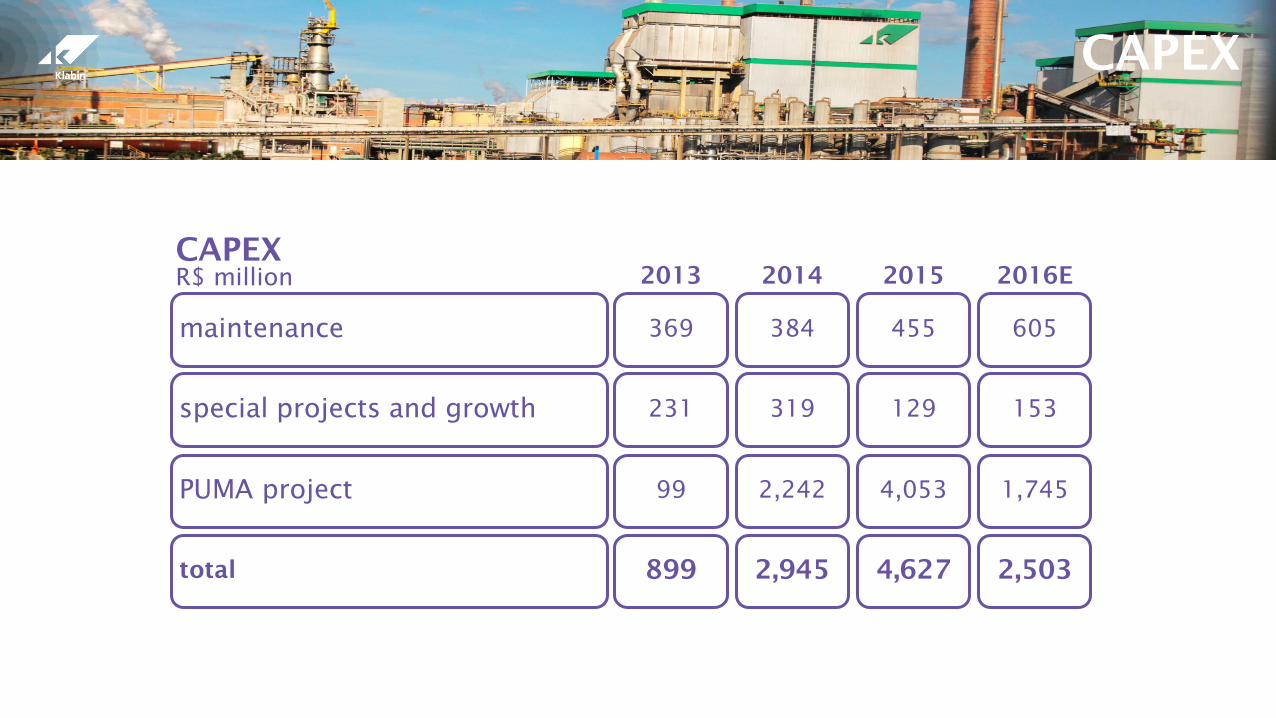
CAPEX
maintenance
CAPEX
R$ million
special projects and growth
PUMA project
total
2013
369
231
99
899
2014
384
319
2,242
2,945
2015
455
129
4,053
4,627
2016E
605
153
1,745
2,503
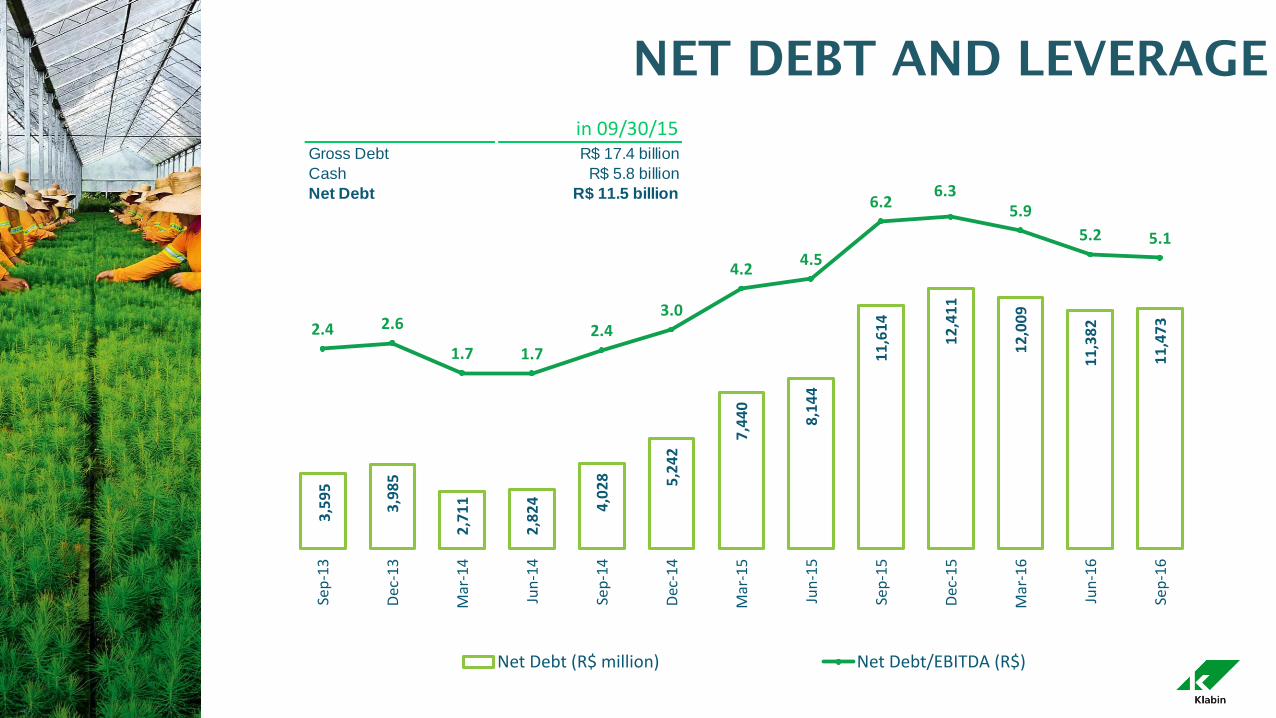
NET DEBT AND LEVERAGE
3,5
95
3,9
85
2,7
11
2,8
24
4,0
28
5,2
42
7,4
40
8,1
44
11
,61
4
12
,41
1
12
,00
9
11
,38
2
11
,47
3 2.4 2.6
1.7 1.7
2.43.0
4.24.5
6.26.3
5.9
5.2 5.1
-4.0-3.5-3.0-2.5-2.0-1.5-1.0-0.50.00.51.01.52.02.53.03.54.04.55.05.56.06.57.0
(1,000)
1,000
3,000
5,000
7,000
9,000
11,000
13,000
15,000
17,000
Sep
-13
Dec
-13
Mar
-14
Jun
-14
Sep
-14
Dec
-14
Mar
-15
Jun
-15
Sep
-15
Dec
-15
Mar
-16
Jun
-16
Sep
-16
NET DEBT AND LEVERAGE
Net Debt (R$ million) Net Debt/EBITDA (R$)
in 09/30/15Gross Debt R$ 17.4 billion
Cash R$ 5.8 billion
Net Debt R$ 11.5 billion
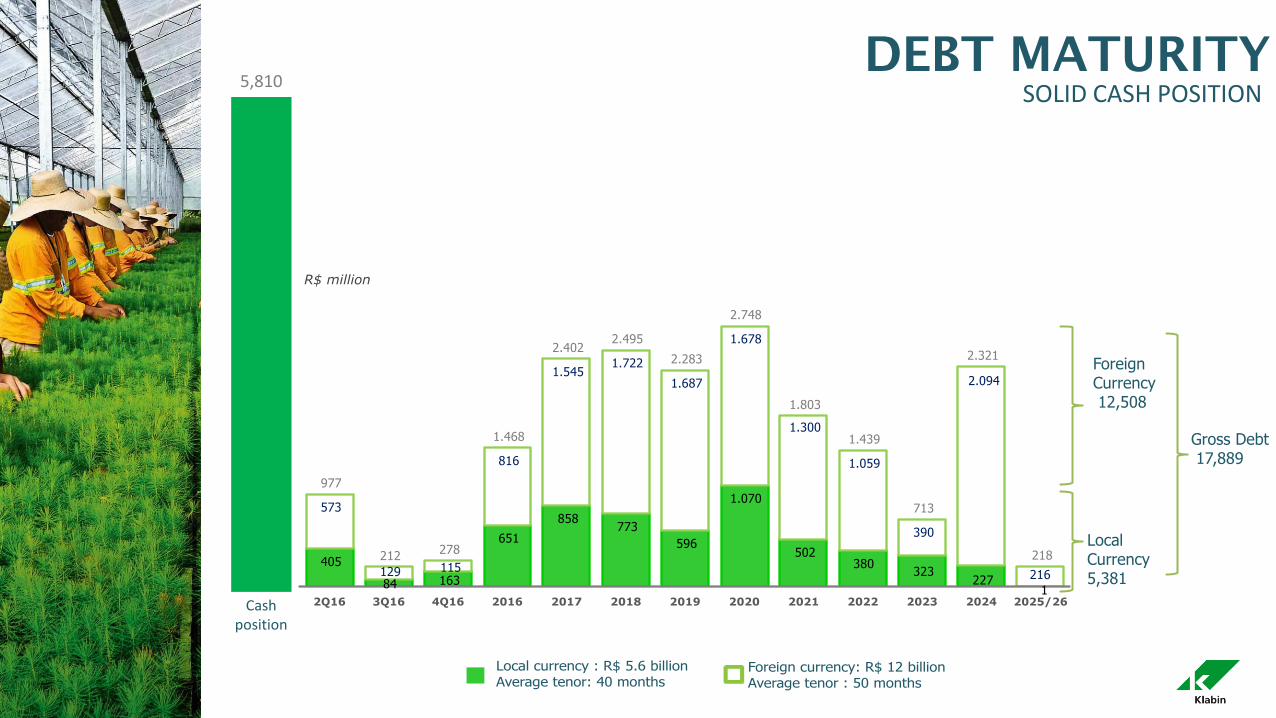
DEBT MATURITY
Cash position
5,810 SOLID CASH POSITION
Local currency : R$ 5.6 billionAverage tenor: 40 months
Foreign currency: R$ 12 billionAverage tenor : 50 months
Foreign Currency12,024
LocalCurrency 5,168
Gross Debt17,192
R$ million
121 146 266
896
678 619
1,189
526 404 343
244
1
237
429
666
1,391 1,571 1,647
1,554
1,569
1,106
426
1,895
198
358
575
932
2,287 2,249 2,266
2,744
2,096
1,510
770
2,139
200
3Q16 4Q16 2016 2017 2018 2019 2020 2021 2022 2023 2024 2025/26
Foreign Currency 12,508
Local Currency 5,381
Gross Debt 17,889
R$ million
405
84 163
651
858 773
596
1.070
502 380
323 227
1
573
129 115
816
1.545 1.722
1.687
1.678
1.300
1.059
390
2.094
216
977
212 278
1.468
2.402 2.495
2.283
2.748
1.803
1.439
713
2.321
218
2Q16 3Q16 4Q16 2016 2017 2018 2019 2020 2021 2022 2023 2024 2025/26
APPENDIX

GLOBAL PULP INCREASING DEMAND IN BOTH FIBERS
2015
24.7
2016
25.4
2017
25.0 26.2
2019 2018
24.3
2014
23.7
CAGR +2%
2020
26.2
LONG FIBER
31.0
2016
32.3
2017
33.2
2018
34.1
2019
35.0
2020
CAGR +3%
28.9
2014 2015
30.0
Asia/ Africa
China
Latin America
Europe
North America
SHORT FIBER
Source: Hawkins Wright Million tonnes per year
CHINA LEADS THE GROWTH
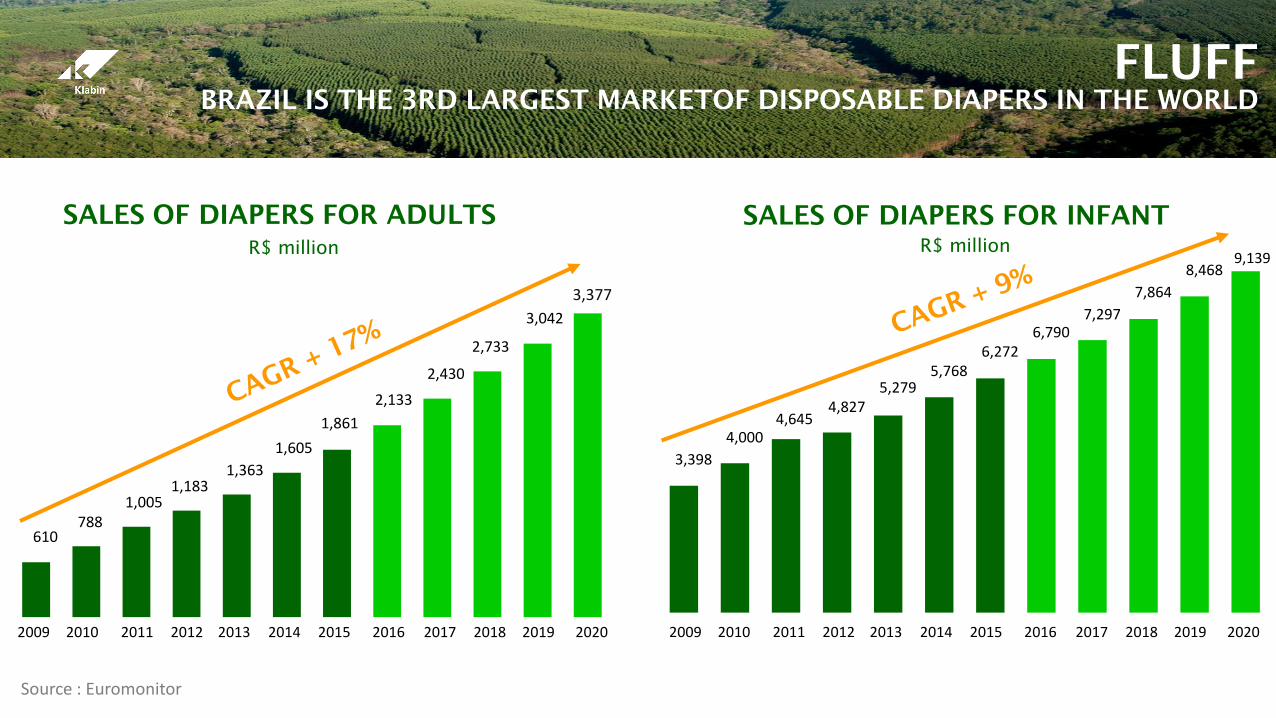
FLUFF BRAZIL IS THE 3RD LARGEST MARKETOF DISPOSABLE DIAPERS IN THE WORLD
Source : Euromonitor
610 788
1,005 1,183
1,363
1,605
1,861
2,133
2,430
2,733
3,042
2016 2014 2013 2012 2015 2011 2009 2010 2020 2019 2018 2017
SALES OF DIAPERS FOR ADULTS
R$ million
3,398
4,000 4,645
4,827 5,279
5,768 6,272
6,790 7,297
7,864
8,468
2016 2014 2013 2012 2015 2011 2009 2010 2020 2019 2018 2017
SALES OF DIAPERS FOR INFANT
R$ million 9,139
3,377
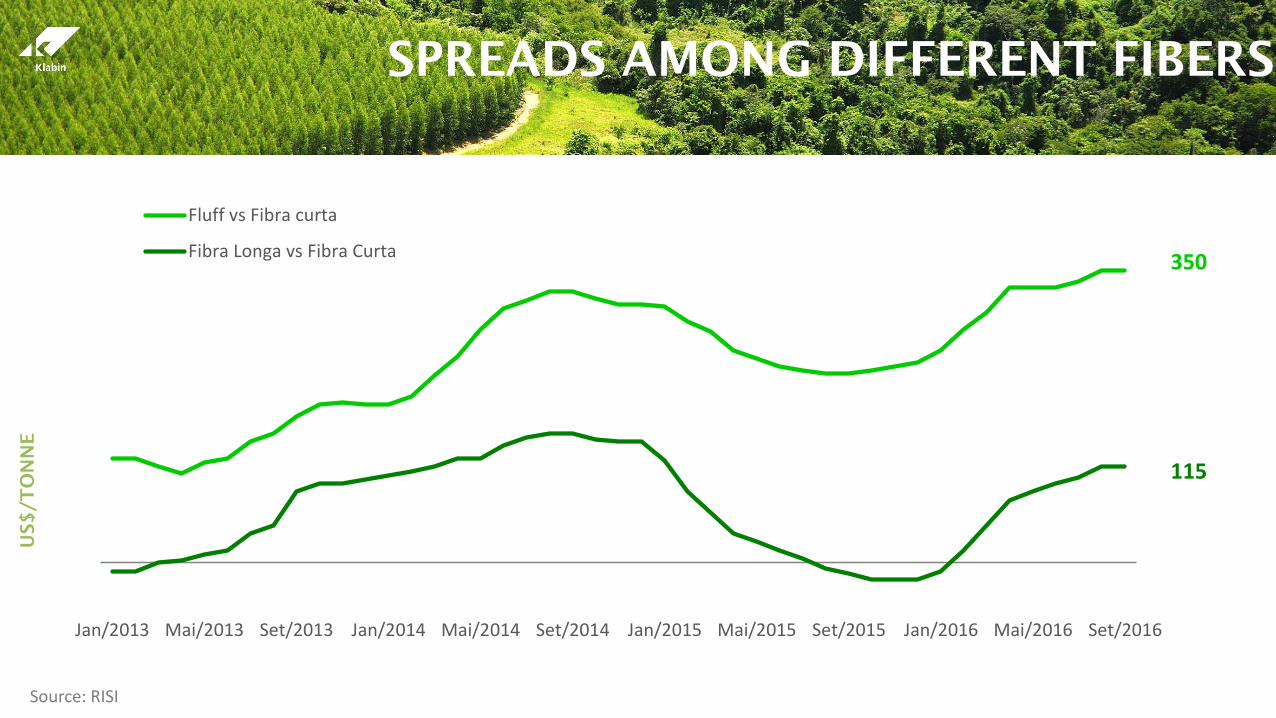
SPREADS AMONG DIFFERENT FIBERS
115
350
Source: RISI
US$
/T
ON
NE
Jan/2013 Mai/2013 Set/2013 Jan/2014 Mai/2014 Set/2014 Jan/2015 Mai/2015 Set/2015 Jan/2016 Mai/2016 Set/2016
Fluff vs Fibra curta
Fibra Longa vs Fibra Curta

-4%
-3%
-2%
-1%
0%
1%
2%
3%
4%
0% 20% 40% 60% 80%
PACKAGING MARKETS
FOCUS IN LARGE AND GROWING MARKETS
PAPER MARKETS DEMAND (2014-2030)
Source: POYRY
100%
Share of consumption in 2014
Tissue KLABIN Pulp
Containerboards KLABIN kraftliner and recycled paper Cartonboards
KLABIN coated boards
Sackpaper KLABIN sack kraft and
industrial bags
Market A
Market B
Market C
Market E Market D
Demand growth per year
KLABIN MARKETS
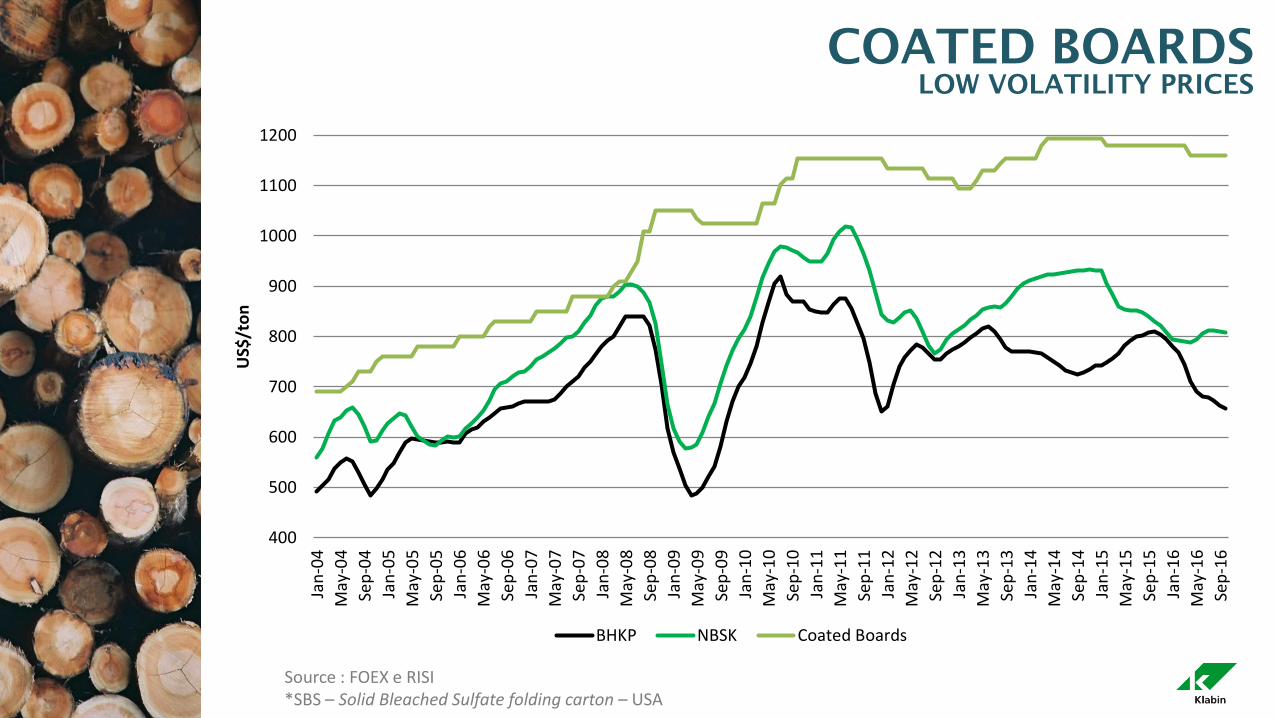
COATED BOARDS LOW VOLATILITY PRICES
Source : FOEX e RISI *SBS – Solid Bleached Sulfate folding carton – USA
*
400
500
600
700
800
900
1000
1100
1200
Jan
-04
May
-04
Sep
-04
Jan
-05
May
-05
Sep
-05
Jan
-06
May
-06
Sep
-06
Jan
-07
May
-07
Sep
-07
Jan
-08
May
-08
Sep
-08
Jan
-09
May
-09
Sep
-09
Jan
-10
May
-10
Sep
-10
Jan
-11
May
-11
Sep
-11
Jan
-12
May
-12
Sep
-12
Jan
-13
May
-13
Sep
-13
Jan
-14
May
-14
Sep
-14
Jan
-15
May
-15
Sep
-15
Jan
-16
May
-16
Sep
-16
US$
/to
n
BHKP NBSK Coated Boards
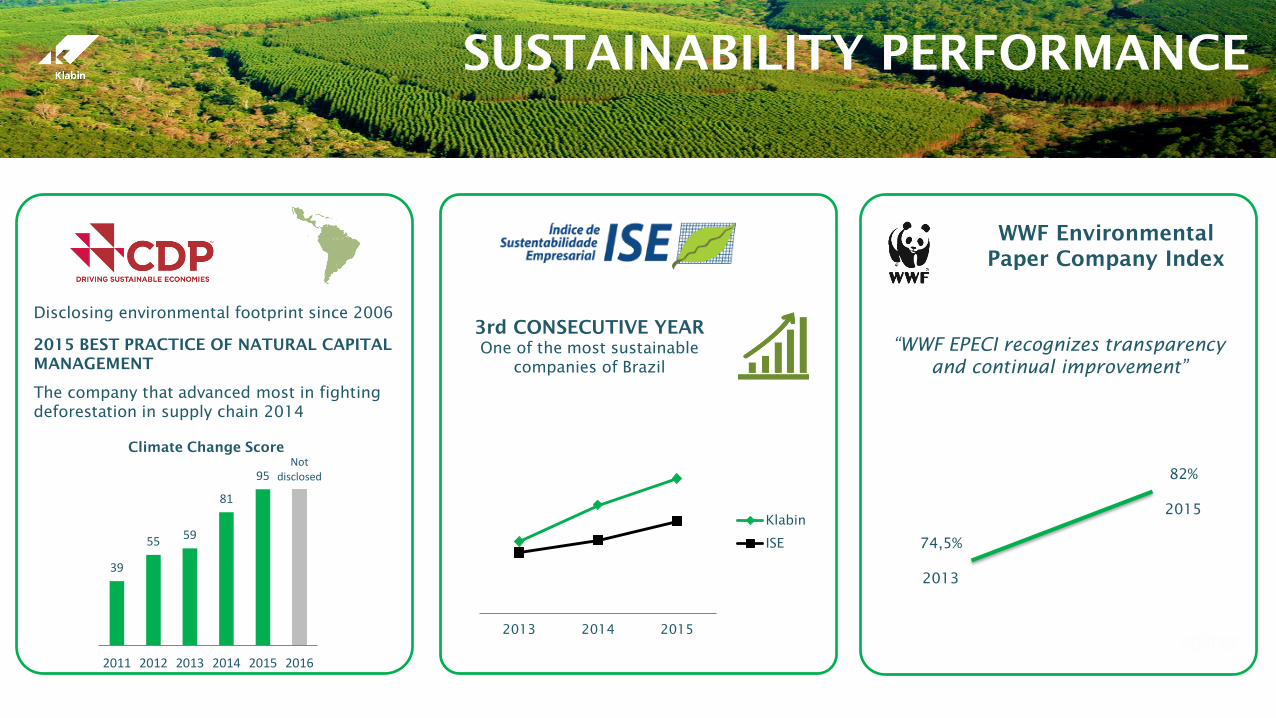
SUSTAINABILITY PERFORMANCE
39
55 59
81
95 Not
disclosed
2011 2012 2013 2014 2015 2016
Climate Change Score
Disclosing environmental footprint since 2006
2015 BEST PRACTICE OF NATURAL CAPITAL
MANAGEMENT
The company that advanced most in fighting
deforestation in supply chain 2014
3rd CONSECUTIVE YEAR
One of the most sustainable
companies of Brazil
2013 2014 2015
Klabin
ISE 74,5%
2013
82%
2015
WWF Environmental
Paper Company Index
“WWF EPECI recognizes transparency
and continual improvement”


![SMALL BUSINESS ADMINISTRATION 13 CFR Part 120 RIN 3245 ... · 1 . SMALL BUSINESS ADMINISTRATION . 13 CFR Part 120 [Docket Number SBA-2020-0032] RIN 3245-AH46 . DEPARTMENT OF THE TREASURY](https://static.fdocuments.in/doc/165x107/5ed444b04c96ec4df575db2e/small-business-administration-13-cfr-part-120-rin-3245-1-small-business-administration.jpg)