ABB Measurement & Analytics Monitoring cement plant … · ABB Measurement & Analytics Monitoring...
8
White paper WP/ANALYTICAL/002–EN ABB Measurement & Analytics Monitoring cement plant stack emissions using FTIR ABB FTIR CEMS analyzer successfully monitors cement plant stack emissions in extensive field study Measurement made easy Introduction A major U.S. cement manufacturing facility completed a five-month field trial of the ABB ACF5000 hot / wet extractive FTIR Continuous Emission Monitoring System (CEMS) in August 2015. The trial primarily tested the system's capabilities to satisfy EPA HCl emission monitoring requirements. Secondarily, it checked how well the system monitored other regulated emission pollutants (SO2, NOx, CO, CO2) under relevant EPA performance specifications and QA requirements and examined the analyzer's performance in monitoring non-regulatory parameters of interest such as ammonia, formaldehyde, and methane. Lastly, the tests included monitoring during different in-line raw mill operating conditions, which can contribute to significant variability in emissions. Fig. 1: Layout of typical cement plant and measurement location
Transcript of ABB Measurement & Analytics Monitoring cement plant … · ABB Measurement & Analytics Monitoring...
White paper WP/ANALYTICAL/002–EN
ABB Measurement & AnalyticsMonitoring cement plant stack emissions using FTIR
ABB FTIR CEMS analyzer successfully monitors cement plant stack emissions in extensive field study
Measurement made easy
Introduction
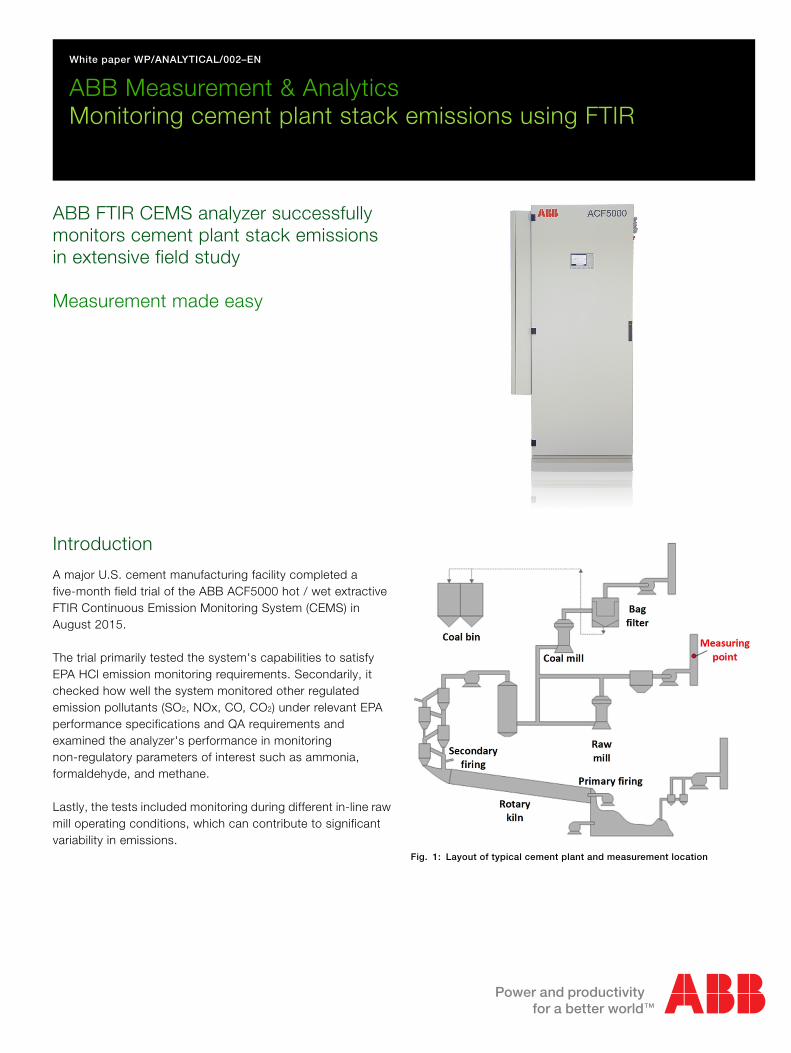
A major U.S. cement manufacturing facility completed a five-month field trial of the ABB ACF5000 hot / wet extractive FTIR Continuous Emission Monitoring System (CEMS) in August 2015.
The trial primarily tested the system's capabilities to satisfy EPA HCl emission monitoring requirements. Secondarily, it checked how well the system monitored other regulated emission pollutants (SO2, NOx, CO, CO2) under relevant EPA performance specifications and QA requirements and examined the analyzer's performance in monitoring non-regulatory parameters of interest such as ammonia, formaldehyde, and methane.
Lastly, the tests included monitoring during different in-line raw mill operating conditions, which can contribute to significant variability in emissions.
Fig. 1: Layout of typical cement plant and measurement location

2 WP/ANALYTICAL/002–EN | ABB Measurement & Analytics | Monitoring cement plant stack emissions using FTIR
The ABB FTIR analyzer system
The trial evaluated the ACF5000 FTIR CEMS manufactured by ABB. This is a hot / wet extractive analyzer system using a high resolution FTIR spectrometer to simultaneously measure up to fifteen gaseous components. The analyzer's standard probe tube positioned inside the stack withstands temperatures up to 500 °C (932 °F). The gas path from the sampling location to the analyzer is maintained above 180 °C (356 °F), allowing measurement of very low concentrations of reactive pollutants such as HCl, NH3 and HF.
An electronically controlled air injector creates a vacuum via the Venturi effect. It draws the sampled gas into the analyzer cell, eliminating the need for a mechanical pump and associated maintenance. As a beneficial side effect, the sample gas undergoes dilution as it exits the analyzer cell outlet. Dilution reduces condensation and makes disposal of the exhaust gas safer.
The use of the air injector allows direct connection of the heated sample line to a heated block and subsequently to the gas cell. This arrangement ensures a constant temperature throughout the measuring system, avoiding potential 'cold spots' where condensation or chemical reactions could take place. A zirconia-sensor-based monitoring system for O2 and a flame ionization detector for THC can be close-coupled directly to the conditioning block if desired.
To monitor drift, the system can be equipped with a 'validation' unit that acts as an alternative to introducing calibration test gases. This unit has a disc with six holes, five of which hold films or gas-filled cells that can be swiveled into the spectrometer's optical path. This approach can eliminate the need to introduce test gases during normal operation. Test gases would be needed only for audits or if the analyzer detects a significant deviation between the expected and measuring values.
Fig. 2: ACF5000 FTIR CEMS flow diagram
Sample conditioning≥180 °C (356 °F)Stack Sampling
≥180 °C (356 °F)Sample line
≥180 °C (356 °F)Analyzer
≥180 °C (356 °F) Exhaust
FTIR
O2
Emergency purge test gas
Test gas
Compressedair
Gas outlet
Test gas
Burner gasFIDGascell
ASP – block
Sample gas
Air cleaner
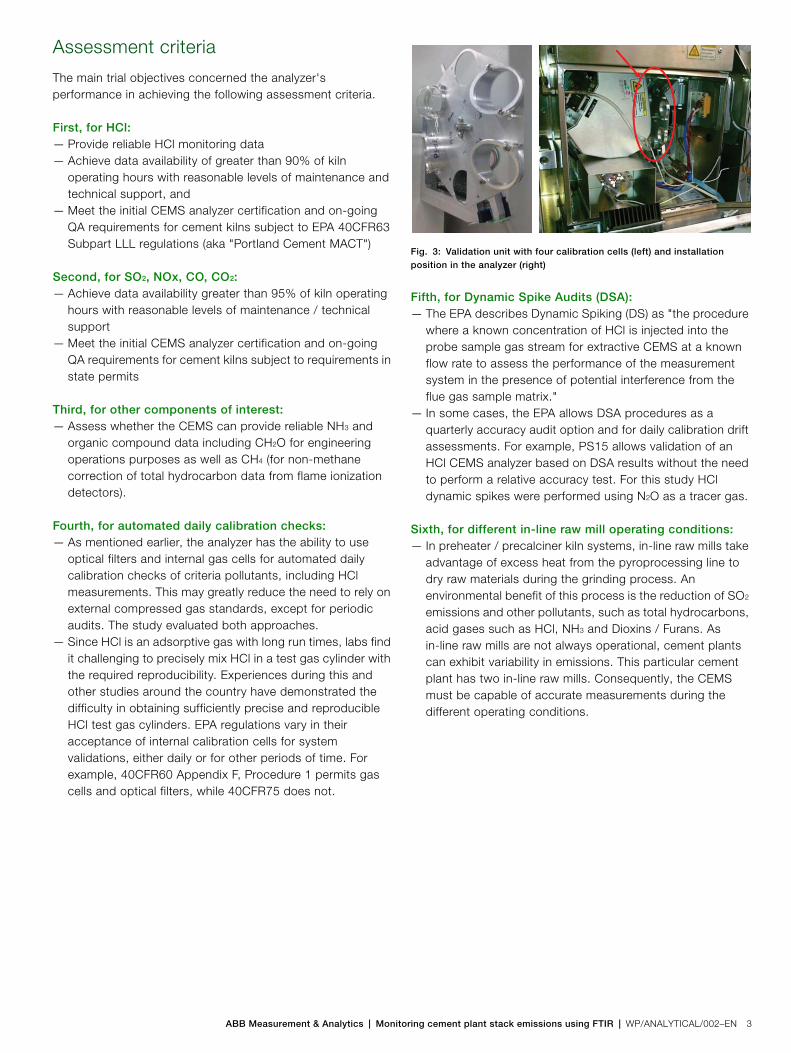
ABB Measurement & Analytics | Monitoring cement plant stack emissions using FTIR | WP/ANALYTICAL/002–EN 3
Assessment criteria
The main trial objectives concerned the analyzer's performance in achieving the following assessment criteria.
First, for HCl:— Provide reliable HCl monitoring data— Achieve data availability of greater than 90% of kiln
operating hours with reasonable levels of maintenance and technical support, and
— Meet the initial CEMS analyzer certification and on-going QA requirements for cement kilns subject to EPA 40CFR63 Subpart LLL regulations (aka "Portland Cement MACT")
Second, for SO2, NOx, CO, CO2:— Achieve data availability greater than 95% of kiln operating
hours with reasonable levels of maintenance / technical support
— Meet the initial CEMS analyzer certification and on-going QA requirements for cement kilns subject to requirements in state permits
Third, for other components of interest:— Assess whether the CEMS can provide reliable NH3 and
organic compound data including CH2O for engineering operations purposes as well as CH4 (for non-methane correction of total hydrocarbon data from flame ionization detectors).
Fourth, for automated daily calibration checks:— As mentioned earlier, the analyzer has the ability to use
optical filters and internal gas cells for automated daily calibration checks of criteria pollutants, including HCl measurements. This may greatly reduce the need to rely on external compressed gas standards, except for periodic audits. The study evaluated both approaches.
— Since HCl is an adsorptive gas with long run times, labs find it challenging to precisely mix HCl in a test gas cylinder with the required reproducibility. Experiences during this and other studies around the country have demonstrated the difficulty in obtaining sufficiently precise and reproducible HCl test gas cylinders. EPA regulations vary in their acceptance of internal calibration cells for system validations, either daily or for other periods of time. For example, 40CFR60 Appendix F, Procedure 1 permits gas cells and optical filters, while 40CFR75 does not.
Fifth, for Dynamic Spike Audits (DSA):— The EPA describes Dynamic Spiking (DS) as "the procedure
where a known concentration of HCl is injected into the probe sample gas stream for extractive CEMS at a known flow rate to assess the performance of the measurement system in the presence of potential interference from the flue gas sample matrix."
— In some cases, the EPA allows DSA procedures as a quarterly accuracy audit option and for daily calibration drift assessments. For example, PS15 allows validation of an HCl CEMS analyzer based on DSA results without the need to perform a relative accuracy test. For this study HCl dynamic spikes were performed using N2O as a tracer gas.
Sixth, for different in-line raw mill operating conditions:— In preheater / precalciner kiln systems, in-line raw mills take
advantage of excess heat from the pyroprocessing line to dry raw materials during the grinding process. An environmental benefit of this process is the reduction of SO2 emissions and other pollutants, such as total hydrocarbons, acid gases such as HCl, NH3 and Dioxins / Furans. As in-line raw mills are not always operational, cement plants can exhibit variability in emissions. This particular cement plant has two in-line raw mills. Consequently, the CEMS must be capable of accurate measurements during the different operating conditions.
Fig. 3: Validation unit with four calibration cells (left) and installation position in the analyzer (right)

4 WP/ANALYTICAL/002–EN | ABB Measurement & Analytics | Monitoring cement plant stack emissions using FTIR
Results with in-line raw mills in operation
The ABB ACF5000 FTIR CEMS provided accurate measurements as compared to a carefully operated reference FTIR measurement system for all parameters present at measurable levels – see Table 1 for results. Additionally, the CEMS analyzer comfortably met the pertinent EPA relative accuracy requirements, including:— PS18 relative accuracy HCl concentration (ppmw) and / or
HCl concentration corrected to 7% O2, dry basis(Note. Compliance with PS15 demonstrated through dynamic spiking as an acceptable alternative to relative accuracy assessment)
— PS2 for SO2 and NO / NOx in units of concentration— PS3 for O2 and CO2 in units of concentration— PS4 for CO in units of concentration
The ABB ACF5000 FTIR CEMS provided accurate measurements of water vapor (H2O), methane (CH4), formaldehyde (CH2O), and ammonia (NH3) as compared to the reference FTIR measurement system. Actually it surpassed the relative accuracy requirements included in the evaluation criteria for these non-regulatory parameters.
The accuracy of these measurements are sufficient for their use at cement kiln systems in:— conversion of emissions to a dry basis— use in the management of NH3 injections and / or
condensable particulate and visible plume issues, and— use in the management or determination of organic
hazardous air pollutant emissions, including the exclusion of the methane contribution from total hydrocarbon measurements
Results for different operating conditions
Limited comparative testing during mill off operation reveals some differences in results between the ACF5000 FTIR CEMS and the reference FTIR measurement system, although all were still within EPA performance requirements. The most significant difference occurred for the SO2 concentration measurements. In that case the ABB FTIR CEMS values were 13 % greater than the reference measurements. While the exact cause is still unknown, extensive review of data from both FTIR systems data concluded that the discrepancy was not due to spectral interferences.
Comparative test results during the transition from two mills off to one mill on revealed increasing discrepancies between the two analyzers for the reactive condensable compounds SO2, HCl, and NH3. These differences most likely originate from the different response times of the two measurement systems, caused by different sample flow rates. This result emphasizes the importance of testing during stable effluent conditions.
During mill-off operation, HCl and zero gas calibration injections into the sample probe of the ABB CEMS (after sampling for many hours at the elevated HCl and NH3 concentrations) revealed residual NH3 and apparent higher HCl concentrations in the measurements. These effects are probably caused by disassociation of ammonium chloride salts that accumulated on the probe filter. As a fix, it is recommended that the sampling system be purged with clean, dry air and / or that active adsorption sites be saturated with high level HCl.
Mean concentration (ppm / vol %) Relative accuracy
(% of mean reference value)
Relative accuracy
(% of emission standard or ppm / vol %)
Parameter Reference FTIR ABB CEMS Difference Result Requirement Result Requirement
HCl (ppmw) 0.44 0.45 0.01 12.1 % 20 % 2.0 % 15 %
HCl (ppm @ 7 % O2 dry) 0.54 0.56 0.02 11.9 % 20 % 2.2 % 15 %
SO2 (ppmw) 13.85 13.58 –0.26 2.8 % 20 % 0.4 % 10 %
CO (ppmw) 151.94 149.31 –2.63 3.6 % 10 % 0.5 % 5 %
NO (ppmw) 163.67 171.63 7.96 5.3 % 20 % 3.4 % 10 %
CO2 (vol %) 20.30 20.56 0.26 1.8 % 20 % 0.36 vol % CO2 1.0 vol % CO2
NO2 (ppmw) –0.003 –0.33 –0.32 Too low None – None
O2 (vol %) 6.71 6.70 0.00 0.5 % 20 % 0.03 vol % O2 1.0 vol % O2
N2O (ppmw) 0.34 0.71 0.37 121 % None – None
H2O (vol %) 14.78 14.69 –0.09 0.8 % None 0.13 vol % H2O 3.0 vol % H2O
NH3 (ppmw) 5.76 6.92 1.16 20.9 % 20 % 1.21 ppm 2.5 ppm
CH2O (ppmw) 1.52 1.90 0.38 29.0 % 20 % 0.44 ppm 0.85 ppm
CH4 (ppmw) 3.82 4.02 0.20 6.7 % 20 % 0.26 ppm 2.5 ppm
Table 1: Relative accuracy test audit (RATA) results with in-line raw mills in operation
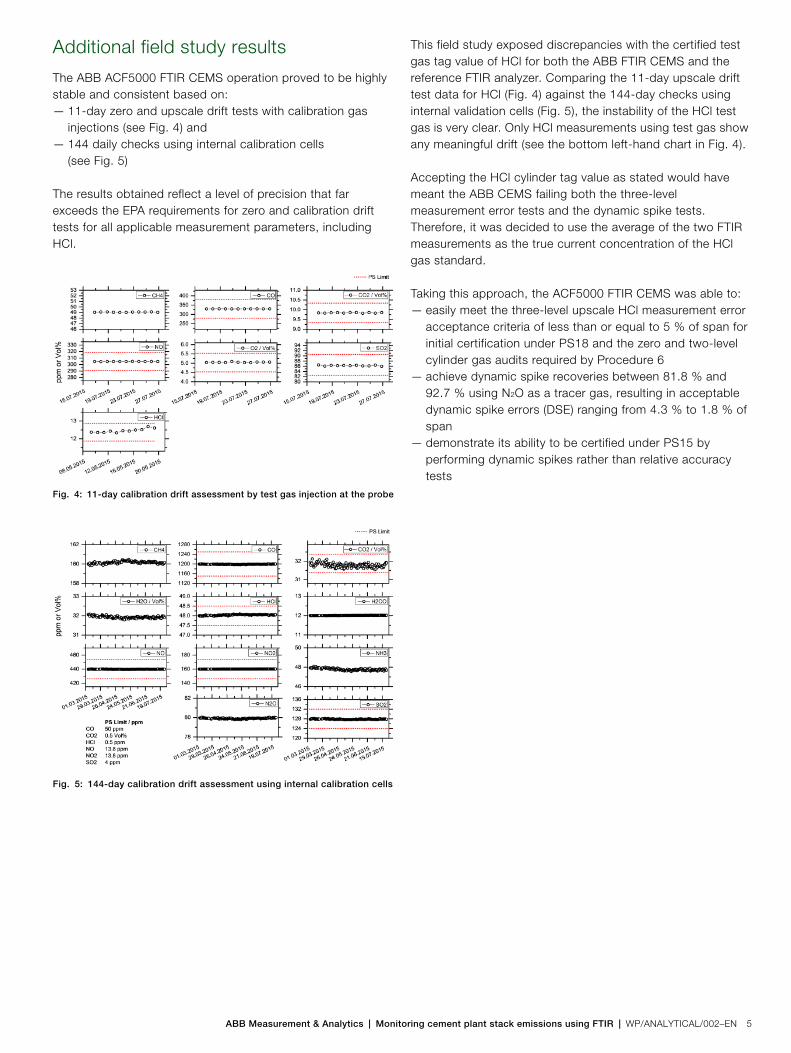
ABB Measurement & Analytics | Monitoring cement plant stack emissions using FTIR | WP/ANALYTICAL/002–EN 5
Additional field study results
The ABB ACF5000 FTIR CEMS operation proved to be highly stable and consistent based on:— 11-day zero and upscale drift tests with calibration gas
injections (see Fig. 4) and— 144 daily checks using internal calibration cells
(see Fig. 5)
The results obtained reflect a level of precision that far exceeds the EPA requirements for zero and calibration drift tests for all applicable measurement parameters, including HCl.
This field study exposed discrepancies with the certified test gas tag value of HCl for both the ABB FTIR CEMS and the reference FTIR analyzer. Comparing the 11-day upscale drift test data for HCl (Fig. 4) against the 144-day checks using internal validation cells (Fig. 5), the instability of the HCl test gas is very clear. Only HCl measurements using test gas show any meaningful drift (see the bottom left-hand chart in Fig. 4).
Accepting the HCl cylinder tag value as stated would have meant the ABB CEMS failing both the three-level measurement error tests and the dynamic spike tests. Therefore, it was decided to use the average of the two FTIR measurements as the true current concentration of the HCl gas standard.
Taking this approach, the ACF5000 FTIR CEMS was able to:— easily meet the three-level upscale HCl measurement error
acceptance criteria of less than or equal to 5 % of span for initial certification under PS18 and the zero and two-level cylinder gas audits required by Procedure 6
— achieve dynamic spike recoveries between 81.8 % and 92.7 % using N2O as a tracer gas, resulting in acceptable dynamic spike errors (DSE) ranging from 4.3 % to 1.8 % of span
— demonstrate its ability to be certified under PS15 by performing dynamic spikes rather than relative accuracy tests
Fig. 4: 11-day calibration drift assessment by test gas injection at the probe
Fig. 5: 144-day calibration drift assessment using internal calibration cells

6 WP/ANALYTICAL/002–EN | ABB Measurement & Analytics | Monitoring cement plant stack emissions using FTIR
System response time tests
No specific system response time must be met in order to comply with PS18, although the time taken to perform daily validations using test gases can be critical to achieving acceptable system availability in accordance with other EPA or state regulations.
HCl is an adsorptive gas, which means the molecules adhere to the surface of sampling system materials. Initial response times to HCl test gases can be very slow, often taking a few hours to stabilize. However, after sampling wet stack gases for a period of time the system becomes conditioned and response times improve dramatically.
Introducing dry test gases to the system reverses that conditioning and can lead to extended response times once again. One method to counteract this is to pre-saturate the system with a higher HCl concentration before introducing the lower level span gas. The results in Fig. 7 demonstrate the effectiveness of this approach.
Procedure 6 permits Dynamic Spiking as an acceptable alternative to flowing dry test gases. The benefit of this approach is that test gases are introduced in combination with native flue gases and so the system remains conditioned. It is very important that native flue gas concentrations remain stable during these tests and, ideally, a suitable tracer gas (for example, SF6 or N2O) is incorporated to verify the dilution ratio.
Once again, it is important that this process is completed within a reasonable amount of time to ensure acceptable system availability. See Fig. 8 for the results of these tests.
Fig. 6: Response time from native HCl concentration to zero
Fig. 7: Response time from zero to HCl span gas concentration with pre-saturation step
Fig. 8: Response time from native HCl concentration to spiked HCl value
ABB Measurement & Analytics | Monitoring cement plant stack emissions using FTIR | WP/ANALYTICAL/002–EN 7
Conclusions
In summary, the ABB ACF5000 FTIR Continuous Emission Monitoring System completed its commissioning and operated for several months without any apparent problems. The analyzer itself had no equipment malfunctions or repairs throughout the entire field evaluation, therefore demonstrating data availability well above 95 % of kiln operating hours.
In addition, the system was able to:— provide very reliable HCl monitoring data and meet the
initial certification and on-going QA requirements for cement kilns subject to EPA 40CFR63 Subpart LLL regulations during all in-line raw mill operating conditions
— meet the initial certification and QA requirements for SO2, NOx, CO and CO2 and provide reliable measurements of other components of interest, including NH3, CH2O and CH4
— demonstrate a level of precision that far exceeds the EPA requirements for zero and calibration drift using both internal calibration cells and flowing test gases
— successfully respond to dynamic spikes of HCl using N2O as a tracer gas
Information extracted from "2015-CIC-1041 Field Evaluation of a Multi-Component FTIR CEMS Against PS-15, PS-18 and Procedure 6," by Stephen J. Gibbons, James W. Peeler, and Henry Vergeer, IEEE IAS/PCA Cement Conference, Dallas, TX, May 15-19, 2016

Contact us
WP
/AN
ALY
TIC
AL/
002–
EN
04.2
016
ABB Inc.Process Automation3700 W Sam Houston Parkway SouthHouston, TX 77042USATel: +1 713 587 8000
www.abb.com/analytical
NoteWe reserve the right to make technical changes or modify the contacts of this document without prior notice. With regards to purchase orders, the agreedparticulars shall prevail. ABB does not accept and responsibility whatsoever for potential errors or possible lack of information in this document.
We reserve all rights in this document and in the subject matter and illustrations contained therein. Any reproduction, disclosure to third parties or utilization of its contents – in whole or in part – is forbidden without prior written consent of ABB.
Copyright© 2016 ABBAll rights reserved