Ab6AIIG 962 A 1p,3 jW *a D @.mgXT T P ANC(O5@9* The term "Lugeon test" implies certain test details...
67
Ab6AIIG 962 A 1p,3 jW *a D @.mgXT T P ANC(O5@9 W gtofflwfflhMA
Transcript of Ab6AIIG 962 A 1p,3 jW *a D @.mgXT T P ANC(O5@9* The term "Lugeon test" implies certain test details...

Ab6AIIG 962 A 1p,3jW *a D @.mgXT T P ANC(O5@9
W gtofflwfflhMA
TECHNICAL REPORT GL-82-3
NEW PRESSURE TEST FOR DETERMININGCOEFFICIENT OF PERMEABILITY
OF ROCK MASSES
by ARobert D. Bennett, Robert F. Anderson
Geotechnical LaboratoryU. S. Army Engineer Waterways Experiment Station
P. 0. Box 631, Vicksburg, Miss. 39180
DTICJuly 1982 ELECTE IJury 1982 JUL 19 9%8
Ao rFinal Report
' Approved For Public Release; Distribution Unlimited F
-JJ
LPrepared for Office, Chief of Engineers, U. S. ArmyWashington, D. C. 20314
Under Civil Works R&D Work Unit 315618207 19 010
WAf _a "Ii
2 ~
.. ~.. ,i
~w
Department of the Army position unless so designated.by ohrauthorized dcmns
The a ns of *Isreport am nottohe used foradvwrtlsng, publeatien, or promotional purposes. JCitation' of trade nom". dAm net constitwanofficial .neteimt or oppwevl of she use of.
sck commercial prodwot.4
7' .',.' . . 1.4
UnclassifiedSECURITY CLASSIFICATION Of THIS PAGE (fe., Data Entere
REPORT DOCUMENTATION PAGE READ INSTRUCTIONSI. REP R EPRT DOUENBEFORE COMPLETING FORM-I. REPORT kiUMSER I2.GOVT ACCESSION NQ 3. RECIPIENT'S CATALOG NUMBER
Technical Report GL-82- 3 A -4//6 q ?4. TITLE (rnd Subtitle) 5. TYPE OF REPORT & PERIOD COVERED
NEW PRESSURE TEST FOR DETERMINING COEFFICIENT Final reportOF PERMEABILITY OF ROCK MASSES
S. PERFORMING ORO. REPORT NUMBER
7. AUTHOR(.) s. CONTRACT OR GRANT NUMBER(&)
Robert D. BennettRobert F. Anderson
9. PERFORMING ORGANIZATION NAME AND ADDRESS 10. PROGRAM ELEMENT. PROJECT. TASKU. S. Army Engineer Waterways Experiment Station AREA I WORK UNIT NUMBERS
Geotechnical LaboratoryP. 0. Box 631, Vicksburg, Miss. 39180 CW R&D Work Unit 31561
It. CONTROLLING OFFICE NAME AND ADDRESS 12. REPORT DATE
Office, Chief of Engineers, U. S. Army July 1982
Washington, D. C. 20314 13, NUMBER OF PAGES6114. MONITORING AGENCY NAME A AODRESS(i diflernt from Controllhi Office) 1S. SECURITY CLASS. (of thl report)
UnclassifiedIS. DECL ASSI FICATION/DOWNGRADING
SCHEDULE
16. DISTRIBUTION STATEMENT (of thie Report)
Approved for public release; distribution unlimited.
17. DISTRIBUTION STATEMENT (of the abstract entered In Block 20, It dlflerent fom Report)
IS. SUPPLEMENTARY NOTES
Available from National Technical Information Service, 5285 Port Royal Road,Springfield, Va. 22151.
19. KEY WORDS (Continue on reverse side it neceesy and identify by block number)
BoringPressureRocks--Permeability
SISYRACT' (Cfttfte ma .oerv ow N namrsaw md I~dntfy 6? block nuaba)New borehole pressure injection test equipment for determining the coeffi-
cient of permeability has been developed that has several improvements overequipment now in common use.
This report describes the major components of the new test equipment and theimprovements made to both equipment and test procedures for reliable operationand accurate test results.
Methods of reporting, analyring, and interpreting results are also presented.
OD I FORM 13 EDI-foM or INOV 66 IS OSOLtTE nlssfeSCURI CS73oFO UnclassifiedSECURITY CLAIM FtCATOX or THI PAGE (faf Dare Eftfrs

SUCUNITY CLASSIFICATION OF THIS PA@4(Mb DA =.Q
SUCURITY CLASSIFICATIOW OF THIS 0hG39Mb. DO 10e a
PREFACE
"Flow of Water Through Rock Masses," Civil Works Research and
Development (CW R&D) Work Unit 31561, was initiated by the U. S. Army
Engineer Waterways Experiment Station (WES) in FY 78 under the direction
and sponsorship of the Office, Chief of Engineers (OCE), U. S. Army.
Mr. Paul Fisher was OCE Technical Monitor.
The test equipment reported herein was developed by Mr. R. F.
Anderson and Mr. W. 0. Miller, Rock Mechanics Applications Group (RMAG),
Engineering Geology and Rock Mechanics Division (EGRMD), Geotechnical
Laboratory (GL), WES. This report was written by Messrs. R. D. Bennett
and R. F. Anderson under the direct supervision of Mr. J. S. Huie,
Chief, RMAG, and under the general supervision of Dr. D. C. Banks,
Chief, EGRMD. Mr. J. P. Sale and Mr. R. G. Ahlvin were Chief and Assis-
tant Chief, respectively, of GL during part of this study. Dr. W. F.
Marcuson III and Dr. P. F. Hadala were Chief and Assistant Chief, respec-
tively, during report preparation.
Commanders and Directors of WES during this study were COL John L.
Cannon, CE, COL Nelson P. Conover, CE, and COL Tilford C. Creel, CE.
Mr. Fred R. Brown was Technical Director.
Accession For
NTIS GRA&IDTIC TAB 0unannouncedS 0Justifieatio-
Distribution/- .. C
Availability Codes 2A Avail and/orDist I Special

CONTENTS
Page
PREFACE .............. . . . . . . 1
CONVERSION FACTORS, U. S. CUSTOMARY TO METRIC (SI) UNITSOF MEASUREMENT .. . . . . . . . . .. . * .& * . * & * o & 3
PART I: INTRODUCTION . . . . . . . . . . . . . . .. .. . .. 4
Background e.*.................*..*..& e * 4Purposen . . . . . . .. . . . * . . . . . . . . . 7
Scope . . o .• . . . * . .... .. . . . . . . 7
PART II: DESCRIPTION OF NEW PRESSURE TEST EQUIPMENT
AND METHODS ....... . . . .. . . 9
Pressure Test Equipment . ............. .. 9Pressure Test Methods ............... . 16
PART III: ANALYSIS AND INTERPRETATION OF RESULTS . . . . . . . 18
Continuum Approach . . . . . . ..... . . . . .. 18
Discontinuum Approach .................. 25Anisotropy--Directional Permeability . . . . . . . . . . 31
PART IV: SUMMARY AND CONCLUSIONS ... ............... o 33
Improvements in Test Equipment . . . . .. . . . . .. 33
Improvements in Test Methods . . . . . . . . . .... 34
Significance of Radius of Influence and Test
Section Length . . . . . . . . . . . . . . . . . 35Choice of Method of Analysis . . . .. .. .. . .. 36
Consideration of Turbulent Flow . . . . . . . . . . . .. 38
REFERENCES . . . . . . . . . . . . . . . ... . . . . . . .. 40
PLATES 1-4
APPENDIX A: PRESSURE TEST METHODS ...... .............. Al
21II
I L-. t-

CONVERSION FACTORS, U. S. CUSTOMARY TO METRIC (SI)UNITS OF MEASUREMENT
U. S. customary units of measurement used in this report can be con-
verted to metric (SI) units as follows:
Multiply By To Obtain
cubic feet 0.0283 cubic metres
degrees Fahrenheit 5/9 Celsius degrees or Kelvins*
feet 0.3048 metres
foot-pounds (force) per pound 0.305 joules per newton-(force)-degree Rankine degree Rankine
gallons (U. S. liquid) 3.785 cubic decimetres
inches 2.54 centimetres
pounds (force) per cubic foot 157.1 newtons per cubic metre
pounds (force) per square foot 47.88 pascals
pounds (force) per square inch 6894.8 pascals
* To obtain Celsius (C) temperature readings from Fahrenheit (F) read-
ings, use the following formula: C - (5/9)(F - 32). To obtain Kelvin(K) readings, use: K - (5/9)(F - 32) + 273.15.
3L'&
NEW PRESSURE TEST FOR DETERMINING COEFFICIENT
OF PERMEABILITY OF ROCK MASSES
PART I: INTRODUCTION
Background
1. Reliable determination of rock mass permeability is essential
to the design and construction of many civil engineering projects.
Assessment of groundwater movement, seepage through abutments, founda-
tion uplift pressures, and grouting requirements all depend on knowledge
of the mass permeability.
2. The primary purpose of this report is to describe a new pres-
sure injection test system and test procedures for determining the
coefficient of permeability of rock masses. The pressure injection test
has been widely used for over 50 years with little change in equipment
or methods, although several improvements in both have been suggested.
The new equipment was designed to overcome problems common to earlierequipment, such as excess head loss in the main injection line, slow
packer inflation and deflation, unreliable control and measurement of
pressure and flow, and packer leakage. Test procedures were improved to
take advantage of the new system's measuring precision and to minimize
errors or problems caused by unknowns in the test environment (e.g.,
partial saturation of the test zone).
3. A brief review of other methods used to measure coefficient of
permeability has been included to show that there are other choices
available which, under some conditions, may have advantages over pres-
sure tests.
Laboratory tests
4. Laboratory tests of intact rock or individual fissures are
convenient and relatively inexpensive compared to field tests, but the
small specimens tested make their reliability suspect because of scale
effects. For a typical natural rock joint the aperture variation may be
of the same order of magnitude as the mean aperture. The variation of
4
in
' Ih
aperture and roughness from joint to joint within the mass may often be
more than an order of magnitude, and coefficient of permeability is
dependent on fissure aperture, roughness, and other properties. There-
fore, unless a statistically significant number of tests are run on
single fissure specimens at their natural state of stress, results are
unlikely to represent field flow conditions. Pipe flow analysis assumes
roughness is small compared to pipe diameter. As stated above, rough-
ness of natural fissures in rock is often of the same order of magnitude
as the fissure aperture. Consequently, flow through fissured rock
cannot be accurately modeled as flow through pipes, although the equiva-
lent pipe analogy can be helpful in understanding the influence of
variables such as velocity and head loss.
Aquifer pumping tests
5. Pumping tests are routinely used to determine aquifer hydrau-
lic properties. Methods for performing and interpreting pumping tests
are presented in Groundwater and Wells (1966). Solutions exist for
treatment of the medium (aquifer) as a porous continuum or as a double
porosity model (Wilson and Witherspoon 1970) with intact rock of low
permeability bounded by fissures with much higher permeability. Saad
(1967) and Gringarten and Witherspoon (1972) have presented solutions
for anisotropic flow through fissured media. These solutions are appli-
cable to flow from a cavity (pressure injection tests) as well as flow
to a cavity or borehole (pumping tests). One advantage of pumping tests
is that a relatively large portion of the mass is affected and the
permeabilities determined more nearly represent the average flow charac-
teristics of the aquifer. Also, the effects of turbulent flow on the
determination of coefficient of permeability are much less critical for
pumping out tests than for pressure injection tests. Turbulence, when
it does occur, usually starts near the borehole and spreads outward in
pressure injection tests. But in pumping tests, turbulence propagates
into the cavity and is much less a problem because the area of infuence
of the test is much larger. Disadvantages include the time required to
perform tests (typically 24 hr, or much longer) and the resulting high
costs. Also, only strata below the groundwater table may be tested.
5
iw

And, except under ideal conditions, interpretations of results may be
nonunique, requiring considerable judgment and experience by the
interpreter.
Tracer tests
6. Two types of tracer tests have been used to estimate perme-
ability. In the dilution rate method, the tracer solution is injected
into a borehole and the decrease in concentration is monitored. This
method requires only one borehole and may be used to determine average
permeability for the entire depth of the hole. Zones of varying perme-
ability may be identified by injecting the solution into packed off
sections, using inflatable packers. Directional differences in hori-
zontal permeability cannot be determined with this method. The travel
time method requires two or more boreholes. Tracer fluid is injected
into one borehole and probes are inserted into the other holes to deter-
mine when the solution arrives. Zones of varying permeability with
depth may be determined if packers are used, or average permeability maybe estimated. If several holes are radially located around the injec-
tion borehole, the degree of anisotropy may be assessed by measuring the
different travel times. Radioisotopes, salt solutions, or fluorescent
dyes may be used as the tracer solution. Lewis, Kritz, and Burgy (1966)
and Maini (1971) discuss methods for determining permeability from
tracer tests. Both types of tests offer advantages. Low injection
pressures minimize the possibility of tissure opening which may occur
during conventional pressure tests. Tracer tests can be performed more
quickly than pumping tests. However, like pumping tests, tracer tests
can only be used in strata below the water table. Thompson (1980)
discussed some applications of tracer tests and supplied guidance for
selection of tracer fluids.
Pressure injection tests
7. Sometimes called packer tests or Lugeon* tests, this test may
be the only practical method for assessing permeability of strata above
* The term "Lugeon test" implies certain test details which are more
restrictive than general pressure injection tests, such as specifiedmaximum flow rate, test section length, and borehole diameter (DeMello and da Cruz 1960).
6
the groundwater table. Air or water may be used to pressurize the
borehole test section, but water is normally used if available because
of the problems involved in interpretation of air-pressure injection
tests. Tests may be performed sequentially as the borehole is made,
using a single-packer setup or a double-packer setup may be used in
completed boreholes to determine the permeability profile. Average
permeability may be obtained for a particular section or for the entire
borehole length. Maini (1971) described a four-packer setup designed to
minimize nonradial flow (end effects) from the test section. Pressure
tests are popular because they may be performed more quickly than pumping
tests and results may be used with rule-of-thumb criteria to estimate
grouting requirements (Lugeon 1933 and De Mello and da Cruz 1960).
Applications and limitations of pressure tests are discussed in subse-
quent sections of this report.
Purpose
8. This study was initiated because the Office, Chief of Engi-
neers (OCE), recognized the need to improve Corps' capabilities for
reliable measurement of coefficient of permeability, evaluation of
seepage through rock abutments, and uplift under foundations of civil
works structures founded on rock.
9. The equipment and test procedures described in this report
incorporate improvements recommended in a previous OCE-sponsored study
of rock mass permeability (Zeigler 1976) as well as improvements subse-
quently identified during this study.
Scope
10. A brief review of methods used to estimate coefficient of
permeability of rock masses, with their relative advantages and disad-
vantages, has been presented in Part I. New pressure test equipment
developed at the U. S. Army Engineer Waterways Experiment Station (WES)
is described in Part II. (Test methods and a suggested format for
7
reporting results are presented in Appendix A.) In Part III, methods of
analyzing and interpreting pressure test results are discussed, including
field conditions for which each method is applicable. Study results are
summarized and conclusions are presented in Part IV.
i
8
PART II: DESCRIPTION OF NEW PRESSURE
TEST EQUIPMENT AND METHODS
Pressure Test Equipment
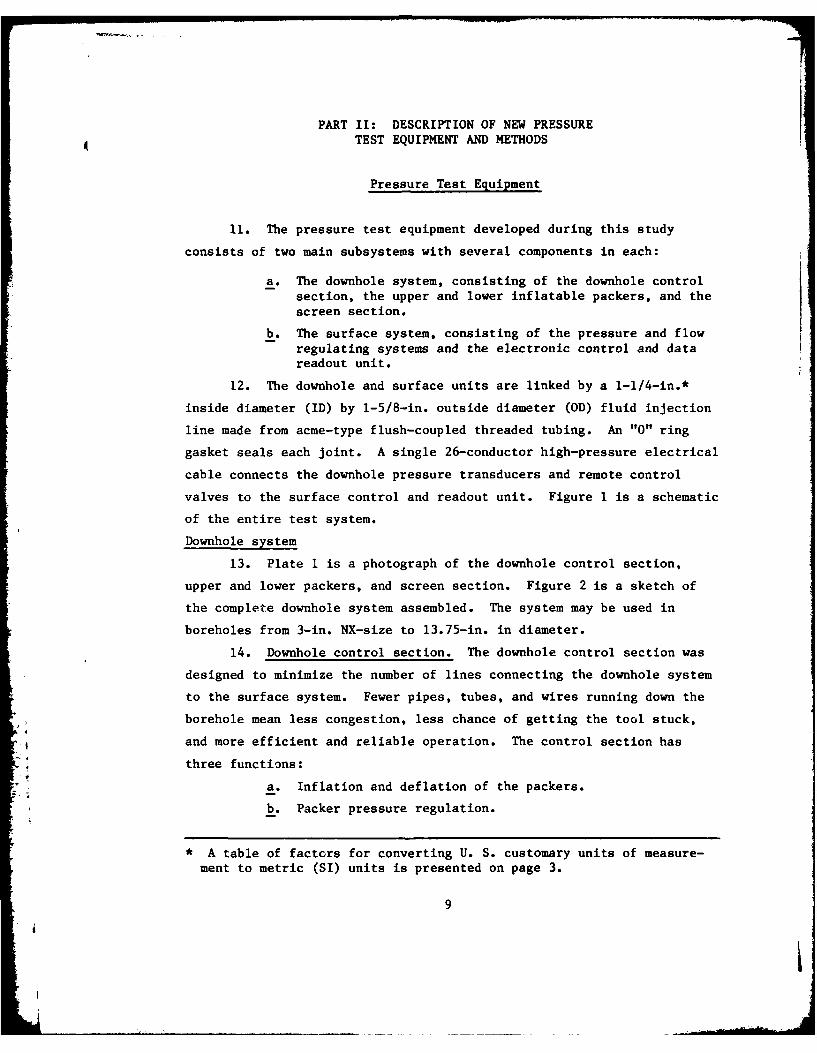
11. The pressure test equipment developed during this study
consists of two main subsystems with several components in each:
a. The downhole system, consisting of the downhole control
section, the upper and lower inflatable packers, and thescreen section.
b. The surface system, consisting of the pressure and flowregulating systems and the electronic control and datareadout unit.
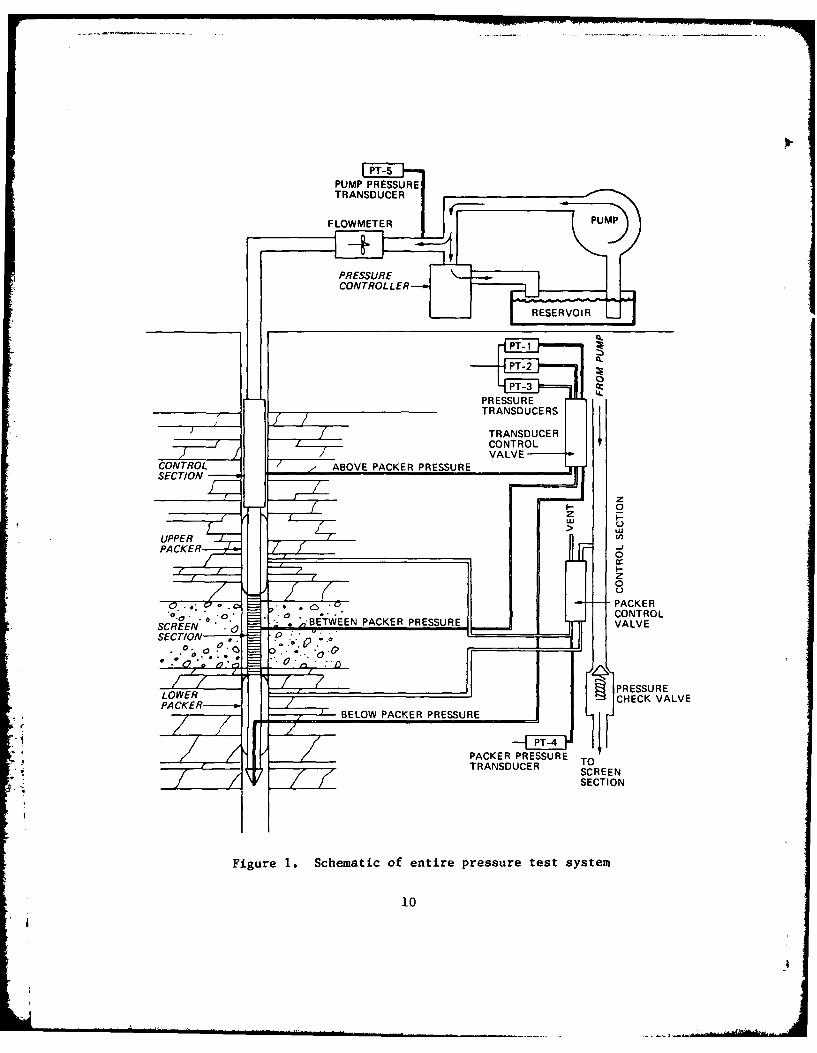
12. The downhole and surface units are linked by a 1-1/4-in.*
inside diameter (ID) by 1-5/8-in. outside diameter (OD) fluid injection
line made from acme-type flush-coupled threaded tubing. An "0" ring
gasket seals each joint. A single 26-conductor high-pressure electrical
cable connects the downhole pressure transducers and remote control
valves to the surface control and readout unit. Figure 1 is a schematic
of the entire test system.
Downhole system
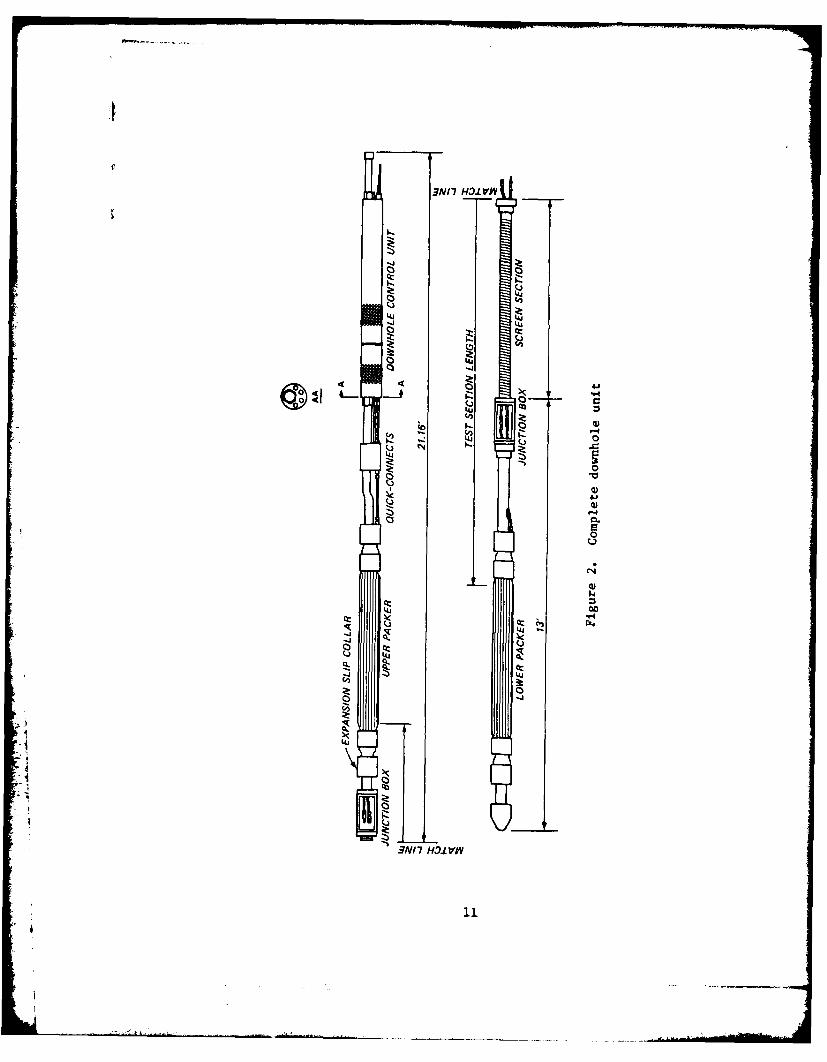
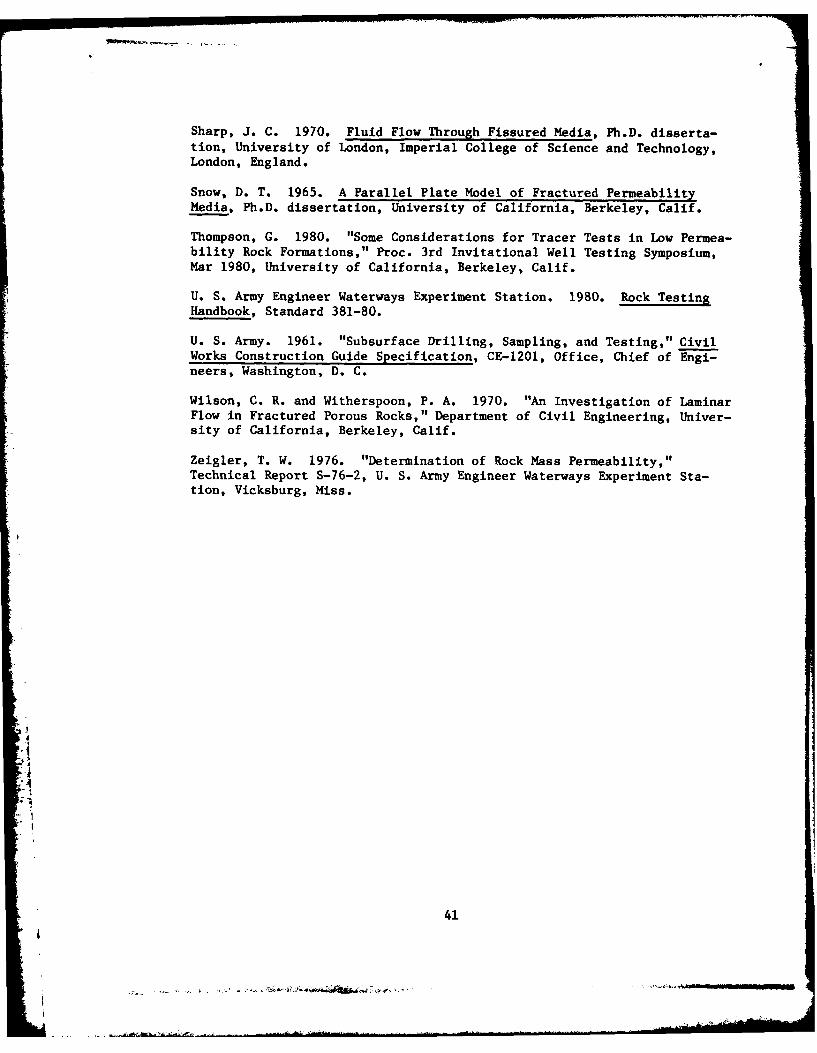
13. Plate 1 is a photograph of the downhole control section,
upper and lower packers, and screen section. Figure 2 is a sketch of
the complete downhole system assembled. The system may be used in
boreholes from 3-in. NX-size to 13.75-in. in diameter.
14. Downhole control section. The downhole control section was
designed to minimize the number of lines connecting the downhole system
to the surface system. Fewer pipes, tubes, and wires running down the
borehole mean less congestion, less chance of getting the tool stuck,
and more efficient and reliable operation. The control section has
three functions:
a. Inflation and deflation of the packers.
b. Packer pressure regulation.
* A table of factors for converting U. S. customary units of measure-ment to metric (SI) units is presented on page 3.
9
PRESSURECONTROLLER-
7~~LEiEROIR
a
PT-3
1TRANSD PACKECCONTROL
CHEKLVLVCONTOL BOEO PACKER PRESSURE
100
3N/7 HO.LVP
-AJ
to
LUU00
CC,
LL Uc
-Lu
Z a4-
3NI 7 OI VP
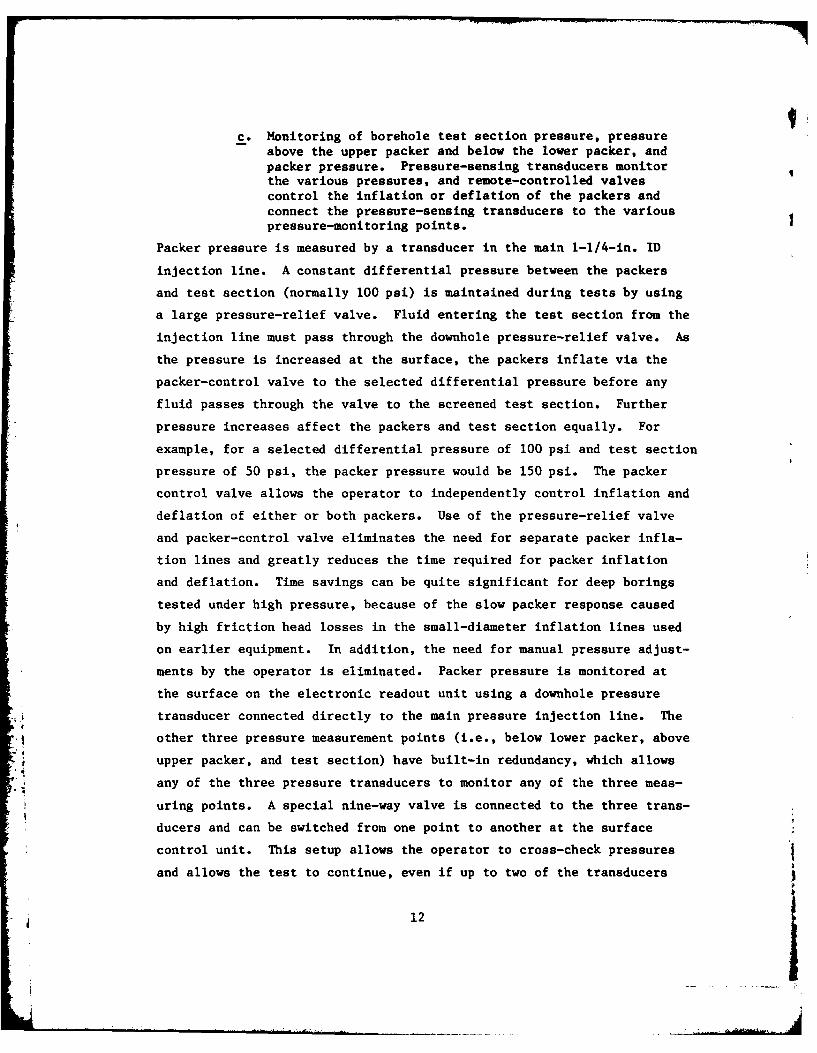
c. Monitoring of borehole test section pressure, pressureabove the upper packer and below the lower packer, andpacker pressure. Pressure-sensing transducers monitorthe various pressures, and remote-controlled valves
control the inflation or deflation of the packers andconnect the pressure-sensing transducers to the various
pressure-monitoring points.
Packer pressure is measured by a transducer in the main 1-1/4-in. ID
injection line. A constant differential pressure between the packers
and test section (normally 100 psi) is maintained during tests by using
a large pressure-relief valve. Fluid entering the test section from the
injection line must pass through the downhole pressure-relief valve. As
the pressure is increased at the surface, the packers inflate via the
packer-control valve to the selected differential pressure before any
fluid passes through the valve to the screened test section. Further
pressure increases affect the packers and test section equally. For
example, for a selected differential pressure of 100 psi and test section
pressure of 50 psi, the packer pressure would be 150 psi. The packer
control valve allows the operator to independently control inflation and
deflation of either or both packers. Use of the pressure-relief valve
and packer-control valve eliminates the need for separate packer infla-
tion lines and greatly reduces the time required for packer inflation
and deflation. Time savings can be quite significant for deep borings
tested under high pressure, because of the slow packer response caused
by high friction head losses in the small-diameter inflation lines used
on earlier equipment. In addition, the need for manual pressure adjust-
ments by the operator is eliminated. Packer pressure is monitored at
the surface on the electronic readout unit using a downhole pressure
transducer connected directly to the main pressure injection line. The
other three pressure measurement points (i.e., below lower packer, above
upper packer, and test section) have built-in redundancy, which allows
any of the three pressure transducers to monitor any of the three meas-
uring points. A special nine-way valve is connected to the three trans-
ducers and can be switched from one point to another at the surface
control unit. This setup allows the operator to cross-check pressures
and allows the test to continue, even if up to two of the transducers
12
fail. The single 26-conductor electrical cable links the nine-way valve
and three transducers to the surface control unit.
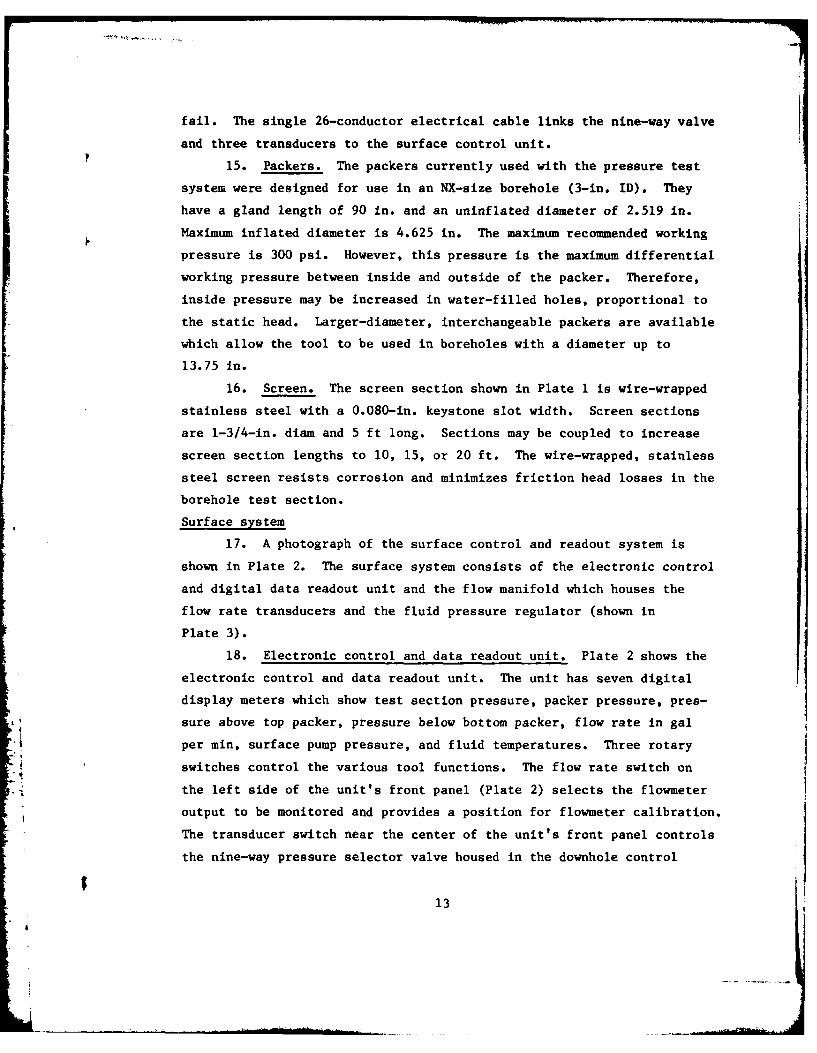
15. Packers. The packers currently used with the pressure test
system were designed for use in an NX-size borehole (3-in. ID). They
have a gland length of 90 in. and an uninflated diameter of 2.519 in.
Maximum inflated diameter is 4.625 in. The maximum recommended working
pressure is 300 psi. However, this pressure is the maximum differential
working pressure between inside and outside of the packer. Therefore,
inside pressure may be increased in water-filled holes, proportional to
the static head. Larger-diameter, interchangeable packers are available
which allow the tool to be used in boreholes with a diameter up to
13.75 in.
16. Screen. The screen section shown in Plate 1 is wire-wrapped
stainless steel with a 0.080-in. keystone slot width. Screen sections
are 1-3/4-in. diam and 5 ft long. Sections may be coupled to increase
screen section lengths to 10, 15, or 20 ft. The wire-wrapped, stainless
steel screen resists corrosion and minimizes friction head losses in the
borehole test section.
Surface system
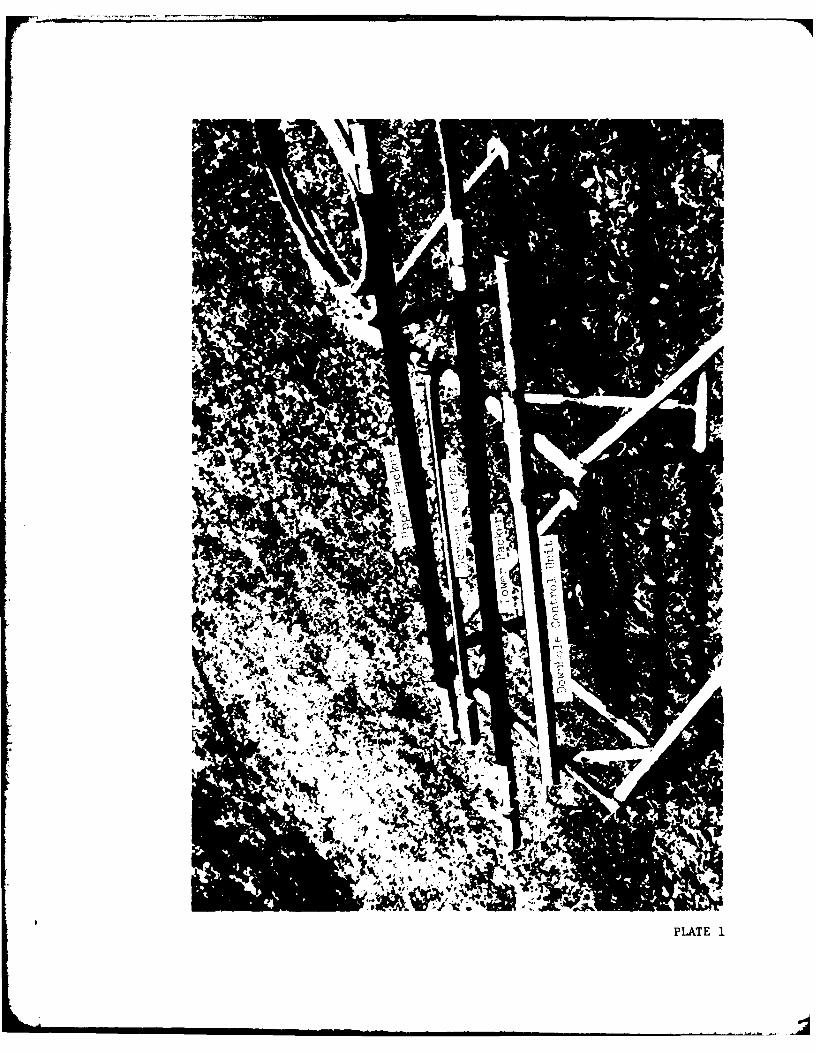
17. A photograph of the surface control and readout system is
shown in Plate 2. The surface system consists of the electronic control
and digital data readout unit and the flow manifold which houses the
flow rate transducers and the fluid pressure regulator (shown in
Plate 3).
18. Electronic control and data readout unit. Plate 2 shows the
electronic control and data readout unit. The unit has seven digital
display meters which show test section pressure, packer pressure, pres-
sure above top packer, pressure below bottom packer, flow rate in gal
per min, surface pump pressure, and fluid temperatures. Three rotary
switches control the various tool functions. The flow rate switch on
the left side of the unit's front panel (Plate 2) selects the flowmeter
output to be monitored and provides a position for flowmeter calibration.
The transducer switch near the center of the unit's front panel controls
the nine-way pressure selector valve housed in the downhole control
13
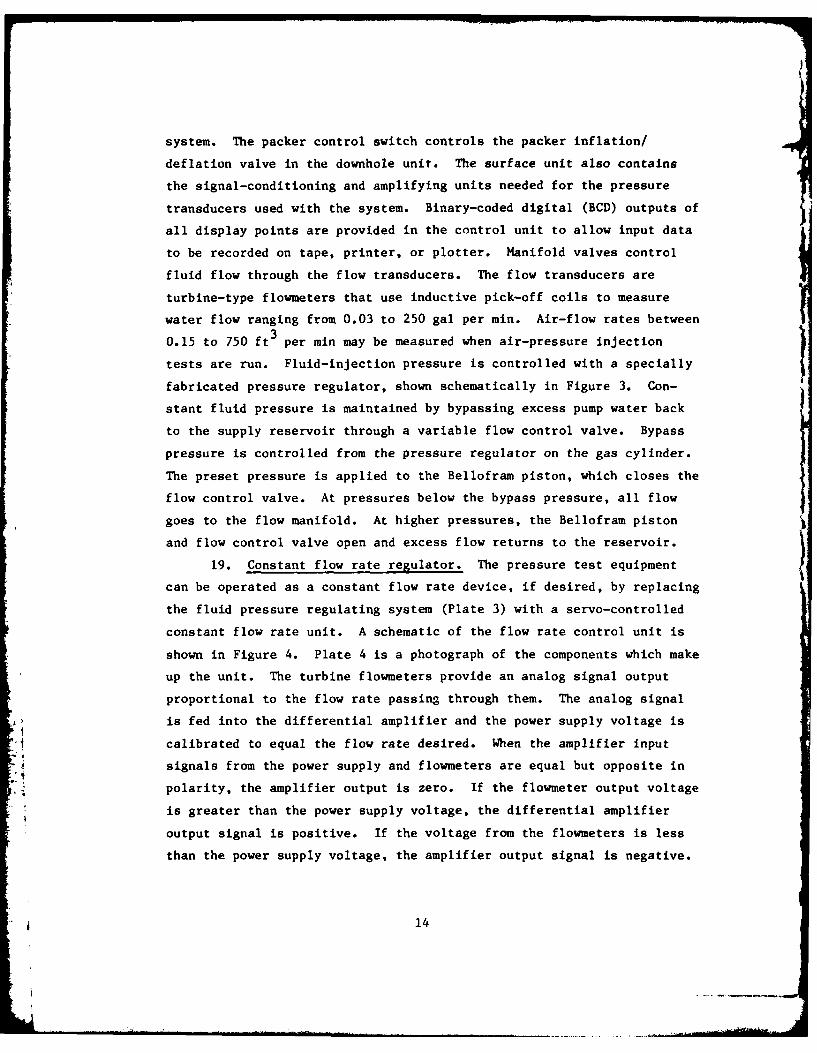
system. The packer control switch controls the packer inflation/
deflation valve in the downhole unit. The surface unit also contains
the signal-conditioning and amplifying units needed for the pressure
transducers used with the system. Binary-coded digital (BCD) outputs of
all display points are provided in the control unit to allow input data
to be recorded on tape, printer, or plotter. Manifold valves control
fluid flow through the flow transducers. The flow transducers are
turbine-type flowmeters that use inductive pick-off coils to measure
water flow ranging from 0.03 to 250 gal per min. Air-flow rates between
0.15 to 750 ft3 per min may be measured when air-pressure injection
tests are run. Fluid-injection pressure is controlled with a specially
fabricated pressure regulator, shown schematically in Figure 3. Con-
stant fluid pressure is maintained by bypassing excess pump water back
to the supply reservoir through a variable flow control valve. Bypass
pressure is controlled from the pressure regulator on the gas cylinder.
The preset pressure is applied to the Bellofram piston, which closes the
flow control valve. At pressures below the bypass pressure, all flow
goes to the flow manifold. At higher pressures, the Bellofram piston
and flow control valve open and excess flow returns to the reservoir.
19. Constant flow rate regulator. The pressure test equipment
can be operated as a constant flow rate device, if desired, by replacing
the fluid pressure regulating system (Plate 3) with a servo-controlled
constant flow rate unit. A schematic of the flow rate control unit is
shown in Figure 4. Plate 4 is a photograph of the components which make
up the unit. The turbine flowmeters provide an analog signal output
proportional to the flow rate passing through them. The analog signal
is fed into the differential amplifier and the power supply voltage is
calibrated to equal the flow rate desired. When the amplifier input
signals from the power supply and flowmeters are equal but opposite in
polarity, the amplifier output is zero. If the flowmeter output voltage
is greater than the power supply voltage, the differential amplifier
output signal is positive. If the voltage from the flowmeters is less
than the power supply voltage, the amplifier output signal is negative.
14

TO FLOWMANIFOLD
FLOWMATER
RSREERSIL
FLOWORATEER
FGLO
--------------------------------E
PIKOFgr 4.SceVtiEoRfowcotrlLni
MOO

The differential amplifier signal drives a motorized valve on the up-
stream side of the flowmeters. A positive amplifier signal causes the
valve to close until the flowmeter input voltage equals the power supply
input voltage, at which point the valve motor stops. Likewise, a nega-
tive amplifier signal causes the valve to open until equilibrium is
reached.
Miscellaneous equipment
20. In addition to the major equipment components described in
the preceding paragraphs, several miscellaneous tools and accessories
are required to perform borehole pressure tests:
a. Reservoir for water supply or high capacity air compres-sor for air-pressure tests.
b. Pump capable of providing the required volume of flow andpressure.
c. Hoist. A drill rig or portable tripod and hoist can beused for lowering and raising downhole unit.
d. Stopwatch (for falling head tests).
e. Wire ties for attaching electrical conductor cable toinjection line.
f. Electrical test equipment, such as a multimeter.
Tank of pressurized air or nitrogen.
Pressure Test Methods
21. The pressure injection test consists of pumping water or air
into an isolated section of borehole. The injection pressure is held
constant and the flow rate is monitored until a constant limiting flow
rate is reached, at which time steady-state flow is assumed. Normally,
water is used if available because of the uncertainty involved in corre-
lating results of compressible fluid (air) flow tests with incompress-
ible fluid (water) flow parameters. (Water is slightly compressible,
but the volume change is usually neglected in practice except in anal-
ysis of deep aquifers.)
22. There is no standard test method for performing pressure
tests, but suggested methods are described in Civil Works Construction
16iI

Guide Specification, CE-1201 (U. S. Army, Office, Chief of Engineers
1961), in the Rock Testing Handbook, (U. S. Army Engineer Waterways
Experiment Station 1980 (Standard 381-80)), and in "Determination of
Rock Mass Permeability" (Zeigler 1976). Procedures for constant and
falling head tests, as well as three-cell injection tests, are described
in "Suggested Methods for Determining Hydraulic Parameters and Charac-
teristics of Rock Masses," Category II, Part 6, prepared by members of
the International Society of Rock Mechanics Commission on Standardiza-
tion of Laboratory and Field Tests (Louis 1977).
23. The methods described in Appendix A were adopted partly from
the suggestions and recommendations contained in the above references
with modifications as required for use with the specific test equipment
developed during this study. Detailed instructions are given for carry-
ing out single- or double-packer pressure tests using water or air
injected under constant or falling head conditions.
17
Fr
PART III: ANALYSIS AND INTERPRETATION OF RESULTS
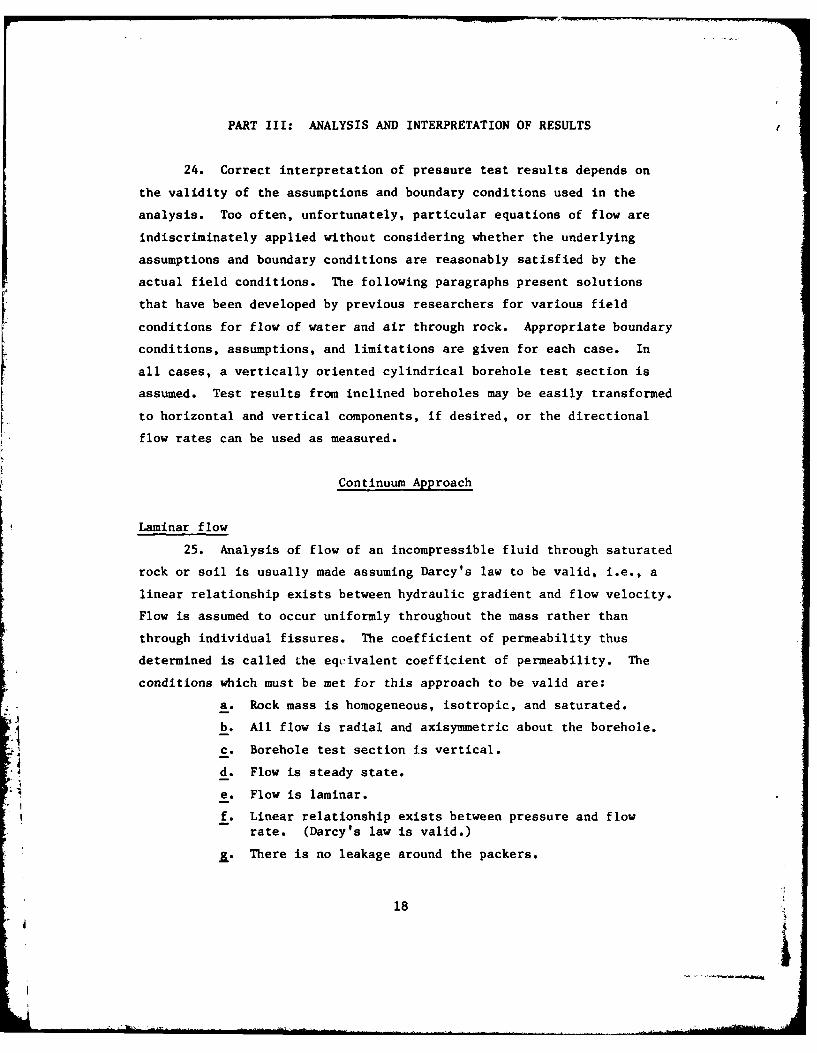
24. Correct interpretation of pressure test results depends on
the validity of the assumptions and boundary conditions used in the
analysis. Too often, unfortunately, particular equations of flow are
indiscriminately applied without considering whether the underlying
assumptions and boundary conditions are reasonably satisfied by the
actual field conditions. The following paragraphs present solutions
that have been developed by previous researchers for various field
conditions for flow of water and air through rock. Appropriate boundary
conditions, assumptions, and limitations are given for each case. In
all cases, a vertically oriented cylindrical borehole test section is
assumed. Test results from inclined boreholes may be easily transformed
to horizontal and vertical components, if desired, or the directional
flow rates can be used as measured.
Continuum Approach
Laminar flow
25. Analysis of flow of an incompressible fluid through saturated
rock or soil is usually made assuming Darcy's law to be valid, i.e., a
linear relationship exists between hydraulic gradient and flow velocity.
Flow is assumed to occur uniformly throughout the mass rather than
through individual fissures. The coefficient of permeability thus
determined is called the equivalent coefficient of permeability. The
conditions which must be met for this approach to be valid are:
a. Rock mass is homogeneous, isotropic, and saturated.
b. All flow is radial and axisymmetric about the borehole.
c. Borehole test section is vertical.
d. Flow is steady state.
e. Flow is laminar.
f. Linear relationship exists between pressure and flow
rate. (Darcy's law is valid.)
j. There is no leakage around the packers.
18
rv

h. Inertia terms are negligible, i.e., the change in pres-sure caused by the acceleration of flow into the mass isnegligible. The importance of inertia terms can bechecked by plotting test results as H/Q versus Q . Thegeneral relationship of injection pressure head, H , andflow rate, Q , may be expressed as:
Ho - AQ + BQ2
Obviously, B must be zero if a linear (Darcy) relation-ship holds. So, if the above equation is rearranged as:
H0 /Q - A + BQ
and plotted as H /Q versus Q , the H/Q interceptwill be at A , where A represents head loss due tofriction. If the resulting plot has a slope of zero(horizontal line), then the constant B = 0 and the iner-tia effects are negligible. Indeed, turbulence, thepossibility of fissure openings, or any other cause ofnonlinearity such as packer leakage may be discounted ifthe slope is zero. If the slope is nonzero, the nonline-arity may be considered using the Missbach approachpresented later, if the nonlinearity is due to turbulence.Obviously, undetected packer leakage and opening offissures will result in erroneous results, regardless ofthe analytical method used.
Constant head tests
26. When conditions a through h are satisfied, the equivalent
coefficient of permeability may be calculated from constant pressure
test results using the equation below, derived by Hvorslev (1951):
K Q ine 21TLH r
0 0
where K = equivalent coefficient of permeability (LT-Ie 3-1Q - volume flow rate at equilibrium (L T- )
r - borehole radius (L)0
R - radius of influence of the pressure test, (L) (distancefrom borehole at which excess pressure is zero).
P-Pt 0
H excess pressure head at center of test section -0 YwL - length of test section, (L)
(Consistent units should be used for all variables.)
19
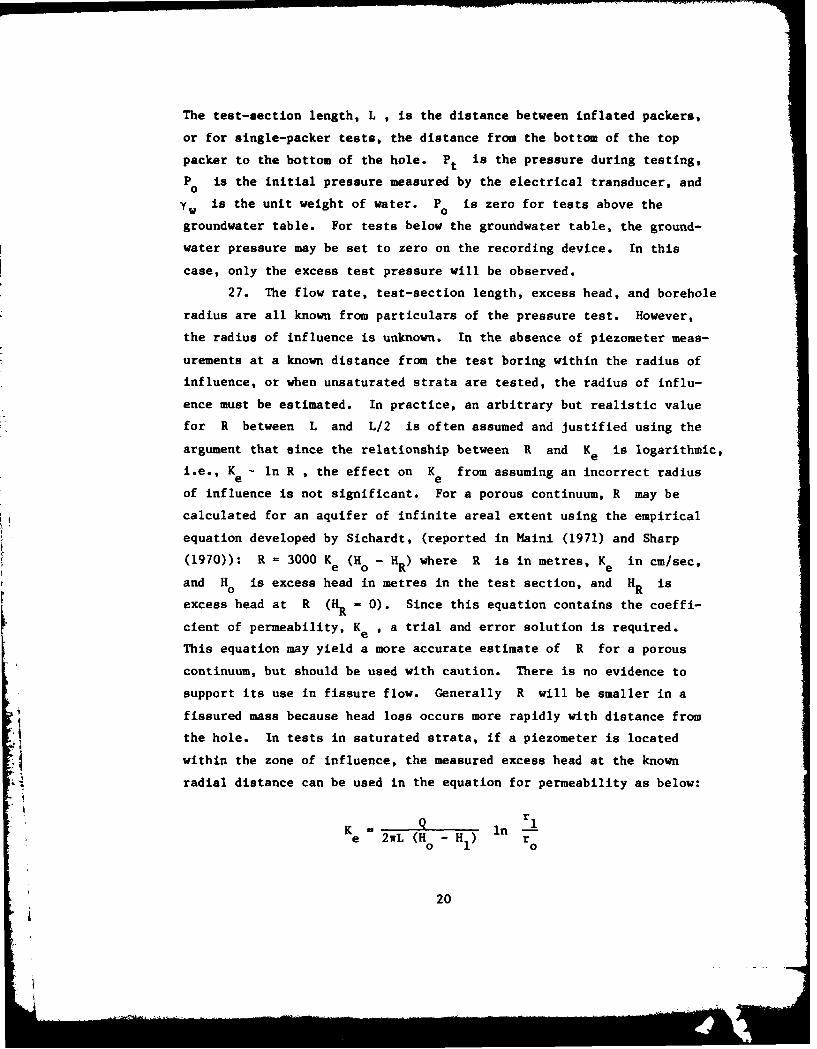
The test-section length, L , is the distance between inflated packers,
or for single-packer tests, the distance from the bottom of the top
packer to the bottom of the hole. Pt is the pressure during testing,
P is the initial pressure measured by the electrical transducer, and
Yw is the unit weight of water. P0 is zero for tests above the
groundwater table. For tests below the groundwater table, the ground-
water pressure may be set to zero on the recording device. In this
case, only the excess test pressure will be observed.
27. The flow rate, test-section length, excess head, and borehole
radius are all known from particulars of the pressure test. However,
the radius of influence is unknown. In the absence of piezometer meas-
urements at a known distance from the test boring within the radius of
influence, or when unsaturated strata are tested, the radius of influ-
ence must be estimated. In practice, an arbitrary but realistic value
for R between L and L/2 is often assumed and justified using the
argument that since the relationship between R and Ke is logarithmic,
i.e., Ke - ln R , the effect on Ke from assuming an incorrect radius
of influence is not significant. For a porous continuum, R may be
calculated for an aquifer of infinite areal extent using the empirical
equation developed by Sichardt, (reported in Maini (1971) and Sharp
(1970)): R = 3000 Ke (H° - HR) where R is in metres, Ke in cm/sec,
and H is excess head in metres in the test section, and HR is
excess head at R (HR - 0). Since this equation contains the coeffi-
cient of permeability, Ke , a trial and error solution is required.
This equation may yield a more accurate estimate of R for a porous
continuum, but should be used with caution. There is no evidence to
support its use in fissure flow. Generally R will be smaller in a
fissured mass because head loss occurs more rapidly with distance from
the hole. In tests in saturated strata, if a piezometer is located
within the zone of influence, the measured excess head at the known
radial distance can be used in the equation for permeability as below:
r1
K - ln 1-e 2L (H - H1) r
20
where r- M distance to piezometer
H1 . excess head at piezometer
Note that the excess head must be determined by packing off or isolating
the section of piezometer which corresponds to the same elevation as the
test section. All other variables are as defined previously. The above
expression yields the average permeability in a straight line from the
borehole test section to the isolated section of the piezometer. Aniso-
tropy in the horizontal plane may be investigated by monitoring piezom-
eters at different orientations from the test hole and calculating the
corresponding permeability coefficients. From these data the magnitudes
and directions of principal coefficients of permeability in the horizon-
tal plane may be determined.
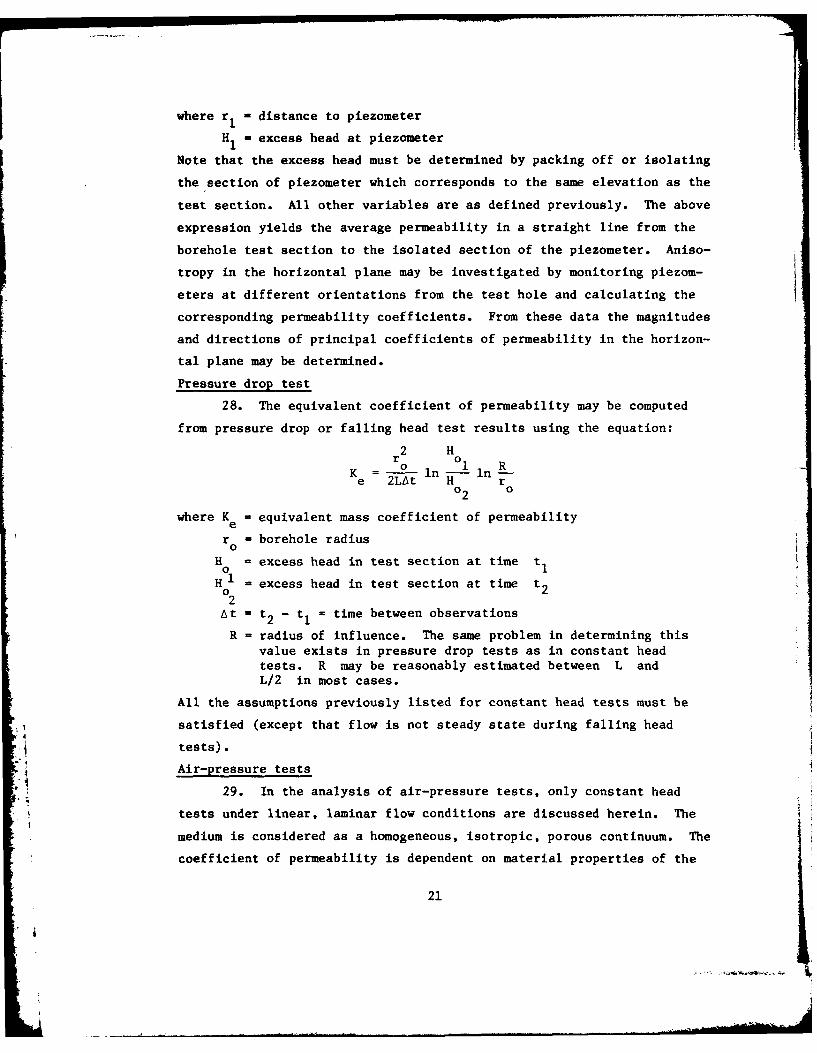
Pressure drop test
28. The equivalent coefficient of permeability may be computed
from pressure drop or falling head test results using the equation:
2 Hr o
K = ln -lne 2LA-t H r02 0
where Ke - equivalent mass coefficient of permeability
r - borehole radius
H = excess head in test section at time t01H 1 excess head in test section at time t22
At = t2 - tI = time between observations
R - radius of influence. The same problem in determining thisvalue exists in pressure drop tests as in constant headtests. R may be reasonably estimated between L andL/2 in most cases.
All the assumptions previously listed for constant head tests must be
satisfied (except that flow is not steady state during falling head
tests).
Air-pressure tests
29. In the analysis of air-pressure tests, only constant head
tests under linear, laminar flow conditions are discussed herein. The
medium is considered as a homogeneous, isotropic, porous continuum. The
coefficient of permeability is dependent on material properties of the
21
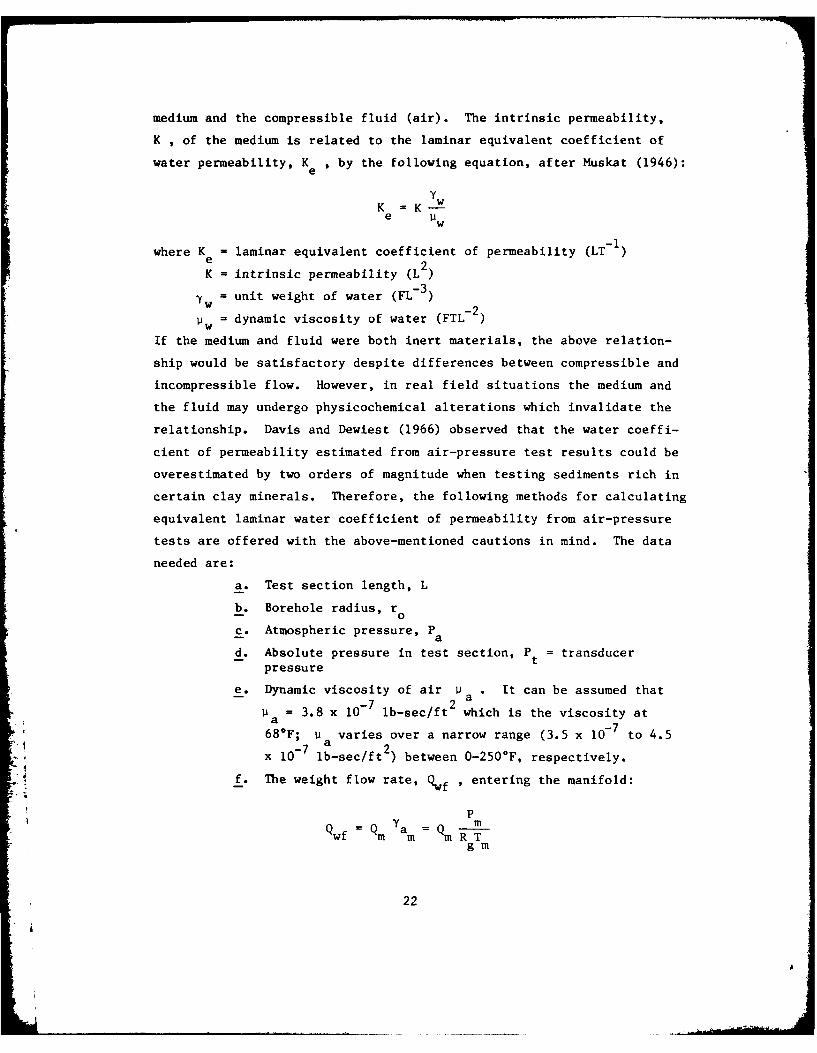
medium and the compressible fluid (air). The intrinsic permeability,
K , of the medium is related to the laminar equivalent coefficient of
water permeability, K , by the following equation, after Muskat (1946):e
YwK = -e 1w
where K = laminar equivalent coefficient of permeability (LT - )e 2K = intrinsic permeability (L2)
Yw = unit weight of water (FL- 3) 2
1w = dynamic viscosity of water (FTL - )
If the medium and fluid were both inert materials, the above relation-
ship would be satisfactory despite differences between compressible and
incompressible flow. However, in real field situations the medium and
the fluid may undergo physicochemical alterations which invalidate the
relationship. Davis and Dewiest (1966) observed that the water coeffi-
cient of permeability estimated from air-pressure test results could be
overestimated by two orders of magnitude when testing sediments rich in
certain clay minerals. Therefore, the following methods for calculating
equivalent laminar water coefficient of permeability from air-pressure
tests are offered with the above-mentioned cautions in mind. The data
needed are:
a. Test section length, L
b. Borehole radius, r
c. Atmospheric pressure, P~ad. Absolute pressure in test section, Pt = transducer
pressure
e. Dynamic viscosity of air P a . It can be assumed that
-7P= 3.8 x 10 lb-sec/ft which is the viscosity ata
7 -768°F; varies over a narrow range (3.5 x 10- to 4.5
10- lb-sec/ft ) between 0-250*F, respectively.
f. The weight flow rate, Qwf entering the manifold:
PQ QYam Q m_wf= m m R T
gm
22

where volume flow rate at the manifold (L3 T- 1)
Ya unit weight of air at manifold (FL- 3)
P - absolute pressure at the manifold (FL- 2)
mR 53.3 ft-lb/lb-deg RankinegTM - absolute temperature at the manifold (deg Rankine)
Degrees Rankine - Degrees Fahrenheit + 460
The unit weight of air in the test section, at , whichis
PYa t7a = __~
t RTgt
where Pt = absolute pressure in test section, lb/ft2
Tt = absolute temperature in test section, deg Rankine
If isothermal expansion of an ideal gas is assumed, the intrinsic perme-
ability K may then be calculated as:
K = 11a ____ in R/rL P2 _ P 2 o
t t a
If the pressure transducer is zeroed downhole, then the measured pres-
sure is the excess test pressure, and the equation reduces to
K = Lin R/rTat iL Pt o
and substituting for the relationship between equivalent coefficient of
permeability, Ke , and intrinsic permeability, K , the equivalent coef-
ficient of permeability is
Yw Qwf PaK = 1 n R/roKe 11 y~ inLP 0n/
w a tt
or rearranging,
K = in R/re pw wL P t 0
23
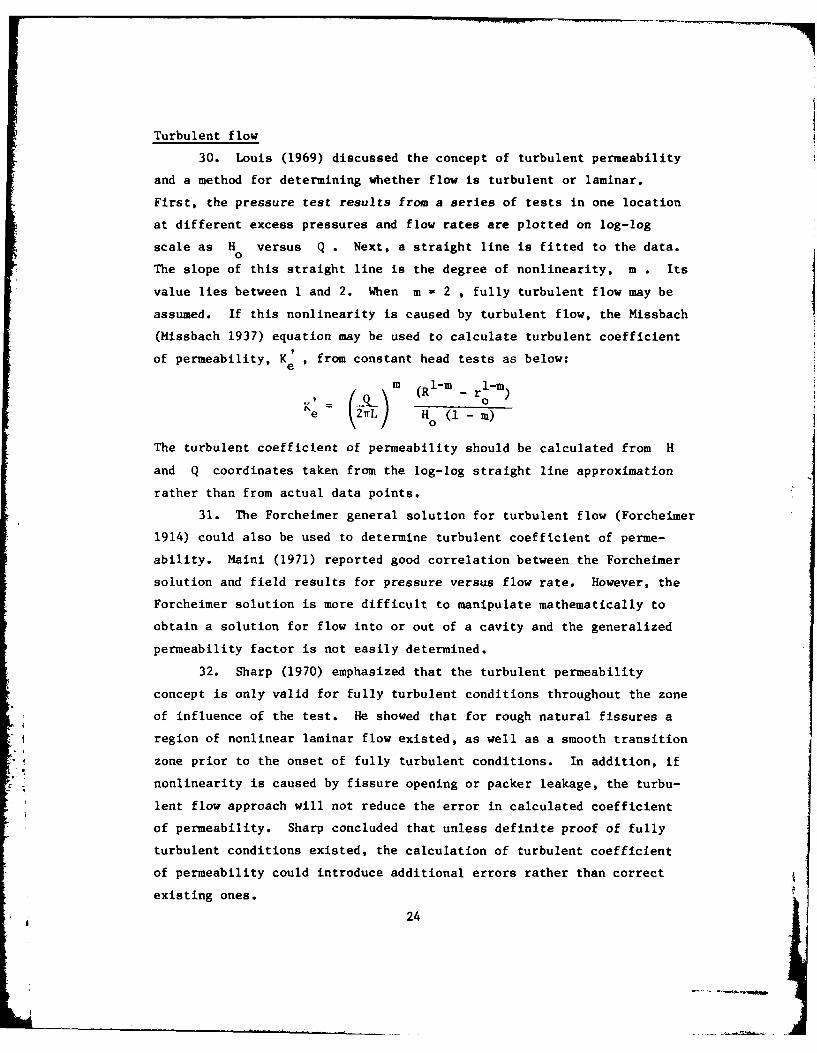
Turbulent flow
30. Louis (1969) discussed the concept of turbulent permeability
and a method for determining whether flow is turbulent or laminar.
First, the pressure test results from a series of tests in one location
at different excess pressures and flow rates are plotted on log-log
scale as H versus Q . Next, a straight line is fitted to the data.0
The slope of this straight line is the degree of nonlinearity, m . Its
value lies between 1 and 2. When m - 2 , fully turbulent flow may be
assumed. If this nonlinearity is caused by turbulent flow, the Missbach
(Missbach 1937) equation may be used to calculate turbulent coefficient
of permeability, K I from constant head tests as below:e9
(Ri- 1-rn
e = AK H( - rm)
The turbulent coefficient of permeability should be calculated from H
and Q coordinates taken from the log-log straight line approximation
rather than from actual data points.
31. The Forcheimer general solution for turbulent flow (Forcheimer
1914) could also be used to determine turbulent coefficient of perme-
ability. Maini (1971) reported good correlation between the Forcheimer
solution and field results for pressure versus flow rate. However, the
Forcheimer solution is more difficult to manipulate mathematically to
obtain a solution for flow into or out of a cavity and the generalized
permeability factor is not easily determined.
32. Sharp (1970) emphasized that the turbulent permeability
concept is only valid for fully turbulent conditions throughout the zone
of influence of the test. He showed that for rough natural fissures a
region of nonlinear laminar flow existed, as well as a smooth transition
zone prior to the onset of fully turbulent conditions. In addition, if
nonlinearity is caused by fissure opening or packer leakage, the turbu-
lent flow approach will not reduce the error in calculated coefficient
of permeability. Sharp concluded that unless definite proof of fully
turbulent conditions existed, the calculation of turbulent coefficient
of permeability could introduce additional errors rather than correct
existing ones.
24
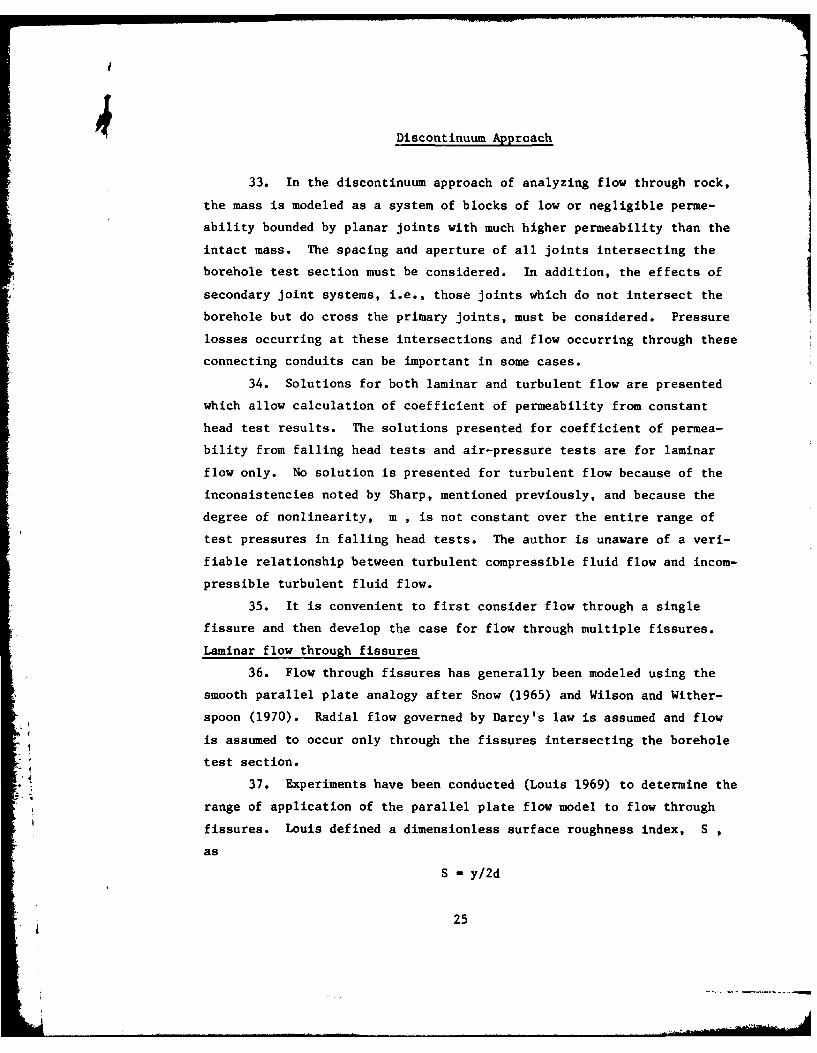
4Discontinuum Approach33. In the discontinuum approach of analyzing flow through rock,
the mass is modeled as a system of blocks of low or negligible perme-
ability bounded by planar joints with much higher permeability than the
intact mass. The spacing and aperture of all joints intersecting the
borehole test section must be considered. In addition, the effects of
secondary joint systems, i.e., those joints which do not intersect the
borehole but do cross the primary joints, must be considered. Pressure
losses occurring at these intersections and flow occurring through these
connecting conduits can be important in some cases.
34. Solutions for both laminar and turbulent flow are presented
which allow calculation of coefficient of permeability from constant
head test results. The solutions presented for coefficient of permea-
bility from falling head tests and air-pressure tests are for laminar
flow only. No solution is presented for turbulent flow because of the
inconsistencies noted by Sharp, mentioned previously, and because the
degree of nonlinearity, m , is not constant over the entire range of
test pressures in falling head tests. The author is unaware of a veri-
fiable relationship between turbulent compressible fluid flow and incom-
pressible turbulent fluid flow.
35. It is convenient to first consider flow through a single
fissure and then develop the case for flow through multiple fissures.
Laminar flow through fissures
36. Flow through fissures has generally been modeled using the
smooth parallel plate analogy after Snow (1965) and Wilson and Wither-
spoon (1970). Radial flow governed by Darcy's law is assumed and flow
is assumed to occur only through the fissures intersecting the borehole
test section.
37. Experiments have been conducted (Louis 1969) to determine the
range of application of the parallel plate flow model to flow through
fissures. Louis defined a dimensionless surface roughness index, S
as
S - y/2d
25

where y - average height of fissure asperities
d - average aperture of the fissure
His tests on concrete slabs indicated that the parallel plate model gave
satisfactory results for S < 0.033 . For S < 0.033 , the actual
measured aperture of the fissure could be used to calculate coefficient
of permeability.
Constant head tests
38. For constant head tests on single fissures the coefficient of
permeability, Ki , is
K d2 'YwK 12 w
where Y = unit weight of water
fw dynamic viscosity of water
For values of S > 0.033 , fissure roughness is important and can be
considered by calculating an equivalent parallel plate aperture. This
calculated aperture is not a measure of actual separation distance
between two rock blocks but is the aperture separating two smooth paral-
lel plates which would yield a flow rate equal to the observed flow rate
through the natural fissure. This equivalent aperture, e , is calcu-
lated as 1/3
e = [Ar --2: l n R/r]
where Q = observed steady-state volume flow rate
H = excess head in test section0R = radius of influence
r -i borehole radius0
Yw and Pw are as defined above
Coordinate values of H and Q should be taken from a straight-line
approximation of H versus Q which must pass through the origin.
The radius of influence is the only unknown test variable and can be
estimated with reasonable accuracy between L/2 and L , where L is
26
the test-section length. This done, the equivalent parallel plate
coefficient of permeability, Kej , may be calculated as below:
ej Y
K =e 2yWej 2 121
If the borehole test section is intersected by several fissures, the
single-fissure analogy may be extended to allow determination of the
coefficient of permeability using either of two methods. First, if the
number of joints and the aperture of each joint intersecting the test
section are known and if S < 0.033 , the coefficient of permeability of
the fissure system, Ks , may be calculated as5n
iYiw Z 2K =is 1211 d
where n - number of fissures
di = aperture of an individual fissure
All other variables are as previously defined.
39. The obvious difficulty in applying this equation is the
measurement of fissure apertures and the evaluation of the surface
roughness index, S . The number of fissures intersecting the test
section may be determined from inspection of the boring log, core sam-
ples, and where available, borehole TV or camera survey results. How-
ever, even when the fissure aperture can be measured at the borehole
wall, there is little justification in using this measurement as the
average aperture over the area of the fissure influenced by the test.
Borehole wall disturbance may cause the aperture to be much larger at
the free face due to chipping of the intact rock around the fissure. On
the other hand, cuttings may seal the fissure and restrict or prevent
the flow from entering the fissure.
- 440. Consequently, the approach normally used is to compute an
* equivalent parallel plate aperture, e , of each fissure as below:
(12:)]1/3i / 12p w Roe fi n 27Hln R r
27
* .. ..I.... ......... . . .-

where all variables are as previously defined.
41. The equivalent laminar coefficient of permeability of each
fissure is then:
---Q--- n R/rej 2nneH 0
If the right-hand side of the equation is multiplied by
3e
Q 121w R
27rnH Yw r
the equation becomes2e yW
Ke 12 w
as shown previously, and the equivalent fissure system coefficient of
permeability is given by
Kes = n (j w
Pressure drop test
42. In a discontinuum analysis of pressure drop tests of natural
fissures, the coefficient of permeability of a single fissure, Ki , may
be calculated as2 Hi(~
K. = in in R/r°3~~ 2t °2
where r - borehole radius
R - estimated radius of influence
d -aperture of fissureSH - excess head at center of test section at time t1
H1 excess head at center of test section at time t
-i elapsed time between tI and t2 JThis expression may be extended to consider multiple fissures in a test
section by replacing the aperture of the single fissure, d , with the
28
cumulative aperture of all fissures intersecting the test section, as
shown below:
K 0 in in R/rKs 2At n Ho
Z di 02
43. Again, the difficulty of accurately determining the aperture
of fissures and the surface roughness index, S , usually leads to the
use of the equivalent aperture approach, as explained previously. If
the number of fissures, n , intersecting the test section is known, the
equivalent aperture, e , may be calculated as
1/3
r 2 12p o /e H In H in R/ro )
The equivalent aperture may then be substituted into the equation to
calculate equivalent fissure coefficient of permeability, K , as shown
below:
°2 /K 0 n ( /I
Kej 26tne H 0
The coefficient of permeability of the fissure system is then:
Kes = nej
or 2 H(r o
K 0 In 1in /es 2 ein H R/r
where all variables are as previously defined. The assumptions and
conditions which must be met for these equations to apply are identical
to those for constant head tests given previously except flow is not
steady state.
29
. . ...

Air-pressure tests
44. The same assumptions and conditions stated in developing the
solution for computing equivalent coefficient of permeability from
air-pressure test results apply to the determination of fissure coeffi-
cient of permeability. The only difference in the equation is that the
effective test section length, L , in the continuum approach is replaced
by the effective test section length, ne , for fissure flow, where:
n - number of fissures intersecting the test section
e = equivalent fissure aperture, assumed constant for all fissures
Therefore, the coefficient of permeability of the fissure system may be
calculated as
K Y w Pa Qwf lnR/res Ya 1 TrneP o
where all variables are as previously defined.
Turbulent fissure flow
45. If flow is turbulent rather than laminar, the Missbach equa-
tion again can be used to determine coefficient of permeability of a
single fissure or system of fissures. The same precautionary notes as
mentioned previously should be kept in mind. The degree of nonlinearity,
m , is determined exactly as in the continuum approach discussed previ-
ously and is equal to the slope of the log H versus log Q straight
line approximation. When evaluating coefficient of permeability, H0
and Q coordinates should be taken from the straight line of best fit
and not from actual data points.
Constant head tests
J 46. For constant head tests, the resulting equation for equiva-
lent turbulent fissure coefficient of permeability is
m 1-rn 1-in'(R- r0
K mej n 2e H (1 -M)
where Kej denotes equivalent turbulent coefficient of permeability of
a single fissure. The equivalent turbulent coefficient of permeability
of the fissure system is
30

KI I
es nKej
or
(1-rn 1-rn
K 0e. (21j H 0 (1-rm)The assumptions which are relevant to the application of the preceding
formulas are repeated below:
a. Vertical borehole test section of length, L , intersec-ted by n horizontal fissures.
b. Inertia effects are neglected.
c. For laminar flow, Darcy's law is valid.
d. For turbulent flow, Missbach equation is valid.
e. Steady-state radial flow occurs only within fissuresintersecting the test section. (No flow through intactrock.)
f. Aperture of individual fissures is constant.
&" For equivalent system coefficient of permeability, allfissures have equal and constant aperture.
h. Test zone is saturated.
i. Boundary conditions:
at r-r , H=H0 0
at r-R , H=0
Anisotropy--Directional Permeability
47. Although it is well recognized that the most general case of
rock mass property distribution is spatially random, most references
emphasize the homogeneous, isotropic case, and treat anisotropy as a
special condition. Indeed, isotropic, homogeneous rock is the exception,and anisotropic, nonhomogeneous rock is the rule. Analysis of homo-
geneous, isotropic conditions is easier than analysis of anisotropic
rock, but the added theoretical complexity can be handled and is not the
reason for the lack of emphasis. Nor are the researchers ignorant of
the problem, but as Maini (1971) said, "No amount of theoretical sophi-
stication is useful unless it is possible to obtain meaningful data from
31

the field." Therein lies the problem. In most site investigations
pressure tests are run in vertical boreholes without regard for rock
structure. Since directional permeability cannot be assessed from these
test results, the designer either assumes isotropy or asks for addition-
al tests in inclined boreholes drilled to maximize intersection of one
joint set and minimize intersections of other joint sets or fissures.
In this way, the permeability of each joint or fissure set contributing
to the overall seepage can be assessed. Another method 'iiich may be
used for saturated strata is to put down vertical boreholes at different
bearings from the vertical test hole within the radius of influence and
monitor changes in pressure. Directional differences in horizontal
permeability can then be calculated and applied in a continuum analysis.
Results from the first method would be applicable in a discontinuum
analysis. Continuum analysis is satisfactory for some rock conditions,
such as conglomerates; porous, nonfissured rock; or highly fractured
rock, but for most cases, flow is anisotropic as are the mechanical
properties of the rock mass.
32

PART IV: SUMMARY AND CONCLUSIONS
Improvements in Test Equipment
48. New pressure test equipment and methods were developed at WES
which significantly improve the reliability and accuracy of rock mass
permeability measurements. Improvements include:
a. Test pressures are monitored downhole by electricaltransducers, eliminating the problem of calculating headlosses in the injection line.
b. Packers are inflated and deflated through the main injec-tion line (1-1/4-in. ID) so packer response is muchfaster than if inflated with 1/4-in. ID nylon lines,common to earlier equipment. Also, there is less con-gestion in the borehole and less chance of getting thetool stuck in the hole.
c. Packers are longer than those on earlier equipment, thusminimizing leakage from the test section past the seal.
d. Transducers monitor pressures in the test section, in thepackers, and above and below the packers so that ifleakage does occur, it is instantly recognized.
e. A nine-way valve and redundant transducers allow theoperator to cross-check pressures and allow the test tocontinue, even if up to two transducers fail.
f. Different size packers may be fitted to the screen sec-tion for testing various diameter boreholes. The minimumand maximum borehole diameters are, respectively, 3 in.
and 13.75 in.
A. Test section length may be varied by adding screen sec-tions in 5-ft increments or by running single packertests.
h. The electronic surface control and readout unit allowsthe operator to monitor and adjust all pressures and flowrate, if desired. Provisions were made for attachingtape, printer, or plotter to record test data.
i. Air temperatures can be monitored in the test section andat the flow manifold where flow is measured. This featureallows the operator to correct volume flow rates whenperforming air-pressure tests.
33

Improvements in Test Methods
49. Pressure test methods have been adapted for use with the new
equipment which result in collection of more reliable test data. Some
of the improvements have been suggested previously and some were dis-
covered during this investigation. They include:
a. Air-pressure tests should not be performed below thewater table. In tests above the water table, the bore-hole should be air-dried prior to testing. Adsorbedwater on the borehole walls can cause errors in calcu-lated permeability coefficients of more than an order ofmagnitude.
b. Similarly, when water-pressure tests are to be performedabove the water table, the borehole should be thoroughlyflushed with water to remove drill cuttings which mayclog fissures and to saturate the area of influencearound the cavity. Permeability determined from tests inunsaturated media may be in error by more than an orderof magnitude, compared with the permeability of the samemedia at saturation. In unsaturated media, the hydraulicgradient is larger because water may enter air-filledvoids, resulting in higher measured flow rates and thushigher permeability coefficients.
c. The borehole should be filled with water to a level abovethe top packer before inflating the packer and starting a
test. This can be accomplished by venting both packerswhile pumping water into the hole until the "above packerpressure" display on the surface readout unit starts to
rise. Then, the packers should be inflated and the testbegun. Otherwise, air may be trapped inside the testsection and the measured flow rates and computed permea-bility coefficients will be too high.
d. Several pressure tests at different excess pressuresshould be run at each test depth to determine a possiblenonlinear pressure-flow rate relationship. Because fis-sure deformation (opening) may occur at high test pres-sures and because this deformation may be inelastic andirreversible, it is suggested that the sequence of testsshould be from lowest to highest excess pressure. How-ever, there is some justification for sequencing thetests from highest to lowest pressure if care is taken toavoid fissure opening. The advantage is that the test atmaximum pressure in unsaturated rock will saturate thearea of influence of all subsequent lower pressure tests.
34

e. Selection of maximum test pressure is very important toreliably estimate permeability. In nearly all cases, the
maximum test pressure should be less than the effectiveoverburden pressure to avoid fissure opening and possiblehydrofracturing. However, in very few cases there may bejustification for using test pressures higher than effec-tive overburden pressure with the knowledge that fissureopening may occur. For example, it may be desirable to
test a noncritical zone of a particular rock type athigher pressures to determine the possible influence thatreservoir loading may have on permeability. For example,if a critical rock formation outcropped on the upstream
side of an abutment and extended downstream some distance,the downstream noncritical section could be tested atpressures representative of the maximum pool to see whateffect the increase in load caused by impoundment mighthave on the permeability of the critical upstream outcrop.It is obvious that hydrofracturing the abutment or dam
core should always be avoided.
Significance of Radius of Influence
and Test Section Length
50. Sharp (1970) varied the ratio of test section length to
borehole radius and observed the variation of head loss with distance
from the borehole. He assumed an isotropic homogeneous continuum and
linear flow and computed head as percent of excess remaining versus
distance from the borehole using a numerical model. He concluded that
for test section length to borehole radius ratios greater than 100
(L/d > 100) flow was 80 percent orthogonal to the borehole for up to
80 percent loss in head. He further concluded that 80 percent of the
head loss occurs within a distance of one-half the test section length
(L/2) from the borehole. The permeability of the medium at distances
greater than L/2 had little effect on the flow from the test section.
Maini (1971) extended this work and concluded that in fissured rock the
head loss occurred at even less distance from the borehole. Two impor-
tant conclusions can be made from these findings (not new, but important,
nonetheless):
a. The arbitrary choice of radius of influence, R , betweenL and L/2 is reasonable considering that most of the
head loss has occurred within this zone and considering
35

further that since coefficient of permeability is propor-tional to the log of radius of influence, any errors inchoosing R will have only a small impact on computedcoefficient of permeability.
b. Pressure test results may be applicable to only a smallvolume of rock surrounding the test section. Nearbycavities, impermeable boundaries, etc., may go completely
undetected.
Choice of Method of Analysis
51. The choice of method of analyzing pressure tests must take
into consideration the field conditions. Above all, though, the test
method and equipment, method of analysis, and other pertinent information
should be documented. A format for reporting results has been suggested
in the Appendix on test methods.
52. The continuum approach will yield satisfactory results in
soil or closely jointed or crushed rock. The discontinuum approach
should be used in conditions where the rock is intersected by widely
spaced or irregular fissures. Where boundary conditions such as faults,
impervious sills or dikes, etc., influence seepage patterns and rates,
anisotropy must be considered. An example may serve to show the need to
consider the possible effects of anisotropy. Consider a dam abutment
characterized by two major joint sets, neither of which are vertical or
horizontal. Assume permeability coefficients of the two joint sets are
not equal and that permeability of the intact rock is negligible.
Assume that joint set 1 dips perpendicular to the reservoir slope and
joint set 2 dips parallel to the reservoir slope as shown in Figure 5.
If a vertical borehole is drilled into the abutment rock and pressure
tested, the coefficient of permeability thus determined is dependent on
the coefficient of permeability and orientation and spacing of each
joint set as well as test section length. The coefficient of permeabil-
ity measured is called the equivalent mass coefficient of permeability,
K • Upon reservoir impoundment, the joint set I with coefficient ofe
permeability K1 will be subject to the full reservoir head above the31
36

Figure 5. Intersecting joint sets
37
4
line of intersection of each joint with the reservoir free face. There-
fore, the seepage rate will be controlled primarily by the flow through
this joint set. Joint set 2, which does not intersect the reservoir but
has strike and dip roughly parallel to the slope face, serves as an
intersecting conduit for joint set 1 and has only a small effect on
flow. If K1 > > K2 , then the use of Ke determined in the vertical
borehole would result in an underestimation of seepage. If K12<< K2 ,then the seepage rate would be overestimated if Ke was used in )calculations. In neither case would directional flow be assessed.
Another consideration is the effect of reservoir loading on the coeffi-
cients of permeability of the joint sets. It is conceivable that joint
set 2 would be compressed upon impoundment, reducing the coefficient of
permeability K2 below the initial value. If initially (before im-
poundment) K2 > K 1 , then K2 would contribute more to Ke than would
K1 . However, upon impoundment K2 might be reduced to K 2< K1 , which
would make K completely invalid.e
53. Therefore, if the rock to be tested is characterized by more
than one major joint set or when major features such as faults or sills
are discovered, the test program should be designed to measure the
coefficient of permeability of each joint set individually by testing
boreholes which are intersected by a maximum number of joints in one set
and a minimum number from the other set(s). Tests along the length of
interest in three differently oriented boreholes will allow the complete
directional permeability profile to be determined and any anisotropy
will be identified. Tests performed in vertical boreholes without
regard to orientation or spacing of major features may yield completely
misleading results.
Consideration of Turbulent Flow
54. The concept of turbulent flow analysis, as explained by Louis
(1969), relies on the existence of completely turbulent conditions
throughout the zone of influence of the test. This condition may never
38

exist as suggested by Sharp (1970), and in any case it is nearly impos-
sible to determine whether observed nonlinearity in the pressure-flow
rate relationship is caused by turbulence or by fissure opening (or
clogging) or packer leakage. Therefore, the equivalent turbulent coef-
ficient of permeability concept should be used cautiously.
-4-
39
iA
REFERENCES
Davis, S. N. and Dewiest, R. J. M. 1966. Hydrogeology, Wiley, New York.
De Mello, V. F. B. and da Cruz, P. T. 1960. "Some Quantitative Investi-gations on Curtain Grouting in Rock Foundations of Earth Dams," Proceed-ings of the First Panamanian Conference on Soil Mechanics and FoundationEngineering, Mexico, Vol II, pp 699-707, Sept. 1960.
Forcheimer, P. H. 1914. Hydraulic, Teubner, Berlin.
Groundwater and Wells. 1966. 1st ed., Published by Edward E. Johnson,Inc., St. Paul, Minn.
Gringarten, A. C. and Witherspoon, P. A. 1972. "A Method of AnalyzingPump Test Data from Fractured Aquifers," Proceedings of the Symposium onPercolation Through Fissured Rock, Stuttgart, Germany.
Hvorslev, M. J. 1951. "Time Log and Soil Permeability in GroundwaterObservations," Bulletin No. 36, U. S. Army Engineer Waterways ExperimentStation, Vicksburg, Miss.
Lewis, D. C., Kritz, G. J. and Burgy, R. H. 1966. "Tracer DilutionSampling Techniques to Determine Hydraulic Conductivity of FracturedRock," Water Resources Research, Vol 2, No. 3.
Louis, C. 1969. "A Study of Groundwater Flow in Jointed Rock and ItsInfluence on the Stability of Rock Masses," Rock Mechanics Research Re-port No. 10, Imperial College, London, England.
• 1977. "Suggested Methods for Determining Hydraulic Param-eters and Characteristics of Rock Masses," Category II, Part 6, ISRMCommittee on Standardization of Laboratory and Field Tests.
Lugeon, M. 1933. Barrages et Geologic, Dunod, Paris.
Maini, Y. N. T. 1971. In Situ Hydraulic Parameters in Jointed RockTheir Measurement and Interpretation, Ph.D. dissertation, ImperialCollege, London, England.
Missbach, A. 1937. Listy Curkova, Vol 55.
Muskat, M. 1946. "The Flow of Homogeneous Fluids Through Porous Media,"1st ed., J. W. Edwards, Inc., Ann Arbor, Mich.
Saad, K. F. 1967. "Determination of the Vertical and Horizontal Permea-bilities of Fractured Water-Bearing Formations," Bulletin of the Inter-national Association of Scientific Hydrology, Vol 12, No. 3, pp 22-26.
40
Sharp, J. C. 1970. Fluid Flow Through Fissured Media, Ph.D. disserta-tion, University of London, Imperial College of Science and Technology,London, England.
Snow, D. T. 1965. A Parallel Plate Model of Fractured PermeabilityMedia, Ph.D. dissertation, University of California, Berkeley, Calif.
Thompson, G. 1980. "Some Considerations for Tracer Tests in Low Permea-bility Rock Formations," Proc. 3rd Invitational Well Testing Symposium,Mar 1980, University of California, Berkeley, Calif.
U. S. Army Engineer Waterways Experiment Station. 1980. Rock TestingHandbook, Standard 381-80.
U. S. Army. 1961. "Subsurface Drilling, Sampling, and Testing," CivilWorks Construction Guide Specification, CE-1201, Office, Chief of Engi-neers, Washington, D. C.
Wilson, C. R. and Witherspoon, P. A. 1970. "An Investigation of LaminarFlow in Fractured Porous Rocks," Department of Civil Engineering, Univer-sity of California, Berkeley, Calif.
Zeigler, T. W. 1976. "Determination of Rock Mass Permeability,"Technical Report S-76-2, U. S. Army Engineer Waterways Experiment Sta-tion, Vicksburg, Miss.
!I
41
06
-14
4K
41
';Y4
14
At
PIATE 1
PLATE 2

..... .....
nv.
41
PLATE 3

PLATE 4

APPENDIX A: PRESSURE TEST METHODS
General Guidance
1. The following suggestions are made concerning drilling the
borehole, pretest checkout of equipment, and testing precautions to
promote a safe, reliable testing program.
Making the borehole
2. Pressure tests are commonly run in NX-size (3-in.-diam) bore-
holes, although this size is in no way required. Rotary drilling with
water for cooling the drill bit and flushing drill cuttings from the
hole is the normal method of making the hole. During drilling, the
water pressure and loss rates should be monitored and recorded. High
fluid pressures may cause hydraulic fracturing of the rock, which must
be avoided. Sudden drops in the return flow rate indicates that a
highly permeable or fractured zone has been penetrated. The drill
string may chatter and vibrate when fractured rock is encountered, and
if severe water loss occurs, the bit may become stuck. If the return
flow rate suddenly increases after dropping off, it usually means the
fissures through which the water loss was occurring have become plugged
with drill cuttings, effectively sealing the borehole walls. The above
information should be noted on the drilling log as an aid in selecting
test depths and in interpreting data. Detailed core logs should be
prepared by an experienced geologist during drilling. The hole should
be pressure washed prior to testing to (a) remove remaining cuttings
(which may clog the fissures) and (b) saturate zones to be tested above
the water table. If single-packer tests are made sequentially as the
hole is extended, there may be more likelihood of noting possible exten-
uating circumstances such as those above for at least two reasons:
a. The test closely follows borehole extension so any unre-corded information which might affect test results can berecalled. This information may be lost or forgotten whentests are made sometime after completing the hole.
b. Joints, fractures, or other high permeability zones maybe more positively located and oriented when both thecore and the log are available.
Al

Borehole orientation and spacing
3. Boreholes for general site investigations are normally drilled
vertically and pressure tested without regard to orientation or spacing
of discontinuities in the rock. As information about the orientation,
spacing, and relative importance of joints and fractures becomes avail-
able from boring logs, core samples, and initial pressure test results,
additional strategically located and oriented borings should be made and
tests which intersect the major identifiable features likely to influence
seepage patterns and contribute to the overall flow rate should be
conducted in these holes. Borehole TV or film camera surveys can be
used to advantage to identify the frequency and orientation of joints
and fractures and their use is recommended in selecting pressure test
locations.
Test Setup
4. The following steps describe setup of the various components
of the pressure test system, followed by step-by-step instructions for
performing constant head, falling head, and air-pressure tests:
a. Set up surface mechanical equipment.
(1) Assemble the flow manifold as shown on Plate 3, in-cluding the regulating bypass valve.
(2) Close 90 deg valves, A, B, C, and D. (See Figure Alfor valve locations on the plumbing and wiring diagram.)
(3) Connect the flowmeter electrical cables and pump pres-sure pick-off line to the transducer. These lines arenext connected to the small surface junction box.
(4) Connect the 1/4-in. nylon line between the regulatingbypass valve and the injection pressure regulator onthe air tank.
' 0A(5) Connect the water pump supply line, flexible hose, and
downhole control unit as shown in Figure Al--a schematicof the flow manifold, downhole unit, and plumbing andwiring connections.
b. Make connections to surface electronic equipment.
(1) Check to make sure both AC power switches on the sur-face control unit are in the OFF position. Plate 2shows the surface control unit. The switches are onthe right side of the unit.
A2

LUU
0
41u
ww
-j u
000.
0- z-00
00
00
'Io 2o 0
o4 Do C(p0 -o
C64 A-
.10

(2) Connect all electrical cables to the Surface Controland Readout Unit. These include AC power, downholecontrol unit, and the flowmeter connection cable.
c. Calibrate pressure transducer.
(1) Switch the bridge excitation toggle switches to theOFF position on all STRAIN GAGE CONDITIONER units.
(2) Place the toggle switches marked CAL (also located onthe conditioner units) to their center or OFF position.The CAL and STRAIN GAGE CONDITIONER switches arelocated along the bottom of the surface control unit
front panel.
(3) Connect a twin-lead jumper cable from the EXTERNALMETER output of the conditioner power supply to theDVM INPUT located just below the flowmeter rotaryselector switch.
(4) Place the flowmeter rotary switch in the EXT. DVM,position. (This connects the FLOWRATE meter to theDVM INPUT jacks.)
(5) Place the toggle switch on the conditioner powersupply to the POWER position. (The red pilot lampshould illuminate.)
(6) Place the POWER switch on the main control unit to theON position. All seven digital panel meters should
illuminate.
(7) Set the CHANNEL selector switch on the Power Supplymodule to the AC position. The meter should readwithin the AC band.
(8) Turn the CHANNEL selector switch to DC; the meter
should read on the DC check line.
(9) Turn the CHANNEL selector to channel 1. This connectsthe power supply meter and the flow rate meter to thenumber 1 strain gage conditioner, which is the condi-
tioner located on the far left.
(10) Adjust the BRIDGE EXCT (using a small screwdriver) toread five volts on the FLOWRATE meter.
, (11) Turn the CHANNEL selector switch to channel 2 and re-peat step 10; adjusting the BRIDGE EXCT screw on con-ditioner 2 (second from the left).
(12) Turn the CHANNEL selector to channel 3. Repeat step 10,adjusting the BRIDGE EXCT screw on conditioner 3(third from left). Repeat for channels 4 and 5. Theremaining conditioners are spares and are not used.
(13) Use a small screwdriver to adjust the AMP BAL locatedon each of the conditioner units until both OUTPUTlamps are off or equally dimmed.
A4
(14) Place all five EXCIT switches in the ON position.
(15) Allow five minutes warm-up time for the pressuretransducer circuits to stabilize.
(16) Adjust the lockable BALANCE knobs on all five condi-tioner units to obtain zero readings on the corre-sponding meters. Note the OUTPUT lights should bothbe off or dimly lit. The display meters across thetop of the control unit correspond in left to rightorder with the conditioner units, except conditionernumber 5, which corresponds to the PUMP PRESSUREmeter.
(17) Place the CAL toggle switches on all five conditionersto the "A" position.
(18) Adjust the lockable GAIN dials on the conditionerunits to obtain the correct calibration number on eachof the display indicators that correspond to the pres-sure transducer being used. Use the calibration chartprovided (Figure A2) (Example: Channel No. 1 TransducerSer. No. 245 Cal. No. 2909).
(19) Return the CAL toggle switches to their OFF position.The display indicators should return to zero. If not,repeat steps 16 through 19 on the channels indicatingthe zero shifts until steady zeros are obtained.
d. Calibrate flowmeter.
(1) The pressure injection test system will cover a widerange of flow rates (0.03 to 250 GPM), made possibleby the use of two flowmeters (0.03 to 3 and 2.5 to250 GPM, see Figure Al). The flowmeters are bothplumbed into the flow manifold and valves controlfluid flow through the flowmeters. The electricaloutput produced by fluid flowing through the flow-meters is nonlinear with respect to a change in flow.Because of the nonlinearity, several calibrationnumbers are provided with each flowmeter to cover the
full range of flows.
(2) Turn the flowmeter selector switch to the 2.5-250 GPMCAL position.
(3) Use the flow calibration chart provided to determinethe calibration number required for a flow of 100 GPM.This calibration is for initial setup only and willlikely be changed during actual testing because of thechanging pressure-flow relationship.
(4) Adjust the CAL ADJ located at the lower right of theflow selector switch until the meter matches the de-
termined calibration number.
A5

9
I
PRESSURE TRANSDUCER CALIBRATION
BridgeTransducer Amplifier Transducer Excitation Cal.Serial No. Serial No. Location Volt No.
245 25477 Downhole 5 2909PT-1
169 25477 Downhole 5 2901PT-2
334 25411 Downhole 5 3069PT-3
231 25411 Downhole 5 2879Packer
249 25441 Uphole 5 2892Pump
25441
FLOWMETER CALIBRATION
Flowmeter Size Cal. Cal.Serial No. GPM Hertz GPM No. Hertz GPM No.
840816 0.03-3 6.29 0.06 11.353 21.09 0.075 1 5a495840816 0.03-3 51.21 0.109 3.470 302.16 0.511 3.006840816 0.03-3 603.67 1.02 3.005 970.81 1.658 3.004840816 0.03-3 1262.08 2.159 3.015 1777.9 3.045 3.008
320441 250 12.05 2.13 244.8 50.56 890 289.3320441 250 248.61 44.13 306.3 573.13 101.7 310.4320441 250 727.94 129.2 311.6 955.21 169.7 313.1320441 250 1213.02 215.8 313.2 1529.72 271.9 315.0
CFM
48192 750 11.3 13.9 24.3 24.048192 750 130.0 119.1 249.7 227.848192 750 453.4 409.1 821.2 750.1
10349 16 62.0 0.60 334.0 2.410349 16 663.0 4.8 985.0 7.210349 16 1293.0 9.6 2169.0 16.8
Figure A2. Pressure transducer calibration chart
p
~A6

(5) Turn the flow selector switch to 2.5-250 GPM METERposition. The meter should read 0.6 or 0.7 GPM.
e. Adjust packer differential pressure valve.
(1) Check to make sure the injection pressure controlregulator output reads zero.
(2) Start water pump. Water should flow freely from thelarge discharge pipe on the regulating bypass valveback to the supply reservoir.
(3) Refer to Figure Al for steps 3 through 11. Open
Valve D on the manifold.
(4) Slowly increase the regulating bypass valve pressurewith the injection control regulator until a pumppressure of 100 PSI is indicated on the surface con-trol unit digital meter.
(5) Open the air-bleed valve located at the junction ofthe flexible hose and downhole injection pipe.
(6) Raise the bleed valve higher than the rest of theequipment to allow the air to escape.
(7) Open Valve C on the manifold.
(8) Allow the air to bleed out of the system; then close
the bleed valve.
(9) Use a 3/4-in. socket wrench with a short extension to
adjust the differential pressure screw located justinside the discharge end of the downhole control unit(see Figure Al, packer pressure differential valveadjustment access) until water just starts to leak bythe internal valve.
(10) Reduce the regulating bypass valve pressure until theflow of water from the downhole control unit stops
completely.
(11) Slowly increase the bypass valve pressure until wateronce again begins to flow from the downhole controlunit and note the pump pressure. If the indicatedpressure is within +5 PSI of 100 PSI, proceed to thenext step. If not, repeat steps 9 through 11.
f. Assemble downhole tool.
(1) Assemble the downhole tool as shown in Figure 2 (main
text).
(2) The tool must be assembled in two sections to avoidexceeding the hoisting height limit of the drill rig.The tool could also buckle if it were raised from thehorizontal position entirely preassembled.
A7
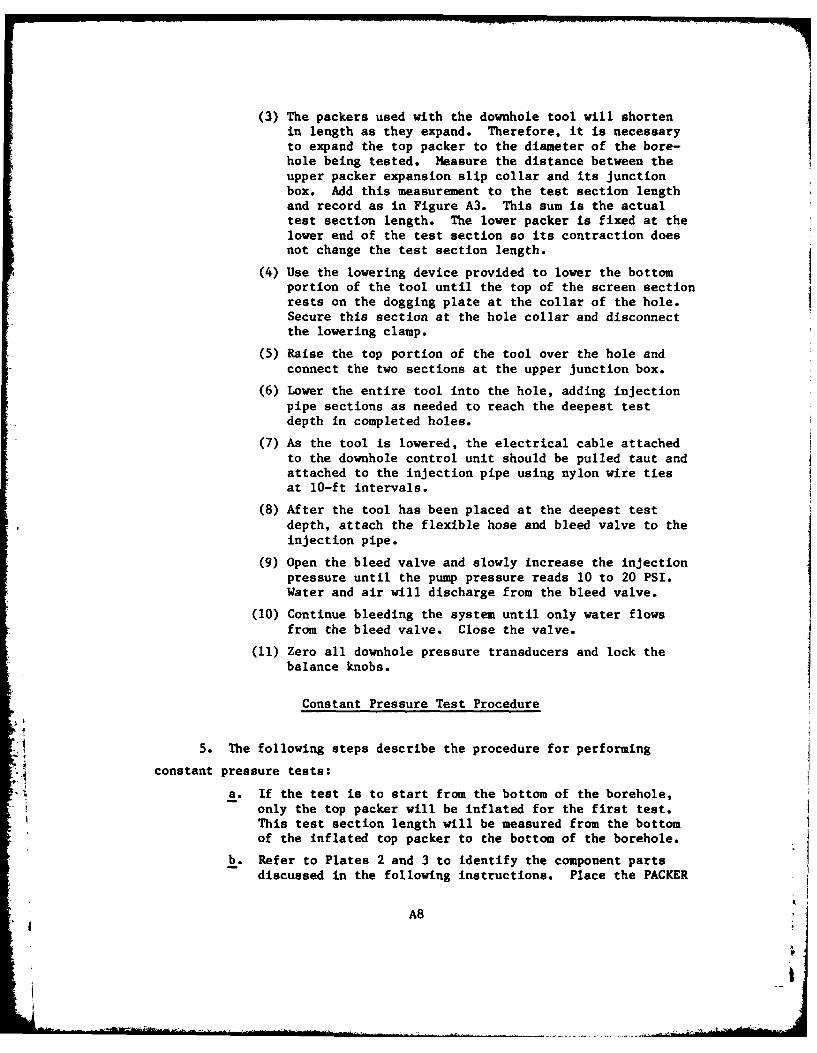
(3) The packers used with the downhole tool will shortenin length as they expand. Therefore, it is necessaryto expand the top packer to the diameter of the bore-hole being tested. Measure the distance between theupper packer expansion slip collar and its junctionbox. Add this measurement to the test section lengthand record as in Figure A3. This sum is the actualtest section length. The lower packer is fixed at thelower end of the test section so its contraction doesnot change the test section length.
(4) Use the lowering device provided to lower the bottomportion of the tool until the top of the screen sectionrests on the dogging plate at the collar of the hole.Secure this section at the hole collar and disconnect
the lowering clamp.
(5) Raise the top portion of the tool over the hole andconnect the two sections at the upper junction box.
(6) Lower the entire tool into the hole, adding injectionpipe sections as needed to reach the deepest testdepth in completed holes.
(7) As the tool is lowered, the electrical cable attachedto the downhole control unit should be pulled taut andattached to the injection pipe using nylon wire tiesat 10-ft intervals.
(8) After the tool has been placed at the deepest testdepth, attach the flexible hose and bleed valve to theinjection pipe.
(9) Open the bleed valve and slowly increase the injectionpressure until the pump pressure reads 10 to 20 PSI.Water and air will discharge from the bleed valve.
(10) Continue bleeding the system until only water flowsfrom the bleed valve. Close the valve.
(11) Zero all downhole pressure transducers and lock thebalance knobs.
Constant Pressure Test Procedure
5. The following steps describe the procedure for performing
constant pressure tests:
a. If the test is to start from the bottom of the borehole,only the top packer will be inflated for the first test.This test section length will be measured from the bottomof the inflated top packer to the bottom of the borehole.
b. Refer to Plates 2 and 3 to identify the component partsdiscussed in the following instructions. Place the PACKER
A8
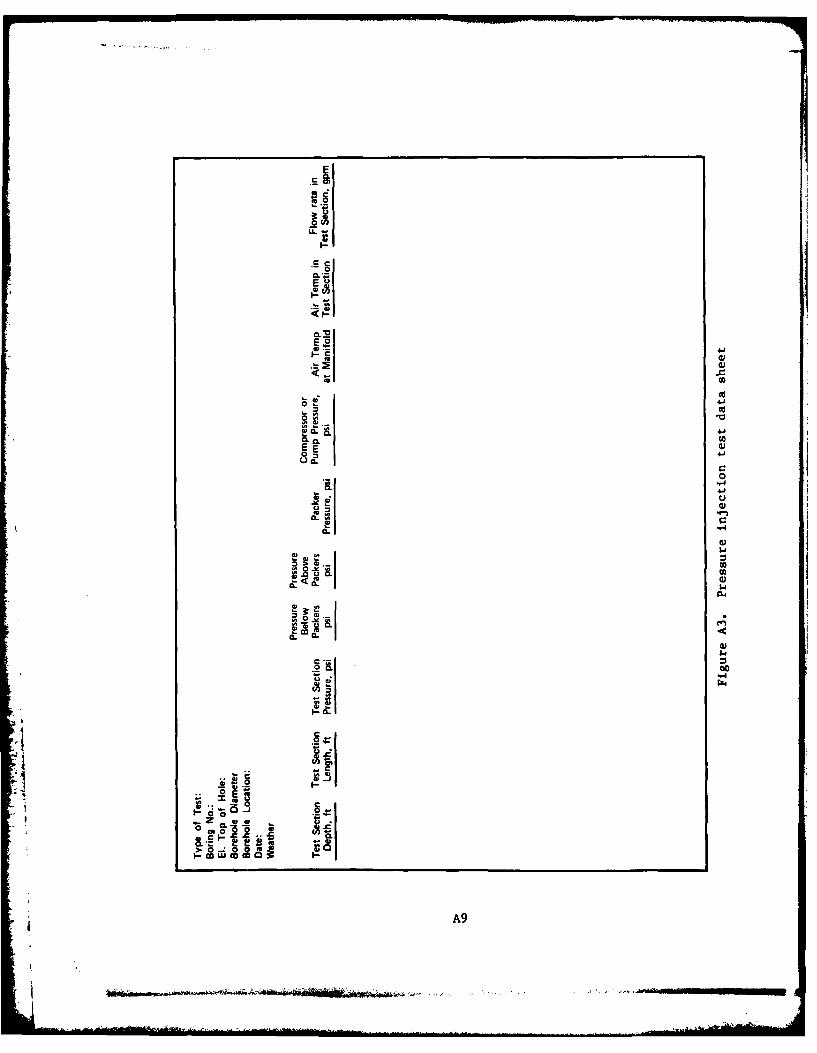
So0
0L.t
E! 2 4-'
CL CL
0 :3 4
0(- - 41
0 4)
.2
41 o
41 -V C
do i c "A90
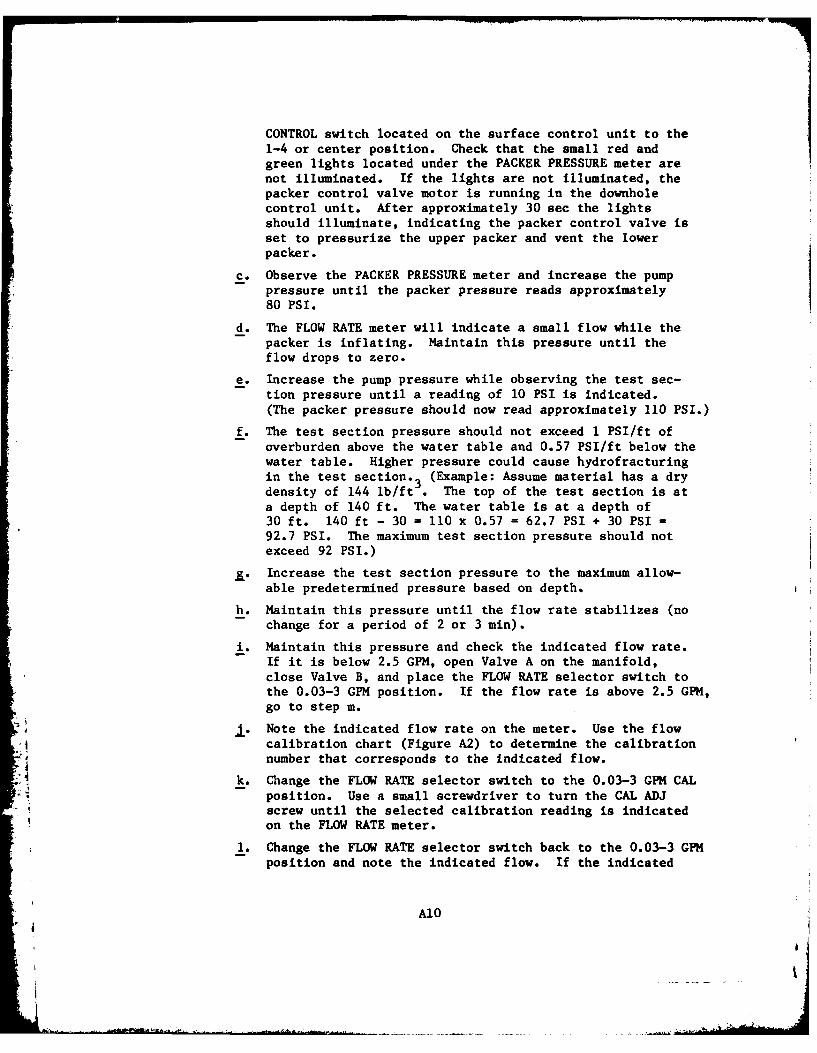
CONTROL switch located on the surface control unit to the1-4 or center position. Check that the small red andgreen lights located under the PACKER PRESSURE meter arenot illuminated. If the lights are not illuminated, thepacker control valve motor is running in the downholecontrol unit. After approximately 30 sec the lightsshould illuminate, indicating the packer control valve isset to pressurize the upper packer and vent the lowerpacker.
c. Observe the PACKER PRESSURE meter and increase the pumppressure until the packer pressure reads approximately80 PSI.
d. The FLOW RATE meter will indicate a small flow while thepacker is inflating. Maintain this pressure until theflow drops to zero.
e. Increase the pump pressure while observing the test sec-tion pressure until a reading of 10 PSI is indicated.(The packer pressure should now read approximately 110 PSI.)
f. The test section pressure should not exceed 1 PSI/ft ofoverburden above the water table and 0.57 PSI/ft below thewater table. Higher pressure could cause hydrofracturingin the test section.3 (Example: Assume material has a drydensity of 144 lb/ft . The top of the test section is ata depth of 140 ft. The water table is at a depth of30 ft. 140 ft - 30 = 110 x 0.57 = 62.7 PSI + 30 PSI92.7 PSI. The maximum test section pressure should notexceed 92 PSI.)
j. Increase the test section pressure to the maximum allow-able predetermined pressure based on depth.
h. Maintain this pressure until the flow rate stabilizes (nochange for a period of 2 or 3 min).
i. Maintain this pressure and check the indicated flow rate.If it is below 2.5 GPM, open Valve A on the manifold,close Valve B, and place the FLOW RATE selector switch tothe 0.03-3 GPM position. If the flow rate is above 2.5 GPM,go to step m.
Nte the indicated flow rate on the meter. Use the flowcalibration chart (Figure A2) to determine the calibrationnumber that corresponds to the indicated flow.
4 k. Change the FLOW RATE selector switch to the 0.03-3 GPM CALposition. Use a small screwdriver to turn the CAL ADJscrew until the selected calibration reading is indicatedon the FLOW RATE meter.
1. Change the FLOW RATE selector switch back to the 0.03-3 GPMposition and note the indicated flow. If the indicated
A1O
*
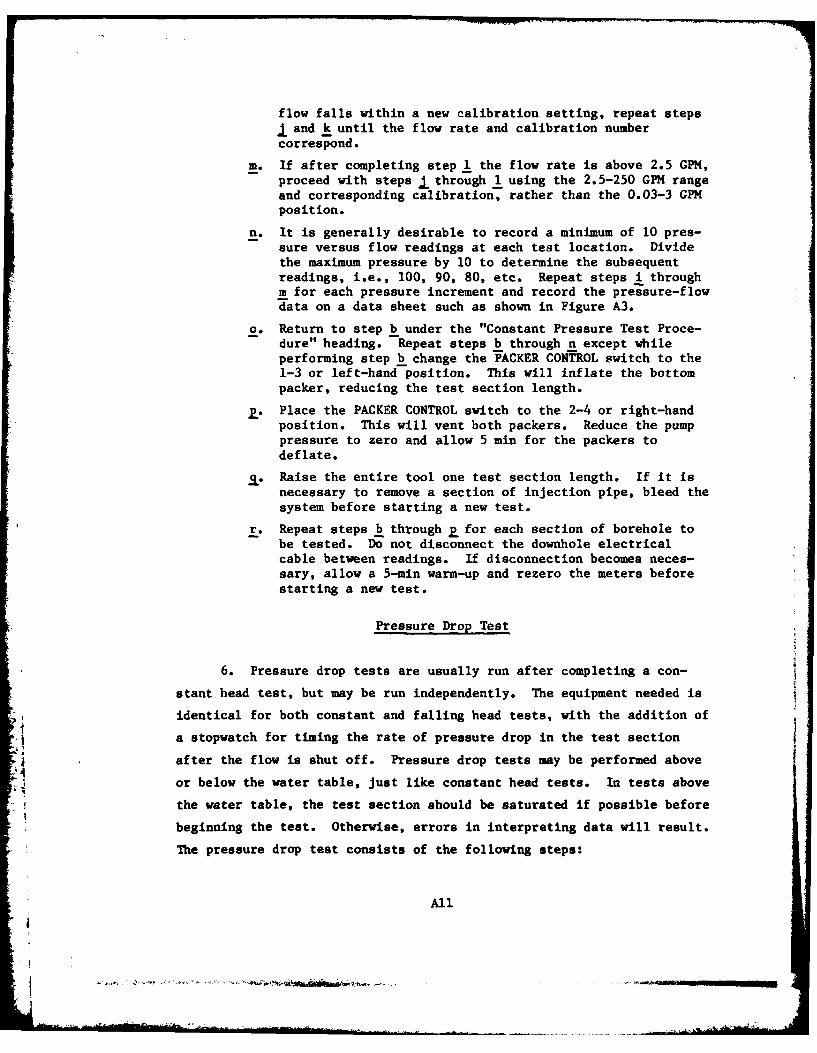
flow falls within a new calibration setting, repeat stepsJ and k until the flow rate and calibration numbercorrespond.
m. If after completing step!1 the flow rate is above 2.5 GPM,proceed with steps J through 1 using the 2.5-250 GP rangeand corresponding calibration, rather than the 0.03-3 GPMposition.
n. It is generally desirable to record a minimum of 10 pres-sure versus flow readings at each test location. Dividethe maximum pressure by 10 to determine the subsequentreadings, i.e., 100, 90, 80, etc. Repeat steps i throughm for each pressure increment and record the pressure-flowdata on a data sheet such as shown in Figure A3.
o. Return to step b under the "Constant Pressure Test Proce-dure" heading. Repeat steps b througha except whileperforming step I change the PACKER CONTROL switch to the1-3 or left-hand position. This will inflate the bottompacker, reducing the test section length.
Place the PACKER CONTROL switch to the 2-4 or right-handposition. This will vent both packers. Reduce the pumppressure to zero and allow 5 min for the packers todeflate.
Raise the entire tool one test section length. If it isnecessary to remove a section of injection pipe, bleed thesystem before starting a new test.
r. Repeat steps b through y for each section of borehole tobe tested. Do not disconnect the downhole electricalcable between readings. If disconnection becomes neces-sary, allow a 5-mmn warm-up and rezero the meters beforestarting a new test.
Pressure Drop Test
6. Pressure drop tests are usually run after completing a con-
stant head test, but may be run independently. The equipment needed is
identical for both constant and falling head tests, with the addition of
a stopwatch for timing the rate of pressure drop in the test section
after the flow is shut off. Pressure drop tests may be performed above
or below the water table, just like constant head tests. In tests above
the water table, the test section should be saturated if possible before
beginning the test. Otherwise, errors in interpreting data will result.
The pressure drop test consists of the following steps:
All

a. Choose test depth. Usually it is desirable to start atthe bottom of completed boreholes and proceed upwards.
b. Estimate limit pressure. See instructions under "ConstantPressure Test Procedure," subparagraph f.
c. Assemble downhole system according to instructions givenunder "Test Setup," subparagraph f.
d. Connect surface control and readout unit to downhole unitvia electrical conductor cable.
e. Connect reservoir to pressure regulator and pump and gas
cylinder. (See schematic, Figure Al.)
f. Attach water supply hose to injection line and test down-hole system for leaks by inflating packers while the sys-tem is at the surface. Repair leaks and recheck. Deflatepackers and detach water supply hose.
. Zero and calibrate readout, unit. (See specific instruc-tions given under "Constant Pressure Test Procedure" forcomplete calibration details.)
h. Lower downhole unit into hole in two sections as explainedunder "Test Setup," subparagraph f. Attach sections ofpressure injection pipe as needed to reach test depth.Use wire ties to attach electrical cable to injection pipeto prevent slack cable from becoming tangled up in thehole.
i. Recheck zero and adjust, if necessary.
Record depth to water in borehole, depth to the center oftest section, and test section length.
k. Inflate packers.
1. Pressurize test section to desired constant test pressure.Caution: Maintain test pressure below effective overbur-den pressure to avoid possible uplift and fissure opening.
m. Shut off flow and record time.
n. Record elapsed time and excess head (pressure) remainingat several increments until equilibrium pressure isreached.
o. Repeat tests at approximately 10 different test pressuresto check for nonlinear flow and consistent results.
Deflate packers. Allow 5 min for complete deflation.
j. Raise tool to next test depth and repeat steps i throughoor remove unit from hole.
A12

Note: It is important that the borehole should be pressure-washed
before testing. The borehole walls and adjacent rock should be satu-
rated prior to testing and all air should be purged from the test sec-
tion before inflating the packers. Tests by Maini (1971) showed that
the permeability determined for unsaturated rock could vary by over an
order of magnitude from that of saturated rock. The gradient is higher
in unsaturated rock, which allows flow into small fissures and pores and
yields higher flow rates than tests on saturated rock. This fact is
important for all water-pressure tests.
Air-pressure Test
7. The air-pressure test is essentially identical to the water-
pressure test with one obvious difference; air is injected into the
borehole rather than water. Air-pressure tests may be used when water
is unavailable, or when testing in highly permeable material where the
flow rate required to pressurize the test section cannot be maintained
with water.
8. If the borehole is drilled with water, it should be aliowed to
dry before testing to avoid possible adverse effects from moisture
absorbed on the borehole walls. Air-pressure tests should not be per-
formed below the water table because of the uncertainty associated with
assessing compressible gas flow through a water-saturated media. Air-
pressure tests require the use of an air compressor with a recommended
capacity of 350 cfm in addition to the equipment needed for water-
pressure tests. The water reservoir is replaced by the air compressor.
In addition, temperature-sensing transducers are required in the flow
manifold and in the test section to permit the weight flow rate to be
determined. The flowmeters must also be changed.
9. Steps required to execute an air-pressure test are listed
below:
a. Choose test depth and estimate limit pressure.
b. Assemble downhole system. See instructions under "TestSetup," subparagraph f.
A13
%.
c. Connect surface control and readout unit to downhole unitwith electrical conductor cable.
d. Connect air compressor to pressure regulator and gascylinder.
e. Attach air-supply line to injection line and test down-hole unit for leaks by pressurizing packers. Joints maybe tested by applying soapy water and checking for bubbles.Repair any leaks and recheck. Deflate packers and detachsupply line.
f. Zero and calibrate readout unit. (See calibration in-structions given under "Constant Pressure Test Procedure.")
s. Lower downhole unit into hole. See instructions givenunder "Test Setup," subparagraph f. Attach sections asneeded to reach desired test depth. Use wire ties to tieconductor cable to injection line to prevent fouling.
h. Recheck zero and adjust if necessary.
i. Record depth to center of test section and test sectionlength.
Inflate packers.
k. Pressurize test section to desired constant test pressureand take readings of temperature, pressure, and flow ratein the test section and at the manifold until flow ratestabilizes. Maintain test pressure below effective over-burden pressure to avoid possible uplift and fissurewidening. If pressure drop test is to be run, go tostep 1; otherwise, go to step n.
1. Shut off air supply and record time.
m. Record elapsed time and pressure in the test section atseveral time increments until pressure returns to equi-librium.
n. Repeat test at several different pressures at same loca-tion to check for nonlinear flow and consistent results.
o. Deflate packers and raise unit to next test depth andrepeat test or remove from hole.
A Reporting Results
*1 10. Numerous cases exist in the literature where pressure test
results were used to estimate seepage patterns and quantities, yet test
equipment and procedures and field conditions were poorly documented.
A14 ________I

The following information should be obtained during the general investi-
gation and testing program and included in the report:
a. Weather conditions and date.
b. Boring number and location and method of drilling andsampling and description of borehole washing procedureused.
c. Graphic boring log, showing joint and fracture orienta-tion, frequency, and condition, and photographs of thecore.
d. Geological cross sections of area of interest.
e. Pressure test section length and depth. Record depthfrom hole collar to center of test section. Recordlength between inflated packers.
f. Description of test equipment and methods used and anyunusual conditions.
1. Test results should be recorded on a data sheet such asshown in Figure A3 and should include type of test (air;or water-pressure, constant head, or pressure drop),depth to water table, and how determined. The test datawill include test section length and depth, flow rate,test section pressure, pressure above packer, pressurebelow packer, packer pressure, pump pressure, and holediameter. Pressure and flow rate should be recorded andplotted during the test. For air-pressure tests, temper-rature at the surface and in the test section should berecorded to correct volume flow rates.
h. A log-log plot of excess head, H , versus flow rate,-- Q , should be prepared by plotting each pressure and flow
rate increment at the same location to check for turbu-lent or nonlinear flow. A typical plot is shown inFigure A and a qualitative explanation of what may behappening downhole is offered for each distinct zone of
the curve.
A15.4t
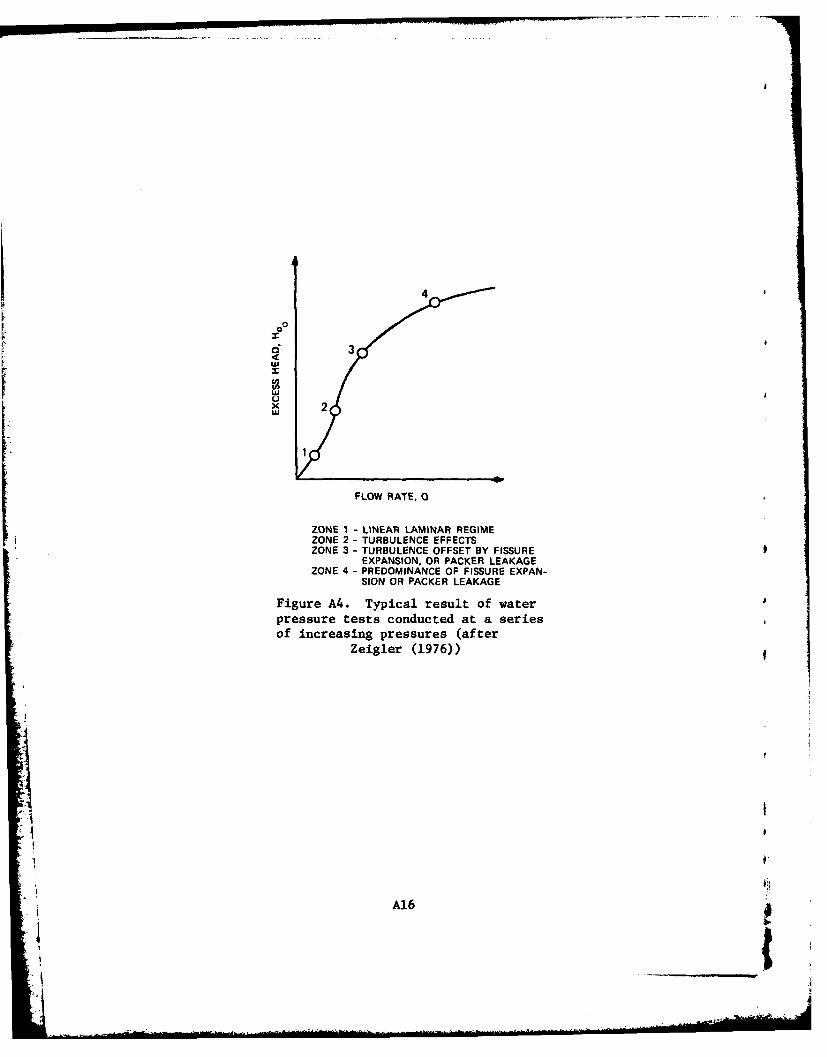
4
Ux
FLOW RATE, Q
ZONE I - LINEAR LAMINAR REGIMEZONE 2 - TURBULENCE EFFECTSZONE 3 - TURBULENCE OFFSET BY FISSURE
EXPANSION, OR PACKER LEAKAGEZONE 4 - PREDOMINANCE OF FISSURE EXPAN-
SION OR PACKER LEAKAGE
Figure A4. Typical result of waterpressure tests conducted at a seriesof increasing pressures (after
Zeigler (1976))
A16
M
(-.

Fi
In accordance with letter from DAEN-RDC, DAEN-ASI dated22 July 1977, Subject: Facsimile Catalog Cards forLaboratory Technical Publications, a facsimile catalogcard in Library of Congress MARC format is reproducedbelow.
Bennett, Robert D.
New pressure test for determining coefficientof permeability of rock masses / by Robert D. Bennett,Robert F. Anderson (Geotechnical Laboratory, U.S. ArmyEngineer Waterways Experiment Station). -- Vicksburg,Miss. : The Station ; Springfield, Va. : available fromNTIS, 1982.
41, 16 p., 4 p. of plates : ill. ; 27 cm. -- (Technicalreport : GL-82-3)
Cover title."July 1982."Final report."Prepared for Office, Chief of Engineers, U.S. Army
under Civil Works R& D Work Unit 31561."Bibliography: p. 40-41.
1. Boring. 2. Pressure. 3. Rocks--Permeability.I. Anderson, Robert F. II. United States. Army.Corps of Engineers. Office of the Chief of Engineers.III. U.S. Army Engineer Waterways Experiment Station.
Bennett, Robert D.New pressure test for determining coefficient : ... 1982.
(Card 2)
Geotechnical Laboratory. IV. Title V. Series:Technical report (U.S. Army Engineer Waterways ExperimentStation) ; GL-82-3.TA7.W34 no.GL-82-3
I
4!