A2A 2019 Investor Guidebook - Amazon S3
28
A2A 2019 Investor Guidebook June 2019
Transcript of A2A 2019 Investor Guidebook - Amazon S3

A2A 2019 Investor Guidebook
June 2019

REFERENCE TO MORE IN-DEPTH, UPDATES AND DOCUMENTS AVAILABLE IN A2A WEBSITE
THIS SYMBOL MARKS THE PAGES WHICH MAY BE SUBJECT TO UPDATES DURING THE YEAR
LEGENDA
THIS SYMBOL MARKS THE PAGES WHERE EXCEL DOWNLOADS ARE AVAILABLE ANNUAL AND QUARTERLY HISTORICAL SERIES AVAILABLE IN THE INVESTOR DATABOOK:HTTPS://WWW.A2A.EU/EN/INVESTORS/PUBLICATIONS-SERVICES/INVESTOR-GUIDEBOOK-KIT OR IN DEDICATED SECTIONS BY CLICKING ON THIS SYMBOL YOU WILL RETURN TO THE INDEX OF THE REFERENCE SECTION
DISCLAIMER - This document has been prepared by A2A solely for investors and analysts. This document does not constitute an offer or invitation to purchase or subscribe any shares or other securities and neither it nor any part of it shall form the basis of or be relied upon in connection with any contract orcommitment whatsoever. Some information contained herein and other material discussed at the meetings may include forward-looking information based on A2A’s current beliefs and expectations. These statements are based on current plans, estimates, projections, and projects and therefore you shouldnot place undue reliance on them. Forward-looking statements involve inherent risks and uncertainties. We caution you that a number of important factors could cause actual results to differ materially from those contained in any forward-looking statement. Such factors include, but are not limited to:changes in global economic business, changes in the price of certain commodities including electricity, gas and coal, the competitive market and regulatory factors. Moreover, forward-looking statements are current only at the date they are made.
A2A public documents used as sources: A2A Strategic Plan, 2018 Results & Business Plan Update; Company Annual Reports, AGM documents, Report on Corporate Governance, Report on Remuneration, Integrated Report
BY CLICKING ON THIS SYMBOL YOU WILL RETURN TO THE GENERAL INDEX
We have divided the Guidebook into the four main sections listed aside, where A2A equity story is unfolded.
The Guidebook has a spreadsheet back up - the Databook, to download for modelling purposes.
We would appreciate your feedback and suggestions to improve this product.
Please write to: [email protected]
Resources:
Databook in excel: this file is part of the Guidebook kit and contains annual and quarterly economic, financial and operational Company data as of 2008.
Additional information on A2A is available at www.a2a.eu . Share price information, Annual Reports and Interim Accounts, press releases and other relevant information can be found in the “Investors” section.
Welcome to A2A Investor Guidebook, prepared for investors and financial analysts to get a thorough insight into the A2A Group
Index
About A2A
Our Strategy
A2A Shareholders
slide 18 - 22
01
02
03
04
Our Responsibilities
slide 3 - 9
slide 10 - 17
slide 23 - 27
A2A AS AN INVESTMENT slide 28

3
A2A focussed geographical presence
Growth oriented multi-utility
About A2A01
A2A asset portfolio: first class asset base and size
ASSETS AND ACTIVITIES
Networks - regulatory framework
BENCHMARKING
More in-depth, updates and documents available in the following website sections:
A2A Group: www.a2a.eu/en/group/mission-values
Assets and Activities: https://www.a2a.eu/en/group/our-plantswww.a2a.eu/en/services
Major Transactions: www.a2a.eu/en/investors/strategy
Strategic Plan: www.a2a.eu/en/investors/presentations-conference
A2A Uniqueness - Integrated and balanced business mix
A2A well positioned in its main businesses
A2A GROUP

4
GENERATION2 GW hydro installed capacity
Ongoing M&A activities in PV Renewables
MARKETLeader for quality and customer satisfaction
Further expansion of the free market customer base
WASTE1st energy producer
from WTE plants
Ongoing developments in capex for
treatment plants
NETWORKS
Incumbent in the key areas
Successful participation in the first gas distribution
tender (Milano1)
BUSINESS UNIT MAIN FEATURES2018 MAIN ACHIEVEMENTS
Growth oriented multi-utility
A2A
LGH (2016)
ACSM-AGAM (2018)
A2A KEEPS CONSOLIDATING NEW TERRITORIES: ACSM-AGAM fully consolidated as of H2 2018
Integrated multi-business portfolio bringing a natural risk hedging and maximising cross-BU synergiesOur long –term path is rooted on Sustainability

5
A2A Uniqueness - Integrated and balanced business mix
2018Ordinary
EBITDA (1)
GENERATION MARKET WASTENETWORKS
NETWORKS HEAT
Merchant High Volatility
With Regulated itemsMerchant Low Volatility Mostly Quasi-Regulated Regulated Quasi-Regulated
359 €M 29% 187 €M 15% 269 €M 22% 323 €M 26% 84 €M 7%
Fuel sourcing
Electricity and gas sales• free market
• regulated marketCollection and street sweeping
Electricity distribution
Cogeneration heat recovery
and sales
Power generation (Thermoelectric
and RES)Public Lighting
Urban Waste Treatment Material Recovery
Electricity and Heat production
Gas distribution
HeatDistribution
Wholesale & TradingNew Energy Solutions
(Energy Efficiency, E-mobilityand Smart City)
Industrial Waste TreatmentIntegrated
Water Cycle
(1) Ordinary EBITDA including Acsm - Agam is equal to 1,222 €M, calculated as reported EBITDA (1,231 €M) net of non recurring items (39 €M) and Ordinary EBITDA from “Corporate” (-30 €M).
VALUE FROM ENDTO BEGINNING
MORE SOLUTIONSTO INVOLVE CUSTOMERS
SMARTER AND MORE RELIABLE
FLEXIBLE AND GREENER ENERGY
BU Risk Profile

6
PL
G
DHE G
W
G W
E G
E
DH
G
G DH
DH
DH
DH
G
G
PL
PL
PL
C
C
C
C
C
C
C
C
C
C
A2A focussed geographical presence
G
G
G
G
G
ITALY
LOMBARDY
WASTEWaste collectionTreatment plantsBiogas/Biomass plantsWaste-to-Energy
GENERATIONHydroelectric CCGT Coal Fuel Oil Solar
E
G
W
PL
C
DH
Technological partnerships abroad on waste treatment plants (UK, Spain and Greece)
NETWORKSElectricityGasWaterPublic Lighting
Cogen. & thermal plants Thermal solar plantsDistrict Heating
A2A operates throughout Italy, predominantly in Lombardy
G
DH
GG
G
W
GEG
G
GW

7
A2A asset portfolio: first class asset base and size
Including ACSM AGAM contribution

8
Regulatory framework
(1) VIRARERA: Asset residual value («valore industriale residuo») - as recognised by ARERA for tariffs purpose, is equal to the capital expenditure necessary to rebuild anew the assets, depreciated due to use and obsolescence (on the basis ofregulatory asset useful life). (2) The figure is calculated as the sum of cost of equity, cost of debt, gearing, recognized financial costs ("OF") and fiscal costs ("Ofisc") (3) only if there is a more than 20% deviation in the average spread between 10-year government bonds of Italy and Germany vs the previous period
ARERA is the Italian Regulatory Authority for Energy, Networks, and Waste. A2A regulated and quasi-regulated activities are the following:
ELECTRICITYNETWORKS
5th Tariff regulatory period: 2016-2023 (8 years)Tariff not linked to change in unit volumes consumption
• Shift from input-based to output-based model as of 2016 and Totex mechanism (optimisation of Opex and Capex) as of 2023
• WACC: in 2019-2021, 5.9% (distribution, metering); additional remuneration related to innovative projects and energy efficiency improvement
• Gradual approach to the extension of asset life
• Price cap: 1.9% (distribution), 1% (metering). The potential extra-efficiencies achieved in the 3rd and 4th regulatory periods are to be shared 50-50 with the consumer by 2019
WACC Reform (electricity and gas networks)
In December 2015 ARERA defined the WACC remuneration for the regulated energy networks, effective from 1 January 2016
The common parameters are set for gas and electricity, excluding those specific of each sector, such as beta and D/E
• WACC is real pre-tax allowed return• WACC regulatory period lasts 6 years (2016-2021)• The interim review is fixed every 3 years
(i.e. at the end of 2018 the WACC applicable in the period 2019-2021 will be set) for: Risk Free Rate; Country Risk Premium(3); Inflation used to calculate “F” factor; Gearing (value more in line with those used by other European regulators), Tax Rate according to the annual Stability Law
GASNETWORKS
4th Tariff Regulatory period: 2014-2019 (6 years)Tariff not linked to change in unit volumes consumption
• WACC: in 2019, 6.3% (distribution), 6.8% (metering) – WACC may be subject to review with the 5th Tariff Regulatory period, starting from 2020
• WACC is applied either to RAB or to VIR ARERA(1) - for new ATEM’s entrants (so-called "asymmetric regulation")
• Price cap: 1.7% for distribution and 0% for metering. Price cap reduced to 0% in the first 2 years of ATEM’s
INTEGRATED WATER CYCLE
2nd Regulatory period: 2016-2019 (4 years)
• Allowed revenues based on full recovery cost subject to efficiency and capped in terms of tariff growth
• Regulatory matrix with six different tariff schemes, linked to the need for new investments, the evolution of underlying costs due to consolidation or improvement in quality of service and Opex per capita
• Fixed annual maximum tariff increases - ranging from 5.5% to 9%, different for each of the six tariff schemes assigned at Local Authority Level (EGA)
• Overall return equal to 5.4%(2), with an additional 1% extra return for investments made from 2014
• X-factor equal to 0.5% to promote higher efficiency on internal Opex
• Interim review: RAB and variable costs (2 years); assumptions on financial costs and taxation can be modified every 2 years if there are "significant changes"
ARERA is set to regulate the integrated wastesector: urban waste collection, transport andtreatment. The first transitory regulatory periodshould start in 2020 and last for 4 years.
The District Heating business is not subject to tariffsetting, but it’s monitored by ARERA regardingconditions (technical and commercial), meteringand quality of service.DISTRICT
HEATING
WASTE

9
0
500
1,000
1,500
2,000
2,500
16,200
2,095
1,651
1,031 967 933 840
491
192 80
MAIN LISTED ITALIAN UTILITIES 2018 EBITDA(Source: A2A analysis on Company data)
A2A well positioned in its main businesses
GENERATIONMARKETWASTENETWORKSOTHER
€M
A2A position has been quite stableat the top
A2A: the most diversified utility, the highest EBITDA among local utilities
A2A MARKET POSITION(1)
(Sources: ARERA and Company data)
(1) 2018 figures include ACSM-AGAM volumes for H2’18
1,231

10
Dynamic M&A Track Record
Our Strategy02
PERFORMANCE
Commitment with Excellence and Community
Industry Trends and A2A industrial model
NEW STRATEGIC PLAN 2018-2023
More in-depth, updates and documents available in the following website sections:
Operating and Consolidated results: www.a2a.eu/en/investors/financial-reports
Strategy & Risk Management: www.a2a.eu/en/investors/strategy
Debt: www.a2a.eu/en/investors/debt
Key Financial Targets
Financial Strategy: Cost reduction and high duration
Bonds and EMTN Programme
DEBT
Business Operating Goals

11
Dynamic M&A Track Record
2014 2016 2017 2018 2019
Increased stakein Edipower (79.5%)
Composting plant of Sanitaria Group
16 photovoltaic plants from NovaPower
Gas & Power branch of X3 Energy
JV with TaleSun Energy Europe on photovoltaic development
SunCity Energy (REN)
75% of Consul System 18 photovoltaic plants from ReEnergyCapital
5 photovoltaic plants from Impax
51% of Linea Group Holding Increased stake in LumEnergia(90%)
100% of Rieco-Resmal Group Start-up Patavina Technologies (Internet of Things)
64% of La BI.CO due
Stake in Edipower (100%)
7.91% of Dolomiti Energia
Partial demerger of EdipowerS.p.A. (Udine hydro plants spun off, except from Ampezzo and Somplago plants)
Put Option exercised on 41.75% of EPCG (Montenegro)
AC
QU
ISIT
ION
SD
ISP
OSA
LS
SWA
P
SWA
P
Relevant shareholdings (31/12/18)
Stake (%) Book value (€M) Scope of consolidation
EPCG(1)18.7 109.0 Equity Method
LGH 51.0 109.4 Fully consolidated
ACSM-AGAM 41.3 190.6 Fully consolidated
Retragas 87.3 30.1 Fully consolidated
ASVT 74.6 10.8 Fully consolidated
(1) Book value equal to the residual NPV of the Put Option exercised by A2A in July 2017. Fully divested in 2019.

12
Industry Trends and A2A industrial model
• Landfill phase-out• Acceleration in sorted collection• Waste system balance and material
recovery
• Decarbonization• Energy democracy• Reduction of PV and wind LCOE
• Energy efficiency• Smart services to inhabitants and
digitalization (IoT)• Green mobility
a2a T
2019 2023
TTransformation
a2a E
2019 2023
EExcellence
a2a C
2019 2023
CCommunity
Business strengthening & change
agile organization,leader in operational excellence
attract and empower peopleengage external ecosystem
SustainabilityInspiring priciple of enterprise development
CIRCULAR ECONOMY
ENERGY TRANSITION
SMARTSOLUTIONS
• TEC framework confirmed • Lower-risk profile • Targets enhanced • Higher focus on sustainable businesses
• Improved and reliable
dividend policy
Further information on A2A strategy is available on the Group website at the following link:https://www.a2a.eu/en/investors/strategy#strategic
Year 2018 2023
PUN Base Load (€/MWh) 61.3 58.1
PUN Peak Load (€/MWh) 68.0 64.1
Clean Spark Spread (PSV) (€/MWh) -1.4 0.8
PSV (€/MWh) 24.2 20.0
CO2 EUA ETS (€/tonn)15.9 22.9

13
Business Operating Goals
GENERATION MARKET WASTE NETWORKS
+ 400 kt WTEs (up to 3.0 Mt) extended capacity
9 NEW waste treatment PLANTS
2.7 M CUSTOMERS Mass market free market power & gas
1,660+ CHARGING STATIONS
150+ MW OF NEW RES (up to ~280 MW, 2.2 GW including hydro)
REACTIVE POWER FOR GRID VOLTAGE REGULATION in Brindisi
35 PRIMARY STATIONS, supporting Milan and Brescia electrification
1.4+ M SMART METERS installed
• Further expansion of RES platform
• Conventional plant reconversion
• Leadership consolidation in flexible CCGTplants
• Match of growing need for peak capacity
• Exploration of innovativeflexibility services
GREENER PORTFOLIO
ADEQUACY & FLEXIBILITY PROVIDER
BUSINESS PLAN HIGHLIGHTS
CUSTOMER FOCUS
• Outstanding client service, with multi-channel customer experience
• Preservation of excellent operations
• VAS in safety, comfort, energy-saving
• Digitalization to enhance service/acquisition
BOOST IN NEW SERVICES
• New services: flexibility, DERs and storage
• New EPCs in energy efficiency services
• Organic growth in public lighting
• Expansion of electric mobility business
FROM WASTE TO COMMODITY
END-TO-END PARTNER FOR URBAN SERVICES
• Reinforce leadership in recycling, selling high-quality secondary raw materials
• New WTE capacity to maintain safety of the Italian waste treatment system
• Enlarging geographic presence, leveraging value chain integration
• Smart and innovative solutions for our territories
• Improve circularity with innovation
SMART GRID AND QUALITY IMPROVEMENT
GAS TENDERS
• Achieve smart and resilient networks
• Increase water cycle performance
• Multi-business operation synergies through automated and digital solutions
• Selective growth in high-priority ATEMs
• Focus on geographical consolidation
Total potential EBITDA from additional projects is between 200 and 300+ €M
KEY ACTIONS
582 402 943 1,963
2.2 GW 6.4 MT 2.6 €B
RES INSTALLED (incl. HYDRO) FREE MARKET CUSTOMERS WASTE TREATED ELECTRICITY AND GAS RAB
323 323 381 518
2.7 M
- 2.1% + 11.5% + 7.1% + 5.0%
(1) Ordinary EBITDA
A2A 2023 TARGETS (€M)
T
MAIN KPI @2023
CUMUL. CAPEX
2019-23
EBITDA(1)
@2023
CAGR
14
Commitment with Excellence and Community
NEW WORKING SPACES
INNOVATION WITH EXTERNAL ECOSYSTEM
LOCAL AGGREGATIONS
AGILE ORGANIZATION
DIGITAL & TECHNOLOGICAL INNOVATION
DE-RISKING
OPERATIONAL EXCELLENCE
MULTI-BUSINESS VALUE
C
E
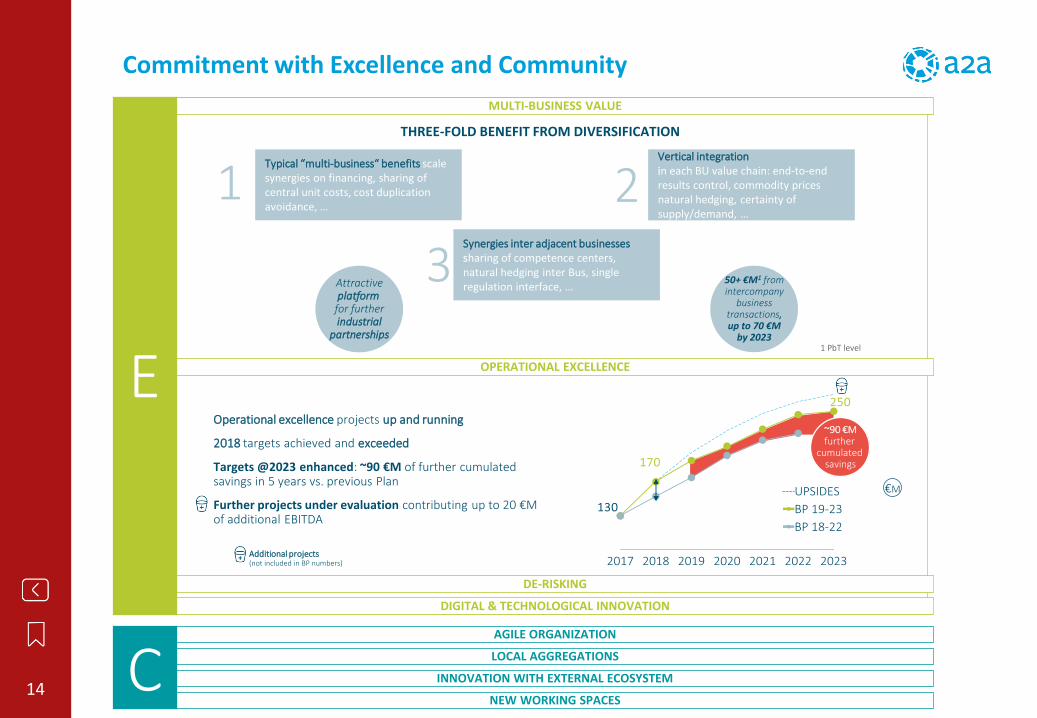
Typical “multi-business“ benefits scale synergies on financing, sharing of central unit costs, cost duplication avoidance, …
Vertical integration in each BU value chain: end-to-end results control, commodity prices natural hedging, certainty of supply/demand, …
THREE-FOLD BENEFIT FROM DIVERSIFICATION
Synergies inter adjacent businessessharing of competence centers, natural hedging inter Bus, single regulation interface, …
1 2
3 50+ €M1 fromintercompany
businesstransactions,up to 70 €M
by 2023
Attractiveplatform
for furtherindustrial
partnerships1 PbT level
Operational excellence projects up and running
2018 targets achieved and exceeded
Targets @2023 enhanced: ~90 €M of further cumulated savings in 5 years vs. previous Plan
Further projects under evaluation contributing up to 20 €M of additional EBITDA
Additional projects(not included in BP numbers)
€M
~90 €Mfurther
cumulated savings

15
Key Financial Targets
+116CAGR +6.1%
€M
1,155 - 1,185 €MEBITDA
300 - 330 €MNET INCOME
700 €M CAPEX
-200 €MNET FREE CASH FLOW
Including non recurring 25 €M
~
~
7.025%
2018
7.7523% 2019
8.026% 2020
min +5% yearlymin 26%
2021
2023
A2A DIVIDENDPER SHARE (€c)
FFO/NET DEBT
Improved dividend policywith lower-risk
business mix
2019 GUIDANCE DIVIDENDS
CASH FLOW GENERATION 2018-23
NET INCOME 2018-23
1,192
1,531CAGR +5.1%
EBITDA 2018-23
€M
BYBU
BYMIX
Merchant High VolatilityMerchant Low VolatilityQuasi RegulatedRegulated
NetworksWaste
MarketGeneration
Corporate & other
2.2x2.5x NFP/EBITDA
Note: "Maintenance" includes mandatory CAPEX
Development
Maintenance
Other
Market
M&A and RES
Waste
Gas tenders
Networks
Generation
CAPEX2019-23
€B €M
+339
-0.1

16
Financial Strategy: Cost reduction and high duration
DEBT BREAKDOWN BY INTEREST
BONDSLOANS
DEBT BREAKDOWN BY SOURCES
FIXED RATEVARIABLE RATE
81
STATISTICS RELATIVE TO DEBTAT 31/12/2018
• Total gross debt: 3.7 €Bn
• Average cost of debt: 3.0%
• Average maturity: 4.7 years
• 1.3 €Bn liquidity position, of which:
• 0.6 €Bn cash
• 0.7 €Bn undrawn committed lines and loans
CURRENT CORPORATE CREDIT RATING
STANDARD’S POOR’S MOODY’S
BBB/A-2Outlook Stable
Baa2Outlook Stable
LOCAL AND FOREIGN CURRENCY LT
SENIOR UNSECURED DEBT
BBB Baa2
%
19
26
74
%
FLEXIBILITY
FINANCIAL STRATEGY
provide the Company with the right instruments to take potential
market opportunities, in a prompt and efficient way
DIVERSIFICATIONoptimize financial sources
and assess/select at any time the most economical and/or
best available
LIQUIDITYmaintain an adequate liquidity
cushion in terms of cash and available committed lines to cover planned cash outlays and absorb
low-probability events
RISK MANAGEMENTmanage in a proactive way
the interest risk with the main purpose to mitigate the effects
of market volatility
GREEN FINANCINGSustainable credit lines
linked to ESG performance and specific business objectives
Green Financing Framework in accordance with the 2018 ICMA Green
Bond and Green Loan Principles
GROSS DEBT MATURITIES AS OF 31 DECEMBER 2018*
* Excluding ACSM AGAM contribution

17
Bonds and EMTN Programme
• On 1 March 2018 the Board of Directors of A2A approved a framework resolution authorising the issue of one or more unsubordinated, unsecured andnon-convertible notes, under the EMTN Programme, up to an aggregate amount of Euro 1 billion, by 30 April 2020
• The adoption of the EMTN is part of the A2A Group’s medium-term financial strategy, which is aimed at lengthening the average life of the Company’soutstanding debt and at maintaining an adequate financial flexibility in order to efficiently manage the future debt maturities, to support the Company’srating
• The bonds to be issued on the basis of the Programme are placed to institutional investors• Program amounts to 4 billion, of witch 1,438 million euro still available as of December 31, 2018• A2A believes that the issuance of Green Financing Instruments – that include Green Bond under A2A EMTN Programme – could contribute to fostering
the transition to a low-carbon economy, giving financial backing to the projects (existing or new ones) enabling this transition and with a positive impactin terms of sustainability.
(1) Date from which interest is paid; (2) Last date on which interest accrues; (3) The current bond rating – where applicable, is different from the issue rating and is equal to the M/L term rating assigned to the Company by S&P and Moody’s.
OUTSTANDING BONDS
Issuevolume (EUR)
Outstandingamount (EUR)
Annual coupon Issue date(1) Maturity date(2) Issue price Re-offer yield Rating(3)
Euro Bond 2027 300,000,000 300,000,000 1.625% 19/10/2017 19/10/2027 98.700 1.768%- S&P
- Moody’s
Euro Bond 2025 300,000,000 300,000,000 1.750% 25/02/2015 25/02/2025 99.221 1.836%- S&P
- Moody’s
Private Placement 2024 300,000,000 300,000,000 1.250% 16/03/2017 16/03/2024 99.774 1.284% - S&P's
Private Placement 2023 300,000,000 300,000,000 4.000% 04/12/2013 04/12/2023 99.539 4.057%Not
applicable
Euro Bond 2022 500,000,000 500,000,000 3.625% 13/12/2013 13/01/2022 99.561 3.688%- S&P
- Moody's
Euro Bond 2021 500,000,000 351,457,000 4.375% 10/07/2013 10/01/2021 99.323 4.487%- S&P
- Moody's
Euro Bond 2019 750,000,000 510,703,000 4.500% 23/11/2012 28/11/2019 99.718 4.548%- S&P
- Moody's

18
A2A Sustainability embedded in the Strategic Plan
A2A strong Commitment to Sustainability
Our Responsibilities03
SUSTAINABILITY
Effective governance model and diversified Board of Directors
CORPORATE GOVERNANCE
More in-depth, updates and documents available in the following website sections:
Sustainability: www.a2a.eu/en/sustainability
Corporate Governance: www.a2a.eu/en/governance_en
Investors: www.a2a.eu/en/investors/shares
www.a2a.eu/en/investors/publications-services/financial-calendar
Enterprise Risk Model supports management actions
RISK MANAGEMENT

19
A2A strong Commitment to Sustainability
STAKEHOLDER ENGAGEMENT
More than 460 initiatives involving external and internal stakeholders. The forumAscolto programme, the multistakeholder feedback initiative launched by A2A in 2015 aimed at understanding the needs of the communities where it operates, continued in 2018
Materiality Evaluation: A2A Group materiality matrix was updated with 21 issues that embrace the 6 Capitals and the Group's governance system.
IMPLEMENTATION
Circular Economy: Sustainably manage waste during its life cycle
Decarbonization: Contribute to achieving national and EU targets for the reduction of greenhouse gas emissions
Smart grid and services: Increase grid reliability through technological innovation
People Innovation: Actively contribute to the welfare of the community and the improvement of working conditions
CAPEX (€M) GENERATION & TRADING
NETWORKSAND HEAT
WASTE CORPORATE TOTAL
Emission reduction 10.4 6.7 19.2 - 36.3
Energy efficiency 2.0 2.4 29.0 4.3 37.7
Renewables 16.5 1.4 2.8 - 20.7
Innovation 0.2 0.4 17.4 0.8 18.8
Total 29.1 10.9 68.4 5.1 113.5
MONITORING AND REPORTING
A2A 2018 Integrated Report has been prepared in accordance with the Global Reporting Initiative (GRI) Standards and, for some indicators, it complies with GRI-G4 Electric Utilities Sector Supplement. The Report considers six forms of capital (Human, Financial, Relational, Intellectual, Manufacturing and Natural), in accordance with the International Integrated Reporting Council (IIRC) framework.
The Integrated Report is available on A2A website at the following link: The Integrated Report 2018. Sustainability KPIs are available in the Investor Databook
SUSTAINABILITY POLICY
Governance and Tools• Sustainability Policy• Territory and Sustainability Board Committee• Code of Ethics • Organisation, Management and Control Model (according to 231/01 Law)• Policy for Quality, Environment and Safety and Systems for their
Management• Risk Management for Sustainability
Four Pillars

20
GENERATION MARKET WASTE NETWORKS
• Set up of the Sustainability and Territory Committee
• 100% executives with sustainability MBOs (10% weight for the CEO/Managing Director)
• A2A adopts a prudent enterprise risk policy, whose purpose is to further develop and integrate risk management into the business process
% sorted collection
New recycling plants
Project on reduction/ reuse/recycle
Water network losses
Treated waste water
Digital users
# LED lighting points
EV charging stations
Contact centre quality
Smart bins Smart meter
Service interruption
Smart grid
GOVERNANCE
CO2 emissions reduction Energy efficiency projects
Green energy sold to Mass Market
Low-impact vehicles DH users
Dispersed heat recovery and DH non-fossil sources
Smart city projects
Banco dell’EnergiaRoadwork siteinspections
Reduction of the accident rate
Environmental education
CIRCULAR ECONOMY
DECARBONIZATION
SMART GRID AND SERVICES
PEOPLE INNOVATION
E
S
G
A2A Sustainability embedded in the Strategic Plan
361374
419
DECARBONIZATION
CO2 /kWh CARBON INTENSITY
640
392356
DIGITAL ENERGY BILL
ENERGY CUSTOMERS REGISTERED WITH THE BOLLETT@MAIL SERVICE
20%14%
n.a.
EQUAL OPPORTUNITIES
WOMEN IN POSITIONS OF RESPONSIBILITY% on total employees applicable
2017 2018 2023 2017 2018 2023 2017 2018 2023
Integration of Sustainability Plan and Financial BP @2023 in line with 2030 sustainability goals
g/kWh
K %
1,280
926888
2017 2018 2023
NEW PLANTS FOR MATERIAL RECOVERY
Kton
WASTE PLANTS FOR MATERIAL RECOVERY - INSTALLED CAPACITY

21
Enterprise Risk Model supports business
THE RISK MANAGEMENT MODEL – PROCESS AND ACTIVITIES
The methodology adopted is characterized by the following steps:1. Regular identification and updating of the risks to which the Group is exposed
2. Risk assessment process carried out through the involvement of all Group structures, risk owners and risk specialists, which includes:- update of risk scenarios (specific events in which risk can materialize) related to activities- risk scoring , based on the estimation of probability of occurrence and the impact on the Group (quali-quantitative measurement)- establishment of the relative controls and mitigation plans
3. Definition of risk priorities and risk reporting submitted to the top management for approval
4. Constant monitoring of mitigating actions progress, to check their effectiveness on risks mitigation and prevention
5. Balance sheet disclosure (“Bilancio Integrato” under the D.Lgs 254/2016 regulation)
OBJECTIVESThe main purpose of the Enterprise Risk Management process is to identify, measure, manage and monitor all the risks that might have a significant impact on the business objectives and to support the top management in being aware when taking that risks.
(1) This method follows the framework set by the Committee of Sponsoring Organizations of the Treadway Commission (CoSO report)
STRATEGICRisk generated by the strategic
choices of the Group
INTERNALRisk generated by the Group activities
DIRECTION OPERATIONAL HUMAN RESOURCESINFORMATION TECHNOLOGY
STRATEGIC AND BUSINESS PLAN INITIATIVES
INVESTMENTS AND DIVESTMENTS
ENVIRONMENTAL PROCUREMENT SECURITY COMPLIANCEBUSINESS INTERRUPTION
CUSTOMER SERVICE LEVEL
CREDIT COLLECTION PROCESSES
INTERNAL SKILLSHEALTH AND SAFETY
ICT INFRASTRUCTURE AND SECURITY
EXTERNAL Risk generated by the context in which the Group operates
COMPETITIVE ENVIRONMENT - REGULATORY NATURAL EVENTS FINANCIAL
CHANGES IN LAWS AND REGULATIONS
MACRO-ECONOMIC SITUATION
LEGAL DISPUTES
SOCIAL AND ENVIRONMENTAL CONTEXT
FISCAL AND TAX-RELATED
CLIMATE CHANGE
OTHER NATURAL EVENTS
COMMODITYINTEREST RATE
LIQUIDITY COUNTERPARTYDEFAULT AND COVENANT
RISK CATEGORIZATION
The A2A Group has adopted an Internal Control and Risk Management System, compliant with the Corporate Governance Code as updated by Consob in 2015. In thisframework, A2A Group has a risk assessment and reporting process which is based on the Enterprise Risk Management method(1) and on the best risk management practice.The model, has been operative since 2010 and, far from being a static reference, is subject to periodic revision according to the evolution of the Group and of the context inwhich it operates.

22
17
50
25
8
Committees
Position Members Executive Independent(1) Responsibilities
Control and Risks
Compensation and Appointment
Territory and Sustainability
Chairman GIOVANNI VALOTTI
Relationships with shareholders, institutions, authorities, and media; external relations; management of activities related to sustainability and social responsibility; preparation of proposals regarding non-recurring territorial consolidation transactions
Deputy Chairman STEFANIA BARIATTI
CEO and Managing Director
LUCA VALERIO CAMERANOCompany’s ordinary operations and for preparations of proposals regarding non-recurring transactions
Director GIAMBATTISTA BRIVIO
Director GIOVANNI COMBONI
Director ENRICO CORALI Internal Audit
Director LUIGI DE PAOLI Lead Independent Director
Director ALESSANDRO FRACASSI
Director MARIA CHIARA FRANCESCHETTI
Director GAUDIANA GIUSTI
Director DINA RAVERA
DIrector NORBERTO ROSINI
(1) As per Code of Self-Discipline by Borsa Italiana. All directors except from the Chairman and the Chief Executive Officer are independent as per Article 148 of theConsolidated Financial Act (T.U.F.); (2) The three Committees are pursuant to the guidelines defined by the “Corporate Governance Code” by Borsa Italiana; (3) All members areindependent as per Code of Self-Discipline by Borsa Italiana; (4) Include traditional governance costs.
Effective governance model and diversified Board of Directors
Board of Directors (2)
%
%
n.
67
33
6
1
5
AGE
GENDER
SENIORITY
41-5051-60
MEN
1-3 YEARS4-6 YEARS7-9 YEARS
Average: 59 years old
Board of Statutory Auditors(3)
GIACINTO SARUBBI (CHAIRMAN)MAURIZIO LEONARDO LOMBARDICHIARA SEGALA
Substitutes:SONIA FERRERO STEFANO MORRI
Remuneration Policy
61-70>71
WOMEN
Board of Directors Diversity
Current Board in charge until 2020 AGM
• for each member of the Board of Directors (80 €k) • for the Chairman of the Board of Statutory Auditors (130 €k) • and for the Effective Statutory Auditors (80 €k)• a fixed remuneration for the Chairman, the Deputy Chairman
and the CEO for their responsibilities• a variable short-term remuneration for the CEO related to
the achievement of the objectives assigned.

23
A2A is an Italian Blue Chip
Shareholding structure: institutional investors up
A2A Shareholders04
INVESTORS
Other Shareholder Information
Dividends on a growing trend since 2011
More in-depth, updates and documents available in the following website sections:
Investors:
https://www.a2a.eu/en/investors/shares/shareholding
www.a2a.eu/en/investors/shares
www.a2a.eu/en/investors/publications-services/financial-calendar

24
Shareholding structure: institutional investors up
(1) At December 31, 2018. Recent updates available at the following link.
Geographic breakdown of the institutional investors:
• USA 25.2%
• UK 18.2%
• Italy 11.3%
• France 11.3%
• Luxembourg 10.2%
• Germany 6.6%
Geographic breakdown of the retail investors:
• Italy 99.7%
• Foreign: 0.3%
59.3% of retail investors are in Lombardy, the region where historically A2Ahas been more active. Investors from the provinces of Milan and Brescia ownrespectively 27.1% and 13.7% of the total retail shareholding.
NUMBER OF SHAREHOLDERS: 72,279
A2A SHAREHOLDING STRUCTURE AT 31 DECEMBER 2018
• Share capital: 3,132,905,277 shares with a par value of 0.52 euro each
• Treasury shares: 23,721,421, equal to 0.76% of the share capital
All shares are voting shares, although - as laid down in art. 9 of by-laws - noindividual shareholder other than the Municipality of Milan and theMunicipality of Brescia may hold an equity interest exceeding 5% of theshare capital. Should such ceiling be exceeded, the voting right attached tothe shares held in excess of 5% of the share capital may not be exercised.
3-year Shareholding Pact between Brescia and Milan Municipalities wassigned on 1 February 2017. The Pact regards 42% of A2A share capital.
Shareholding Pact on 42%
The above-mentioned information derives from an internal analysis based on the shareholders register data - updated at 23 May 2018 (i.e., dividend payment date) and classified by the provider.
%
25
MUNICIPALITY OF BRESCIAMUNICIPALITY OF MILAN
TREASURY SHARESMARKET
25
49.2
0,8
Retail investors: 10.3% of the share capitalInstitutional investors: 37.1% of share capital

25
A2A vs FTSE MIB and EURO STOXX UTILITIES
• Market capitalisation at December 28, 2018: € 4,926 m
• Average capitalisation: € 4,763 m
• Average volumes: 9,807,945
• Average price: 1.520 €/share
• Maximum price: 1.687 €/share
• Minimum price: 1.392 €/share
• Number of shares: 3,132,905,277
A2A stock is also traded on the following platforms: Aquis, BATS, Blockmatch, Chi-X, Equiduct, ITG Posit, Liquidnet, Sigma-X, Turquoise, UBS MTF.
IndicesA2A 2018 figures (Borsa Italiana)
Moreover, A2A has been included in the Ethibel Excellence Investment Register and in the EthibelPioneer Investment Register.
Tickers: Bloomberg – A2A:IMReuters – A2.MI
A2A is an Italian Blue Chip
A2A in 201829 December 2017=100
80
85
90
95
100
105
110
115
120 A2A
FTSE MIB
EURO STOXX UTILITIES
0
10,000,000
20,000,000
30,000,000
40,000,000
50,000,000
60,000,000
1.10
1.20
1.30
1.40
1.50
1.60
1.70
1.80
Vo
lum
es
€/s
har
e
Volume (right-hand scale) Price
A2A forms part of the following indices
Ethical Indices
FTSE MIBSTOXX EuropeEURO STOXXMSCI Europe Small CapWisdomTree InternationalS&P Global Mid Small Cap
FTSE4GOOD IndexECPI IndicesEthibel Sustainability Index Excellence EuropeEuro STOXX Sustainability IndexEuronext Vigeo Index: Eurozone 120Standard Ethics Italian Index

26
Dividends on a growing trend since 2011
With reference to year 2018, the Shareholders' Meeting approved the distribution of an ordinary dividend of 0.070euros for each ordinary share in circulation (corresponding to paid dividends of approximately 218 million euros), morethan 21% up compared to the previous year, entirely taken from 2018 A2A S.p.A. net income.
Dividend Policy
The 2019 - 2023 Strategic Plan confirms a dividend policy basedon sustainable growth (DPS at 7.75 euro cents in 2019, 8.0in 2020, with minimum growth in the following years equal to 5%per year).
Dividend taxation
Dividends no longer attract any tax credit and, depending on whothe recipient is, they may be subject to withholding tax at source or,in part, contribute towards taxable income.
(1) Dividend Yield calculated on annual average share price (2) Pay-out calculated on ordinary income (net of non-recurrent items)

27
Other Shareholder information
SHAREHOLDERS’ MEETINGSAs laid down in A2A by-laws, the company holds one compulsory Shareholders’ General Meeting per year. The Annual General Meeting is called by the Board of Directors within 120 days (or 180 days under certain circumstances) of the end of the fiscal year. With reference to the procedures for the AGM call, please refer to A2A By-laws and Corporate Governance section of the company website (i.e., Shareholders’ Meetings). This section also contains all relevant documents for the AGM.
AMERICAN DEPOSITARY RECEIPTSA2A American Depositary Receipts (ADRs) are traded on the US Over The Counter market (OTC) under the symbol AEMMY. Three unsponsored ADR programs were launched by Deutsche Bank (2008), BNY Mellon (2008) and Citibank (2014) respectively. In all cases, one ADR represents five A2A ordinary shares. Further details are available at websites www.adr.com and www.sec.gov
DOCUMENTATIONAll the Group documents mentioned in this Guidebook are available on A2A website.They may also be obtained, on request, from the Company Secretary at the company’s registered office or through e-mail at [email protected].
A2A INVESTOR RELATIONS GUIDELINESMain goal: promote and support the correct knowledge and valuation of the A2A stock by the financial community, through a communication which is active, transparent, well-timed, constant, correct and not discriminatory. In order to achieve this goal, the IR Department supports A2A top management in the constant monitoring of the expectations of the financial markets on the Group performance.
Core activities: • hold regular meetings (one-to-one and group) with the financial community in Italy and
abroad; engage with the main proxy agencies
• arrange conference calls with the management at the time of the release of the Group results
• organize International roadshows with the top management for the presentation of important strategic developments
Blackout period: prior to a public release of financial results, the top management is not available for meetings concerning the financial performance that will be disclosed. The length of this black-out period is to be considered around two weeks approximately.
The answers to investors and analysts can only deal with issues related to the IR activity and, concerning A2A share, the IR department can only refer to public information available on the company website in particular to the documents released on the website in compliance with legal provisions.The IR department is not in charge neither of comments about A2A performance in the Stock Exchange, nor of financial advice about the investment in A2A.
PURCHASE AND DISPOSAL OF TREASURY SHARES: MAIN POINTS
The 2019 Shareholders’ General Meeting authorized the Board of Directors to conduct treasury share purchase and disposal transactions to the extent to which such authority has not been exercised after 2017 AGM:
• the maximum number of treasury shares that can be held is 313,290,527, which is equal to one-tenth of the shares making up the share capital, considering the shares already owned by A2A S.p.A. and by its subsidiaries;
• treasury share purchases and disposals will be conducted to pursue, in the interest of the Company and in respect of the principle of equal treatment of shareholders and of current applicable regulations, objectives such as transactions related to business projects consistent with the strategies that the Company intends to pursue, in relation to which the opportunity for share exchanges may be manifested;
• The authorization to purchase and dispose of the shares will have a term of validity of 18 months starting on the date of the Meeting resolution
A2A treasury shares were equal to 0.7572% of the share capital at 31 December 2018
A dividend relating to the financial year 2018 was paid on 22 May 2019 (ex-dividenddate 20 May 2019, record date 21 May 2019).

SHAPING THE FUTURE TODAY
VALUE GROWTH SUSTAINABILITY DIVIDENDSVALUE FROM ASSET
QUALITY, DIVERSIFICATION, AND
SYNERGIES
DISCIPLINED GROWTH OPEN TO SECTOR
DYNAMICS
FOCUS ON
AS A KEY PILLAR