A Voxel-Based Morphometric Study of Ageing in 465...
16
A Voxel-Based Morphometric Study of Ageing in 465 Normal Adult Human Brains Catriona D. Good,* Ingrid S. Johnsrude,² John Ashburner,* Richard N. A. Henson,* , ‡ Karl J. Friston,* and Richard S. J. Frackowiak* *Wellcome Department of Cognitive Neurology, Institute of Neurology, Queen Square, London; ²Now at MRC Cognition and Brain Sciences Unit, 15 Chaucer Road, Cambridge; and ‡Institute of Cognitive Neuroscience, University College London, 17, Queen Square, London WC1N 3BG United Kingdom Received September 26, 2000; published online May 11, 2001 Voxel-based-morphometry (VBM) is a whole-brain, unbiased technique for characterizing regional cere- bral volume and tissue concentration differences in structural magnetic resonance images. We describe an optimized method of VBM to examine the effects of age on grey and white matter and CSF in 465 normal adults. Global grey matter volume decreased linearly with age, with a significantly steeper decline in males. Local areas of accelerated loss were observed bilater- ally in the insula, superior parietal gyri, central sulci, and cingulate sulci. Areas exhibiting little or no age effect (relative preservation) were noted in the amyg- dala, hippocampi, and entorhinal cortex. Global white matter did not decline with age, but local areas of relative accelerated loss and preservation were seen. There was no interaction of age with sex for regionally specific effects. These results corroborate previous re- ports and indicate that VBM is a useful technique for studying structural brain correlates of ageing through life in humans. © 2001 Academic Press Key Words: ageing; normal; MRI; voxel based mor- phometry. INTRODUCTION There is compelling evidence from post mortem and in vivo studies that the brain shrinks with age, but accurate quantification of the specific patterns of age- related atrophy has proved elusive. It is unclear whether there are predictable common patterns of age- ing or whether individual human brains respond to the ageing process idiosyncratically. Postmortem analysis of mammalian brains suggest that there may be a gradient of ageing from the association areas to the primary sensory regions, with the former showing the most prominent correlations between age and atrophy (Flood and Coleman, 1988). Many postmortem and in vivo brain imaging studies have addressed the ageing issue, but many of these are limited by methodological constraints such as small sample size. Postmortem analyses of brain structure depend on factors such as the interval between death and fixation, the timing of measurements (Last and Tompsett, 1953; Messert, 1972; Miller et al., 1980), and the inclusion or exclusion of brain stem structures and meninges (which can be difficult to control), and hence vary across studies. Fur- thermore, if brain weight is related to body height, the progressive increase in height over the past century may limit the applicability of conclusions from the sig- nificant fraction of postmortem studies that were con- ducted in the last century (Miller and Corsellis, 1977). A number of in vivo imaging studies have attempted to quantify age-related change in whole brain volume, grey matter, white matter and CSF compartments, using CT, 2-D MRI, and more recently high resolution MRI morphometry. Apart from the more obvious limi- tations of small cohort studies and earlier imaging techniques (Schwartz, 1985), as well as variability in reporting absolute or fractional volumes, the majority of these studies have been based on manual or semi- automated region of interest guided measurements (Raz et al., 1997; Filipek et al., 1994; Pfefferbaum et al., 1994; Luft et al., 1999; Xu et al., 2000), which may be inherently biased. This bias is introduced by the small number of regions and metrics used in classical mor- phometrics that are insensitive to changes elsewhere in the brain. A number of unbiased whole brain tech- niques are emerging due to the improved resolution of structural MRI scans and the development of sophisti- cated image processing tools: The simplest methods apply rigid body registration within subject, e.g., Fox and Freeborough (1996), compared age-related changes over 1 year in a small group of patients with Alzheimer’s disease and controls using a semiauto- mated rigid body coregistration technique, and subse- quently they showed little change in nine elderly con- trols over 1 year using a fluid registration technique (Freeborough and Fox, 1998). Guttmann et al. (1998) used a fully automated segmentation technique to NeuroImage 14, 21–36 (2001) doi:10.1006/nimg.2001.0786, available online at http://www.idealibrary.com on 21 1053-8119/01 $35.00 Copyright © 2001 by Academic Press All rights of reproduction in any form reserved.
Transcript of A Voxel-Based Morphometric Study of Ageing in 465...

i
NeuroImage 14, 21–36 (2001)doi:10.1006/nimg.2001.0786, available online at http://www.idealibrary.com on
A Voxel-Based Morphometric Study of Ageingin 465 Normal Adult Human Brains
Catriona D. Good,* Ingrid S. Johnsrude,† John Ashburner,* Richard N. A. Henson,*,‡Karl J. Friston,* and Richard S. J. Frackowiak*
*Wellcome Department of Cognitive Neurology, Institute of Neurology, Queen Square, London; †Now at MRC Cognitionand Brain Sciences Unit, 15 Chaucer Road, Cambridge; and ‡Institute of Cognitive Neuroscience,
University College London, 17, Queen Square, London WC1N 3BG United Kingdom
Received September 26, 2000; published online May 11, 2001
1inpinscaacAmqt(u
Voxel-based-morphometry (VBM) is a whole-brain,unbiased technique for characterizing regional cere-bral volume and tissue concentration differences instructural magnetic resonance images. We describe anoptimized method of VBM to examine the effects of ageon grey and white matter and CSF in 465 normaladults. Global grey matter volume decreased linearlywith age, with a significantly steeper decline in males.Local areas of accelerated loss were observed bilater-ally in the insula, superior parietal gyri, central sulci,and cingulate sulci. Areas exhibiting little or no ageeffect (relative preservation) were noted in the amyg-dala, hippocampi, and entorhinal cortex. Global whitematter did not decline with age, but local areas ofrelative accelerated loss and preservation were seen.There was no interaction of age with sex for regionallyspecific effects. These results corroborate previous re-ports and indicate that VBM is a useful technique forstudying structural brain correlates of ageing throughlife in humans. © 2001 Academic Press
Key Words: ageing; normal; MRI; voxel based mor-phometry.
INTRODUCTION
There is compelling evidence from post mortem andin vivo studies that the brain shrinks with age, butaccurate quantification of the specific patterns of age-related atrophy has proved elusive. It is unclearwhether there are predictable common patterns of age-ing or whether individual human brains respond to theageing process idiosyncratically. Postmortem analysisof mammalian brains suggest that there may be agradient of ageing from the association areas to theprimary sensory regions, with the former showing themost prominent correlations between age and atrophy(Flood and Coleman, 1988). Many postmortem and invivo brain imaging studies have addressed the ageingssue, but many of these are limited by methodological
21
constraints such as small sample size. Postmortemanalyses of brain structure depend on factors such asthe interval between death and fixation, the timing ofmeasurements (Last and Tompsett, 1953; Messert,1972; Miller et al., 1980), and the inclusion or exclusionof brain stem structures and meninges (which can bedifficult to control), and hence vary across studies. Fur-thermore, if brain weight is related to body height, theprogressive increase in height over the past centurymay limit the applicability of conclusions from the sig-nificant fraction of postmortem studies that were con-ducted in the last century (Miller and Corsellis, 1977).A number of in vivo imaging studies have attempted toquantify age-related change in whole brain volume,grey matter, white matter and CSF compartments,using CT, 2-D MRI, and more recently high resolutionMRI morphometry. Apart from the more obvious limi-tations of small cohort studies and earlier imagingtechniques (Schwartz, 1985), as well as variability inreporting absolute or fractional volumes, the majorityof these studies have been based on manual or semi-automated region of interest guided measurements(Raz et al., 1997; Filipek et al., 1994; Pfefferbaum et al.,994; Luft et al., 1999; Xu et al., 2000), which may benherently biased. This bias is introduced by the smallumber of regions and metrics used in classical mor-hometrics that are insensitive to changes elsewheren the brain. A number of unbiased whole brain tech-iques are emerging due to the improved resolution oftructural MRI scans and the development of sophisti-ated image processing tools: The simplest methodspply rigid body registration within subject, e.g., Foxnd Freeborough (1996), compared age-relatedhanges over 1 year in a small group of patients withlzheimer’s disease and controls using a semiauto-ated rigid body coregistration technique, and subse-
uently they showed little change in nine elderly con-rols over 1 year using a fluid registration techniqueFreeborough and Fox, 1998). Guttmann et al. (1998)sed a fully automated segmentation technique to
1053-8119/01 $35.00Copyright © 2001 by Academic Press
All rights of reproduction in any form reserved.

D
aaae
masm
goifcCTigjtmf
22 GOOD ET AL.
evaluate the effects of age on tissue compartments, butprovided no information with regional specificitywithin these compartments. More complex models arerequired to register images from larger cohorts into acommon stereotactic space using linear or nonlinearforms of spatial normalization enabling region by re-gion comparisons. For example, voxel-based morphom-etry (VBM) allows a voxel-wise comparison of spatiallynormalized images, deformation-based morphometry(DBM) and tensor-based morphometry (TBM) use thedeformation fields derived from spatial normalizationto make comparisons. The former to identify differ-ences in relative positions of brain structures and thelatter to detect local shape differences. There is a largebody of literature on various forms of such methods(e.g., Ashburner et al., 1998; Christensen et al., 1997;
avatzikos et al., 1996, 1998; Guimond et al., 2000;Thompson, 1997), but as yet ageing data is not avail-able from large subject groups.
Recently Resnick et al. (2000) showed cross sectionaland 1 year longitudinal age changes in a relativelylarge group (n 5 116) of elderly subjects using a semi-utomated brain extraction technique followed by fullyutomated segmentation, nonlinear normalization andutomatically determined Talairach “boxels” of inter-st.The great variety in morphometry methodologiesay in part explain the conflicting literature on linear
nd nonlinear patterns of tissue change, the effect ofex and the heterogeneic response of various compart-ents of the brain to ageing.In this cross sectional study of a relatively large
roup of normal adults (n 5 465), we applied VBM inrder to characterize and quantify age-related changen the human brain on a voxel-by-voxel basis. Thisacilitates not only the assessment of separate brainompartments, namely grey and white matter andSF, but also subregions within these compartments.he standard (simple) technique of VBM has been used
n a number of studies with relatively small subjectroups. In this study with a substantially larger sub-ect group we reveal potential problems of the standardechnique and the need for further improvements toinimise error while maximizing sensitivity. The dif-
erences between the standard (Wright et al., 1995;Ashburner and Friston, 2000) and optimized methodswill be highlighted in the methods section.
METHODS
Subjects
Approval for the study was obtained from the jointethics committee of the National Hospital for Neurol-ogy and Neurosurgery and the Institute of Neurology,UCL. The study group was selected from a populationof 1761 normal volunteers who responded to advertise-ments and were scanned at the Wellcome Department
of Cognitive Neurology between February 1998 andDecember 1999. All subjects with any neurological,medical, psychiatric condition, or migraine were ex-cluded. Inclusion criteria included: (1) Normal MRIbrain as determined by an experienced neuroradiolo-gist (CDG). Any MRI scans with structural abnormal-ities, prominent normal variants (e.g., mega cisternamagna, cavum septum pellucidum) or technical arte-facts were excluded; (2) no history of alcohol intake ofmore than 30 units/week or intake of more than 10units within 48 h prior to scanning (a unit of alcohol isequal to 10 ml of pure alcohol and is roughly equivalentto a glass of wine (125 ml) or a single measure of spirits(25 ml); (3) no history of severe head trauma requiringmedical attention; (4) no history of cognitive difficul-ties; (5) no history of treated hypertension. 465 subjectsmet all the inclusion criteria. They comprised 29 left-handed females (aged 18–75, median 31), 171 right-handed females (aged 18–79, median 28), 38 left-handed males (aged 20–59, median 33), and 227 right-handed males (aged 17–67, median 26).
Structural MRI Scanning Protocol
Magnetic resonance imaging was performed on a 2Tesla Siemens MAGNETOM Vision scanner. A 3-Dstructural MRI was acquired on each subject using aT-1-weighted MPRAGE sequence (TR/TE/TI/NEX 9.7/4/600/1, flip angle 12°, matrix size 256 3 192, FOV256 3 192, yielding 120 sagittal slices and a slicethickness of 1.5 mm with in-plane resolution of 1 3 1mm.
Data Analysis
Data were analyzed on a Sun Ultra 60 workstation(Sun Microsystems, Mountain View, CA) using MAT-LAB 5.3 (MathWorks, Natick, MA) and SPM 99 (Well-come Dept. Cogn. Neurol, London; http://www.fil.ion.ucl.ac.uk/spm) (Friston et al., 1995a).
Preprocessing of Structural Data
In this section we first describe the standard methodof VBM which we used initially for grey and whitematter and CSF preprocessing and for the creation oftemplates. We then highlight the need for an optimizedmethod, and finally we describe the various steps of theoptimized method for grey and white matter.
Before preprocessing, all the structural images werechecked for artefacts and the center point was placedon the anterior commissure.
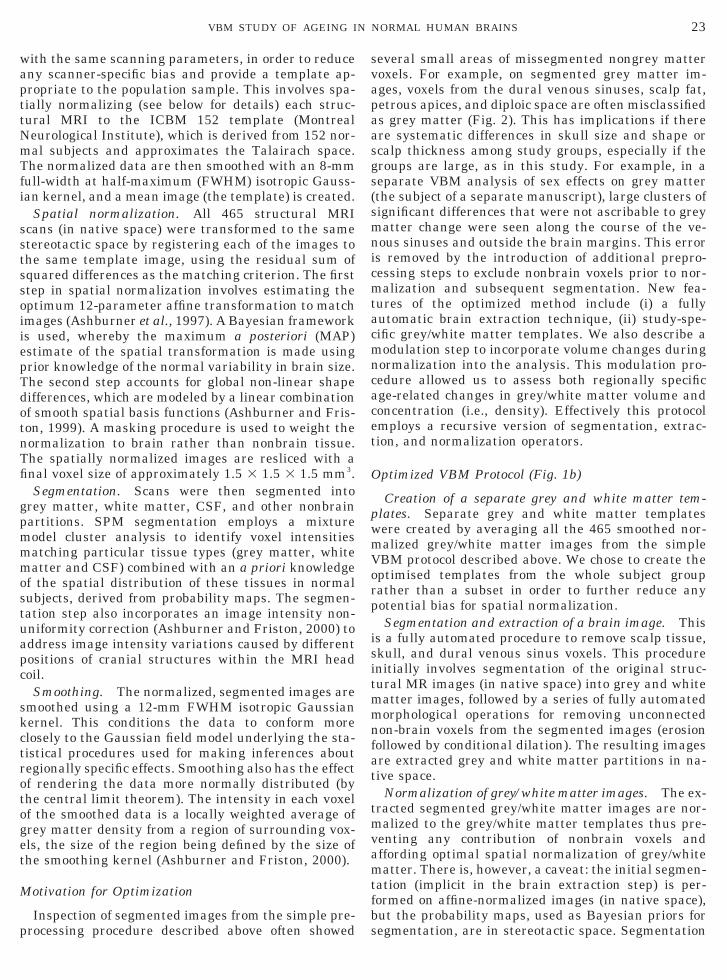
Standard VBM Protocol (Fig. 1a)
Template creation. First, an anatomical templatewas created from a subgroup of 120 normal subjects (60females and 60 males matched for age and handed-ness), with a mean age and age range matched to theentire study group imaged on the same MRI scanner
23VBM STUDY OF AGEING IN NORMAL HUMAN BRAINS
with the same scanning parameters, in order to reduceany scanner-specific bias and provide a template ap-propriate to the population sample. This involves spa-tially normalizing (see below for details) each struc-tural MRI to the ICBM 152 template (MontrealNeurological Institute), which is derived from 152 nor-mal subjects and approximates the Talairach space.The normalized data are then smoothed with an 8-mmfull-width at half-maximum (FWHM) isotropic Gauss-ian kernel, and a mean image (the template) is created.
Spatial normalization. All 465 structural MRIscans (in native space) were transformed to the samestereotactic space by registering each of the images tothe same template image, using the residual sum ofsquared differences as the matching criterion. The firststep in spatial normalization involves estimating theoptimum 12-parameter affine transformation to matchimages (Ashburner et al., 1997). A Bayesian frameworkis used, whereby the maximum a posteriori (MAP)estimate of the spatial transformation is made usingprior knowledge of the normal variability in brain size.The second step accounts for global non-linear shapedifferences, which are modeled by a linear combinationof smooth spatial basis functions (Ashburner and Fris-ton, 1999). A masking procedure is used to weight thenormalization to brain rather than nonbrain tissue.The spatially normalized images are resliced with afinal voxel size of approximately 1.5 3 1.5 3 1.5 mm3.
Segmentation. Scans were then segmented intogrey matter, white matter, CSF, and other nonbrainpartitions. SPM segmentation employs a mixturemodel cluster analysis to identify voxel intensitiesmatching particular tissue types (grey matter, whitematter and CSF) combined with an a priori knowledgeof the spatial distribution of these tissues in normalsubjects, derived from probability maps. The segmen-tation step also incorporates an image intensity non-uniformity correction (Ashburner and Friston, 2000) toaddress image intensity variations caused by differentpositions of cranial structures within the MRI headcoil.
Smoothing. The normalized, segmented images aresmoothed using a 12-mm FWHM isotropic Gaussiankernel. This conditions the data to conform moreclosely to the Gaussian field model underlying the sta-tistical procedures used for making inferences aboutregionally specific effects. Smoothing also has the effectof rendering the data more normally distributed (bythe central limit theorem). The intensity in each voxelof the smoothed data is a locally weighted average ofgrey matter density from a region of surrounding vox-els, the size of the region being defined by the size ofthe smoothing kernel (Ashburner and Friston, 2000).
Motivation for Optimization
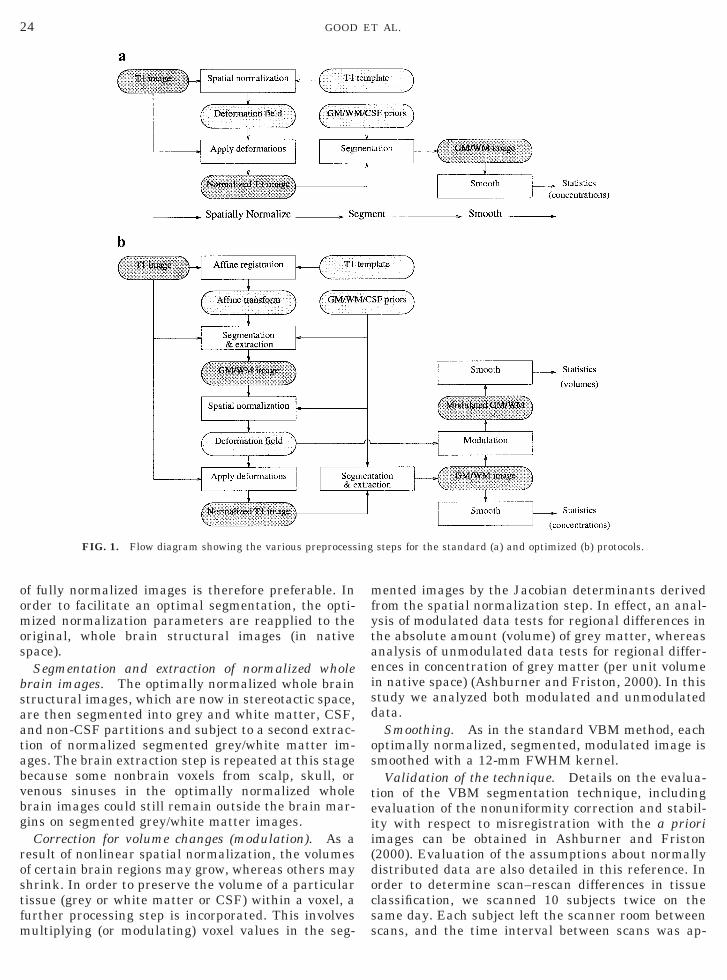
Inspection of segmented images from the simple pre-processing procedure described above often showed
several small areas of missegmented nongrey mattervoxels. For example, on segmented grey matter im-ages, voxels from the dural venous sinuses, scalp fat,petrous apices, and diploic space are often misclassifiedas grey matter (Fig. 2). This has implications if thereare systematic differences in skull size and shape orscalp thickness among study groups, especially if thegroups are large, as in this study. For example, in aseparate VBM analysis of sex effects on grey matter(the subject of a separate manuscript), large clusters ofsignificant differences that were not ascribable to greymatter change were seen along the course of the ve-nous sinuses and outside the brain margins. This erroris removed by the introduction of additional prepro-cessing steps to exclude nonbrain voxels prior to nor-malization and subsequent segmentation. New fea-tures of the optimized method include (i) a fullyautomatic brain extraction technique, (ii) study-spe-cific grey/white matter templates. We also describe amodulation step to incorporate volume changes duringnormalization into the analysis. This modulation pro-cedure allowed us to assess both regionally specificage-related changes in grey/white matter volume andconcentration (i.e., density). Effectively this protocolemploys a recursive version of segmentation, extrac-tion, and normalization operators.
Optimized VBM Protocol (Fig. 1b)
Creation of a separate grey and white matter tem-plates. Separate grey and white matter templateswere created by averaging all the 465 smoothed nor-malized grey/white matter images from the simpleVBM protocol described above. We chose to create theoptimised templates from the whole subject grouprather than a subset in order to further reduce anypotential bias for spatial normalization.
Segmentation and extraction of a brain image. Thisis a fully automated procedure to remove scalp tissue,skull, and dural venous sinus voxels. This procedureinitially involves segmentation of the original struc-tural MR images (in native space) into grey and whitematter images, followed by a series of fully automatedmorphological operations for removing unconnectednon-brain voxels from the segmented images (erosionfollowed by conditional dilation). The resulting imagesare extracted grey and white matter partitions in na-tive space.
Normalization of grey/white matter images. The ex-tracted segmented grey/white matter images are nor-malized to the grey/white matter templates thus pre-venting any contribution of nonbrain voxels andaffording optimal spatial normalization of grey/whitematter. There is, however, a caveat: the initial segmen-tation (implicit in the brain extraction step) is per-formed on affine-normalized images (in native space),but the probability maps, used as Bayesian priors forsegmentation, are in stereotactic space. Segmentation
24 GOOD ET AL.
of fully normalized images is therefore preferable. Inorder to facilitate an optimal segmentation, the opti-mized normalization parameters are reapplied to theoriginal, whole brain structural images (in nativespace).
Segmentation and extraction of normalized wholebrain images. The optimally normalized whole brainstructural images, which are now in stereotactic space,are then segmented into grey and white matter, CSF,and non-CSF partitions and subject to a second extrac-tion of normalized segmented grey/white matter im-ages. The brain extraction step is repeated at this stagebecause some nonbrain voxels from scalp, skull, orvenous sinuses in the optimally normalized wholebrain images could still remain outside the brain mar-gins on segmented grey/white matter images.
Correction for volume changes (modulation). As aresult of nonlinear spatial normalization, the volumesof certain brain regions may grow, whereas others mayshrink. In order to preserve the volume of a particulartissue (grey or white matter or CSF) within a voxel, afurther processing step is incorporated. This involvesmultiplying (or modulating) voxel values in the seg-
FIG. 1. Flow diagram showing the various preprocess
mented images by the Jacobian determinants derivedfrom the spatial normalization step. In effect, an anal-ysis of modulated data tests for regional differences inthe absolute amount (volume) of grey matter, whereasanalysis of unmodulated data tests for regional differ-ences in concentration of grey matter (per unit volumein native space) (Ashburner and Friston, 2000). In thisstudy we analyzed both modulated and unmodulateddata.
Smoothing. As in the standard VBM method, eachoptimally normalized, segmented, modulated image issmoothed with a 12-mm FWHM kernel.
Validation of the technique. Details on the evalua-tion of the VBM segmentation technique, includingevaluation of the nonuniformity correction and stabil-ity with respect to misregistration with the a prioriimages can be obtained in Ashburner and Friston(2000). Evaluation of the assumptions about normallydistributed data are also detailed in this reference. Inorder to determine scan–rescan differences in tissueclassification, we scanned 10 subjects twice on thesame day. Each subject left the scanner room betweenscans, and the time interval between scans was ap-
steps for the standard (a) and optimized (b) protocols.
ing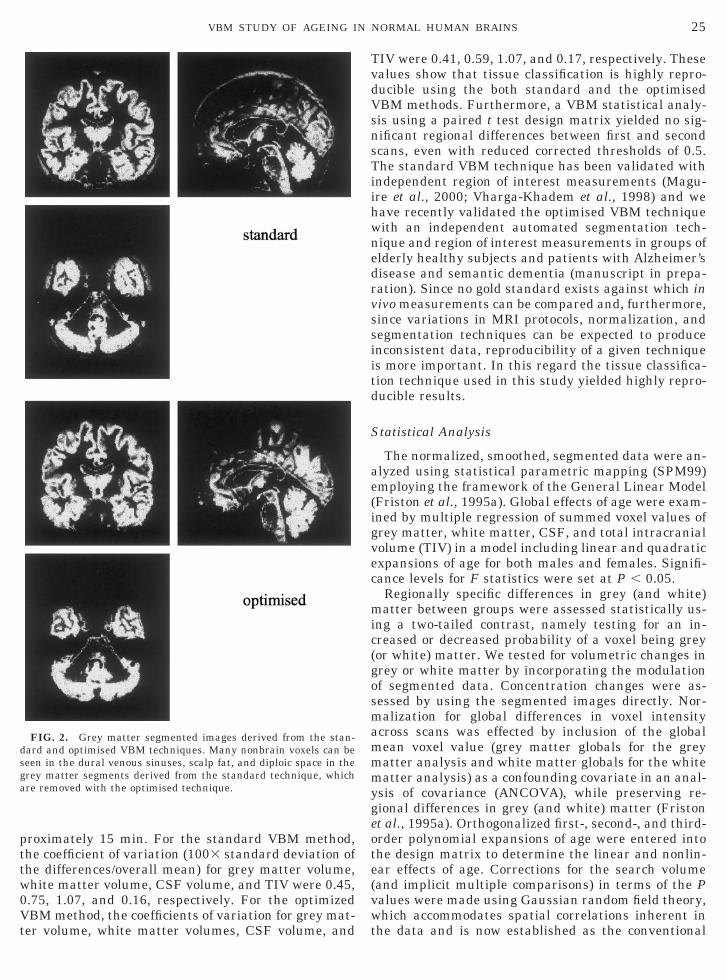
hwnedr
igvec
mic(gosmammmygeote(vwt
25VBM STUDY OF AGEING IN NORMAL HUMAN BRAINS
proximately 15 min. For the standard VBM method,the coefficient of variation (1003 standard deviation ofthe differences/overall mean) for grey matter volume,white matter volume, CSF volume, and TIV were 0.45,0.75, 1.07, and 0.16, respectively. For the optimizedVBM method, the coefficients of variation for grey mat-ter volume, white matter volumes, CSF volume, and
FIG. 2. Grey matter segmented images derived from the stan-dard and optimised VBM techniques. Many nonbrain voxels can beseen in the dural venous sinuses, scalp fat, and diploic space in thegrey matter segments derived from the standard technique, whichare removed with the optimised technique.
TIV were 0.41, 0.59, 1.07, and 0.17, respectively. Thesevalues show that tissue classification is highly repro-ducible using the both standard and the optimisedVBM methods. Furthermore, a VBM statistical analy-sis using a paired t test design matrix yielded no sig-nificant regional differences between first and secondscans, even with reduced corrected thresholds of 0.5.The standard VBM technique has been validated withindependent region of interest measurements (Magu-ire et al., 2000; Vharga-Khadem et al., 1998) and we
ave recently validated the optimised VBM techniqueith an independent automated segmentation tech-ique and region of interest measurements in groups oflderly healthy subjects and patients with Alzheimer’sisease and semantic dementia (manuscript in prepa-ation). Since no gold standard exists against which in
vivo measurements can be compared and, furthermore,since variations in MRI protocols, normalization, andsegmentation techniques can be expected to produceinconsistent data, reproducibility of a given techniqueis more important. In this regard the tissue classifica-tion technique used in this study yielded highly repro-ducible results.
Statistical Analysis
The normalized, smoothed, segmented data were an-alyzed using statistical parametric mapping (SPM99)employing the framework of the General Linear Model(Friston et al., 1995a). Global effects of age were exam-ned by multiple regression of summed voxel values ofrey matter, white matter, CSF, and total intracranialolume (TIV) in a model including linear and quadraticxpansions of age for both males and females. Signifi-ance levels for F statistics were set at P , 0.05.
Regionally specific differences in grey (and white)atter between groups were assessed statistically us-
ng a two-tailed contrast, namely testing for an in-reased or decreased probability of a voxel being greyor white) matter. We tested for volumetric changes inrey or white matter by incorporating the modulationf segmented data. Concentration changes were as-essed by using the segmented images directly. Nor-alization for global differences in voxel intensity
cross scans was effected by inclusion of the globalean voxel value (grey matter globals for the greyatter analysis and white matter globals for the whiteatter analysis) as a confounding covariate in an anal-
sis of covariance (ANCOVA), while preserving re-ional differences in grey (and white) matter (Fristont al., 1995a). Orthogonalized first-, second-, and third-rder polynomial expansions of age were entered intohe design matrix to determine the linear and nonlin-ar effects of age. Corrections for the search volumeand implicit multiple comparisons) in terms of the Palues were made using Gaussian random field theory,hich accommodates spatial correlations inherent in
he data and is now established as the conventional
dammFh
FmmFeeFpw(
re5oabdwpvTm(pbrdia
wsfcci
C
C
26 GOOD ET AL.
approach to inference in smooth spatially extendeddata (Friston et al., 1995b; Worsley et al., 1996). Weassessed the goodness of fit of first, second and thirdorder polynomial expansions using F maps or SPM{F}(Buchel et al., 1996). Significance levels for the F sta-tistics were set at P , 0.05, corrected for multiplecomparisons. Significance levels for one-sided T statis-tics were set at P , 0.025, corrected.
RESULTS
Grey Matter
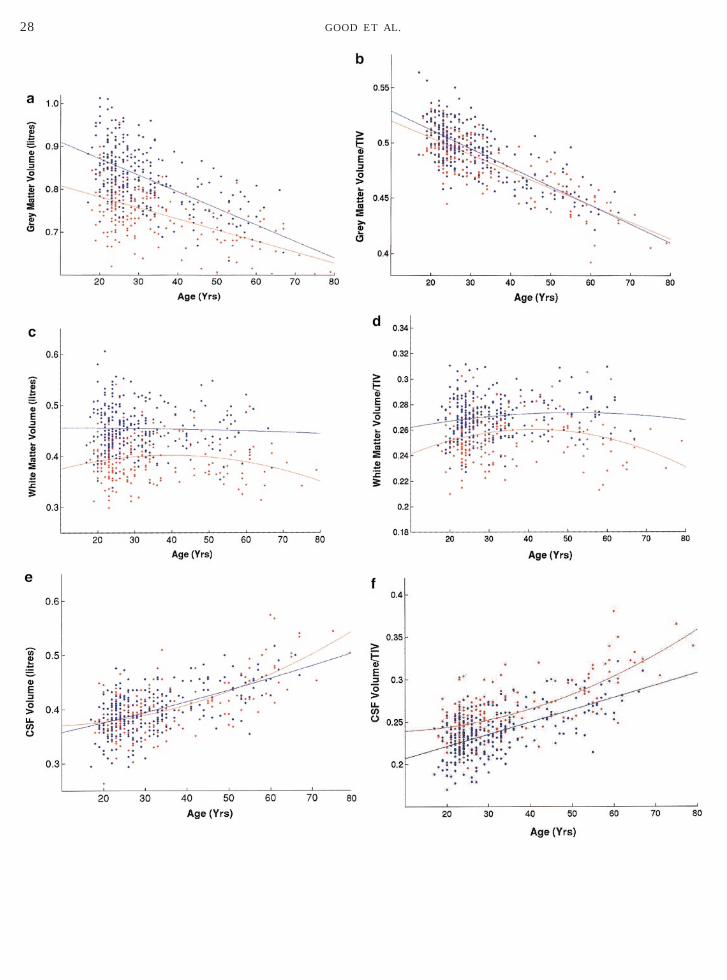
Global effects of age. There was a decline of globalgrey matter volume with age (Fig. 3a); overall R2 50.489. This involved cortical and deep gray matterstructures and cerebellum diffusely and a similar pat-tern was observed when TIV was included as a con-founding covariate. The linear coefficient (b1) was sig-nificant for both males, b1 5 20.0039, F(1,458) 5 58.7,P , 0.0001, and females, b1 5 20.0026, F(1,458) 531.7, P , 0.0001. Both quadratic coefficients failed toreach significance (F , 1.06, P . 0.30). The rate of
ecline was greater in males than females, a trend thatpproached significance, F(1,458) 5 3.54, P , 0.06. Theean grey matter volume was significantly greater inales (0.829 liters) than females (0.747 liters),(1,458) 5 239.85, P , 0.0001. There was no effect ofandedness on global grey matter volume, F(1,458) ,
1. When absolute volumes were expressed as a fractionof TIV, a similar significant pattern of linear declinewas noted for males (P , 0.001) and females (P ,0.001), although the increased decline in males wasless marked, F(1457) 5 0.8, P 5 0.17. The mean frac-tional volume of grey matter was significantly greaterfor males than females (P , 0.001), although this wasless pronounced than the absolute volume difference(Fig. 3b). The grey–white absolute volume ratio was1.89 for females and 1.89 for males. The grey–whitefractional volume ratio was 1.82 for females and 1.82for males.
Regional effects of age. Local areas of relative ac-celerated loss of grey matter volume (i.e., more thanthe global loss) were observed bilaterally in the supe-rior parietal gyri, pre- and postcentral gyri, insula/frontal operculum, right cerebellum (posterior lobe),and anterior cingulate (Fig. 4a). Areas of relative ac-celerated loss of grey matter concentration were ob-served in the left middle frontal gyrus (F2), transversetemporal (Heschl’s) gyri bilaterally, and left planumtemporale (Fig. 4b). Areas of relative preservation (i.e.,less than the global loss) of grey matter volume werenoted symmetrically in the lateral thalami, amygdala,hippocampi, and entorhinal cortex (Fig. 4c). Areas ofrelative preservation of grey matter concentrationwere seen more diffusely in the thalami (Fig. 4d). Table1 demonstrates the stereotactic coordinates corrected Pand Z scores for grey matter analyses.
These local effects tended to be linear, with no im-proved fit to the data with inclusion of a second and/orthird order polynomial term. There were no significanttwo- or three-way interactions with age and sex andhandedness.
White Matter
Global effects of age. There was no significant de-cline in white matter volume with age (Fig. 3c), overallR2 5 0.326. The linear coefficients were not significant(F , 1.05, P . 0.30), though the quadratic coefficientapproached significance for females, b2 5 0.0004,
(1,468) 5 3.65, P , 0.06 (but not males, F , 1). Theean white matter volume was significantly greater inales (0.454 liters) than females (0.395 liters),(1,458) 5 218, P , 0.0001, but no other sex differ-nces approached significance (F , 1.27). There was noffect of handedness on global white matter volume(1,458) , 1. When white matter volume was ex-ressed as a fraction of TIV, the quadratic coefficientas significant for females (P , 0.01), but not for males
Fig. 3d).Regional effects of age. There were local areas of
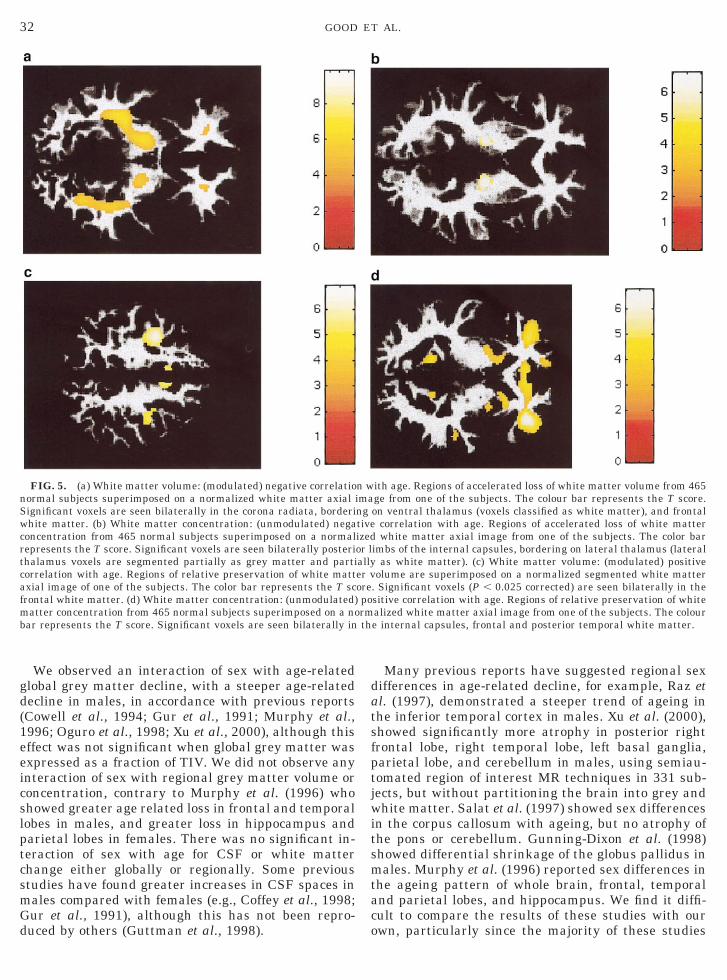
elative accelerated loss of white matter volume bilat-rally in frontal white matter, optic radiations (Fig.a), and posterior limbs of internal capsule, borderingn the ventrolateral thalamus. Local areas of acceler-ted decline of white matter concentration were seenilaterally in posterior limbs of internal capsule, bor-ering on the lateral thalamus (Fig. 5b). Inspection ofhite matter segmented images (from the optimizedreprocessing method) shows some lateral thalamusoxels classified as white matter (see Discussion).here were local areas of relative preservation of whiteatter volume bilaterally in the posterior frontal lobes
Fig. 5c), cerebellum, and right temporal lobe. Relativereservation of white matter concentration was notedilaterally in the internal capsules, frontal, and poste-ior temporal/occipital white matter (Fig. 5d). Table 2emonstrates the stereotactic coordinates of local max-ma, corrected P and Z scores for the white matternalyses.These local effects of age also tended to be linear,ith no improved fit to the data with inclusion of
econd and/or third order terms, apart from two smalloci of accelerated nonlinear decline in white matteroncentration at the anterior aspect of both internalapsules. There were no significant two- or three-waynteractions with age and sex and handedness.
SF
Global effects of age. There was a global increase inSF volume with age (Fig. 3e), overall R2 5 0.377. This
involved the entire CSF compartment including theventricles and surface sulci. A similar pattern wasobserved when TIV was included as a confoundingcovariate. The linear coefficient was significant for both
27VBM STUDY OF AGEING IN NORMAL HUMAN BRAINS
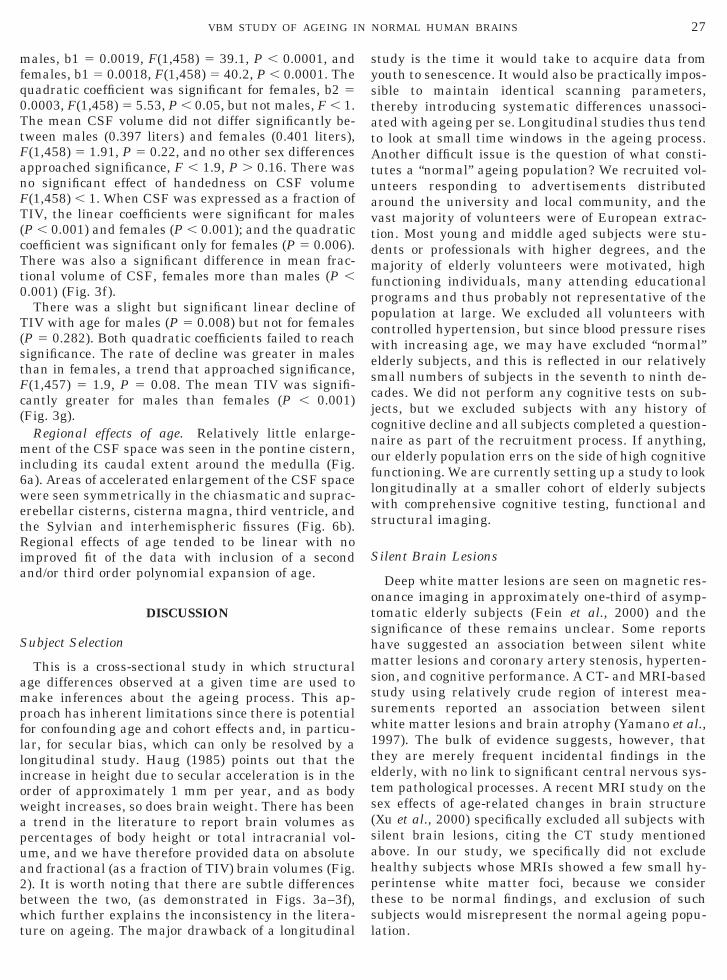
males, b1 5 0.0019, F(1,458) 5 39.1, P , 0.0001, andfemales, b1 5 0.0018, F(1,458) 5 40.2, P , 0.0001. Thequadratic coefficient was significant for females, b2 50.0003, F(1,458) 5 5.53, P , 0.05, but not males, F , 1.The mean CSF volume did not differ significantly be-tween males (0.397 liters) and females (0.401 liters),F(1,458) 5 1.91, P 5 0.22, and no other sex differencesapproached significance, F , 1.9, P . 0.16. There wasno significant effect of handedness on CSF volumeF(1,458) , 1. When CSF was expressed as a fraction ofTIV, the linear coefficients were significant for males(P , 0.001) and females (P , 0.001); and the quadraticcoefficient was significant only for females (P 5 0.006).There was also a significant difference in mean frac-tional volume of CSF, females more than males (P ,0.001) (Fig. 3f).
There was a slight but significant linear decline ofTIV with age for males (P 5 0.008) but not for females(P 5 0.282). Both quadratic coefficients failed to reachsignificance. The rate of decline was greater in malesthan in females, a trend that approached significance,F(1,457) 5 1.9, P 5 0.08. The mean TIV was signifi-cantly greater for males than females (P , 0.001)(Fig. 3g).
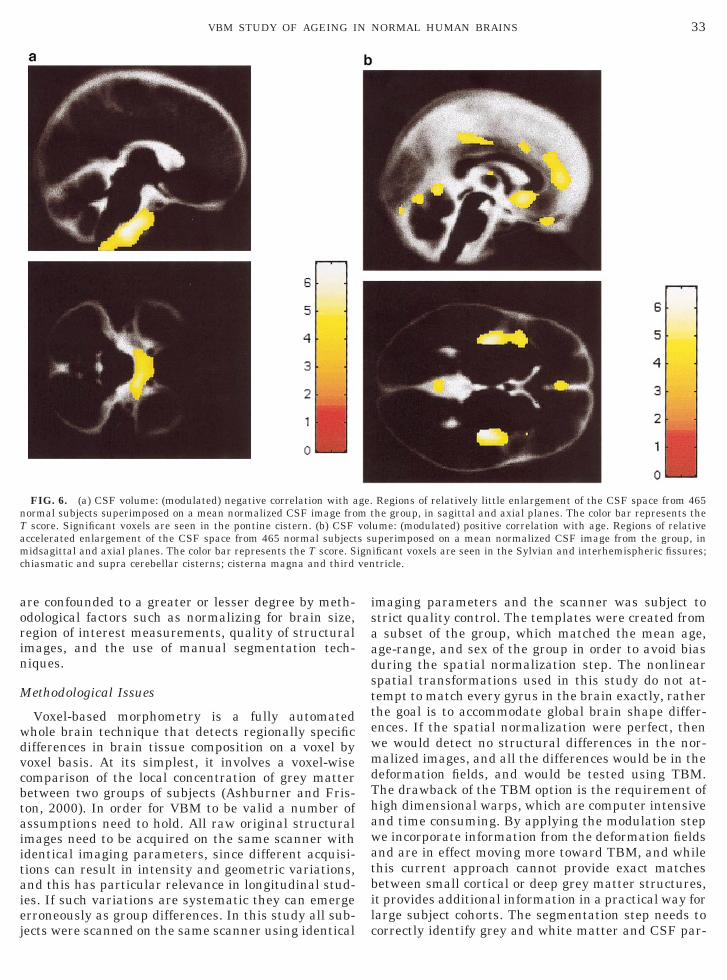
Regional effects of age. Relatively little enlarge-ment of the CSF space was seen in the pontine cistern,including its caudal extent around the medulla (Fig.6a). Areas of accelerated enlargement of the CSF spacewere seen symmetrically in the chiasmatic and suprac-erebellar cisterns, cisterna magna, third ventricle, andthe Sylvian and interhemispheric fissures (Fig. 6b).Regional effects of age tended to be linear with noimproved fit of the data with inclusion of a secondand/or third order polynomial expansion of age.
DISCUSSION
Subject Selection
This is a cross-sectional study in which structuralage differences observed at a given time are used tomake inferences about the ageing process. This ap-proach has inherent limitations since there is potentialfor confounding age and cohort effects and, in particu-lar, for secular bias, which can only be resolved by alongitudinal study. Haug (1985) points out that theincrease in height due to secular acceleration is in theorder of approximately 1 mm per year, and as bodyweight increases, so does brain weight. There has beena trend in the literature to report brain volumes aspercentages of body height or total intracranial vol-ume, and we have therefore provided data on absoluteand fractional (as a fraction of TIV) brain volumes (Fig.2). It is worth noting that there are subtle differencesbetween the two, (as demonstrated in Figs. 3a–3f),which further explains the inconsistency in the litera-ture on ageing. The major drawback of a longitudinal
study is the time it would take to acquire data fromyouth to senescence. It would also be practically impos-sible to maintain identical scanning parameters,thereby introducing systematic differences unassoci-ated with ageing per se. Longitudinal studies thus tendto look at small time windows in the ageing process.Another difficult issue is the question of what consti-tutes a “normal” ageing population? We recruited vol-unteers responding to advertisements distributedaround the university and local community, and thevast majority of volunteers were of European extrac-tion. Most young and middle aged subjects were stu-dents or professionals with higher degrees, and themajority of elderly volunteers were motivated, highfunctioning individuals, many attending educationalprograms and thus probably not representative of thepopulation at large. We excluded all volunteers withcontrolled hypertension, but since blood pressure riseswith increasing age, we may have excluded “normal”elderly subjects, and this is reflected in our relativelysmall numbers of subjects in the seventh to ninth de-cades. We did not perform any cognitive tests on sub-jects, but we excluded subjects with any history ofcognitive decline and all subjects completed a question-naire as part of the recruitment process. If anything,our elderly population errs on the side of high cognitivefunctioning. We are currently setting up a study to looklongitudinally at a smaller cohort of elderly subjectswith comprehensive cognitive testing, functional andstructural imaging.
Silent Brain Lesions
Deep white matter lesions are seen on magnetic res-onance imaging in approximately one-third of asymp-tomatic elderly subjects (Fein et al., 2000) and thesignificance of these remains unclear. Some reportshave suggested an association between silent whitematter lesions and coronary artery stenosis, hyperten-sion, and cognitive performance. A CT- and MRI-basedstudy using relatively crude region of interest mea-surements reported an association between silentwhite matter lesions and brain atrophy (Yamano et al.,1997). The bulk of evidence suggests, however, thatthey are merely frequent incidental findings in theelderly, with no link to significant central nervous sys-tem pathological processes. A recent MRI study on thesex effects of age-related changes in brain structure(Xu et al., 2000) specifically excluded all subjects withsilent brain lesions, citing the CT study mentionedabove. In our study, we specifically did not excludehealthy subjects whose MRIs showed a few small hy-perintense white matter foci, because we considerthese to be normal findings, and exclusion of suchsubjects would misrepresent the normal ageing popu-lation.
28 GOOD ET AL.

captJocotaoaen
aian1wcmmno
a
29VBM STUDY OF AGEING IN NORMAL HUMAN BRAINS
Global Effects of Age: Grey Matter, White Matter, andCSF
Many neuropathological studies show that normalageing is characterised by a substantial and extensiveloss of neurons in the cerebral cortex, although this iscontroversial, with recent stereological investigationsindicating little neuronal loss with normal ageing (e.g.,Peters et al., 1998; Gomez-Isla, 1996, 1997), and somereports suggesting that alterations in cerebral whitematter and subcortical neuronal loss may be the pre-dominant effect of age (Guttman et al., 1998). Our dataoncur with those neuropathological and previous CTnd MRI morphometry studies that suggest ageingredominantly and substantially affects the grey mat-er (Pfefferbaum et al., 1992, 1994; Lim et al., 1992;ernigan et al., 1991; Schwartz, 1985). In particular,ur data suggest a linear decline in grey matter inoncordance with Pfefferbaum et al. (1994), and webserved this pattern of decline for absolute and frac-ional grey matter volumes. Others have suggestedccelerated ageing in the later decades of life, and sinceur data included relatively few subjects over 65 years,nd furthermore our elderly subjects could be consid-red to be “super normal,” we could be missing thisonlinear trend.
FIG. 3.—Continued
FIG. 3. (a) Scatter plot of total grey matter volume (liters) againsbest fitting linear regression curves for females and males are superiage (years) for 465 normal subjects (females in red, males in bluesuperimposed. (c) Scatter plot of total white matter volume (litres) agThe best fitting quadratic regression curves for females and males areagainst age (years) for 465 normal subjects (females in red, males in bare superimposed. (e) Scatter plot of total CSF volume (liters) againstbest fitting quadratic regression curves for females and males are su(years) for 465 normal subjects (females in red, males in blue). Thsuperimposed. (g) Scatter plot of TIV against age (years) for 465 norregression curves for females and males are superimposed.
The majority of structural MRI data indicate thatlthough significant microstructural changes are seenn cerebral white matter (Raz et al., 1997; Wahlund etl., 1990), significant total white matter volume loss isot expressed (Jernigan et al., 1991; Pfefferbaum et al.,992, 1994; Raz et al., 1993). Our data are consistentith this finding. This phenomenon may be due to
oncomitant factors with opposing influence: the loss ofyelin associated with ageing (Ansari and Loch, 1975)ay reduce white matter bulk, whereas the simulta-
eous expansion of the capillary network and swellingf perivascular spaces (Meier-Ruge et al., 1992) may
enlarge white matter bulk. In accordance with previ-ous CT and MRI literature, we observed an increase inthe CSF compartment with age, best described by alinear function. We noted a small but significant de-cline in TIV with age in males and a smaller nonsig-nificant trend in females, which most probably reflectsthe secular trend of increasing head size over the lastcentury. The mean absolute grey–white matter volumeratio was 1.89, and the mean fractional grey–whitevolume ratio was 1.82. Grey–white matter ratios varywidely in the literature, for example postmortem andin vivo studies, using a variety of methodologies, reportratios in a wide range from approximately 3–1.1, de-pendent on age (e.g., Caviness et al., 1996; Guttmann et
l., 1998; Pfefferbaum et al., 1994; Resnick et al., 2000).
Regional Effects of Age
Our data support the theory of a heterogeneic re-sponse of various compartments of the brain to ageing.We observed accelerated loss of grey matter volumesymmetrically in both parietal lobes (angula gyri), pre-and postcentral gyri, insula, and anterior cingulatecortex. We also observed accelerated loss of grey mat-ter concentration in the left middle frontal gyrus, leftplanum temporale and transverse temporal gyri bilat-erally. There was relative preservation of grey mattervolume symmetrically in the amygdala, hippocampi,entorhinal cortices, and lateral thalami, with relativepreservation of grey matter concentration more dif-fusely in the thalami. This is in accordance with pre-vious work showing a predominant age effect in theparietal lobes (Resnick et al., 2000) and prefrontal greymatter (Raz et al., 1997); a smaller effect in fusiform,
e (years) for 465 normal subjects (females in red, males in blue). Theosed. (b) Scatter plot of fractional grey matter volume (/TIV) againsthe best fitting linear regression curves for females and males arest age (years) for 465 normal subjects (females in red, males in blue).perimposed. (d) Scatter plot of fractional white matter volume (/TIV)). The best fitting quadratic regression curves for females and malese (years) for 465 normal subjects (females in red, males in blue). Theimposed. (f) Scatter plot of fractional CSF volume (/TIV) against ageest fitting quadratic regression curves for females and males arel subjects (females in red, males in blue). The best fitting quadratic
t agmp). Tainsulueag
pere bma

30 GOOD ET AL.
FIG. 4. (a) Grey matter volume: (modulated) negative correlation with age. Regions of relative accelerated loss of grey matter volumefrom 465 normal subjects superimposed on a normalized structural image in the sagittal plane (a), axial plane (b), and coronal plane (c). Thecolor bar represents the T score. Significant voxels (P , 0.025 corrected) are seen bilaterally in the anterior cingulate (a), bilateral pre- andpostcentral gyri (b), and bilateral angular gyri (b, c). The significant cerebellar and anterior insula voxels are not shown. (b) Grey matterconcentration: (unmodulated) negative correlation with age. Regional areas of relative accelerated loss of grey matter concentration from 465normal subjects superimposed on the whole brain template derived from all subjects. The color bar represents the T score. Significant voxels(P , 0.025 corrected) are seen bilaterally in the transverse temporal (Heschl’s) gyri and left planum temporale. (c) Grey matter volume:

c(ct
31VBM STUDY OF AGEING IN NORMAL HUMAN BRAINS
inferior temporal and superior parietal cortices andminimal change in the hippocampal formation (Raz etal., 1997). The lack of a substantial age-related changein the amygdala/hippocampal regions demonstrated byour data and work by Raz et al. (1997) is somewhatsurprising and at odds with other reports. Animal andhuman pathological studies have demonstrated age-related changes in the hippocampus (Kemper, 2000;Landfield, 2000), as have previous structural imagingstudies and recent work using MR spectroscopy (Schuffet al., 1999). A possible explanation for this discrep-ancy could be the sampling methods used to assess thehippocampus: region of interest techniques used inthese previous studies may be observer dependent andsubject to error due to the complex and variable shapeof the hippocampus. It should be noted that we usedVBM to examine age-related changes in local tissuecomposition, deliberately adjusting for macroscopicand shape differences that classical ROI-based mor-phometric approaches characterise. It is also worthemphasizing that our data are reporting regionally
TAB
x y z Z
Grey matter: modula
242 57 54 6.4442 258 54 5.352 42 26 6.17
240 21 10 6.0742 4 15 6.0662 220 40 6.44
257 228 45 5.88254 29 50 6.14
31 290 234 5.36
Grey matter: unmodul
252 21 38 5.7246 220 2 6
45 216 2 5.722 15 29 5.51
Grey matter: modula
227 24 221 .826 23 222 .8
Grey matter: unmodu
15 217 9 .8214 18 8 .8
40 280 24 5.62
(modulated) positive correlation with age. Regional areas of relasuperimposed on a normalized structural image in the coronal planorrected) are noted bilaterally in amygdala/hippocampal complexes,in red) and negative (green) correlations superimposed on the same sorrelation with age. Regions of relative preservation of grey matter cemplate derived from all subjects. The color bar represents the T sc
thalami.
specific changes within the grey matter compartmentover and above global grey matter change, whereasmost other studies report changes without covaryingout global grey matter volume. A very recent region ofinterest and voxel-wise morphometry paper in youngadults reported that the volume of the amygdala ap-peared to be independent of age and gender, whereasthe hippocampi showed shrinkage with age in men butnot in women (Pruessner et al., 2001). The statisticalmodel used in this paper did however not model theglobal amount of grey matter and the age range issubstantially different, so it cannot be directly com-pared with our method.
Sex Differences
The whole brain volume and grey and white matterpartitions were larger in males compared with femalesin accordance with previous literature (Raz et al., 1997;Coffey et al., 1998; Gur et al., 1991; Murphy et al.,1996).
1
P(corrected) Location
negative correlation
,0.0001 L angular gyrus,0.0001 R angular gyrus,0.0001 Anterior cingulate sulcus,0.0001 L anterior insula,0.0001 R anterior insula,0.0001 R pre and post central gyri,0.0001 L post central gyrus,0.0001 L precentral gyrus,0.0001 R cerebellum (posterior lobe)
d negative correlation
,0.0001 L middle frontal gyrus,0.0001 L Heschl’s gyrus/planum temporale,0.0001 R Heschl’s gyrus
0.002 Subcallosal gyrus
positive correlation
,0.0001 L amygdala/hippocampus,0.0001 R amygdala/hippocampus
d positive correlation
,0.0001 R thalamus,0.0001 L thalamus
0.001 R parietal lobe
e preservation of grey matter volume from 465 normal subjectsThe color bar represents the T score. Significant voxels (P , 0.025orhinal cortex, and lateral thalami. The second figure shows positivectural image. (d) Grey matter concentration: (unmodulated) positiveentration from 465 normal subjects superimposed on the whole brain. Significant voxels (P , 0.025 corrected) are noted bilaterally in the
LE
ted
ate
ted
late
tive.enttru
oncore
slptcsmGd
datsfptjwitsmtaco
nSwcrtcafmb
32 GOOD ET AL.
We observed an interaction of sex with age-relatedglobal grey matter decline, with a steeper age-relateddecline in males, in accordance with previous reports(Cowell et al., 1994; Gur et al., 1991; Murphy et al.,1996; Oguro et al., 1998; Xu et al., 2000), although thiseffect was not significant when global grey matter wasexpressed as a fraction of TIV. We did not observe anyinteraction of sex with regional grey matter volume orconcentration, contrary to Murphy et al. (1996) whohowed greater age related loss in frontal and temporalobes in males, and greater loss in hippocampus andarietal lobes in females. There was no significant in-eraction of sex with age for CSF or white matterhange either globally or regionally. Some previoustudies have found greater increases in CSF spaces inales compared with females (e.g., Coffey et al., 1998;ur et al., 1991), although this has not been repro-uced by others (Guttman et al., 1998).
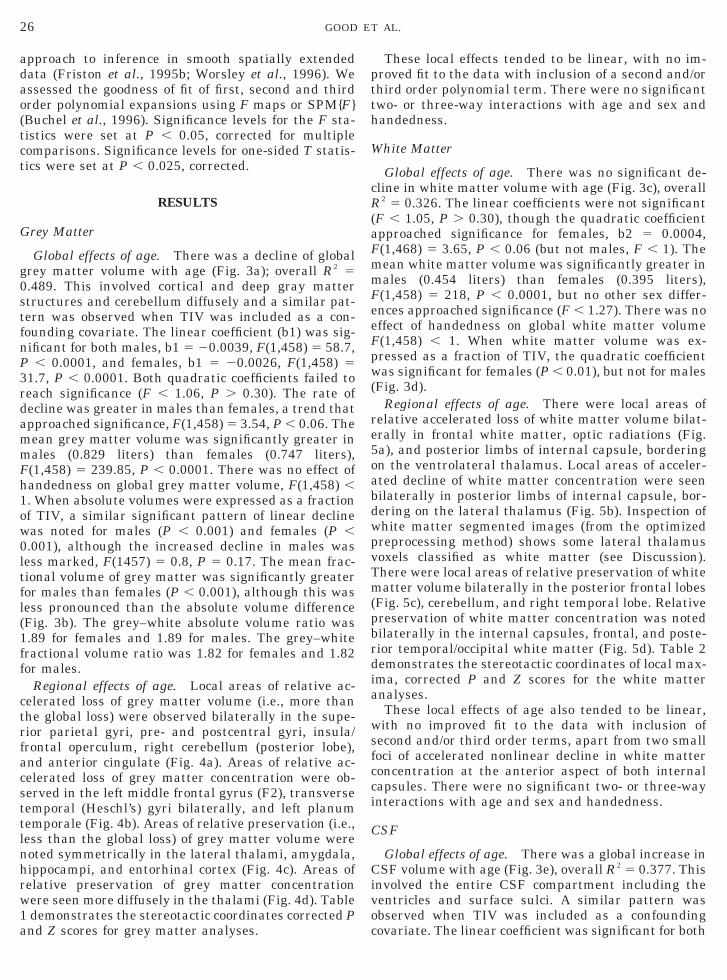
FIG. 5. (a) White matter volume: (modulated) negative correlatioormal subjects superimposed on a normalized white matter axialignificant voxels are seen bilaterally in the corona radiata, borderihite matter. (b) White matter concentration: (unmodulated) nega
oncentration from 465 normal subjects superimposed on a normalepresents the T score. Significant voxels are seen bilaterally posterihalamus voxels are segmented partially as grey matter and partiorrelation with age. Regions of relative preservation of white mattxial image of one of the subjects. The color bar represents the T scrontal white matter. (d) White matter concentration: (unmodulated)atter concentration from 465 normal subjects superimposed on a no
ar represents the T score. Significant voxels are seen bilaterally in
Many previous reports have suggested regional sexifferences in age-related decline, for example, Raz etl. (1997), demonstrated a steeper trend of ageing inhe inferior temporal cortex in males. Xu et al. (2000),howed significantly more atrophy in posterior rightrontal lobe, right temporal lobe, left basal ganglia,arietal lobe, and cerebellum in males, using semiau-omated region of interest MR techniques in 331 sub-ects, but without partitioning the brain into grey andhite matter. Salat et al. (1997) showed sex differences
n the corpus callosum with ageing, but no atrophy ofhe pons or cerebellum. Gunning-Dixon et al. (1998)howed differential shrinkage of the globus pallidus inales. Murphy et al. (1996) reported sex differences in
he ageing pattern of whole brain, frontal, temporalnd parietal lobes, and hippocampus. We find it diffi-ult to compare the results of these studies with ourwn, particularly since the majority of these studies
ith age. Regions of accelerated loss of white matter volume from 465ge from one of the subjects. The colour bar represents the T score.on ventral thalamus (voxels classified as white matter), and frontal
correlation with age. Regions of accelerated loss of white matterwhite matter axial image from one of the subjects. The color bar
imbs of the internal capsules, bordering on lateral thalamus (lateralas white matter). (c) White matter volume: (modulated) positive
olume are superimposed on a normalized segmented white matter. Significant voxels (P , 0.025 corrected) are seen bilaterally in thesitive correlation with age. Regions of relative preservation of whitealized white matter axial image from one of the subjects. The coloure internal capsules, frontal and posterior temporal white matter.
n wimangtiveizedor lallyer vorepormth
33VBM STUDY OF AGEING IN NORMAL HUMAN BRAINS
are confounded to a greater or lesser degree by meth-odological factors such as normalizing for brain size,region of interest measurements, quality of structuralimages, and the use of manual segmentation tech-niques.
Methodological Issues
Voxel-based morphometry is a fully automatedwhole brain technique that detects regionally specificdifferences in brain tissue composition on a voxel byvoxel basis. At its simplest, it involves a voxel-wisecomparison of the local concentration of grey matterbetween two groups of subjects (Ashburner and Fris-ton, 2000). In order for VBM to be valid a number ofassumptions need to hold. All raw original structuralimages need to be acquired on the same scanner withidentical imaging parameters, since different acquisi-tions can result in intensity and geometric variations,and this has particular relevance in longitudinal stud-ies. If such variations are systematic they can emergeerroneously as group differences. In this study all sub-jects were scanned on the same scanner using identical
FIG. 6. (a) CSF volume: (modulated) negative correlation with anormal subjects superimposed on a mean normalized CSF image froT score. Significant voxels are seen in the pontine cistern. (b) CSFaccelerated enlargement of the CSF space from 465 normal subjectmidsagittal and axial planes. The color bar represents the T score. Schiasmatic and supra cerebellar cisterns; cisterna magna and third
imaging parameters and the scanner was subject tostrict quality control. The templates were created froma subset of the group, which matched the mean age,age-range, and sex of the group in order to avoid biasduring the spatial normalization step. The nonlinearspatial transformations used in this study do not at-tempt to match every gyrus in the brain exactly, ratherthe goal is to accommodate global brain shape differ-ences. If the spatial normalization were perfect, thenwe would detect no structural differences in the nor-malized images, and all the differences would be in thedeformation fields, and would be tested using TBM.The drawback of the TBM option is the requirement ofhigh dimensional warps, which are computer intensiveand time consuming. By applying the modulation stepwe incorporate information from the deformation fieldsand are in effect moving more toward TBM, and whilethis current approach cannot provide exact matchesbetween small cortical or deep grey matter structures,it provides additional information in a practical way forlarge subject cohorts. The segmentation step needs tocorrectly identify grey and white matter and CSF par-
Regions of relatively little enlargement of the CSF space from 465he group, in sagittal and axial planes. The color bar represents theume: (modulated) positive correlation with age. Regions of relativeuperimposed on a mean normalized CSF image from the group, inificant voxels are seen in the Sylvian and interhemispheric fissures;tricle.
ge.m tvols signven
2spoigdtafctgSwsfimadtmf
anitHasiotts(
wpigfa
anfimhswaertcpwaswcm
34 GOOD ET AL.
titions. In areas where grey/white matter differentia-tion is poor, for example, in the brainstem and thala-mus, voxels may be incorrectly classified, even using anoptimal preprocessing method. This effect is demon-strated in the significant lateral thalamic differenceswe detected on both the grey and white matter analy-ses (Figs. 4c, 4d, 5a, and 5b). These age-related differ-ences are real and significant but their cause cannot beattributed directly to grey/white matter changes,rather in the way these changes impact on the classi-fication as grey or white. We are currently attemptingto address this problem by optimizing the MR struc-tural imaging sequence to provide better grey/whitematter contrast and segmentation (Deichmann et al.,000). Additional improvements can be made to theegmentation procedure by the creation of customisedrior probability maps appropriate to the subject groupf interest. This has particular relevance when study-ng patient populations whose brain structure differsreatly from young normal subjects. We included el-erly subjects with a few small white matter hyperin-ensities. In addition perivascular spaces enlarge withge and there may be subtle signal changes more dif-usely in the white matter of elderly subjects. Theseould be potentially misclassified as CSF or grey mat-er, leading to a potential overestimation of CSF andrey matter and an underestimation of white matter.ince we did not observe global white matter atrophyith age, we can conclude that perivascular spaces and
mall white matter lesions were predominantly classi-ed as white matter. The inclusion or exclusion of theodulation step facilitates the assessment of absolute
mount or concentration of a region of tissue. The latteroes not however provide information about cytoarchi-ectural structure such as neuronal packing or cellorphometry, hence the term concentration is pre-
erred to density.The statistics used to identify structural differences
ssume that the residuals after fitting the model areormally distributed. If the data are not well behaved,
t may be appropriate to perform nonparametric sta-istical analyses (Ashburner and Friston, 2000;olmes et al., 1996). The voxel-based extent statisticvailable within SPM, should not be used in VBM. Thistatistic is based upon the number of connected voxelsn a cluster defined by a prespecified threshold. Inrder to be valid, this test requires the smoothness ofhe residuals to be spatially invariant, but this is nothe case with neuroanatomy which has a highly non-tationary nature and thus leads to inexact p valuesAshburner and Friston, 2000; Worsley et al., 1999).
There is a great deal of endogenous variabilityithin and between brain regions, and in a recentaper the authors report that 80% of the total variancen gyral volume arises from individual and specificyri, while only 10% of the total variance reflects uni-orm scaling to total neocortical volume (Kennedy etl., 1998). In addition there can be contributions from
rtifactual sources such as imperfections in the spatialormalization that themselves show a regional speci-city. This has implications for the sensitivity of anyorphometric technique to detect changes in regions of
igh variance. Our technique may be relatively insen-itive to subtle age effects in regions of high variancehile more sensitive to change in regions of low vari-nce; however, this is the point of using SPM thatmploys a regionally specific estimate of variance. Thisegional variance may well explain the inconsistency ofhe literature with regard to regionally specific agehanges, especially in small brain structures. The hip-ocampus for example, is a relatively small structureith a complex architecture, which often demonstratesdegree of variability between subjects on visual in-
pection. VBM has demonstrated subtle changesithin the hippocampus in a group of taxi-drivers, that
orroborated independent and accurate ROI measure-ents (Maguire et al., 2000), suggesting that this tech-
nique can register and segment small structures withsome degree of accuracy. There is the potential forerror in patients, for example those with Alzheimer’sdisease or indeed in normal elderly subjects, since thegrey/white matter contrast is reduced, and segmenta-tion may be less accurate. As high dimensional warp-ing techniques advance to the stage where they canprovide accurate mapping of small gyri in large subjectgroups in a time efficient and practical way, then someof these issues will be resolved.
Conclusion
Our data provide evidence of specific patterns in thestructural brain correlates of ageing, not only globallybetween grey and white matter compartments, but alsolocally within regions of the brain. The use of largenumbers of subjects in this study permitted the exam-ination of relatively subtle age-related effects, but alsohighlighted the need for a rigorous and optimal VBMmethod to avoid errors of interpretation caused by mis-classification of non-brain voxels. Significantly theyhave been obtained with a fully automated methodthat eschews observer bias and the data have beenobtained in life, eliminating post mortem and agonalchanges. They also speak to VBM as a tool for detectingsubtle structural brain changes in normal subjects.
ACKNOWLEDGMENT
This work was supported by the Wellcome Trust.
REFERENCES
Adachi, T., Kobayashi, S., Yamaguchi, S., and Okada, K. 2000. MRIfindings of small subcortical “lacunar-like” infarction resultingfrom large vessel disease. J. Neurol. 247: 280–285.
Ansari, K., and Loch, J. 1975. Decreased myelin basic protein con-tent of the aged human brain. Neurology 25: 1045–1050.
C
C
C
D
D
D
D
E
F
F
F
F
F
F
F
G
G
G
G
G
H
J
K
K
L
L
L
L
L
M
M
M
M
35VBM STUDY OF AGEING IN NORMAL HUMAN BRAINS
Ashburner, J., Neelin, P., Collins, D., Evans, A., and Friston, K. J.1997. Incorporating prior knowledge into image registration. Neu-roImage 6: 344–352.
Ashburner, J., Hutton, C., Frackowiak, R. S. J., Johnsrude, I., Price,C., and Friston, K. J. 1998. Identifying global anatomical differ-ences: Deformation-based morphometry. Hum. Brain Mapp. 6:348–357.
Ashburner, J., and Friston, K. J. 1999. Nonlinear spatial normaliza-tion using basis functions. Hum. Brain Mapp. 7: 254–266.
Ashburner, J., Andersson, J. L., and Friston, K. J. 2000. Imageregistration using a symmetric prior—In three dimensions. Hum.Brain Mapp. 9: 212–225.
Ashburner, J., and Friston, K. J. 2000. Voxel-based morphometry—The methods. Neuroimage 11: 805–821.
Buchel, C., Wise, R. J., Mummery, C. J., Poline, J. B., and Friston,K. J. 1996. Nonlinear regression in parametric activation studies.Neuroimage 4: 60–66.
Celsis, P. 2000. Age-related cognitive decline, mild cognitive impair-ment or preclinical Alzheimer’s disease? Ann. Med. 32: 6–14.
hristensen, G. E., Joshi, S. C., and Miller, M. I. 1997. Volumetrictransformation of brain anatomy. IEEE Trans. Med. Imag. 16:864–877.offey, C. E., Lucke, J. F., Saxton, J. A., Ratcliff, G., Unitas, L. J.,Billig, B., and Bryan, R. N. 1998. Sex differences in brain ageing:A quantitative magnetic resonance imaging study [published er-ratum appears in Arch. Neurol. 1998. 55(5):627]. Arch. Neurol. 55:169–179.owell, P. E., Turetsky, B. I., Gur, R. C., Grossman, R. I., Shtasel,D. L., and Gur, R. E. 1994. Sex differences in ageing of the humanfrontal and temporal lobes. J. Neurosci. 14: 4748–4755.avatzikos, C., Vaillant, M., Resnick, S. M., Prince, J. L., Levotsky,S., and Bryan, R. N. 1996a. A computerised approach for morpho-logical analysis of the corpus callosum. J. Comput. Assist. Tomogr.20: 88–97.avatzikos, C. 1996b. Spatial normalization of 3D brain imagesusing deformable models. J. Comput. Assist. Tomogr. 20: 656–665.avatzikos, C. 1998. Mapping of image data to stereotaxic spaces:Applications to brain mapping. Hum. Brain Mapp. 6: 334–338.eichmann, R., Good, C. D., Ashburner, J., Josephs, O., and Turner,R. 2000. Optimization of 3-D MP-RAGE sequences for structuralbrain imaging. NeuroImage 12: 112–127.
vans, A. C., Kamber, M., Collins, D., and Macdonald, D. 1994. AnMRI-based probabilistic atlas of neuroanatomy. In Magnetic Res-onance Scanning and Epilepsy (S. Shorvon, D. Fish, F. Ander-mann, G. Bydder, and H. Stefan, Eds.), pp. 263–274, Plenum, NewYork.
ein, G., Van Dyke, C., Davenport, L., Turetsky, B., Brant-Zawadzki,M., Zatz, L., Dillon, W., and Valk, P. 2000. Preservation of normalcognitive functioning in elderly subjects with extensive white-matter lesions of long duration. Arch. Gen. Psychiatry 47: 220–223.
ilipek, P., Richelme, C., Kennedy, D., and Caviness, V. J. 1994. Theyoung adult human brain: An MRI-based morphometric analysis.Cerebral Cortex 4: 344–360.
lood, D., and Coleman, P. 1988. Neuron numbers and size in ageingbrain: Comparison of human, monkey and rodent data. Neurobiol.Ageing 9: 453–463.
ox, N., and Freeborough, P. 1996. Visualization and quantificationof rates of atrophy in Alzheimer’s disease. Lancet 348: 94–97.
reeborough, P. A., and Fox, N. C. 1998. Modelling brain deforma-tions in Alzheimer disease by fluid registration of serial 3D MRimages. J. Comput. Assist. Tomogr. 22: 838–843.
riston, K. J., Holmes, A. P., Worsley, K., Poline, J.-B., Frith, C. D.,and Frackowiak, R. S. J. 1995a. Statistic parametric maps in
functional imaging: A general linear approach. Hum. Brain Mapp.2: 189–210.
riston, K. J., Holmes, A. P., Poline, J.-B., Price, C. J., and Frith,C. D. 1995b. Detecting activations in PET and fMRI. NeuroImage4: 223–235.uimond, A., Meunier, J., and Thirion, J. P. 2000. Average brainmodels: A convergence study. Comp. Vision Image Understand 77:192–210.unning-Dixon, F. M., Head, D., McQuain, J., Acker, J. D., and Raz,N. 1998. Differential ageing of the human striatum: a prospectiveMR imaging study. Am. J. Neuroradiol. 19: 1501–1507.ur, R. C., Mozley, P. D., Resnick, S. M., Gottlieb, G. L., Kohn, M.,Zimmerman, R., Herman, G., Atlas, S., Grossman, R., and Ber-retta, D. 1991. Gender differences in age effect on brain atrophymeasured by magnetic resonance imaging. Proc. Natl. Acad. Sci.USA 88: 2845–2849.uttmann, C. R., Benson, R., Warfield, S. K., Wei, X., Anderson,M. C., Hall, C. B., Abu-Hasaballah, K., Mugler, J. P., III, andWolfson, L. 2000. White matter abnormalities in mobility-im-paired older persons. Neurology 54: 1277–1283.uttmann, C. R., Jolesz, F. A., Kikinis, R., Killiany, R. J., Moss,M. B., Sandor, T., and Albert, M. S. 1998. White matter changeswith normal ageing. Neurology 50: 972–978.olmes, A. P., Blair, R. C., Watson, J. D. G., and Ford, I. 1996.Nonparametric analysis of statistic images from functional map-ping experiments. J. Cereb. Blood Flow Metab. 16: 7–22.
ernigan, T. L., Archibald, S. L., Berhow, M. T., Sowell, E. R., Foster,D. S., and Hesselink, J. R. 1991. Cerebral structure on MRI, PartI: Localization of age-related changes. Biol. Psychiatry 29: 55–67.emper, T. 2000. Neuroanatomical and neuropathological changesduring ageing and dementia. In Clinical Neurology of Ageing (M.Albert and E. Knoepfel, Eds.), pp. 3–67, Oxford Univ. Press, NewYork.ennedy, D. N., Lange, N., Makris, N., Bates, J., Meyer, J., andCaviness, V. S., Jr. 1998. Gyri of the human neocortex: An MRI-based analysis of volume and variance. Cerebral Cortex 8: 372–384.
andfield, P. W. 1988. Hippocampal neurobiological mechanisms ofage-related memory dysfunction. Neurobiol. Ageing 9: 571–579.
ast, R. J., and Tompsett, D. H. 1953. Casts of cerebral ventricles.Br. J. Surg. 40: 525–543.
eary, S. M., Brex, P. A., MacManus, D. G., Parker, G. J., Barker,G. J., Miller, D. H., and Thompson, A. J. 2000. A (1)H magneticresonance spectroscopy study of ageing in parietal white matter:Implications for trials in multiple sclerosis. Magn. Reson. Imag.18: 455–459.
im, K. O., Zipursky, R. B., Watts, M. C., and Pfefferbaum, A. 1992.Decreased gray matter in normal ageing: An in vivo magneticresonance study. J. Gerontol. 47: B26–B30.
uft, A. R., Skalej, M., Schulz, J. B., Welte, D., Kolb, R., Burk, K.,Klockgether, T., and Voight, K. 1999. Patterns of age-relatedshrinkage in cerebellum and brainstem observed in vivo usingthree-dimensional MRI volumetry. Cereb. Cortex 9: 712–721.aguire, E. A., Gadian, D. G., Johnsrude, I. S., Good, C. D., Ash-burner, J., Frackowiak, R. S. F., et al. 2000. Navigation-relatedstructural change in the hippocampi of taxi drivers. Proc. Natl.Acad. Sci. USA 97: 4398–4403.eier-Ruge, W., Ulrich, J., Bruhlmann, M., and Meier, E. 1992.Age-related white matter-atrophy in the human brain. Ann. N.Y.Acad. Sci. 673: 260–269.essert, B. 1972. Reevaluation of the size of the lateral ventricles ofthe brain: Postmortem study of an adult population. Neurology 22:941–951.iller, A., Alston, R., and Corsellis, J. A. N. 1980. Variation with agein the volumes of gray and white matter in the cerebral hemi-
O
P
P
P
R
R
R
R
S
S
S
S
S
T
V
W
W
W
X
Y
Y
36 GOOD ET AL.
spheres in man: Measurements with an image analyzer. Neuro-pathol. Appl. Neurobiol. 6: 119–132.
Miller, A., and Corsellis, J. 1977. Evidence for a secular increase inhuman brain weight over the past century. Ann. Hum. Biol. 4:253–257.
Murphy, D. G., DeCarli, C., McIntosh, A. R., Daly, E., Mentis, M. J.,Pietrini, P., Szczepanik, J., Schapiro, M. B., Grady, C. L., Horwitz,B., and Rapoport, S. I. 1996. Sex differences in human brainmorphometry and metabolism: An in vivo quantitative magneticresonance imaging and positron emission tomography study on theeffect of ageing. Arch. Gen. Psychiatry 53: 585–594.guro, H., Okada, K., Yamaguchi, S., and Kobayashi, S. 1998. Sexdifferences in morphology of the brain stem and cerebellum withnormal ageing. Neuroradiology 40: 788–792.
fefferbaum, A., Mathalon, D. H., Sullivan, E., Rawles, J., Zipursky,R., and Lim, K. O. 1994. A quantitative magnetic resonance im-aging study of changes in brain morphology from infancy to lateadulthood. Arch. Neurol. 51: 874–887.
fefferbaum, A., Lim, K. O., Zipursky, R. B., Mathalon, D. H., Rosen-bloom, M. J., Lane, B., Ha, C. N., and Sullivan, E. V. 1992. Braingray and white matter volume loss accelerates with ageing inchronic alcoholics: A quantitative MRI study. Alcohol Clin. Exp.Res. 16: 1078–1089.
ruessner, J. C., Collins, D. L., Pruessner, M., and Evans, A. C. Ageand gender predict volume decline in the anterior and posteriorhippocampus in early adulthood. J. Neurosci. 21: 194–200.
az, N., Torres, I. J., Spencer, W. D., and Acker, J. D. 1993. Patho-clysis in ageing human cerebral cortex: Evidence from in vivo MRIinvestigation. Psychobiology 21: 151–160.
az, N., Gunning, F. M., Head, D., Dupuis, J. H., McQuain, J.,Briggs, S. D., Loken, W. J., Thornton, A. E., and Acker, J. D. 1997.Selective ageing of the human cerebral cortex observed in vivo:Differential vulnerability of the prefrontal gray matter. Cereb.Cortex 7: 268–282.
esnick, S., Goldszal, A., Davatzikos, C., Golski, S., Kraut, M., Met-ter, E., Bryan, R. N., and Zonderman, A. 2000. One-year agechanges in MRI brain volumes in older adults. Cereb. Cortex 10:464–472.ypma, B., and D’Esposito, M. 2000. Isolating the neural mecha-nisms of age-related changes in human working memory. Nat.Neurosci. 3: 509–515.
achdev, P., Brodaty, H., Rose, N., and Cathcart, S. 1999. Schizo-phrenia with onset after age 50 years. 2: Neurological, neuropsy-chological and MRI investigation. Br. J. Psychiatry 175: 416–421.
alat, D., Ward, A., Kaye, J. A., and Janowsky, J. S. 1997. Sexdifferences in the corpus callosum with ageing. Neurobiol. Ageing18: 191–197.
chretlen, D., Pearlson, G. D., Anthony, J. C., Aylward, E. H., Au-gustine, A. M., Davis, A., and Barta, P. 2000. Elucidating thecontributions of processing speed, executive ability, and frontallobe volume to normal age-related differences in fluid intelligence.J. Int. Neuropsychol. Soc. 6: 52–61.
chuff, N., Amend, D. L., Knowlton, R., Norman, D., Fein, G., andWeiner, M. W. 1999. Age-related metabolite changes and volumeloss in the hippocampus by magnetic resonance spectroscopy andimaging. Neurobiol. Ageing 20: 279–285.
chwartz, M. 1985. Computed tomographic analysis of brain mor-phometrics in 30 healthy adults ages 21 to 81 years. Ann. Neurol.17: 146–157.
hompson, P. M., MacDonald, D., Mega, M. S., Holmes, C. J., Evans,A. C., and Toga. 1997. Detection and mapping of abnormal brainstructure with a probabilistic atlas of cortical surfaces. J. Comput.Assist. Tomogr. 21: 567–581.argha-Khadem, F., Watkins, K. E., Price, C. J., Ashburner, J.,Alcock, K. J., Connelly, A., et al. 1998. Neural basis of an inheritedspeech and language disorder. Proc. Natl. Acad. Sci. USA 95:12695–12700.ahlund, L. O., Agartz, I., Almqvist, O., Basun, H., Forssell, L.,Saaf, J., and Wetterberg, L. 1990. The brain in healthy agedindividuals. Radiology 174: 675–679.orsley, K. J., Marrett, S. N. P., Vandal, A. C., Friston, K. J., andEvans, A. C. 1996. A unified statistical approach for determiningsignificant voxels in images of cerebral activation. Hum. BrainMapp. 4: 58–73.orsley, K. J., Andermann, M., Neelin, P., Vandal, A. C., Friston,K. J., and Evans, A. C. 1999. Detecting changes in non-isotropicimages. Hum. Brain Mapp. 8: 98–101.
u, J., Kobayashi, S., Yamaguchi, S., Iijima, K., Okada, K., andYamashita, K. 2000. Gender effects on age-related changes inbrain structure. Am. J. Neuroradiol. 21: 112–118.
amano, S., Sawai, N., Minami, S., Nomura, K., Yamamoto, Y.,Fukui, R., Takaoka, M., and Dohi, K. 1997. The relationship be-tween brain atrophy and asymptomatic cerebral lesions. Jpn. J.Geriat. 34: 913–919.
oshimura, K., and Kurashige, T. 2000. Age-related changes in theposterior limb of the internal capsule revealed by magnetic reso-nance imaging. Brain Dev. 22: 118–122.