
A TRANSCRIPTOMIC APPROACH TO DISSECT THE EFFECT...
188
1 University of Padova Department of Agronomy, Food, Natural resources, Animals and Environment _________________________________________________________________ DOCTORAL COURSE IN CROP SCIENCE CYCLE: XXVI A TRANSCRIPTOMIC APPROACH TO DISSECT THE EFFECT OF GRAPEVINE ROOTSTOCKS ON PLANT TOLERANCE TO ABIOTIC STRESSES AND BERRY RIPENING Head of the course: Ch.mo Prof. Antonio Berti Supervisor: Ch.mo Prof. Margherita Lucchin Co-supervisor: Dott. Claudio Bonghi Ph.D student: Massimiliano Corso
Transcript of A TRANSCRIPTOMIC APPROACH TO DISSECT THE EFFECT...
1
University of Padova
Department of Agronomy, Food, Natural resources, Animals and Environment
_________________________________________________________________
DOCTORAL COURSE IN CROP SCIENCE
CYCLE: XXVI
A TRANSCRIPTOMIC APPROACH TO DISSECT THE EFFECT OF GRAPEVINE ROOTSTOCKS ON PLANT TOLERANCE TO ABIOTIC STRESSES AND BERRY
RIPENING
Head of the course: Ch.mo Prof. Antonio Berti
Supervisor: Ch.mo Prof. Margherita Lucchin
Co-supervisor: Dott. Claudio Bonghi
Ph.D student: Massimiliano Corso

2

3
Declaration
I hereby declare that this submission is my own work and that, to the best of my
knowledge and belief, it contains no material previously published or written by another
person nor material which to a substantial extent has been accepted for the award of any
other degree or diploma of the university or other institute of higher learning, except
where due acknowledgment has been made in the text.
January 31st, 2014 Massimiliano Corso
A copy of the thesis will be available at http://paduaresearch.cab.unipd.it/

4

5
In memory of Angelo Ramina
(1944-2013)

6
7
Science is not illusion.
But it would be an illusion
to suppose that we could get
anywhere else
what it cannot give us.
Sigmund Freud, 1927

8
9
Index
Riassunto 13
Summary 19
Chapter I - General introduction 25
1. Grapevine rootstocks 26
1.1 Influence of rootstocks on grapevine abiotic stresses tolerance 27
1.2 Rootstocks widely used in viticulture and characterization of new
genotypes with OMICS techniques 29
2. Study of genes expression by using a transcriptomic approach 32
3. Grapevine and its genome 35
4. References (Chapter I) 38
Chapter II - Transcriptomes comparison of a susceptible and a putative tolerant
grapevine rootstocks to drought give insight into the mechanisms of water stress
tolerance 43
1. Introduction 44
2. Materials and methods 49
2.1 Experimental design and plant material 49
2.2 Whole transcriptome analysis 50
2.3 Multifactorial and pairwise statistical analysis 51
2.4 Ontology and Differential Clustering Analyses (DCA) 51
3. Results 54
3.1 Physiological traits analyses 54
3.2 mRNA-seq sequencing and mapping of reads to the grapevine
genome 55
3.3 Multi-factor design and discovering of differentially expressed genes 55
3.4 Differential cluster analysis (DCA) 61
4. Discussion 68
5. Acknowledgements 78
6. References (Chapter II) 79
10
Chapter III - Grapevine rootstocks differentially affected ripening inception and
auxin-related genes of Cabernet sauvignon berries 89
1. Introduction 90
2. Materials and methods 93
2.1 Plant Material and experimental design 93
2.2 RNA-seq and qPCR analyses 94
2.3 Statistical and bioinformatics analyses on mRNA-seq and
microRNA-seq data 95
2.4 Phylogenetic analyses of ARF and AUX/IAA auxin-related gene
families 96
3. Results 97
3.1 Physical and biochemical analyses 97
3.2 Differentially expressed (DE) genes, DEmiRNA and time course
clustering analyses 100
3.3 Characterization and phylogenetic analyses of grape AUX/IAA and
ARF auxin-related families 105
3.4 CS/1103P and CS/M4 berries highlights differential regulation of
auxin-related genes 107
3.5 Effect of rootstock on miRNA expression and their control of auxin
metabolisms 112
4. Discussion 114
5. Acknowledgements 122
6. References (Chapter III) 123
Chapter IV - Grape berry ripening delay induced by a prevéraison NAA treatment is
paralleled by a shift in the expression pattern of auxin- and ethylene related
genes 131
1. Introduction 132
2. Materials and methods 134
2.1 Plant Material and treatment 134
2.2 RNA extraction, microarray analysis and quantitative real time PCR 134
11
2.3 Microarray annotation and enrichment analysis 136
2.4 HORMONOMETER analyses 136
3. Results 137
3.1 Biochemical analyses 137
3.2 Differentially expressed genes and enrichment analysis 138
3.3 MapMan analysis 140
3.4 HORMONOMETER analysis 142
3.5 Expression of auxin-, ethylene-, and abscisic acid related genes 145
4. Discussion 149
5. Conclusions 155
6. Acknowledgements 156
7. References (Chapter IV) 157
Chapter V - General conclusions 163
References (Chapter V) 165
Additional Chapter - Sensorial, biochemical and molecular changes in Raboso Piave
grape berries applying “Double Maturation Raisonnée” and late harvest
Techniques 167
1. Introduction 168
2. Materials and methods 170
2.1 Plant material, treatment and biochemical analysis 170
2.2 RNA extraction, microarray analysis and qPCR 171
3. Results and discussion 173
3.1 Biochemical and sensorial analysis 173
3.2 Transcriptome profiling of TH, LH and DMR berries 175
3.3 Phenylpropanoids: metabolites and transcripts analysis 181
4. Acknowledgements 185
6. References ( Additional Chapter) 186
Ringraziamenti finali 189

12

13
RIASSUNTO
La vite (genere Vitis) rappresenta una delle principali specie coltivate su scala mondiale ,
con una produzione che si avvicina ai 70 milioni di tonnellate e una superficie coltivata di
oltre 7 milioni di ettari . Tra le 60 specie all'interno del genere Vitis, Vitis vinifera L. è la
più utilizzata per la produzione di vino e distillati. Prima della devastazione della
viticoltura europea causata dall'introduzione del parassita fillossera dal Nord America, le
varietà di V. vinifera usate per la produzione di vino in Europa non erano innestate.
Successivamente, l'utilizzo di portinnesti di origine americana ha permesso di fornire una
maggiore resistenza al parassita e ad altre malattie che stavano seriamente
compromettendo la viticolture Europea. I portinnesti più usati commercialmente derivano
da incroci di svariate specie di vite, tra cui V. berlandieri, V. riparia e V. rupestris, e, oltre
a migliorare la resistenza alla fillossera e altri patogeni, conferiscono caratteristiche di
tolleranza a stress abiotici (come siccità, elevata salinità e Fe-carenza), regolano la crescita
dell’acino, contribuiscono alla maturazione e alla qualità dei frutti, possono alterare alcuni
aspetti legati alla qualità in post-raccolta dell’acino.
I risultati presentati in questa tesi di dottorato sono parte integrante di un progetto multi-
disciplinare chiamato SERRES (selezione di nuovi portinnesti di vite resistenti a stress
abiotici attraverso lo sviluppo e la validazione di marcatori molecolari) e finanziato dalla
fondazione Ager. La selezione e la caratterizzazione di portainnesti che conferiscano un
maggiore grado di tolleranza agli stress abiotici è essenziale per lo sviluppo di modelli
agricoli sostenibili e, allo stesso tempo, per l’induzione di un rapporto equilibrato tra fase
vegetativa e produttiva, una progressione diversa della maturazione dell’uva, così come,
differenze a livello qualitativo. Migliorare la conoscenza delle basi molecolari,
biochimiche e fisiologiche della resistenza allo stress è un requisito fondamentale per la
selezione di genotipi in grado di far fronte alle condizioni di stress senza conseguenze
negative su crescita vegetativa e produzione di uva ad alta qualità.
Lo stress idrico ha un impatto enorme sulla produzione agricola, infatti, è uno dei
principali fattori che limitano la produttività delle piante e causano una grave riduzione
della resa. Sulla base dei modelli climatici globali, che prevedono un aumento delle aree
aride nel prossimo futuro, la carenza idrica può diventare il principale fattore limitante per
la coltivazione. In questo contesto, i portinnesti potrebbero assumere un ruolo importante
14
nel limitare la perdita di raccolto migliorando l'efficienza dell'uso dell'acqua, il potenziale
di sopravvivenza della pianta e la capacità di crescita del frutto in presenza di condizioni
avverse come siccità ed elevata salinità del suolo (stress osmotici). Lo stress idrico porta a
molti cambiamenti morfologici e fisiologici, tra cui ridotta espansione della parte aerea,
limitazione della crescita radicale, diminuzione della traspirazione fogliare e
dell’efficienza fotosintetica, accumulo di ioni e osmoliti, attivazione di processi di
disintossicazione e parallelamente la regolazione a livello trascrizionale di un elevato
numero di geni. In seguito allo stress idrico, si innesca uno stress secondario legato
all’accumulo di specie reattive dell'ossigeno (ROS), quali H2O2, O2-
, -OH, 1O2 e NO. Le
ROS sono responsabili della maggior parte dei danni ossidativi nei sistemi biologici e
nelle componenti cellulari. Un rigoroso controllo dei livelli delle ROS è obbligatorio per
la sopravvivenza delle piante e il cross-talk tra l’accumulo di ROS lo stato redox è parte
integrante di un preciso controllo omeostatico che gioca un ruolo fondamentale nella
risposta agli stress. Le piante innescano svariati meccanismi di riduzione del livello di
ROS (ROS-scavenging) volti all’induzione dell’espressione di geni che codificano per gli
enzimi superossido dismutasi (SOD) , catalasi (CAT), ascorbato perossidasi e glutatione
perossidasi.
Recentemente è stato condotto uno studio di caratterizzazione a livello biochimico e
fisiologico di M4 [(V. vinifera x V. Berlandieri) x V. berlandieri cv Resseguier n.1], un
nuovo genotipo di vite candidato ad essere utilizzato come portinnesto. Questo genotipo,
studiato dal 1985 dal gruppo di ricerca DiSAA dell'Università degli studi di Milano, è
stato selezionato per la sua alta tolleranza allo stress idrico (WS) e salino (SS). Se
confrontate con il genotipo commerciale 101.14, le piante di M4 sottoposte a deficit idrico
hanno mostrato una maggiore capacità di tolleranza e una più elevata attività fotosintetica
anche in condizioni di stress gravi.
Nella prima parte di questa tesi sono stati osservati i risultati ottenuti da un’analisi
trascrittomica condotta su larga scala (RNA -Seq), effettuata su foglie e radici dei
portinnesti M4 e 101.14 campionati in condizioni di stress idrico progressivo (5 time-
points). Le analisi fisiologiche sono state effettuate sulle piante trattate (deficit idrico, WS)
e di controllo (irrigate, WW) lungo tutto il campionamento. L'analisi multifattoriale, che è
stata condotta sui dati mRNA-Seq, ci ha permesso di valutare il peso di tre diverse
15
componenti sulla risposta allo stress: genotipo ( R : 101.14 e M4 ), tipo di stress imposto
(Trattamento, T : WW e WS) e time-point considerato ( P : T1 - T4 ). Con questa analisi
stato inoltre possibile identificare i geni differenzialmente espressi (GDE) legati all’azione
specifica o combinata di questi fattori (R:T , R:P , T:P e R:T:P). In WS radice si è sempre
osservati un numero maggiore di GDE rispetto alla foglia. Una prima osservazione
generale confrontando i risultati delle analisi multifattoriali eseguite su foglie e radici, è
che nel tessuto radice il "trattamento" sembra essere la variabile che ha un impatto
maggiore sull’espressione genica, mentre nel tessuto fogliare il peso del genotipo
(portinnesto) sembra essere il più elevato. Questa osservazione non è sorprendente,
considerato che il sistema radicale è il primo organo a percepire lo stress causato dalla
carenza idrica e quello principale atto alla risposta. In questo caso è chiaro che il tipo di
trattamento imposto rappresenta la variabile principale che influenza l’espressione genica
mentre l'effetto del genotipo è meno determinante. Con i dati RNA-seq è stata eseguita
una “Differential Cluster Analysis” (DCA), che si basa sul confronto delle correlazioni tra
le espressioni dei trascritti di un organismo “reference” e di un “target”. Questa analisi ci
ha permesso di identificare i pattern di co-espressione genica (T1-T4) conservati e pattern
non-conservati tra M4 e 101.14. Per quanto riguarda gli ormoni vegetali, è stata osservata
un’induzione dei geni legati ad auxine, jasmonati ed etilene nelle radici di M4 sottoposte a
stress, mentre una sovra-regolazione degli stessi trascritti è stata osservata in 101.14. La
categoria metabolica più interessante, emersa dall’analisi DCA, è quella legata ai
metaboliti secondari. Infatti sono stati individuati diversi GDE legati a questa categoria sia
in radice che in foglia di M4, indotti in condizioni di stress, ed è stata evidenziata una
forte specificità di espressione tra i due tessuti. Infatti, in condizioni di carenza idrica,
radici e foglie del genotipo tollerante M4 mostrano rispettivamente una maggiore
induzione dei geni legati agli stilbeni (i.e. STS) e ai flavonoidi (e.g. CHS, F3H, LDOX,
FLS). Il ruolo di questi geni potrebbe essere legato al controllo e al bilanciamento delle
specie reattive dell’ossigeno (ROS), in aggiunta ai classici meccanismi di ROS-scaveging
(meccanismi antiossidanti primari). In presenza di stress idrico, M4 potrebbe attuare
meccanismi differenziali in radice e foglie che portano alla produzione di molecole, come
resveratrolo e flavonoidi, correlate ad un sistema antiossidante secondario presente solo
16
nel portinnesto più tollerante. La maggiore tolleranza allo stress idrico di M4, in confronto
a quanto osservato in 101.14, potrebbe essere relativo a questi eventi.
Nella seconda parte di questa tesi, è stato valutato l’effetto dei portinnesti M4 e 1103P su
sviluppo, maturazione e qualità delle bacche di Cabernet Sauvignon (CS). Per questo
esperimento sono stati campionati da piante di CS/M4 e CS/1103P acini interi a 45, 59 e
65 giorni dopo la piena fioritura (GDF). Successivamente la maggior parte delle bacche di
CS/M4 avevano raggiunto l’invaiatura, si è quindi deciso di separare bucce e polpe per i
campionamenti successivi, condotti a 72, 86 e 100 GDF. Sulla base dei parametri fisici
(volume e colore) e chimici (solidi solubili totali, SSC), i due portinnesti hanno mostrato
una diversa influenza sulla cinetica di sviluppo e maturazione delle bacche di CS. Per
identificare le stesse fasi di sviluppo dei frutti raccolti da CS/1103P e CS/M4, è stato
condotta un’analisi di espressione preliminare, mediante sistema real-time PCR, sui geni
coinvolti nella biosintesi di fenoli, zuccheri e acidi organici. Questo approccio ha
permesso di identificare la fase verde a 45 DAFB in entrambe le combinazioni d’innesto,
mentre l’invaiatura è stata individuata a 72 e 86 DAFB rispettivamente per CS/M4 e
CS/1103P. Le analisi mRNA-seq e micro-RNAseq sono state effettuate sulle bacche in
fase di pre-invaiatura (45 GDF), invaiatura (72 GDF per CS/M4 e 86 GDF per CS/1103P)
e epoca di raccolta tradizionale di CS (100 GDF). Le analisi statistiche sono state condotte
sui dati RNA-seq confrontando il rapporto tra i dati di espressione di CS/M4 e CS/1103P
ad ogni punto della cinetica e per entrambi i tessuti. Le analisi di “clusterizzazione” e di
arricchimento hanno evidenziato la presenta di un elevato numero di GDE legati a
metabolismi auxinici. Le auxine hanno un ruolo fondamentale durante lo sviluppo e sulla
maturazione della bacca, si è quindi deciso di concentrare la nostra attenzione su questa
classe ormonale e di eseguire una caratterizzazione e un’analsi filogenetica delle famiglie
geniche ARF e AUX / IAA sul genoma di PN40024. Il ruolo delle auxine in questi
processi è stato studiato anche in un altro un altro lavoro presentato in questa tesi, durante
il quale è stato dimostrato che un trattamento sugli acini d’uva in fase di pre-invaiatura
con l’auxina sintetica NAA causa un ritardo nella maturazione, che si manifesta a livello
fisiologico e di espressione genica, parallelamente alle quali è stata osservata l’induzione
di un elevato numero di trascritti atti a controllare l’omeostasi delle auxine. Le analisi
condotte con il software HORMONOMETER hanno suggerito che il recupero
17
omeostatico atto a portare i livelli dell’ormone a concentrazioni meno elevate è avvenuto a
soli 7 giorni dal trattamento. Questa ipotesi è fortemente supportata dalla sovra-
regolazione di geni coinvolti nella coniugazione (GH3 -like) e nell'azione ( IAA4 e IAA31
-like) delle auxine. Considerando questi risultati, le differenze osservate tra CS/M4 e
CS/1103P durante lo sviluppo e la maturazione della bacca potrebbero essere collegate ad
una diversa regolazione dell’auxina. Infatti, i dati di espressione (mRNA-seq, microRNA-
seq e qPCR) evidenziato importanti differenze nel metabolismo auxinico tra le due
combinazioni d’innesto. I nostri dati suggeriscono un coinvolgimento importante
dell’ormone nel controllo dello sviluppo/maturazione della bacca grazie all’espressione di
legati, da un lato all’azione delle auxine (ARF e AUX/IAA) e, dall'altro , all’omeostasi di
questo ormone attraverso trascritti coinvolti nella coniugazione (GH3) e nel trasporto (PIN
e ABCB). In questo contesto , anche i miRNA hanno un ruolo importante, in particolare
esercitando un controllo sulla trascrizione dei geni ARF (e.g. miR160 e miR167). In fase
di pre-invaiatura, le auxine hanno un’azione positiva sulla trascrizione dei geni che
controllano le dimensioni della bacca (e.g. espansine) e di geni legati alla famiglia delle
ARF (ad esempio VvARF8A e VvARF1A ). Parallelamente all'induzione di geni che
appartengono alla famiglia ARF, è stata osservata l’induzione di trascritti che controllano i
livelli (e.g. VvGH3-1) e l'azione (VvIAA9, VvIAA15A, VvIAA16) dell’ormone,
suggerendo un’accurata regolazione dei livelli auxinici in queste fasi importanti dello
sviluppo del frutto. Inoltre, il controllo dei livelli di auxina nella bacca d’uva sembra
essere legato anche ad altri meccanismi legati all’induzione di geni legati al trasporto
ormonale durante le fasi precoci (ABCBs) e tardive (PIN) della maturazione del frutto.
Tenendo conto delle differenze osservate tra CS/M4 e CS/1103P nell’espressione di
trascritti legati al metabolismo dell’auxina, questo ormone sembra esercitare un’azione
negativa su alcuni geni legati alla maturazione della bacca (e.g. flavonoidi), ma la sua
induzione nella fase di pre-invaiatura potrebbe essere necessaria per far scattare altri
processi metabolici coinvolti nella maturazione dell’acino d’uva.

18
19
SUMMARY
Grapevine represents one of the major economic crop species on a worldwide scale, with a
world production approaching 70 million of tons and a harvest area of over 7 million
hectares. Amongst the 60 species within the Vitis genus, Vitis vinifera L. is the mostly
used for the production of wine and distilled liquors. Before the devastation of European
viticulture caused by of the introduction of phylloxera from North America, varieties of V.
vinifera used commercially for wine production in Europe were traditionally grown on
their own roots. Subsequently, the use of rootstocks from the pest’s origin was introduced
to provide resistance to this and other deleterious diseases and to save the fate of European
viticulture. Rootstocks have been bred from a number of Vitis species, especially V.
berlandieri, V. riparia, and V. rupestris, and are known, in addition to the enhanced
resistance to phylloxera and other pathogens, confer tolerance to abiotic stresses (e.g.
drought, high salinity and Fe-deficiency), regulate the size of the scion, affected fruit
development/ripening, contribute to fruit quality and can alter specific aspects of
postharvest fruit quality of a scion.
Results presented in this Ph.D thesis are a part of a larger multi-disciplinary project called
SERRES (Selection of new grape rootstocks resistant to abiotic stresses through the
development and validation of molecular markers) granted by Ager foundation. Selection
of resistant rootstocks is crucial for the development of sustainable agricultural models
and, at the same time, for inducing a balanced vegetative/productive ratio, a different
ripening progression in grape berries and, as well as, differences in their global quality.
Improving the knowledge about the molecular, biochemical and physiological bases of
stress resistance is an absolute requirement for the selection of genotypes able to cope
with stress conditions without any negative consequences on the vegetative growth and
production of high quality grape.
Drought has an enormous impact on crop production, indeed, it is one of the major factors
limiting plant productivity and cause a severe yield reduction. Based on the global climate
models, which predict an increase in the aridity in the next future, water deficit may
became the major limiting factor. In this context rootstocks may play an important role in
limiting crop loss by improving water use efficiency, potential for survival, growth
capacity and scion adaptability to stress conditions. Water deficit leads to many
20
morphological and physiological changes across a range of spatial and temporal scales,
including reduced expansion of aerial organs, maintenance of root growth, decrease in
transpiration and photosynthesis, accumulation of osmotic compounds and ions, activation
of detoxifying processes and, in parallel, the transcriptional regulation of a large number
of genes. Oxidative stress is related to the accumulation of reactive oxygen species, such
as H2O2, O2-
, -OH, 1O2, and NO. These ROS are responsible for most of the oxidative
damages in biological systems and cellular components. Thus, a strict control of ROS
levels, throughout the expression of genes coding for superoxide dismutases (SOD),
catalase (CAT), ascorbate peroxidase and glutathione peroxidise ROS scavenging
enzymes, is mandatory for plant survival and the cross-talk between ROS accumulation
and redox state is integrating part of a fine homeostasis control that plays a pivotal role in
the plant response to stresses.
Recently, a biochemical and physiological study of the M4 [(V. vinifera x V. berlandieri)
x V. berlandieri x cv Resseguier n.1] novel candidate genotype to be used as rootstock in
grapevine was performed. This genotype, established from 1985 by the DiSAA research
group operating at the Milan University, was selected for its high tolerance to water deficit
(WS) and salt exposure (SS). In comparison with the 101.14 commercial genotype, M4
un-grafted plants subjected to water and salt stress showed a greater capacity to tolerate
WS and SS maintaining photosynthetic activity also under severe stress conditions and
accumulating, especially at the root level, osmotic compounds and ions.
In the first part of this thesis were reported results obtained from a large scale whole
transcriptome analyses (RNA-seq) performed on root (whole apparatus) and leaf tissues of
101.14 (drought susceptible) and M4 plants sampled in progressive drought (five time
points). Physiological analyses were performed on treated (water-stress, WS) and control
(well-watered, WW) plants over all the sampling. The multifactorial analysis , which was
performed on mRNA -seq data concerning to both the analyzed tissues (leaf and root),
allowed us to evaluate the relative weight of the genotype (R: 101.14 and M4), of the type
of stress imposed (Treatment, T: WW and WS) and of the time point considered (P: T1-
T4), and to identify Differentially expressed Genes (DEGs) that are affected in a specific
way or the combined action of these factors (R:T, R:P, T:P and R:T:P). In WS root
dataset, all considered components (R, T and P) were found to affect the higher number of
21
genes in comparison to other dataset (WS leaf). A first general observation comparing
results of the multifactorial analyses performed on leaves and roots is that in root tissue
the “treatment” seems to be the main variable explaining differential gene expression
depend on the kind treatment imposed, whereas in leaf tissue the weight of the genotype
(rootstock) appear to be the highest. This observation is not surprising, considering that
the root system is the first organ perceiving the water deprivation stress and the main one
actively responding to it. In this case it’s clear the kind of treatment imposed represent the
main variable influencing expression whereas the effect of the genotype is less
determinant on differential expression of genes. RNA-seq data were used to performed a
Differential Cluster Analysis (DCA), which is based upon comparison of correlation
between genes expression of a “reference” and a “target” organism and allowed us to
identify conserved and diverged co-expression patterns between related organisms. This
analysis allowed us to compared the transcriptomic responses of M4 and 101.14
rootstocks. As concerns plant hormones, it was showed an induction of auxin, JAs and
GAs related-genes at the beginning of the stress kinetic in M4 stressed roots, whereas a
up-regulation of these transcripts in unstressed root was observed in 101.14. The most
interesting metabolic category was the “Secondary metabolism” one because several
DEGs belonging to these metabolisms were founded in both root and leaf upon WS, but
with a strong specificity of DEGs expression among two considered organs. Indeed, upon
WS, roots and leaves of the tolerant genotype M4 exhibit an higher induction of stilbenes
(i.e. STS) and flavonoids (e.g. CHS, F3H, LDOX, FLS) biosynthetic genes, respectively.
We hypothesized the role of these genes in the control and balance ROS levels, in addition
to the others well known ROS scavengers. In presence of water stress, M4 rootstock may
acts differential mechanisms in root and leaves which leads to the production of
molecules, such as resveratrol and flavonoids and these events may be related to a
secondary antioxidant system in this rootstock. The higher resistance of M4 rootstock to
water stress, in comparison to what observed in 101.14, should be related to these events.
In the second part, in order to evaluate the effects of the rootstocks on grape berry quality
and development/ripening, an RNA-seq experiment on Cabernet Sauvignon (CS) grafted
onto M4 and 1103 Paulsen rootstocks was carried out. Whole berries were collected from
CS/1103P and CS/M4 bunches at 45, 59, 65 days after full bloom (DAFB), in
22
correspondence to the end of lag phase. At this moment most of grape berries reached
véraison, the other samples (separating skin and pulp) were collected at 72, 86 and 100
DAFB. On the basis of physical (volume and colour) and chemical (Soluble Solids
Concentration, SSC) parameters, the two rootstocks seem to induce a different
development and ripening pattern on CS berries. To identify the same developmental
phases of berries collected from CS/1103P and CS/M4, the expression profile of genes
involved in phenols, sugar and organic acids metabolisms were overlapped. This approach
allowed to establish that the green phase occurred at 45 DAFB in both combinations,
while véraison happened at 72 and 86 DAFB for CS/M4 and CS/1103P, respectively. An
mRNA-seq and a microRNA-seq experiments were carried out on CS berries sampled at
pre-véraison (45 DAFB), véraison (72 and 86 DAFB for M4 and 1103P, respectively) and
traditional CS vintage date (100 DAFB). For the statistical analyses on RNA-seq data a
pairwise comparisons between M4 and 1103P genotypes were accomplished at each time
point and a large numbers of DEGs related to auxin metabolisms were identified with
enrichment and clustering analysis. It is well known the important role of auxins on grape
berry development, so, it was decided to focus our attention on this hormone and to
performed a characterization of grape ARF and AUX/IAA gene families. Indeed, in
another work presented in this thesis, we showed that an NAA treatment just before
véraison caused delayed grape berry ripening at the transcriptional and physiological
level, along with the recovery of a steady state of its intracellular concentration. Hormone
indices analysis carried out with the HORMONOMETER tool suggests that biologically
active concentrations of auxins were achieved throughout a homeostatic recovery. This
occurred within 7 days after the treatment, during which the physiological response was
mainly unspecific and due to a likely pharmacological effect of NAA. This hypothesis is
strongly supported by the up-regulation of genes involved in auxin conjugation (GH3-like)
and action (IAA4- and IAA31-like). Considering these results, the differences observed
among CS/M4 and CS/1103P in grape berry development and ripening should be related
to a different regulation of auxin metabolism. Indeed, all transcripts/miRNAs analyses
performed (RNA-seq, microRNA-seq and qPCR) highlighted important differences in the
auxin metabolism among the two scion/rootstock combination. Our data suggest an
important involvement in the control of grape berry development/ripening of genes that
23
are related, on one hand to auxin action (ARF and AUX/IAA) and, on the other hand, to
homeostasis of this hormone through the expression of genes involved in conjugation
(GH3) and transport (PIN and ABCB). In this context, also miRNA have an important
role, especially by controlling ARF–related genes (e.g. miR160 and miR167). In the case
of fruit ripening, auxin acted as a positive regulator of genes that control grape berry size
(e.g. expansin-related genes) before the véraison stage; it was indeed observed the up-
regulation at the pre-véraison stage, which was different for CS/M4 and CS/1103P, of
transcripts that control auxin-responsive genes (e.g. VvARF8A and VvARF1A). The
induction of genes that belonged to ARF family was paralleled by the expression of
transcripts that control auxin level(e.g. VvGH3-1) and action (VvIAA9, VvIAA15A,
VvIAA16), suggesting that an accurate regulation of auxin homeostasis in grape berries at
these phases. Moreover, control of auxin levels in grape berry seems pass through other
mechanisms which involved control of transport-related genes in the early (ABCBs) and
late (PINs) phases of berry development. Taking into accounts that at commercial CS
harvest, CS/M4 berries berries were showing differences in some processes ripening-
related (e.g. flavonoids metabolism) and a different regulation of auxin metabolisms,
when compared to those of CS/1103P, auxin seems to act as negative regulators on some
genes related to grape berry ripening but its induction at the pre-véraison stage could be
necessary to triggers other metabolism involved in ripening processes.

24

25
Chapter I
GENERAL INTRODUCTION
26
1. Grapevine rootstocks
Grafting, which involves the combination of two different varieties or species to form a
plant with new characteristics, is a technique extensively used in the cultivation of several
horticultural species, such as grapevine, apple and peach. Grafting technique involves the
areal part, called scion, which is grafted onto the basal portion, called rootstock, of the
plant (Arrigo and Arnold, 2007; Lee et al., 2010). So, the new-formed individual is made
up by two bionts (scion and rootstock), which are characterized by two different
genotypes. Grafting has two parameters of importance: ease of grafting and affinity
between scion/rootstock combination (Gregory et al., 2013). To obtain a successful
grafting the vascular cambium, responsible for cell division, of both bionts has to be in
contact in order to connect xylem and phloem (Marguerit et al., 2012). In viticulture,
practice of grafting was already widespread in ancient times but the principal reason for
the widespread use of grafting in viticulture was the Daktulosphaira vitifoliae (phylloxera)
epidemic. Phylloxera, native to North America, was introduced into Europe at the end of
the nineteenth century and destroyed around four million of vineyard hectares. There are
some evidences that a Bordeaux grower called Leo Laliman was the first to advise
grafting European grape vines, Vitis vinifera, onto rootstocks from Vitis species originate
from North America. The higher resistance to this pests observed in the American species
is related to their co-evolution with phylloxera, which leads to the development of
resistance mechanisms that still are not completely understood. Proper sanitation may
reduce the risk of phylloxera infestation, but it is no guarantee against its spread. The
potential economic loss from phylloxera infestation is so great that planting on resistant
rootstocks is recommended even in regions where phylloxera is not yet present (Arrigo
and Arnold, 2007).
In addition to the enhanced resistance to phylloxera, the growth of many plants in
cultivated systems is profoundly affected by selection of appropriate rootstocks.
Rootstocks have been bred from a number of Vitis species, especially V. berlandieri, V.
riparia, and V. rupestris, and are known to confer resistance to various pathogens,
tolerance to abiotic stresses (e.g. drought, high salinity and Fe2+
-deficiency), regulate the
size of the scion, affected fruit development/ripening, contribute to fruit quality and
further they can alter specific aspects of postharvest fruit quality of a scion (Arrigo and
27
Arnold, 2007; Lee et al., 2010; Gregory et al., 2013; Marguerit et al., 2012; Fisarakis et
al., 2001; Grant and Matthews, 1996; Walker et al., 2002, 2004).
1.1 Influence of rootstocks on grapevine abiotic stresses tolerance
In addition to their ability to helped scion to cope with biotic stresses, rootstocks can
confer also tolerance to a large range of abiotic stresses. Among these, drought and high
salinity have an enormous impact on crop production, indeed, they were ones of the major
factors limiting plant productivity and cause a severe yield reduction (Cramer et al.,
2007). So, breeding of crop varieties that use water more efficiently is a key strategy for
the improvement of agro systems (Marguerit et al., 2012). Based on the global climate
models, which predict an increase in the aridity in the next future (Dai, 2013), water
deficit may became the major limiting factor. In this context rootstocks may play an
important role in limiting crop loss by improving water use efficiency, potential for
survival, growth capacity and scion adaptability to stress conditions (Marguerit et al.,
2012).
Rootstocks exhibit differential degrees of tolerance in response to drought, for example
101-14 and Schwarzmann are considered less tolerant, while Lider 116-60, Ramsey, 1103
Paulsen, 140 Ruggeri, Kober 5BB and Richter 110 confer to scion higher drought
tolerance (Flexas et al., 2009).
The ability of these rootstocks to confer high tolerance to water stress depend on several
factors. For some perennial crop species, altered scion vigour has been linked to
differences in hydraulic parameters of the root system. Gambetta et al. (2012) hypotized a
pivotal role of aquaporins proteins in relation to grapevine rootstocks vigour and control
of water use during drought. In this study they showed that VvPIPs expression was
consistently higher in high-vigour rootstock and demonstrate their role in control of
rootstocks vigour. The hydraulic capacity of a root system to deliver water scion is related
to the increase in Lpr (per root surface area or per biomass), and/or whole-root-system
surface area. Indeed, (Alsina et al., 2011) found that grapevines grafted onto 1103P
rootstock (high vigour) exhibited greater whole-root-system hydraulic conductance
compared to 101-14 (low vigour) resulting from continued growth at greater depth during
the warmer and drier summer months.
28
Stomata have another important role in regulating water loss during water stress
(Marguerit et al., 2012), and stomatal closure is one of the earliest responses to water
deficit (Damour et al., 2010). So, grapevine rootstocks which increased the efficiency of
stomatal closure control and water use efficiency induced also a major tolerance to water
stress.
Salt stress is another environmental perturbation which negatively affects grapevine
growth and yield. High salinity cause problems in water uptake and availability of
micronutrients, increasing toxic-ion concentration and degradation of soil structure (Ismail
et al., 2013). Vitis vinifera is moderately sensitive to high salinity in the soil and damages
caused by this stress are primary related to the chloride ions. The inhibition of grapevine
growth and CO2 assimilation in relation to high salinity is mainly due to changes in
stomatal conductance (similarly to what observed for water stress), electron transport rate,
leaf water potential, chlorophyll, fluorescence, osmotic potential, and leaf ion
concentrations (Cramer et al., 2007). Together with these physiological problems, salt
stress causes, at molecular level, formation of reactive oxygen species (ROS), membrane
disorganization, metabolic toxicity and reduced nutrient acquisition, as well as induction
of several genes related to plant hormones (e.g. abscissic acid and jasmonates) (Cramer et
al., 2007; Ismail et al., 2012). Grapevine responses to salinity depends on several factors,
such as soil type, rootstock–scion combination, irrigation system and climate. Grapevine
are more sensitive to Cl− toxicity than Na
+ toxicity (Cramer 2007). Rootstocks obtained
from wild Vitis species differ widely in their ability to exclude Cl− (in reducing order V.
rupestris, V. cinerea, V. champini and V. berlandieri), and consequently in their capability
to higher tolerate salinity; so, response efficiency of the scion in presence of salt soils vary
in relation to the comparative exclusion of sodium versus chloride by the genotype of the
root system (Fisarakis et al., 2001). Fisarakis et al. (2001) showed that there is a great
variability in the uptake and accumulation of Na+ and Cl− among rootstocks. In this work
they showed that V. berlandieri specie had a great ability for Cl− and/or Na+ exclusion,
although this ability is reduced in hybrids having V. vinifera as parent. This explains the
reduced ability for Cl− exclusion of 41B (V.berlandieri×V.vinifera) compared to other
rootstocks. Salinity, as well as water stress, negatively affects grapevine yield. In Walker
et al. (2002) was shown a strong influence of rootstock on scion production upon salt
29
stress. In particular they observed that rootstocks imparting most vigour at high salinity
(e.g. Ramsey, 1103 Paulsen and R2), determined by the weight of one-year-old pruning
wood in each year also produced a higher number of bunches per vine at both the medium
and high salinity treatments.
Iron chlorosis is further physiopathology that affects grapevine grown on calcareous soil.
Iron (Fe) deficiency chlorosis, associated with high levels of soil bicarbonate is one of the
main nutritional disorders observed in sensitive grapevine genotypes. Fe deficiency causes
a reduction of grapevine longevity and productivity, affected growth and reduced yield
(Covarrubias and Rombolà, 2013). Grapevine upon iron chlorosis stress enhance the
activity of Fe-reductase enzyme and increase the release of protons and organic
compounds in roots. This result in a lower pH and higher solubility of Fe(III) and is
known as strategy I (Jiménez et al., 2007). In this context bicarbonate concentration is
particularly important, indeed bicarbonate is one of the main factors causing Fe chlorosis
in strategy I plants but mechanisms of its involvement in this stress are still not clear
(Covarrubias and Rombolà, 2013). Several V. vinifera cultivars are subjected to stress
induced by calcareous soils, however the use of selected rootstocks can solve this
problems. For example, Bavaresco and Lovisolo (2000) showed that different
scion/rootstock combinations among three Pinot blanc cultivars and two rootstocks (SO4
and 3309C) lead up to different results in response to iron chlorosis, strongly related to the
chlorophyll content and vegetative growth which were correlated with specific
conductivity in scion/rootstock surface. In another work, Bavaresco et al. (1993)
compared the response of 140 Ruggeri and 101.14 rootstocks to iron choloris showing that
the iron-efficient rootstock (140 Ruggeri) did not induce chlorosis when growing on the
calcareous soil, while the opposite occurred with the iron-inefficient rootstock (101.14).
1.2 Rootstocks widely used in viticulture and characterization of new
genotypes with OMICS techniques
Widely used grapevine rootstocks are individuals derived from crosses of two or more
species belonging to the genus Vitis. In particular, the majority of commercial rootstocks
used in viticulture belong to V. riparia, V. berlandieri and V. ruprestris hybrids (Arrigo
and Arnold, 2007), leading to a narrow genetic variability. Indeed, 90% of cultivated vines
are grafted onto less than ten rootstocks
This situation may cause several risk, such as the onset of pathogens, nematodes and
insects mutations which leads these species
example is the AxR1 Californian
used for effectiveness loss (Grant and Matthews, 1996)
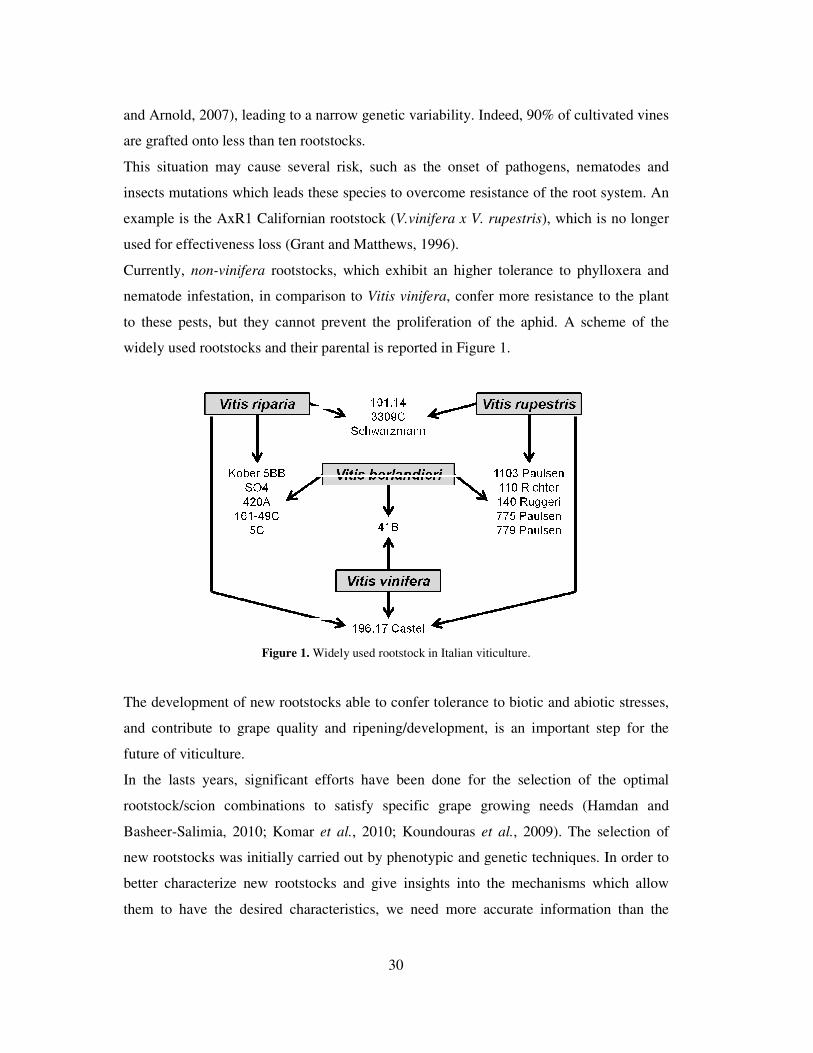
Currently, non-vinifera rootstocks, which exhibit an higher tolerance to
nematode infestation, in comparison to
to these pests, but they cannot
widely used rootstocks and their parental is reported in Figure 1.
Figure 1. Widely used rootstock in Italian viticulture.
The development of new rootstocks able to confer tolerance to biotic and abiotic stresses,
and contribute to grape quality and ripening/development, is an important step for the
future of viticulture.
In the lasts years, significant efforts have been done
rootstock/scion combinations to satisfy specific
Basheer-Salimia, 2010; Komar et al.
new rootstocks was initially carried out by phenotypic and genetic techni
better characterize new rootstocks and give insights into the mechanisms which allow
them to have the desired characteristics, we need more accurate information than the
30
narrow genetic variability. Indeed, 90% of cultivated vines
rootstocks.
his situation may cause several risk, such as the onset of pathogens, nematodes and
insects mutations which leads these species to overcome resistance of the root system.
n rootstock (V.vinifera x V. rupestris), which is no longer
(Grant and Matthews, 1996).
rootstocks, which exhibit an higher tolerance to phylloxera and
nematode infestation, in comparison to Vitis vinifera, confer more resistance to the plant
prevent the proliferation of the aphid. A scheme of the
widely used rootstocks and their parental is reported in Figure 1.
Widely used rootstock in Italian viticulture.
f new rootstocks able to confer tolerance to biotic and abiotic stresses,
and contribute to grape quality and ripening/development, is an important step for the
ignificant efforts have been done for the selection of the optimal
rootstock/scion combinations to satisfy specific grape growing needs (Hamdan and
et al., 2010; Koundouras et al., 2009). The selection of
new rootstocks was initially carried out by phenotypic and genetic techniques. In order to
better characterize new rootstocks and give insights into the mechanisms which allow
them to have the desired characteristics, we need more accurate information than the
narrow genetic variability. Indeed, 90% of cultivated vines
his situation may cause several risk, such as the onset of pathogens, nematodes and
of the root system. An
, which is no longer
lloxera and
resistance to the plant
the proliferation of the aphid. A scheme of the
f new rootstocks able to confer tolerance to biotic and abiotic stresses,
and contribute to grape quality and ripening/development, is an important step for the
of the optimal
(Hamdan and
The selection of
ques. In order to
better characterize new rootstocks and give insights into the mechanisms which allow
them to have the desired characteristics, we need more accurate information than the
phenotypical one. Actually, the developmente of the “omics” sciences
transcriptomic, proteomic and metabolomic approaches became essential to functionally
characterize the selected rootstocks and to understand the effect of these rootstocks on the
scion (Deluc et al., 2009; Grimplet
et al., 2013; Wang et al., 2009)
A multi-disciplinary approach was carried out with the AGER
(http://users.unimi.it/serres/index.html
rootstock resistant to abiotic stresses through the development and validation of molecular
markers) project was to create the basis for
currently limited by the low availability of rootstocks
adverse growing conditions, such as water scarcity, salinity o
this project, the adaptive responses to environmental stresses (
and calcareous soils) of new putative
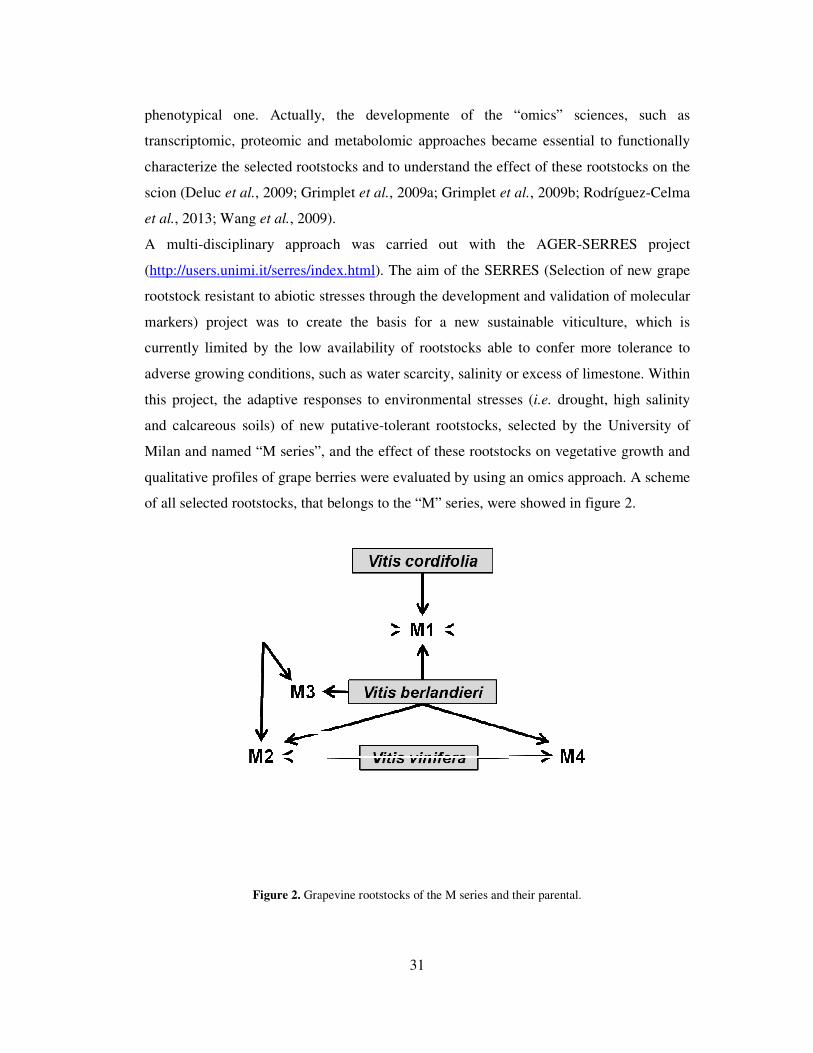
Milan and named “M series”, and the effect of these rootstocks
qualitative profiles of grape berries were evaluated by using an omics approach
of all selected rootstocks, that belongs to the “M” series, were showed in figure 2.
Figure 2. Grapevine rootstocks of the M series and their parental.
31
phenotypical one. Actually, the developmente of the “omics” sciences
transcriptomic, proteomic and metabolomic approaches became essential to functionally
characterize the selected rootstocks and to understand the effect of these rootstocks on the
, 2009; Grimplet et al., 2009a; Grimplet et al., 2009b; Rodríguez
, 2009).
disciplinary approach was carried out with the AGER-SERRES project
http://users.unimi.it/serres/index.html). The aim of the SERRES (Selection of
esistant to abiotic stresses through the development and validation of molecular
to create the basis for a new sustainable viticulture, which is
the low availability of rootstocks able to confer more tolerance to
adverse growing conditions, such as water scarcity, salinity or excess of limestone. Within
this project, the adaptive responses to environmental stresses (i.e. drought, high salinity
and calcareous soils) of new putative-tolerant rootstocks, selected by the University of
Milan and named “M series”, and the effect of these rootstocks on vegetative
berries were evaluated by using an omics approach
that belongs to the “M” series, were showed in figure 2.
Grapevine rootstocks of the M series and their parental.
phenotypical one. Actually, the developmente of the “omics” sciences, such as
transcriptomic, proteomic and metabolomic approaches became essential to functionally
characterize the selected rootstocks and to understand the effect of these rootstocks on the
2009b; Rodríguez-Celma
SERRES project
Selection of new grape
esistant to abiotic stresses through the development and validation of molecular
sustainable viticulture, which is
able to confer more tolerance to
r excess of limestone. Within
drought, high salinity
olerant rootstocks, selected by the University of
on vegetative growth and
berries were evaluated by using an omics approach. A scheme
that belongs to the “M” series, were showed in figure 2.
32
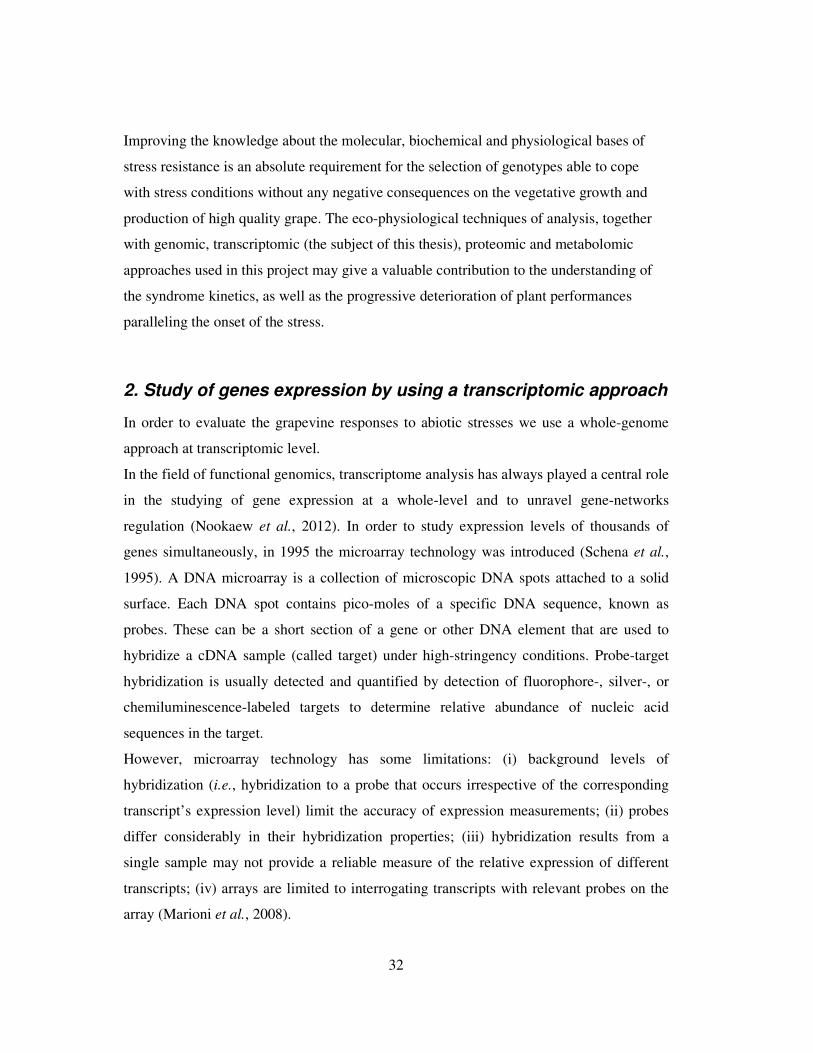
Improving the knowledge about the molecular, biochemical and physiological bases of
stress resistance is an absolute requirement for the selection of genotypes able to cope
with stress conditions without any negative consequences on the vegetative growth and
production of high quality grape. The eco-physiological techniques of analysis, together
with genomic, transcriptomic (the subject of this thesis), proteomic and metabolomic
approaches used in this project may give a valuable contribution to the understanding of
the syndrome kinetics, as well as the progressive deterioration of plant performances
paralleling the onset of the stress.
2. Study of genes expression by using a transcriptomic approach
In order to evaluate the grapevine responses to abiotic stresses we use a whole-genome
approach at transcriptomic level.
In the field of functional genomics, transcriptome analysis has always played a central role
in the studying of gene expression at a whole-level and to unravel gene-networks
regulation (Nookaew et al., 2012). In order to study expression levels of thousands of
genes simultaneously, in 1995 the microarray technology was introduced (Schena et al.,
1995). A DNA microarray is a collection of microscopic DNA spots attached to a solid
surface. Each DNA spot contains pico-moles of a specific DNA sequence, known as
probes. These can be a short section of a gene or other DNA element that are used to
hybridize a cDNA sample (called target) under high-stringency conditions. Probe-target
hybridization is usually detected and quantified by detection of fluorophore-, silver-, or
chemiluminescence-labeled targets to determine relative abundance of nucleic acid
sequences in the target.
However, microarray technology has some limitations: (i) background levels of
hybridization (i.e., hybridization to a probe that occurs irrespective of the corresponding
transcript’s expression level) limit the accuracy of expression measurements; (ii) probes
differ considerably in their hybridization properties; (iii) hybridization results from a
single sample may not provide a reliable measure of the relative expression of different
transcripts; (iv) arrays are limited to interrogating transcripts with relevant probes on the
array (Marioni et al., 2008).
33
In recent years Next Generation Sequencing (NGS) technology, which is a novel high-
throughput sequencing technology producing millions of sequences per single sequencing
run, has emerged (Fu et al., 2009). Among NGS techniques, RNA-seq is the most used for
transcriptomics studies. This is due to the fast development of the technology, together
with the decrease in the running cost and the possibility to uncover novel transcriptional-
related events.
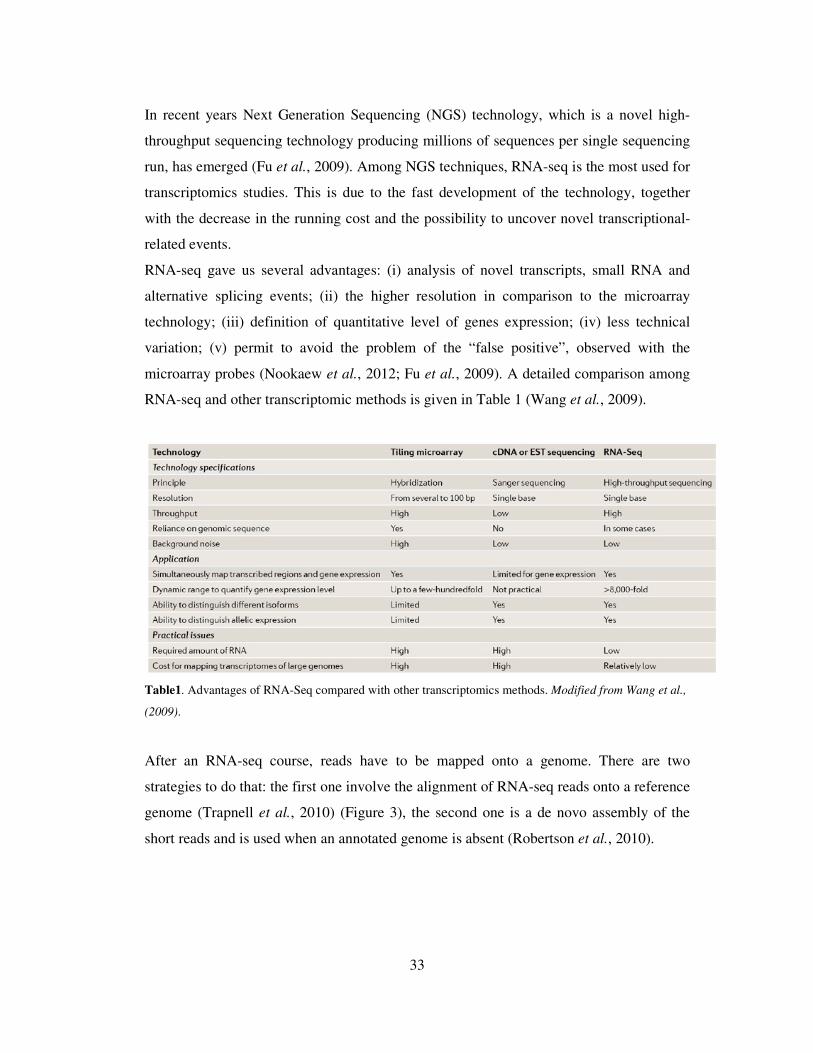
RNA-seq gave us several advantages: (i) analysis of novel transcripts, small RNA and
alternative splicing events; (ii) the higher resolution in comparison to the microarray
technology; (iii) definition of quantitative level of genes expression; (iv) less technical
variation; (v) permit to avoid the problem of the “false positive”, observed with the
microarray probes (Nookaew et al., 2012; Fu et al., 2009). A detailed comparison among
RNA-seq and other transcriptomic methods is given in Table 1 (Wang et al., 2009).
Table1. Advantages of RNA-Seq compared with other transcriptomics methods. Modified from Wang et al.,
(2009).
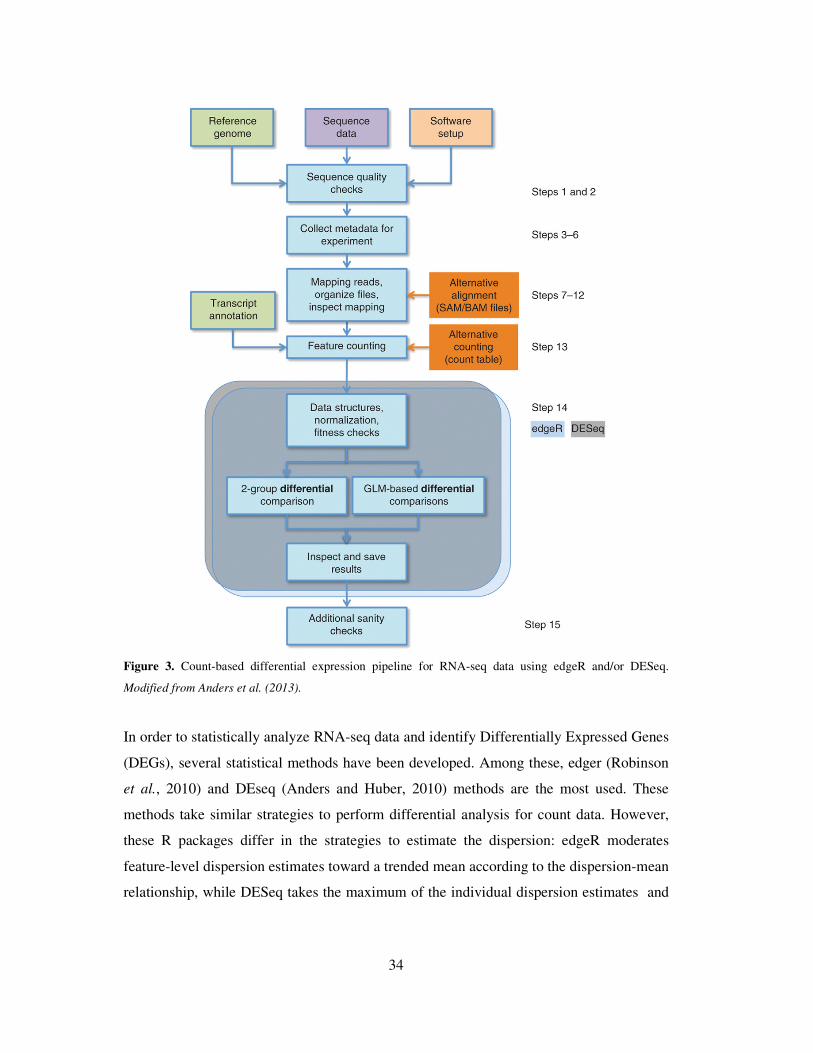
After an RNA-seq course, reads have to be mapped onto a genome. There are two
strategies to do that: the first one involve the alignment of RNA-seq reads onto a reference
genome (Trapnell et al., 2010) (Figure 3), the second one is a de novo assembly of the
short reads and is used when an annotated genome is absent (Robertson et al., 2010).
34
Figure 3. Count-based differential expression pipeline for RNA-seq data using edgeR and/or DESeq.
Modified from Anders et al. (2013).
In order to statistically analyze RNA-seq data and identify Differentially Expressed Genes
(DEGs), several statistical methods have been developed. Among these, edger (Robinson
et al., 2010) and DEseq (Anders and Huber, 2010) methods are the most used. These
methods take similar strategies to perform differential analysis for count data. However,
these R packages differ in the strategies to estimate the dispersion: edgeR moderates
feature-level dispersion estimates toward a trended mean according to the dispersion-mean
relationship, while DESeq takes the maximum of the individual dispersion estimates and
35
the dispersion-mean trend. In practice, this means DESeq is less powerful, whereas edgeR
is more sensitive to outliers. Recent comparative studies have highlighted that no single
method dominates another across all settings (Anders et al., 2013) (Figure 3).
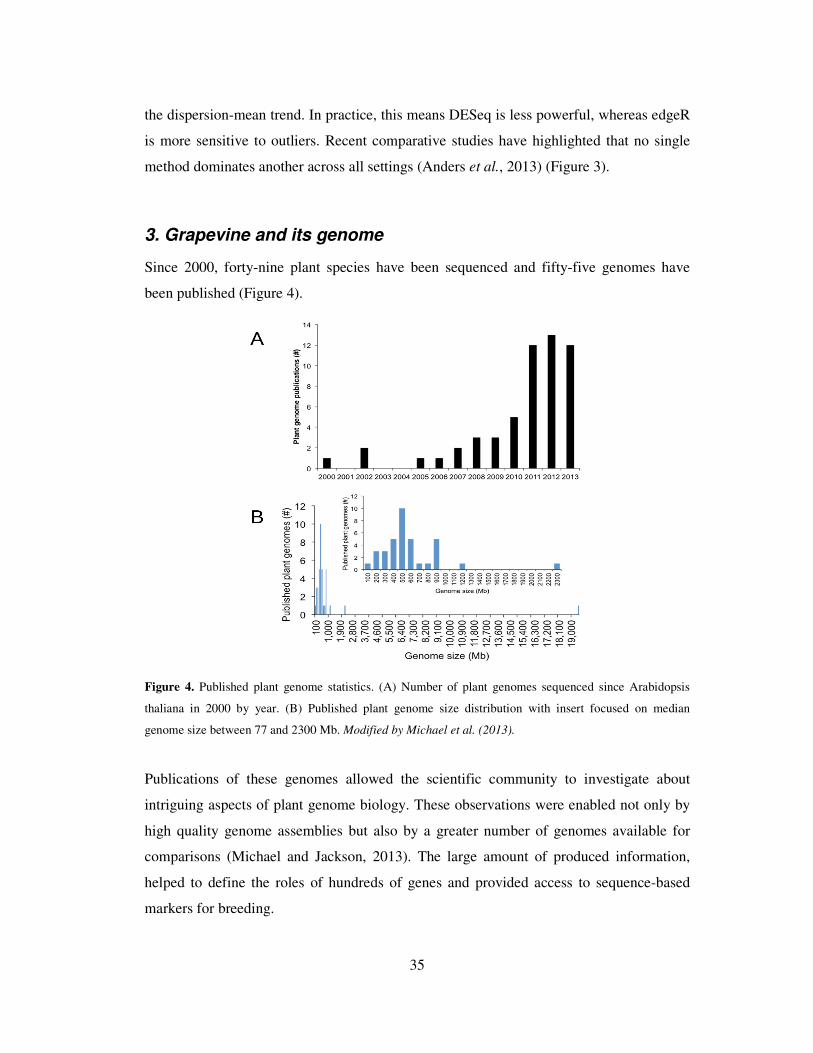
3. Grapevine and its genome
Since 2000, forty-nine plant species have been sequenced and fifty-five genomes have
been published (Figure 4).
Figure 4. Published plant genome statistics. (A) Number of plant genomes sequenced since Arabidopsis
thaliana in 2000 by year. (B) Published plant genome size distribution with insert focused on median
genome size between 77 and 2300 Mb. Modified by Michael et al. (2013).
Publications of these genomes allowed the scientific community to investigate about
intriguing aspects of plant genome biology. These observations were enabled not only by
high quality genome assemblies but also by a greater number of genomes available for
comparisons (Michael and Jackson, 2013). The large amount of produced information,
helped to define the roles of hundreds of genes and provided access to sequence-based
markers for breeding.

36
As concerns grapevine, the complete genome sequence was obtained in 2007 (Table 2) by
two independent projects (Jaillon et al., 2007; Velasco et al., 2007). The availability of the
genomic sequence gave the opportunity to conduct several genome-wide studies focused
on different aspects of grape biology such as berry development and response to different
biotic and abiotic stresses (Bottcher et al., 2013; Castellarin et al., 2007; Chaves et al.,
2010; Ziliotto et al., 2012; Vannozzi et al., 2012; Dal Santo et al., 2013; Fasoli et al.,
2012), as already described in the above chapter.
Table 2. Grape published genomes. Abreviations: kb, kilobases; Mb, megabases; Chr, chromosome; PMID,
PubMed ID.
The sequencing of the grapevine genome represented the fourth genome of the flowering
plants, the second one among wood plants and the first one concerning fruit producting
plants (Michael and Jackson, 2013). The French-italian sequencing (Jaillon et al., 2007)
was obtained by the selection of the PN40024 line, a particular Pinot Noir clone
characterized by a high degree of homozygosity (approximately 84%) and obtained
through multiple auto-fecundation cycles in order to by-pass the high heterozygosis that
characterize grapevine. The other grape genome, published by the Institute of S. Michele
all’Adige (IASMA, Velasco et al., 2007), was obtained by sequencing the heterozygous
clone ENTAV115 of Pinot Noir cultivar.
The actual genome sequence available on line is the 12X assembly coverage of PN40024
(http://genomes.cribi.unipd.it/grape/), the last annotation of the genome was carried out by
the CRIBI institute (University of Padova, Italy) by using data retrieved from the
PN40024 clone.
As concern PN40024, the genome size is approximately 475 Mb and 30,434 genes have
been identified. On the other hand, genome sequence obtained by the ENTAV115 clone,
is slightly larger, with a size for the haploid genome estimated at 505 Mb and a total
Paper Size
(Mb)
Assembled
(Mb)
Assem
(%)
gene
(#)
repeat
(%)
scaffold N50
(kb)
contig N50
(kb)
Sequencer
types
PMID
Jaillon et al. (2007) 475 487 103 30,434 41 2,065 66 Sanger 17721507
Velasco et al. (2007) 505 477 95 29,585 27 1,330 18Sanger,
Roche/445418094749
37
number of 29,585 gene prediction (http://genomics.research.iasma.it/gb2/gbrowse/grape/).
More detailed information about PN40024 and ENTAV115 are indicated in Table 2.
The public release of these genomes represents a remarkable goal, but also a formidable
starting point for a vast range of studies aimed at improving our knowledge about gene
function and genetic variability in this species. Transfer and interpretation of results
obtained in model organisms on molecular mechanisms involved in the determination of
important agronomical characters is now feasible together with the new opportunity for a
molecular breeding in grapevine.
The advent of high-throughput re-sequencing technologies (Bentley, 2006),we have
entered an exciting era in which we can finally learn what differences are found among
individuals within a species at the DNA sequence level. Recent data obtained from
different plant species have shown us how plastic, dynamic and variable plant genomes
are. Comparison of genomic sequences related to different cultivar of Vitis vinifera species
highlighted the presence of a core genome containing genes that are present in all strains
and a dispensable genome composed of partially shared and strain-specific DNA sequence
elements. Morgante et al.(2007) introduced this new concept called ‘pangenome’ (from
the Greek word pan, meaning whole).
In recent years, the number of Vitis vinifera cultivar and other non-vinifera species re-
sequenced has significantly increased, due to the lower cost and the higher speed of
analysis of new generation sequencer (e.g. SOLiD, Illumina, Roche/454, Proton)
(citazione). This should allow us to extend the concept of pan-genome to the genus Vitis,
by indentifying a core genome which contains genes shared among V. vinifera and non-
vinifera species (e.g. V. rupestris, V. berlandieri, V. riparia and intra-specific hybrids).
38
4. References
Alsina MM, Smart DR, Bauerle T, de Herralde F, Biel C, Stockert C, Negron C, Save R. 2011. Seasonal changes of whole root system conductance by a drought-tolerant grape
root system. Journal of experimental botany 62, 99-109.
Anders S, Huber W. 2010. Differential expression analysis for sequence count data.
Genome Biology 11, R106.
Anders S, McCarthy DJ, Chen Y, Okoniewski M, Smyth GK, Huber W, Robinson MD. 2013. Count-based differential expression analysis of RNA sequencing data using R
and Bioconductor. Nature protocols 8, 1765-1786.
Arrigo N, Arnold C. 2007. Naturalised Vitis rootstocks in Europe and consequences to
native wild grapevine. PloS one 2, e521.
Bavaresco L, Fraschini P, Perino A. 1993. Effect of the rootstock on the occurrence of
lime-induced chlorosis of potted Vitis vinifera L. cv. ‘Pinot blanc’. Plant and Soil 157,
305-311.
Bavaresco L, Lovisolo C. 2000. Effect of grafting on grapevine chlorosis and hydraulic
conductivity. Vitis 39, 89-92.
Bentley DR. 2006. Whole-genome re-sequencing. Current opinion in genetics &
development 16, 545-552.
Bottcher C, Burbidge C, Boss P, Davies C. 2013. Interactions between ethylene and
auxin are crucial to the control of grape (Vitis vinifera L.) berry ripening. BMC Plant
Biology 13, 222.
Castellarin S, Matthews M, Gaspero G, Gambetta G. 2007. Water deficits accelerate
ripening and induce changes in gene expression regulating flavonoid biosynthesis in grape
berries. Planta 227, 101-112.
Chaves MM, Zarrouk O, Francisco R, Costa JM, Santos T, Regalado AP, Rodrigues ML, Lopes CM. 2010. Grapevine under deficit irrigation: hints from physiological and
molecular data. Annals of Botany 105, 661-676.
Covarrubias J, Rombolà A. 2013. Physiological and biochemical responses of the iron
chlorosis tolerant grapevine rootstock 140 Ruggeri to iron deficiency and bicarbonate.
Plant and Soil 370, 305-315.
Cramer G, Ergül A, Grimplet J, Tillett R, Tattersall ER, Bohlman M, Vincent D, Sonderegger J, Evans J, Osborne C, Quilici D, Schlauch K, Schooley D, Cushman J.
2007. Water and salinity stress in grapevines: early and late changes in transcript and
metabolite profiles. Functional & integrative genomics 7, 111-134.
Dai A. 2013. Increasing drought under global warming in observations and models.
Nature Climate Change 3, 52-58.
39
Dal Santo S, Tornielli G, Zenoni S, Fasoli M, Farina L, Anesi A, Guzzo F, Delledonne M, Pezzotti M. 2013. The plasticity of the grapevine berry transcriptome. Genome
Biology 14, r54.
Damour G, Simonneau T, Cochard H, Urban L. 2010. An overview of models of
stomatal conductance at the leaf level. Plant, Cell & Environment 33, 1419-1438.
Deluc LG, Quilici DR, Decendit A, Grimplet J, Wheatley MD, Schlauch KA, Merillon JM, Cushman JC, Cramer GR. 2009. Water deficit alters differentially
metabolic pathways affecting important flavor and quality traits in grape berries of
Cabernet Sauvignon and Chardonnay. BMC genomics 10, 212.
Fasoli M, Dal Santo S, Zenoni S, Tornielli GB, Farina L, Zamboni A, Porceddu A, Venturini L, Bicego M, Murino V, Ferrarini A, Delledonne M, Pezzotti M. 2012. The
grapevine expression atlas reveals a deep transcriptome shift driving the entire plant into a
maturation program. The Plant cell 24, 3489-3505.
Fisarakis I, Chartzoulakis K, Stavrakas D. 2001. Response of Sultana vines (V.
vinifera L.) on six rootstocks to NaCl salinity exposure and recovery. Agricultural Water
Management 51, 13-27.
Flexas J, Barón M, Bota J, Ducruet J-M, Gallé A, Galmés J, Jiménez M, Pou A, Ribas-Carbó M, Sajnani C, Tomàs M, Medrano H. 2009. Photosynthesis limitations
during water stress acclimation and recovery in the drought-adapted Vitis hybrid Richter-
110 (V. berlandieri×V. rupestris). Journal of experimental botany 60, 2361-2377.
Fu X, Fu N, Guo S, Yan Z, Xu Y, Hu H, Menzel C, Chen W, Li Y, Zeng R, Khaitovich P. 2009. Estimating accuracy of RNA-Seq and microarrays with proteomics.
BMC genomics 10, 161.
Gambetta GA, Manuck CM, Drucker ST, Shaghasi T, Fort K, Matthews MA, Walker MA, McElrone AJ. 2012. The relationship between root hydraulics and scion
vigour across Vitis rootstocks: what role do root aquaporins play? Journal of experimental
botany 63, 6445-6455.
Grant RS, Matthews MA. 1996. The Influence of Phosphorus Availability, Scion, and
Rootstock on Grapevine Shoot Growth, Leaf Area, and Petiole Phosphorus Concentration.
American Journal of Enology and Viticulture 47, 217-224.
Gregory PJ, Atkinson CJ, Bengough AG, Else MA, Fernández-Fernández F, Harrison RJ, Schmidt S. 2013. Contributions of roots and rootstocks to sustainable,
intensified crop production. Journal of experimental botany 64, 1209-1222.
Grimplet J, Cramer GR, Dickerson JA, Mathiason K, Van Hemert J, Fennell AY.
2009a. VitisNet: "Omics" integration through grapevine molecular networks. PloS one 4,
e8365.
Grimplet J, Wheatley MD, Jouira HB, Deluc LG, Cramer GR, Cushman JC. 2009b.
Proteomic and selected metabolite analysis of grape berry tissues under well-watered and
water-deficit stress conditions. Proteomics 9, 2503-2528.
40
Hamdan A-JS, Basheer-Salimia R. 2010. Preliminary Compatibility between Some
Table-Grapevine Scion and Phylloxera-Resistant Rootstock Cultivars. Jordan Journal of
Agricultural Sciences 6, 1-10.
Ismail A, Riemann M, Nick P. 2012. The jasmonate pathway mediates salt tolerance in
grapevines. Journal of experimental botany 63, 2127-2139.
Ismail A, Seo M, Takebayashi Y, Kamiya Y, Eiche E, Nick P. 2013. Salt adaptation
requires efficient fine-tuning of jasmonate signalling. Protoplasma, 1-18.
Jaillon O, Aury JM, Noel B, Policriti A, Clepet C, Casagrande A, Choisne N, Aubourg S, Vitulo N, Jubin C, Vezzi A, Legeai F, Hugueney P, Dasilva C, Horner D, Mica E, Jublot D, Poulain J, Bruyere C, Billault A, Segurens B, Gouyvenoux M, Ugarte E, Cattonaro F, Anthouard V, Vico V, Del Fabbro C, Alaux M, Di Gaspero G, Dumas V, Felice N, Paillard S, Juman I, Moroldo M, Scalabrin S, Canaguier A, Le Clainche I, Malacrida G, Durand E, Pesole G, Laucou V, Chatelet P, Merdinoglu D, Delledonne M, Pezzotti M, Lecharny A, Scarpelli C, Artiguenave F, Pe ME, Valle G, Morgante M, Caboche M, Adam-Blondon AF, Weissenbach J, Quetier F, Wincker P. 2007. The grapevine genome sequence suggests ancestral hexaploidization in
major angiosperm phyla. Nature 449, 463-467.
Jiménez S, Gogorcena Y, Hévin C, Rombolà AD, Ollat N. 2007. Nitrogen nutrition
influences some biochemical responses to iron deficiency in tolerant and sensitive
genotypes of Vitis. Plant and Soil 290, 343-355.
Komar V, Vigne E, Demangeat G, Lemaire O, Fuchs M. 2010. Comparative
Performance of Virus-Infected Vitis vinifera cv. Savagnin rose Grafted onto Three
Rootstocks. American Journal of Enology and Viticulture 61, 68-73.
Koundouras S, Hatzidimitriou E, Karamolegkou M, Dimopoulou E, Kallithraka S, Tsialtas JT, Zioziou E, Nikolaou N, Kotseridis Y. 2009. Irrigation and Rootstock
Effects on the Phenolic Concentration and Aroma Potential of Vitis vinifera L. cv.
Cabernet Sauvignon Grapes. Journal of Agricultural and Food Chemistry 57, 7805-7813.
Lee J-M, Kubota C, Tsao SJ, Bie Z, Echevarria PH, Morra L, Oda M. 2010. Current
status of vegetable grafting: Diffusion, grafting techniques, automation. Scientia
Horticulturae 127, 93-105.
Marguerit E, Brendel O, Lebon E, Van Leeuwen C, Ollat N. 2012. Rootstock control
of scion transpiration and its acclimation to water deficit are controlled by different genes.
The New phytologist 194, 416-429.
Marioni JC, Mason CE, Mane SM, Stephens M, Gilad Y. 2008. RNA-seq: an
assessment of technical reproducibility and comparison with gene expression arrays.
Genome research 18, 1509-1517.
Michael TP, Jackson S. 2013. The First 50 Plant Genomes. Plant Gen. 6, -.
Morgante M, De Paoli E, Radovic S. 2007. Transposable elements and the plant pan-
genomes. Current opinion in plant biology 10, 149-155.
41
Nookaew I, Papini M, Pornputtapong N, Scalcinati G, Fagerberg L, Uhlén M, Nielsen J. 2012. A comprehensive comparison of RNA-Seq-based transcriptome analysis
from reads to differential gene expression and cross-comparison with microarrays: a case
study in Saccharomyces cerevisiae. Nucleic Acids Research 40, 10084-10097.
Robertson G, Schein J, Chiu R, Corbett R, Field M, Jackman SD, Mungall K, Lee S, Okada HM, Qian JQ, Griffith M, Raymond A, Thiessen N, Cezard T, Butterfield YS, Newsome R, Chan SK, She R, Varhol R, Kamoh B, Prabhu AL, Tam A, Zhao Y, Moore RA, Hirst M, Marra MA, Jones SJ, Hoodless PA, Birol I. 2010. De novo
assembly and analysis of RNA-seq data. Nature methods 7, 909-912.
Robinson MD, McCarthy DJ, Smyth GK. 2010. edgeR: a Bioconductor package for
differential expression analysis of digital gene expression data. Bioinformatics 26, 139-
140.
Rodríguez-Celma J, Lattanzio G, Jiménez S, Briat J-F, Abadía J, Abadía A, Gogorcena Y, López-Millán A-F. 2013. Changes Induced by Fe Deficiency and Fe
Resupply in the Root Protein Profile of a Peach-Almond Hybrid Rootstock. Journal of
Proteome Research 12, 1162-1172.
Schena M, Shalon D, Davis RW, Brown PO. 1995. Quantitative Monitoring of Gene
Expression Patterns with a Complementary DNA Microarray. Science 270, 467-470.
Trapnell C, Williams BA, Pertea G, Mortazavi A, Kwan G, van Baren MJ, Salzberg SL, Wold BJ, Pachter L. 2010. Transcript assembly and quantification by RNA-Seq
reveals unannotated transcripts and isoform switching during cell differentiation. Nature
biotechnology 28, 511-515.
Vannozzi A, Dry I, Fasoli M, Zenoni S, Lucchin M. 2012. Genome-wide analysis of the
grapevine stilbene synthase multigenic family: genomic organization and expression
profiles upon biotic and abiotic stresses. BMC Plant Biology 12, 130.
Velasco R, Zharkikh A, Troggio M, Cartwright DA, Cestaro A, Pruss D, Pindo M, Fitzgerald LM, Vezzulli S, Reid J, Malacarne G, Iliev D, Coppola G, Wardell B, Micheletti D, Macalma T, Facci M, Mitchell JT, Perazzolli M, Eldredge G, Gatto P, Oyzerski R, Moretto M, Gutin N, Stefanini M, Chen Y, Segala C, Davenport C, Dematte L, Mraz A, Battilana J, Stormo K, Costa F, Tao Q, Si-Ammour A, Harkins T, Lackey A, Perbost C, Taillon B, Stella A, Solovyev V, Fawcett JA, Sterck L, Vandepoele K, Grando SM, Toppo S, Moser C, Lanchbury J, Bogden R, Skolnick M, Sgaramella V, Bhatnagar SK, Fontana P, Gutin A, Van de Peer Y, Salamini F, Viola R. 2007. A high quality draft consensus sequence of the genome of a heterozygous
grapevine variety. PloS one 2, e1326.
Walker RR, Blackmore DH, Clingeleffer PR, Correll RL. 2002. Rootstock effects on
salt tolerance of irrigated field-grown grapevines (Vitis vinifera L. cv. Sultana).: 1. Yield
and vigour inter-relationships. Australian Journal of Grape and Wine Research 8, 3-14.
Walker RR, Blackmore DH, Clingeleffer PR, Correll RL. 2004. Rootstock effects on
salt tolerance of irrigated field-grown grapevines (Vitis vinifera L. cv. Sultana) 2. Ion
42
concentrations in leaves and juice. Australian Journal of Grape and Wine Research 10,
90-99.
Wang Z, Gerstein M, Snyder M. 2009. RNA-Seq: a revolutionary tool for
transcriptomics. Nature reviews. Genetics 10, 57-63.
Ziliotto F, Corso M, Rizzini FM, Rasori A, Botton A, Bonghi C. 2012. Grape berry
ripening delay induced by a pre-veraison NAA treatment is paralleled by a shift in the
expression pattern of auxin- and ethylene-related genes. BMC Plant Biology 12, 185.
43
Chapter II
Transcriptomes comparison of a susceptible
and a putative tolerant grapevine rootstocks
to drought give insight into the mechanisms
of water stress tolerance
Massimiliano Corso1*, Alessandro Vannozzi1*, Elie Maza2, Nicola Vitulo3,
Franco Meggio1, Mondher Bouzayen2 Giorgio Valle3, Claudio Bonghi1,4,
Margherita Lucchin1,4 and Angelo Ramina1
1. Department of Agronomy, Food, Natural Resources, Animals and Environment, DAFNAE,
University of Padova, Agripolis–Viale dell’Università 16, 35020 Legnaro (Padova), Italy.
2. Genomics and Biotechnology of Fruit (GBF) laboratory, Institut National Polytechnique de
Toulouse, Avenue de l'Agrobiopole, F-31326 Castanet-Tolosan Cedex (Toulouse), France.
3. CRIBI, Università degli Studi di Padova, viale G. Colombo 3, 35121 Padova, Italy.
4. Centro Interdipartimentale per la Ricerca in Viticoltura ed Enologia (CIRVE) Via XXVIII Aprile,
14-31015 Conegliano (TV), Italy.
*These authors contributed equally to this work
44
1. Introduction
Before the devastation of European viticulture caused by of the introduction of phylloxera
(Daktulosphaira vitifoliae) from North America in the nineteenth century, varieties of V.
vinifera used commercially for wine production in Europe were traditionally grown on
their own roots. Subsequently, the use of rootstocks from the pest’s origin was introduced
to provide resistance to this and other deleterious diseases and to save the fate of European
viticulture. Although, at first, the replacement of the entire root system of “vinifera”
varieties with “non vinifera” or “American” species was seen as a sort of contamination of
the purity and quality of wine, subsequently, the use of grapevine rootstocks spread also
over those countries where viticulture constituted a young and new challenge and where
phylloxera did not represent a menace yet (Arrigo and Arnold, 2007; Gregory et al.,
2013). The explanation of this trend relies on the fact that the use of rootstocks was
quickly found not only to confer resistance to diseases, but to imply a larger range of
advantages, altering numerous physiological processes at the level of scion such as
biomass accumulation (Gregory et al., 2013), fruit quality (Walker et al., 2002, 2004), and
the ability to respond to many biotic and abiotic stresses (Meggio et al., IN PRESS;
Marguerit et al., 2012). In fact, apart from conferring resistance to phylloxera, rootstocks
were found to have many other desirable attributes, such as tolerance to calcareous soils
(Covarrubias and Rombolà, 2013), salinity (Fisarakis et al., 2001), nematodes (McCarthy
and Cirami, 1990) and drought (Marguerit et al., 2012; Gambetta et al., 2012). All these
characteristics make the use of rootstocks and the development of new genotypes of
crucial importance in the contemporary viticulture.
Water availability is one of the major environmental factors contemporary viticulture has
to cope with (Flexas et al., 2009; Cramer et al., 2007; Chaves et al., 2010). Most of the
word’s wine-producing regions are subjected to seasonal drought, and, based on the global
climate models, which predict an increase in the aridity in the next future (IPCC, 2007),
water deficit may became the major limiting factor in wine production and quality.
Moreover, the enhanced pressure on water resources increased the global perception of the
need to reduce the “water footprint” for irrigated crops (Cominelli et al., 2013) and in
addition to a product enjoyable in all sensorial aspects, consumers expect wines to be
healthy and produced in an environmental sustainable manner (Bisson et al., 2002).
45
Grapes are well adapted to semi-arid climate such as that of Mediterranean and are
generally considered relatively tolerant to water deficit. The large and deep root system,
together with physiological drought avoidance mechanisms, such as stomatal control of
transpiration, xylem embolism (Tramontini et al., 2013) and the ability to adjust
osmotically, make these plants able to grow also in sub-optimal water conditions.
However, considering that a large proportion of vineyards are now located in region where
seasonal drought coincides with the grapevine growing season, the combined effect of soil
water deficit, air temperature and high evaporative demand is known to limit grapevine
yield and to delay the vintage date (Walker et al., 2004; Flexas et al., 2009; Chaves et al.,
2009), with a negative effect on grape berry and, consequently, wine quality. Water
deficit leads to many morphological and physiological changes across a range of spatial
and temporal scales (Chaves et al., 2002), including reduced expansion of aerial organs
(Cramer et al., 2007), maintenance of root growth (Sharp and Davies, 1979), decrease in
transpiration and photosynthesis (Chaves et al., 2010), accumulation of osmotic
compounds and ions (Cramer et al., 2007), activation of detoxifying processes and, in
parallel, the transcriptional regulation of a large number of genes (Cramer et al., 2007;
Tattersall et al., 2007; Tillett et al., 2011). Stomata closure is one of the early plant
physiological responses upon moderate to mild water deficits conditions and this
phenomenon is often related to a metabolic limitation (Chaves et al., 2002): CO2 diffusion
is lowered by stomata closure and thus results in a lower rate of net carbon (C)
assimilation. In grapevine, it has been reported that photosynthetic process is quite
resistant to water stress (Chaves et al., 2009; Souza et al., 2003). Under low to moderate
deficit irrigation, maintenance of the activity of the Calvin cycle and of the maximum
rates of carboxylation and electron transport has generally been observed (Souza et al.
2005a). However, as the water stress becomes severe, net CO2 assimilation (An) and other
metabolic processes operating in the mesophyll are inhibited and water use efficiency thus
declines. The imbalance between the light capture and its utilization results in a down-
regulation of photosystem II (PSII) activity, phenomenon known as photo inhibition
(Reddy et al., 2004) and the changes in the photochemistry of chloroplasts in leaves result
in the dissipation of excess light energy in the PSII core and antenna with the generation
of active oxygen species (ROS) such as H2O2, O2-, -OH, 1O2, and NO. These ROS are
46
responsible for most of the oxidative damages in biological systems (Apel and Hirt, 2004)
and cellular components. Thus, a strict control of ROS levels is mandatory for plant
survival (Kar, 2011) and the cross-talk between ROS accumulation and redox state is
integrating part of a fine homeostasis control that plays a pivotal role in the plant response
to stresses (Suzuki et al., 2012). Together with the accumulation of ROS scavenging
compounds and related genes, such as superoxide dismutases (SOD), catalase (CAT),
ascorbate peroxidase and glutathione peroxidase (Kar, 2011; Mittler, 2002), the
photorespiration provides an important strategy to cope with the effect of light energy
excess as observed in a recent expression study conducted by Cramer et al. (2007).
Phytohormones play a central role in the ability of plants to adapt to abiotic stresses by
mediating a wide range of adaptive responses, which often alter gene expression by
inducing or preventing the degradation of transcriptional regulators via the ubiquitin–
proteasome system (Kelley and Estelle, 2012; Peleg and Blumwald, 2011; Santner and
Estelle, 2009). Abscisic acid (ABA) is one of the most studied stress-responsive hormone
in plants, especially as concerns the plant response to water deficit (Fujita et al., 2011; Qin
et al., 2011). Its synthesis is one of the fastest plants responses to abiotic stresses,
triggering ABA-induced gene expression and inducing stomatal closure to reduce water
loss and eventually limiting cellular growth (Peleg and Blumwald, 2011). Physiological
studies showed that under abiotic stresses, especially drought and salinity, plants
accumulate high levels of ABA accompanied by major transcriptome changes, including
(Qin et al., 2011) genes involved in its sensing (PYR/RCAR), signal transduction (type 2C
protein phosphatases, PP2Cs; SnRK2s kinases), regulation (e.g. AREB/ABFs, DREB,
MYB), and response (e.g. response to dehydration-like, RD-like; LEA proteins; HIS)
(Fujita et al., 2011; Qin et al., 2011; Novikova et al., 2009).
Although ABA remains the best-studied hormone for plant stress response, a growing
number of studies are revealing that many other hormones, such as auxins, ethylene,
jasmonates (JAs), gibberellins (GAs), Salicylic acid (SA), and Brassinosteroids (BRs) are
involved in the plant response to water stress (Peleg and Blumwald, 2011). Thus, plant
adaptation to water limiting conditions, as well as other abiotic stresses, has to been seen
as the concerted action of all the above cited plant hormones throughout a fine tuned
cross-talk (Kohli et al., 2013). JA, for instance, accumulates, together with JA-responsive
47
genes, under many types of stress conditions including drought. This was observed in soy-
bean (Creelman and Mullet, 1995), Pinus pinaster (Pedranzani et al., 2007), tomato
(Pedranzani et al., 2003) and rice (Kiribuchi et al., 2005). Although the precise function of
JA in drought response is still unclear there are strong evidences of the cross-talk between
JAs with ABA and other plant hormones. In rice, the ectopic expression of AtJMT, a gene
which converts JA to MeJA, not only let to an higher accumulation of MeJA in young
panicles, but also to a dramatic loss in grain yield substantial increase in ABA levels,
suggesting a cross-talk between the two hormones. Moreover the JASMONATE ZIM-
DOMAIN (JAZ) protein, a repressor of the MYC2 transcription factor and thus of the JA-
signaling pathway, was recently found to interact with other partners beside MYC2,
including the GA-signaling genes DELLAs, suggesting also a synergic JA-GA cross-talk
(Wasternack, 2007). Plant hormones highlight an interesting cross talk also with ROS,
which act as secondary messengers of these regulators (Kar, 2011). It is well known that
H2O2 regulates ABA-mediated stomatal closure by acting on Ca2+
levels and inactivating
PP2Cs (Meinhard et al., 2002). Stomatal closure is also mediated by ethylene via ETR1,
an hormone receptor, which is involved in H2O2-sensing (Desikan et al., 2005). Finally,
in Joo et al. (2001) is reported an induction of ROS in roots mediated by auxins,
suggesting a role downstream of transport in auxin signaling and gravitropism.
The decrease of osmotic potential (π) in response to water stress is another well-known
mechanism by which many plants adjust to drought conditions. Apart from the passive
solute concentration resulting from dehydration, plants can accumulate solutes in an active
and genetically regulated manner. The compounds involved in this adjustment widely
between species: in the majority of perennial woody species they seem to be organic
compounds as observed in peaches, apples and cherries, which accumulate sorbitol
(Escobar-Gutiérrez and Gaudillére, 1994; Wang et al., 1996; Arndt et al., 2000), or in
Morus alba, which accumulate amino acids (Ramanjulu et al., 1994). V. vinifera cv
Cabernet Sauvignon shoot tips of water-deficit-treated plants were found to accumulate
malate, proline and glucose concentration.
Recently, a biochemical and physiological study of novel candidate genotype to be used as
rootstock in grapevine was performed (Meggio et al., IN PRESS). This genotype,
designed as M4 [(V. vinifera x V. berlandieri) x V. berlandieri x cv Resseguier n.1] and
48
established from 1985 by the DiSAA research group operating at the Milan University,
was selected for its high tolerance to water deficit (WS) and salt exposure (SS). In
comparison with the 101.14 commercial genotype, M4 un-grafted plants subjected to
water and salt stress showed a greater capacity to tolerate WS and SS maintaining
photosynthetic activity also under severe stress conditions and accumulating, especially at
the root level, osmotic compounds and ions. Here we report results obtained from a large
scale whole transcriptome analyses performed on leaf and root tissues of both M4 and
101.14 genotypes under the same WS experimental conditions exposed in Meggio et al.
(2013). The absolute novelty of this study relies on the fact that, differing from previous
studies performed on plants subjected to an instantaneous decline in water availability, in
our experiment, water deprivation was accomplished gradually, miming as far as possible
those conditions that might occur in field

49
2. Materials and methods
2.1 Experimental design and plant material.
Two-years-old glass-house grown plants of the susceptible and tolerant grapevine
rootstocks under study, respectively the widely used 101.14 genotype (V. riparia x V.
rupestris) and the experimental M4 one ((V. vinifera x V. berlandieri) x V. berlandieri cv.
Resseguier n. 1), were subjected to drought stress with the aim of understanding the
genetic determinism of tolerance and susceptibility in both genotypes. A total number of
108 glasshouse-grown plants from each genotype were subdivided into three groups:
plants grown under well-watered (WW) conditions, plants grown under water-deficit
conditions (WS, Water-Stress) and plants grown under high salinity (SS, Salt-Stress), not
discussed in the present paper. WW plants, which were used as controls for water stress,
were grown in pots with a water-availability equal to the 80% of the field capacity. The
water-stress treatment (WS) was imposed by growing 101.14 and M4 plants in limited
water-availability conditions in respect to the control. This was accomplished gradually
decreasing the water-availability in pots from 80% to the minimum level of 30% of field
capacity. The whole drought experiment had a duration of 10 days during which, leaf
physiological measurements were performed on fully expanded leaves, immediately
before sampling. Leaf water potential (Ψleaf) was determined using a Scholander-type
pressure chamber (model PMS-1000, PMS Instruments, Corvallis, Oregon, USA), net
assimilation rate (An) and stomatal conductance (gs) measurements were performed using
a LI- 6400 portable photosynthesis system (Li-Cor Inc. Lincoln, Nebraska, USA), as
reported in Meggio et al. (2014). In addition, we hereby report unpublished data of leaf
transpiration rate (E, mmol H2O m-2
s-1
), performed in the same experimental conditions:
600 µmol of photons m-2
s-1
, a CO2 concentration of 380 µmol mol−1
, 1.5 kPa of vapor
pressure deficit (VPD) and a block temperature of 25 °C.
Both the genotypes experienced a similar degree of water deficit, allowing a robust
comparison of their physiological and molecular responses as reported in Meggio et al.
(IN PRESS). Four time points, designed as T1 to T4 were considered for both leaf and
root tissues sampling. Five leaves and root tissues were collected from pools of at least 6
plants for each genotype (101.14 and M4) and each condition (WW and WS), respectively
at 2 (WS-T1), 4 (WS-T2), 7 (WS-T3) and 10 (WS-T4) days after the beginning of drought
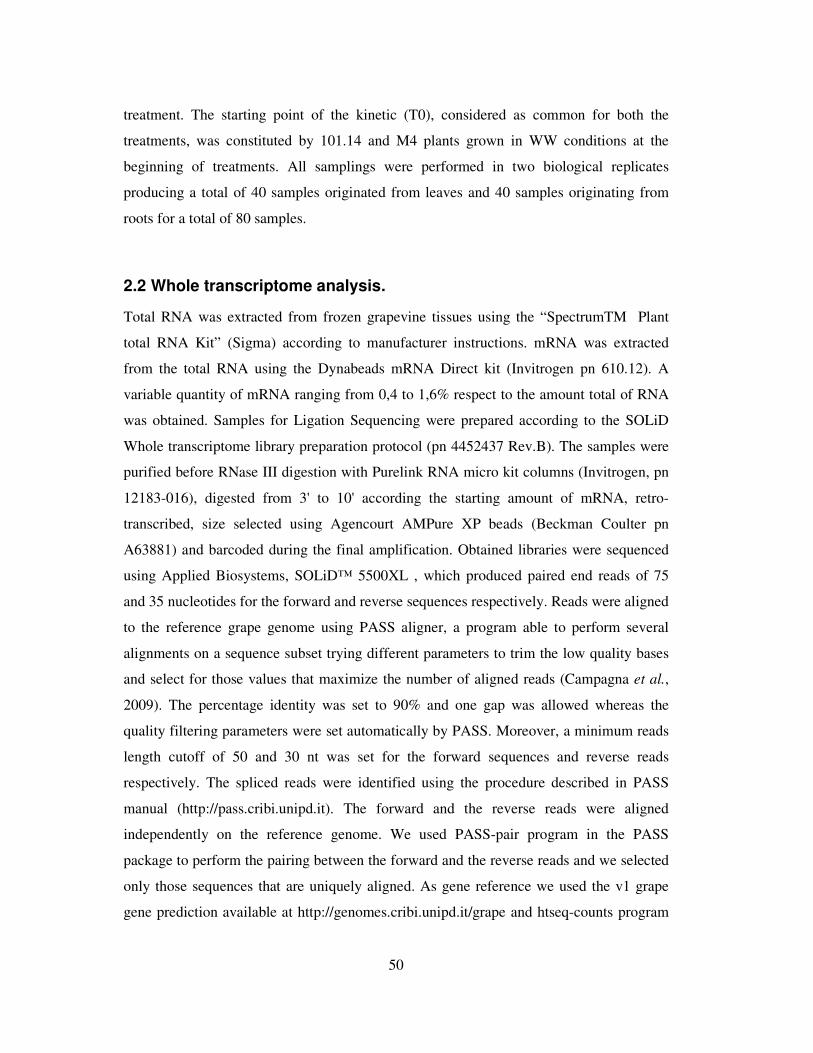
50
treatment. The starting point of the kinetic (T0), considered as common for both the
treatments, was constituted by 101.14 and M4 plants grown in WW conditions at the
beginning of treatments. All samplings were performed in two biological replicates
producing a total of 40 samples originated from leaves and 40 samples originating from
roots for a total of 80 samples.
2.2 Whole transcriptome analysis.
Total RNA was extracted from frozen grapevine tissues using the “SpectrumTM Plant
total RNA Kit” (Sigma) according to manufacturer instructions. mRNA was extracted
from the total RNA using the Dynabeads mRNA Direct kit (Invitrogen pn 610.12). A
variable quantity of mRNA ranging from 0,4 to 1,6% respect to the amount total of RNA
was obtained. Samples for Ligation Sequencing were prepared according to the SOLiD
Whole transcriptome library preparation protocol (pn 4452437 Rev.B). The samples were
purified before RNase III digestion with Purelink RNA micro kit columns (Invitrogen, pn
12183-016), digested from 3' to 10' according the starting amount of mRNA, retro-
transcribed, size selected using Agencourt AMPure XP beads (Beckman Coulter pn
A63881) and barcoded during the final amplification. Obtained libraries were sequenced
using Applied Biosystems, SOLiD™ 5500XL , which produced paired end reads of 75
and 35 nucleotides for the forward and reverse sequences respectively. Reads were aligned
to the reference grape genome using PASS aligner, a program able to perform several
alignments on a sequence subset trying different parameters to trim the low quality bases
and select for those values that maximize the number of aligned reads (Campagna et al.,
2009). The percentage identity was set to 90% and one gap was allowed whereas the
quality filtering parameters were set automatically by PASS. Moreover, a minimum reads
length cutoff of 50 and 30 nt was set for the forward sequences and reverse reads
respectively. The spliced reads were identified using the procedure described in PASS
manual (http://pass.cribi.unipd.it). The forward and the reverse reads were aligned
independently on the reference genome. We used PASS-pair program in the PASS
package to perform the pairing between the forward and the reverse reads and we selected
only those sequences that are uniquely aligned. As gene reference we used the v1 grape
gene prediction available at http://genomes.cribi.unipd.it/grape and htseq-counts program
51
(http://www-huber.embl.de/users/anders/HTSeq/doc/count.html) to quantify gene
abundance.
2.3 Multifactorial and pairwise statistical analysis.
DEseq R package (http://www.r-project.org/) was used to perform the statistical analyses
for discovering differentially expressed genes (DEGs) by using both a multi-factor and a
pairwise-comparison approaches (Maza et al., 2013). In order to evaluate the single effects
of the genotype (R: 101.14 and M4), of the type of stress imposed (Treatment, T: WW,
WS, and SS for control, water stress and salt stress experiment, respectively) and of the
time point considered (P: T1-T4 and T1-T3 for WS and SS, respectively) on gene
expression, a multifactorial analysis was carried out by using the multi-factor designs
method of DEseq R package (Anders and Huber, 2012;
http://bioconductor.org/packages/release/bioc/html/DESeq.html). This method allows to
evaluate the weight of each factor considered in the analysis (R, T and P) and its impact
on gene expression and, consequently on DEGs, according to a false discovery rate (FDR)
< 0.05 for both experiments and tissues. This procedure consist of the following passages:
create a count data set with multiple factors (with the three components described above),
estimate size factor and dispersions of the data, fit generalized linear models (GLMs)
according to the two models (full model regresses the genes' expression on both the library
type and the treatment condition, the reduced model regresses them only on the library
type), and then compare them in order to infer whether the additional specification of the
treatment improves the fit and hence, whether the treatment has significant effect (Anders
and Huber, 2010).
Pairwise tests (Anders and Huber, 2010) between stressed (WS) and unstressed (WW)
tissues were also performed. In this case the analysis was performed considering each
genotype, tissue and time point singularly.
2.4 Ontology and Differential Clustering Analyses (DCA).
In order to functionally classify the genes affected by drought treatment, the Gene
Ontology (GO) terms were retrieved, imported in the Blast2GO software v2.5.0 (Götz et
al., 2008) and increased of about 16% by means of the Annex function (Myhre et al.,
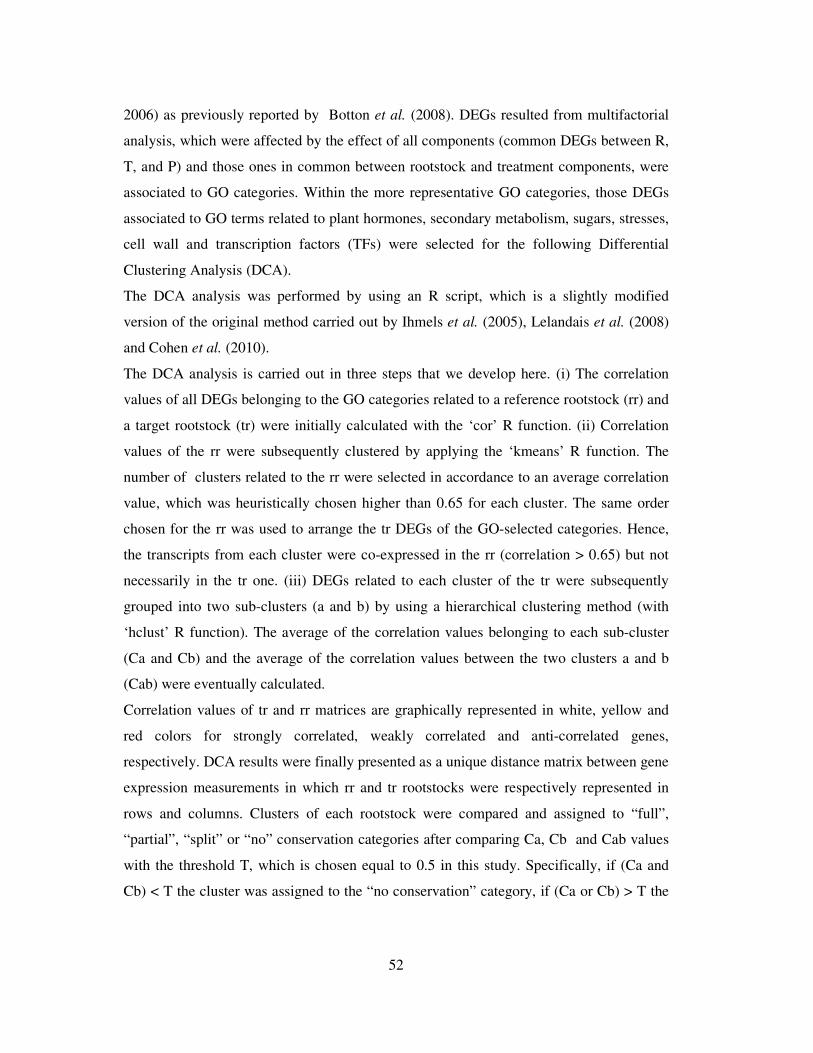
52
2006) as previously reported by Botton et al. (2008). DEGs resulted from multifactorial
analysis, which were affected by the effect of all components (common DEGs between R,
T, and P) and those ones in common between rootstock and treatment components, were
associated to GO categories. Within the more representative GO categories, those DEGs
associated to GO terms related to plant hormones, secondary metabolism, sugars, stresses,
cell wall and transcription factors (TFs) were selected for the following Differential
Clustering Analysis (DCA).
The DCA analysis was performed by using an R script, which is a slightly modified
version of the original method carried out by Ihmels et al. (2005), Lelandais et al. (2008)
and Cohen et al. (2010).
The DCA analysis is carried out in three steps that we develop here. (i) The correlation
values of all DEGs belonging to the GO categories related to a reference rootstock (rr) and
a target rootstock (tr) were initially calculated with the ‘cor’ R function. (ii) Correlation
values of the rr were subsequently clustered by applying the ‘kmeans’ R function. The
number of clusters related to the rr were selected in accordance to an average correlation
value, which was heuristically chosen higher than 0.65 for each cluster. The same order
chosen for the rr was used to arrange the tr DEGs of the GO-selected categories. Hence,
the transcripts from each cluster were co-expressed in the rr (correlation > 0.65) but not
necessarily in the tr one. (iii) DEGs related to each cluster of the tr were subsequently
grouped into two sub-clusters (a and b) by using a hierarchical clustering method (with
‘hclust’ R function). The average of the correlation values belonging to each sub-cluster
(Ca and Cb) and the average of the correlation values between the two clusters a and b
(Cab) were eventually calculated.
Correlation values of tr and rr matrices are graphically represented in white, yellow and
red colors for strongly correlated, weakly correlated and anti-correlated genes,
respectively. DCA results were finally presented as a unique distance matrix between gene
expression measurements in which rr and tr rootstocks were respectively represented in
rows and columns. Clusters of each rootstock were compared and assigned to “full”,
“partial”, “split” or “no” conservation categories after comparing Ca, Cb and Cab values
with the threshold T, which is chosen equal to 0.5 in this study. Specifically, if (Ca and
Cb) < T the cluster was assigned to the “no conservation” category, if (Ca or Cb) > T the

53
cluster was assigned to the “partial conservation” category, if (Ca and Cb) > T and Cab <
T the cluster was assigned to the “split conservation” category and if (Ca, Cb and Cab) >
T the cluster was assigned to the “full conservation” category.
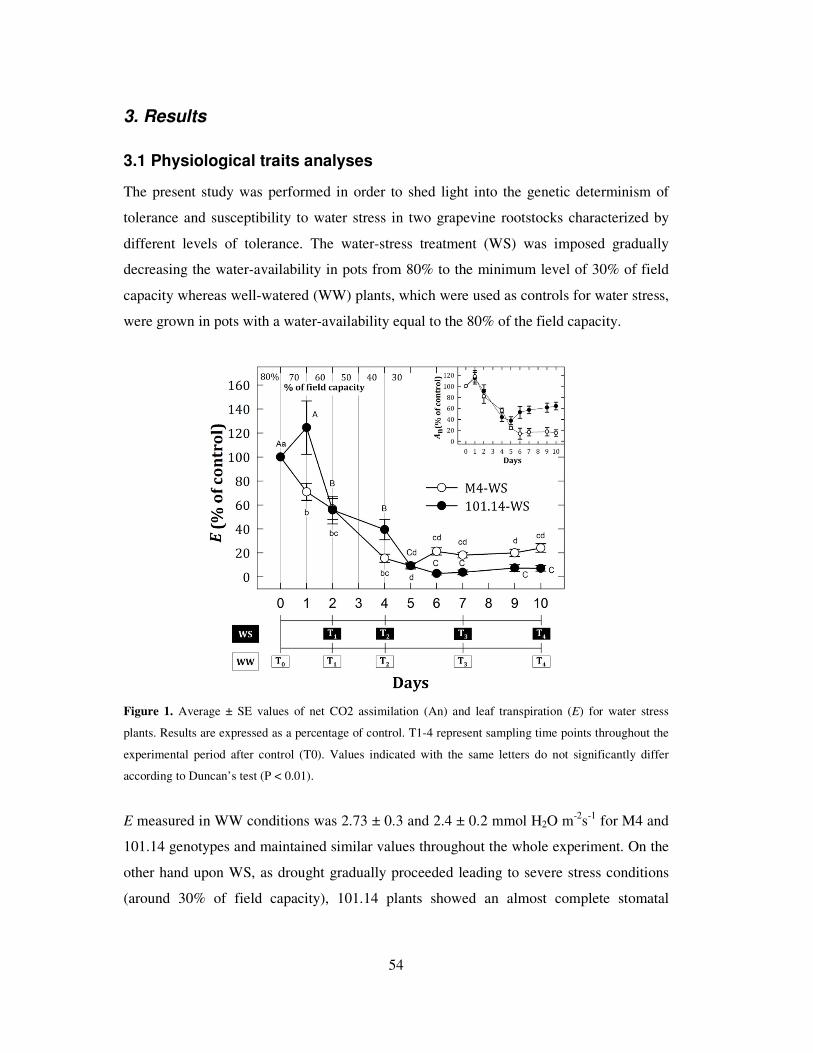
54
3. Results
3.1 Physiological traits analyses
The present study was performed in order to shed light into the genetic determinism of
tolerance and susceptibility to water stress in two grapevine rootstocks characterized by
different levels of tolerance. The water-stress treatment (WS) was imposed gradually
decreasing the water-availability in pots from 80% to the minimum level of 30% of field
capacity whereas well-watered (WW) plants, which were used as controls for water stress,
were grown in pots with a water-availability equal to the 80% of the field capacity.
Figure 1. Average ± SE values of net CO2 assimilation (An) and leaf transpiration (E) for water stress
plants. Results are expressed as a percentage of control. T1-4 represent sampling time points throughout the
experimental period after control (T0). Values indicated with the same letters do not significantly differ
according to Duncan’s test (P < 0.01).
E measured in WW conditions was 2.73 ± 0.3 and 2.4 ± 0.2 mmol H2O m-2
s-1
for M4 and
101.14 genotypes and maintained similar values throughout the whole experiment. On the
other hand upon WS, as drought gradually proceeded leading to severe stress conditions
(around 30% of field capacity), 101.14 plants showed an almost complete stomatal
55
closure, whereas a transpiration rate of approximately 20 % with respect to its control was
maintained in M4 (Figure 1).
3.2 mRNA-seq sequencing and mapping of reads to the grapevine
genome
To gain a better understanding of the molecular mechanisms underlying the drought
tolerance of the M4 genotype compared to the susceptible 101.14 one, an mRNA-seq
analysis using Next Generation Sequencing (NGS) technologies was performed. The
whole transcriptome sequencing was performed on a Solid 5500XL platform. The analysis
was accomplished on all the 80 samples previously described, in order to obtain a detailed
screenshot of the transcriptome changing of the two rootstocks within the entire stress
kinetics. The whole experiment produced approximately 4.8 billion of paired-end reads
(75 and 35 bp length for forward and reverse reads respectively), with the total number of
reads produced for each time point ranging from 29 to 82 million paired-end reads and a
median of 45 million reads. An average percentage of 90% of total reads passed the
quality control test (filtered based on reads length after the trimming of the low quality
bases) and were mapped to the PN40024 12Xv1 reference genome (Jaillon et al., 2007)
producing a number of unique mapping reads ranging from 10 to 37 million depending on
the sample.
3.3 Multi-factor design and discovering of differentially expressed
genes
For the evaluation of Differentially Expressed Genes (DEGs) upon water stress in the two
rootstocks under study, a main step in the statistical analysis was estimating the influence
of different independent components (i.e. variables) on transcriptome. Amongst these
were the effect of genotype, indicated as “R” (101.14 and M4 respectively), the type of
treatment imposed, indicated as “T” (well watered, WW; water stress, WS) and the time
point considered during the kinetic of stress, indicated as “P” (T1, T2, T3, T4).
Thus, a multi-factor analysis was carried out on mRNA-seq data sets obtained from WS
root tissues and WS leaf tissues, in order to evaluate both the singular (R, T, P) and
combined (R:T, R:P, T:P, R:T:P) impacts of each component on DE genes according to a
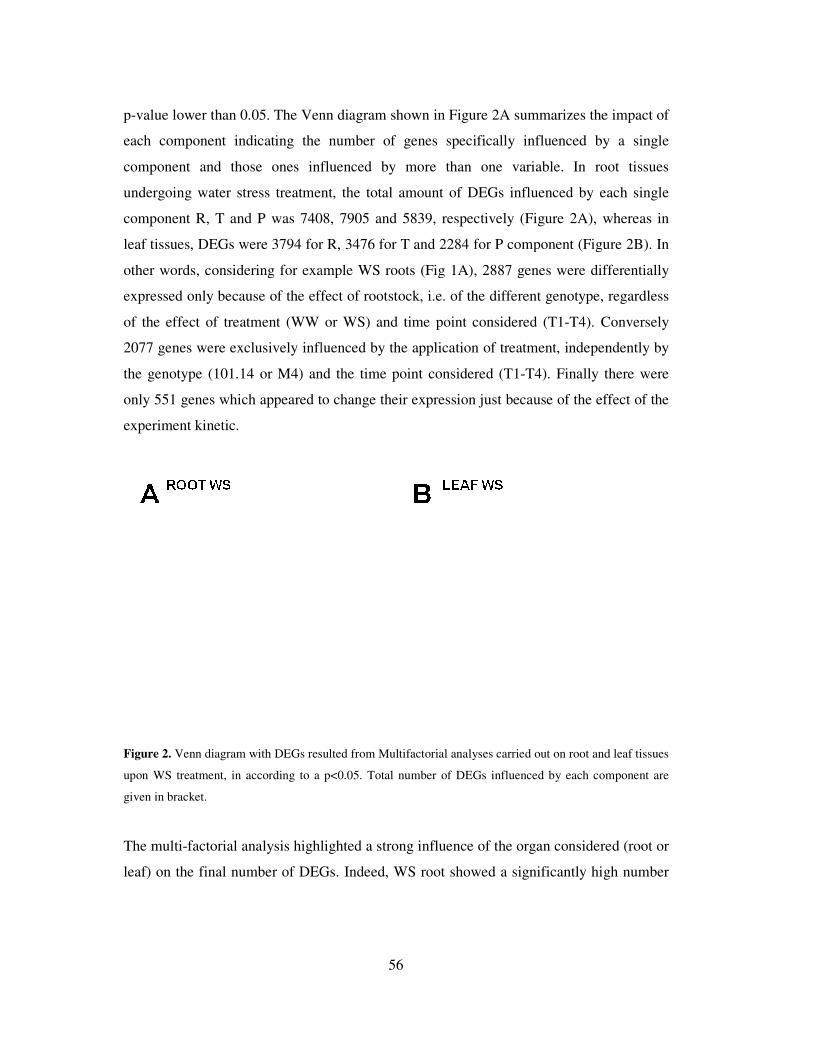
p-value lower than 0.05. The Venn diagram
each component indicating the
component and those ones influenced by more than one variable
undergoing water stress treatment, the total amount of
component R, T and P was 7408, 7905 and 5839, respectively (
leaf tissues, DEGs were 3794 for R, 3476 for T and 2284 for P component (
other words, considering for example WS roots (Fig 1A), 2887 genes we
expressed only because of the effect of rootstock, i.e. of the different genotype, regardless
of the effect of treatment (WW or WS) and time point considered (T1
2077 genes were exclusively influenced by the application of
the genotype (101.14 or M4) and the time point considered (T1
only 551 genes which appeared to change their expression just because of the ef
experiment kinetic.
Figure 2. Venn diagram with DEGs resulted from Multifactorial analyses carried out on root and leaf tissues
upon WS treatment, in according to a p<0.05
given in bracket.
The multi-factorial analysis highlighted a strong influen
leaf) on the final number of DEGs. Indeed, WS root showed a significantly high number
56
. The Venn diagram shown in Figure 2A summarizes the impact of
number of genes specifically influenced by a single
component and those ones influenced by more than one variable. In root tissues
undergoing water stress treatment, the total amount of DEGs influenced by each single
component R, T and P was 7408, 7905 and 5839, respectively (Figure 2A), whereas in
leaf tissues, DEGs were 3794 for R, 3476 for T and 2284 for P component (Figure
other words, considering for example WS roots (Fig 1A), 2887 genes were differentially
expressed only because of the effect of rootstock, i.e. of the different genotype, regardless
of the effect of treatment (WW or WS) and time point considered (T1-T4). Conversely
2077 genes were exclusively influenced by the application of treatment, independently by
the genotype (101.14 or M4) and the time point considered (T1-T4). Finally there were
only 551 genes which appeared to change their expression just because of the ef
DEGs resulted from Multifactorial analyses carried out on root and leaf tissues
upon WS treatment, in according to a p<0.05. Total number of DEGs influenced by each component are
factorial analysis highlighted a strong influence of the organ considered (root or
leaf) on the final number of DEGs. Indeed, WS root showed a significantly high number
summarizes the impact of
number of genes specifically influenced by a single
. In root tissues
by each single
2A), whereas in
Figure 2B). In
re differentially
expressed only because of the effect of rootstock, i.e. of the different genotype, regardless
T4). Conversely
treatment, independently by
T4). Finally there were
only 551 genes which appeared to change their expression just because of the effect of the
DEGs resulted from Multifactorial analyses carried out on root and leaf tissues
Total number of DEGs influenced by each component are
ce of the organ considered (root or
leaf) on the final number of DEGs. Indeed, WS root showed a significantly high number
57
of DEGs, with 11792 transcripts, whereas in WS leaf the amount of DEGs was
approximately 50% less, with 6404 transcripts.
Interestingly, whereas in roots the treatment (T) component seemed to have the major
influence on expression, showing the highest number of DEGs (7905) in comparison to all
the other components, in leaves, the genotype (R) appears to have the highest impact on
the modulation of transcripts, with 3794 DEGs. As concerns the effect of the stress kinetic
on DEGs, its influence appeared to be less important for both root and leaf tissues. In
addition to the Multifactorial analysis, a pairwise comparison between WS and WW data f
both tissues and genotypes was carried out from T1 to T4. Taking into account that
treatment and genotype were the variables showing the major impact of on transcriptome
pairwise comparisons, performed separately for the two genotypes under study (101.14
and M4), were accomplished between the water stressed tissues, respectively leaves and
roots, and the non-stressed ones at each time point (T1-T4) (Figure 3). Apart from M4 leaf
tissues, which showed a peak of DE genes at T2 (4 days after stress imposition, DASI)
followed by a decrease (T3) and a new increase at T4, all other comparisons revealed an
increased amount of differentially expressed genes within the first 7 days (T1-T3), with a
peak at T3 probably related to the increasing stress levels (Figure 3A, B). Except for M4
leaf tissues, T4, which corresponds to 10 DASI, showed a sensible decrease in the number
of DE genes respect to T3 (Figure 3A, B). This could be due to the fact that all plants
undergone a sort of pot-effect depression or, in the case of the susceptible genotype, that
the plant metabolism is inhibited because of the stress. A first general observation is that,
in both 101.14 and M4 rootstocks, water deficit affected an higher number of DEGs in
root tissue (Figure 3B) in comparison to the leaf one (Figure 3A).
Regarding the leaf tissues, there was a relatively low amount of DEGs between stressed
and control plants on day 2 (T1), when stress levels were very low (Figure 3A). This was
observed both in 101.14 and in M4 rootstocks, with respectively 29 and 44 DE genes
detected. As the stress increased with time, so did the number of stress-responsive
transcripts. Indeed, on day 4 (T2) there were massive changes in gene expression with
over 1200 transcripts, which increased or decreased significantly in both genotypes (1232
DEGs in 101.14 and 1223 DEGs in M4) (Figure 3A). As previously mentioned, for WS
leaf data, a first macroscopic difference between the two rootstocks (for WS leaf) was
58
detected at T3 (7 DASI), with an increased number of DEGs in 101.14 in comparison to
T2 (1475 DEGs at T3) and a drastic decrease of M4-related DEGs (677 DEGs; Figure
3A). Amongst those DEGs identified at each time point, there were genes found to be
common to both 101.14 and M4 rootstocks and other genes, which appeared to be
genotype-specific.
As concerns data related to leaf tissue at 4 DASI (T2), there were 619 DEGs common to
both 101.14 and M4 that were significantly different from the relative control and 604
specific genes that were up or down regulated exclusively in M4 rootstock (613 were
101.14-specific). Indeed, 4 days after the imposition of stress, the two genotypes appear to
respond in a quite similar manner, at least based on the raw transcriptional data.
Interestingly, at T3, the number of M4-private DE genes decreased, with only 168
accessions that were significantly different from the control only in M4 and a much higher
number (966) of 101.14-private DEGs. The opposite pattern was observed at T4, with a
higher number of M4-private genes (715) against those (300) registered in 101.14.
Approximately 21% to 31% of 101.14 rootstock genes were significantly different from
controls both at T2 and T3 and T4 whereas 21% to 44% of DE genes were common for
T2-T3-T4 in M4 (data not showed).
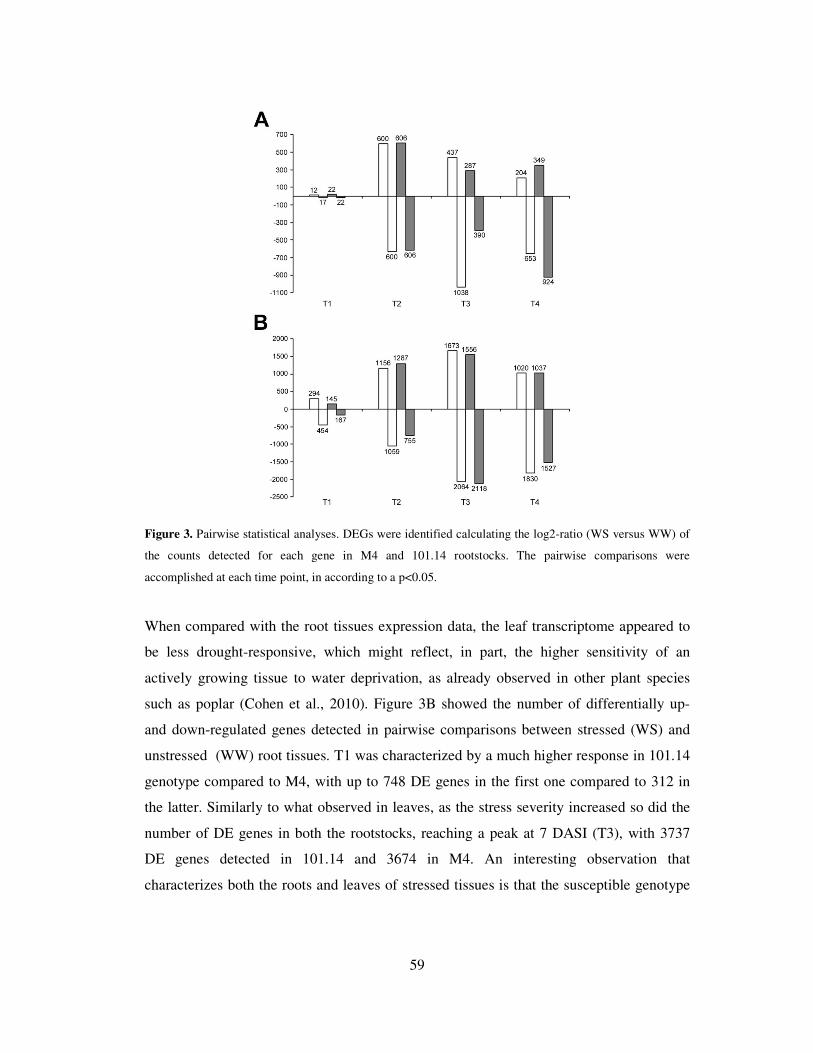
59
Figure 3. Pairwise statistical analyses. DEGs were identified calculating the log2-ratio (WS versus WW) of
the counts detected for each gene in M4 and 101.14 rootstocks. The pairwise comparisons were
accomplished at each time point, in according to a p<0.05.
When compared with the root tissues expression data, the leaf transcriptome appeared to
be less drought-responsive, which might reflect, in part, the higher sensitivity of an
actively growing tissue to water deprivation, as already observed in other plant species
such as poplar (Cohen et al., 2010). Figure 3B showed the number of differentially up-
and down-regulated genes detected in pairwise comparisons between stressed (WS) and
unstressed (WW) root tissues. T1 was characterized by a much higher response in 101.14
genotype compared to M4, with up to 748 DE genes in the first one compared to 312 in
the latter. Similarly to what observed in leaves, as the stress severity increased so did the
number of DE genes in both the rootstocks, reaching a peak at 7 DASI (T3), with 3737
DE genes detected in 101.14 and 3674 in M4. An interesting observation that
characterizes both the roots and leaves of stressed tissues is that the susceptible genotype
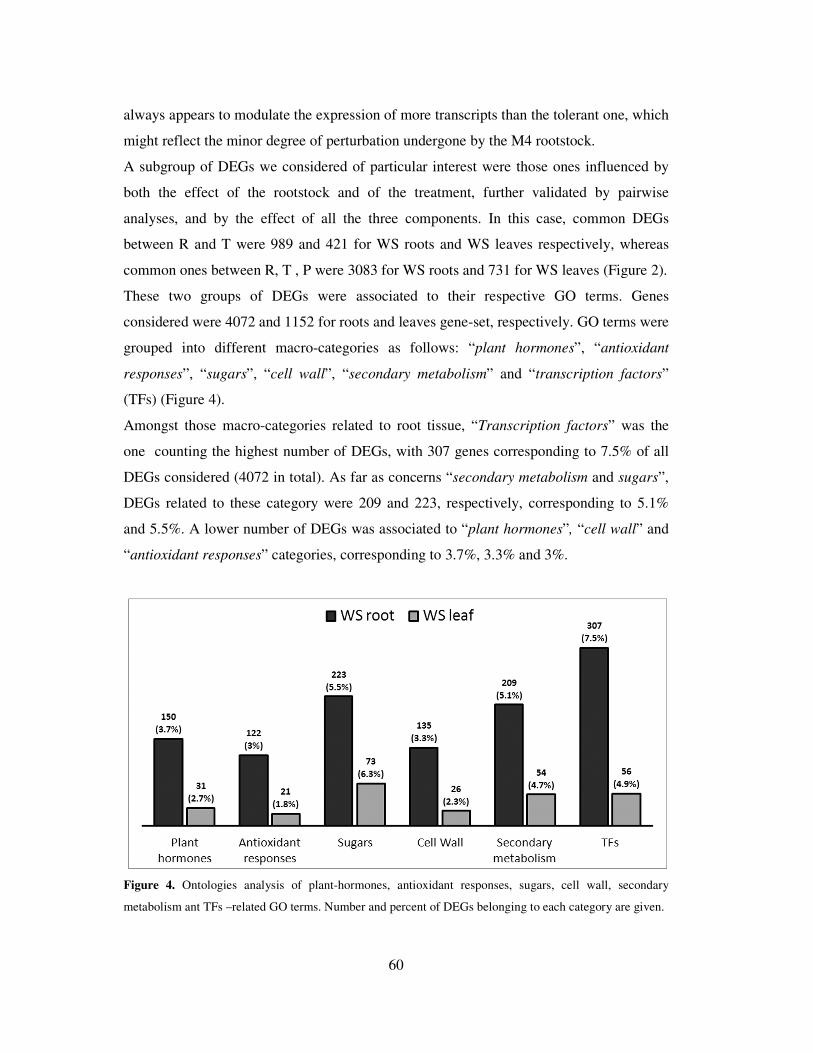
60
always appears to modulate the expression of more transcripts than the tolerant one, which
might reflect the minor degree of perturbation undergone by the M4 rootstock.
A subgroup of DEGs we considered of particular interest were those ones influenced by
both the effect of the rootstock and of the treatment, further validated by pairwise
analyses, and by the effect of all the three components. In this case, common DEGs
between R and T were 989 and 421 for WS roots and WS leaves respectively, whereas
common ones between R, T , P were 3083 for WS roots and 731 for WS leaves (Figure 2).
These two groups of DEGs were associated to their respective GO terms. Genes
considered were 4072 and 1152 for roots and leaves gene-set, respectively. GO terms were
grouped into different macro-categories as follows: “plant hormones”, “antioxidant
responses”, “sugars”, “cell wall”, “secondary metabolism” and “transcription factors”
(TFs) (Figure 4).
Amongst those macro-categories related to root tissue, “Transcription factors” was the
one counting the highest number of DEGs, with 307 genes corresponding to 7.5% of all
DEGs considered (4072 in total). As far as concerns “secondary metabolism and sugars”,
DEGs related to these category were 209 and 223, respectively, corresponding to 5.1%
and 5.5%. A lower number of DEGs was associated to “plant hormones”, “cell wall” and
“antioxidant responses” categories, corresponding to 3.7%, 3.3% and 3%.
Figure 4. Ontologies analysis of plant-hormones, antioxidant responses, sugars, cell wall, secondary
metabolism ant TFs –related GO terms. Number and percent of DEGs belonging to each category are given.
61
On the other hand, DEGs identified in WS leaves highlighted a different weight of
ontology categories in comparison to the root tissue. In this case the highest percentage of
transcripts was related to “sugars”, with 73 DEGs (6.3%). ”Transcription factors” and
“secondary metabolism” categories were less represented, with respectively 56 (4.9%) and
54 (4.7%) genes. Finally “Plant hormones”, “antioxidant responses” and “cell wall”
categories showed 31 (2.8%), 21 (2%) and 26 (2.3%) DEGs, respectively. For each tissue
and ontology category, a DCA analysis was carried out.
To better investigate these common DE gene subsets, an additional analysis (DCA) was
carried out in order to identify those transcript that showed different behavior between M4
and 101.14 rootstocks.
3.4 Differential cluster analysis (DCA)
Results obtained from the multifactorial analysis and the pairwise analyses were used
together in a Differential Cluster Analysis (DCA). Previous studies have demonstrated
that generally, genes belonging to the same GO category and sharing a similar function,
are significantly co-expressed (Eisen et al., 1998; Kim et al., 2001; Ihmels et al., 2004)
showing high level of pair-wise correlation. Nevertheless, comparison of transcriptomes
belonging to different organisms can highlight differences in the patterns of gene co-
regulation within individual GO categories. These differences are likely to reflect
differences in the physiology, or in the adaptation to different environments. To better
capture differential expression patterns between 101.14 and M4, and to systematically
characterize the conservation or divergence of co-expression between genes with a related
function, we implement and used a recently developed approach, termed Differential
Cluster Algorithm (DCA). This analysis was performed on gene groups defined by
membership in the same GO categories previously described (i.e. those ones detected in
the subgroup of R-T and R-T-P common DEGs by the multifactorial analysis) by
correlating their expression values obtained from the pairwise analysis (provided as log2
of the ratio between read counts obtained from WS and WW tissues). The DCA algorithm
allowed us to identify co-expression clusters embedded within these gene sets and to
assign each of these clusters to one of four categories indicating the level of conservation
62
between the two genotypes: “full”, “partial”, “split”, or ”absent”. A full conservation class
is supposed to contain DEGs which are co-regulated in a similar manner in both
genotypes, whereas a “partial conservation class” or a “split conservation” class
identifies, together with subsets of genes that show similar co-regulation in the two
genotypes, also sub-clusters of genes which display independent or even inversely
correlated patterns. Those clusters that showed the most interesting results both in root and
leaf tissues are reported in Figures 5 and 6. Again, roots and leaves highlighted different
responses upon stress.
In root tissue, the most interesting results concerned “Transcription factors” and
“secondary metabolism” ontologies. Within TFs category (Figure 5A), reference DEGs
(101.14) were subdivided into three primary clusters designed as R-TF1, R-TF2 and R-
TF3. Each of these clusters were uniformly co-expressed in 101.14. In contrast, in M4
they were split in two distinct secondary clusters, one of which was similar in both 101.14
and M4 indicating a “partial conservation”, the other one showing a different behaviour of
several genes. Amongst them, of particular interesting were those belonging to the WRKY
family for what concerns cluster R-TF1, MYB family for R-TF2 and NAC family for R-
TF3. In Figure 5A we listed these genes together with their pattern of expression within
the whole stress kinetic in both the genotypes considered. Looking at the picture it’s clear
that the totality of WRKY TFs show a different behaviour between the two genotypes,
being strongly up-regulated at T2 (4 DASI) limitedly to the M4 rootstock. Regarding the
other gene families belonging to the TFs ontology which highlighted particularly
interestingly results, clusters R-TF2 and R-TF3 embed five MYBs and three NACs
transcription factors that were induced at T1 (2 DASI) in M4 and, conversely were
significantly down-regulated in 101.14 (Figure 5A). It is worthy to note that VvMYB14
(VIT_07s0005g03340) and NAC83-like (VIT_14s0068g01490) TFs, which do not belong
to the primary clusters R-TF1, R-TF2 and R-TF3 (the list of all primary clusters identified
is reported in Supplementary table Z), have been included in the list since they are
particularly interesting, in fact although highly expressed in both the genotypes analysed,
they show patterns of expression totally different between them. VvMYB14 showed an
high induction in stressed M4 roots at T2, T3 and T4 whereas its up-regulation in 101.14
was limited to T2 (Figure 5A). VvNAC83 was induced at T2 only in M4 WS roots, while
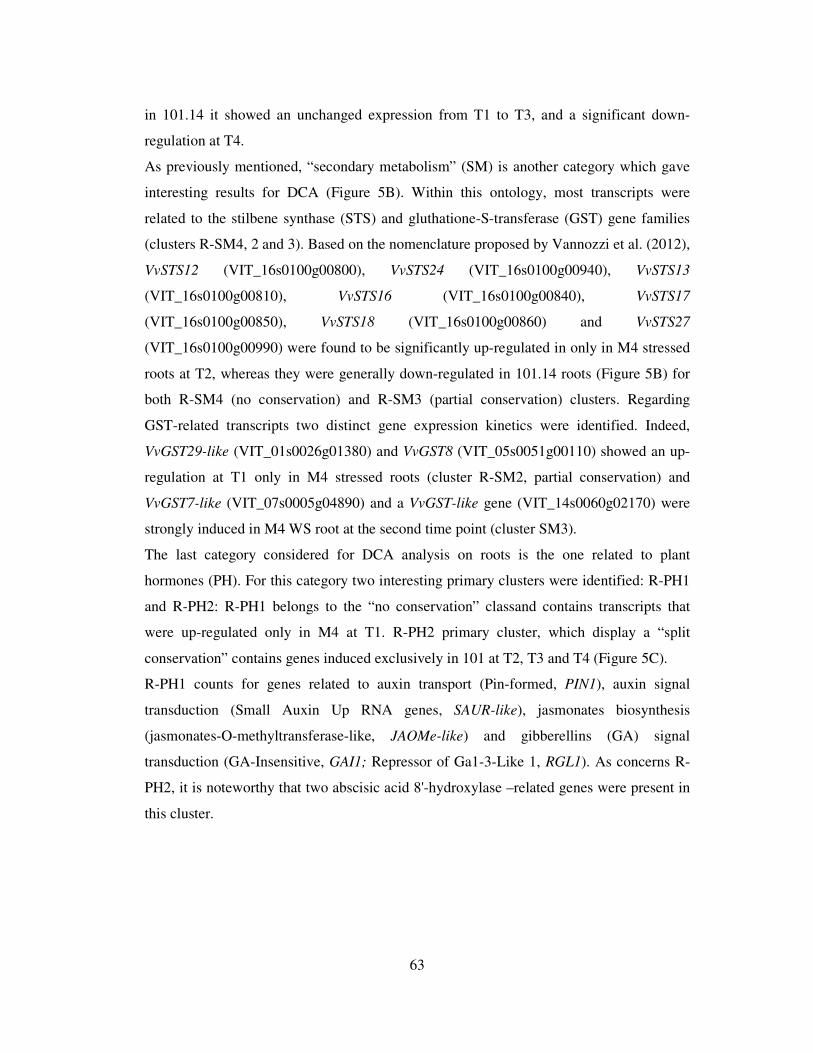
63
in 101.14 it showed an unchanged expression from T1 to T3, and a significant down-
regulation at T4.
As previously mentioned, “secondary metabolism” (SM) is another category which gave
interesting results for DCA (Figure 5B). Within this ontology, most transcripts were
related to the stilbene synthase (STS) and gluthatione-S-transferase (GST) gene families
(clusters R-SM4, 2 and 3). Based on the nomenclature proposed by Vannozzi et al. (2012),
VvSTS12 (VIT_16s0100g00800), VvSTS24 (VIT_16s0100g00940), VvSTS13
(VIT_16s0100g00810), VvSTS16 (VIT_16s0100g00840), VvSTS17
(VIT_16s0100g00850), VvSTS18 (VIT_16s0100g00860) and VvSTS27
(VIT_16s0100g00990) were found to be significantly up-regulated in only in M4 stressed
roots at T2, whereas they were generally down-regulated in 101.14 roots (Figure 5B) for
both R-SM4 (no conservation) and R-SM3 (partial conservation) clusters. Regarding
GST-related transcripts two distinct gene expression kinetics were identified. Indeed,
VvGST29-like (VIT_01s0026g01380) and VvGST8 (VIT_05s0051g00110) showed an up-
regulation at T1 only in M4 stressed roots (cluster R-SM2, partial conservation) and
VvGST7-like (VIT_07s0005g04890) and a VvGST-like gene (VIT_14s0060g02170) were
strongly induced in M4 WS root at the second time point (cluster SM3).
The last category considered for DCA analysis on roots is the one related to plant
hormones (PH). For this category two interesting primary clusters were identified: R-PH1
and R-PH2: R-PH1 belongs to the “no conservation” classand contains transcripts that
were up-regulated only in M4 at T1. R-PH2 primary cluster, which display a “split
conservation” contains genes induced exclusively in 101 at T2, T3 and T4 (Figure 5C).
R-PH1 counts for genes related to auxin transport (Pin-formed, PIN1), auxin signal
transduction (Small Auxin Up RNA genes, SAUR-like), jasmonates biosynthesis
(jasmonates-O-methyltransferase-like, JAOMe-like) and gibberellins (GA) signal
transduction (GA-Insensitive, GAI1; Repressor of Ga1-3-Like 1, RGL1). As concerns R-
PH2, it is noteworthy that two abscisic acid 8'-hydroxylase –related genes were present in
this cluster.
64
Figure 5. Differential cluster analysis results of root tissue. For correlation matrix (DCA), white (value = 1),
yellow (value = 0), and red (value = -1) indicate a complete correlation, no correlation, or anti-correlation,
65
respectively, among transcripts. As concerns tables with list of considered genes, red and blue represent up-
and down-regulation, respectively, of genes upon WS treatment.
Leaf tissue highlighted different results in comparison to root tissue. Within all considered
categories, sugars (L-SG), secondary metabolism (L-SM) and transcription factors (L-TF)
showed the most interesting results in the DCA. As previously described in the ontology
analyses, sugars category is the most represented in terms of DEGs. Six transcripts
contained in L-SG1 (partial conservation) cluster (Figure 6A) showed interesting
expression kinetics. In particular the enolase, Pyruvate Kinase-like (PK-like) and 1,3-β-
glucananase sugar-related genes were slightly induced at T1 and strongly up-regulated at
T2 in M4 stressed leaves. On the other hand, Glucose-1-phosphate adenylyltransferase 1-
like (AGPase 1-like) and 2,3-bisphosphoglycerate-dependent phosphoglycerate mutase -
like (PGK-like) showed a severe induction in both T1 and T2 time points in the M4
rootstock. Finally, sugar transporter 13-like (SUC 13-like) was induced in M4 leaf at time
points T2 and T3 (Figure 6A). On the contrary, these genes were down-regulated over all
the kinetic in 101.14 leaves, considering log2 WS/WW values (Figure 6A).
The second considered category in the DCA analysis is secondary metabolism. This group
highlighted very specific results if root and leaf tissues were compared. As previously
described, root tissue –related clusters contained several genes mainly belonging to
stilbene synthase and gluthatione-S-transferase families. In contrast, leaf tissue L-SM4
cluster included 12 interesting genes related to the flavonoid metabolic pathway, which
were all induced at T1 and strongly expressed and induced at T2 in the M4 stressed leaves
(Figure 6B). It is worthy of note that these genes are involved in most of the reactions
which start from phenylalanine and lead to the biosynthesis of flavonols and anthocyanins
–related compounds. Specifically L-SM4 (partial conservation) cluster contained: (i)
Phenilalanine Ammonio Lyase (PAL), Chalcone Synthase (CHS) and Chalcone Isomerase
(CHI) genes, that catalyzed the early reactions of the phenylpropanoids pathway; (ii)
flavonoid 3-hydroxylase-related genes (F3’5’H 2-like and two F3H-like); (iii) Flavonol
Synthase 4 (FLS4) and FLS5, which lead to the flavonols biosynthesis; (iv)
Dihydroflavonol 4-Reductase (DFR 4-like), Leucoanthocyanidin Dioxygenase (LDOX)
and Anthocyanidin Reductase (ANR), which lead to the anthocyanins biosynthesis.

66
Figure 6. Differential cluster analysis results of leaf tissue. For correlation matrix (DCA), white (value = 1),
yellow (value = 0), and red (value = -1) indicate a complete correlation, no correlation, or anti-correlation,
67
respectively, among transcripts. As concerns tables with list of considered genes, red and blue represent up-
and down-regulation, respectively, of genes upon WS treatment
The third relevant category which comes from DCA is related to plant TFs (L-TF). Within
this category, MYB family was the most represented gene family which showed opposite
expression kinetic among M4 and 101.14. In L-TF2 (partial conservation) cluster (Figure
6C) four MYB TFs were identified, which were induced 2 and 4 days after stress
imposition (T1 and T2) only in M4 rootstock. On the contrary all these TFs showed an
higher expression in the 101.14 unstressed leaf in comparison to the stressed one (Figure
6C). In addition to these genes, L-TF2 cluster contained a rice DD1A (DD1A-like) gene
and another gene with unknown function, which were both up-regulated at T1 in M4 leaf
subjected to water stress. Transparent testa 2 (TT2-like) and NAC 71-like genes, that
belongs to L-TF1 (partial conservation) cluster, were both up regulated in M4 (log2
WS/WW) until 7 days after stress imposition (T3), while, Inducer of CBF expression 1
(ICE1) stress-related genes was strongly induced in M4 rootstock over all the kinetic
considered in this experiment (Figure 6C).
Finally, the last considered category was the antioxidant responses (L-AR). Interestingly,
in this group (split conservation) there were three genes belonging to the Laccase (LAC)
family that highlighted an induction in M4 leaves in the early phase after water stress
imposition (T1) (Figure 6D).
68
4. Discussion
In this study the transcriptome profiles obtained from leaves and roots of a drought-
tolerant and a susceptible grapevine rootstock upon water stress were compared in order to
clarify the molecular mechanisms explaining, at least at the transcriptional level, the
different degrees of susceptibility observed. The novelty of the present work relies on two
main aspects: firstly, to our knowledge this is the first report of a comparison between
transcriptomes of a susceptible and a putative-tolerant grapevine rootstock, secondly, this
work also introduces a comparison between the basal (roots) and the aerial (leaves) parts
of the plants upon stress.
In order to reproduce as accurately as possible real open-field conditions and thus study an
adaptive instead of a shock response to water stress, drought imposition was progressively
applied to M4 and 101.14 plants by gradually reducing water addiction to desired field
capacity from 80 % to 30 % during a 10 days treatment (Figure 1). This was a different
experimental design compared to what observed in Cramer et al. (2007), where authors
completely stopped water addiction from the beginning of water stress experiment.
During the first stages of water deprivation leaf physiological parameters decreased in
both 101.14 and M4 genotypes, but after 6 days, when the stress became more severe
(30% of field capacity), leaves transpiration was almost completely inhibited in 101.14
plants, whereas maintained E values of about 24% with respect to its control in M4 (WW
plants). In the same experimental condition, Meggio et al. (IN PRESS) observed a
concurrent decrease of gs and An in both genotypes in the early stages of WS,, but at later
time points, a different physiological response to water stress took place among the two
genotypes. Indeed, an almost complete inhibition of both assimilation and transpiration
rates was observed in 101.14 as stomatal conductance drop to values of 5 % with respect
to its control. On the contrary M4, maintaining gs values of 20 % with respect to its
control, allowed higher transpiration rates (24 %) partially recovered An to values of
approximately 60 % compared to control.
All these data indicates that, after a concurrent decrease of all physiological parameters
observed in both genotypes in the early stages of drought (Meggio et al., IN PRESS), as
stress conditions became severe, M4 was able to maintain higher transpiration and net
69
assimilation rates demonstrating a much better ability to acclimatize in comparison to the
susceptible genotype.
RNA-seq analysis helped us to clarify the molecular mechanisms which explain these
differential responses. Aligning reads obtained from transcriptomes deriving from
different grapevine species such as V. riparia, V. rupestris, V. Berlandieri and V. vinifera
to the reference genome obtained from a high homozygous Pinot noir line, could be
hazardous since structural variation and variability had been described even within the
vinifera species, as observed by Venturini et al. (2013) aligning V. vinifera cv Corvina
against the PN40024 12v1 reference genome. Citing other examples, in a large scale study
in which the assemblies of 18 genomes coming from 18 natural A. thaliana accessions
were compared (Gan et al., 2011), was demonstrated that one-third of protein-coding
genes predicted in Col-0 are disrupted in at least one of the other arabidopsis accessions
and in some way restored under the form of alternative gene models. Moreover it was
shown that gene expression of different ecotypes in the same conditions differs for nearly
half of expressed genes and is associated with cis variants due to SNPs (approximately 0.5
to 0.8 Mln between Col-0 and the other ecotypes) and in/del (about 1,2 Mln).
Based on these observations seems to be necessary sequenced and reannotated each
individual genomes to avoid bias interpreting the consequence of genetic variation and
expression. Nevertheless, despite alignment of 101.14 and M4 transcriptomes against that
PN40024 reference led to a “lost” of a remarkable number of reads which did not map to
any prediction within the reference genome (approximately 50%), the high throughput of
the instrument used for sequencing allowed to reach a suitable coverage of the grape
transcriptome ranging from approximately 20 to 60 fold. Moreover, as we were dealing
with a comparative approach, aligning reads to a common reference genome rather than
making de novo assemblies for each single genotype was considered essential to establish
comparisons and relations between transcriptional data obtained from the two genotypes.
In these sense the PN40024 reference genome was utilized as a sort of common
denominator for interpreting a part of the phenotypic variability observed between the two
rootstocks.
Multifactorial analyses (Figure 2) on the whole leaf and root transcriptome datasets
allowed us to better define the weight of the genotype (i.e. the rootstock) and of the
70
treatment on the transcriptome layout and to filter out those DE genes whose expression is
only liked to the contribute of a single component. In other word we excluded those genes
which are differentially expressed just because of differences amongst genotypes or
because of treatment and we only consider those ones which were affected by the
contribute of both the variables (McCarthy et al., 2012).
A first general observation comparing results of the multifactorial analyses performed on
leaves and roots is that in root tissue (Figure 2A) the “treatment” factor seems to be the
main variable explaining differential gene expression (7905 DEGs) depend on the kind
treatment imposed) whereas in leaf tissue (Figure 2B) the weight of the genotype
(rootstock) appear to be the highest (3794). This observation is not surprising, considering
that the root system is the first organ perceiving the water deprivation stress and the main
one actively responding to it. In this case it’s clear the kind of treatment imposed represent
the main variable influencing expression whereas the effect of the genotype is less
determinant on differential expression of genes. The opposite is true on the aerial part of
plants: in leaves, the genotype factor appeared to have a major effect when compared to
the other components. Frensch et al. (1997) observed that in maize plants undergoing
water deprivation, roots and leaves use different strategies in response to stress and there
is a preferential growth of root system in respect to shot. These differential responses were
partially explained by the “cable theory”, according to which the elongation zones in roots
and shot are hydraulically separated and use different strategies to control water potential
gradients. A possible explanation of this event is that, after a first stress perception
mediated by roots, secondary signals which caused perturbations were perceived by leaves
and the effect of the genotype in countering these perturbations is of primary importance.
As a general observation, the number of DEGs in roots was always higher compared to
leaves, as reported in Figure 2, showing the Venn diagrams obtained from the
multifactorial analysis, but also in Figure 3 showing the pairwise comparison within each
timepoint considered. If we only compare those DEGs considered for the ontologies
analysis (those ones common to R-T, and R-T- P components), there were 4072 DE genes
detected in roots and only 1152 in leaf.
In root, TFs category was the most represented one with 7.5% of total DEGs belonging to
it. On the other hand, in leaf tissue, the majority of DEGs belong to “sugars” category.
71
This is not unexpected considering that sugars accumulation during osmotic stresses has
been reported in numerous species and tissues (Wingler and Roitsch, 2008; Sun et al.,
2010; Castellarin et al., 2007; Valluru and Van den Ende, 2008).
As concerns plant hormones category, it was showed an induction of auxin, JAs and GAs
related-genes at T1 in M4 stressed roots (Figure 5C), whereas a up-regulation of these
transcripts in unstressed root was observed in 101.14. Regarding JAs metabolism,
VvJAOMe-like (VIT_04s0023g02200) is a key enzyme in jasmonates biosynthetic
pathway and is involved in the formation of methyl jasmonate (MeJA) from jasmonic acid
(Wasternack, 2007; Seo et al., 2001). MeJA mediates diverse developmental processes
and defence responses against biotic and abiotic stresses in plants (Ismail et al., 2012).
Some authors showed, in rice and chickpea (root), a strong correlation between drought
and MeJA biosynthesis and they hypothesize its role in water stress mediated response.
They speculate that plant produced MeJA in response to water scarcity, which in turn
stimulated the production of the “stress hormone” ABA (De Domenico et al., 2012).
In figure 5C was observed an induction at T1 in M4 WS root of GAI1 and RGL1, which
are essential components of GAs signal transduction. It is well known that, under
environmental stresses, DELLA protein, such as RGL1, were accumulated and conferred
more tolerance to plants (Achard et al., 2008). Achard et al. (2008), showed that DELLA
have an important role in oxidative stress responses by reduced ROS species; indeed, they
observed that DELLAs delayed H2O2-induced cell death, thereby promoting stress
tolerance (Achard et al., 2008).
On the other hand, in leaf, DEGs related to sugars were the most represented in the
ontology analysis (Figure 4) and they were strongly up-regulated in M4 leaves upon WS,
conversely to what observed in 101.14 (Figure 6A). Among this category, VvAGPase1-
like (VIT_03s0038g04570) where highly induced in M4, indeed it showed an expression
which is three and ten times higher upon WS at T1 and T2, respectively (Figure 6A).
AGPase is a key enzyme in starch biosynthesis and its expression is related to threalose
accumulation (O’Hara et al., 2013). In Arabidopsis thaliana, Kempa et al. (2008) showed
that, in presence of osmotic stress, ADP-glucose pyrophosphorylase (AGPase1 and 2),
which provides ADP-glucose, were induced. In addition they hypotesize a role of genes
belonging to both starch mobilisation and starch synthesis processes when plants were
72
subjected to osmotic stresses (Kempa et al., 2008). In addition, Gamm et al. (2011) found
that AGPase activity was increased after infection of grapevine leaves with the oomycete
Plasmopara viticola, together with accumulation of trehalose and the induction of
trehalase.
Another category which showed particularly interesting results was the “antioxidant
responses” one (Figure 4), in particular genes belonging to the laccase family were
strongly induced at T1 only in M4 stressed leaves (Figure 6D). Laccase are part of another
large family of enzymes, called the multicopper enzymes. They are present in both plants
and fungi but their role in stress responses are still unclear (Mayer and Staples, 2002). As
concerns abiotic stresses, Liang et al. (2006) demonstrated that maize LAC1 expression
was enhanced upon high salinity and they suggested an involvement of this class of
enzymes in response to salt stress (Liang et al., 2006).
“Secondary metabolism” ontology category was the only one in common among
considered organs but involved different responses between root and leaves. It is worthy
of note that root (Figure 5B) and leaf (Figure 6B) highlighted a strong specificity of DEGs
expression kinetics, as observed in DCA analysis. In particular, in M4 root tissue was
observed a strong up regulation of several STS transcripts (e.g. VvSTS18/24/27) after 4
DASI (T2) and an induction of four GST-related genes at T1 (GST8 and 29) and T2-T4
(GST25 and GST-like). It is well known that genes involved in resveratrol biosynthesis
(STSs) increased their expression in response to several biotic and abiotic stresses (UV,
high salinity, drought) but their role in these processes is still matter of debate (Versari et
al., 2001; Höll et al., 2013; Vannozzi et al., 2012). Stilbene and resveratrol synthase were
expressed in several organs in response to abiotic stresses. A strong tissue specificity of
resveratrol synthase was observed in peanut plants during development, indeed this
compound was present at relatively high levels in both roots and pods organs, but at below
the detection limit in leaves (Chung et al., 2001). As concerns Vitis species, an induction
of STSs genes in response to treatment was observed in Vitis rotundifolia hairy root after
H2O2 treatment (Nopo-Olazabal et al., 2014). Hydrogen peroxide is a ROS which have
been suggested to play a key signaling role in plant responses to several abiotic stresses
(such as extreme temperatures, drought, radiation, ozone, and wounding) treatment. In the
above described work they highlighted a strong specificity in root tissue of these
73
transcripts in response to abiotic stresses perturbations (Nopo-Olazabal et al., 2014). As
showed by Wang et al. (2010), stilbenes synthases expressions were higher in both young
root and leaves of Vitis vinifera cv. Cabernet sauvignon, but STS was highly expressed
only in leaves when an UV treatment was carried out. In the present paper it was reported
for the first time in Vitis a strong specificity of STSs genes expression in root tissue after
water stress treatment, considering the induction of these transcripts observed in various
and specific organs in response to other kind of abiotic (UV light in particular) and biotic
stresses (Vannozzi et al., 2012; Nopo-Olazabal et al., 2014; Wang et al., 2010; Shi et al.,
2014) we can hypnotized that the expression of this class of transcripts, listed in figure 5B,
should be strongly related to drought treatment. In addition to STS, also GSTs transcripts
(figure 5B) showed an up-regulation in M4 roots. Plant GSTs have also long been
associated with responses to biotic and abiotic stress, hormones and developmental
change; GSTs role in response to abiotic stress is due to their capability of normalizing
ROS level (Kar, 2011; Dixon et al., 2010).
On the other hand, in leaf tissue expression of genes related to secondary metabolism
highlighted different responses to what observed in root. In this case it was observed a
strong induction in M4 stressed leaves at T1 and a strongly induction at T2 (log2 WS/WW
of 2-4) of transcripts leading to flavonoids biosynthesis, such as CHS, F3H, FLS, LDOX
and other genes involved in this pathway (Figure 6B). The up-regulation of transcripts and
metabolites in response to drought in the aerial part of grapevine and other species were
reported in other studies (Castellarin et al., 2007; Ramakrishna and Ravishankar, 2011).
Castellarin et al. (2007) showed that the majority of genes committed to the flavonoid
pathway (i.e. CHS, F3’5’H, F3’H and UFGT) showed patterns of increased transcript
accumulation in WS plants. In addition, drought often causes oxidative stress and was
reported to show increase in the amounts of flavonoids and phenolic acids in willow
(Pisum sativum) leaves (Chalker-Scott, 1999) and it was observed that plant tissues
containing anthocyanins are usually rather resistant to drought (Larson, 1988).
As previously described, upon WS, roots and leaves of the tolerant genotype M4 exhibit
an higher induction of stilbenes and flavonoids biosynthetic genes, respectively. But, why
plants choose to synthesize these compounds which are metabolically expensive? A
possible explanation is related to their roles antioxidant compounds.
74
Water stress, which can be define as “primary stress”, induces the accumulation of several
compounds and increase the production of reactive oxygen species (Kar, 2011). Indeed,
metabolic pathways in plant organelles are sensitive to changes in environmental
conditions (such as drought and other stresses), and metabolic imbalances can induce a
“secondary” oxidative stress, which caused oxidation of cellular components and may
damage organelle integrity (Apel and Hirt, 2004; Suzuki et al., 2012; Mittler, 2002). It is
clear that ROS control and scaveging is mandatory for plant survival in presence of abiotic
stresses. To protect themselves against oxidative damage and control ROS levels, plants
evolved defence mechanism to scavenge ROS by producing a large numbers of molecules
which acts as scavenger (i.e. SOD, CAT, APX) (Kar, 2011; Sozuki et al., 2012). In
addition to these scavengers, there are other compounds with antioxidant activity in plant.
Stilbenes and flavonoids are claimed to have this important function in these processes.
Stilbenoids (resveratrol in particular) are a powerful defence antioxidant molecules
founded in several species and their accumulation is particularly higher in grapevine
species (Tillett et al., 2011; Höll et al., 2013; Vannozzi et al., 2012; Stuart and Robb,
2013). The chemistry of stilbenes in grape compounds is very complex. These antioxidant
compounds act as phytoalexins, synthesized by plants in response to biotic and abiotic
stress (Flamini et al., 2013). Their antioxidant activity was extensively studied in humans
(de la Lastra and Villegas, 2007; Hosoda et al., 2013) but how stilbenes act as antioxidant
in plants are still object of experiments. Also flavonoids, which were significantly induced
in M4 leaves upon WS (Figure 6B), have been suggested to play an important function as
antioxidant in plant response to oxidative stresses (Ramakrishna and Ravishankar, 2011;
Brunetti et al., 2013).
Indeed, they contrast the oxidative stress related to an excess of excitation energy in the
chloroplast by absorb solar wavelengths (Agati et al., 2012). Oxidative damage is strongly
induced by environmental perturbations which limit CO2 assimilation and its diffusion to
the carboxylation sites (Brunetti et al., 2013; Agati et al., 2012; Hernández et al., 2009).
These events are exacerbated when plants were subjected to environmental stresses, such
as drought or high salinity. This function of flavonoids may reduce the activity of
enzymes which are claimed to acts as “primary” ROS scavenger (i.e. SOD and CAT) in
the chloroplast (Brunetti et al., 2013; Mullineaux and Karpinski, 2002). In addition,
75
flavonoids were capable of quenching H2O2 and other free-radicals species and to protect
the chloroplast membrane from oxidative damage thanks to their capability to stabilizing
membranes that contain non-bilayer lipids (Agati et al., 2012).
Taking into accounts the above discussed data, transcripts related to stilbenoids, together
with GSTs and DELLAs related-genes (figure 5B, 5C), and flavonoids (figure 6B)
biosynthesis have, respectively, a root and leaf tissue-specific expression upon drought. In
presence of water stress, M4 rootstock may acts differential mechanisms in root and
leaves which leads to the production of molecules, such as resveratrol and flavonoids.
These events may constitute a secondary antioxidant system in these plant tissues. The
higher resistance of M4 rootstock to water stress, in comparison to what observed in
101.14, should be related to these events. Indeed, a possible explanation is that grapevine
species which are drought-tolerant act, in addition to “primary mechanisms” of ROS
scaveging, also other “secondary mechanisms” which leads to the biosynthesis of different
secondary compounds in root and leaves. In this way, M4 (like other grapevine stress-
tolerant genotypes) have a greater capability to control ROS homeostasis and prevent
oxidative damages than the susceptible genotypes.
M4 and 101.14 showed an interesting differential regulation of flavonoids/stilbenoids-
related genes in root and leaf, but how is regulated the transcription of these gene?
Transcription factors could have an important role in these processes. Role of stress-
responsive TFs is well documented, they interact with cis-elements in the promoter
regions of several stress-related genes and thus up-regulate the expression of many
downstream genes resulting in imparting abiotic stress tolerance (Agarwal and Jha, 2010).
Transcriptomic data suggest that plant TFs are involved in a large number of metabolic
processes in response to abiotic stresses and that controlled the expression of a large
number of genes by an intricate regulatory network (Lata et al., 2011).
As showed in figure 5A, in root, three classes of TFs showed the major changes in
transcript abundance between M4 and 101.14 in response to water deficit: WRKY, MYB
and NAC families. Among these, WRKY were the most represented. WRKY proteins
represent an important class of transcriptional regulators involved in plants biotic and
abiotic stress (e.g. drought, high salinity, UV) induced pathways. In this experiment, a
relatively large group of VvWRKY genes were strongly induced in M4 root 4 days after
76
stress treatment, these included VvWRKY24. Despite what observed by Wang et al., (IN
PRESS), which hypotized a role of VvWRKY24 only in response to cold stress, it was one
of the most expressed in our dataset in response to drought. Interestingly, Li et al., (2010)
showed that AtWRKY54, which is ortholog to our VvWRKY25 (Figure 5A), is significantly
induced by cold and drought treatments, and by E. necator infection. These result suggests
that VvWRKY25 may mediating plant defense response in V.vinifera and also play a role in
abiotic stress responses.
In our work, VvWRKY24/28/29/37/41 exybith a co-expression with STSs genes (figure
5A), indeed they were all strongly induced at T2 only in M4, althought are ncessary more
evidences,, it is might hypothesized that some WRKY are actively involved in the
regulation of STSs gene expression . In addition to the WRKY family, also VvMYB14
transcript were strongly induced in M4 stressed roots and its up-regulation paralleled those
observed for STSs genes. As already observed by Höll et al. (2013), VvMYB14 (figure
5A) control the expression of grapevine VvSTS25/27/29 under UV-C and wounding
conditions. In our experimental conditions the co-expression analysis reveals a
cooperation between thatVvSTS27/29 and VvMYB14 (Figure 5A) suggesting for the latter
a possible role also in drought stress response. Except for VvMYB2 (Figure 5A), whose
Arabidopsis ortholog cooperate with AtMYC2 as transcriptional activators of genes (as
rd22) able to increase tolerance to drought (Abe et al., 2003), the other stress-induced
MYBs are not already indicated as stress-related TFs. However, it is worthy of note that
they are co-expressed with GST29-like and GST8-like (Figure 5B), two genes involved, as
described above, in the response to oxidative stress.
In WS root, last identified family of TFs in DEGs (Figure 5A), was that of NAC . Within
this family, the involvement of NAC2 (Figure 5A) in the regulatory network governing
responses to stresses is well documented. In transgenic rice plants for
Os01g66120/OsNAC2/6 gene were showing an enhancement of drought tolerance
(Nakashima et al., 2007) or AtNAC2 play a central role in the cross-talk among several
hormonal metabolisms in response to salinity stress (He et al., 2005).
In leaf tissue were observed a lower number of DEGs TFs-related, compared to root
tissue, and most of them belong to the MYB-family. As well as in root, also in leaf MYB
TFs are known to control several pathways in response to stress through the activation of a
77
large number of stress-responsive genes (Lata et al., 2011; Ambawat et al., 2013;
Czemmel et al., 2012). In this work, all MYBs identified as DEG were induced at T1 and
T2 (Figure 6C) in the putative-tolerant rootstocks and their expression paralleled that
observed for DEGs coding for flavonoids biosynthetic enzymes (Figure 6B). A strong
connection between MYB and flavonoids is well documented (for a review see Czemmel
et al., 2012). R2R3-MYB proteins have been identified to be the key determinants in
regulatory networks controlling not only the allocation of specific gene expression
patterns during flavonoid biosynthesis, but also diverse aspects of development and
responses to biotic and abiotic stresses which are not related to production of secondary
metabolites (Ravaglia et al., 2013; Stracke et al., 2001). Among VvMYB genes (Figure
6C), VvMYBPA1-like was one of the most abundantly expressed (Figure 6C). MYBPA
genes are known to induce the expression of biosynthetic genes (CHS, CHI, DFR, LDOX
and ANR)involved in proanthocyanidins (PA) biosynthetic pathway, indeed PA
accumulation has been shown to be regulate by the presence of MYBPA1 and MYBPA2
(Czemmel et al., 2012). Together with VvMYBPA1-like, also MYB12 is known to enhance
the expression of several flavonoids biosynthetic genes, such as CHS, CHI, F3H and FLS
(Ambawat et al., 2013), which are all induced at T1-T2 in M4 WS leaf (Figure 6B).
Furthermore, MYB2 gene, which also is reported in our dataset, in Arabidopsis is known
to be induced upon dehydration or salt stress (Ambawat et al., 2013). In order to confirm
the differences observed among M4 and 101.14 in the control of secondary metabolism –
related genes by TFs, the next step in this work will be the analysis of the cis-elements
present in the promoter region of both genotypes.
In this work we exhaustively described the transcriptomic responses to drought of two
genotypes in root and leaf tissues. Despite to what observed in other studies (Cramer et
al., 2007; Tattersall et al., 2007; Tillett et al., 2011), we did not considered responses to
water stress which were in common among susceptible and tolerant plants (e.g. ABA,
photosynthetic and sugars –related genes) but only the expression of those genes which
were strictly related to the tolerant rootstock. This allowed us to identify novel putative
gene networks carried out by grapevine which showed an higher resistance to osmotic
stress. In the near future, the expression of selected genes has to be evaluate on a large
range of genotypes which showed differential responses upon drought in order to

78
understand if these genes can be used as functional markers for WS-tolerant grapevine
plants.
5. Acknowledgements
This study was supported by the AGER “SERRES” Project, grant n° 2010-2105.
79
6. References
Abe H, Urao T, Ito T, Seki M, Shinozaki K, Yamaguchi-Shinozaki K. 2003.
Arabidopsis AtMYC2 (bHLH) and AtMYB2 (MYB) function as transcriptional activators
in abscisic acid signaling. The Plant cell 15, 63-78.
Achard P, Renou J-P, Berthomé R, Harberd NP, Genschik P. 2008. Plant DELLAs
Restrain Growth and Promote Survival of Adversity by Reducing the Levels of Reactive
Oxygen Species. Current Biology 18, 656-660.
Agarwal PK, Jha B. 2010. Transcription factors in plants and ABA dependent and
independent abiotic stress signalling. Biologia Plantarum 54, 201-212.
Agati G, Azzarello E, Pollastri S, Tattini M. 2012. Flavonoids as antioxidants in plants:
Location and functional significance. Plant Science 196, 67-76.
Ambawat S, Sharma P, Yadav N, Yadav R. 2013. MYB transcription factor genes as
regulators for plant responses: an overview. Physiology and Molecular Biology of Plants
19, 307-321.
Anders S, Huber W. 2010. Differential expression analysis for sequence count data.
Genome Biology 11, R106.
Apel K, Hirt H. 2004. REACTIVE OXYGEN SPECIES: Metabolism, Oxidative Stress,
and Signal Transduction. Annual Review of Plant Biology 55, 373-399.
Arndt SK, Wanek W, Clifford SC, Popp M. 2000. Contrasting adaptations to drought
stress in field-grown <i>Ziziphus mauritiana</i> and <i>Prunus persica</i> trees: water
relations, osmotic adjustment and carbon isotope composition. Functional Plant Biology
27, 985-996.
Arrigo N, Arnold C. 2007. Naturalised Vitis rootstocks in Europe and consequences to
native wild grapevine. PLoS ONE 2, e521.
Bisson LF, Waterhouse AL, Ebeler SE, Walker MA, Lapsley JT. 2002. The present
and future of the international wine industry. Nature 418, 696-699.
Bogs J, Downey MO, Harvey JS, Ashton AR, Tanner GJ, Robinson SP. 2005.
Proanthocyanidin synthesis and expression of genes encoding leucoanthocyanidin
reductase and anthocyanidin reductase in developing grape berries and grapevine leaves.
Plant physiology 139, 652-663.
Bogs J, Jaffe FW, Takos AM, Walker AR, Robinson SP. 2007. The grapevine
transcription factor VvMYBPA1 regulates proanthocyanidin synthesis during fruit
development. Plant physiology 143, 1347-1361.
Botton A, Galla G, Conesa A, Bachem C, Ramina A, Barcaccia G. 2008. Large-scale
Gene Ontology analysis of plant transcriptome-derived sequences retrieved by AFLP
technology. BMC Genomics 9, 347.
80
Brunetti C, Di Ferdinando M, Fini A, Pollastri S, Tattini M. 2013. Flavonoids as
Antioxidants and Developmental Regulators: Relative Significance in Plants and Humans.
International Journal of Molecular Sciences 14, 3540-3555.
Campagna D, Albiero A, Bilardi A, Caniato E, Forcato C, Manavski S, Vitulo N, Valle G. 2009. PASS: a program to align short sequences. Bioinformatics 25, 967-968.
Castellarin S, Matthews M, Gaspero G, Gambetta G. 2007. Water deficits accelerate
ripening and induce changes in gene expression regulating flavonoid biosynthesis in grape
berries. Planta 227, 101-112.
Chalker-Scott L. 1999. Environmental Significance of Anthocyanins in Plant Stress
Responses. Photochemistry and Photobiology 70, 1-9.
Chaves MM, Flexas J, Pinheiro C. 2009. Photosynthesis under drought and salt stress:
regulation mechanisms from whole plant to cell. Annals of Botany 103, 551-560.
Chaves MM, Pereira JS, Maroco J, Rodrigues ML, Ricardo CPP, Osòrio ML, Carvalho I, Faria T, Pinheiro C. 2002. How Plants Cope with Water Stress in the Field?
Photosynthesis and Growth. Annals of Botany 89, 907-916.
Chaves MM, Zarrouk O, Francisco R, Costa JM, Santos T, Regalado AP, Rodrigues ML, Lopes CM. 2010. Grapevine under deficit irrigation: hints from physiological and
molecular data. Annals of Botany 105, 661-676.
Chung IM, Park MR, Rehman S, Yun SJ. 2001. Tissue specific and inducible
expression of resveratrol synthase gene in peanut plants. Molecules and cells 12, 353-359.
Cohen D, Bogeat-Triboulot MB, Tisserant E, Balzergue S, Martin-Magniette ML, Lelandais G, Ningre N, Renou JP, Tamby JP, Le Thiec D, Hummel I. 2010.
Comparative transcriptomics of drought responses in Populus: a meta-analysis of genome-
wide expression profiling in mature leaves and root apices across two genotypes. BMC
Genomics 11, 630.
Cominelli E, Conti L, Tonelli C, Galbiati M. 2013. Challenges and perspectives to
improve crop drought and salinity tolerance. New Biotechnology 30, 355-361.
Covarrubias J, Rombolà A. 2013. Physiological and biochemical responses of the iron
chlorosis tolerant grapevine rootstock 140 Ruggeri to iron deficiency and bicarbonate.
Plant and Soil 370, 305-315.
Cramer G, Ergül A, Grimplet J, Tillett R, Tattersall ER, Bohlman M, Vincent D, Sonderegger J, Evans J, Osborne C, Quilici D, Schlauch K, Schooley D, Cushman J.
2007. Water and salinity stress in grapevines: early and late changes in transcript and
metabolite profiles. Functional & Integrative Genomics 7, 111-134.
Creelman RA, Mullet JE. 1995. Jasmonic acid distribution and action in plants:
regulation during development and response to biotic and abiotic stress. Proceedings of
the National Academy of Sciences 92, 4114-4119.
81
Czemmel S, Heppel S, Bogs J. 2012. R2R3 MYB transcription factors: key regulators of
the flavonoid biosynthetic pathway in grapevine. Protoplasma 249, 109-118.
De Domenico S, Bonsegna S, Horres R, Pastor V, Taurino M, Poltronieri P, Imtiaz M, Kahl G, Flors V, Winter P, Santino A. 2012. Transcriptomic analysis of oxylipin
biosynthesis genes and chemical profiling reveal an early induction of jasmonates in
chickpea roots under drought stress. Plant Physiology and Biochemistry 61, 115-122.
de la Lastra CA, Villegas I. 2007. Resveratrol as an antioxidant and pro-oxidant agent:
mechanisms and clinical implications. Biochemical Society transactions 35, 1156-1160.
Desikan R, Hancock JT, Bright J, Harrison J, Weir I, Hooley R, Neill SJ. 2005. A
role for ETR1 in hydrogen peroxide signaling in stomatal guard cells. Plant physiology
137, 831-834.
Dixon DP, Skipsey M, Edwards R. 2010. Roles for glutathione transferases in plant
secondary metabolism. Phytochemistry 71, 338-350.
Downey MO, Harvey JS, Robinson SP. 2003. Analysis of tannins in seeds and skins of
Shiraz grapes throughout berry development. Australian Journal of Grape and Wine
Research 9, 15-27.
Eisen MB, Spellman PT, Brown PO, Botstein D. 1998. Cluster analysis and display of
genome-wide expression patterns. Proceedings of the National Academy of Sciences of the
United States of America 95, 14863-14868.
Escobar-Gutiérrez AJ, Gaudillére J-P. 1994. Variability in Sorbitol: Sucrose Ratios in
Mature Leaves of Different Peach Cultivars. Journal of the American Society for
Horticultural Science 119, 321-324.
Fisarakis I, Chartzoulakis K, Stavrakas D. 2001. Response of Sultana vines (V.
vinifera L.) on six rootstocks to NaCl salinity exposure and recovery. Agricultural Water
Management 51, 13-27.
Flamini R, Mattivi F, Rosso M, Arapitsas P, Bavaresco L. 2013. Advanced Knowledge
of Three Important Classes of Grape Phenolics: Anthocyanins, Stilbenes and Flavonols.
International Journal of Molecular Sciences 14, 19651-19669.
Flexas J, Barón M, Bota J, Ducruet J-M, Gallé A, Galmés J, Jiménez M, Pou A, Ribas-Carbó M, Sajnani C, Tomàs M, Medrano H. 2009. Photosynthesis limitations
during water stress acclimation and recovery in the drought-adapted Vitis hybrid Richter-
110 (V. berlandieri×V. rupestris). Journal of experimental botany 60, 2361-2377.
Frensch J. 1997. Primary responses of root and leaf elongation to water deficits in the
atmosphere and soil solution. Journal of Experimental Botany 48, 985-999.
Fujita Y, Fujita M, Shinozaki K, Yamaguchi-Shinozaki K. 2011. ABA-mediated
transcriptional regulation in response to osmotic stress in plants. Journal of plant research
124, 509-525.
82
Gambetta GA, Manuck CM, Drucker ST, Shaghasi T, Fort K, Matthews MA, Walker MA, McElrone AJ. 2012. The relationship between root hydraulics and scion
vigour across Vitis rootstocks: what role do root aquaporins play? Journal of experimental
botany 63, 6445-6455.
Gamm M, Héloir M-C, Bligny R, Vaillant-Gaveau N, Trouvelot S, Alcaraz G, Frettinger P, Clément C, Pugin A, Wendehenne D, Adrian M. 2011. Changes in
Carbohydrate Metabolism in Plasmopara viticola-Infected Grapevine Leaves. Molecular
Plant-Microbe Interactions 24, 1061-1073.
Gan X, Stegle O, Behr J, Steffen JG, Drewe P, Hildebrand KL, Lyngsoe R, Schultheiss SJ, Osborne EJ, Sreedharan VT, Kahles A, Bohnert R, Jean G, Derwent P, Kersey P, Belfield EJ, Harberd NP, Kemen E, Toomajian C, Kover PX, Clark RM, Ratsch G, Mott R. 2011. Multiple reference genomes and transcriptomes for
Arabidopsis thaliana. Nature 477, 419-423.
Götz S, García-Gómez JM, Terol J, Williams TD, Nagaraj SH, Nueda MJ, Robles M, Talón M, Dopazo J, Conesa A. 2008. High-throughput functional annotation and data
mining with the Blast2GO suite. Nucleic Acids Research 36, 3420-3435.
Gregory PJ, Atkinson CJ, Bengough AG, Else MA, Fernández-Fernández F, Harrison RJ, Schmidt S. 2013. Contributions of roots and rootstocks to sustainable,
intensified crop production. Journal of Experimental Botany 64, 1209-1222.
He X-J, Mu R-L, Cao W-H, Zhang Z-G, Zhang J-S, Chen S-Y. 2005. AtNAC2, a
transcription factor downstream of ethylene and auxin signaling pathways, is involved in
salt stress response and lateral root development. The Plant Journal 44, 903-916.
Hernández I, Alegre L, Van Breusegem F, Munné-Bosch S. 2009. How relevant are
flavonoids as antioxidants in plants? Trends in Plant Science 14, 125-132.
Höll J, Vannozzi A, Czemmel S, D'Onofrio C, Walker AR, Rausch T, Lucchin M, Boss PK, Dry IB, Bogs J. 2013. The R2R3-MYB Transcription Factors MYB14 and
MYB15 Regulate Stilbene Biosynthesis in Vitis vinifera. The Plant Cell Online.
Hosoda R, Kuno A, Hori YS, Ohtani K, Wakamiya N, Oohiro A, Hamada H, Horio Y. 2013. Differential Cell-Protective Function of Two Resveratrol (Trans-3,5,4′-
trihydroxystilbene) Glucosides against Oxidative Stress. Journal of Pharmacology and
Experimental Therapeutics 344, 124-132.
Ihmels J, Bergmann S, Barkai N. 2004. Defining transcription modules using large-
scale gene expression data. Bioinformatics 20, 1993-2003.
Ihmels J, Bergmann S, Berman J, Barkai N. 2005. Comparative gene expression
analysis by differential clustering approach: application to the Candida albicans
transcription program. PLoS genetics 1, e39.
Ismail A, Riemann M, Nick P. 2012. The jasmonate pathway mediates salt tolerance in
grapevines. Journal of Experimental Botany 63, 2127-2139.
83
Jaillon O, Aury JM, Noel B, Policriti A, Clepet C, Casagrande A, Choisne N, Aubourg S, Vitulo N, Jubin C, Vezzi A, Legeai F, Hugueney P, Dasilva C, Horner D, Mica E, Jublot D, Poulain J, Bruyere C, Billault A, Segurens B, Gouyvenoux M, Ugarte E, Cattonaro F, Anthouard V, Vico V, Del Fabbro C, Alaux M, Di Gaspero G, Dumas V, Felice N, Paillard S, Juman I, Moroldo M, Scalabrin S, Canaguier A, Le Clainche I, Malacrida G, Durand E, Pesole G, Laucou V, Chatelet P, Merdinoglu D, Delledonne M, Pezzotti M, Lecharny A, Scarpelli C, Artiguenave F, Pe ME, Valle G, Morgante M, Caboche M, Adam-Blondon AF, Weissenbach J, Quetier F, Wincker P. 2007. The grapevine genome sequence suggests ancestral hexaploidization in
major angiosperm phyla. Nature 449, 463-467.
Joo JH, Bae YS, Lee JS. 2001. Role of auxin-induced reactive oxygen species in root
gravitropism. Plant physiology 126, 1055-1060.
Kar RK. 2011. Plant responses to water stress: Role of reactive oxygen species. Plant
Signaling & Behavior 6, 1741-1745.
Kelley DR, Estelle M. 2012. Ubiquitin-mediated control of plant hormone signaling.
Plant physiology 160, 47-55.
Kempa S, Krasensky J, Dal Santo S, Kopka J, Jonak C. 2008. A central role of
abscisic acid in stress-regulated carbohydrate metabolism. PLoS ONE 3, e3935.
Kim SK, Lund J, Kiraly M, Duke K, Jiang M, Stuart JM, Eizinger A, Wylie BN, Davidson GS. 2001. A gene expression map for Caenorhabditis elegans. Science 293,
2087-2092.
Kiribuchi K, Jikumaru Y, Kaku H, Minami E, Hasegawa M, Kodama O, Seto H, Okada K, Nojiri H, Yamane H. 2005. Involvement of the basic helix-loop-helix
transcription factor RERJ1 in wounding and drought stress responses in rice plants.
Bioscience, biotechnology, and biochemistry 69, 1042-1044.
Kohli A, Sreenivasulu N, Lakshmanan P, Kumar P. 2013. The phytohormone crosstalk
paradigm takes center stage in understanding how plants respond to abiotic stresses. Plant
Cell Reports 32, 945-957.
Larson RA. 1988. The antioxidants of higher plants. Phytochemistry 27, 969-978.
Lata C, Yadav A, Prasad M. 2011. Role of Plant Transcription Factors in Abiotic Stress
Tolerance. In: Shanker A, ed. Abiotic Stress Response in Plants - Physiological,
Biochemical and Genetic Perspectives.
Lelandais G, Tanty V, Geneix C, Etchebest C, Jacq C, Devaux F. 2008. Genome
adaptation to chemical stress: clues from comparative transcriptomics in Saccharomyces
cerevisiae and Candida glabrata. Genome Biology 9, R164.
Li H, Xu Y, Xiao Y, Zhu Z, Xie X, Zhao H, Wang Y. 2010. Expression and functional
analysis of two genes encoding transcription factors, VpWRKY1 and VpWRKY2,
isolated from Chinese wild Vitis pseudoreticulata. Planta 232, 1325-1337.
84
Liang M, Haroldsen V, Cai X, Wu Y. 2006. Expression of a putative laccase gene,
ZmLAC1, in maize primary roots under stress*. Plant, Cell & Environment 29, 746-753.
Marguerit E, Brendel O, Lebon E, Van Leeuwen C, Ollat N. 2012. Rootstock control
of scion transpiration and its acclimation to water deficit are controlled by different genes.
The New phytologist 194, 416-429.
Mayer AM, Staples RC. 2002. Laccase: new functions for an old enzyme.
Phytochemistry 60, 551-565.
Maza E, Frasse P, Senin P, Bouzayen M, Zouine M. 2013. Comparison of
normalization methods for differential gene expression analysis in RNA-Seq experiments:
A matter of relative size of studied transcriptomes. Communicative & Integrative Biology
6, e25849.
McCarthy DJ, Chen Y, Smyth GK. 2012. Differential expression analysis of multifactor
RNA-Seq experiments with respect to biological variation. Nucleic Acids Research 40,
4288-4297.
McCarthy MG, Cirami RM. 1990. The Effect of Rootstocks on the Performance of
Chardonnay from a Nematode-Infested Barossa Valley Vineyard. American Journal of
Enology and Viticulture 41, 126-130.
Meggio F, Prinsi B, Negri, A.S. , Di Lorenzo GS, Lucchini G, Pitacco P, Failla O, Scienza A, Cocucci C, Espen L. IN PRESS. Different biochemical and physiological
responses of two grapevine rootstock genotypes to drought and salt treatments. Australian
Journal of Grape and Wine Research.
Meinhard M, Rodriguez P, Grill E. 2002. The sensitivity of ABI2 to hydrogen peroxide
links the abscisic acid-response regulator to redox signalling. Planta 214, 775-782.
Mittler R. 2002. Oxidative stress, antioxidants and stress tolerance. Trends in Plant
Science 7, 405-410.
Mullineaux P, Karpinski S. 2002. Signal transduction in response to excess light: getting
out of the chloroplast. Current Opinion in Plant Biology 5, 43-48.
Myhre S, Tveit H, Mollestad T, Lægreid A. 2006. Additional Gene Ontology structure
for improved biological reasoning. Bioinformatics 22, 2020-2027.
Nakashima K, Tran L-SP, Van Nguyen D, Fujita M, Maruyama K, Todaka D, Ito Y, Hayashi N, Shinozaki K, Yamaguchi-Shinozaki K. 2007. Functional analysis of a
NAC-type transcription factor OsNAC6 involved in abiotic and biotic stress-responsive
gene expression in rice. The Plant Journal 51, 617-630.
Nopo-Olazabal C, Condori J, Nopo-Olazabal L, Medina-Bolivar F. 2014. Differential
induction of antioxidant stilbenoids in hairy roots of Vitis rotundifolia treated with methyl
jasmonate and hydrogen peroxide. Plant Physiology and Biochemistry 74, 50-69.
85
Novikova GV, Stepanchenko NS, Nosov AV, Moshkov IE. 2009. At the beginning of
the route: ABA perception and signal transduction in plants. Russian Journal of Plant
Physiology 56, 727-741.
Nuruzzaman M, Sharoni AM, Kikuchi S. 2013. Roles of NAC transcription factors in
the regulation of biotic and abiotic stress responses in plants. Frontiers in Microbiology 4,
248.
O’Hara LE, Paul MJ, Wingler A. 2013. How Do Sugars Regulate Plant Growth and
Development? New Insight into the Role of Trehalose-6-Phosphate. Molecular Plant 6,
261-274.
Pedranzani H, Racagni G, Alemano S, Miersch O, Ramírez I, Peña-Cortés H, Taleisnik E, Machado-Domenech E, Abdala G. 2003. Salt tolerant tomato plants show
increased levels of jasmonic acid. Plant Growth Regulation 41, 149-158.
Pedranzani H, Sierra-de-Grado R, Vigliocco A, Miersch O, Abdala G. 2007. Cold and
water stresses produce changes in endogenous jasmonates in two populations of Pinus
pinaster Ait. Plant Growth Regulation 52, 111-116.
Peleg Z, Blumwald E. 2011. Hormone balance and abiotic stress tolerance in crop plants.
Current Opinion in Plant Biology 14, 290-295.
Qin F, Shinozaki K, Yamaguchi-Shinozaki K. 2011. Achievements and challenges in
understanding plant abiotic stress responses and tolerance. Plant & cell physiology 52,
1569-1582.
Ramakrishna A, Ravishankar GA. 2011. Influence of abiotic stress signals on
secondary metabolites in plants. Plant Signaling & Behavior 6, 1720-1731.
Ramanjulu S, Veeranjaneyulu K, Sudhakar C. 1994. Short-term shifts in nitrogen
metabolism in mulberry Morus alba under salt shock. Phytochemistry 37, 991-995.
Ravaglia D, Espley R, Henry-Kirk R, Andreotti C, Ziosi V, Hellens R, Costa G, Allan A. 2013. Transcriptional regulation of flavonoid biosynthesis in nectarine (Prunus persica)
by a set of R2R3 MYB transcription factors. BMC Plant Biology 13, 68.
Santner A, Estelle M. 2009. Recent advances and emerging trends in plant hormone
signalling. Nature 459, 1071-1078.
Seo HS, Song JT, Cheong J-J, Lee Y-H, Lee Y-W, Hwang I, Lee JS, Choi YD. 2001.
Jasmonic acid carboxyl methyltransferase: A key enzyme for jasmonate-regulated plant
responses. Proceedings of the National Academy of Sciences 98, 4788-4793.
Sharp RE, Davies WJ. 1979. Solute regulation and growth by roots and shoots of water-
stressed maize plants. Planta 147, 43-49.
Shi J, He M, Cao J, Wang H, Ding J, Jiao Y, Li R, He J, Wang D, Wang Y. 2014. The
comparative analysis of the potential relationship between resveratrol and stilbene
synthase gene family in the development stages of grapes (Vitis quinquangularis and Vitis
vinifera). Plant Physiology and Biochemistry 74, 24-32.
86
Souza CRd, Maroco J, #227, P. o, Santos TPd, Rodrigues ML, #237, lia, Lopes CM, Pereira J, S. o, Chaves MM. 2003. Partial rootzone drying: regulation of stomatal
aperture and carbon assimilation in field-grown grapevines (<i>Vitis</i> <i>vinifera</i>
cv. Moscatel). Functional Plant Biology 30, 653-662.
Stracke R, Werber M, Weisshaar B. 2001. The R2R3-MYB gene family in Arabidopsis
thaliana. Current Opinion in Plant Biology 4, 447-456.
Stuart J, Robb E. 2013. Resveratrol and Its Derivatives as Phytoalexins. Bioactive
Polyphenols from Wine Grapes: Springer New York, 1-8.
Sun L, Zhang M, Ren J, Qi J, Zhang G, Leng P. 2010. Reciprocity between abscisic
acid and ethylene at the onset of berry ripening and after harvest. BMC Plant Biology 10,
257.
Suzuki N, Koussevitzky S, Mittler RON, Miller GAD. 2012. ROS and redox signalling
in the response of plants to abiotic stress. Plant, Cell & Environment 35, 259-270.
Tattersall ER, Grimplet J, DeLuc L, Wheatley M, Vincent D, Osborne C, Ergül A, Lomen E, Blank R, Schlauch K, Cushman J, Cramer G. 2007. Transcript abundance
profiles reveal larger and more complex responses of grapevine to chilling compared to
osmotic and salinity stress. Functional & Integrative Genomics 7, 317-333.
Tillett R, Ergul A, Albion R, Schlauch K, Cramer G, Cushman J. 2011. Identification
of tissue-specific, abiotic stress-responsive gene expression patterns in wine grape (Vitis
vinifera L.) based on curation and mining of large-scale EST data sets. BMC Plant
Biology 11, 86.
Tramontini S, Vitali M, Centioni L, Schubert A, Lovisolo C. 2013. Rootstock control
of scion response to water stress in grapevine. Environmental and Experimental Botany
93, 20-26.
Valluru R, Van den Ende W. 2008. Plant fructans in stress environments: emerging
concepts and future prospects. Journal of Experimental Botany 59, 2905-2916.
Vannozzi A, Dry I, Fasoli M, Zenoni S, Lucchin M. 2012. Genome-wide analysis of the
grapevine stilbene synthase multigenic family: genomic organization and expression
profiles upon biotic and abiotic stresses. BMC Plant Biology 12, 130.
Venturini L, Ferrarini A, Zenoni S, Tornielli GB, Fasoli M, Santo SD, Minio A, Buson G, Tononi P, Zago ED, Zamperin G, Bellin D, Pezzotti M, Delledonne M.
2013. De novo transcriptome characterization of Vitis vinifera cv. Corvina unveils varietal
diversity. BMC Genomics 14, 41.
Versari A, Parpinello GP, Tornielli GB, Ferrarini R, Giulivo C. 2001. Stilbene
Compounds and Stilbene Synthase Expression during Ripening, Wilting, and UV
Treatment in Grape cv. Corvina. Journal of Agricultural and Food Chemistry 49, 5531-
5536.
87
Walker RR, Blackmore DH, Clingeleffer PR, Correll RL. 2002. Rootstock effects on
salt tolerance of irrigated field-grown grapevines (Vitis vinifera L. cv. Sultana).: 1. Yield
and vigour inter-relationships. Australian Journal of Grape and Wine Research 8, 3-14.
Walker RR, Blackmore DH, Clingeleffer PR, Correll RL. 2004. Rootstock effects on
salt tolerance of irrigated field-grown grapevines (Vitis vinifera L. cv. Sultana) 2. Ion
concentrations in leaves and juice. Australian Journal of Grape and Wine Research 10,
90-99.
Wang M, Vannozzi1, Wang G, Liu JY, Liang YH, Chen F, Tornielli GB, Zenoni S, Cavallini E, Cheng ZM. IN PRESS. Genome and transcriptome analysis of the grapevine
(Vitis vinifera L.) WRKY gene family. Plant Cell Tissuea and Organs.
Wang W, Tang K, Yang H-R, Wen P-F, Zhang P, Wang H-L, Huang W-D. 2010.
Distribution of resveratrol and stilbene synthase in young grape plants (Vitis vinifera L.
cv. Cabernet Sauvignon) and the effect of UV-C on its accumulation. Plant Physiology
and Biochemistry 48, 142-152.
Wang Z, Quebedeaux B, Stutte G. 1996. Partitioning of [<sup>14</sup>C]Glucose Into
Sorbitol and Other Carbohydrates in Apple Under Water Stress. Functional Plant Biology
23, 245-251.
Wasternack C. 2007. Jasmonates: An Update on Biosynthesis, Signal Transduction and
Action in Plant Stress Response, Growth and Development. Annals of Botany 100, 681-
697.
Wingler A, Roitsch T. 2008. Metabolic regulation of leaf senescence: interactions of
sugar signalling with biotic and abiotic stress responses. Plant Biology 10, 50-62.

88
89
Chapter III
Grapevine rootstocks differentially affected
ripening inception and auxin-related genes of
Cabernet sauvignon berries
Massimiliano Corso, Fiorenza Ziliotto, Alessandro Vannozzi, Tommaso
Nicolato, Andrea Fusco, Margherita Lucchin and Claudio Bonghi
Department of Agronomy, Food, Natural Resources, Animals and Environment,
DAFNAE, University of Padova, Agripolis–Viale dell’Università 16, 35020 Legnaro
(Padova), Italy
90
1. Introduction
Grape berry development exhibits a double-sigmoid pattern characterized by two phases
of rapid growth separated by a lag phase, during which little or no growth occurs (Coombe
and McCarthy, 2000). The onset of ripening (named véraison) occurs at the end of this lag
phase and involves the accumulation of sugars (hexoses) in the vacuoles of mesocarp
cells, anthocyanins in the berry skin, catabolism of organic acids, and the development of
other compounds related to flavour and aroma (Conde et al., 2007; Symons et al., 2006;
Kuhn et al., 2013). Several hormones may participate and interplay in the control of grape
berry development and ripening, such as ethylene, auxin, abscisic acid (ABA),
gibberellins (GAs), cytokinins (CKs) and brassinosteroids (BRs) (Davies and Böttcher,
2009). The early stages of berry development, from fertilization to the formation of the
fruit (fruit set), are mainly driven by auxins, CKs and GAs that promote cell division and
expansion. Although these hormones have a pivotal role in grape berry development, they
are produced mostly by the seeds (Giribaldi et al., 2010). The changes occurring from pre-
véraison to full ripening are accompanied by significant increases in ABA content, this
hormone claimed to be a ripening determinant in non-climacteric fruits such as grape
berry (Kuhn et al., 2013; Giribaldi et al., 2010; Sun et al., 2010). In addition to ABA,
endogenous levels of BRs and ethylene transiently increase at pre-véraison and véraison,
respectively. Exogenous applications of these hormones positively modulate many
ripening-related processes such as the accumulation of anthocyanins, most likely by
enhancing the transcription of CHS, F3H, UFGT, and MYB1 genes (Symons et al., 2006;
Giribaldi et al., 2010; Chervin et al., 2008; Jeong et al., 2004; Ziliotto et al., 2012). These
treatments can also induce the uptake and storage of sugars in the berries (Giribaldi et al.,
2010; Böttcher et al., 2011). On the other hand, it is well known that exogenous
application of auxin at the pre-véraison stage cause a shift in grape berry ripening and a
repression of several ripening-related genes (Ziliotto et al., 2012; Davies et al., 1997).
Several studies pointed out that auxin levels increase during the early development of the
grape berry (pre-véraison), and then decrease at the véraison stage. The decrease of auxin
content is necessary, as demonstrated by the exogenous application of auxin at véraison
that negatively affected the expression of genes encoding enzymes related to sugars and
anthocyanins (CHS, F3'H and UFGT) biosynthesis and caused a delay in the reduction of
91
chlorophyll and acidity (Davies and Böttcher, 2009; Ziliotto et al., 2012; Böttcher et al.,
2011). However, it was also observed that treatments with this hormone are positively
correlated with the induction of genes related to ethylene biosynthesis (ACC-oxidase,
ACO, and ACC-synthase, ACS) (Ziliotto et al., 2012). This effect was not unexpected
taking into account that high levels of auxin are required for the transition to auto-catalytic
ethylene biosynthesis, the key event in the ripening of climacteric fruit (El-Sharkawy et
al., 2010; Tatsuki et al., 2013).
Böttcher et al. (2010) speculate that auxin levels might be controlled throughout
conjugation by GH3 proteins; in particular they showed that GH3 protein catalyzed auxin
conjugation to amino acids, such as aspartate, and they observed that low levels of free
auxin content correspond to high levels of conjugated auxins (Böttcher et al., 2010).
Despite the obvious economic implications of controlling these processes, the mechanisms
that regulate auxin homeostasis and its control during grape berry ripening remain unclear.
In order to clarify this aspect, it is necessary to well investigate the molecular control of
auxin homeostasis based on genes involved in biosynthesis (TRYPS), conjugation (GH3),
action (ARF and AUX/IAA) and transport (PIN). In a previous paper (Ziliotto et al., 2012),
it was hypothesized that exogenous application of the synthetic auxin NAA caused an
excessive availability of auxin, most likely counterbalanced by homeostatic mechanisms
which are activated after the treatment.
As above described, grape berry ripening is regulated by a complex regulatory networks in
which also microRNA (miRNA) play a pivotal role. miRNAs are a class of non-coding
RNA molecules with an important role as negative regulators of gene expression. In recent
experiments (Carra et al., 2011; Carra et al., 2009; Wang et al., 2012; Wang et al., 2011),
several conserved and novel miRNA, which showed a tissue specificity and have a
putative role in grape berry ripening, has been characterized. Despite the large number of
information given in the last years, miRNAs’ roles in the regulatory network linked to
grape berry ripening are only partially understood.
In addition to endogenous signals (i.e. hormones and miRNAs), grape berry ripening is
modulated by exogenous stimuli such as environmental factors. Light, water availability
and temperature severely affect grape berry ripening and quality, and may cause a shitf in
the date of vintage (Kuhn et al., 2013). Among these, water deficit has been the most
92
studied for its negative impact on grapevine yield and wine quality (Chaves et al., 2010;
Qin et al., 2011). Generally, drought cause an accumulation of secondary
(phenylpropanoids, especially anthocyanins and stilbenoids) and primary (sugars and
organic acids) metabolites and their related transcripts in grape berries (Castellarin et al.,
2007; Deluc et al., 2009). Grapevine responses to water deficit are heavily affected by the
genotype; indeed, as observed by Deluc et al. (2009), under water stress, Cabernet
sauvignon (CS) grape berries showed an higher accumulation of the “stress hormone”
abscissic acid (ABA) and better responses to drought, in comparison to the white cultivar
Chardonnay.
In order to counteracts these problems, in lasts years the use of rootstocks and the
development of new genotypes has assumed greater importance in modern viticulture
(Corso et al., chapter I of this thesis). Rootstocks provide tolerance to exogenous limiting
factors, both biotic (e.g., soilborne pests) and abiotic (e.g., salinity, water or oxygen
deficit), while influencing the ecophysiological behaviour of the scion and its berry
quality (Tramontini et al., 2013).
As above mentioned, an acceleration of ripening may negatively affect grape berry and
wine quality. Consequently, further investigations about rootstocks and genotypes with
improved tolerance to abiotic stresses are essential.
In order to evaluate the effect of rootstock on grape berry quality and development, a
detailed investigation was performed at the transcriptomic level (mRNA-seq and
microRNA-seq) on development and ripening of berries of Vitis vinifera L. cv Cabernet
Sauvignon (CS) grafted either onto the “commercial” (i.e. the most commonly used)
rootstock 1103P or onto a new rootstock, called M4 [(V. vinifera x V. berlandieri) x V.
berlandieri xcv Resseguier n.1], the latter showing high tolerance to water deficit and
salinity. Results pointed out differences in terms of berry ripening kinetics and a
differential regulation of genes involved in auxin action (ARF and AUX/IAA),
conjugation (GH3) and transport (PIN) among CS/M4 and CS/1103P.

93
2. Materials and methods
2.1 Plant Material and experimental design
Experiments were performed on Vitis vinifera L. cv Cabernet Sauvignon (CS) grafted onto
1103P and M4 rootstocks (Pasqua vigneti e cantine, Novaglie VR, Italy). Grapevines were
grown in well-watered conditions.
Whole berries were collected from both CS/1103P and CS/M4 bunches, at 45, 59, 65 days
after full bloom (DAFB). During this phase most berries reached véraison. Additional
samples (skin and pulp separately) were collected at 72, 86 and 100 DAFB (Figure 1). All
tissue samples were immediately frozen in liquid nitrogen and stored at -80 °C until use.
Two biological replicates were collected, each made up of one hundred berries collected
from fifty bunches (two berries per bunch) and chosen according to the CIRG index
proposed by Carreño et al. (1995) at the same position within the cluster (median
position). Sampling was performed in 2011 and 2012.
Figure 1. Schematic representation of experimental trial. The sampling dates of both CS/rootstocks berries
were at 45, 59, 65, 72, 86 and 100 DAFB. Véraison of CS/M4 (72 DAFB) and CS/1103P (86 DAFB) are
also indicated.
Physical (berry diameter and volume) and biochemical (Total Soluble Solids, Brix°)
parameters were determined on 80 berries at each time point considered in the experiment.
In order to better define grape berry ripening evolution in the two CS/rootstock
combinations, colorimetric analyses were performed on 100 berries at 45, 59, 65, 72 and
94
86 DAFB, using the CR-10 colorimeter (Konica-Minolta Holdings Inc., Tokyo, Japan).
Color was measured according to the L*a*b* space, defining brightness (L*, from white
to black) and the chromatic coordinates (a*, from red to green; b*, from yellow to blue).
2.2 RNA-seq and qPCR analyses.
Total RNA for both mRNA-seq and real-time PCR experiments was extracted from either
whole berry samples or from skin and pulp separately, using the perchlorate method as
reported by Ziliotto et al. (2012). Small RNAs for microRNA-seq analyses were extracted
from all samples following the CTAB method (Chang et al., 1993), with few
modifications.
mRNA was purified from the total RNA using the Dynabeads mRNA Direct kit
(Invitrogen pn 610.12). A variable quantity of mRNA ranging from 0.4 to 1.6% with
respect to the total RNA was obtained.
Samples for Ligation Sequencing were prepared according to the SOLiD Whole
transcriptome library preparation protocol (pn 4452437 Rev.B). Samples were purified
before RNase III digestion with Purelink RNA micro kit columns (Invitrogen, pn 12183-
016), digested from 3 to 10 minutes according the starting amount of mRNA, reverse-
transcribed, size selected using Agencourt AMPure XP beads (Beckman Coulter pn
A63881), and barcoded during the final amplification. Obtained libraries were sequenced
using Applied Biosystems SOLiD™ 5500XL , which produced paired-end reads of 75 and
35 nucleotides for the forward and reverse sequences, respectively. Reads were aligned to
the reference grape genome using PASS aligner, a software able to perform several
alignments on a sequence subset, trying different parameters to trim the low quality bases
and select the best ones to maximize the number of aligned reads (Campagna et al., 2009).
The percentage identity was set to 90% with one gap allowed whereas the quality filtering
parameters were set automatically by PASS. Moreover, a minimum reads length cut-off of
50 and 30 nt was set for the forward sequences and reverse reads, respectively. The
spliced reads were identified using the procedure described in PASS manual
(http://pass.cribi.unipd.it). Forward and reverse reads were aligned independently on the
reference genome. PASS-pair was used from the PASS package to perform the pairing
between forward and reverse reads and select only those sequences that are uniquely
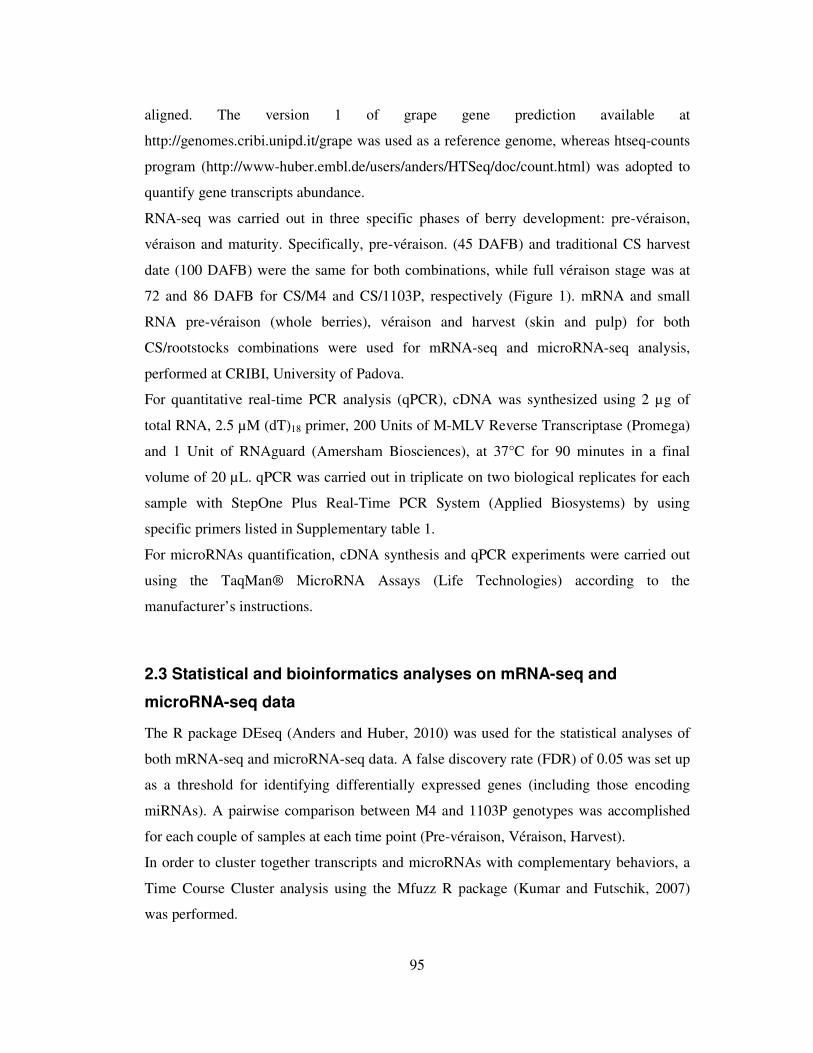
95
aligned. The version 1 of grape gene prediction available at
http://genomes.cribi.unipd.it/grape was used as a reference genome, whereas htseq-counts
program (http://www-huber.embl.de/users/anders/HTSeq/doc/count.html) was adopted to
quantify gene transcripts abundance.
RNA-seq was carried out in three specific phases of berry development: pre-véraison,
véraison and maturity. Specifically, pre-véraison. (45 DAFB) and traditional CS harvest
date (100 DAFB) were the same for both combinations, while full véraison stage was at
72 and 86 DAFB for CS/M4 and CS/1103P, respectively (Figure 1). mRNA and small
RNA pre-véraison (whole berries), véraison and harvest (skin and pulp) for both
CS/rootstocks combinations were used for mRNA-seq and microRNA-seq analysis,
performed at CRIBI, University of Padova.
For quantitative real-time PCR analysis (qPCR), cDNA was synthesized using 2 µg of
total RNA, 2.5 µM (dT)18 primer, 200 Units of M-MLV Reverse Transcriptase (Promega)
and 1 Unit of RNAguard (Amersham Biosciences), at 37°C for 90 minutes in a final
volume of 20 µL. qPCR was carried out in triplicate on two biological replicates for each
sample with StepOne Plus Real-Time PCR System (Applied Biosystems) by using
specific primers listed in Supplementary table 1.
For microRNAs quantification, cDNA synthesis and qPCR experiments were carried out
using the TaqMan® MicroRNA Assays (Life Technologies) according to the
manufacturer’s instructions.
2.3 Statistical and bioinformatics analyses on mRNA-seq and
microRNA-seq data
The R package DEseq (Anders and Huber, 2010) was used for the statistical analyses of
both mRNA-seq and microRNA-seq data. A false discovery rate (FDR) of 0.05 was set up
as a threshold for identifying differentially expressed genes (including those encoding
miRNAs). A pairwise comparison between M4 and 1103P genotypes was accomplished
for each couple of samples at each time point (Pre-véraison, Véraison, Harvest).
In order to cluster together transcripts and microRNAs with complementary behaviors, a
Time Course Cluster analysis using the Mfuzz R package (Kumar and Futschik, 2007)
was performed.
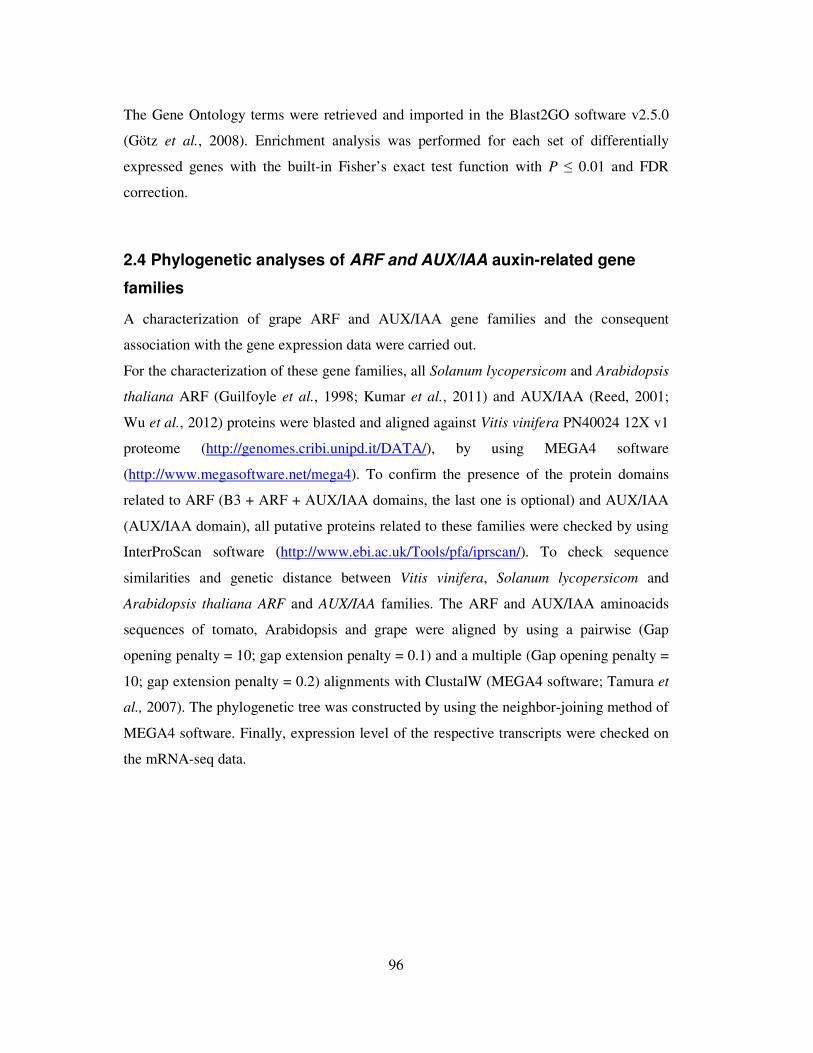
96
The Gene Ontology terms were retrieved and imported in the Blast2GO software v2.5.0
(Götz et al., 2008). Enrichment analysis was performed for each set of differentially
expressed genes with the built-in Fisher’s exact test function with P ≤ 0.01 and FDR
correction.
2.4 Phylogenetic analyses of ARF and AUX/IAA auxin-related gene
families
A characterization of grape ARF and AUX/IAA gene families and the consequent
association with the gene expression data were carried out.
For the characterization of these gene families, all Solanum lycopersicom and Arabidopsis
thaliana ARF (Guilfoyle et al., 1998; Kumar et al., 2011) and AUX/IAA (Reed, 2001;
Wu et al., 2012) proteins were blasted and aligned against Vitis vinifera PN40024 12X v1
proteome (http://genomes.cribi.unipd.it/DATA/), by using MEGA4 software
(http://www.megasoftware.net/mega4). To confirm the presence of the protein domains
related to ARF (B3 + ARF + AUX/IAA domains, the last one is optional) and AUX/IAA
(AUX/IAA domain), all putative proteins related to these families were checked by using
InterProScan software (http://www.ebi.ac.uk/Tools/pfa/iprscan/). To check sequence
similarities and genetic distance between Vitis vinifera, Solanum lycopersicom and
Arabidopsis thaliana ARF and AUX/IAA families. The ARF and AUX/IAA aminoacids
sequences of tomato, Arabidopsis and grape were aligned by using a pairwise (Gap
opening penalty = 10; gap extension penalty = 0.1) and a multiple (Gap opening penalty =
10; gap extension penalty = 0.2) alignments with ClustalW (MEGA4 software; Tamura et
al., 2007). The phylogenetic tree was constructed by using the neighbor-joining method of
MEGA4 software. Finally, expression level of the respective transcripts were checked on
the mRNA-seq data.
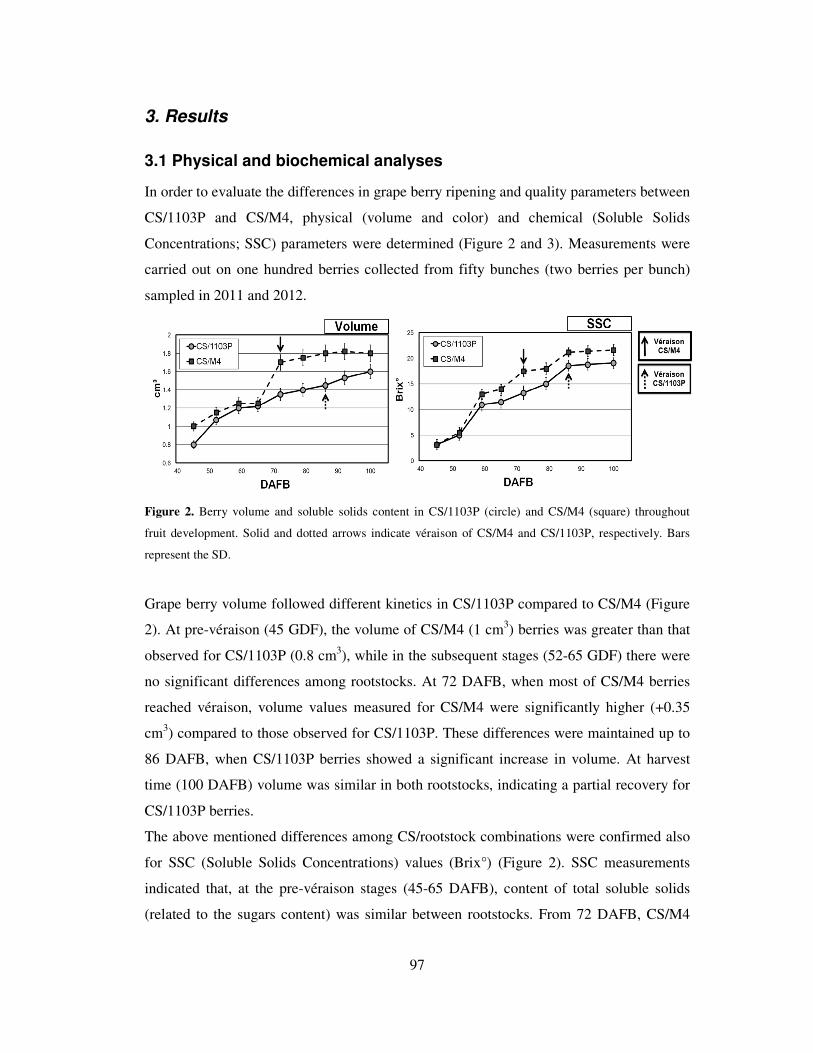
97
3. Results
3.1 Physical and biochemical analyses
In order to evaluate the differences in grape berry ripening and quality parameters between
CS/1103P and CS/M4, physical (volume and color) and chemical (Soluble Solids
Concentrations; SSC) parameters were determined (Figure 2 and 3). Measurements were
carried out on one hundred berries collected from fifty bunches (two berries per bunch)
sampled in 2011 and 2012.
Figure 2. Berry volume and soluble solids content in CS/1103P (circle) and CS/M4 (square) throughout
fruit development. Solid and dotted arrows indicate véraison of CS/M4 and CS/1103P, respectively. Bars
represent the SD.
Grape berry volume followed different kinetics in CS/1103P compared to CS/M4 (Figure
2). At pre-véraison (45 GDF), the volume of CS/M4 (1 cm3) berries was greater than that
observed for CS/1103P (0.8 cm3), while in the subsequent stages (52-65 GDF) there were
no significant differences among rootstocks. At 72 DAFB, when most of CS/M4 berries
reached véraison, volume values measured for CS/M4 were significantly higher (+0.35
cm3) compared to those observed for CS/1103P. These differences were maintained up to
86 DAFB, when CS/1103P berries showed a significant increase in volume. At harvest
time (100 DAFB) volume was similar in both rootstocks, indicating a partial recovery for
CS/1103P berries.
The above mentioned differences among CS/rootstock combinations were confirmed also
for SSC (Soluble Solids Concentrations) values (Brix°) (Figure 2). SSC measurements
indicated that, at the pre-véraison stages (45-65 DAFB), content of total soluble solids
(related to the sugars content) was similar between rootstocks. From 72 DAFB, CS/M4
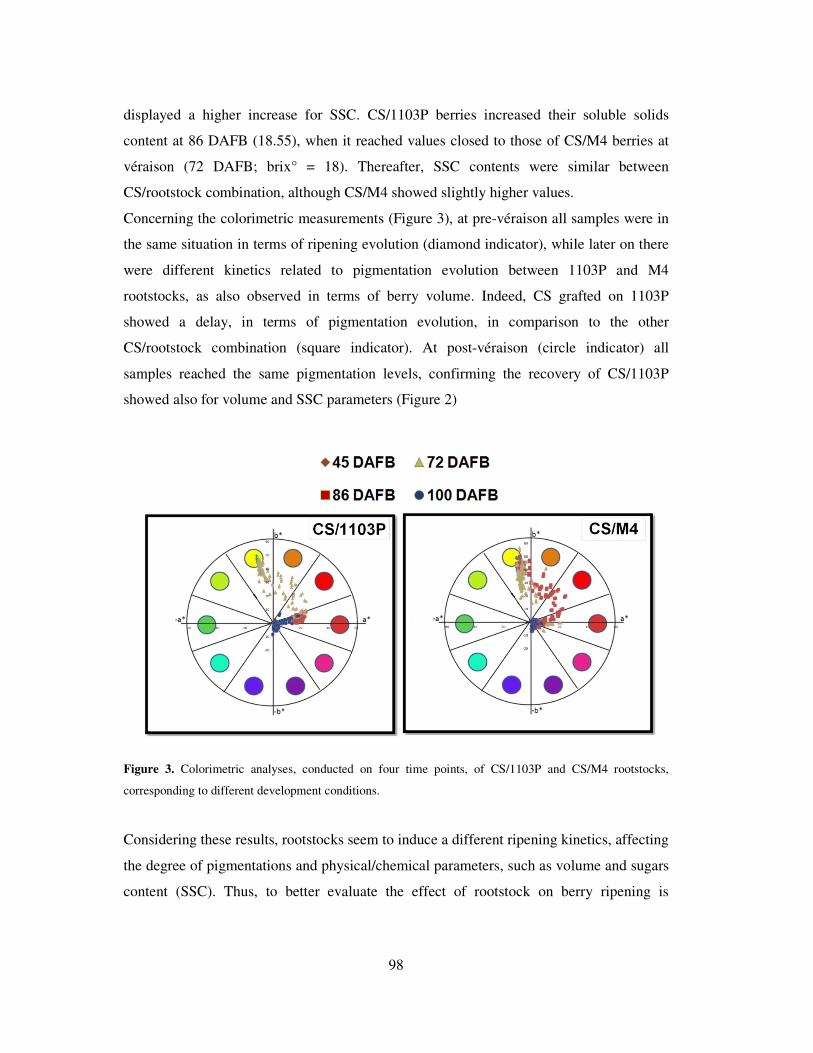
98
displayed a higher increase for SSC. CS/1103P berries increased their soluble solids
content at 86 DAFB (18.55), when it reached values closed to those of CS/M4 berries at
véraison (72 DAFB; brix° = 18). Thereafter, SSC contents were similar between
CS/rootstock combination, although CS/M4 showed slightly higher values.
Concerning the colorimetric measurements (Figure 3), at pre-véraison all samples were in
the same situation in terms of ripening evolution (diamond indicator), while later on there
were different kinetics related to pigmentation evolution between 1103P and M4
rootstocks, as also observed in terms of berry volume. Indeed, CS grafted on 1103P
showed a delay, in terms of pigmentation evolution, in comparison to the other
CS/rootstock combination (square indicator). At post-véraison (circle indicator) all
samples reached the same pigmentation levels, confirming the recovery of CS/1103P
showed also for volume and SSC parameters (Figure 2)
Figure 3. Colorimetric analyses, conducted on four time points, of CS/1103P and CS/M4 rootstocks,
corresponding to different development conditions.
Considering these results, rootstocks seem to induce a different ripening kinetics, affecting
the degree of pigmentations and physical/chemical parameters, such as volume and sugars
content (SSC). Thus, to better evaluate the effect of rootstock on berry ripening is
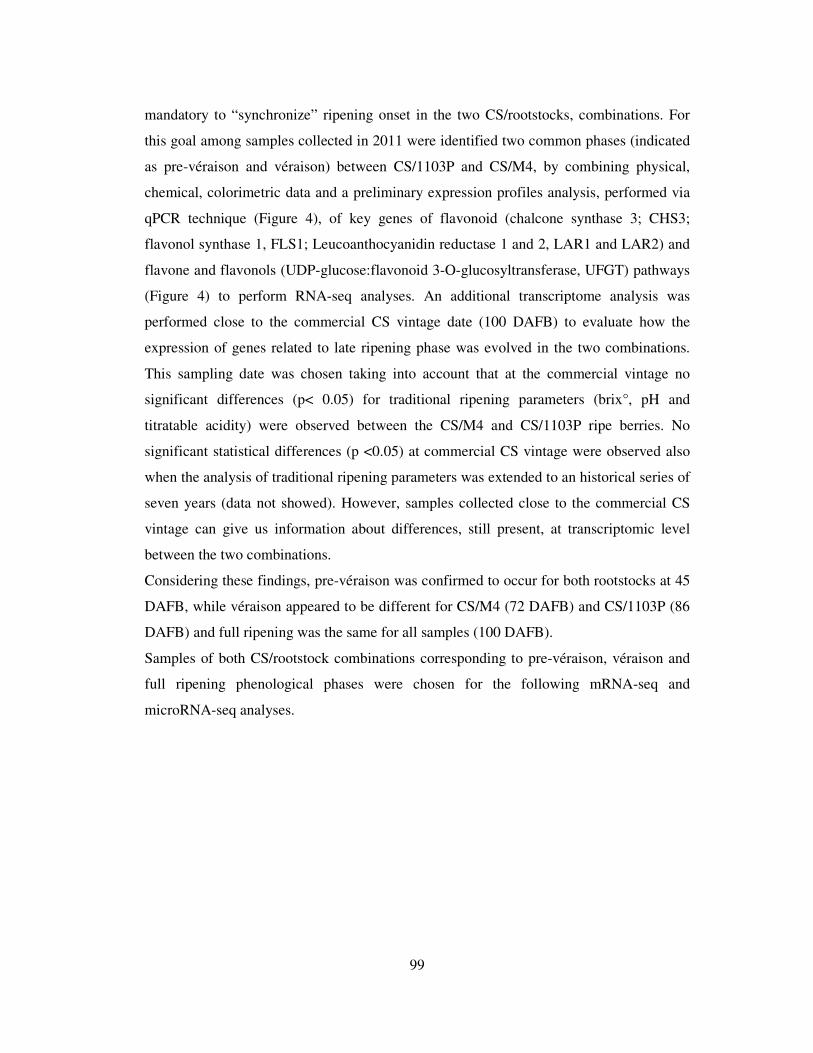
99
mandatory to “synchronize” ripening onset in the two CS/rootstocks, combinations. For
this goal among samples collected in 2011 were identified two common phases (indicated
as pre-véraison and véraison) between CS/1103P and CS/M4, by combining physical,
chemical, colorimetric data and a preliminary expression profiles analysis, performed via
qPCR technique (Figure 4), of key genes of flavonoid (chalcone synthase 3; CHS3;
flavonol synthase 1, FLS1; Leucoanthocyanidin reductase 1 and 2, LAR1 and LAR2) and
flavone and flavonols (UDP-glucose:flavonoid 3-O-glucosyltransferase, UFGT) pathways
(Figure 4) to perform RNA-seq analyses. An additional transcriptome analysis was
performed close to the commercial CS vintage date (100 DAFB) to evaluate how the
expression of genes related to late ripening phase was evolved in the two combinations.
This sampling date was chosen taking into account that at the commercial vintage no
significant differences (p< 0.05) for traditional ripening parameters (brix°, pH and
titratable acidity) were observed between the CS/M4 and CS/1103P ripe berries. No
significant statistical differences (p <0.05) at commercial CS vintage were observed also
when the analysis of traditional ripening parameters was extended to an historical series of
seven years (data not showed). However, samples collected close to the commercial CS
vintage can give us information about differences, still present, at transcriptomic level
between the two combinations.
Considering these findings, pre-véraison was confirmed to occur for both rootstocks at 45
DAFB, while véraison appeared to be different for CS/M4 (72 DAFB) and CS/1103P (86
DAFB) and full ripening was the same for all samples (100 DAFB).
Samples of both CS/rootstock combinations corresponding to pre-véraison, véraison and
full ripening phenological phases were chosen for the following mRNA-seq and
microRNA-seq analyses.
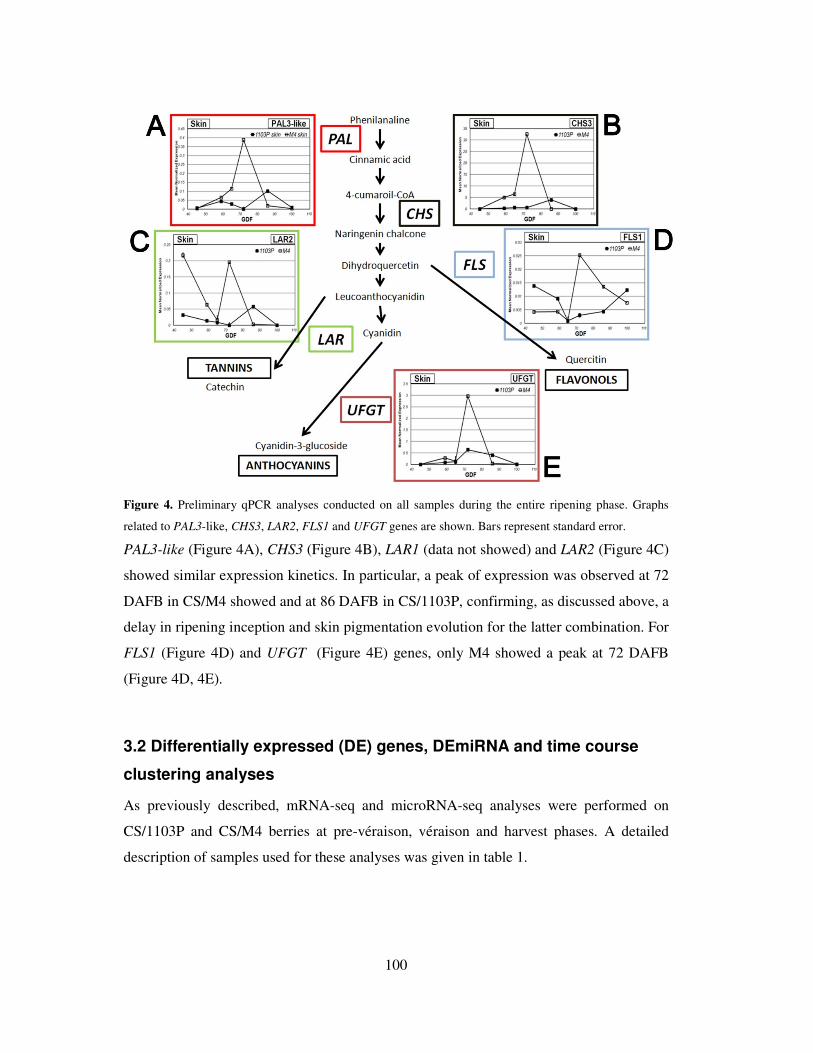
100
Figure 4. Preliminary qPCR analyses conducted on all samples during the entire ripening phase. Graphs
related to PAL3-like, CHS3, LAR2, FLS1 and UFGT genes are shown. Bars represent standard error.
PAL3-like (Figure 4A), CHS3 (Figure 4B), LAR1 (data not showed) and LAR2 (Figure 4C)
showed similar expression kinetics. In particular, a peak of expression was observed at 72
DAFB in CS/M4 showed and at 86 DAFB in CS/1103P, confirming, as discussed above, a
delay in ripening inception and skin pigmentation evolution for the latter combination. For
FLS1 (Figure 4D) and UFGT (Figure 4E) genes, only M4 showed a peak at 72 DAFB
(Figure 4D, 4E).
3.2 Differentially expressed (DE) genes, DEmiRNA and time course
clustering analyses
As previously described, mRNA-seq and microRNA-seq analyses were performed on
CS/1103P and CS/M4 berries at pre-véraison, véraison and harvest phases. A detailed
description of samples used for these analyses was given in table 1.
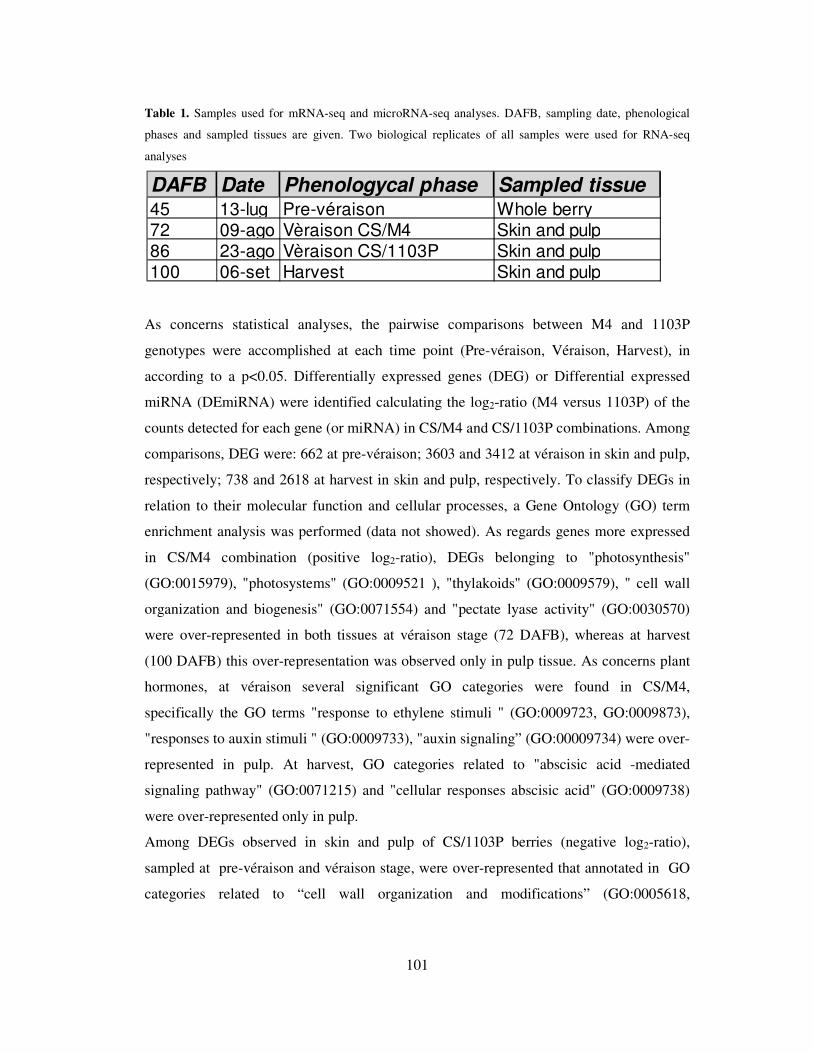
101
Table 1. Samples used for mRNA-seq and microRNA-seq analyses. DAFB, sampling date, phenological
phases and sampled tissues are given. Two biological replicates of all samples were used for RNA-seq
analyses
As concerns statistical analyses, the pairwise comparisons between M4 and 1103P
genotypes were accomplished at each time point (Pre-véraison, Véraison, Harvest), in
according to a p<0.05. Differentially expressed genes (DEG) or Differential expressed
miRNA (DEmiRNA) were identified calculating the log2-ratio (M4 versus 1103P) of the
counts detected for each gene (or miRNA) in CS/M4 and CS/1103P combinations. Among
comparisons, DEG were: 662 at pre-véraison; 3603 and 3412 at véraison in skin and pulp,
respectively; 738 and 2618 at harvest in skin and pulp, respectively. To classify DEGs in
relation to their molecular function and cellular processes, a Gene Ontology (GO) term
enrichment analysis was performed (data not showed). As regards genes more expressed
in CS/M4 combination (positive log2-ratio), DEGs belonging to "photosynthesis"
(GO:0015979), "photosystems" (GO:0009521 ), "thylakoids" (GO:0009579), " cell wall
organization and biogenesis" (GO:0071554) and "pectate lyase activity" (GO:0030570)
were over-represented in both tissues at véraison stage (72 DAFB), whereas at harvest
(100 DAFB) this over-representation was observed only in pulp tissue. As concerns plant
hormones, at véraison several significant GO categories were found in CS/M4,
specifically the GO terms "response to ethylene stimuli " (GO:0009723, GO:0009873),
"responses to auxin stimuli " (GO:0009733), "auxin signaling” (GO:00009734) were over-
represented in pulp. At harvest, GO categories related to "abscisic acid -mediated
signaling pathway" (GO:0071215) and "cellular responses abscisic acid" (GO:0009738)
were over-represented only in pulp.
Among DEGs observed in skin and pulp of CS/1103P berries (negative log2-ratio),
sampled at pre-véraison and véraison stage, were over-represented that annotated in GO
categories related to “cell wall organization and modifications” (GO:0005618,
DAFB Date Phenologycal phase Sampled tissue45 13-lug Pre-véraison Whole berry72 09-ago Vèraison CS/M4 Skin and pulp86 23-ago Vèraison CS/1103P Skin and pulp100 06-set Harvest Skin and pulp
102
GO:0071554, GO:0042545). As regards transcripts related to secondary metabolism, an
over-representation of GO terms related to “metabolism and biosynthesis of
phenylpropanoids and flavonoids” (GO:0009698, GO:0009699, GO:0009812 ,
GO:0009813) was observed at pre-véraison and harvest in pulp tissue. Categories related
to stress responses, such as "response to biotic stimulus" (GO:0009607), "defenses
responses" (GO:0006952) and "response to stress" (GO:0006950), were significantly
over-represented at pre-véraison. At harvest, it was observed an over-representation of GO
terms related to plant hormones, specifically those related to "cellular responses to auxin
stimuli" (GO:0071365) and "signal transduction pathway auxin mediated" (GO:0009734).
For what concerns miRNA-seq, only 30 novel and conserved DEmiRNA were identified
(in at least one time-point) with statistical analysis. This result is not unexpected
considering that the analysis was carried out with a total of 471 miRNA.
In order to shed light about differences in CS/M4 and CS/1103P ripening regulation
mediated by miRNA, DEmiRNA and the respective target genes were identified in pulp
and skin gene datasets. To obtain this information, firstly DEGs and DEmiRNA,
separately for each tissue, were subjected to a Time Course Cluster analysis, using the
Mfuzz R package (Kumar and Futschik, 2007).,. This analysis allowed us to identify six
and seven clusters for the DEG with different kinetic in skin and pulp, respectively, and
six clusters for differentially expressed miRNA in both skin and pulp. The last step step
was to identify target genes of differentially expressed miRNA and to check if these
targets were significantly differentially expressed in our experiment.
In skin tissues, miRNAs that showed an opposite behaviour in comparison to the
respective genes-target were associated with metabolic categories mainly related to plant
growth (figure 5A). In particular miR396, which has Growth-regulating factor 9 (GRF9)
as target, showed a significant up-regulation at véraison and harvest in CS/M4 berries.
On the other hand, in pulp tissue genes which seem to show a control mediated by miRNA
belonged to growth regulation, auxin transcription factors, Homeobox-leucine zipper
transcription factors and detoxification -related metabolic categories. Indeed, miR167
(figure 5B) and miR166 (figure 5E) were strongly up-regulated in CS/M4 at harvest, and
their relative gene-target ARF3/ARF6/ARF8 and REVOLUTA-PHABULOSA transcription
factors (TFs), were down-regulated at the same phenological phase. Among pulp-related
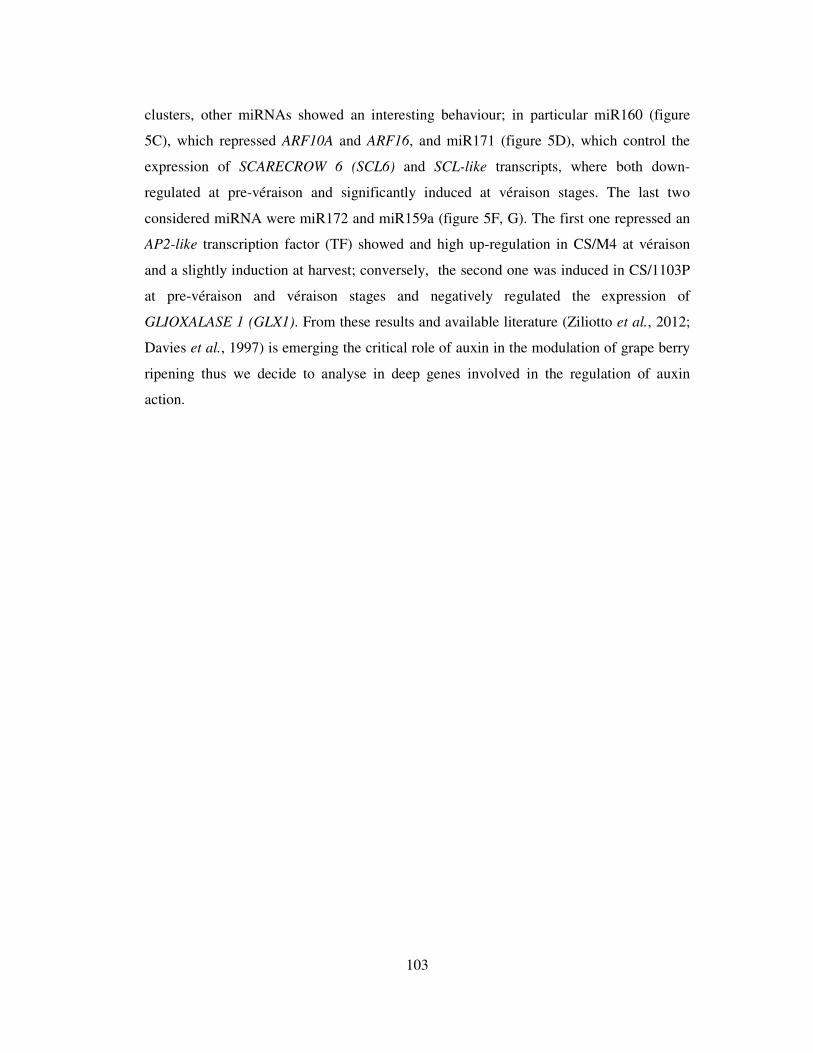
103
clusters, other miRNAs showed an interesting behaviour; in particular miR160 (figure
5C), which repressed ARF10A and ARF16, and miR171 (figure 5D), which control the
expression of SCARECROW 6 (SCL6) and SCL-like transcripts, where both down-
regulated at pre-véraison and significantly induced at véraison stages. The last two
considered miRNA were miR172 and miR159a (figure 5F, G). The first one repressed an
AP2-like transcription factor (TF) showed and high up-regulation in CS/M4 at véraison
and a slightly induction at harvest; conversely, the second one was induced in CS/1103P
at pre-véraison and véraison stages and negatively regulated the expression of
GLIOXALASE 1 (GLX1). From these results and available literature (Ziliotto et al., 2012;
Davies et al., 1997) is emerging the critical role of auxin in the modulation of grape berry
ripening thus we decide to analyse in deep genes involved in the regulation of auxin
action.
104
Figure 5. Expression pattern of miRNA (microRNA-seq data) and their respective genes target (mRNA-seq
data. Expression values of RNA-seq data were al given as log2 (M4/1103P) ratio. Bars represented SE.
105
3.3 Characterization and phylogenetic analyses of grape AUX/IAA and
ARF auxin-related families
In order to characterize AUX/IAA and ARF putative grapevine protein, a phylogenetic
analysis was carried out. AUX/IAA family is characterized by the AUX/IAA protein
domain, while ARF proteins contains B3, ARF and the optional AUX/IAA domains. It is
well known that aux/iaa inactivate arf proteins, with the formation of an heterodimer. All
putative proteins which exhibit the typical domains of arf and aux/iaa proteins were
blasted again family members previously identified in Arabidopsis thaliana and Solanum
lycopersycom (Supplementary figures 1 and 2).
In total were identified 18 and 21 proteins of grape belonging to ARF and AUX/IAA gene
families (figure 6A, B), respectively; all proteins sequences contains domain related to
these gene families, so it can be concluded which they are good candidates to be member
of these categories of auxin transcription factors. In a previous work, 26 grape AUX/IAA
putative proteins were identified (Çakir et al., 2013). Given the different results obtained,
in this work we re-checked all the putative proteins identified in the other experiment and
we found several identified sequences which contains with B3 and ARF domains, typical
of the ARF proteins and not of the AUX/IAA ones. So, it can be concluded that the
previous analysis conducted by Çakir et al. (2013) was not exhaustive and contained some
mistakes , thus we decided to use our phylogenetic characterization.
Arf putative proteins were distributed among 13 chromosomes and highlighted a varied
sequences length among its members. Indeed, the longest sequence was 1155 aa-longer
(VvARF19) and the lowest was 623 aa-longer (VvARF16) (Figure 6B). On the other
hand, aux/iaa putative proteins were characterized by a distribution among a fewer number
of grape chromosome (eight in total) and more uniform length. Between these family, the
length of the sequences were lower in comparison to those observed for ARF family, with
an average of 254 aa (Figure 6B). Expression data derived from mRNA-seq analyses were
associated to annotated ARF and AUX/IAA putative transcripts identified in the version
V1 grape annotation. In order to selected the transcripts for qPCR experiments, each
transcript was associated with the number of RNA-seq counts and an heat-map with all
values (log2 M4/1103P) was created (Supplementary figures 3 and 4).
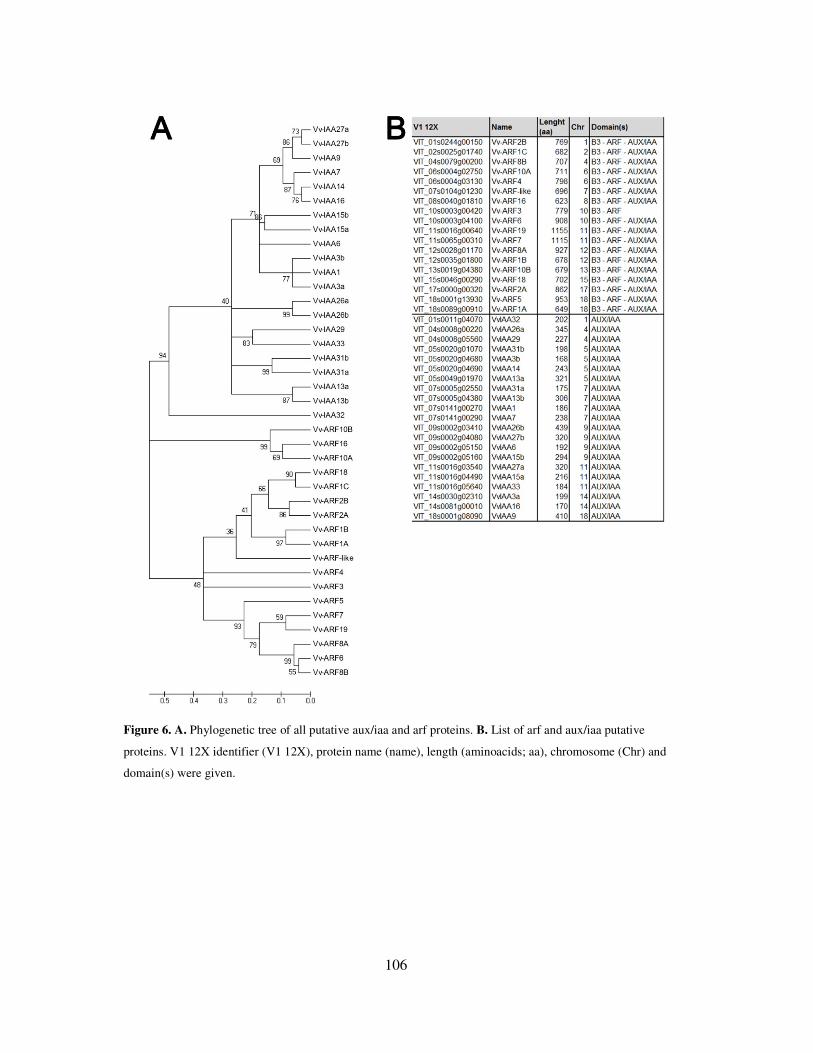
106
Figure 6. A. Phylogenetic tree of all putative aux/iaa and arf proteins. B. List of arf and aux/iaa putative
proteins. V1 12X identifier (V1 12X), protein name (name), length (aminoacids; aa), chromosome (Chr) and
domain(s) were given.
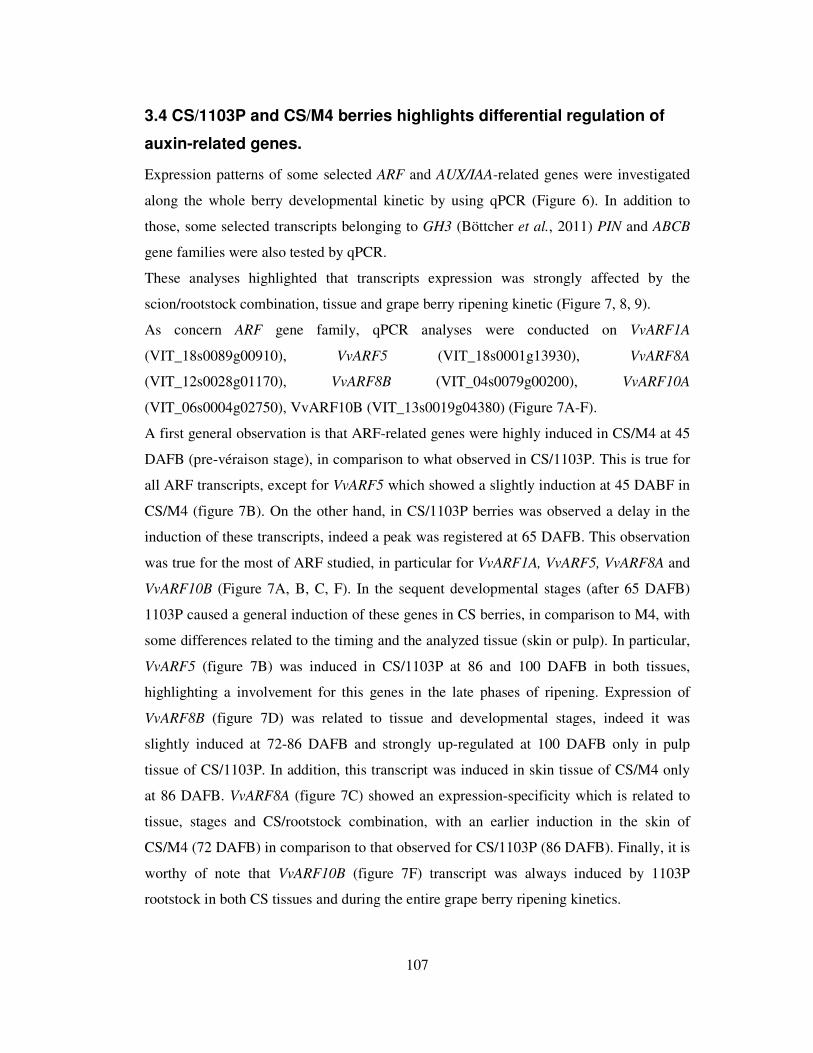
107
3.4 CS/1103P and CS/M4 berries highlights differential regulation of
auxin-related genes.
Expression patterns of some selected ARF and AUX/IAA-related genes were investigated
along the whole berry developmental kinetic by using qPCR (Figure 6). In addition to
those, some selected transcripts belonging to GH3 (Böttcher et al., 2011) PIN and ABCB
gene families were also tested by qPCR.
These analyses highlighted that transcripts expression was strongly affected by the
scion/rootstock combination, tissue and grape berry ripening kinetic (Figure 7, 8, 9).
As concern ARF gene family, qPCR analyses were conducted on VvARF1A
(VIT_18s0089g00910), VvARF5 (VIT_18s0001g13930), VvARF8A
(VIT_12s0028g01170), VvARF8B (VIT_04s0079g00200), VvARF10A
(VIT_06s0004g02750), VvARF10B (VIT_13s0019g04380) (Figure 7A-F).
A first general observation is that ARF-related genes were highly induced in CS/M4 at 45
DAFB (pre-véraison stage), in comparison to what observed in CS/1103P. This is true for
all ARF transcripts, except for VvARF5 which showed a slightly induction at 45 DABF in
CS/M4 (figure 7B). On the other hand, in CS/1103P berries was observed a delay in the
induction of these transcripts, indeed a peak was registered at 65 DAFB. This observation
was true for the most of ARF studied, in particular for VvARF1A, VvARF5, VvARF8A and
VvARF10B (Figure 7A, B, C, F). In the sequent developmental stages (after 65 DAFB)
1103P caused a general induction of these genes in CS berries, in comparison to M4, with
some differences related to the timing and the analyzed tissue (skin or pulp). In particular,
VvARF5 (figure 7B) was induced in CS/1103P at 86 and 100 DAFB in both tissues,
highlighting a involvement for this genes in the late phases of ripening. Expression of
VvARF8B (figure 7D) was related to tissue and developmental stages, indeed it was
slightly induced at 72-86 DAFB and strongly up-regulated at 100 DAFB only in pulp
tissue of CS/1103P. In addition, this transcript was induced in skin tissue of CS/M4 only
at 86 DAFB. VvARF8A (figure 7C) showed an expression-specificity which is related to
tissue, stages and CS/rootstock combination, with an earlier induction in the skin of
CS/M4 (72 DAFB) in comparison to that observed for CS/1103P (86 DAFB). Finally, it is
worthy of note that VvARF10B (figure 7F) transcript was always induced by 1103P
rootstock in both CS tissues and during the entire grape berry ripening kinetics.
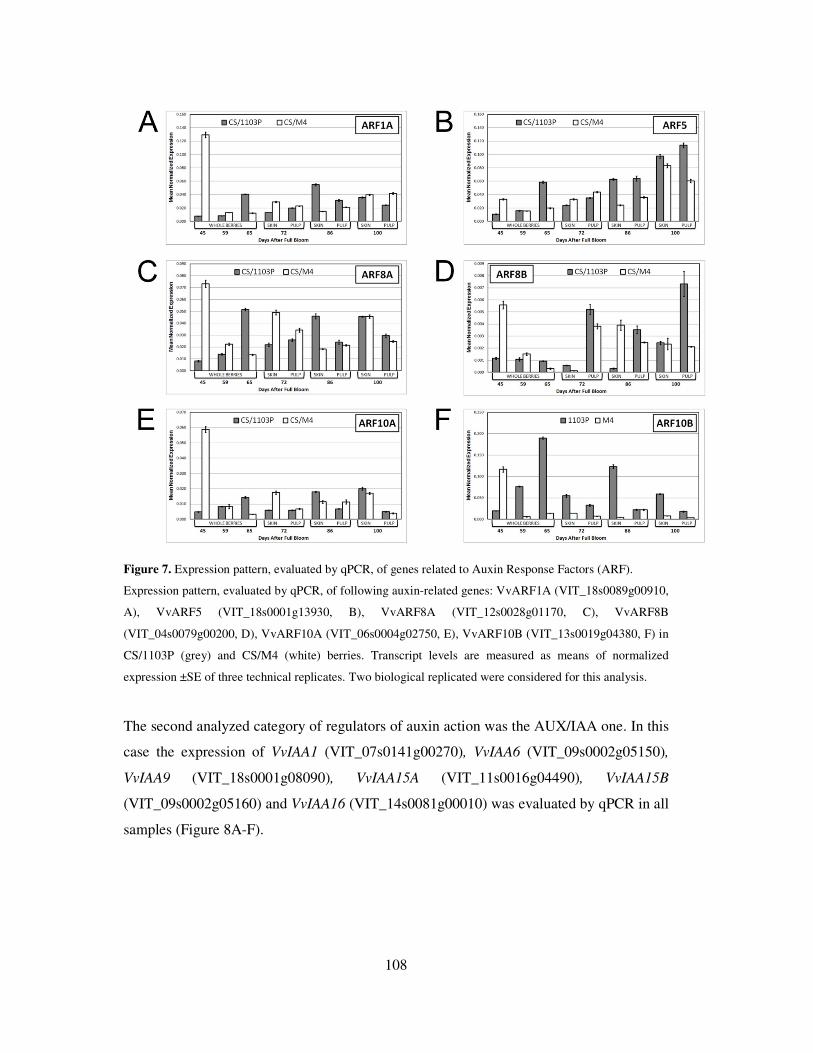
108
Figure 7. Expression pattern, evaluated by qPCR, of genes related to Auxin Response Factors (ARF).
Expression pattern, evaluated by qPCR, of following auxin-related genes: VvARF1A (VIT_18s0089g00910,
A), VvARF5 (VIT_18s0001g13930, B), VvARF8A (VIT_12s0028g01170, C), VvARF8B
(VIT_04s0079g00200, D), VvARF10A (VIT_06s0004g02750, E), VvARF10B (VIT_13s0019g04380, F) in
CS/1103P (grey) and CS/M4 (white) berries. Transcript levels are measured as means of normalized
expression ±SE of three technical replicates. Two biological replicated were considered for this analysis.
The second analyzed category of regulators of auxin action was the AUX/IAA one. In this
case the expression of VvIAA1 (VIT_07s0141g00270), VvIAA6 (VIT_09s0002g05150),
VvIAA9 (VIT_18s0001g08090), VvIAA15A (VIT_11s0016g04490), VvIAA15B
(VIT_09s0002g05160) and VvIAA16 (VIT_14s0081g00010) was evaluated by qPCR in all
samples (Figure 8A-F).
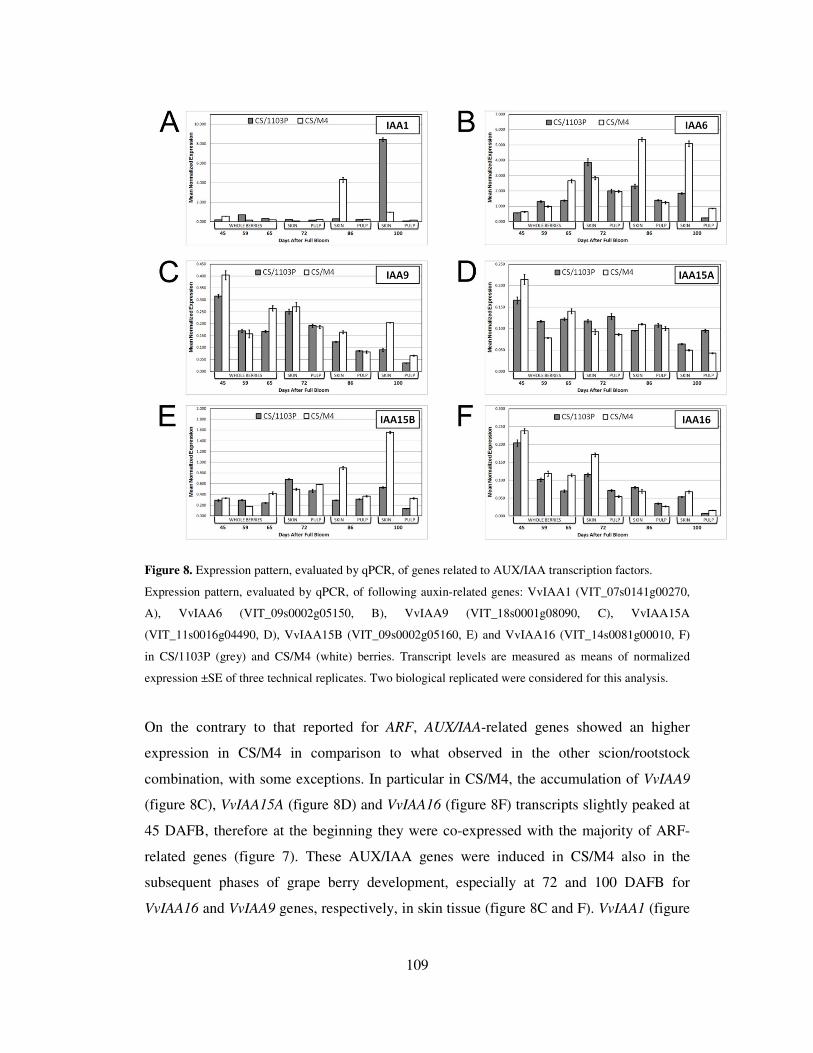
109
Figure 8. Expression pattern, evaluated by qPCR, of genes related to AUX/IAA transcription factors.
Expression pattern, evaluated by qPCR, of following auxin-related genes: VvIAA1 (VIT_07s0141g00270,
A), VvIAA6 (VIT_09s0002g05150, B), VvIAA9 (VIT_18s0001g08090, C), VvIAA15A
(VIT_11s0016g04490, D), VvIAA15B (VIT_09s0002g05160, E) and VvIAA16 (VIT_14s0081g00010, F)
in CS/1103P (grey) and CS/M4 (white) berries. Transcript levels are measured as means of normalized
expression ±SE of three technical replicates. Two biological replicated were considered for this analysis.
On the contrary to that reported for ARF, AUX/IAA-related genes showed an higher
expression in CS/M4 in comparison to what observed in the other scion/rootstock
combination, with some exceptions. In particular in CS/M4, the accumulation of VvIAA9
(figure 8C), VvIAA15A (figure 8D) and VvIAA16 (figure 8F) transcripts slightly peaked at
45 DAFB, therefore at the beginning they were co-expressed with the majority of ARF-
related genes (figure 7). These AUX/IAA genes were induced in CS/M4 also in the
subsequent phases of grape berry development, especially at 72 and 100 DAFB for
VvIAA16 and VvIAA9 genes, respectively, in skin tissue (figure 8C and F). VvIAA1 (figure
110
8A), VvIAA6 (figure 8B) and VvIAA15B (figure 8E) showed the higher differences among
rootstocks in the last phases of grape berry ripening (86-100 DAFB). This behaviour was
particularly evident for VvIAA6 (figure 8B) and VvIAA15B (figure 8E) being their
significantly up-regulated at 86 and 100 DAFB in skin tissue of CS/M4 (3 times higher in
comparison to CS/1103P). VvIAA1 (figure 8A) showed a strong induction at a specific
time-point and tissue for both rootstocks, with differences related to the developmental
phase. Indeed, the expression of this gene was induced in skin tissue at 86 DAFB in
CS/M4 (20 times higher in comparison to CS/1103P), while it was also strongly induced
(10 times higher) in CS/1103P but at the last stage of grape berry ripening (100 DAFB).
The last two considered categories were GH3 and PIN –related transcripts (figure 9).
Figure 9. Expression pattern, evaluated by qPCR, of genes related to auxin conjugation (GH3) and transport
(PIN). Expression pattern of following auxin-related genes: VvGH3-1 (VIT_03s0091g00310, A), VvGH3-8
(VIT_07s0104g00800, B), VvPIN4-like (VIT_01s0011g04860, C), VvPIN-like (VIT_05s0062g01120, D),
VvABCB-like A (VIT_04s0044g01860, E) and VvABCB-like B (VIT_07s0031g02200, F) in CS/1103P
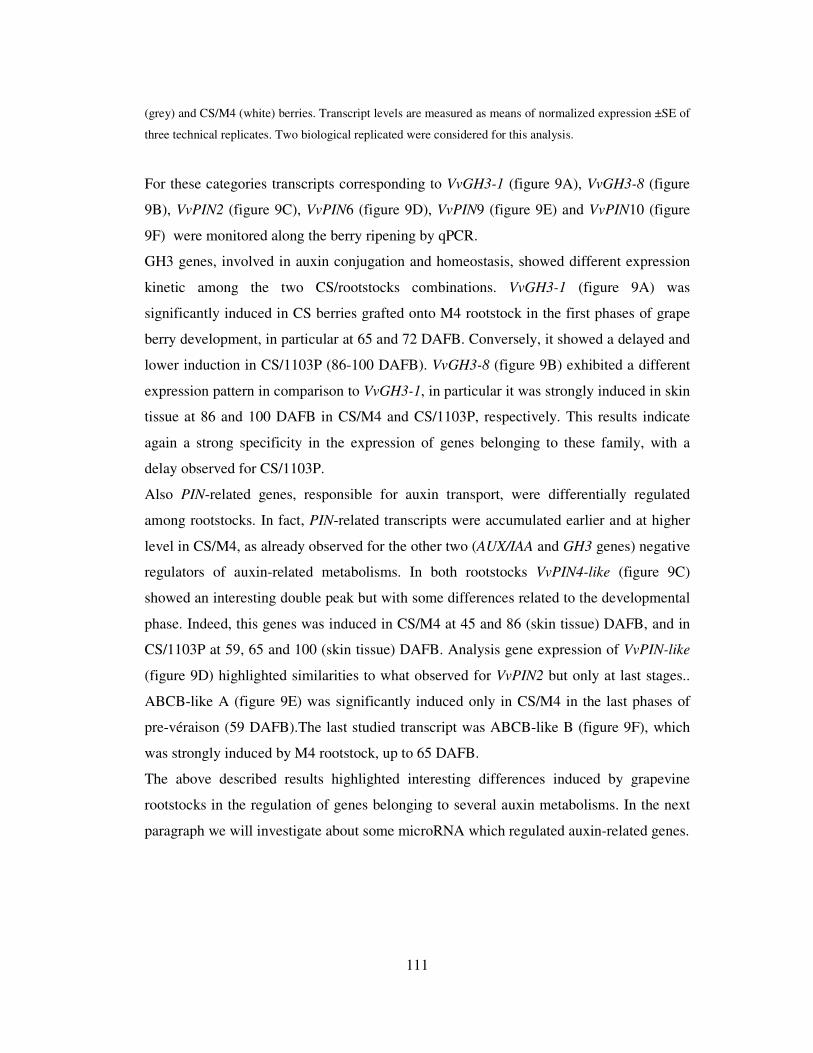
111
(grey) and CS/M4 (white) berries. Transcript levels are measured as means of normalized expression ±SE of
three technical replicates. Two biological replicated were considered for this analysis.
For these categories transcripts corresponding to VvGH3-1 (figure 9A), VvGH3-8 (figure
9B), VvPIN2 (figure 9C), VvPIN6 (figure 9D), VvPIN9 (figure 9E) and VvPIN10 (figure
9F) were monitored along the berry ripening by qPCR.
GH3 genes, involved in auxin conjugation and homeostasis, showed different expression
kinetic among the two CS/rootstocks combinations. VvGH3-1 (figure 9A) was
significantly induced in CS berries grafted onto M4 rootstock in the first phases of grape
berry development, in particular at 65 and 72 DAFB. Conversely, it showed a delayed and
lower induction in CS/1103P (86-100 DAFB). VvGH3-8 (figure 9B) exhibited a different
expression pattern in comparison to VvGH3-1, in particular it was strongly induced in skin
tissue at 86 and 100 DAFB in CS/M4 and CS/1103P, respectively. This results indicate
again a strong specificity in the expression of genes belonging to these family, with a
delay observed for CS/1103P.
Also PIN-related genes, responsible for auxin transport, were differentially regulated
among rootstocks. In fact, PIN-related transcripts were accumulated earlier and at higher
level in CS/M4, as already observed for the other two (AUX/IAA and GH3 genes) negative
regulators of auxin-related metabolisms. In both rootstocks VvPIN4-like (figure 9C)
showed an interesting double peak but with some differences related to the developmental
phase. Indeed, this genes was induced in CS/M4 at 45 and 86 (skin tissue) DAFB, and in
CS/1103P at 59, 65 and 100 (skin tissue) DAFB. Analysis gene expression of VvPIN-like
(figure 9D) highlighted similarities to what observed for VvPIN2 but only at last stages..
ABCB-like A (figure 9E) was significantly induced only in CS/M4 in the last phases of
pre-véraison (59 DAFB).The last studied transcript was ABCB-like B (figure 9F), which
was strongly induced by M4 rootstock, up to 65 DAFB.
The above described results highlighted interesting differences induced by grapevine
rootstocks in the regulation of genes belonging to several auxin metabolisms. In the next
paragraph we will investigate about some microRNA which regulated auxin-related genes.
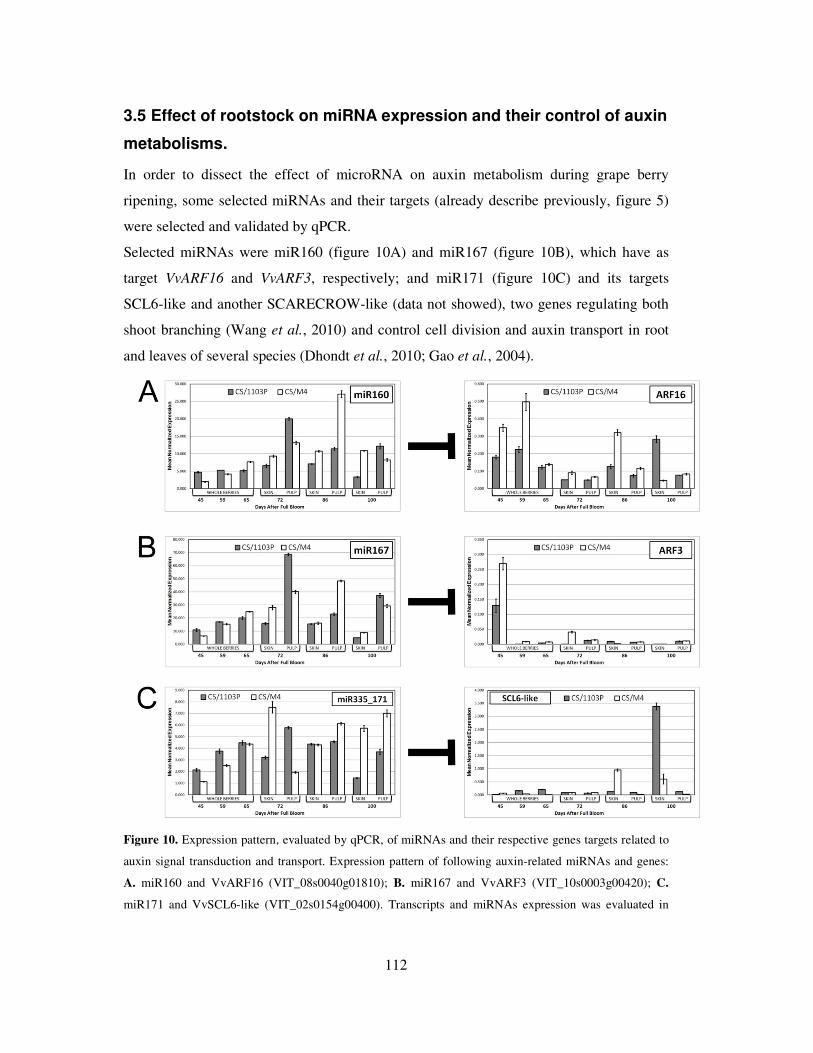
112
3.5 Effect of rootstock on miRNA expression and their control of auxin
metabolisms.
In order to dissect the effect of microRNA on auxin metabolism during grape berry
ripening, some selected miRNAs and their targets (already describe previously, figure 5)
were selected and validated by qPCR.
Selected miRNAs were miR160 (figure 10A) and miR167 (figure 10B), which have as
target VvARF16 and VvARF3, respectively; and miR171 (figure 10C) and its targets
SCL6-like and another SCARECROW-like (data not showed), two genes regulating both
shoot branching (Wang et al., 2010) and control cell division and auxin transport in root
and leaves of several species (Dhondt et al., 2010; Gao et al., 2004).
Figure 10. Expression pattern, evaluated by qPCR, of miRNAs and their respective genes targets related to
auxin signal transduction and transport. Expression pattern of following auxin-related miRNAs and genes:
A. miR160 and VvARF16 (VIT_08s0040g01810); B. miR167 and VvARF3 (VIT_10s0003g00420); C.
miR171 and VvSCL6-like (VIT_02s0154g00400). Transcripts and miRNAs expression was evaluated in
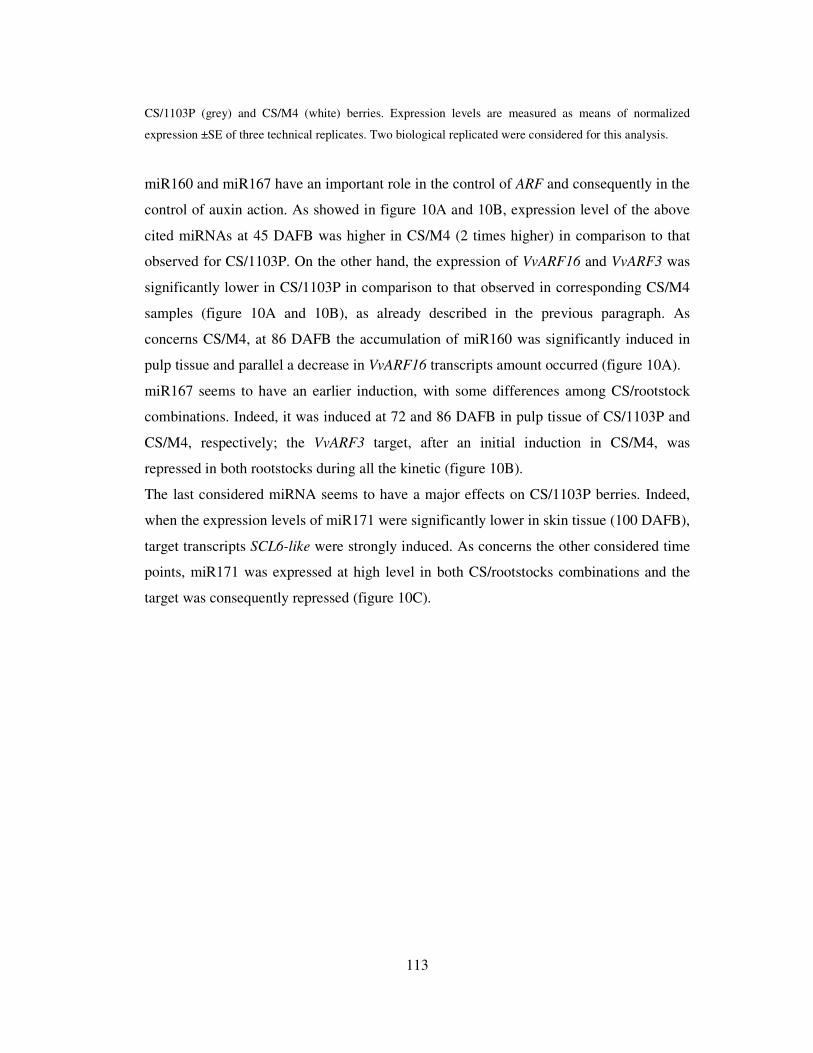
113
CS/1103P (grey) and CS/M4 (white) berries. Expression levels are measured as means of normalized
expression ±SE of three technical replicates. Two biological replicated were considered for this analysis.
miR160 and miR167 have an important role in the control of ARF and consequently in the
control of auxin action. As showed in figure 10A and 10B, expression level of the above
cited miRNAs at 45 DAFB was higher in CS/M4 (2 times higher) in comparison to that
observed for CS/1103P. On the other hand, the expression of VvARF16 and VvARF3 was
significantly lower in CS/1103P in comparison to that observed in corresponding CS/M4
samples (figure 10A and 10B), as already described in the previous paragraph. As
concerns CS/M4, at 86 DAFB the accumulation of miR160 was significantly induced in
pulp tissue and parallel a decrease in VvARF16 transcripts amount occurred (figure 10A).
miR167 seems to have an earlier induction, with some differences among CS/rootstock
combinations. Indeed, it was induced at 72 and 86 DAFB in pulp tissue of CS/1103P and
CS/M4, respectively; the VvARF3 target, after an initial induction in CS/M4, was
repressed in both rootstocks during all the kinetic (figure 10B).
The last considered miRNA seems to have a major effects on CS/1103P berries. Indeed,
when the expression levels of miR171 were significantly lower in skin tissue (100 DAFB),
target transcripts SCL6-like were strongly induced. As concerns the other considered time
points, miR171 was expressed at high level in both CS/rootstocks combinations and the
target was consequently repressed (figure 10C).
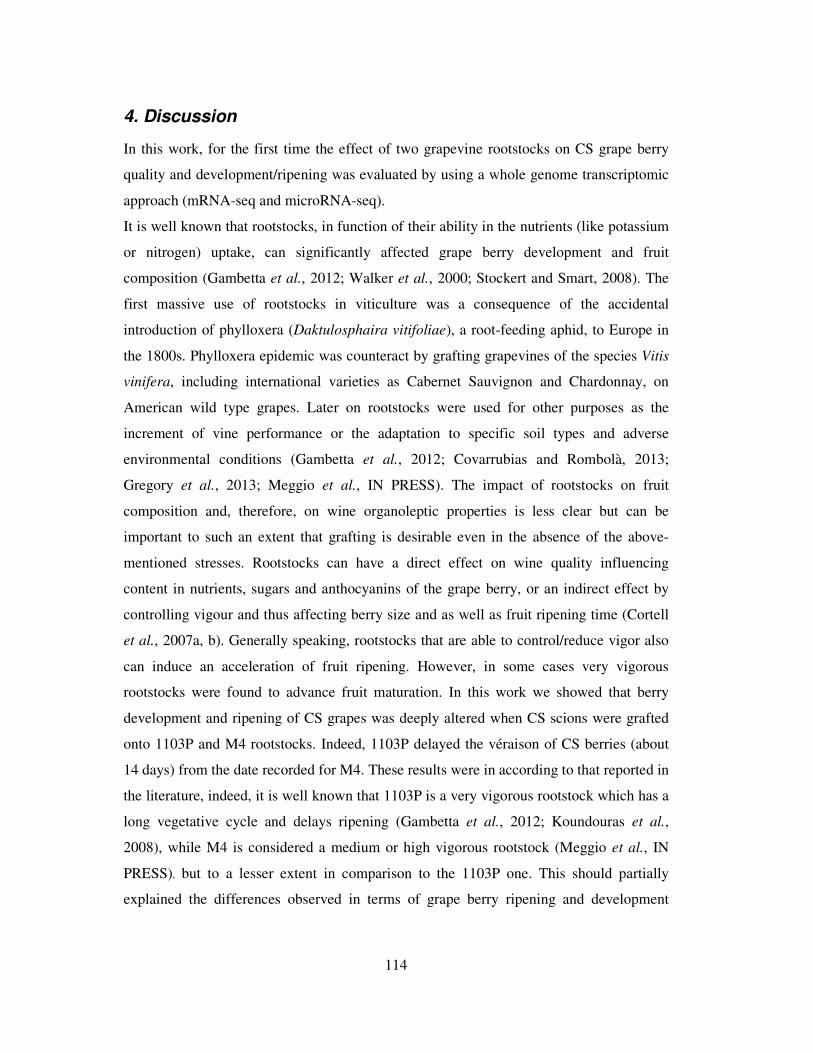
114
4. Discussion
In this work, for the first time the effect of two grapevine rootstocks on CS grape berry
quality and development/ripening was evaluated by using a whole genome transcriptomic
approach (mRNA-seq and microRNA-seq).
It is well known that rootstocks, in function of their ability in the nutrients (like potassium
or nitrogen) uptake, can significantly affected grape berry development and fruit
composition (Gambetta et al., 2012; Walker et al., 2000; Stockert and Smart, 2008). The
first massive use of rootstocks in viticulture was a consequence of the accidental
introduction of phylloxera (Daktulosphaira vitifoliae), a root-feeding aphid, to Europe in
the 1800s. Phylloxera epidemic was counteract by grafting grapevines of the species Vitis
vinifera, including international varieties as Cabernet Sauvignon and Chardonnay, on
American wild type grapes. Later on rootstocks were used for other purposes as the
increment of vine performance or the adaptation to specific soil types and adverse
environmental conditions (Gambetta et al., 2012; Covarrubias and Rombolà, 2013;
Gregory et al., 2013; Meggio et al., IN PRESS). The impact of rootstocks on fruit
composition and, therefore, on wine organoleptic properties is less clear but can be
important to such an extent that grafting is desirable even in the absence of the above-
mentioned stresses. Rootstocks can have a direct effect on wine quality influencing
content in nutrients, sugars and anthocyanins of the grape berry, or an indirect effect by
controlling vigour and thus affecting berry size and as well as fruit ripening time (Cortell
et al., 2007a, b). Generally speaking, rootstocks that are able to control/reduce vigor also
can induce an acceleration of fruit ripening. However, in some cases very vigorous
rootstocks were found to advance fruit maturation. In this work we showed that berry
development and ripening of CS grapes was deeply altered when CS scions were grafted
onto 1103P and M4 rootstocks. Indeed, 1103P delayed the véraison of CS berries (about
14 days) from the date recorded for M4. These results were in according to that reported in
the literature, indeed, it is well known that 1103P is a very vigorous rootstock which has a
long vegetative cycle and delays ripening (Gambetta et al., 2012; Koundouras et al.,
2008), while M4 is considered a medium or high vigorous rootstock (Meggio et al., IN
PRESS), but to a lesser extent in comparison to the 1103P one. This should partially
explained the differences observed in terms of grape berry ripening and development
115
among the two CS/rootstocks combinations (Figure 2). One of the most important factors
in determining the quality of the wine is the heterogeneity of grape ripening progression at
the bunch level. At véraison the level ripening asynchrony is strongly influenced, beside
the cultivar and the environmental conditions, by the hormonal content (Deluc et al.,
2009). In this context, the relationship between plant hormones and the effects of the
hormonal treatments on grape berries have been extensively studied at the transcriptomic
levels (Symons et al., 2006; Davies and Böttcher, 2009; Chervin et al., 2008; Ziliotto et
al., 2012), while transcriptomic studies regarding the effect of the rootstock are almost
absent.
Physical and biochemical analyses carried in this work (figure 2), showed differences in
terms of ripening kinetics among two CS/rootstocks combinations. In particular, the
véraison for CS/M4 was identified at 72 DAFB, where samples showed a SSC of about 18
brix°. In CS/1103P berries the same SSC value was reached only two week later (at 86
DAFB) . These results were in according to those reported by other authors that recorded a
significant delay in developing berries of Shiraz when grafted on 1103P instead of onto
other less vigorous rootstocks (Walker et al., 2000).
mRNA-seq results, enrichment analysis and qPCR (Supplementary figure 5) pointed out
an early induction of genes involved in sugar metabolism in CS/M4. Hexose sugars
accumulation begins at véraison (Grimplet et al., 2007), whereas in the earlier stages these
solutes are not stored in the vacuoles but metabolised (Davies and Robinson, 2000). Flow
of solutes from the phloem cells to the berry mesocarp occurs via apoplastic and is
mediated by transporters (named HT1 and HT2) ,that allow the accumulation of hexoses,
in particular fructose and glucose (Grimplet et al., 2007), in vacuole. HT1 expression in
CS/M4 skin was similar to what observed by Fillion et al. (1999) and Davies and
Robinson, (2000). In particular two peaks were observed, at 59 and 86 DAFB which
correspond to pre and post –véraison stages, respectively (supplementary figure 5C).
VvGIN1 (supplementary figure 5A) and VvGLU-INV (supplementary figure 5B), two
genes coding for a vacuolar invertase involved in the hydrolysis of sucrose to fructose and
glucose, were expressed both in CS/1103P and CS/M4 at pre-véraison stage (45-65
DAFB), as already reported by Davies and Robinson, (2000), but to a significantly higher
level in CS/M4 berries. All these data indicate that in CS/M4 a higher accumulation of
116
soluble solids accumulation and sugars-related genes transcripts than that observed in
CS/1103P occurred (Figure 2; Supplementary figure 5).
Sugars concentration is positively correlated with the amount of anthocyanins during
grape berry ripening and negatively correlated with others phenolics compounds because
the latter offer another substrate for synthesis of anthocyanins (Castellarin et al., 2011;
Gambetta et al., 2010; Liang et al., 2011). Genes involved in phenylpropanoids
biosynthetic pathway were expressed earlier and to a higher level in CS/M4 (Figure 4).
This pattern was in according with the earlier véraison (14 days) observed in CS/M4
berries (Figure 3). Indeed, it is well known that accumulation of anthocyanins and
induction of genes involved in their biosynthesis are strongly related to the onset of
ripening in grape berries (Kuhn et al., 2013; Grimplet et al., 2007; Chen et al., 2006). The
early expression of genes related to anthocyanins pathway is also positively related to the
greater intensity of colour observed in CS/M4 berries in comparison to that observed in
CS/1103P (data not showed), as already suggested by other authors (Pérez-Magariño and
González-San José, 2004; Ryan and Revilla, 2003).
Expression of PAL3-like genes (Figure 4A) was higher in skin tissue as observed by
Grimplet et al. (2007) and Castellarin et al. (2011). As concerns PAL gene (VvPAL3-like)
we observed a strong correlation between its expression and berries staining intensity.
This fact was expected considering that PAL is the first enzyme of phenylpropanoid
pathway and is therefore producing also precursors for the of phenolic compounds, thus
PAL is indicated as one of responsible for rate-limiting steps in anthocyanins biosynthesis
(Guillaumie et al., 2011). Similarly, the increased expression of VvCHS3 and VvUFGT
genes (Figure 4B, E) had a positive impact on anthocyanins accumulation (Liang et al.,
2011; Lijavetzky et al., 2012). The increase of anthocyanins-related genes occurred
during the ripening phase was paralleled by anthocyanins accumulation in the berry
(Davies and Robinson, 2000). The same trend was also observed for the gene coding for
the synthesis of flavonols (FLS1; Figure 4D), while the LAR2 gene (Figure 4C), which
encodes for an enzyme involved in tannins biosynthesis, showed a induction in CS/M4 at
pre-véraison (45 DAFB) and in both rootstocks at véraison (72 and 86 DAFB in CS/M4
and CS/1103P, respectively). The increased expression of VvLAR2 at pre-véraison should
117
be linked to an induction of tannins accumulation that, as observed by Grimplet et al.
(2007), were typically produced in the first phase of berry growth.
The above discussed data showed significant differences in berry composition when CS
scions are grafted onto M4 or 1103P and support the fact that rootstocks exert a strong
influence on berry development and ripening-related processes. But, what are the
molecular mechanisms that control these events? A possible explanation could be related
to auxin metabolism. Considering the large numbers of DEGs related to auxin identified
using Mfuzz cluster and enrichment analyses, and the relevant role of auxins during grape
berry development(Ziliotto et al., 2012), a characterization of grape ARF and AUX/IAA
gene families and the consequent association with the gene expression data was carried
out (Figure 6; supplementary figures 3 and 4). Level of the synthetic auxin indole-3-acetic
acid (IAA) reached its maximum in flowers and young berries, and then decreased until
véraison (Bottcher et al., 2012). The decrease in IAA levels is thought to be a prerequisite
for the onset and progression of ripening in a large range of fruit, including grapes
(Ziliotto et al., 2012; Böttcher et al., 2011; Davies et al., 1997; Schaffer et al., 2013;
Symons et al., 2012). In this work, we observed that the delayed véraison of CS/1103P
berries was paralleled by a delayed induction and a lower expression of VvGH3-1 gene
(Figure 9A) when these two events were compared to those occurring in CS/M4 ones.
These results were in according to that observed by Böttcher et al. (2010 and 2011), which
demonstrate that the increasing levels of conjugated form of IAA in grapes might be
linked to the low levels of active IAA recorded at, and after, the onset of ripening.
Conjugation of IAA to amino acids, catalyzed by GH3, have an important role in the
control of auxin homeostasis and the pivotal role of GH3 proteins in control of fruit
ripening is still under investigation (Pattison et al., IN PRESS). As already observed in
rice, GH3-8 is linked to the repression of expansin-related genes and their expression is
skin-tissue specific (Ding et al., 2008). Also the induction of VvGH3-8 (Figure 9B)
detected at post-véraison phase of CS/M4 (86 DAFB) and CS/1103P (100 DAFB) was
paralleled by a decrease in expansin-related transcripts expression as already observed by
Ziliotto et al., 2012.
ARFs and AUX/IAAs genes regulation was essential for several metabolisms related to
grape berry development and ripening. Our data highlighted that ARF genes, which are
118
actively involved in the auxin action, showed an earlier induction at pre-véraison stage in
CS/M4 berries (figure 7; supplementary figure 3), when auxin level reached its maximum
(Davies et al., 1997). As concerns CS/1103P most of ARF transcripts, VvARF8A/10B in
particular (Figures 7C, F), reached a peak (65 DAFB) in their expression later than
occurred in CS/M4. Taking into accounts the differences observed between CS/rootstocks
combinations in the regulation of ARF transcripts, a role in grape fruit development of
these transcripts was suggested. Several genes belonging to this family were showing
similar expression kinetic indicating that their function can overlap during fruit
development, as already observed in tomato (Kumar et al., 2011). In particular expression
of VvARF8A (Figure 7C) suggested, in both CS/M4 and CS/1103P, its involvement in
fruit development and ripening. An involvement of ARF8 in fertilization and fruit s et was
suggested (Goetz et al., 2007; Seymour et al., 2013), but its role during fruit ripening is
still unknown. VvARF1A and VvARF10A (Figures 7A, E) were significantly induced at the
pre-véraison stage, especially in CS/M4, suggesting a function in cell expansion during
berry green phase and thus a role in the early phases of fruit development. Indeed, a recent
work demonstrated a role of tomato ARF10 in the regulation of the size and shape of the
fruit (Hendelman et al., 2012). As concerns ARF1, it was observed an induction at the
mature green phase in tomato, suggesting its involvement in fruit development too
(Kumar et al., 2011).
VvARF5 was the only one highly expressed in the latter phases of berry ripening,
especially at 86-100 DAFB period. Its high expression during fruit ripening was already
observed by Kumar et al. (2011), in tomato fruit, but role of this genes during fruit
developmental processes is still unknown.
Several AUX/IAA-related genes showed an earlier and higher induction throughout all
grape berry development in CS/M4 samples (Figure 8; supplementary figure 4). It is well
known that in absence of auxin, AUX-IAA sequester ARF by protein-protein interaction
and inhibit the binding between the latter and the promoter region of auxin-responsive
genes. In this context AUX/IAA genes have been claimed as regulators of auxin response
during fruit development and ripening (Pattison et al., IN PRESS; Wang et al., 2005;
Woodward and Bartel, 2005).

119
Among this family, VvIAA9 and VvIAA15A were more induced during the green phase of
grape berry development (Figure 8C, D), as already observed in tomato by Audran-
Delalande et al. (2012), so, their expression can be related to the control of auxin
responsive genes in the early phases of berry ripening. Conversely, VvIAA6 and VvIAA15B
(Figure 8E, F) were significantly induced in CS/M4 at 86-100 DAFB suggesting their role
in control of auxin responsive genes in the latter phases of grape berry ripening. It is
worthy of note that VvIAA1 showed a strong tissue specificity in both CS/rootstocks
combinations, with differences among rootstocks related to the expression pattern, as
already described in the results section (Figure 8A).
Genes coding for cellular auxin transporter enzymes, were the lasts one considered in this
experiment (Figure 9). Auxin concentration in fruit, as well as in other organs, is strictly
related to its polar transport, which contributes to the formation of local auxin maxima and
minima that control various aspects of fruit development and ripening development
(Pattison et al., IN PRESS). Auxin efflux is mainly due to PIN and ABCB enzymes, while
auxin influx is controlled by AUX/LAX proteins (Pattison et al., IN PRESS; Geisler and
Murphy, 2006). mRNA-seq (data not showed) and qPCR (Figure 9) analyses highlighted
interesting expression patterns in these genes families. As showed in figure 9C and 9D,
PIN-like genes were mainly expressed in the final phases of grape berry ripening in skin
tissue, with an early induction in CS/M4 in comparison to what observed in CS/1103P.
ABCB-like genes were expressed in the pre-véraison stage (45-65 DAFB) and showed an
higher expression in CS/M4 (Figure 9E, F). PIN and ABCB genes were suggested to
control auxin intracellular levels and homeostasis in different species and tissues (Carraro
et al., 2012; Forestan et al., 2012; Pattison and Catalá, 2012). Our results suggest a
specific tissue and temporal -expression of both PIN and ABCB families and their
involvement in the reduction of auxin levels and control of auxin homeostasis in grape
berries.
Taken together, these data suggest an important involvement in the control of grape berry
development/ripening of genes that are related, on one hand to auxin signal transduction
(ARF and AUX/IAA) and, on the other hand, to homeostasis of this hormone through the
expression of genes involved in conjugation (GH3) and transport (PIN and ABCB).
Analysis of the expression patterns of genes involved in auxin transport and metabolism
120
are an important first step to elucidate the control of auxin levels and gradients in the fruit,
and are being performed in an increasing number of various fruit species (Ziliotto et al.,
2012; El-Sharkawy et al., 2010; Dal Cin et al., 2009; Kang et al., 2013). In addition to
these mechanisms, miRNAs seems to be important in the control of fruit development and
ripening and their role is currently emerging (Carra et al., 2011; Wang et al., 2012). An
important role in the modulation of auxin-related genes after pre-véraison stage was
indeed played by miR160 and miR167 which repressed VvARF16 and VvARF10,
respectively, at véraison stage (Figure 10). The higher expression of miR160a/b-1, which
corresponds to those considered in this word (figure 10A), during early and late stages of
grape berry ripening was reported also by Wang et al. (2014), which showed an induction
of this miRNA at young and mature berry of the table grapevine ‘Summer Black’. Despite
what observed by Carra et al. (2009), which hypotized a role of only before grape
ripening, we can speculate about its involvement also during the following phenological
phases. As observed for miR160, also miR167a (Figure 10B) expression was induced
during ripening, this should be related to its role in the repression of genes involved in
growth and development, which were expressed in the pre-véraison phases (Liu et al.,
2012). Another important issue of transcriptional control mediated by miRNA, is related
to their mobility. Indeed, in this study it was observed changes in conserved miRNA
expression, together with the presence of novel miRNA genotype specific (data not
showed), which is probably due to a production of these miRNA in the root zone and their
transport to the aerial part. Long-distance
transport of small interfering RNA and microRNA has been proven in several studies. For,
example, Yoo et al. (2004) showed that small RNA corresponding to authentic regulatory
RNAs (siRNA and miRNA) can enter and move through the phloem of several plant
species. Furthermore,
these authors identify a novel protein, Cucurbita maxima PHLOEM SMALL RNA
BINDING PROTEIN1 (CmPSRP1), and show that it likely plays a role in trafficking of
small RNA through
the phloem. So, in both leaf and root development, miRNAs establish intercellular
gradients of gene expression that are essential for cell and tissue differentiation
(Gursanscky et al., 2011) but their translocation from the basal (root) to the aerial
121
(leaves/berries) part of the plant has still to be proven. It, therefore, remains a distinct
possibility that proteins may facilitate or inhibit the movement of small RNAs not only
from cell to cell, but to distal locations in plants via the phloem.
In another paper, we observed that, after an NAA-treatment at the pre-véraison stage,
Merlot grape berries counterbalanced the excessive availability of auxin controlling auxin
homeostasis through the modulation of genes involved in biosynthesis, breakdown,
conjugation and transport (Ziliotto et al., 2012). Data presented here confirmed that auxin
level (in this case due to different scion/rootstock combination) can be a key factor in the
onset and progression of grape berry ripening. The ability of rootstock to induce high
auxin levels in scion buds was postulated Sorce et al. (2006) to explain the positive effect
of vigorous peach rootstocks on scion branching. In the case of fruit ripening, auxin acted
as a positive regulator of genes that control grape berry size (e.g. expansin-related genes)
before the véraison stage; it was indeed observed the up-regulation at the pre-véraison
stage, which was different for CS/M4 and CS/1103P, of transcripts that control auxin-
responsive genes (e.g. VvARF8A and VvARF1A). The induction of genes that belonged to
ARF family was paralleled by the expression of transcripts that control auxin levels (e.g.
VvGH3-1, VvIAA9, VvIAA15A, VvIAA16), highlighting an accurate regulation of auxin
homeostasis in grape berries at these phases. Moreover, control of auxin levels in grape
berry seems pass through other mechanisms involving the control of transport-related
genes in early (e.g. ABCB) and late (PIN) phases of berry development (figure 9).
Although several studies emphasize the function of auxin as a repressor of genes involved
in the ripening process (Daminato et al., 2013; Sundberg and Ostergaard, 2009), a more
complex role of auxin regulating this process is currently emerging from studies carried
out both in climacteric fruit as peach (Tatsuki et al., 2013; Trainotti et al., 2007a) and in
climacteric-suppressed fruit as plums (El-Sharkawy et al., 2010). These studies
demonstrated that auxin can play an autonomous role in the ripening and, at the same
time, to govern the ripening interacting with ethylene (Trainotti et al., 2007b). The
interaction between auxin and ethylene in the controlling of ripening is supported by the
ability of auxin treatment to restore a correct progression of ripening in fruit in which this
event is partially impaired as in Stony-Hard peaches (Tatsuki et al., 2013) and on Shiro, a
122
suppressed climacteric plum (El-Sharkawy et al., 2010). These results suggest that a
scarcity of auxin might negative affect the levels of autocatalytic ethylene production.
In the case of grape, auxin treatment performed at véraison induced the expression of
genes involved in the ethylene biosynthesis although the ripening progression was deeply
delayed (Ziliotto et al, 2012). In this contest, auxin acted as negative regulators on some
genes related to grape berry ripening but its induction at the pre-véraison stage could be
necessary to triggers other metabolism involved in ripening processes. Auxin seems to be
accumulated rapidly and in higher levels in CS berries grafted onto the M4 genotype and
high levels of ripening-related genes resulted in the early transition of the green fruit into
the ripening stage as already observed in other fruit (El-Sharkawy et al., 2010; Pattison
and Catalá, 2012; Trainotti et al., 2007b; Exposito-Rodriguez et al., 2011).
5. Acknowledgements
This study was supported by the Progetto AGER “SERRES”, grant n° 2010-2105.We are
especially indebted to Pasqua vigneti e cantine (Novaglie, Verona, Italy) for the supply of
plant materials.
123
6. References
Anders S, Huber W. 2010. Differential expression analysis for sequence count data.
Genome Biology 11, R106.
Audran-Delalande C, Bassa C, Mila I, Regad F, Zouine M, Bouzayen M. 2012.
Genome-Wide Identification, Functional Analysis and Expression Profiling of the
Aux/IAA Gene Family in Tomato. Plant and Cell Physiology 53, 659-672.
Bottcher C, Dennis EG, Booker GW, Polyak SW, Boss PK, Davies C. 2012. A novel
tool for studying auxin-metabolism: the inhibition of grapevine indole-3-acetic acid-amido
synthetases by a reaction intermediate analogue. PloS one 7, e37632.
Böttcher C, Harvey K, Forde CG, Boss PK, Davies C. 2011. Auxin treatment of pre-
veraison grape (Vitis vinifera L.) berries both delays ripening and increases the
synchronicity of sugar accumulation. Australian Journal of Grape and Wine Research 17,
1-8.
Böttcher C, Keyzers RA, Boss PK, Davies C. 2010. Sequestration of auxin by the
indole-3-acetic acid-amido synthetase GH3-1 in grape berry (Vitis vinifera L.) and the
proposed role of auxin conjugation during ripening. Journal of experimental botany 61,
3615-3625.
Çakir B, Kiliçkaya O, Olcay A. 2013. Genome-wide analysis of Aux/IAA genes in Vitis
vinifera: cloning and expression profiling of a grape Aux/IAA gene in response to
phytohormone and abiotic stresses. Acta Physiologiae Plantarum 35, 365-377.
Campagna D, Albiero A, Bilardi A, Caniato E, Forcato C, Manavski S, Vitulo N, Valle G. 2009. PASS: a program to align short sequences. Bioinformatics 25, 967-968.
Carra A, Gambino G, Urso S, Nervo G. 2011. Non Coding RNAs and Gene Silencing
in Grape. In: Erdmann VA, Barciszewski J, eds. Non Coding RNAs in Plants: Springer
Berlin Heidelberg, 67-78.
Carra A, Mica E, Gambino G, Pindo M, Moser C, Pè ME, Schubert A. 2009. Cloning
and characterization of small non-coding RNAs from grape. The Plant Journal 59, 750-
763.
Carraro N, Tisdale-Orr TE, Clouse RM, Knoller AS, Spicer R. 2012. Diversification
and Expression of the PIN, AUX/LAX, and ABCB Families of Putative Auxin
Transporters in Populus. Frontiers in plant science 3, 17.
Carreño J, Martínez A, Almela L, Fernández-López JA. 1995. Proposal of an index
for the objective evaluation of the colour of red table grapes. Food Research International
28, 373-377.
Castellarin S, Matthews M, Gaspero G, Gambetta G. 2007. Water deficits accelerate
ripening and induce changes in gene expression regulating flavonoid biosynthesis in grape
berries. Planta 227, 101-112.
124
Castellarin SD, Gambetta GA, Wada H, Shackel KA, Matthews MA. 2011. Fruit
ripening in Vitis vinifera: spatiotemporal relationships among turgor, sugar accumulation,
and anthocyanin biosynthesis. Journal of experimental botany 62, 4345-4354.
Chang S, Puryear J, Cairney J. 1993. A simple and efficient method for isolating RNA
from pine trees. Plant Molecular Biology Reporter 11, 113-116.
Chaves MM, Zarrouk O, Francisco R, Costa JM, Santos T, Regalado AP, Rodrigues ML, Lopes CM. 2010. Grapevine under deficit irrigation: hints from physiological and
molecular data. Annals of Botany 105, 661-676.
Chen J-Y, Wen P-F, Kong W-F, Pan Q-H, Wan S-B, Huang W-D. 2006. Changes and
subcellular localizations of the enzymes involved in phenylpropanoid metabolism during
grape berry development. Journal of Plant Physiology 163, 115-127.
Chervin C, Tira-umphon A, Terrier N, Zouine M, Severac D, Roustan J-P. 2008.
Stimulation of the grape berry expansion by ethylene and effects on related gene
transcripts, over the ripening phase. Physiologia Plantarum 134, 534-546.
Conde C, Silva P, Fontes N, Dias ACP, Tavares RM, Sousa MJ, Agasse A, Delrot S, Gerós H. 2007. Biochemical Changes throughout Grape Berry Development and Fruit
and Wine Quality.
Coombe BG, McCarthy MG. 2000. Dynamics of grape berry growth and physiology of
ripening. Australian Journal of Grape and Wine Research 6, 131-135.
Cortell JM, Halbleib M, Gallagher AV, Righetti TL, Kennedy JA. 2007a. Influence of
vine vigor on grape (Vitis vinifera L. Cv. Pinot Noir) anthocyanins. 2. Anthocyanins and
pigmented polymers in wine. Journal of agricultural and food chemistry 55, 6585-6595.
Cortell JM, Halbleib M, Gallagher AV, Righetti TL, Kennedy JA. 2007b. Influence of
vine vigor on grape (Vitis vinifera L. Cv. Pinot Noir) anthocyanins. 1. Anthocyanin
concentration and composition in fruit. Journal of agricultural and food chemistry 55,
6575-6584.
Covarrubias J, Rombolà A. 2013. Physiological and biochemical responses of the iron
chlorosis tolerant grapevine rootstock 140 Ruggeri to iron deficiency and bicarbonate.
Plant and Soil 370, 305-315.
Dal Cin V, Velasco R, Ramina A. 2009. Dominance induction of fruitlet shedding in
Malus x domestica (L. Borkh): molecular changes associated with polar auxin transport.
BMC Plant Biology 9, 139.
Daminato M, Guzzo F, Casadoro G. 2013. A SHATTERPROOF-like gene controls
ripening in non-climacteric strawberries, and auxin and abscisic acid antagonistically
affect its expression. Journal of experimental botany 64, 3775-3786.
Davies C, Boss PK, Robinson SP. 1997. Treatment of Grape Berries, a Nonclimacteric
Fruit with a Synthetic Auxin, Retards Ripening and Alters the Expression of
Developmentally Regulated Genes. Plant physiology 115, 1155-1161.
125
Davies C, Böttcher C. 2009. Hormonal Control of Grape Berry Ripening. In: Roubelakis-
Angelakis K, ed. Grapevine Molecular Physiology & Biotechnology: Springer
Netherlands, 229-261.
Davies C, Robinson SP. 2000. Differential screening indicates a dramatic change in
mRNA profiles during grape berry ripening. Cloning and characterization of cDNAs
encoding putative cell wall and stress response proteins. Plant physiology 122, 803-812.
Deluc L, Quilici D, Decendit A, Grimplet J, Wheatley M, Schlauch K, Merillon J-M, Cushman J, Cramer G. 2009. Water deficit alters differentially metabolic pathways
affecting important flavor and quality traits in grape berries of Cabernet Sauvignon and
Chardonnay. BMC Genomics 10, 212.
Dhondt S, Coppens F, De Winter F, Swarup K, Merks RMH, Inzé D, Bennett MJ, Beemster GTS. 2010. SHORT-ROOT and SCARECROW Regulate Leaf Growth in
Arabidopsis by Stimulating S-Phase Progression of the Cell Cycle. Plant physiology 154,
1183-1195.
Ding X, Cao Y, Huang L, Zhao J, Xu C, Li X, Wang S. 2008. Activation of the indole-
3-acetic acid-amido synthetase GH3-8 suppresses expansin expression and promotes
salicylate- and jasmonate-independent basal immunity in rice. The Plant cell 20, 228-240.
El-Sharkawy I, Mila I, Bouzayen M, Jayasankar S. 2010. Regulation of two germin-
like protein genes during plum fruit development. Journal of experimental botany 61,
1761-1770.
Exposito-Rodriguez M, Borges AA, Borges-Perez A, Perez JA. 2011. Gene structure
and spatiotemporal expression profile of tomato genes encoding YUCCA-like flavin
monooxygenases: the ToFZY gene family. Plant physiology and biochemistry : PPB /
Societe francaise de physiologie vegetale 49, 782-791.
Fillion L, Ageorges A, Picaud S, Coutos-Thevenot P, Lemoine R, Romieu C, Delrot S.
1999. Cloning and expression of a hexose transporter gene expressed during the ripening
of grape berry. Plant physiology 120, 1083-1094.
Forestan C, Farinati S, Varotto S. 2012. The Maize PIN Gene Family of Auxin
Transporters. Frontiers in plant science 3, 16.
Gambetta G, Matthews M, Shaghasi T, McElrone A, Castellarin S. 2010. Sugar and
abscisic acid signaling orthologs are activated at the onset of ripening in grape. Planta
232, 219-234.
Gambetta GA, Manuck CM, Drucker ST, Shaghasi T, Fort K, Matthews MA, Walker MA, McElrone AJ. 2012. The relationship between root hydraulics and scion
vigour across Vitis rootstocks: what role do root aquaporins play? Journal of experimental
botany 63, 6445-6455.
Gao M-j, Parkin I, Lydiate D, Hannoufa A. 2004. An auxin-responsive SCARECROW-
like transcriptional activator interacts with histone deacetylase. Plant Molecular Biology
55, 417-431.
126
Geisler M, Murphy AS. 2006. The ABC of auxin transport: The role of p-glycoproteins
in plant development. FEBS letters 580, 1094-1102.
Giribaldi M, Gény L, Delrot S, Schubert A. 2010. Proteomic analysis of the effects of
ABA treatments on ripening Vitis vinifera berries. Journal of experimental botany 61,
2447-2458.
Goetz M, Hooper LC, Johnson SD, Rodrigues JC, Vivian-Smith A, Koltunow AM.
2007. Expression of aberrant forms of AUXIN RESPONSE FACTOR8 stimulates
parthenocarpy in Arabidopsis and tomato. Plant physiology 145, 351-366.
Götz S, García-Gómez JM, Terol J, Williams TD, Nagaraj SH, Nueda MJ, Robles M, Talón M, Dopazo J, Conesa A. 2008. High-throughput functional annotation and data
mining with the Blast2GO suite. Nucleic Acids Research 36, 3420-3435.
Gregory PJ, Atkinson CJ, Bengough AG, Else MA, Fernández-Fernández F, Harrison RJ, Schmidt S. 2013. Contributions of roots and rootstocks to sustainable,
intensified crop production. Journal of experimental botany 64, 1209-1222.
Grimplet J, Deluc L, Tillett R, Wheatley M, Schlauch K, Cramer G, Cushman J.
2007. Tissue-specific mRNA expression profiling in grape berry tissues. BMC Genomics
8, 187.
Guilfoyle TJ, Ulmasov T, Hagen G. 1998. The ARF family of transcription factors and
their role in plant hormone-responsive transcription. Cellular and Molecular Life Sciences
CMLS 54, 619-627.
Guillaumie S, Fouquet R, Kappel C, Camps C, Terrier N, Moncomble D, Dunlevy J, Davies C, Boss P, Delrot S. 2011. Transcriptional analysis of late ripening stages of
grapevine berry. BMC Plant Biology 11, 165.
Gursanscky NR, Searle IR, Carroll BJ. 2011. Mobile microRNAs hit the target. Traffic
12, 1475-1482.
Hendelman A, Buxdorf K, Stav R, Kravchik M, Arazi T. 2012. Inhibition of lamina
outgrowth following Solanum lycopersicum AUXIN RESPONSE FACTOR 10
(SlARF10) derepression. Plant Molecular Biology 78, 561-576.
Jeong ST, Goto-Yamamoto N, Kobayashi S, Esaka M. 2004. Effects of plant hormones
and shading on the accumulation of anthocyanins and the expression of anthocyanin
biosynthetic genes in grape berry skins. Plant Science 167, 247-252.
Kang C, Darwish O, Geretz A, Shahan R, Alkharouf N, Liu Z. 2013. Genome-scale
transcriptomic insights into early-stage fruit development in woodland strawberry Fragaria
vesca. The Plant cell 25, 1960-1978.
Koundouras S, Tsialtas IT, Zioziou E, Nikolaou N. 2008. Rootstock effects on the
adaptive strategies of grapevine (Vitis vinifera L. cv. Cabernet–Sauvignon) under
contrasting water status: Leaf physiological and structural responses. Agriculture,
Ecosystems & Environment 128, 86-96.
127
Kuhn N, Guan L, Dai ZW, Wu B-H, Lauvergeat V, Gomès E, Li S-H, Godoy F, Arce-Johnson P, Delrot S. 2013. Berry ripening: recently heard through the grapevine.
Journal of experimental botany.
Kumar L, Futschik M. 2007. Mfuzz: a software package for soft clustering of microarray
data. Bioinformation 2, 5-7.
Kumar R, Tyagi A, Sharma A. 2011. Genome-wide analysis of auxin response factor
(ARF) gene family from tomato and analysis of their role in flower and fruit development.
Molecular Genetics and Genomics 285, 245-260.
Liang Z, Sang M, Fan P, Wu B, Wang L, Duan W, Li S. 2011. Changes of
Polyphenols, Sugars, and Organic Acid in 5 Vitis Genotypes during Berry Ripening.
Journal of Food Science 76, C1231-C1238.
Lijavetzky D, Carbonell-Bejerano P, Grimplet J, Bravo G, Flores P, Fenoll J, Hellin P, Oliveros JC, Martinez-Zapater JM. 2012. Berry flesh and skin ripening features in
Vitis vinifera as assessed by transcriptional profiling. PloS one 7, e39547.
Liu H, Jia S, Shen D, Liu J, Li J, Zhao H, Han S, Wang Y. 2012. Four AUXIN
RESPONSE FACTOR genes downregulated by microRNA167 are associated with growth
and development in Oryza sativa. Functional Plant Biology 39, 736-744.
Meggio F, Prinsi B, Negri, A.S. , Di Lorenzo GS, Lucchini G, Pitacco P, Failla O, Scienza A, Cocucci C, Espen L. IN PRESS. Different biochemical and physiological
responses of two grapevine rootstock genotypes to drought and salt treatments. Australian
Journal of Grape and Wine Research.
Pattison RJ, Catalá C. 2012. Evaluating auxin distribution in tomato (Solanum
lycopersicum) through an analysis of the PIN and AUX/LAX gene families. The Plant
Journal 70, 585-598.
Pattison RJ, Csukasi F, Catalá C. IN PRESS. Mechanisms regulating auxin action
during fruit development. Physiologia Plantarum.
Pérez-Magariño S, González-San José ML. 2004. Evolution of Flavanols,
Anthocyanins, and Their Derivatives during the Aging of Red Wines Elaborated from
Grapes Harvested at Different Stages of Ripening. Journal of agricultural and food
chemistry 52, 1181-1189.
Qin F, Shinozaki K, Yamaguchi-Shinozaki K. 2011. Achievements and Challenges in
Understanding Plant Abiotic Stress Responses and Tolerance. Plant and Cell Physiology
52, 1569-1582.
Reed JW. 2001. Roles and activities of Aux/IAA proteins in Arabidopsis. Trends in Plant
Science 6, 420-425.
Ryan J-M, Revilla E. 2003. Anthocyanin Composition of Cabernet Sauvignon and
Tempranillo Grapes at Different Stages of Ripening. Journal of agricultural and food
chemistry 51, 3372-3378.
128
Schaffer RJ, Ireland HS, Ross JJ, Ling TJ, David KM. 2013. SEPALLATA1/2-
suppressed mature apples have low ethylene, high auxin and reduced transcription of
ripening-related genes. AoB Plants 5.
Seymour GB, Østergaard L, Chapman NH, Knapp S, Martin C. 2013. Fruit
Development and Ripening. Annual Review of Plant Biology 64, 219-241.
Sorce M, Mariotti L, Massai R, Lorenzi R. 2006. The Involvement of Indoleacetic Acid
in Paradormancy and Sylleptic Shoot Development of Grafted Peach Trees and Hybrid
Rootstocks. European Journal of Horticultural science 71, 155-160.
Stockert C, Smart DR. 2008. The Physiological Basis of rootstock Control of Grape
Fruit Nitrogen Composition. 2nd Annual National Viticulture Research Conference.
University of California, Davis, USA, 78, 79.
Sun L, Zhang M, Ren J, Qi J, Zhang G, Leng P. 2010. Reciprocity between abscisic
acid and ethylene at the onset of berry ripening and after harvest. BMC Plant Biology 10,
257.
Sundberg E, Ostergaard L. 2009. Distinct and dynamic auxin activities during
reproductive development. Cold Spring Harbor perspectives in biology 1, a001628.
Symons GM, Chua Y-J, Ross JJ, Quittenden LJ, Davies NW, Reid JB. 2012.
Hormonal changes during non-climacteric ripening in strawberry. Journal of experimental
botany 63, 4741-4750.
Symons GM, Davies C, Shavrukov Y, Dry IB, Reid JB, Thomas MR. 2006. Grapes on
steroids. Brassinosteroids are involved in grape berry ripening. Plant physiology 140, 150-
158.
Tamura K, Dudley J, Nei M, Kumar S. 2007. MEGA4: Molecular Evolutionary
Genetics Analysis (MEGA) Software Version 4.0. Molecular Biology and Evolution 24,
1596-1599.
Tatsuki M, Nakajima N, Fujii H, Shimada T, Nakano M, Hayashi K-i, Hayama H, Yoshioka H, Nakamura Y. 2013. Increased levels of IAA are required for system 2
ethylene synthesis causing fruit softening in peach (Prunus persica L. Batsch). Journal of
experimental botany 64, 1049-1059.
Trainotti L, Tadiello A, Casadoro G. 2007a. The involvement of auxin in the ripening
of climacteric fruits comes of age: the hormone plays a role of its own and has an intense
interplay with ethylene in ripening peaches. Journal of experimental botany 58, 3299-
3308.
Trainotti L, Tadiello A, Casadoro G. 2007b. The involvement of auxin in the ripening
of climacteric fruits comes of age: the hormone plays a role of its own and has an intense
interplay with ethylene in ripening peaches. Journal of experimental botany 58, 3299-
3308.
129
Tramontini S, Vitali M, Centioni L, Schubert A, Lovisolo C. 2013. Rootstock control
of scion response to water stress in grapevine. Environmental and Experimental Botany
93, 20-26.
Walker RR, Read PE, Blackmore DH. 2000. Rootstock and salinity effects on rates of
berry maturation, ion accumulation and colour development in Shiraz grapes. Australian
Journal of Grape and Wine Research 6, 227-239.
Wang C, Han J, Liu C, Kibet K, Kayesh E, Shangguan L, Li X, Fang J. 2012.
Identification of microRNAs from Amur grape (vitis amurensis Rupr.) by deep
sequencing and analysis of microRNA variations with bioinformatics. BMC Genomics 13,
122.
Wang C, Leng X, Zhang Y, Kayesh E, Zhang Y, Sun X, Fang J. 2014. Transcriptome-
wide analysis of dynamic variations in regulation modes of grapevine microRNAs on their
target genes during grapevine development. Plant Molecular Biology 84, 269-285.
Wang C, Wang X, Kibet NK, Song C, Zhang C, Li X, Han J, Fang J. 2011. Deep
sequencing of grapevine flower and berry short RNA library for discovery of novel
microRNAs and validation of precise sequences of grapevine microRNAs deposited in
miRBase. Physiologia Plantarum 143, 64-81.
Wang H, Jones B, Li Z, Frasse P, Delalande C, Regad F, Chaabouni S, Latche A, Pech JC, Bouzayen M. 2005. The tomato Aux/IAA transcription factor IAA9 is involved
in fruit development and leaf morphogenesis. The Plant cell 17, 2676-2692.
Wang L, Mai Y-X, Zhang Y-C, Luo Q, Yang H-Q. 2010. MicroRNA171c-Targeted
SCL6-II, SCL6-III, and SCL6-IV Genes Regulate Shoot Branching in Arabidopsis.
Molecular Plant 3, 794-806.
Woodward AW, Bartel B. 2005. Auxin: Regulation, Action, and Interaction. Annals of
Botany 95, 707-735.
Wu J, Peng Z, Liu S, He Y, Cheng L, Kong F, Wang J, Lu G. 2012. Genome-wide
analysis of Aux/IAA gene family in Solanaceae species using tomato as a model.
Molecular Genetics and Genomics 287, 295-311.
Yoo BC, Kragler F, Varkonyi-Gasic E, Haywood V, Archer-Evans S, Lee YM, Lough TJ, Lucas WJ. 2004. A systemic small RNA signaling system in plants. The Plant
cell 16, 1979-2000.
Ziliotto F, Corso M, Rizzini FM, Rasori A, Botton A, Bonghi C. 2012. Grape berry
ripening delay induced by a pre-veraison NAA treatment is paralleled by a shift in the
expression pattern of auxin- and ethylene-related genes. BMC Plant Biology 12, 185.

130
131
Chapter IV
Grape berry ripening delay induced by a pre-
véraison NAA treatment is paralleled by a
shift in the expression pattern of auxin- and
ethylene related genes
Massimiliano Corso1, Fiorenza Ziliotto1, Fabio-Massimo Rizzini1, Angela
Rasori1, Alessandro Botton1, Claudio Bonghi1,2
1. Department of Agronomy, Food, Natural Resources, Animals and Environment, DAFNAE,
University of Padova, Agripolis–Viale dell’Università 16, 35020 Legnaro (Padova), Italy.
2. Centro Interdipartimentale per la Ricerca in Viticoltura ed Enologia (CIRVE) Via XXVIII Aprile,
14-31015 Conegliano (TV), Italy
Published: Ziliotto F*, Corso M*, Rizzini FM, Rasori A, Botton A, Bonghi C. 2012.
Grape berry ripening delay induced by a pre-veraison NAA treatment is paralleled by a
shift in the expression pattern of auxin- and ethylene-related genes. BMC Plant Biology
12, 185. *Equal contribution
132
1. Introduction
A large number of physiological and molecular events are known to occur during grape
berry ripening, but the regulatory mechanisms controlling this critical developmental
phase are still poorly understood. The onset of ripening (termed véraison) is accompanied
by significant changes, at both physical (pulp firmness) and chemical (accumulation of
sugars and flavor compounds, synthesis of anthocyanins and reduction of organic acids
concentration) levels (Nunan et al., 1998; Robinson et al., 2000), concurrently with the
modification of the transcription rate of a large number of related genes (Deluc et al.,
2007; Pilati et al., 2007). Auxin, ethylene, abscisic acid (ABA) and brassinosteroids (BRs)
are actively involved, throughout a complex network of interactions with other mobile
signals, in the regulation of grape berry ripening (Davies et al., 2009). Interestingly, the
highest levels of auxin are observed at early berry development, then its concentration
decreases rapidly before véraison, becoming undetectable after two weeks (Deytieux-
Belleau et al., 2007; Böttcher et al., 2010).
On the other hand, another study showed no dramatic changes in auxin concentration
during berry growth and development (Symons et al., 2006). Application of synthetic
auxins before véraison delays ripening, as seen in several ripening related physiological
processes (Davies et al., 1997; Böttcher et al., 2010a; Böttcher et al., 2010b), and heavily
modifies the transcription of key genes involved in the sugars metabolism, cell wall turn-
over and biosynthesis of phenylpropanoids (Jeong et al., 2004). Among the latter, the
expression of genes encoding chalcone synthase (CHS), flavanone hydroxylase (F3H),
UDP-glucose:flavonoid 3-O-glucosyltransferase (UFGT), and MYB transcription factors
(Davies et al., 1997; Davies et al., 2009;) is negatively affected by auxin. Davies et al.
(1997) showed that treatments with the synthetic auxin BTOA (benzothiazole-2-oxyacetic
acid) were able to modify the hexose accumulation mechanisms by altering the expression
of the related genes. NAA applications at véraison also inhibited genes belonging to cell
wall structure, such as GRIP4 coding for a proline-rich protein, and negatively affected
ABA metabolism (Davies et al., 2009). Endogenous levels of ethylene, ABA and BRs
increase at véraison, and exogenous applications of these hormones accelerate the
initiation of the ripening phase, concurrently stimulating the accumulation of
anthocyanins, most likely by enhancing the transcription of CHS, F3H, UFGT, and MYB1
133
genes (El-Kereamy et al., 2003; Jeong et al., 2004; Symons et al., 2006; Chervin et al.,
2008; Giribaldi et al., 2011). These treatments can also induce the uptake and storage of
sugars by berries (Giribaldi et al., 2011). In addition, low doses of ethylene at véraison
stimulated grape berry expansion, enabling cell elongation in pulp and skin, and inducing
genes encoding aquaporins (AQUAPORIN1 and AQUAPORIN2) and cell wall
hydrolase/esterase, such as Polygalacturonase (PG1) Expansin (EX), and Pectin-methyl
esterase (PME) (Chervin et al., 2008; Sun et al., 2010).
Since mutants with impaired ripening are not available in grapevine, the best alternative
way to investigate the role of hormones during berry development consists in altering the
specific process by means of exogenous applications of plant growth regulators.
Transcriptome studies dealing with the effects of exogenous hormone treatments in
grapevine have focused on ethylene (Chervin et al., 2008), referring to the pivotal role of
this hormone in the transcriptional regulation of its biosynthesis and signal transduction
during grape berry development. In particular, ethylene treatments were shown to induce
the transcription of ARF8 (auxin response factor) and NCED (9-cisepoxycarotenoid
dioxygenase) genes, the latter encoding a key enzyme of ABA biosynthesis (Chervin et
al., 2008). Auxin treatments were also investigated, showing an increase in ethylene due
to the stimulation of the expression of genes encoding its biosynthetic key enzymes (Chae
et al., 2000; El-Sharkawy et al., 2008) and signal transduction elements (El-Sharkawy et
al., 2009).
In order to shed light on the hormone interactions occurring at véraison, a specific
transcriptomic study was carried out on NAA treated berries. This study confirms the
capacity of NAA to delay grape berry ripening at the transcriptional level. The duration of
this delay may be associated with the recovery of a steady state of auxin concentration. In
the presence of altered levels of auxin, the crosstalk between hormones involves diverse
specific mechanisms, acting at both the hormone response and biosynthesis levels, thus
creating a complex network of transcriptional responses.
134
2. Materials and methods
2.1 Plant materials and treatment
Experiments were performed on Vitis vinifera L. cv. Merlot berries collected at a
commercial vineyard (Vini e vigne, Monselice PD, Italy). One-hundred bunches from fifty
homogeneous plants (two bunches per plant) were treated in planta with a synthetic auxin
(naphtalenacetic acid, NAA, 200 mg/L; SIGMA-N640) at the pre-véraison stage
corresponding to fifty-three days after full bloom (DAFB), as suggested by Jeong et al.
(2004). Whole berries from treated and untreated bunches were collected at 57, 60, 70, 95,
and 110 DAFB (see Additional file 10), and either immediately used for biochemical
analyses or frozen in liquid nitrogen and stored at -80°C for RNA isolation and
transcriptomic evaluations. Because of a delayed ripening observed upon the treatment,
additional samples were collected from NAA-treated bunches up to 160 DAFB. The
sample at 148 DAFB was chosen ex post as being representative of the harvest date of
treated berries, according not only to the Color Index for Red Grape (CIRG), but also to
the biochemical parameters that were similar to the control samples at harvest (see Results
section for a detailed description). At each time-point, three biological replicates were
sampled for the biochemical analyses and two for transcriptomic assessments. Each
replicate was collected from five to seven bunches and was made up of at least fifty
berries chosen according to the CIRG index proposed by Carreño et al. (1995) at the same
position within the cluster (median position). The juice from each replicate was used to
assess the biochemical indicators (titratable acidity, pH, tartaric acid, malic acid, soluble
solids) using a WineScan FT 120 multiple-parameter analyser (FOSS, Denmark), while
anthocyanin content was determined as described by Mattivi et al. (2006). A colorimetric
index was chosen since gene expression analyses in individual grape berries during
ripening initiation revealed that pigmentation intensity could be assumed as a valid
indicator of developmental staging within the cluster (Lund et al., 2008).
2.2 RNA extraction, microarray analysis and quantitative real time
PCR
Total RNA for both microarray and real-time PCR experiments was extracted from whole
berries stored at -80°C using the perchlorate method as reported by Rizzini et al. (2009).

135
Microarray experiments were carried out using the grape AROS V1.0 platform
(http://www.operon.com), as described by Rizzini et al. (2009). The following samples
were hybridized: NAA-treated berries at 60 DAFB versus untreated berries at 60 DAFB
(N1/C1), NAA-treated berries at 110 DAFB versus untreated berries at 110 DAFB
(N2/C2), and NAA-treated berries at 148 DAFB versus untreated berries at 110 DAFB
(N3/C2). For each of the three comparisons, three slides were hybridized using targets
corresponding to two biological replicates (at least one biological replicate was dye-
swapped, except for the N1/C1 comparison for which both replicates were dye-swapped
and thus four slides were hybridized). Raw hybridization data were quality-filtered,
background subtracted, and intra-array normalized with the loess method. The above
calculations were all carried out with the package limma and other basic statistical
functions of R for Mac OS X v2.13.1 (http://www.r-project.org/). The same package was
also used for discovering differentially expressed genes by means of the linear modelling
approach (lmFit) and the empirical Bayes statistics (eBayes), both implemented in limma
(Smyth et al., 2004). All the experimental procedures comply with minimum information
about a microarray experiment (MIAME) standards for array data (Brazma et al., 2001).
Gene expression data have been submitted to Gene Expression Omnibus (GEO)
(accession no. GSE37341) at NCBI (https://www.ncbi.nlm. nih.gov/geo/). For quantitative
real-time PCR analysis (qPCR), cDNA was synthesized using 2 µg of total RNA, 2.5 µM
(dT)18 primer, 200 Units of M-MLV Reverse Transcriptase (Promega) and 1 Unit of
RNAguard (Amersham Biosciences), at 37°C for 90 minutes in a final volume of 20 µL.
qPCR was carried out in triplicate, on two biological replicates for each sample, with
StepOne Plus Real-Time PCR System (Applied Biosystems) by using specific primers
listed in Additional file 11. The specificity of amplification was assessed as indicated by
Botton et al. (2011). Data were acquired, elaborated, and exported with the StepOne
Software version 2.1 (Applied Biosystems), whereas all the final calculations were carried
out with the automated Excel spreadsheet Q-Gene designed by Simon (2003) using the
modifications of the delta cycle threshold method suggested by Pfaffl (2001). Gene
expression values were normalized to the housekeeping gene UbiCF (Ubiquitin
Conjugating Factor; CF203457) already used by Castellarin et al. (2007) and reported as
arbitrary units of mean normalized expression, using equation 2 of Q-Gene.
136
2.3 Microarray annotation and enrichment analysis
The sequences of the oligos spotted onto the AROS V1.0 microarray were matched by
means of the Blastn algorithm against the transcripts of the 12X genome assembly
obtained at the CRIBI Centre of the University of Padova and publicly available at the
website http:// genomes.cribi.unipd.it/. The Gene Ontology terms were retrieved, imported
in the Blast2GO software v2.5.0 (Götz et al., 2008) and increased of about 16% by means
of the Annex function (Myhre et al., 2006) as reported by Botton et al. (2008). Enrichment
analysis was performed for each set of differentially expressed genes with the built-in
Fisher’s exact test function with P ≤ 0.01 and FDR correction.
2.4 HORMONOMETER analyses
The HORMONOMETER tool (Volodarsky et al., 2009; http://genome.weizmann.
ac.il/hormonometer/) was used by following the same pipeline adopted in peach by
Bonghi et al. (2011). Since this bioinformatic tool accepts only Arabidopsis gene
expression data, the probes spotted onto the grape microarray were matched against the
12X genome assembly as reported above and, in turn, the genes predicted in the latter
release were matched with those of Arabidopsis by blasting the respective protein
sequences against each other (grape deduced proteins vs TAIR10 proteins). In this way, an
association ‘array probe-grape gene-Arabidopsis gene’ was obtained, allowing to use as
input data for HORMONOMETER the grape gene expression data coupled with the
respective locus names and Affymetrix probe IDs of the putative Arabidopsis orthologs.
In the case in which different grape genes matched a single Arabidopsis gene, their
expression values were averaged and considered just once. In addition to the whole set of
grape genes spotted onto the microarray, three subsets were submitted to
HORMONOMETER: i) genes with hormone-specific responsiveness (i.e. that are not
multiple targets of hormones), ii) hormone-responsive genes encoding transcription
factors (TFs), and iii) genes encoding TFs with hormone-specific responsiveness (an
intersection between the two previous groups). A short description of the basic principles
of functioning of the HORMONOMETER tool is given by Bonghi et al. (2011).
137
3. Results
3.1 Biochemical analyses
Physical (berry volume) and chemical (total anthocyanins content, soluble solids
concentration, titratable acidity) parameters were assessed in both control and NAA-
treated berries (Figure 1), in order to verify the actual efficacy of the treatment.
Untreated berries showed an increase of volume after the time of the treatment (53 Days
After Full Bloom, DAFB) until reaching a temporary lag phase (from 60 to 70 DAFB)
during which this parameter did not vary significantly. Thereafter, it increased and
reached its maximum at harvest (110 DAFB). The volume of NAAtreated berries showed
a significant increase up to 70 DAFB, when their lag phase began. At this time, the
volume of treated samples was about half that of the control. Moreover, the lag phase of
NAA-treated berries was more than 50% longer (from 70 to 95 DAFB) with respect to the
control. Thereafter, the volume increased, until reaching, at harvest (148 DAFB), a value
similar to that observed in untreated samples (Figure 1A).
Anthocyanins content of whole berries in control samples increased very rapidly up to five
days following the lag phase, and then gradually decreased until harvest (110 DAFB). The
accumulation of anthocyanins was significantly inhibited in NAA-treated berries to almost
undetectable levels up to 80 DAFB. Thereafter, a constant increase was observed until
harvest (148 DAFB), finally reaching a level similar to that measured in the control
(Figure 1B).
Soluble solids concentration (SSC) of control berries constantly increased throughout the
whole experiment, especially during the lag phase of berry growth. NAA treatment
showed an inhibitory effect also on this parameter, similar to that of anthocyanins. In fact,
no increase of SSC was observed up to 80 DAFB, whereas a constant rise was measured
thereafter, reaching at harvest the same values as the control (Figure 1C).
In control berries, a constant decrease of titratable acidity, well correlated with both malic
and tartaric acid degradation, was observed during ripening evolution. On the other hand,
NAA-treated berries always showed significantly higher levels of total acidity than the
control, except for samples at harvest, whose acidity was similar to that assessed in
untreated samples. However, in treated berries a clear correlation was observed only
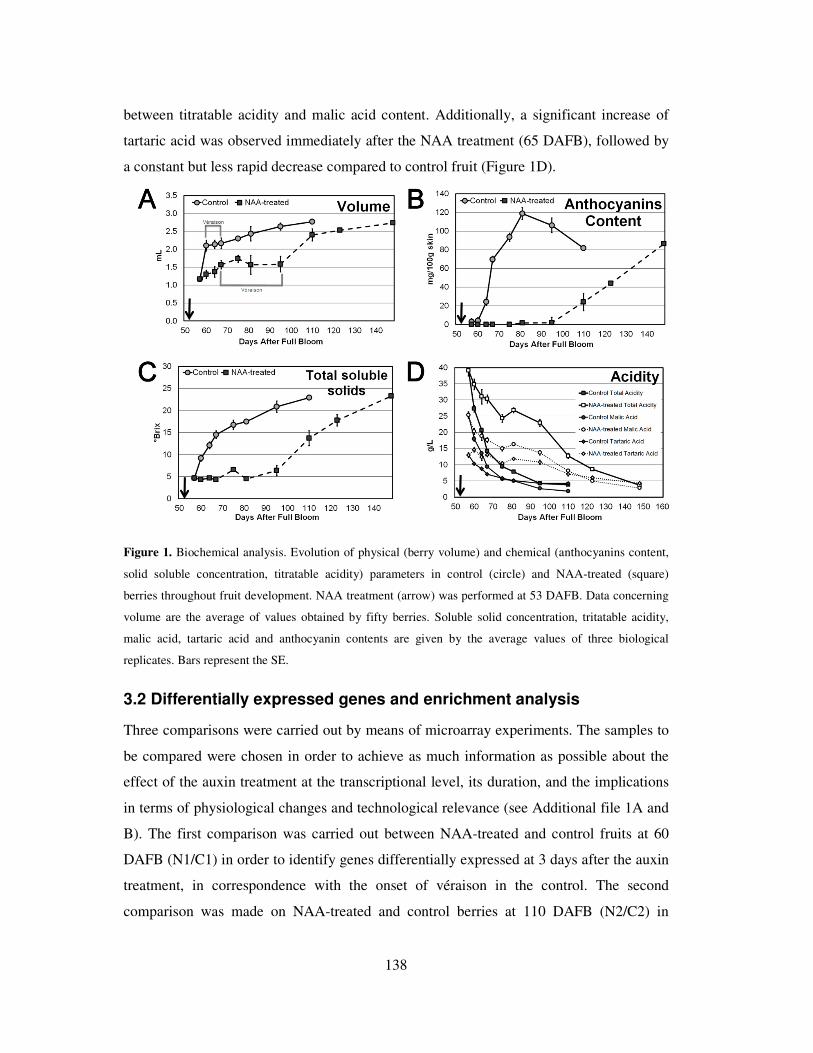
138
between titratable acidity and malic acid content. Additionally, a significant increase of
tartaric acid was observed immediately after the NAA treatment (65 DAFB), followed by
a constant but less rapid decrease compared to control fruit (Figure 1D).
Figure 1. Biochemical analysis. Evolution of physical (berry volume) and chemical (anthocyanins content,
solid soluble concentration, titratable acidity) parameters in control (circle) and NAA-treated (square)
berries throughout fruit development. NAA treatment (arrow) was performed at 53 DAFB. Data concerning
volume are the average of values obtained by fifty berries. Soluble solid concentration, tritatable acidity,
malic acid, tartaric acid and anthocyanin contents are given by the average values of three biological
replicates. Bars represent the SE.
3.2 Differentially expressed genes and enrichment analysis
Three comparisons were carried out by means of microarray experiments. The samples to
be compared were chosen in order to achieve as much information as possible about the
effect of the auxin treatment at the transcriptional level, its duration, and the implications
in terms of physiological changes and technological relevance (see Additional file 1A and
B). The first comparison was carried out between NAA-treated and control fruits at 60
DAFB (N1/C1) in order to identify genes differentially expressed at 3 days after the auxin
treatment, in correspondence with the onset of véraison in the control. The second
comparison was made on NAA-treated and control berries at 110 DAFB (N2/C2) in
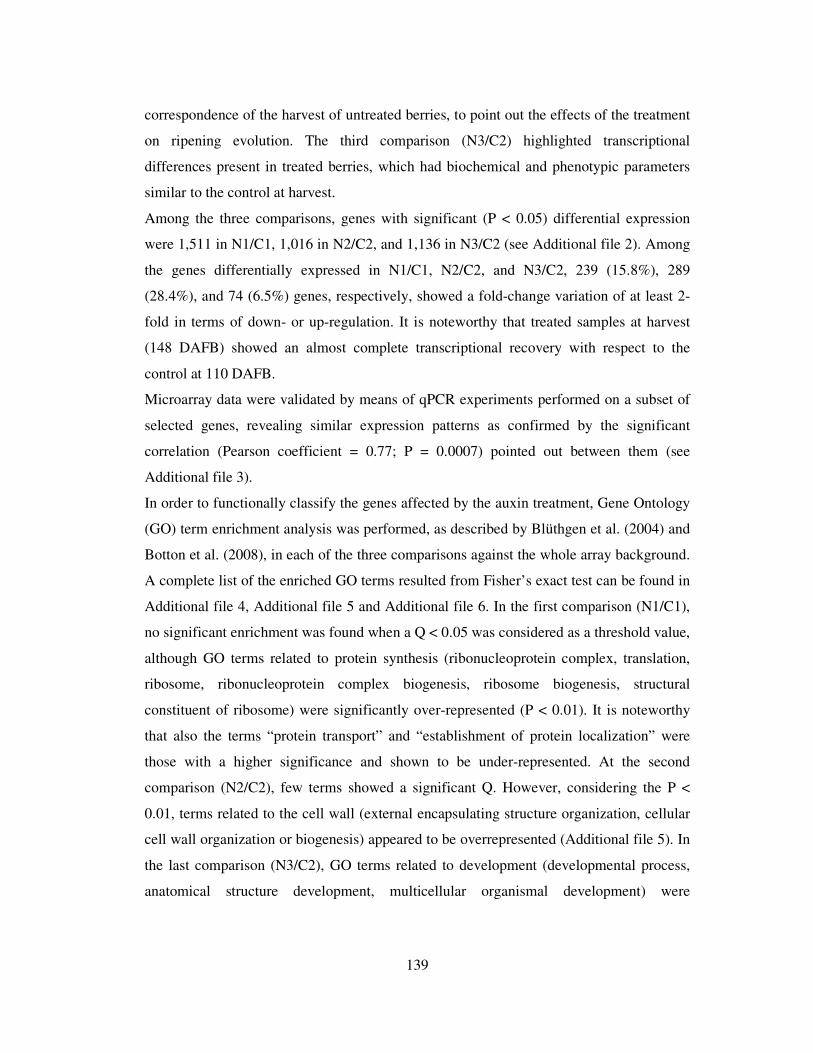
139
correspondence of the harvest of untreated berries, to point out the effects of the treatment
on ripening evolution. The third comparison (N3/C2) highlighted transcriptional
differences present in treated berries, which had biochemical and phenotypic parameters
similar to the control at harvest.
Among the three comparisons, genes with significant (P < 0.05) differential expression
were 1,511 in N1/C1, 1,016 in N2/C2, and 1,136 in N3/C2 (see Additional file 2). Among
the genes differentially expressed in N1/C1, N2/C2, and N3/C2, 239 (15.8%), 289
(28.4%), and 74 (6.5%) genes, respectively, showed a fold-change variation of at least 2-
fold in terms of down- or up-regulation. It is noteworthy that treated samples at harvest
(148 DAFB) showed an almost complete transcriptional recovery with respect to the
control at 110 DAFB.
Microarray data were validated by means of qPCR experiments performed on a subset of
selected genes, revealing similar expression patterns as confirmed by the significant
correlation (Pearson coefficient = 0.77; P = 0.0007) pointed out between them (see
Additional file 3).
In order to functionally classify the genes affected by the auxin treatment, Gene Ontology
(GO) term enrichment analysis was performed, as described by Blüthgen et al. (2004) and
Botton et al. (2008), in each of the three comparisons against the whole array background.
A complete list of the enriched GO terms resulted from Fisher’s exact test can be found in
Additional file 4, Additional file 5 and Additional file 6. In the first comparison (N1/C1),
no significant enrichment was found when a Q < 0.05 was considered as a threshold value,
although GO terms related to protein synthesis (ribonucleoprotein complex, translation,
ribosome, ribonucleoprotein complex biogenesis, ribosome biogenesis, structural
constituent of ribosome) were significantly over-represented (P < 0.01). It is noteworthy
that also the terms “protein transport” and “establishment of protein localization” were
those with a higher significance and shown to be under-represented. At the second
comparison (N2/C2), few terms showed a significant Q. However, considering the P <
0.01, terms related to the cell wall (external encapsulating structure organization, cellular
cell wall organization or biogenesis) appeared to be overrepresented (Additional file 5). In
the last comparison (N3/C2), GO terms related to development (developmental process,
anatomical structure development, multicellular organismal development) were
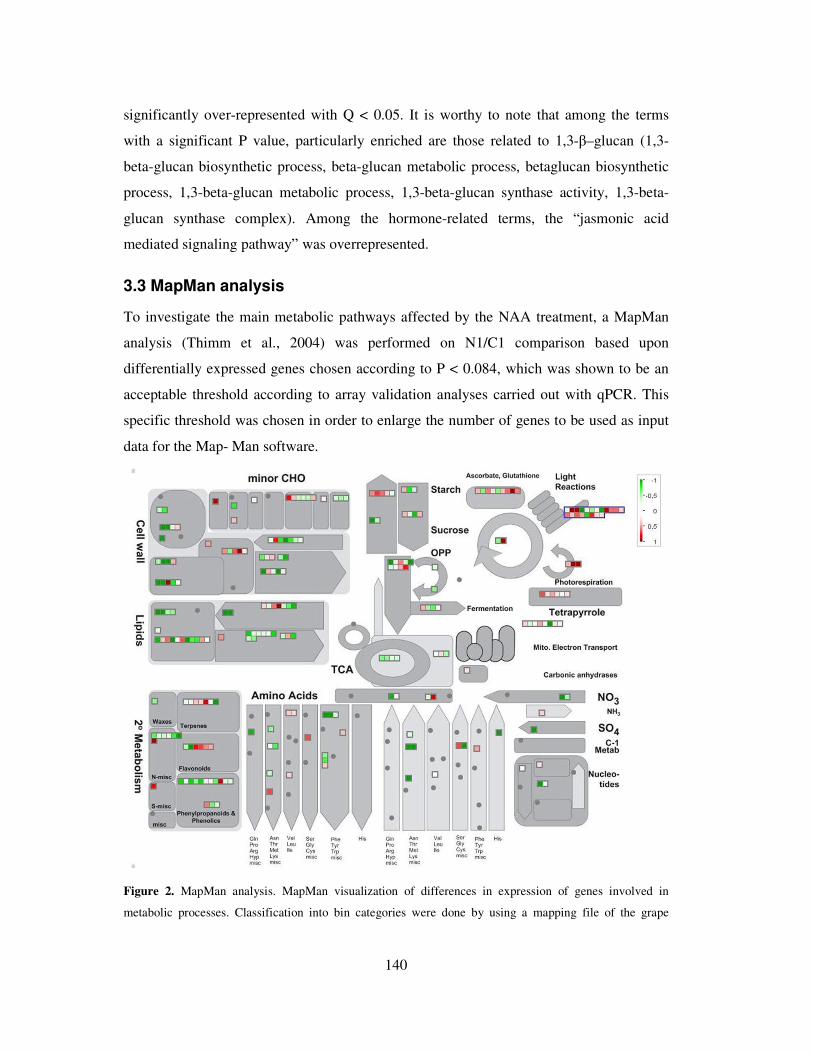
140
significantly over-represented with Q < 0.05. It is worthy to note that among the terms
with a significant P value, particularly enriched are those related to 1,3-β–glucan (1,3-
beta-glucan biosynthetic process, beta-glucan metabolic process, betaglucan biosynthetic
process, 1,3-beta-glucan metabolic process, 1,3-beta-glucan synthase activity, 1,3-beta-
glucan synthase complex). Among the hormone-related terms, the “jasmonic acid
mediated signaling pathway” was overrepresented.
3.3 MapMan analysis
To investigate the main metabolic pathways affected by the NAA treatment, a MapMan
analysis (Thimm et al., 2004) was performed on N1/C1 comparison based upon
differentially expressed genes chosen according to P < 0.084, which was shown to be an
acceptable threshold according to array validation analyses carried out with qPCR. This
specific threshold was chosen in order to enlarge the number of genes to be used as input
data for the Map- Man software.
Figure 2. MapMan analysis. MapMan visualization of differences in expression of genes involved in
metabolic processes. Classification into bin categories were done by using a mapping file of the grape
141
AROS V1.0 platform (http://mapman.gabipd.org/web). Heat maps show genes with statistically significant
(P value < 0.084) differential expression identified by comparing NAA-treated and control berries at 60
DAFB (N1/C1). A conventional red-to-green scale was used to indicate up-regulation (red) or down-
regulation (green).
MapMan pointed out that several metabolisms were down-regulated in NAA-treated
berries, such as those involving cell wall metabolism, carbohydrates, lipids, secondary
metabolites, and amino acids, with the only exception of the light reactions pathway that
showed a general up-regulation (Figure 2).
The cell wall and secondary metabolism bin categories, which were linked to the above
described biochemical parameters, were investigated. The cell wall category included
genes coding for pectin methyl esterase, endo- transglycosylase, polygalacturonase, and
expansin-like protein (Figure 2), whereas the secondary metabolism included genes
encoding alcohol dehydrogenase, phenylalanine ammonium lyase (phenylpropanoids and
phenolics pathway) and chalcone synthase (flavonoid pathway). Within this secondary
metabolism category, genes coding for ß-carotene hydroxylase (terpenes pathway) and
cynnamoyl-CoA reductase (flavonoid pathway) showed an up-regulation in NAA-treated
berries (Figure 2). Expression patterns of key genes involved in cell expansion and
phenylpropanoids pathway were validated in qPCR experiments carried out in all samples
(see Additional file 7). This validation analysis pointed out that the expression profiles of
selected genes (anthocyanins: CHS1, Vv_10010748; CHS3, Vv_10004167; F3H,
Vv_10003855; UFGT, Vv_10004481, MYB31, Vv17s0000g06190 and MYB4,
Vv4s0023g03710; cell wall metabolism: PG1, Vv_10003791, and EX1, Vv_10000426;
water uptake: TIP;2-like, Vv_10003817 and AQUA1, Vv_10003711), paralleled the
kinetics of anthocyanins content and berry volume (Figure 1), showing an early inhibitory
effect of the auxin treatment, followed by a recovery at harvest, when the treated samples
showed transcripts levels similar to the control.
A detailed list of genes with the respective bin codes belonging to each MapMan category
is reported in Additional file 8.
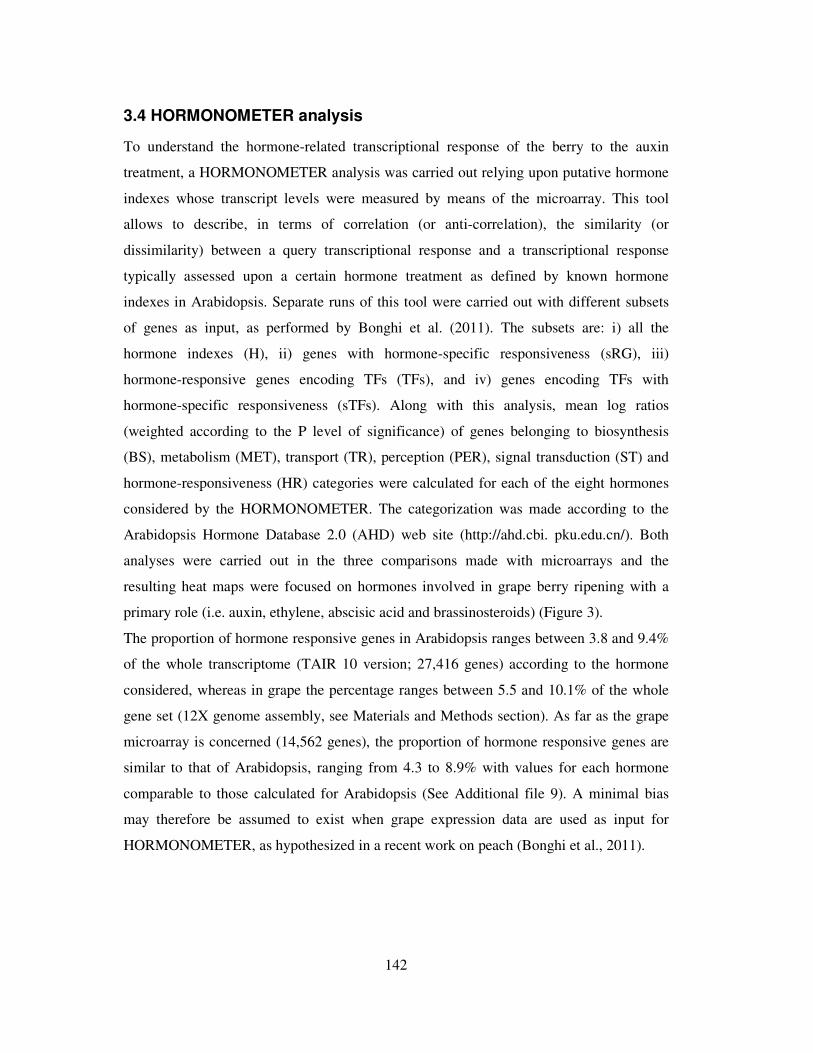
142
3.4 HORMONOMETER analysis
To understand the hormone-related transcriptional response of the berry to the auxin
treatment, a HORMONOMETER analysis was carried out relying upon putative hormone
indexes whose transcript levels were measured by means of the microarray. This tool
allows to describe, in terms of correlation (or anti-correlation), the similarity (or
dissimilarity) between a query transcriptional response and a transcriptional response
typically assessed upon a certain hormone treatment as defined by known hormone
indexes in Arabidopsis. Separate runs of this tool were carried out with different subsets
of genes as input, as performed by Bonghi et al. (2011). The subsets are: i) all the
hormone indexes (H), ii) genes with hormone-specific responsiveness (sRG), iii)
hormone-responsive genes encoding TFs (TFs), and iv) genes encoding TFs with
hormone-specific responsiveness (sTFs). Along with this analysis, mean log ratios
(weighted according to the P level of significance) of genes belonging to biosynthesis
(BS), metabolism (MET), transport (TR), perception (PER), signal transduction (ST) and
hormone-responsiveness (HR) categories were calculated for each of the eight hormones
considered by the HORMONOMETER. The categorization was made according to the
Arabidopsis Hormone Database 2.0 (AHD) web site (http://ahd.cbi. pku.edu.cn/). Both
analyses were carried out in the three comparisons made with microarrays and the
resulting heat maps were focused on hormones involved in grape berry ripening with a
primary role (i.e. auxin, ethylene, abscisic acid and brassinosteroids) (Figure 3).
The proportion of hormone responsive genes in Arabidopsis ranges between 3.8 and 9.4%
of the whole transcriptome (TAIR 10 version; 27,416 genes) according to the hormone
considered, whereas in grape the percentage ranges between 5.5 and 10.1% of the whole
gene set (12X genome assembly, see Materials and Methods section). As far as the grape
microarray is concerned (14,562 genes), the proportion of hormone responsive genes are
similar to that of Arabidopsis, ranging from 4.3 to 8.9% with values for each hormone
comparable to those calculated for Arabidopsis (See Additional file 9). A minimal bias
may therefore be assumed to exist when grape expression data are used as input for
HORMONOMETER, as hypothesized in a recent work on peach (Bonghi et al., 2011).
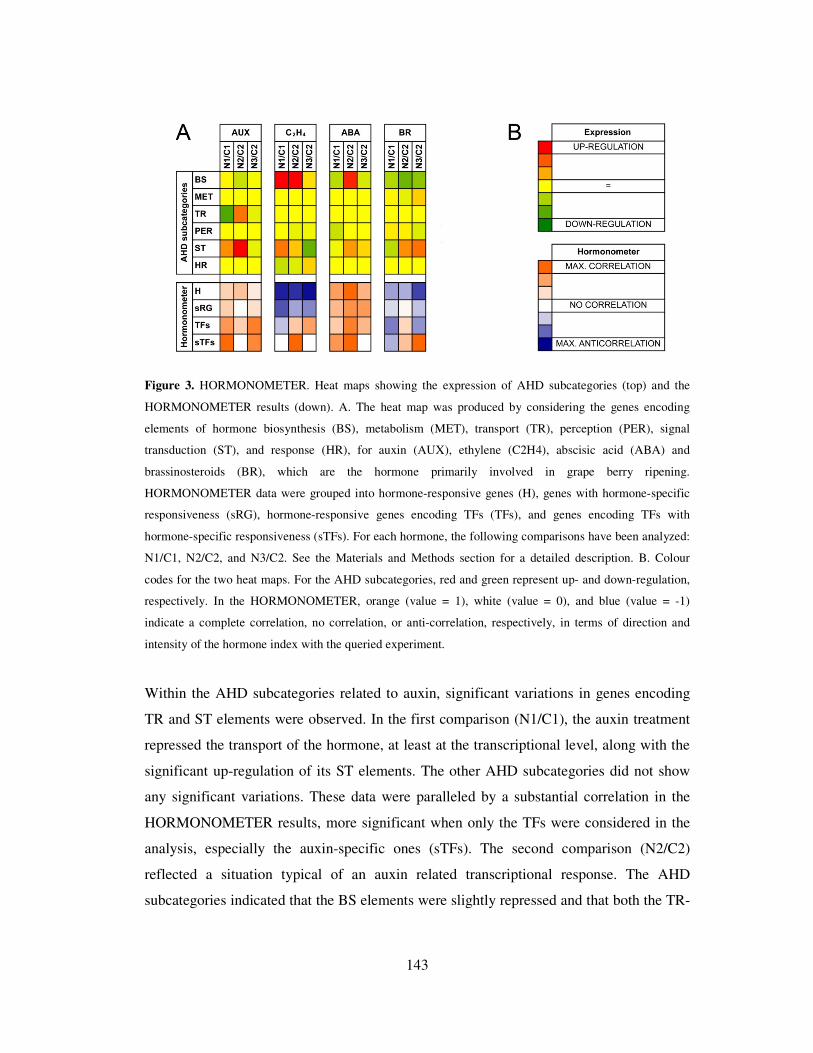
143
Figure 3. HORMONOMETER. Heat maps showing the expression of AHD subcategories (top) and the
HORMONOMETER results (down). A. The heat map was produced by considering the genes encoding
elements of hormone biosynthesis (BS), metabolism (MET), transport (TR), perception (PER), signal
transduction (ST), and response (HR), for auxin (AUX), ethylene (C2H4), abscisic acid (ABA) and
brassinosteroids (BR), which are the hormone primarily involved in grape berry ripening.
HORMONOMETER data were grouped into hormone-responsive genes (H), genes with hormone-specific
responsiveness (sRG), hormone-responsive genes encoding TFs (TFs), and genes encoding TFs with
hormone-specific responsiveness (sTFs). For each hormone, the following comparisons have been analyzed:
N1/C1, N2/C2, and N3/C2. See the Materials and Methods section for a detailed description. B. Colour
codes for the two heat maps. For the AHD subcategories, red and green represent up- and down-regulation,
respectively. In the HORMONOMETER, orange (value = 1), white (value = 0), and blue (value = -1)
indicate a complete correlation, no correlation, or anti-correlation, respectively, in terms of direction and
intensity of the hormone index with the queried experiment.
Within the AHD subcategories related to auxin, significant variations in genes encoding
TR and ST elements were observed. In the first comparison (N1/C1), the auxin treatment
repressed the transport of the hormone, at least at the transcriptional level, along with the
significant up-regulation of its ST elements. The other AHD subcategories did not show
any significant variations. These data were paralleled by a substantial correlation in the
HORMONOMETER results, more significant when only the TFs were considered in the
analysis, especially the auxin-specific ones (sTFs). The second comparison (N2/C2)
reflected a situation typical of an auxin related transcriptional response. The AHD
subcategories indicated that the BS elements were slightly repressed and that both the TR-

144
and ST-related genes were significantly up-regulated. This may be interpreted as a typical
homeostatic response, confirmed by the HORMONOMETER results, which indicated a
general unspecific correlation between auxin target expression and the typical auxinrelated
transcriptional response. In the last comparison (N3/C2), the AHD categories were very
stable and the HORMONOMETER analysis still pointed out an active transcriptional
response to auxin, with a significant correlation for the TFs and sTFs subsets, suggesting
that the response to the hormone may have involved mainly auxin specific transcription
factors.
As concerns ethylene, interesting data were observed regarding both the AHD
subcategories and the HORMONOMETER results. As far as the biosynthetic genes are
concerned, a strong up-regulation was found in the second comparison (N2/C2), whereas
data in the other two cases were less significant. The ST-related transcription showed a
significant variation in all comparisons, being stimulated in the first and second (N1/ C1
and N2/C2, respectively), and repressed in the third (N3/C2). Significant variations were
observed also in the HR genes, which were down-regulated in all cases except the N3/C2
comparison. The HORMONOMETER analysis showed a strong and broad anti-
correlation in all situations when all genes and the ethylene-specific ones (sRG) were
considered. An almost reversed situation was observed in the other subsets (TFs and
sTFs), except for the first comparison (N1/C1) that still showed an anti-correlation and no
correlation, for TFs and sTFs, respectively. In N2/C2, a stronger correlation was found for
sTFs than for TFs, whereas in the third comparison no correlation was found for the
hormone-specific TFs.
Genes coding for BS elements of abscisic acid (ABA), were down-regulated at N1/C1
comparison, while in the N2/C2 comparison they were up-regulated. A weak
transcriptional repression was found for genes encoding PER elements in the first
comparisons, although with low significance. A stimulation of transcription was found in
ST-related genes that paralleled that of BS. The HORMONOMETER showed a general
correlation in all subsets and all situations, without, however, any ABA-specificity.
The brassinosteroids category showed significant data in both the analyses (AHD
subcategories and HORMONOMETER). BS-related genes varied significantly in all three
comparisons, with a down-regulation trend in all cases. Slight, but not significant,
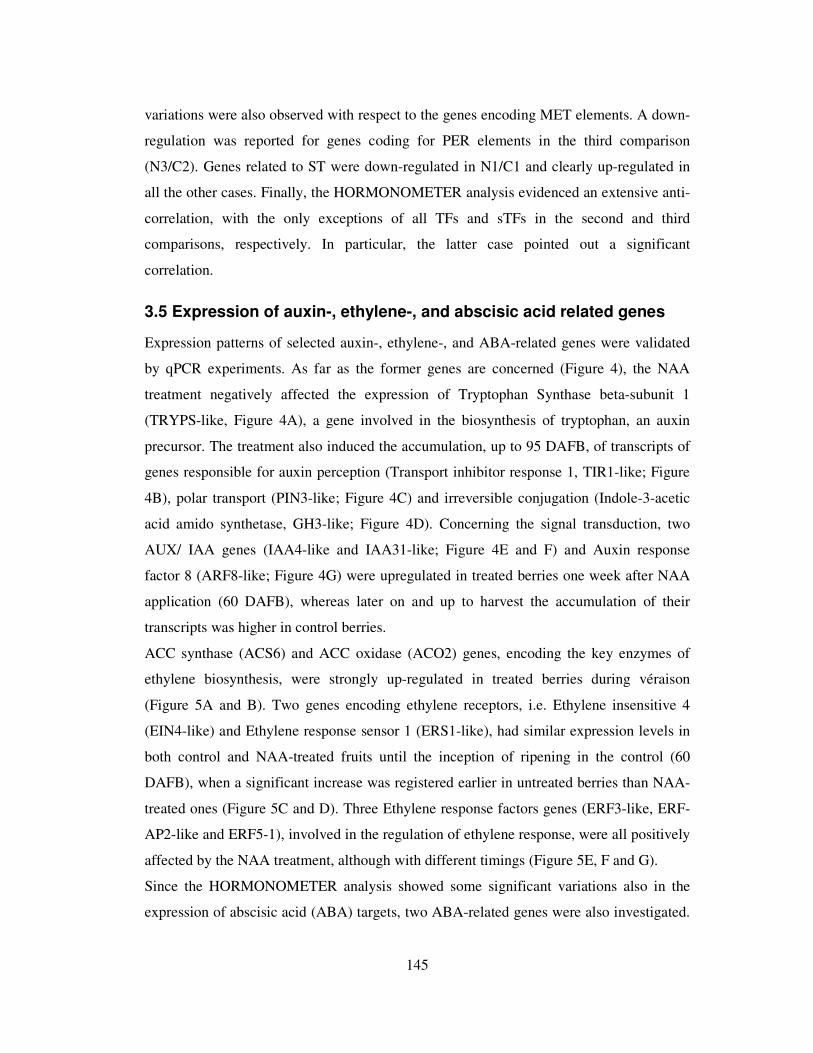
145
variations were also observed with respect to the genes encoding MET elements. A down-
regulation was reported for genes coding for PER elements in the third comparison
(N3/C2). Genes related to ST were down-regulated in N1/C1 and clearly up-regulated in
all the other cases. Finally, the HORMONOMETER analysis evidenced an extensive anti-
correlation, with the only exceptions of all TFs and sTFs in the second and third
comparisons, respectively. In particular, the latter case pointed out a significant
correlation.
3.5 Expression of auxin-, ethylene-, and abscisic acid related genes
Expression patterns of selected auxin-, ethylene-, and ABA-related genes were validated
by qPCR experiments. As far as the former genes are concerned (Figure 4), the NAA
treatment negatively affected the expression of Tryptophan Synthase beta-subunit 1
(TRYPS-like, Figure 4A), a gene involved in the biosynthesis of tryptophan, an auxin
precursor. The treatment also induced the accumulation, up to 95 DAFB, of transcripts of
genes responsible for auxin perception (Transport inhibitor response 1, TIR1-like; Figure
4B), polar transport (PIN3-like; Figure 4C) and irreversible conjugation (Indole-3-acetic
acid amido synthetase, GH3-like; Figure 4D). Concerning the signal transduction, two
AUX/ IAA genes (IAA4-like and IAA31-like; Figure 4E and F) and Auxin response
factor 8 (ARF8-like; Figure 4G) were upregulated in treated berries one week after NAA
application (60 DAFB), whereas later on and up to harvest the accumulation of their
transcripts was higher in control berries.
ACC synthase (ACS6) and ACC oxidase (ACO2) genes, encoding the key enzymes of
ethylene biosynthesis, were strongly up-regulated in treated berries during véraison
(Figure 5A and B). Two genes encoding ethylene receptors, i.e. Ethylene insensitive 4
(EIN4-like) and Ethylene response sensor 1 (ERS1-like), had similar expression levels in
both control and NAA-treated fruits until the inception of ripening in the control (60
DAFB), when a significant increase was registered earlier in untreated berries than NAA-
treated ones (Figure 5C and D). Three Ethylene response factors genes (ERF3-like, ERF-
AP2-like and ERF5-1), involved in the regulation of ethylene response, were all positively
affected by the NAA treatment, although with different timings (Figure 5E, F and G).
Since the HORMONOMETER analysis showed some significant variations also in the
expression of abscisic acid (ABA) targets, two ABA-related genes were also investigated.
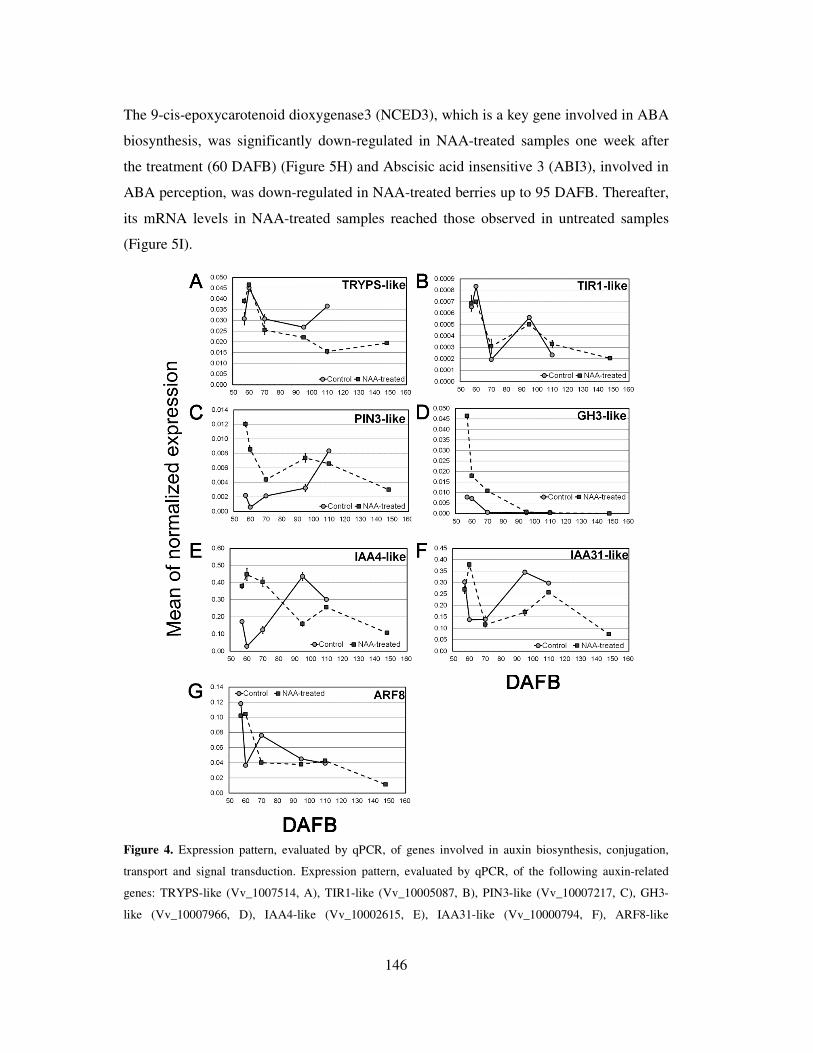
146
The 9-cis-epoxycarotenoid dioxygenase3 (NCED3), which is a key gene involved in ABA
biosynthesis, was significantly down-regulated in NAA-treated samples one week after
the treatment (60 DAFB) (Figure 5H) and Abscisic acid insensitive 3 (ABI3), involved in
ABA perception, was down-regulated in NAA-treated berries up to 95 DAFB. Thereafter,
its mRNA levels in NAA-treated samples reached those observed in untreated samples
(Figure 5I).
Figure 4. Expression pattern, evaluated by qPCR, of genes involved in auxin biosynthesis, conjugation,
transport and signal transduction. Expression pattern, evaluated by qPCR, of the following auxin-related
genes: TRYPS-like (Vv_1007514, A), TIR1-like (Vv_10005087, B), PIN3-like (Vv_10007217, C), GH3-
like (Vv_10007966, D), IAA4-like (Vv_10002615, E), IAA31-like (Vv_10000794, F), ARF8-like
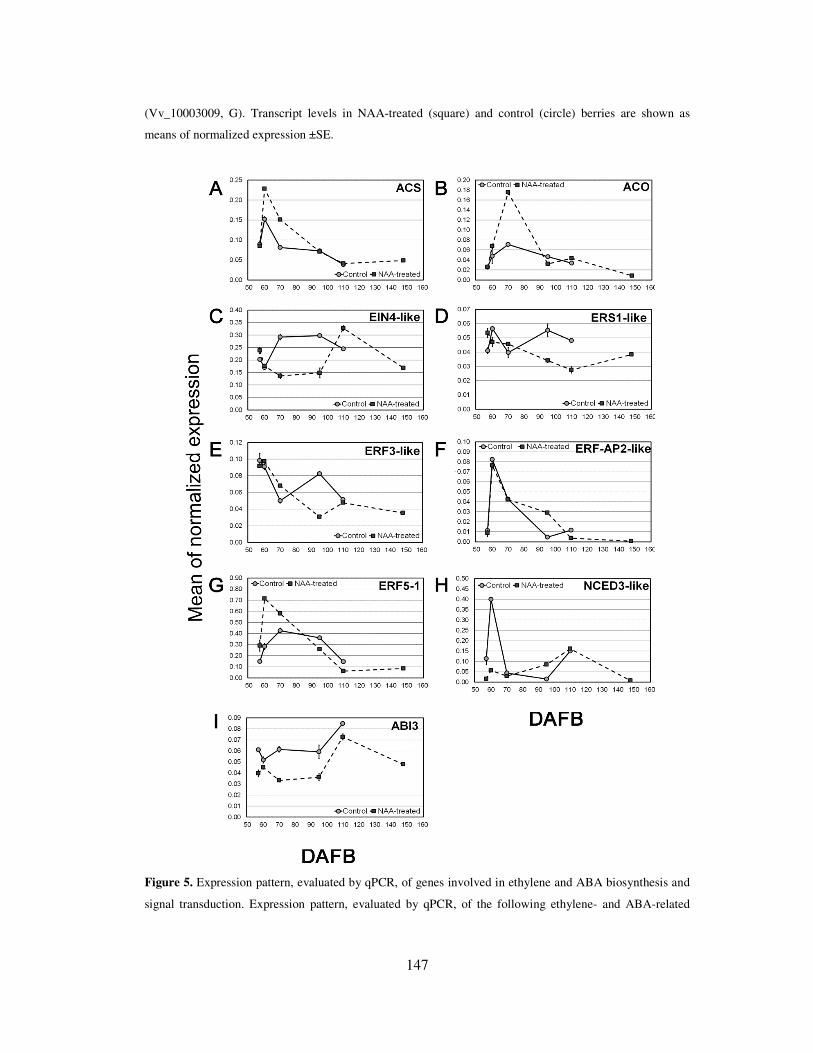
147
(Vv_10003009, G). Transcript levels in NAA-treated (square) and control (circle) berries are shown as
means of normalized expression ±SE.
Figure 5. Expression pattern, evaluated by qPCR, of genes involved in ethylene and ABA biosynthesis and
signal transduction. Expression pattern, evaluated by qPCR, of the following ethylene- and ABA-related

148
genes: ACS6 (Vv_10001614), ACO2 (Vv_10004370), EIN4-like (Vv_10010357), ERS1-like
(Vv_10007917), ERF3-like (Vv_10001775), ERF-AP2-like (Vv_10000332), ERF5-1 (Vv_10001287),
NCED3 (Vv_10009127), ABI3 (Vv_10001065). Transcript levels in NAA-treated (square) and control
(circle) berries are shown as means of normalized expression ±SE.
149
4. Discussion
A ripening delay caused by the application of auxins has been previously recorded both in
climacteric and nonclimacteric fruits (Cohen et al., 1996; Davies et al., 1997). In
grapevine, a ripening delay induced by the application of natural or synthetic auxins,
including NAA, to berries before véraison was observed in a large range of cultivars
(Jeong et al., 2004; Detyeux-Belleau et al., 2007). Results presented in this study
confirmed that NAA, applied at the prevéraison stage, strongly delays ripening inception
in cv. Merlot (Figure 1). All the parameters used to monitor the ripening progression (in
particular berry volume, SSC, and titratable acidity), with the exception of the initial delay
occurring in the treated berries, showed overlapping kinetics in both treated and untreated
fruit. These data suggest that the auxin treatment caused just a shift in the initiation of
ripening, as already hypothesized by Böttcher et al. (2010). This observation is also
confirmed by the microarray data analysis, which showed a decreasing number of
differentially expressed genes throughout the experiment (see Additional file 2). At the
véraison of control fruit (60 DAFB), MapMan analysis clearly shows that NAA
application down-regulated genes involved in cell expansion (cell wall metabolism and
water uptake) and secondary metabolism, in particular those responsible for flavonoids
biosynthesis (Figure 2), consistently with the biochemical analyses. This repressive effect
remained well evident up to 110 DAFB, whereas a partial recovery was observed
thereafter, as already reported by Davies et al. (1997) and Jeong et al. (2004). At harvest
of NAA-treated berries (148 DAFB), the transcription level of genes involved in the
flavonoids biosynthetic pathway was still enhanced with respect to the control fruit at
harvest, while a full recovery was observed for those involved in cell wall metabolism and
water uptake (see Additional file 7). These observations show that NAA is more effective
in counteracting the accumulation of flavonoids rather than berry expansion, as
demonstrated by Böttcher et al. (2011).
Both in control and treated fruits there is a clear coordination of the transcriptional
regulation of genes determining cell expansion (i.e. EX1 and PG1) and turgor (i.e. Pip1),
in agreement with the model for cell expansion proposed by Cosgrove (1997), especially
during the early post-treatment phases and up to 95 DAFB. During this phase, the NAA
treatment clearly repressed the genes involved in both processes, which was consistent
150
with the berry volume measures and thus reflecting an almost exclusive transcriptional
control of berry expansion. An inversion of this trend and a complete recovery to the
levels of the control was observed thereafter (after 95 DAFB), although not correlated
with the faster volume increase occurring in treated berries to reach a final volume at
harvest equal to that of the control fruits. This may be due to different mechanisms
controlling berry expansion other than the auxin-controlled transcription, most likely at
posttranscriptional level, as previously demonstrated for aquaporins whose gating
behaviour can be affected by phosphorylation, heteromerization, pH, Ca2+, pressure,
solute gradients and temperature (Chaumont et al. 2005). Regulation of aquaporin
trafficking may also represent a way to modulate membrane water permeability. Taken
together, these data indicate that the berry expansion process is under the control of
multiple regulatory pathways, involved according to a well-defined developmentally-
programmed chronological sequence.
To shed light on the role of auxin and its cross-talk with other hormones in the regulation
of berry ripening, a specific analysis was carried out on hormone-related genes by using
the HORMONOMETER bioinformatic platform (Volodarsky et al., 2009). This was
paralleled by a merged analysis of specific gene categories (i.e. the AHD categories). This
approach allowed to set up a hypothetical model describing what happened in terms of
auxin-related response after the NAA treatment (Figure 4). The application of NAA
caused an excessive availability of auxin, most likely counterbalanced by homeostatic
mechanisms involving synthesis, breakdown, conjugation and transport (Perrot-
Rechenmann and Napier, 2005; Woodward and Bartel, 2005). However, at 60 DAFB
auxin biosynthesis and metabolism gene categories did not differ significantly between
control and treated samples, transport was generally repressed, and an auxin-specific
transcriptional response was seen along with a general activation of signal transduction
elements. Therefore, it is likely that the homeostatic mechanisms had already been
activated within the first 7 days after the treatment. This hypothesis is supported by qPCR
expression data, especially those related to GH3-like, IAA4-like, and IAA31- like genes
(Figure 5D, E, F). In NAA-treated berries at 57 DAFB, the first of these three auxin-
related genes was expressed 6-fold higher compared to the control, then its expression
decreased to just 2.5-fold at 60 DAFB, followed by a constantly decreasing trend leading
151
to the same levels measured in the control at 95 DAFB. GH3 (Gretchen Hagen 3) genes,
specifically those belonging to group II (Staswick et al., 2005), encode enzymes that
conjugate IAA to amino acids. Interestingly, it has been recently shown that GH3.1 plays
a role in the formation of IAAAspartate at the onset of grape berry ripening, and it
positively responds to the combined application of ABA and sucrose, and to ethylene,
linking it to the control of ripening processes (Böttcher et al., 2011). Nevertheless, both
the IAA genes showed well-correlated diverging trends from 57 up to 60 DAFB, with the
highest differences pointed out in the latter time point, coinciding also with the highest
level of their expression in NAA-treated berries. Also the ARF8-like gene showed the
largest divergence at 60 DAFB and the HORMONOMETER data indicate a very active
transcriptional control compatible with an auxinspecific response. The expression patterns
of these four genes along with the HORMONOMETER data and the overall physiological
response indicate that biologically active concentrations of auxin were achieved
throughout a homeostatic recovery occurring within 7 days after the treatment, during
which the physiological response is mainly unspecific and due to a likely pharmacological
effect of NAA. During this period, conjugation and transport may contribute to a decrease
in the auxin levels, leading to the same range of concentration that can be found before
ripening inception, thus generating a developmental block. This block is most likely
mediated by a primary auxin signaling, whose main players include the IAAs and the
ARFs, as their expression patterns indicate. At 110 DAFB, an overall repression of
biosynthetic genes along with a stimulation of those coding for TR and ST elements was
observed in NAA-treated samples.
The HORMONOMETER indicates the activation of specific gene targets that were not
auxin-specific, although they were compatible with still biologically active auxin levels.
In this phase, a likely secondary homeostatic response was occurring, mainly at the level
of biosynthesis as shown by the repression of upstream auxin BS genes such as TRYPS-
like. The primary transcriptional response achieved within 110 DAFB triggered the
recovery cascade that was active also thereafter, as demonstrated by biochemical
parameters. However, at this stage the biological meaning of the homeostatic recovery is
different from that occurring before 60 DAFB. It is likely that the early homeostatic
reaction was just aimed at detoxifying from high auxin concentrations, whereas that
152
occurring at 110 DAFB was a symptom of a normal ripening progression resembling the
natural ripening inception during which auxin levels were shown to decrease (Böttcher et
al., 2011). Some auxin-specific targets, mainly TF encoding, were shown to be active up
to 148 DAFB, most likely triggering the transcriptional regulation of genes, such as CHS1
and F3H that were shown to be down-regulated (see Additional file 7, A and C). At this
stage, however, the overall transcriptional response was scarce since berry ripening was
definitely accomplished, as shown by the physiological and biochemical parameters.
Fluctuations in auxin levels and response were shown to be correlated with ripening
progression and a possible mechanism was hypothesized to explain how the berry reacts
to the NAA treatment, but how does auxin action link to other hormones, such as ethylene,
ABA, and brassinosteroids, that are known to regulate the same developmental processes?
The HORMONOMETER analysis may help to explain this aspect, especially considering
the first comparison (N1/C1), in which the existence of a strong antagonistic effect
between auxin and ethylene and, to a lesser extent, a substantial ‘synergism’ between
auxin and ABA were shown. Both these aspects were quite marked for both the whole
subset of transcriptional indexes (H) and the specific ones (sRG). The transient positive
effect of NAA on the transcription of ACS6 and ACO2 genes (Figure 5A and B), already
measured in other fruits (Barry et al., 2000; Trainotti et al., 2007; El-Sharkawy et al.,
2008), may be interpreted as a part of the secondary homeostatic reaction to the auxin
treatment, as described above. As such, the transient increase of ethylene biosynthesis
specifically induced by biologically active auxin concentrations would counteract the
excess of auxin by activating downstream mechanisms, in this case related to the
biosynthesis of the hormone (i.e. the TRYPS gene), thus releasing the berry from the
developmental block.
According to the Arabidopsis model of ethylene signaling, reduced expression and activity
of receptors increase sensitivity to ethylene, whereas increased receptor expression and
activity decrease sensitivity (Lin et al., 2009). It is also known that ethylene receptors act
in cooperation, according to mutual, but often unique roles, thus differentially regulating
ethylene responses and giving diverse outputs according to the receptor complex
combination (Liu et al., 2012). Furthermore, in Arabidopsis, EIN4 was shown to have a
unique role in ethylene signaling (Hua et al., 1998; Cancel et al., 2002) and a synergistic
153
effect on ers1 function, as it is required to maintain ethylene insensitivity in an ers1
background (Liu et al., 2012). Taking into account these data, a relevant role during grape
berry ripening may be played by the putative AtEIN4 orthologue, as the corresponding
gene was expressed in a ripening-dependent manner, with increasing levels after véraison,
measured both in the control and NAA-treated samples (Figure 5C). Also an ERS1-like
gene showed similar expression patterns, although shifted ahead (Figure 5D). Similar
transcriptional behaviors were reported also by Deluc et al. (2007) and Chervin and Deluc
(2010) along with a peak of ethylene biosynthesis, and may be consistent with a higher
sensitivity to the hormone at véraison (delayed by the auxin treatment), which decreases
thereafter throughout ripening.
The effect of auxin on genes involved in ethylene response was very weak, as seen in both
the AHD and the HORMONOMETER analyses (Figure 3), with the exception of an
ERF5-1 gene, which was significantly up-regulated at 60 DAFB (Figure 5G). A
significant correlation was observed between the expression patterns of this gene and
ACS6, leading to the hypothesis that ERF5-1 may mediate the auxin-induced up-
regulation of ethylene biosynthetic genes in grape. This hypothesis is currently being
investigated with dedicated experimental trials in order to shed light on the crosstalk
between these two hormones, which is crucial for grape berry development and ripening.
Although the NAA treatment caused a general stimulation of ethylene biosynthesis and
action, a negative effect on the transcription of genes involved in flavonoids biosynthesis,
cell wall metabolism and water uptake, previously shown to be ethylene-related (El-
Kereamy et al., 2003; Chervin et al., 2008), was observed. Several studies have examined
the interactions between auxin and ethylene at the transcriptional level and different
models were proposed (Stepanova et al., 2007; Lewis et al., 2011; Muday et al., 2012).
Taking into account this information, the effect of NAA may have bypassed the primary
level of crosstalk between the two hormones, resulting into the activation of only some
targets in common with ethylene that may belong to the secondary crosstalk. Consistent
with this possibility, the upstream regulatory regions of many genes induced by auxin and
ethylene were shown to contain putative auxin response element (AuxRE) and ethylene
response element (ERE) sequences, which are sites for ARF and EIN3/EIL binding,
respectively (Lewis et al., 2011). Future studies should specifically address this aspect.
154
The existence of a synergism between auxin and ABA was unexpected taking into account
the opposite roles previously claimed for these hormones in the regulation of grape berry
ripening (Davies et al., 2009). These data, however, may indicate that the
HORMOMETER analysis is able to reveal a previously unappreciated selectivity of auxin
towards the regulation of ABA-related processes, as already reported by Volodarsky et al.
(2009) for salicylic acid and auxin. In fact, data presented here pointed out that auxin
down-regulated the genes involved in ABA biosynthesis (Figure 5H), while the signal
transduction pathway elements were substantially unaffected or stimulated (see Additional
file 2). These ambiguous outcomes were already pointed out in previous studies revealing
that ABA and auxin signaling pathways belong to a very complex regulatory network with
unexpected features (Nemhauser et al., 2006).
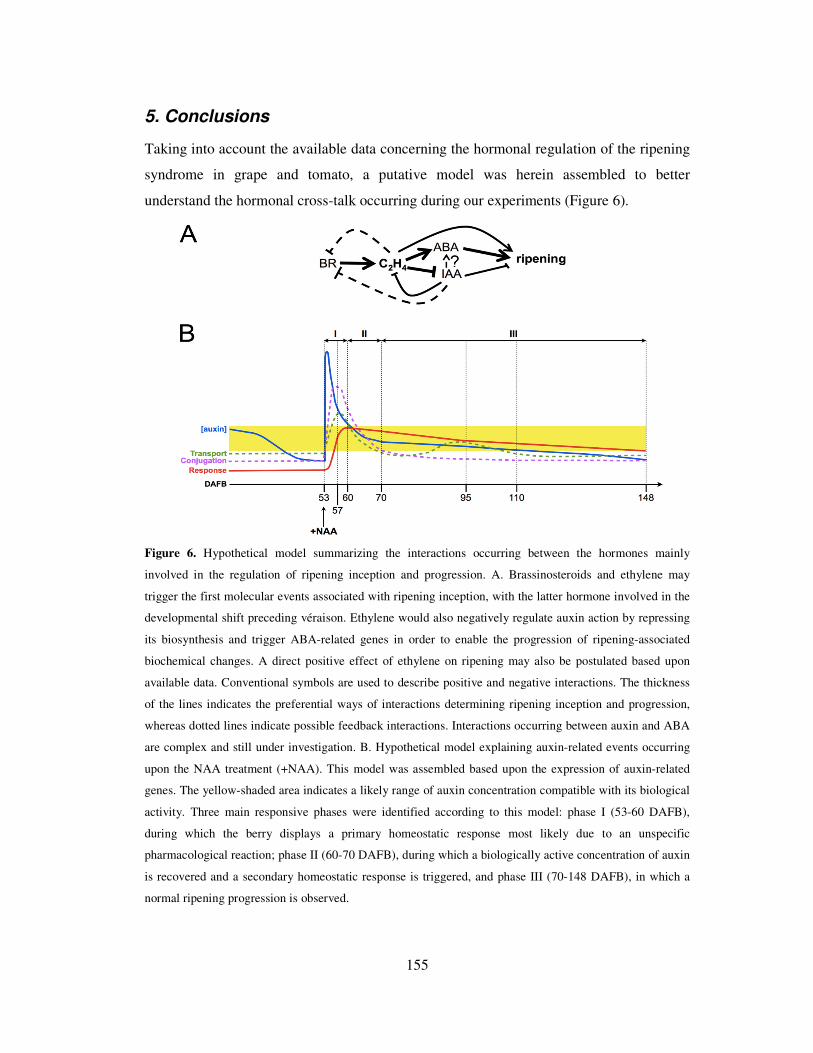
155
5. Conclusions
Taking into account the available data concerning the hormonal regulation of the ripening
syndrome in grape and tomato, a putative model was herein assembled to better
understand the hormonal cross-talk occurring during our experiments (Figure 6).
Figure 6. Hypothetical model summarizing the interactions occurring between the hormones mainly
involved in the regulation of ripening inception and progression. A. Brassinosteroids and ethylene may
trigger the first molecular events associated with ripening inception, with the latter hormone involved in the
developmental shift preceding véraison. Ethylene would also negatively regulate auxin action by repressing
its biosynthesis and trigger ABA-related genes in order to enable the progression of ripening-associated
biochemical changes. A direct positive effect of ethylene on ripening may also be postulated based upon
available data. Conventional symbols are used to describe positive and negative interactions. The thickness
of the lines indicates the preferential ways of interactions determining ripening inception and progression,
whereas dotted lines indicate possible feedback interactions. Interactions occurring between auxin and ABA
are complex and still under investigation. B. Hypothetical model explaining auxin-related events occurring
upon the NAA treatment (+NAA). This model was assembled based upon the expression of auxin-related
genes. The yellow-shaded area indicates a likely range of auxin concentration compatible with its biological
activity. Three main responsive phases were identified according to this model: phase I (53-60 DAFB),
during which the berry displays a primary homeostatic response most likely due to an unspecific
pharmacological reaction; phase II (60-70 DAFB), during which a biologically active concentration of auxin
is recovered and a secondary homeostatic response is triggered, and phase III (70-148 DAFB), in which a
normal ripening progression is observed.
156
According to this working model, which is currently being validated, brassinosteroids
(BR) may start the cascade of events leading to ripening by increasing ethylene levels, as
reported in tomato (Vardhini et al., 2002). It is known that a dramatic increase in
endogenous BR levels occurs at the onset of fruit ripening in grape (Symons et al., 2006)
and that also an ethylene peak is measurable just before véraison (Chervin et al., 2004).
Moreover, ethylene seems to repress BR-regulated genes once ripening is triggered
(Tonutti et al., unpublished data), thus indicating a possible feedback mechanism allowing
a time progression of the syndrome through the coordination of the downstream events.
According to this view, ethylene may play a central role in ripening inception. On one
hand, it acts independently and directly on the activation of ripening-associated processes,
such as those related to cell wall modifications (Chervin et al., 2008), and on the other
hand it cooperates with ABA to indirectly trigger several biochemical changes associated
with ripening, such as berry coloration (El-Kereamy et al., 2003; Sun et al., 2010). It also
represses auxin biosynthesis, thus releasing the berry from the developmental block
exerted by this hormone (Böttcher et al., 2010). When the NAA treatment was performed,
the berry was most likely undergoing this developmental shift controlled by ethylene,
which was still reversible. Therefore, the transient increase in auxin levels imposed by the
exogenous treatment caused a reversion by counterbalancing the developmental control
exerted by ethylene, thus leading the berry back to the pre-véraison stage with a
consequent delay of the ripening progression.
6. Acknowledgements
The authors would like to thank Angelo Ramina and Aiman Jajo for helpful comments
and critical reading of the manuscript. This study was supported by the Progetto AGER
“SERRES”, grant n° 2010-2105.
157
7. References
Barry CS, Llop-Tous MI, Grierson D. 2000. The regulation of 1- aminocyclopropane-1-
carboxylic acid synthase gene expression during the transition from system-1 to system-2
ethylene synthesis in tomato. Plant Physiology, 123:979–986.
Blüthgen N, Brand K, Cajavec B, Swat M, Herzel H, Beule D. 2004. Biological
profiling of gene groups utilizing gene ontology – A statistical framework. Bioinformatics,
2118.:3674–3676.
Bonghi C, Trainotti L, Botton A, Tadiello A, Rasori A, Ziliotto F, Zaffalon V,
Casadoro G, Ramina A. 2011. A microarray approach to identify genes involved in seed-
pericarp cross-talk and development in peach. BMC Plant Biology, 11:107.
Böttcher C, Boss PK, Davies C. 2011. Acyl substrate preferences of an IAA-amido
synthetase account for variations in grape Vitis vinifera L.. berry ripening caused by
different auxinic compounds indicating the importance of auxin conjugation in plant
development. Journal of Experimental Botany, 62:4267–4280.
Böttcher C, Harvey K, Forde CG, Boss PK, Davies C. 2010. Auxin treatment of
preveraison grape Vitis vinifera L.. berries both delays ripening and increases the
synchronicity of sugar accumulation. Aust J Grape Wine R, 17:1–8.
Böttcher C, Keyzers RA, Boss PK, Davies C. 2010. Sequestration of auxin by the
indole-3-acetic acid-amido synthetase GH3-1 in grape berry Vitis vinifera L.. and the
proposed role of auxin conjugation during ripening. Journal of Experimental Botany,
61:3615–3625.
Botton A, Eccher G, Forcato C, Ferrarini A, Begheldo M, Zermiani M, Moscatello S,
Battistelli A, Velasco R, Ruperti B, Ramina A. 2011. Signaling pathways mediating the
induction of apple fruitlet abscission. Plant Physiology, 155:185–208.
Botton A, Galla G, Conesa A, Bachem C, Ramina A, Barcaccia G. 2008. Large-scale
Gene Ontology analysis of plant transcriptome-derived sequences retrieved by AFLP
technology. BMC Genomics, 9:347–366.
Brazma A, Hingamp P, Quackenbush J, Sherlock G, Spellman P, Stoeckert C, Aach
J, Ansorge W, Ball CA, Causton HC, Gaasterland T, Glenisson P, Holstege FC, Kim
IF, Markowitz V, Matese JC, Parkinson H, Robinson A, Sarkans U, Schulze-Kremer
S, Stewart J, Taylor R, Vilo J, Vingron M. 2001. Minimum information about a
microarray experiment MIAME. – toward standards for microarray data. Nat Genet,
29:365–371.
158
Cancel JD, Larsen PB. 2002. Loss-of-function mutations in the ethylene receptor ETR1
cause enhanced sensitivity and exaggerated response to ethylene in Arabidopsis. Plant
Physiology, 129:1557–1567.
Carreño J, Martinez A, Almela L, Fernández-López JA. 1995. Proposal of an index
for the objective evaluation of the color of red table grapes. Food Res Int, 28:373–377.
Castellarin SD, Pfeiffer A, Sivilotti P, Degan M, Peterlunger E, Di Gaspero G. 2007.
Transcriptional regulation of anthocyanin biosynthesis in ripening fruits of grapevine
under seasonal water deficit. Plant, Cell & Environment, 3011.:1381–1399.
Chae HS, Cho YG, Park MY, Lee MC, Eun MY, Kang BG, Kim WT. 2000.
Hormonal cross-talk between auxin and ethylene differentially regulates the expression of
two members of the 1-aminocyclopropane-1-carboxylate oxidase gene family in rice
Oryza sativa L. Plant Cell Physiol, 41:354–362.
Chaumont F, Moshelion M, Daniels MJ. 2005. Regulation of plant aquaporins activity.
Biol Cell 2005, 97:749–764.
Chervin C, Deluc L. 2010. Ethylene signaling receptors and transcription factors over the
grape berry development: gene expression profiling. Vitis, 49:129–136.
Chervin C, El-Kereamy A, Roustan JP, Latché A, Lamon J, Bouzayen M. 2004.
Ethylene seems required for the berry development and ripening in grape, a non-climateric
fruit. Plant Sci, 167:1301–1305.
Chervin C, Tira-umphon A, Terrier N, Zouine M, Severac D, Roustan JP. 2008.
Stimulation of the grape berry expansion by ethylene and effects on related gene
transcripts, over the ripening phase. Physiol Plantarum, 134:534–546.
Cohen JD. 1996. In vitro tomato fruit cultures demonstrate a role for indole-3-acetic acid
in regulating fruit ripening. J Amer Soc Hortic Sci, 121:520–524.
composition during ripening of grape berries. Plant Physiology, 118:783–792.
Cosgrove DJ. 1997. Relaxation in a high-stress environment: the molecular bases of
extensible cell walls and cell enlargement. Plant Cell, 9:1031–1041.
Davies C, Boss PK, Robinson SP. 1997. Treatment of grape berries, a nonclimateric fruit
with a synthetic auxin, retards ripening and alters the expression of developmentally
regulated genes. Plant Physiology, 115:1155–1161.
Davies C, Böttcher C. 2009. In: Grapevine Molecular Physiology & Biotechnology 2nd
edition: Hormonal control of grape berry ripening. Dordrecht: Spinger Science: Edited by
Roubelakis-Angelakis KA. 229–261.
159
Deluc LG, Grimplet J, Wheatley MD, Tillet RL, Quilici DR, Osborne C, Schooley
DA, Schlauch KA, Cushman JC, Cramer GR. 2007. Transcriptomic and metabolite
analyses of Cabernet Sauvignon grape berry development. BMC Genomics, 8:429.
Deytieux-Belleau C, Gagne S, L’Hyvernay A, Doneche B, Geny L. 2009. Possible roles
of both abscisic acid and Indol-acetic acid in controlling grape berry ripening process. J
Int Sci Vigne Vin, 41:141–148.
El-Kereamy A, Chervin C, Roustan JP. 2003. Exogenous ethylene stimulates the long-
term expression of genes related to anthocyanin biosynthesis in grape berries. Physiol
Plantarum, 119:175–182.
El-Sharkawy I, Kim WS, Jayasankar S, Svircev AM, Brown DCW. 2008. Differential
regulation of four members of the ACC synthase gene family in plum. Journal of
Experimental Botany, 59:2009–2027.
El-Sharkawy J, Sherif S, Mila I, Bouzayen M, Jayasankar S 2009. Molecular
characterization of seven genes encoding ethylene-responsive transcriptional factors
during plum fruit development and ripening. Journal of Experimental Botany, 60:907–
922.
Giribaldi M, Hartung W, Schubert A. 2011. The effects of abscisic acid on grape berry
ripening are affected by the timing of treatment. J Int Sci Vigne Vin, 44:9–15.
Götz S, Garcia-Gomez JM, Terol J, Williams TD, Nagaraj SH, Nueda MJ, Robles M,
Talon M, Dopazo J, Conesa A. 2008. High-throughput functional annotation and data
mining with the Blast2GO suite. Nucleic Acids Res, 36:3420–3435.
Hua J, Meyerowitz EM. 1998. Ethylene responses are negatively regulated by a receptor
gene family in Arabidopsis thaliana. Cell, 94:261–271.
Jeong ST, Goto-Yamamoto N, Kobayashi S, Esaka M. 2004. Effects of plant hormones
and shading on the accumulation of anthocyanins and the expression of anthocyanin
biosynthetic genes in grape berry skins. Plant Sci, 167:247–252.
Lewis DR, Negi S, Sukumar P, Muday GK. 2011. Ethylene inhibits lateral root
development, increase IAA transport and expression of PIN3 and PIN7 auxin efflux
carriers. Development, 138:3485–3495.
Lin Z, Zhong S, Grierson D. 2009. Recent advances in ethylene research. Journal of
Experimental Botany, 60:3311–3336.
Liu Q, Wen C-K. 2012. Arabidopsis ETR1 and ERS1 differentially repress the ethylene
response in combination with other ethylene receptor genes. Plant Physiology, 158:1193–
1207.
160
Lund ST, Peng FY, Nayar N, Reid KA, Schlosser J. 2008. Gene expression analyses in
individual grape Vitis vinifera L.. berries during ripening initiation reveal that
pigmentation intensity is a valid indicator of developmental staging within the cluster.
Plant Mol Biol, 68:301–315.
Mattivi F, Guzzon R, Vrhovsek U, Stefanini M, Velasco R. 2006. Metabolite profiling
of grape: flavonols and anthocyanins. J Agric Food Chem, 54:7692–7702.
Muday GK, Rahman A, Binder BM. 2012. Auxin and ethylene: collaborators or
competitors? Trends Plant Sci 2012, 174.:181–195.
Myhre S, Tveit H, Mollestad T, Lægreid A. 2006. Additional Gene Ontology structure
for improved biological reasoning. Bioinformatics, 22:2020–2027.
Nemhauser JL, Hong FX, Chory J. 2006. Different plant hormones regulate similar
processes through largely non-overlapping transcriptional responses. Cell 2006, 126:467–
475.
Nunan KJ, Sims IM, Bacic A, Robinson SP, Fincher GB. 1998. Changes in cell wall
Perrot-Rechenmann C, Napier RM. 2005. Auxins. Vitam Horm, 72:203–233.
Pfaffl MW. 2001. A new mathematical model for relative quantification in realtime RT-
PCR. Nucleic Acids Res, 29:e45.
Pilati S, Perazzolli M, Malossino A, Cestaro A, Demattè L, Fontana P, Dal Ri A,
Viola R, Velasco R, Moser C. 2007. Genome-wide transcriptional analysis of grapevine
berry ripening reveals a set of genes similarly modulated during three seasons and the
occurrence of an oxidative burst at véraison. BMC Genomics, 8:428.
Rizzini FM, Bonghi C, Tonutti P. 2009. Postharvest water loss induces marked changes
in transcript profiling in skins of wine grape berries. Postharvest Biol Techn, 52:247–253.
Robinson SP, Davies C. Molecular biology of grape berry ripening. 2000. Australian J
Grape Wine R, 6:175–188.
Simon P. 2003. Q-Gene: processing quantitative real-time RT-PCR data. Bioinformatics,
19:1439–1440.
Smyth GK. 2004. Linear models and empirical Bayes methods for assessing differential
expression in microarray experiments. Stat Appl Genet Mol Biol, 3:1.
Staswick PE, Serban B, Rowe M, Tiryaki I, Maldonado MT, Maldonado MC, Suza
W. 2005. Characterization of an Arabidopsis enzyme family that conjugates amino acids
to indole-3-acetic acid. Plant Cell, 17:616–627.
161
Stepanova AN, Yun J, Likhacheva AV, Alonso JM. 2007. Multilevel interactions
between ethylene and auxin in Arabidopsis roots. Plant Cell, 19:2169–2185.
Sun L, Zhang M, Ren J, Qi J, Zhang G, Leng P. 2010. Reciprocity between abscisic
acid and ethylene at the onset of ripening and after harvest. BMC Plant Biology, 10:257.
Symons GM, Davies C, Shavrukov Y, Dry IB, Reid J, Thomas MR. 2006. Grapes on
steroids. Brassinosteroids are involved in grape berry ripening. Plant Physiology,
140:150–158.
Thimm O, Bläsing O, Gibon Y, Nagel A, Meyer S, Krüger P, Selbig J, Müller LA,
Rhee SY, Stitt M. 2004. MAPMAN, a user-driven tool to display genomics data sets onto
diagrams of metabolic pathways and other biological processes. Plant J, 37:914–939.
Trainotti L, Tadiello A, Casadoro G. 2007. The involvement of auxin in the ripening of
climacteric fruits comes of age: the hormone plays a role of its own and has an intense
interplay with ethylene in ripening peaches. Journal of Experimental Botany, 58:3299–
3308.
Vardhini BV, Rao SSR. 2002. Acceleration of ripening of tomato pericarp discs by
brassinosteroids. Phytochemistry, 61:843–847.
Volodarsky D, Leviatan N, Otcheretianski A, Fluhr R. 2009. HORMONOMETER a
tool for discerning transcript signatures of hormone action in the Arabidopsis
transcriptome. Plant Physiology, 150:1796–1805.
Woodward AW, Bartel B. 2005. Auxin, Regulation, Action, and Interaction. Ann Bot,
95:707–73.

162
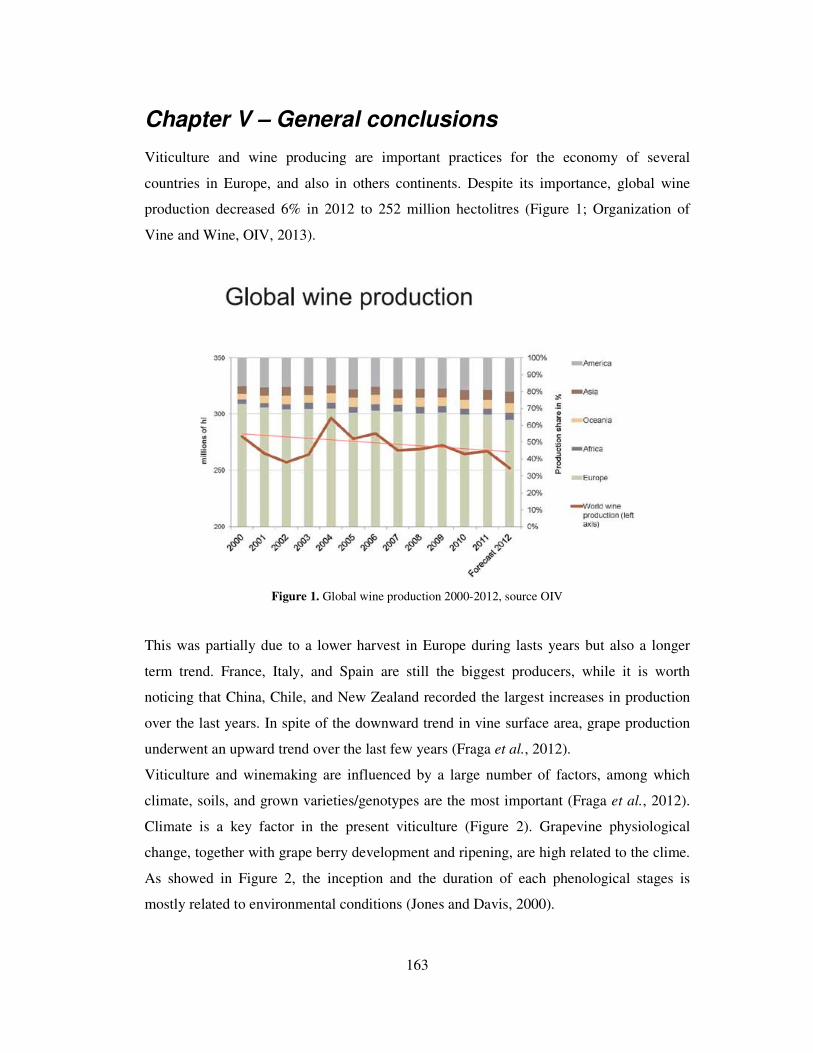
163
Chapter V – General conclusions
Viticulture and wine producing are important practices for the economy of several
countries in Europe, and also in others continents. Despite its importance, global wine
production decreased 6% in 2012 to 252 million hectolitres (Figure 1; Organization of
Vine and Wine, OIV, 2013).
Figure 1. Global wine production 2000-2012, source OIV
This was partially due to a lower harvest in Europe during lasts years but also a longer
term trend. France, Italy, and Spain are still the biggest producers, while it is worth
noticing that China, Chile, and New Zealand recorded the largest increases in production
over the last years. In spite of the downward trend in vine surface area, grape production
underwent an upward trend over the last few years (Fraga et al., 2012).
Viticulture and winemaking are influenced by a large number of factors, among which
climate, soils, and grown varieties/genotypes are the most important (Fraga et al., 2012).
Climate is a key factor in the present viticulture (Figure 2). Grapevine physiological
change, together with grape berry development and ripening, are high related to the clime.
As showed in Figure 2, the inception and the duration of each phenological stages is
mostly related to environmental conditions (Jones and Davis, 2000).
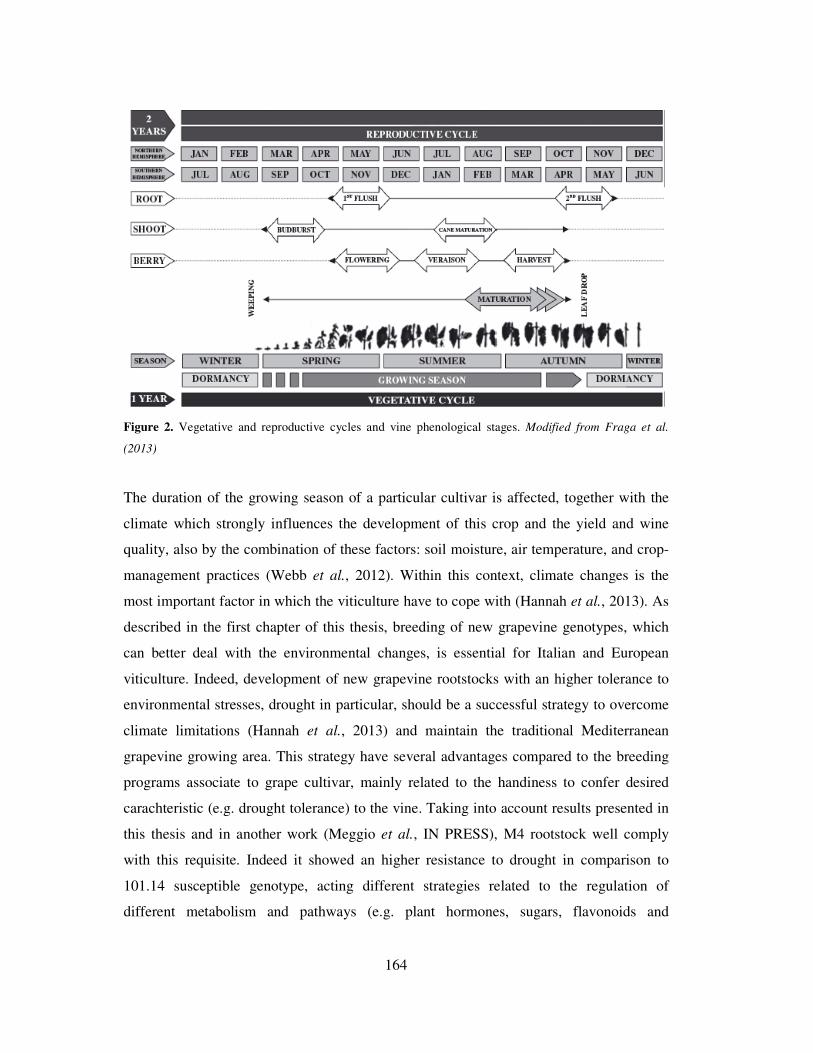
164
Figure 2. Vegetative and reproductive cycles and vine phenological stages. Modified from Fraga et al.
(2013)
The duration of the growing season of a particular cultivar is affected, together with the
climate which strongly influences the development of this crop and the yield and wine
quality, also by the combination of these factors: soil moisture, air temperature, and crop-
management practices (Webb et al., 2012). Within this context, climate changes is the
most important factor in which the viticulture have to cope with (Hannah et al., 2013). As
described in the first chapter of this thesis, breeding of new grapevine genotypes, which
can better deal with the environmental changes, is essential for Italian and European
viticulture. Indeed, development of new grapevine rootstocks with an higher tolerance to
environmental stresses, drought in particular, should be a successful strategy to overcome
climate limitations (Hannah et al., 2013) and maintain the traditional Mediterranean
grapevine growing area. This strategy have several advantages compared to the breeding
programs associate to grape cultivar, mainly related to the handiness to confer desired
carachteristic (e.g. drought tolerance) to the vine. Taking into account results presented in
this thesis and in another work (Meggio et al., IN PRESS), M4 rootstock well comply
with this requisite. Indeed it showed an higher resistance to drought in comparison to
101.14 susceptible genotype, acting different strategies related to the regulation of
different metabolism and pathways (e.g. plant hormones, sugars, flavonoids and

165
stilbenes). In addition to their capability to overcome climate limitations, grapevine
rootstocks greatly influenced grapevine reproductive performances (Koundouras et al.,
2008; Kidman et al., 2013) fruit development, ripening and quality (Walker et al., 2002,
2004). So, together with the induction of an higher tolerance to environmental disturbance
to the scion, viticulture need new rootstocks which did not alter quality of grape berry and
wine or, better, which increase their qualitative characteristics.
The second part of this thesis showed that M4, in addition to the higher tolerance to
drought, did not significantly alter grape berry quality of Cabernet sauvignon cultivar.
Indeed, it was showed that it cause an advance in the onset of ripening in comparison to
the 1103P rootstock, which is a more vigorous rootstock (Gambetta et al., 2012). Within
this background, M4 not only enhance water stress tolerance, but also positively
influenced grape berry development and ripening throughout the control of different
metabolism, among which auxins seem to play a pivotal role.
So, considering new scenario for the European and Italian vine growing and the climate
changes which can alter quality of grape berries and wine on a global scale, development
of new rootstocks with desirable traits, together with those belonging to the “M series”, it
will be one of the main goal of the future viticulture.
References
Fraga H, Malheiro AC, Moutinho-Pereira J, Santos JA. 2012. An overview of climate
change impacts on European viticulture. Food and Energy Security 1, 94-110.
Gambetta GA, Manuck CM, Drucker ST, Shaghasi T, Fort K, Matthews MA, Walker MA, McElrone AJ. 2012. The relationship between root hydraulics and scion
vigour across Vitis rootstocks: what role do root aquaporins play? Journal of experimental
botany 63, 6445-6455.
Hannah L, Roehrdanz PR, Ikegami M, Shepard AV, Shaw MR, Tabor G, Zhi L, Marquet PA, Hijmans RJ. 2013. Climate change, wine, and conservation. Proceedings
of the National Academy of Sciences of the United States of America 110, 6907-6912.
Jones GV, Davis RE. 2000. Climate Influences on Grapevine Phenology, Grape
Composition, and Wine Production and Quality for Bordeaux, France. American Journal
of Enology and Viticulture 51, 249-261.
166
Kidman CM, Dry PR, McCarthy MG, Collins C. 2013. Reproductive performance of
Cabernet Sauvignon and Merlot (Vitis vinifera L.) is affected when grafted to rootstocks.
Australian Journal of Grape and Wine Research 19, 409-421.
Koundouras S, Tsialtas IT, Zioziou E, Nikolaou N. 2008. Rootstock effects on the
adaptive strategies of grapevine (Vitis vinifera L. cv. Cabernet–Sauvignon) under
contrasting water status: Leaf physiological and structural responses. Agriculture,
Ecosystems & Environment 128, 86-96.
Meggio F, Prinsi B, Negri, A.S. , Di Lorenzo GS, Lucchini G, Pitacco P, Failla O, Scienza A, Cocucci C, Espen L. IN PRESS. Different biochemical and physiological
responses of two grapevine rootstock genotypes to drought and salt treatments. Australian
Journal of Grape and Wine Research.
Walker RR, Blackmore DH, Clingeleffer PR, Correll RL. 2002. Rootstock effects on
salt tolerance of irrigated field-grown grapevines (Vitis vinifera L. cv. Sultana).: 1. Yield
and vigour inter-relationships. Australian Journal of Grape and Wine Research 8, 3-14.
Walker RR, Blackmore DH, Clingeleffer PR, Correll RL. 2004. Rootstock effects on
salt tolerance of irrigated field-grown grapevines (Vitis vinifera L. cv. Sultana) 2. Ion
concentrations in leaves and juice. Australian Journal of Grape and Wine Research 10,
90-99.
Webb LB, Whetton PH, Bhend J, Darbyshire R, Briggs PR, Barlow EWR. 2012.
Earlier wine-grape ripening driven by climatic warming and drying and management
practices. Nature Clim. Change 2, 259-264.
167
Additional Chapter
Sensorial, biochemical and molecular
changes in Raboso Piave grape berries
applying “Double Maturation Raisonnée” and
late harvest techniques
Massimiliano Corso1, Fiorenza Ziliotto1, Fabio-Massimo Rizzini1, Angela
Gianni Teo2, Giovanni Cargnello2, Claudio Bonghi1,2
1. Department of Agronomy, Food, Natural Resources, Animals and Environment, DAFNAE,
University of Padova, Agripolis–Viale dell’Università 16, 35020 Legnaro (Padova), Italy.
2. Centro Interdipartimentale per la Ricerca in Viticoltura ed Enologia (CIRVE) Via XXVIII Aprile,
14-31015 Conegliano (TV), Italy
Published: Corso M*, Ziliotto F* Rizzini FM, Rasori A, Botton A, Bonghi C. 2013.
Sensorial, biochemical and molecular changes in Raboso Piave grape berries applying
“Double Maturation Raisonnée” and late harvest techniques. Plant Science 208, 50-57. *Equal contribution
168
1. Introduction
At ripening Raboso Piave grape berries have high acidity level and an unbalanced
polyphenols profile, in which condensed tannin precursors (e.g. catechin) are prominent
(De Rosso et al., 2009). These two features cause the austere aroma (De Rosso et al.,
2010; Mattivi et al., 2006), which is the main contributor in the sensory profile of the
Raboso Piave wine.
To alter the composition of the berries, and consequently improve wine quality, viticulture
strategies can be adopted based on a delay of traditional harvest (TH) using Late Harvest
(LH) or withering carried out both on- or off-plant. LH produces significant changes in
wine composition by inducing levels of proline, sugar, alcohol and total acid content in the
decanted must and base wine (Guillaumie et al., 2011). Off-plant withering causes the
accumulation of abscisic acid (ABA) and proline, as well as an increase in alcohol
dehydrogenase (ADH) and lipoxygenase enzyme activity (Costantini et al., 2006). As an
alternative to these techniques, a new practice called “Double Maturation Raisonnée”
(DMR) has been developed (Cargnello G., 1995; Cargnello et al., 2006). DMR consists of
a type of on-plant withering in which the heads bearing fruit and/or shoots are cut in a
reasoned or well thought out, manner. In fact, cutting the cane produces two cluster
populations: the first is located above the cut where the connection between cluster and
vine is still active, while the second is located below the cut and is composed of clusters
for which any connection with the trunk is severed. In the first population, the profile of
metabolites is similar to that observed in LH berries as a vascular connection is
maintained and over-ripe processes are not always characterized by major dehydration
events (Guillaumie et al., 2011). In contrast, significant biochemical changes do occur in
the second population, and these changes are primarily related to water loss (e.g. a strong
increase in sugar content caused by the cellular juice concentration), as has been described
previously in berries subjected to withering (Rizzini et al., 2009). In addition, polyphenols
are “more mature” in DMR berries, titratable acidity remains high because malic and
tartaric acid catabolism is slowed, and the susceptibility to pathogen attack is reduced
(Carbonneau A., 2008). All these changes improve sensorial parameters of the wine
obtained from DMR berries.
169
Metabolic profiles observed in LH and withered-berry techniques are paralleled by
significant changes in the expression of genes involved in key ripening processes
(Guillaumie et al., 2011; Rizzini et al., 2009; Bonghi et al., 2012; Zamboni et al., 2010).
These genes belong to functional categories involved in abiotic and biotic stresses (e.g.
desiccation, pathogen susceptibility), primary and secondary metabolisms (e.g. sugars,
aroma and polyphenols biosynthesis and transport) as well as regulators of development
(e.g. hormones and transcription factors). The effect of water loss on berry transcriptome
is strongly dependent
on genotype; however, it is well documented that water loss strongly affects the
expression of several genes involved in the phenylpropanoids pathway (Versari et al.,
2001) and causes the accumulation of phenols (e.g. stilbenes) that have been assumed as
putative biomarkers of the withering process (Bonghi et al., 2012; Zamboni et al., 2010;
Versari et al., 2001; Zamboni et al., 2008). Similarly, the (+)-valencene synthase gene,
encoding an enzyme involved in sesquiterpene biosynthesis, has been proposed as putative
marker of LH berries because its expression was up-regulated in both white (Chardonnay)
and red (Cabernet Sauvignon) cultivars (Guillaumie et al., 2011). Much informations are
already available concerning changes in must sensory profiles and biochemical indicators
of the grape ripening processes (Carbonneau A., 2008) in berries subjected to DMR, but
molecular data are totally lacking.
The goal of this research was to evaluate, by using a microarray approach, the impact of
LH and DMR techniques on Raboso Piave berry transcriptome, focusing attention on
differentially expressed genes related to sensory and biochemical parameters. Our data
demonstrated that DMR Raboso Piave berries subjected to DMR, in comparison to TH
and LH, maintained high titratable acidity and showed re-equilibration of polyphenols
profile, mainly due to an increase of flavonol and a reduction of tannin precursors. These
modifications were accompanied by significant changes in the transcription of genes
involved in primary and secondary metabolism.

170
2. Materials and methods
2.1 Plant Material, treatment and biochemical analysis
The experiments were performed on Vitis vinifera L. cv. Raboso Piave berries collected in
a commercial vineyard (Giorgio Cecchetto), located in the Piave DOC area (Treviso,
Italy) in 2008. One-hundred bunches from sixty homogeneous plants were collected at
different times to form six thesis: a) Traditional Harvest (TH), usually performed at the
end of October (in this case at October 29th), b) Late harvest (LH) berries over-ripened on
the plant and harvested 20 days after TH (DATH), and c) DMR berries collected from
clusters located both above (DMR-A) and below the cut (DMR-B), each harvested at 36
and 45 DATH. Every week representative berries were separated into two groups: the first
was used for biochemical and sensory analyses, the other berries were frozen in liquid
nitrogen and stored at -80 °C.
In order to evaluate biochemical parameters, the juice from fifty homogenized berries was
used to measure total acidity (g/L), malic and tartaric acid (g/L), pH and sugar content
(°brix) , using a WineScan™ Basic (FOSS, Italia) analyzer following the manufacturer’s
instructions.
Total phenolic content in the grapes was determined using the Folin-Ciocalteu
colorimetric method modified by (Yang et al., 2004). Anthocyanins content was evaluated
using the protocol described by (Ribéreau-Gayon et al., 2006), while high-performance
liquid chromatography (HPLC) was used to determine skin flavonoids (catechin and
quercitin) and stilbenes (cis-piceids, cis-resveratrol and trans- resveratrol) amounts,
following the protocol of (Sun et al., 2006).
Biochemical data were statistically analyzed (one-way ANOVA and post hoc LSD test) by
using the software package SPSS release 14.0 for Windows (SPSS Inc., Chicago, IL,
USA).
Sensorial analyses were conducted on musts obtained from TH-, LH-, DMR-A- and
DMR-B berries using the protocols described by (Cargnello, 2009).
171
2.2 RNA extraction, microarray analysis and qPCR
Total RNA for both microarray and real-time PCR experiments was extracted from whole
berries using the perchlorate method as described by (Ziliotto et al., 2012).
Microarray experiments were conducted using the grape AROS V1.0 platform
(www.operon.com), as described by (Rizzini et al., 2009). The following samples were
hybridized: LH versus TH, DMR-A versus TH and DMR-B versus TH only for the 36
DATH.
For each of the three comparisons, three slides were hybridized using targets obtained
from two biological replicates.
Raw hybridization data were quality-filtered and background-subtracted using TIGR
Spotfinder software (www.tm4.org/spotfinder) as described by (Ziliotto et al., 2012).
Resulting data were intra-array normalized using the median method (Yang et al., 2002).
MeV software (www.tm4.org/mev) was used for discovering differential gene expression
among the comparisons (t-test) and a Venn diagram with differentially expressed genes
(DEG) among three comparisons was created using GeneVenn software
(www.genevenn.sourceforge.net).
Gene expression data have been submitted to Gene Expression Omnibus (GEO)
(accession no. GSE43385) at NCBI (https://www.ncbi.nlm.nih.gov/geo/).
PageMan software (Usadel et al., 2006) was used to perform an enrichment analysis based
on a Fisher exact test. This analysis was conducted on each set of common and specific
differentially expressed genes among three comparisons, with a p<0.05 (z > 1.96).
In order to find patterns and highlight similarities and differences in data, a Principal
Component Analysis (PCA) (Soumya Raychaudhuri, 2000) was performed on
biochemical and transcriptomic data, and metabolites. For biochemical and metabolites
PCA analysis, a log2 ratio of LH and DMRs versus TH were used as input data. For
transcriptomic data, gene ontology (GO) categories related to acidity, sugars and
phenylpropanoids metabolism were identified. Later on, transcripts of the grape AROS
V1.0 platform related to each category were mediated and used as input data. For qPCR
data, a PCA analysis with log2 ratio of LH and DMRs versus TH of transcripts studied
with real-time PCR were used as input data.
172
cDNA synthesis and quantitative real-time PCR (qPCR) analyses were performed
following methods described by (Ziliotto et al., 2012). Primers used in qPCR experiments
are listed in Supplementary Table 1.
173
3. Results and discussion
3.1 Biochemical and Sensorial Analysis
FOSS analysis of berries subjected to LH, DMR-A and DMR-B, in comparison to those
sampled at TH, showed statistically significant differences in terms of titratable acidity,
malic and tartaric acids as well as sugar content and total polyphenols (Table 1). In
particular DMR-B berries, maintained a titratable acidity similar to that observed in TH-
berries (reduction of 9%), while DMR-A and LH berries showed a reduction of 18 and
21% in comparison to TH-berries, respectively, as has been previously observed in other
grapevine cultivars subjected to a late harvest dehydration (Guillaumie et al., 2011;
Bellincontro et al., 2004). The malic acid content in DMR-B berries was very similar to
TH berries; while in DMR-A and LH there was a decrease of 19% and 32%, respectively.
In contrast, none of the late harvest techniques used significantly affected tartaric acid
content.
Variations of tartaric and malic acid levels in grape berries led to a significant increase in
pH only in LH-bunches (+0.26% in comparison to TH), while significant changes were
not observed for DMR berries (+0.1% for DMR-B). These data demonstrated that DMR
was effective in maintaining the titratable acidity measured in Raboso Piave berries at TH.
This positive effect was absent when DMR berries were harvested later (45 days after TH,
data not shown). In this case, a 40% and 45% reduction in malic acid level was observed
in DMR-A and DMR-B, respectively. This strong reduction could be due both to an
increase in malate oxidation and its transformation into soluble sugars, as suggested by
(Terrier, 2001). To confirm this hypothesis it is necessary to verify if the increase in sugar
content in DMR berries is due simply to dehydration or if it is also a result of the
catabolism of malic acid.
Total Soluble Solids (TSS) and total polyphenols were higher in LH, DMR-A and DMR-B
in comparison to TH berries (Tab.1). This result was expected considering that a xylem
backflow occurs in berries subjected to a delay in harvest time, with the concomitant
reduction in the functionality of phloem leading to weight (water) loss (~7% of berry
volume per day) (Tilbrook and Tyerman, 2009). The altered water potential magnifies the
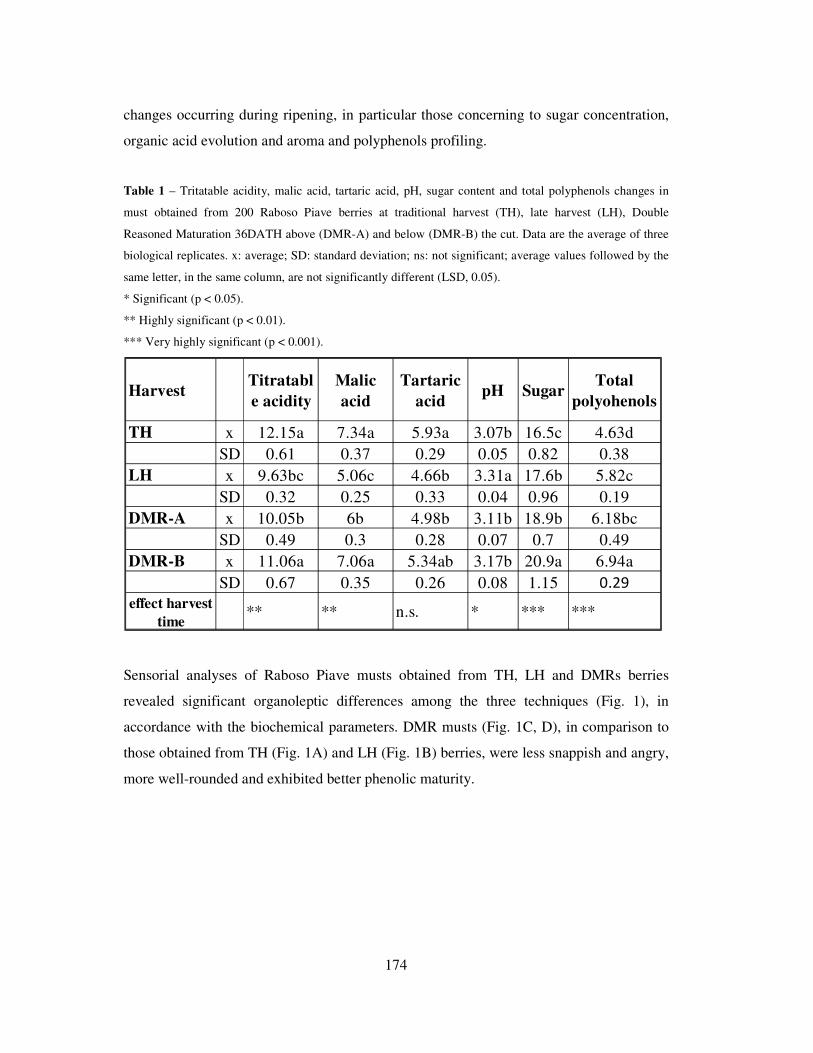
174
changes occurring during ripening, in particular those concerning to sugar concentration,
organic acid evolution and aroma and polyphenols profiling.
Table 1 – Tritatable acidity, malic acid, tartaric acid, pH, sugar content and total polyphenols changes in
must obtained from 200 Raboso Piave berries at traditional harvest (TH), late harvest (LH), Double
Reasoned Maturation 36DATH above (DMR-A) and below (DMR-B) the cut. Data are the average of three
biological replicates. x: average; SD: standard deviation; ns: not significant; average values followed by the
same letter, in the same column, are not significantly different (LSD, 0.05).
* Significant (p < 0.05).
** Highly significant (p < 0.01).
*** Very highly significant (p < 0.001).
Sensorial analyses of Raboso Piave musts obtained from TH, LH and DMRs berries
revealed significant organoleptic differences among the three techniques (Fig. 1), in
accordance with the biochemical parameters. DMR musts (Fig. 1C, D), in comparison to
those obtained from TH (Fig. 1A) and LH (Fig. 1B) berries, were less snappish and angry,
more well-rounded and exhibited better phenolic maturity.
Harvest Titratabl
e acidity
Malic
acid
Tartaric
acidpH Sugar
Total
polyohenols
TH x 12.15a 7.34a 5.93a 3.07b 16.5c 4.63d
SD 0.61 0.37 0.29 0.05 0.82 0.38
LH x 9.63bc 5.06c 4.66b 3.31a 17.6b 5.82c
SD 0.32 0.25 0.33 0.04 0.96 0.19
DMR-A x 10.05b 6b 4.98b 3.11b 18.9b 6.18bc
SD 0.49 0.3 0.28 0.07 0.7 0.49
DMR-B x 11.06a 7.06a 5.34ab 3.17b 20.9a 6.94a
SD 0.67 0.35 0.26 0.08 1.15 0.29
effect harvest
time** ** n.s. * *** ***
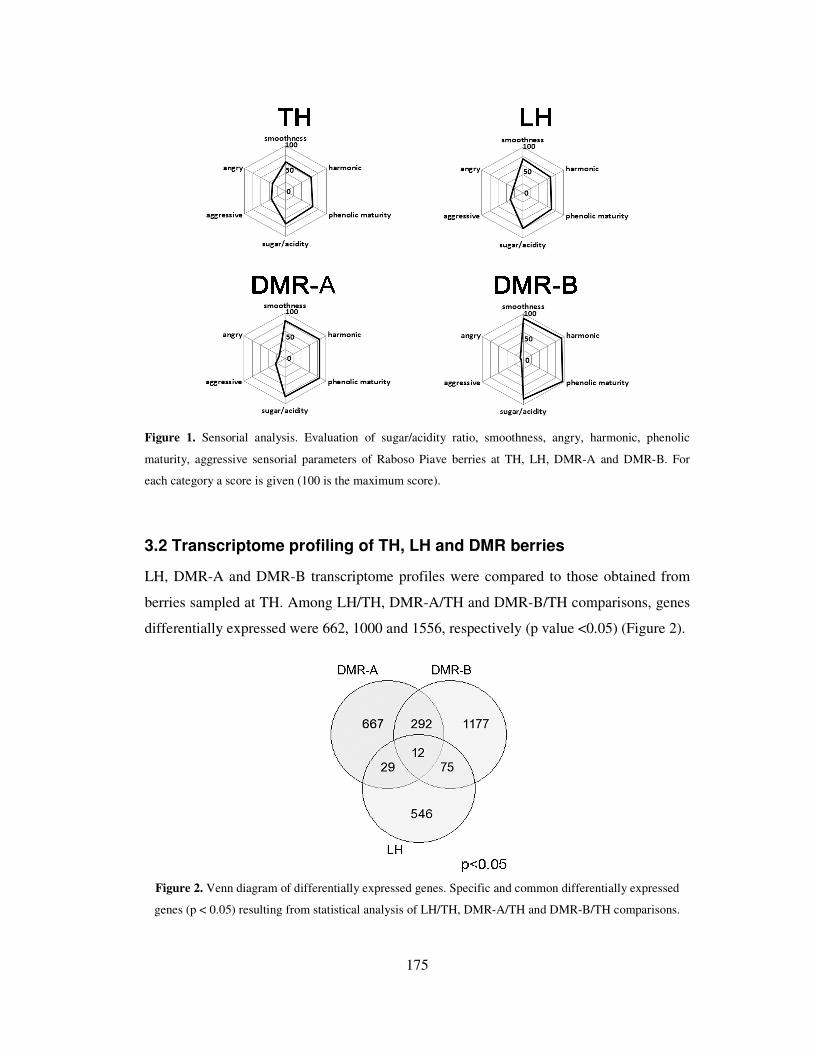
175
Figure 1. Sensorial analysis. Evaluation of sugar/acidity ratio, smoothness, angry, harmonic, phenolic
maturity, aggressive sensorial parameters of Raboso Piave berries at TH, LH, DMR-A and DMR-B. For
each category a score is given (100 is the maximum score).
3.2 Transcriptome profiling of TH, LH and DMR berries
LH, DMR-A and DMR-B transcriptome profiles were compared to those obtained from
berries sampled at TH. Among LH/TH, DMR-A/TH and DMR-B/TH comparisons, genes
differentially expressed were 662, 1000 and 1556, respectively (p value <0.05) (Figure 2).
Figure 2. Venn diagram of differentially expressed genes. Specific and common differentially expressed
genes (p < 0.05) resulting from statistical analysis of LH/TH, DMR-A/TH and DMR-B/TH comparisons.
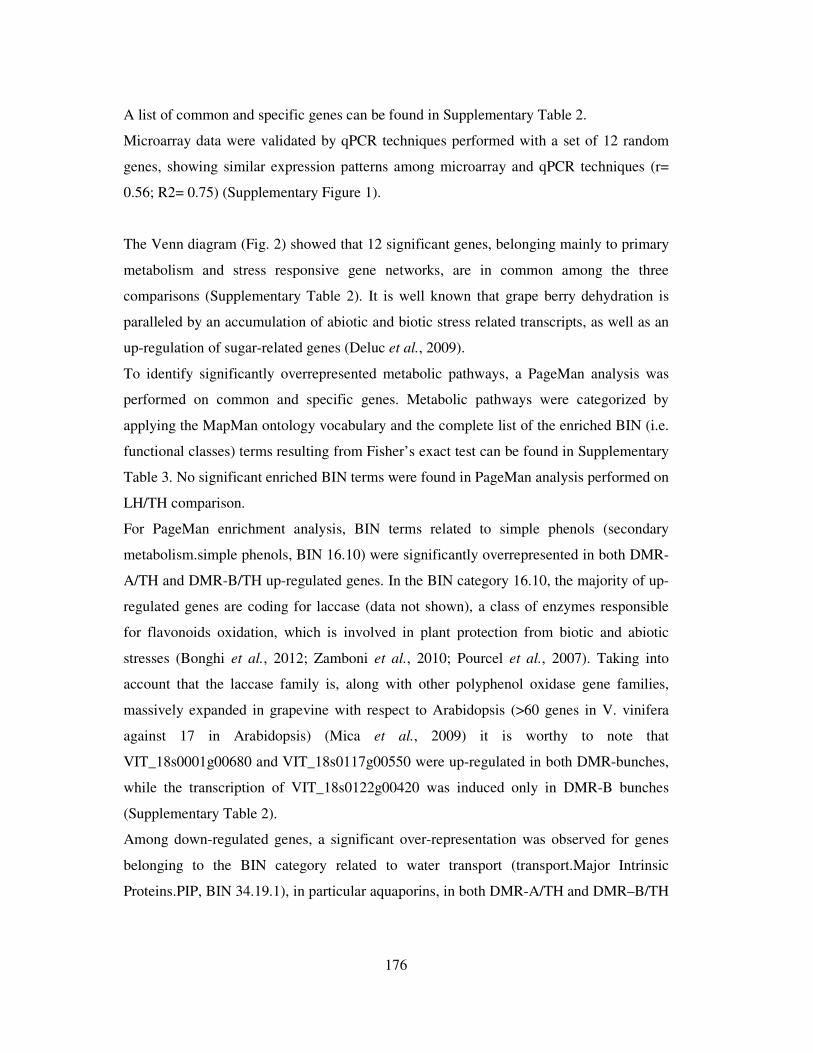
176
A list of common and specific genes can be found in Supplementary Table 2.
Microarray data were validated by qPCR techniques performed with a set of 12 random
genes, showing similar expression patterns among microarray and qPCR techniques (r=
0.56; R2= 0.75) (Supplementary Figure 1).
The Venn diagram (Fig. 2) showed that 12 significant genes, belonging mainly to primary
metabolism and stress responsive gene networks, are in common among the three
comparisons (Supplementary Table 2). It is well known that grape berry dehydration is
paralleled by an accumulation of abiotic and biotic stress related transcripts, as well as an
up-regulation of sugar-related genes (Deluc et al., 2009).
To identify significantly overrepresented metabolic pathways, a PageMan analysis was
performed on common and specific genes. Metabolic pathways were categorized by
applying the MapMan ontology vocabulary and the complete list of the enriched BIN (i.e.
functional classes) terms resulting from Fisher’s exact test can be found in Supplementary
Table 3. No significant enriched BIN terms were found in PageMan analysis performed on
LH/TH comparison.
For PageMan enrichment analysis, BIN terms related to simple phenols (secondary
metabolism.simple phenols, BIN 16.10) were significantly overrepresented in both DMR-
A/TH and DMR-B/TH up-regulated genes. In the BIN category 16.10, the majority of up-
regulated genes are coding for laccase (data not shown), a class of enzymes responsible
for flavonoids oxidation, which is involved in plant protection from biotic and abiotic
stresses (Bonghi et al., 2012; Zamboni et al., 2010; Pourcel et al., 2007). Taking into
account that the laccase family is, along with other polyphenol oxidase gene families,
massively expanded in grapevine with respect to Arabidopsis (>60 genes in V. vinifera
against 17 in Arabidopsis) (Mica et al., 2009) it is worthy to note that
VIT_18s0001g00680 and VIT_18s0117g00550 were up-regulated in both DMR-bunches,
while the transcription of VIT_18s0122g00420 was induced only in DMR-B bunches
(Supplementary Table 2).
Among down-regulated genes, a significant over-representation was observed for genes
belonging to the BIN category related to water transport (transport.Major Intrinsic
Proteins.PIP, BIN 34.19.1), in particular aquaporins, in both DMR-A/TH and DMR–B/TH
177
comparisons. Aquaporins are a family of transmembrane proteins considered to be largely
responsible for the high permeability to water exhibited by plasma membranes thus the
down-regulation of aquaporins transcripts during ripening or LH has been suggested as a
strategy for reducing water loss (Guillaumie et al., 2011). In this work, we observed that
an higher number of aquaporin isoforms (six isoforms) were down-regulated in DMR-B
bunches, on the other hand only two isoforms were differentially regulated in the DMR-A
ones (two isoforms) (Supplementary Table 2). This difference could be explained
considering that ripening grape berry is not hydraulically isolated from the parent plant by
xylem occlusion but, rather, is “hydraulically buffered” by water delivered via the phloem
(Choat et al.,2009). In the case of DMR-A bunches (still attached to the plant), the
delivery of excess phloem water could be related with the less number of down-regulated
aquaporin isoforms.
For DMR-A/TH comparison, specific down-regulated genes belonging to categories
regarding cell wall (cell wall.cell wall proteins.LRR, BIN 10.5.3 and cell
wall.degradation.mannan-xylose-arabinose-fucose, BIN 10.6.2) and lipid metabolism
(lipid metabolism.exotics.methylsterol monooxygenase, BIN 11.8.2, lipid metabolism.FA
synthesis and FA elongation.acyl coa ligase, BIN 11.1.8) were overrepresented.
Metabolisms related to cell wall degradation and reduction of lipid biosynthesis (mainly
sterols) were stimulated in the case of a prolongation of berry ripening on the plant (Le
Fur et al., 1994). Concerning terms related to up-regulated genes those associated to “cell
wall.modification” and lignin biosynthesis (secondary
metabolism.phenylpropanoids.lignin biosynthesis, BIN 16.2.1) were overrepresented.
Activation of the lignin pathway is likely a reaction of skin cells to an advanced stage of
dehydration (Guillaumie et al., 2011; Bonghi et al., 2012; Zamboni et al., 2008), which
could represent a barrier for the gas exchange between cells and the surrounding
environment. In still metabolically active fruit tissues (skin, in particular), this stress
condition activates specific reactions aimed at stress adaptation and the minimization of
microbial attacks. It has already been reported that the application of DMR is particularly
effective in indirect grey mold control on grapevine (Cargnello et al., 2006).
178
For DMR-B specific genes, terms related to fermentation (fermentation.aldehyde
dehydrogenase, BIN 5.10) and stress (stress.abiotic.touch/wounding, BIN 20.2.4) were
significantly overrepresented in the up-regulated genes.
Among BIN categories over-represented in DMR-A/TH and DMR-B/TH comparison,
those related to sugars/acidity and polyphenols were selected, for which the GO terms
were retrieved to implement the information present in the MapMan ontology vocabulary.
These GO categories were used to perform a PCA analysis to better identify those
specifically affected by the application of different harvest techniques (Fig. 3). For
sugars/acidity (Fig. 3A) and polyphenols (Fig. 3B), most of the GO terms were separated
by the first principal component, with a variance of 58.8% and 83.3%, respectively, while
second principal component showed a variance of 28.4% and 11.5%, respectively.
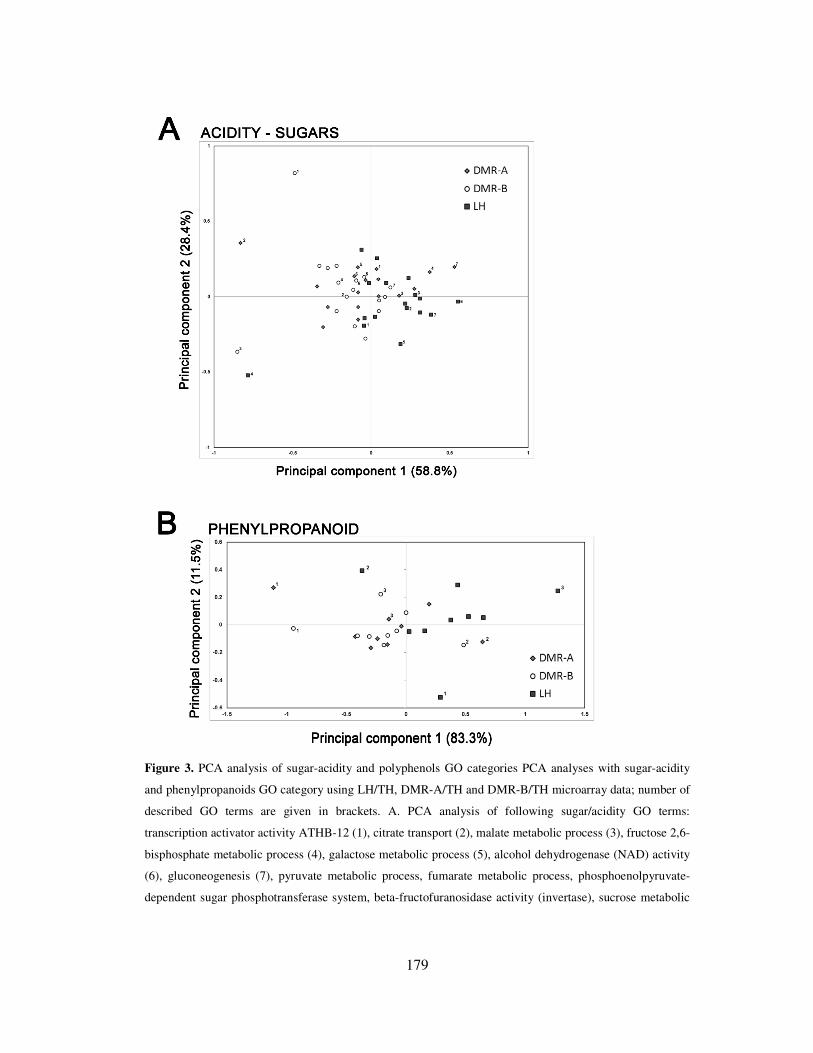
179
Figure 3. PCA analysis of sugar-acidity and polyphenols GO categories PCA analyses with sugar-acidity
and phenylpropanoids GO category using LH/TH, DMR-A/TH and DMR-B/TH microarray data; number of
described GO terms are given in brackets. A. PCA analysis of following sugar/acidity GO terms:
transcription activator activity ATHB-12 (1), citrate transport (2), malate metabolic process (3), fructose 2,6-
bisphosphate metabolic process (4), galactose metabolic process (5), alcohol dehydrogenase (NAD) activity
(6), gluconeogenesis (7), pyruvate metabolic process, fumarate metabolic process, phosphoenolpyruvate-
dependent sugar phosphotransferase system, beta-fructofuranosidase activity (invertase), sucrose metabolic
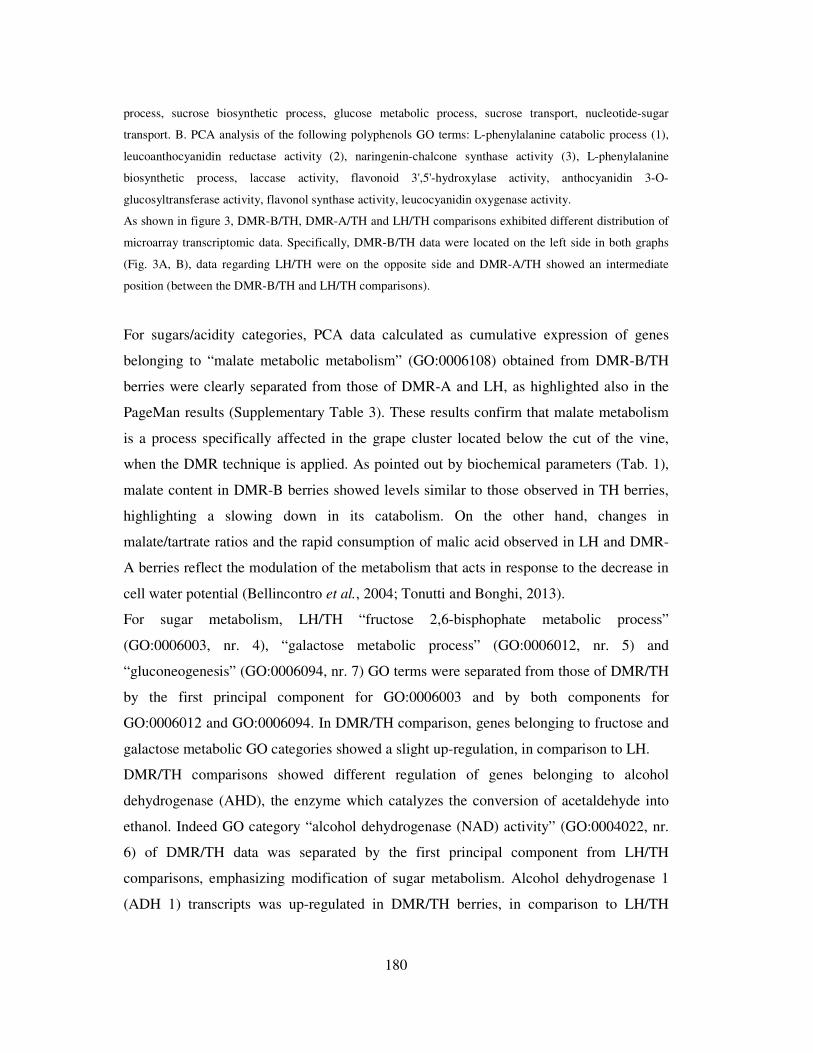
180
process, sucrose biosynthetic process, glucose metabolic process, sucrose transport, nucleotide-sugar
transport. B. PCA analysis of the following polyphenols GO terms: L-phenylalanine catabolic process (1),
leucoanthocyanidin reductase activity (2), naringenin-chalcone synthase activity (3), L-phenylalanine
biosynthetic process, laccase activity, flavonoid 3',5'-hydroxylase activity, anthocyanidin 3-O-
glucosyltransferase activity, flavonol synthase activity, leucocyanidin oxygenase activity.
As shown in figure 3, DMR-B/TH, DMR-A/TH and LH/TH comparisons exhibited different distribution of
microarray transcriptomic data. Specifically, DMR-B/TH data were located on the left side in both graphs
(Fig. 3A, B), data regarding LH/TH were on the opposite side and DMR-A/TH showed an intermediate
position (between the DMR-B/TH and LH/TH comparisons).
For sugars/acidity categories, PCA data calculated as cumulative expression of genes
belonging to “malate metabolic metabolism” (GO:0006108) obtained from DMR-B/TH
berries were clearly separated from those of DMR-A and LH, as highlighted also in the
PageMan results (Supplementary Table 3). These results confirm that malate metabolism
is a process specifically affected in the grape cluster located below the cut of the vine,
when the DMR technique is applied. As pointed out by biochemical parameters (Tab. 1),
malate content in DMR-B berries showed levels similar to those observed in TH berries,
highlighting a slowing down in its catabolism. On the other hand, changes in
malate/tartrate ratios and the rapid consumption of malic acid observed in LH and DMR-
A berries reflect the modulation of the metabolism that acts in response to the decrease in
cell water potential (Bellincontro et al., 2004; Tonutti and Bonghi, 2013).
For sugar metabolism, LH/TH “fructose 2,6-bisphophate metabolic process”
(GO:0006003, nr. 4), “galactose metabolic process” (GO:0006012, nr. 5) and
“gluconeogenesis” (GO:0006094, nr. 7) GO terms were separated from those of DMR/TH
by the first principal component for GO:0006003 and by both components for
GO:0006012 and GO:0006094. In DMR/TH comparison, genes belonging to fructose and
galactose metabolic GO categories showed a slight up-regulation, in comparison to LH.
DMR/TH comparisons showed different regulation of genes belonging to alcohol
dehydrogenase (AHD), the enzyme which catalyzes the conversion of acetaldehyde into
ethanol. Indeed GO category “alcohol dehydrogenase (NAD) activity” (GO:0004022, nr.
6) of DMR/TH data was separated by the first principal component from LH/TH
comparisons, emphasizing modification of sugar metabolism. Alcohol dehydrogenase 1
(ADH 1) transcripts was up-regulated in DMR/TH berries, in comparison to LH/TH
181
(Supplementary Table 2), due to an activation of the fermentative pathway, already
observed in several experiments with an increase in ethanol and acetaldehyde levels
following dehydration (Bellincontro et al., 2004; Chkaiban et al., 2007; Cirilli et al.,
2012). The induction of aerobic fermentation is probably related to an excess of sugars
concentration, which may also be the case for DMR berries that showed higher levels of
total soluble solids in comparison to LH berries (Table 1). In this case increasing levels of
ADH 1 may be a necessary step in removing acetaldehyde related to an increasing
concentration of sugars. In PCA analysis, GO terms related to sugar transport (nucleotide-
sugar transport, GO:0015780, and sucrose transport, GO:0015770) did not show
significant differences among three comparisons. It is well known that severe water stress
affects phloem unloading, inhibits the accumulation of sugars and negatively regulates
sugar transporters in grape berries (WANG et al., 2003), as evidenced for genes coding for
sugar transporters that showed low expression values (data not shown).
Taken together, these data highlighted that dehydration did not influence sugars
biosynthesis and transport; therefore it can be concluded that the increase in sugar levels
in DMR grape berries is due to the excess of concentration which occurs after grape berry
dehydration.
For the polyphenols category, DMR/TH “L-phenylalanine catabolic process”
(GO:0006559) terms, related to the Phenylalanine ammonia-lyase (PAL) gene, were
significantly separated in the LH/TH comparison. Besides, genes that act in the next steps
of the phenylpropanoids pathways (“naringenin-chalcone synthase activity”, GO:0016210,
and “leucoantocyanidin reductase activity”, GO:0033788) also showed different
distribution in PCA graphs of DMR/TH and LH/TH comparisons. These data highlighted
significant differences between samples in the regulation of phenylpropanoids
metabolism, with the adoption of different routes in DMRs and LH berries. This category
will be discussed in more detail in the next section.
3.3 Phenylpropanoids metabolomics and transcriptomic analysis
Biochemical and sensorial analyses pointed out that DMRs grape berries reached a
balanced polyphenols profile (Table 1) and complete phenolic maturity (Figure 1), two of
the major factors affecting red wine quality. Metabolites analysis revealed that the amount
182
of polyphenols in DMRs berries is significantly higher than that measured in berries
harvested at TH and LH (Supplementary table 4).
To better understand changes in polyphenols metabolism, a PCA analysis was performed
on data related to the content of resveratrol, quercitin, catechin and anthocyanins,
normalized against TH berries values, measured in LH, DMR-A and DMR-B berries
(Figure 4A). Quercitin and catechin of DMRs were significantly separated from LH data
by the first principal component accounting for 96.8% of variance. Trans-resveratrol value
was also separated among the three delayed harvests by the first principal component, in
this case with more marked differences. Instead, cis-resveratrol of LH was separated from
DMR-A and DMR-B by the second principal component accounting for 3.2% of variance.
Anthocyanins data did not show significant differences among the three harvest
techniques.
Detailed data on metabolites quantification in TH, LH and DMRs are listed in
Supplementary Table 4.
Transcript amounts of the main genes involved in polyphenols biosynthesis (listed in
Supplementary Table 1) were analyzed using the procedure described for metabolites
(Figure 4B).
PCA analysis highlighted that most of data can be explained by the first and second
principal component, with a variance of 97.0% and 2.0%, respectively.
Data distribution observed for PAL gene (Nr. 2) was the same as that observed for PCA
conducted with GO terms data (Figure 3) The ratio between the level of PAL transcripts
measured in DMR-B- and TH berries was clearly separated from that recorded for DMR-
A and LH samples by the first principal component with a variance of 97.0%, confirming
the existence of a different regulation of PAL gene expression among the three harvests.
Stilbene synthase gene (STS, nr.1) is involved in resveratrol production and showed
significant differences between DMRs and LH. PCA pattern shown by STS transcripts
parallels those obtained for trans-resveratrol in the PCA analysis conducted using phenol
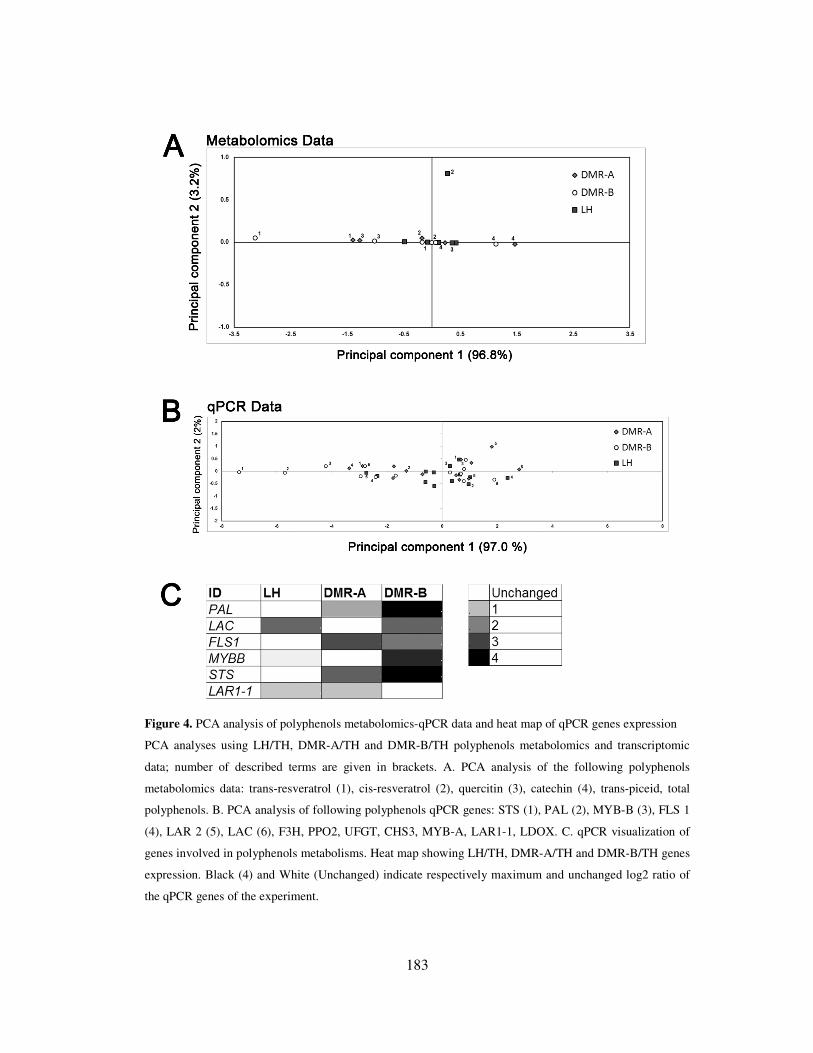
183
Figure 4. PCA analysis of polyphenols metabolomics-qPCR data and heat map of qPCR genes expression
PCA analyses using LH/TH, DMR-A/TH and DMR-B/TH polyphenols metabolomics and transcriptomic
data; number of described terms are given in brackets. A. PCA analysis of the following polyphenols
metabolomics data: trans-resveratrol (1), cis-resveratrol (2), quercitin (3), catechin (4), trans-piceid, total
polyphenols. B. PCA analysis of following polyphenols qPCR genes: STS (1), PAL (2), MYB-B (3), FLS 1
(4), LAR 2 (5), LAC (6), F3H, PPO2, UFGT, CHS3, MYB-A, LAR1-1, LDOX. C. qPCR visualization of
genes involved in polyphenols metabolisms. Heat map showing LH/TH, DMR-A/TH and DMR-B/TH genes
expression. Black (4) and White (Unchanged) indicate respectively maximum and unchanged log2 ratio of
the qPCR genes of the experiment.
184
metabolites (Figure 3). Similar results, although to a lesser extent, were obtained for
flavonol-synthase 1 (FLS 1, nr. 4) and MYB-B (nr. 3), involved in flavonol biosynthesis
and its regulation, respectively, and leucoanthocyanidin-reductase 2 (LAR2, nr 5), which
is involved in catechin biosynthesis. No significant differences were observed for the
expression of genes involved in anthocyanins synthesis (e.g. leucoanthocyanidin oxidase
and UDP-glucose:flavonoid 3-O-glucosyltransferase) as well as flavonoids catabolism
(e.g. polyphenol oxidases and laccases) by comparing the three harvest strategies.
Taken together, metabolites and transcripts analyses revealed that there are different
regulation mechanisms of polyphenols metabolism in DMR and LH samples. DMR
showed high expression of PAL gene (Figure 4C), confirming that this gene is strongly
activated during both over-ripening and postharvest dehydration (Rizzini et al., 2009;
Bonghi et al., 2012; Zamboni et al., 2010). However, two members of the PAL gene
family were shown to be down-regulated in withering Raboso Piave berries (Bonghi et al.,
2012). This suggests that the expression regulation of the numerous members of the V.
vinifera PAL multigene family is complex and may represent a key step in the multiple
physiological responses to postharvest stress. The increasing availability of polyphenols
precursors was used for synthesizing stilbenes and some categories of flavonoids. As far
as stilbenes are concerned, DMR and LH berries, showed higher content of trans-
resveratrol (e.g. 3 times more in DMR-B than in TH, Supplementary Table 4), as already
reported by (Carbonneau A., 2008), paralleled by an up-regulation of STS 1 gene (more
than 40 times higher in DMR-B than that observed in TH, Fig. 4C). This result was not
unexpected, indeed senescence (Vannozzi et al., 2012) and abiotic stresses, such as
dehydration, are able to induce STS expression (Bonghi et al., 2012; Zamboni et al., 2010;
Versari et al., 2001). Among flavonoids, the application of DMR-B induced the
accumulation of quercitin, a flavonol-related metabolites (Supplementary Table 4), while
catechin was significantly reduced. These trends were consistent with the induction of
transcripts encoding for FLS 1 and MYB-B in comparison to TH (Fig. 4C) suggesting a
shift in DMRs samples (DMR-B in particular) towards a flavonol pathway and a
concomitant repression of tannins biosynthesis. To the contrary, in LH berries flavonoids
composition remained almost similar to that registered in TH berries characterized by a
low level of quercitin and FLS1 transcripts as well as an accumulation of catechin and
185
LAR 2 mRNAs (Fig. 4C), which means that the LH technique was less efficient than
DMR in the reallocation of dehydroquercitin toward quercitin instead of
leucoantocyanidin and then catechin. The increase of quercitin observed in DMR-B
berries has an important impact on quality parameters considering that this flavonol
contributes to the bitter taste and color of red wine by stabilizing anthocyanin pigments
(Cheynier et al., 2006). The decrease of catechin results in reduced synthesis of tannins.
This event is correlated to the reduction of astringency registered in Raboso Piave musts
obtained from DMR berries, as demonstrated by sensorial analysis. A decrease in total
anthocyanins was observed for DMR berries, in comparison to TH and LH berries. This
could be due to the diversion of a common precursor towards flavonols instead of
anthocyanins.
In DMR berries harvested later (45 days after H), the positive effect on polyphenols
balance disappeared (data not shown). This event, associated with a drop in titratable
acidity (Tab. 1), suggests that an excessive delay in the harvest of DMR berries negatively
affects the global quality of Raboso berries.
The unique traits of wines obtained from overripe and/or dehydrated berries are the result
of processes and events, some of which are strictly regulated in terms of gene expression.
Several pathways, related to wine quality traits, appear to be positively modulated by
delaying the harvest and, in particular, when berries undergo DMR. However, the
effectiveness of DMR is strongly influenced by the technical expertise of the wine grower,
who should modify the duration of DMR in relation to climate and perform sensorial
analyses on grapes in order to establish the best vintage time. The DMR technique can
successfully modify grape berry quality only when these factors are taken into
consideration in a well thought out manner.
4. Acknowledgements
This work was supported by a grant from Territori DiVini Consortium
(http://www.territoridivini.it). We are especially indebted to Giorgio Cecchetto for the
supply of plant materials and valuable comments.
186
5. References
Bellincontro A, De Santis D, Botondi R, Villa I, Mencarelli F. 2004. Different
postharvest dehydration rates affect quality characteristics and volatile compounds of
Malvasia, Trebbiano and Sangiovese grapes for wine production. Journal of the Science of
Food and Agriculture 84, 1791-1800.
Bonghi C, Rizzini FM, Gambuti A, Moio L, Chkaiban L, Tonutti P. 2012. Phenol
compound metabolism and gene expression in the skin of wine grape (Vitis vinifera L.)
berries subjected to partial postharvest dehydration. Postharvest Biology and Technology
67, 102-109.
Carbonneau A. CG, Murisier F. 2008. Passerillage sur souche: une technique innovante
de raisonnement de la maturation au service de la viticolture durable. Une alternative à
l'enrichissiment en sucres. 31st World Congress of Vine and Wine. Verona (Italy).
Cargnello G, Pezza L, Gallo G, Camatta T, Coccato S, Pascarella G, Di Gaetano R, Casadei G, La Torre A, Spera G, Scaglione M, Moretti S, Garofalo A. 2006. D.M.R.
("Double Reasoned Maturing"): innovative technique of agronomic ecologic control of
grey mould on grapevine. trials and various considerations. Communications in
agricultural and applied biological sciences 71, 1055-1061.
Cargnello G. 2009. Great chain: urgent necessity the focusing on the “metaethical”
Cargnello G. RA, Lovat L., Pezza L., Gallo G., Fanucci G. 1995. "Double Maturation
Raisonnée" (DMR): évolution de quelques paramètres qualitatifs en fonction de l'époque
d'intervention sur les variétés Prosecco et Marzemino (Vitis Vinifera L.). GESCO, Vol. 8.
Vila do Conde (Porto), 403-414.
Cheynier V, Dueñas-Paton M, Salas E, Maury C, Souquet J-M, Sarni-Manchado P, Fulcrand H. 2006. Structure and Properties of Wine Pigments and Tannins. American
Journal of Enology and Viticulture 57, 298-305.
Chkaiban L, Botondi R, Bellincontro A, De Santis D, Kefalas P, Mencarelli F. 2007.
Influence of postharvest water stress on lipoxygenase and alcohol dehydrogenase
activities, and on the composition of some volatile compounds of Gewürztraminer grapes
dehydrated under controlled and uncontrolled thermohygrometric conditions. Australian
Journal of Grape and Wine Research 13, 142-149.
Cirilli M, Bellincontro A, De Santis D, Botondi R, Colao MC, Muleo R, Mencarelli F.
2012. Temperature and water loss affect ADH activity and gene expression in grape berry
during postharvest dehydration. Food Chemistry 132, 447-454.
Costantini V, Bellincontro A, De Santis D, Botondi R, Mencarelli F. 2006. Metabolic
Changes of Malvasia Grapes for Wine Production during Postharvest Drying. Journal of
Agricultural and Food Chemistry 54, 3334-3340.
De Rosso M, Panighel A, Carraro R, Padoan E, Favaro A, Dalla Vedova A, Flamini R. 2010. Chemical Characterization and Enological Potential of Raboso Varieties by
187
Study of Secondary Grape Metabolites. Journal of Agricultural and Food Chemistry 58,
11364-11371.
De Rosso M, Panighel A, Dalla Vedova A, Stella L, Flamini R. 2009. Changes in
Chemical Composition of a Red Wine Aged in Acacia, Cherry, Chestnut, Mulberry, and
Oak Wood Barrels. Journal of Agricultural and Food Chemistry 57, 1915-1920.
Deluc L, Quilici D, Decendit A, Grimplet J, Wheatley M, Schlauch K, Merillon J-M, Cushman J, Cramer G. 2009. Water deficit alters differentially metabolic pathways
affecting important flavor and quality traits in grape berries of Cabernet Sauvignon and
Chardonnay. BMC Genomics 10, 212.
Guillaumie S, Fouquet R, Kappel C, Camps C, Terrier N, Moncomble D, Dunlevy J, Davies C, Boss P, Delrot S. 2011. Transcriptional analysis of late ripening stages of
grapevine berry. BMC Plant Biology 11, 165.
Mattivi F, Guzzon R, Vrhovsek U, Stefanini M, Velasco R. 2006. Metabolite Profiling
of Grape: Flavonols and Anthocyanins. Journal of Agricultural and Food Chemistry 54,
7692-7702.
Mica E, Piccolo V, Delledonne M, Ferrarini A, Pezzotti M, Casati C, Del Fabbro C, Valle G, Policriti A, Morgante M, Pesole G, Pe ME, Horner D. 2009. High throughput
approaches reveal splicing of primary microRNA transcripts and tissue specific expression
of mature microRNAs in Vitis vinifera. BMC Genomics 10, 558.
Pourcel L, Routaboul J-M, Cheynier V, Lepiniec L, Debeaujon I. 2007. Flavonoid
oxidation in plants: from biochemical properties to physiological functions. Trends in
Plant Science 12, 29-36.
Ribéreau-Gayon P, Glories Y, Maujean A, Dubourdieu D. 2006. Phenolic Compounds.
Handbook of Enology: John Wiley & Sons, Ltd, 141-203.
Rizzini FM, Bonghi C, Tonutti P. 2009. Postharvest water loss induces marked changes
in transcript profiling in skins of wine grape berries. Postharvest Biology and Technology
52, 247-253.
Soumya Raychaudhuri JMS, and Russ B. Altman. 2000. Principal components analysis
to summarize microarray experiments: application to sporulation time series. PMC.
Hawaii, Sheraton Waikiki, 455-466.
Sun B, Leandro MC, de Freitas V, Spranger MI. 2006. Fractionation of red wine
polyphenols by solid-phase extraction and liquid chromatography. Journal of
Chromatography A 1128, 27-38.
Terrier NaRC. 2001. Grape berry acidity. In: Roubelakis-Angelakis, ed. Molecular
biology and biotechnology of the grapevine. Dordrecht, 35-57.
Tilbrook J, Tyerman SD. 2009. Hydraulic connection of grape berries to the vine:
varietal differences in water conductance into and out of berries, and potential for
backflow. Functional Plant Biology 36, 541-550.
188
Tonutti P, Bonghi C. 2013. Biochemical and molecular changes in grap berries during
extended on-vine ripening and postharvest dehydration. In: Wiley-Blackwell, ed. Sweet,
Reinforced and Fortified Wines: Grape Biochemistry, Technology and Vinification.
Usadel B, Nagel A, Steinhauser D, Gibon Y, Blasing O, Redestig H, Sreenivasulu N, Krall L, Hannah M, Poree F, Fernie A, Stitt M. 2006. PageMan: An interactive
ontology tool to generate, display, and annotate overview graphs for profiling
experiments. BMC Bioinformatics 7, 535.
Vannozzi A, Dry I, Fasoli M, Zenoni S, Lucchin M. 2012. Genome-wide analysis of the
grapevine stilbene synthase multigenic family: genomic organization and expression
profiles upon biotic and abiotic stresses. BMC Plant Biology 12, 130.
Versari A, Parpinello GP, Tornielli GB, Ferrarini R, Giulivo C. 2001. Stilbene
Compounds and Stilbene Synthase Expression during Ripening, Wilting, and UV
Treatment in Grape cv. Corvina. Journal of Agricultural and Food Chemistry 49, 5531-
5536.
WANG ZP, DELOIRE A, CARBONNEAU A, FEDERSPIEL B, LOPEZ F. 2003. An
in vivo Experimental System to Study Sugar Phloem Unloading in Ripening Grape
Berries During Water Deficiency Stress. Annals of Botany 92, 523-528.
Yang J, Meyers KJ, van der Heide J, Liu RH. 2004. Varietal Differences in Phenolic
Content and Antioxidant and Antiproliferative Activities of Onions. Journal of
Agricultural and Food Chemistry 52, 6787-6793.
Yang YH, Dudoit S, Luu P, Lin DM, Peng V, Ngai J, Speed TP. 2002. Normalization
for cDNA microarray data: a robust composite method addressing single and multiple
slide systematic variation. Nucleic Acids Research 30, e15.
Zamboni A, Di Carli M, Guzzo F, Stocchero M, Zenoni S, Ferrarini A, Tononi P, Toffali K, Desiderio A, Lilley KS, Pè ME, Benvenuto E, Delledonne M, Pezzotti M.
2010. Identification of Putative Stage-Specific Grapevine Berry Biomarkers and Omics
Data Integration into Networks. Plant Physiology 154, 1439-1459.
Zamboni A, Minoia L, Ferrarini A, Tornielli GB, Zago E, Delledonne M, Pezzotti M.
2008. Molecular analysis of post-harvest withering in grape by AFLP transcriptional
profiling. Journal of Experimental Botany 59, 4145-4159.
Ziliotto F, Corso M, Rizzini F, Rasori A, Botton A, Bonghi C. 2012. Grape berry
ripening delay induced by a pre-veraison NAA treatment is paralleled by a shift in the
expression pattern of auxin- and ethylene-related genes. BMC Plant Biology 12, 185.
Le Fur C.H.Y, Bard M-H, Olsson A. 1994. Evolution of phytosterols in Chardonnay
grape berry skins during last stages of ripening. Vitis 33, 5.
Choat B., Gambetta GA, Shackel KA, Matthews MA. 2009. Vascular function in grape
berries across development and its relevance to apparent hydraulic isolation, Plant
Physiology 151, 1677–1687.


![15. Rilascio Modificato Orale [modalità compatibilità]users.unimi.it/gazzalab/wordpress/wp-content/uploads/2011/12/15... · (matrici, sistemi reservoir, sistemi osmotici) Ad unità](https://static.fdocuments.in/doc/165x107/5c66613309d3f2e4308c188b/15-rilascio-modificato-orale-modalita-compatibilitausersunimiitgazzalabwordpresswp-contentuploads20111215.jpg)


