A THREE-STAGE MODEL OF INDUSTRIAL TRADE SHOW PERFORMANCEgarylilien.info/publications/68 -...
21
MARKETING SCIENCE Val 14. No I. Winter 1995 Prinrrd rn US 4 A THREE-STAGE MODEL OF INDUSTRIAL TRADE SHOW PERFORMANCE SRINATH GOPALAKRISHNA AND GARY L. LILlEN Smeal College of Business Administration, The Pennsylvania Slate University, University Park, Pennsylvania 16802 Trade shows are an important but under-researched component of the promotion mix for most industrial products. In this paper, we develop a three-stage model of trade show performance. relying on different indices of performance at each stage: attraction, contact, and conversion efficiency. We model the impact of preshow promotion, booth space, use of attention-getting techniques, competition, number and training of booth salespeople on the extent of attraction, contact. and conversion. The results from an empirical application using data from 85 firms that participated in a major trade show in 199 1 suggest significant and different impact of these variabies. In addition, we illustrate how the model can be used to evaluate trade-offs among differentdecision variables.,Finally, we develop some general results implied by our model concerning the optimal allocation of trade show resources. (Industrial Marketing; Marketing Mix; Trade Shows) Introduction Trade shows are a bit like industrial versions of shopping malls: they are industrial examples of potential buyers visiting prospective sellers. And, like at the shopping mall, most attendees either have specific plans to buy a product in the category exhibited or at least exert some degree of influence on purchase decisions in the category (Trade Show Bureau 1986). Thus trade shows could be a unique and potentially attractive industrial promotion vehicle. Next to expenditures on print advertising, trade shows represent the largest component of the advertising and promotion budget for industrial firms (Business .Warketing 1990a). As the cost of sales calls continues to escalate ($292 for one sales cali, Cahners Advertising Research Report 1992), the costs of a contact at a trade show and the cost to close a sale subsequently, as reported by trade show operators (about $ 186 to reach a prospect using trade shows and about 0.8 sales calls to close a sale thereafter; Trade Show Blireazi 1992) make trade shows attractive complements to alternative forms of promotion. Amongst the indications that trade shows provide marketing value are the projections that in the next five years, the number of net square feet of exhibit space, the number of exhibiting firms and the total attendance are expected to increase by nearly 30% over the levels in 1991 (Trade Show Bureau 1991 ). In spite of the large expenditures involved (over $9 billion in direct expendirures aionr in 1987: Btisine.~.~ 12.Iarki.tin~ 1988), few studies have appeared that systematically explain
Transcript of A THREE-STAGE MODEL OF INDUSTRIAL TRADE SHOW PERFORMANCEgarylilien.info/publications/68 -...
MARKETING SCIENCE Val 14. No I. Winter 1995
Prinrrd rn U S 4
A THREE-STAGE MODEL OF INDUSTRIAL TRADE SHOW PERFORMANCE
SRINATH GOPALAKRISHNA AND GARY L. LILlEN Smeal College of Business Administration, The Pennsylvania Slate University,
University Park, Pennsylvania 16802
Trade shows are an important but under-researched component of the promotion mix for most industrial products. In this paper, we develop a three-stage model of trade show performance. relying on different indices of performance at each stage: attraction, contact, and conversion efficiency. We model the impact of preshow promotion, booth space, use of attention-getting techniques, competition, number and training of booth salespeople on the extent of attraction, contact. and conversion. The results from an empirical application using data from 85 firms that participated in a major trade show in 199 1 suggest significant and different impact of these variabies. In addition, we illustrate how the model can be used to evaluate trade-offs among different decision variables.,Finally, we develop some general results implied by our model concerning the optimal allocation of trade show resources. (Industrial Marketing; Marketing Mix; Trade Shows)
Introduction
Trade shows are a bit like industrial versions of shopping malls: they are industrial examples of potential buyers visiting prospective sellers. And, like at the shopping mall, most attendees either have specific plans to buy a product in the category exhibited or at least exert some degree of influence on purchase decisions in the category (Trade Show Bureau 1986) . Thus trade shows could be a unique and potentially attractive industrial promotion vehicle.
Next to expenditures on print advertising, trade shows represent the largest component of the advertising and promotion budget for industrial firms (Business .Warketing 1990a). As the cost of sales calls continues to escalate ($292 for one sales cali, Cahners Advertising Research Report 1992), the costs of a contact at a trade show and the cost to close a sale subsequently, as reported by trade show operators (about $ 186 to reach a prospect using trade shows and about 0.8 sales calls to close a sale thereafter; Trade Show Blireazi 1992) make trade shows attractive complements to alternative forms of promotion. Amongst the indications that trade shows provide marketing value are the projections that in the next five years, the number of net square feet of exhibit space, the number of exhibiting firms and the total attendance are expected to increase by nearly 30% over the levels in 1991 (Trade Show Bureau 1991 ).
In spite of the large expenditures involved (over $9 billion in direct expendirures aionr in 1987: Btisine.~.~ 12.Iarki.tin~ 1988), few studies have appeared that systematically explain
INDUSTRIAL TRADE SHOW PERFORMANCE 23
ttade show performance. This lack of definitive research results from several closely connected factors. Many firms do not even specify their objectives when participating at a trade show, much less attempt to quantify them. Company representatives use phrases like "we go to trade shows because our competitors are there" and "it is mostly a matter of image" (Bonoma 1983). The lack of clear objectives, combined with the lack of a unified framework for evaluating performance, have forced managers to rely primarily on judgement when deciding on show selection, product(s) to be exhibited, booth size, amount of preshow advertising, etc.
These two concerns-the lack of clear or consistent objectives and the relationship of those objectives to the variables under the control of the firm-are the issues that engage us here. While some research exists examining the way managers rate the performance of their firm along several dimensions (Kerin and Cron 1987, for example), we have not been able to locate research recognizing differing objectives-such as corporate image enhancement, brand awareness, interest generation, lead generation and the like (Hutt and Speh 1995, p. 495)-among exhibitors at the same show and how those differing objectives relate to the several tactical variables under the firm's control. More specifically, we propose a more direct assessment of trade show performance using multiple indices such that differing show objectives can be directly translated into appropriate performance measures. We then explicitly link these performance measures to tactical variables under the control of the exhibiting firm.
In the following sections, we develop and present a conceptual framework to relate several of the most frequently-mentioned objectives of trade show participation to mea- sures of performance associated with exhibit-booth traffic flow. We then propose hy- potheses concerning those tactical variables that we believe have an influence on the corresponding performance measure. We develop a set of models linking the tactical variables to three performance measures and perform an exploratory analysis calibrating the model with data from one important trade show. Based on the parameter estimates, we discuss the explicit assessment of trade-offs between key variables given the firm's objective. Finally, we discuss normative implications and suggest areas for further research.
Conceptual Development
Previous Research on Trade Shows While researchers have acknowledged the importance of trade shows in the business
marketing mix (Cavanaugh 1976, Moriarty and Spekman 1984), they have also ac- knowledged that little systematic research about trade shows exists (Rosson and Seringhaus 1990). Most of the work in the critical area of performance assessment has been con- ceptual, using surrogate measures like audience activity, and audience quality (Bellizzi and Lipps 1984, Cavanaugh 1976). The limited empirical work on trade shows includes exploratory descriptive work (Lilien 1983), focussing on factors that affect participation and spending, given participation. That study found that firms with complex, less fre- quently purchased products, with high sales levels and high customer concentration were more likely to participate in trade shows. Among those participating in trade shows, firms with products in the early stages of the life cycle, having high total-firm sales, aggressive product plans, and low customer concentration tended to spend more. But the study said nothing about the effectiveness either of participation or of the spending.
Kerin and Cron ( 1987) examined the selling and nonsclling dimensions of trade show participation. They found that better performing firms (as rated by the firms themselves) exhibited a greater number of products, had more customers, greater sales volume, had specified show objectives and used fewer horizontal shows (broad-based end user audience) and marc vertical shows (narrow end user audience).
Bello (1992), studied buying behavior at trade shows and reported that ( i ) attendee

24 SRiNATH GOPALAKRISHNA AND GARY L. LILIEN
involvement in purchase decisions is positively related to his/her position in the firm's authority structure (hierarchical level) but involvement is negatively related to firm size, (ii) transaction information (price, terms of sale, etc.) is important for attendees in upper authority positions whereas both transaction and technical information (operating char- acteristics, technology, ete.) are Important for attendees from small firms, and (iii) at- tendees in tower authority positions tend to use nonpersonal sources, attendees from small firms use personal in-exhibit sources and attendees from large firms use personal out-of-exhibit sources of information.
While the above studies add to our general understanding, they do not address the differing objectives exhibitors may have and the relationship between tactical variables and those different objectives.
The nature as well as the source of information about trade show performance delimits possible analyses and conclusions. Consider the nature of information: performance mea- sures can be subjective or objective. Subjective assessments typically use rating scales where a respondent rates some aspect of performance. For example, Kerin and Cron ( 1987) used a 7-point Likert type scale ( 1 = very poor, 7 = very good) to measure several aspects of trade show performance such as prospect identification, enhancing corporate image, etc.
Objective measures such as the number of sales leads or number of visitors at a booth, while seemingly more appealing, are generally proprietary and have been reported in the academic literature only on a limited basis.
While the industrial purchasing process involves interaction between buyers and sellers, suppliers have been the traditional source of infarmation on performance. For example, Kerin and Cron ( 1987) asked exhibit managers and marketing executives at exhibiting firms to rate their own firm's performance at the show. Such measures reflect management attitudes, and may not correspond to the attitudes of show attendees, which are key in measuring show effectiveness (Promotion Marketing 1989). We have found no other published research that has used data from both sources, as we do here.
Role of Trade Shows in the Marketing Mix
Personal selling is usually the largest single item in the business marketing commu- nications mix (Lilien 1979, Lilien and Weinstein 1983). Trade shows, like advertising, are typically viewed as complementary to the direct selling activity. For example, trade shows uncover previously unknown or inaccessible buying influences, can project a fa- vorable corporate image, can provide product information, generate qualified leads for salespeople, handle customer complaints, etc. (Hutt and Speh 1995, p. 495). In addition, trade shows satisfy competitive objectives and serve to enhance employee morale.
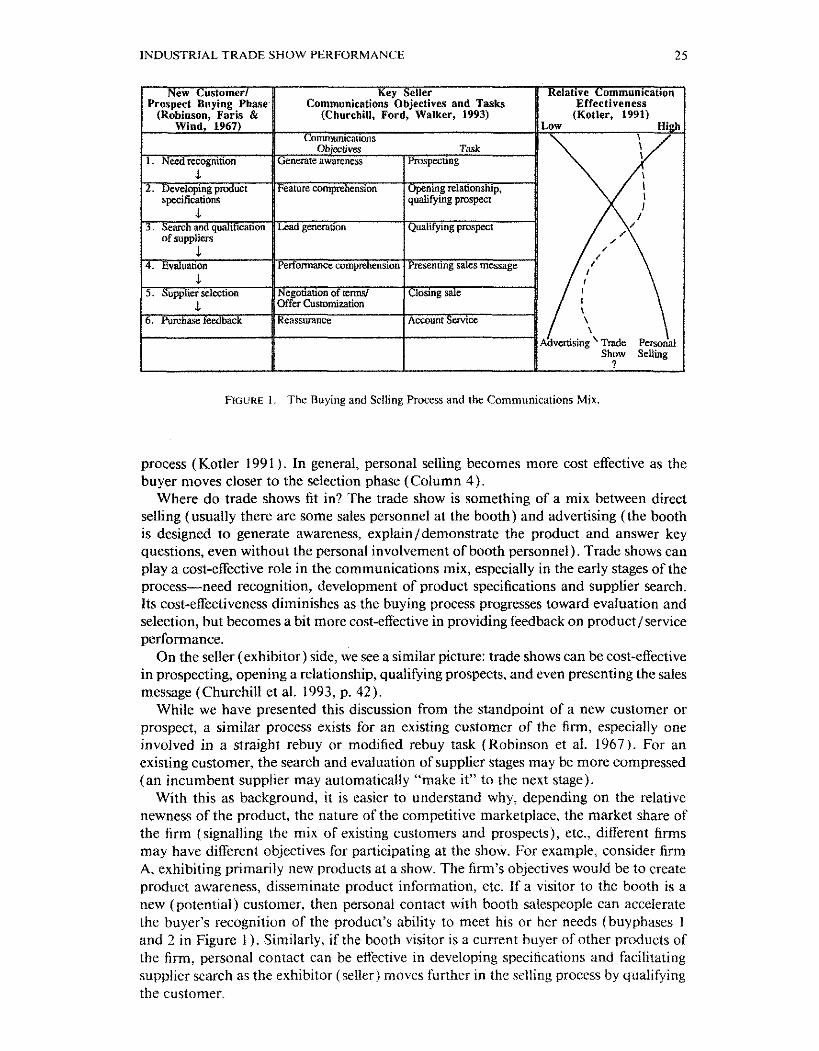
To appreciate tbe role of the trade show in the marketing communications mix, it is useful to view the trade show in the context of both the buying and the selling process stages (Figure 1 ) .
Robinson et al. ( 1967), and many researchers since then have characterized the in- dustrial buying process as a series of stages (see Wind and Thomas 1994). Column I of the exhibit highlights those stages. Buyers in these different stages have different infor- mation needs. Similarly, the seller also faces a multistage selling process that involves different communication objectives (Column 2) , which in turn lead to different com- munication tasks for the seller (Column 3). As some of those objectives (like generating awareness) are handled more cost-effectively by impersonal marketing communications while others (like offering customization) by personal contact, most suppliers employ a mix of communication vehicles.
Figure 1 also displays the relative cost-effectiveness of advertising and personal selling in performing the needed communications tasks, depending on the stage of the buying
INUUSrRlAL TRADE SHOW PERFORMANCE 25
FIGURE 1. The Buying and Selling Process and the Communications Mix
process (Kotler 1991). In general, personal selling becomes more cost effective as the buyer moves closer to the selection phase (Column 4).
Where do trade shows fit in? The trade show is something of a mix between direct selling (usually there are some sales personnel at the booth) and advertising (the booth is designed to generate awareness, explain/demonstrate the product and answer key questions, even without the personal involvement of booth personnel). Trade shows can play a cost-effective role in the communications mix, especially in the early stages of the process-need recognition, development of product specifications and supplier search. Its cost-effectiveness diminishes as the buying process progresses toward evaluation and selection, but becomes a bit more cost-effective in providing feedback on product /service performance.
On the seller (exhibitor) side, we see a similar picture: trade shows can be cost-effective in prospecting, opening a relationship, qualifying prospects, and even presenting the sales message (Churchill et al. 1993, p. 42).
While we have presented this discussion from the standpoint of a new customer or prospect, a similar process exists for an existing customer of the firm, especially one involved in a straight rebuy or modified rebuy task (Robinson et al. 1967). For an existing customer, the search and evaluation of supplier stages may be more compressed (an incumbent supplier may aulomatically "make it" to the next stage).
With this as background, it is easier to understand why, depending on the relative newness of the product, the nature of the competitive marketplace. the market share of the firm (signalling the mix of existing customers and prospects), etc., different firms may have different objectives for participating at the show. For example, consider firm A, exhibiting primarily new products at a show. The firm's objectives would be to create product awareness, disseminate product information, etc. If a visitor to the booth is a new (potential) customer, then personal contact with booth salespeople can accelerate the buyer's recognition of the product's ability to meet his or her needs (buyphases 1 and 2 in Figure 1 ). Similarly, if the booth visitor is a current buyer of other products of the firm, personal contact can be effective in developing specifications and facili~ating supplier search as the exhibitor (seller) moves further in the selling process by qualifying the customer.
26 SRINATH GOPALAKRISEINA AND GARY L. LILIEN
Consider, now, firm B, exhibiting some products that are currently on the market (existing products). Its objective at the trade show could be to seek feedback on current product and/or service performance (buyphase 6 ) with current customers. With new customers (prospects), its objectives would be similar to those for firm A: qualifying the individual as a viable prospect and getting the firm qualified as a viable supplier for that prospect.
The above discussion suggests that business marketing communications in general, and trade shows in particular, help move customers and prospects sequentially through a buying process. Trade shows do this by first attracting an audience to the booth, making contact with interested visitors (among those attracted), qualifling/converting a portion of the interested contacts into sales leads, and so on. It seems reasonable to expect that different tactical variables could have a different impact on different measures of effec- tiveness: booth size may he critical in attracting an audience while the quality of booth personnel may be key in turning booth visitors into viable sales leads.
This flow process is analogous to that for the adoption of new packaged goods (Parfitt and Collins 1968: market share of a brand = proportion aware X proportion of new buyers given awareness X repeat purchasing rate given awareness and trial) and that of Choffray and Lilien ( 1980) in organizational buying (probability of choice conditional on awareness, meeting specs, preference, etc.).
Conceptual Framework
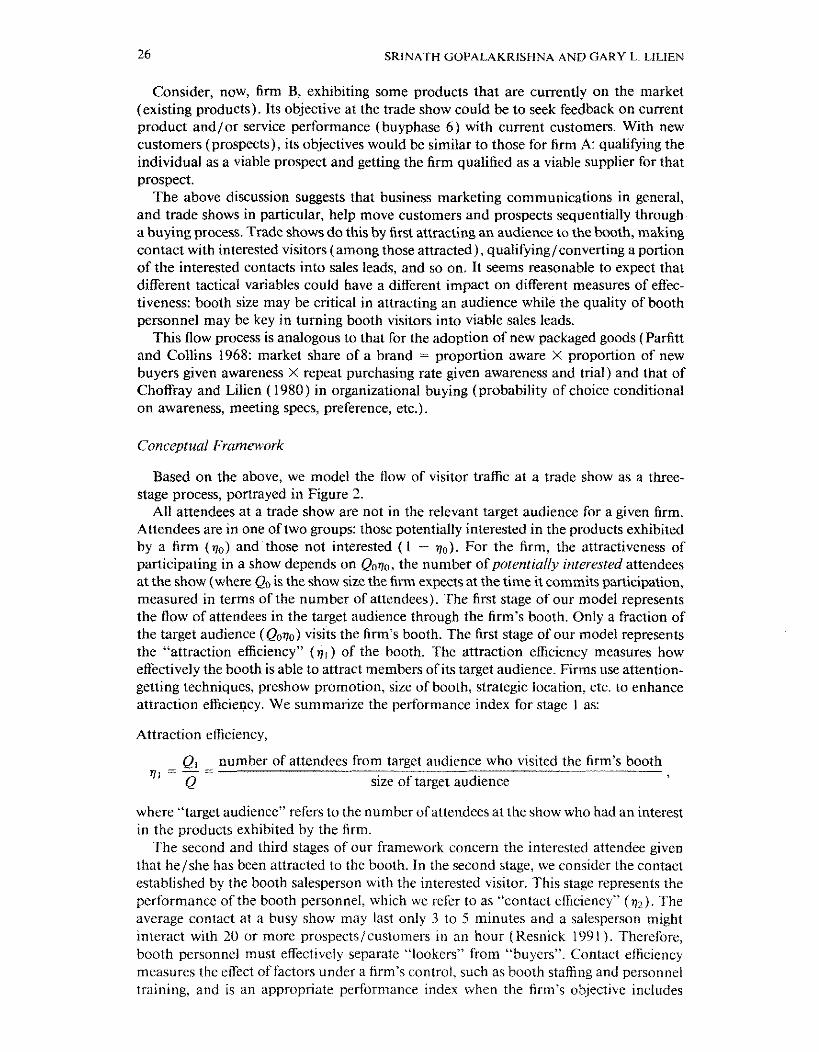
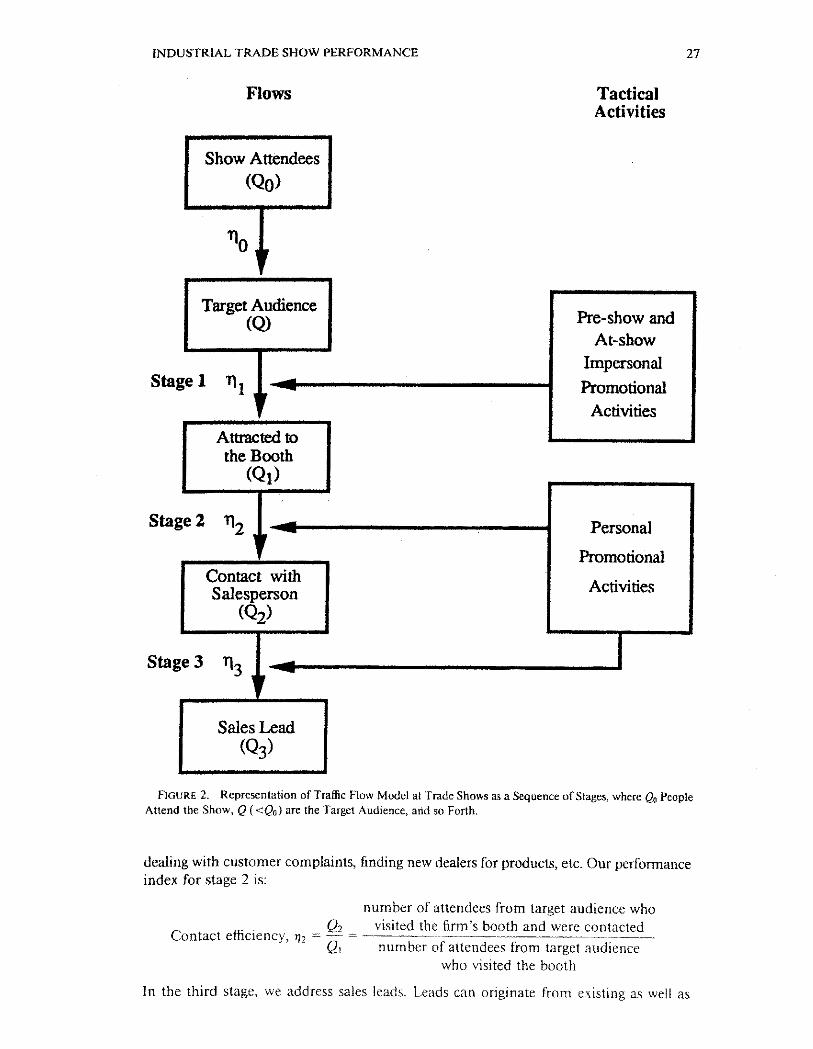
Based on the above, we model the flow of visitor traffic at a trade show as a three- stage process, portrayed in Figure 2.
A11 attendees at a trade show are not in the relevant target audience for a given firm. Attendees are in one of two groups: those potentially interested in the products exhibited by a firm (qo) and those not interested ( 1 - v0). For the firm, the attractiveness of participating in a show depends on Q o ~ o , the number of potentially interested attendees at the show (where QO is the show size the firm expects at the time it commits participation, measured in terms of the number of attendees). The first stage of our model represents the flow of attendees in the target audience through the firm's booth. Only a fraction of the target audience (Qoqo) visits the firm's booth. The first stage of our model represents the "attraction efficiency" ( q , ) of the booth. The attractron efficiency measures how effectively the booth is able to attract members of its target audience. Firms use attention- getting techniques, preshow promotion, size of booth, strategic location, etc. to enhance attraction efficiency. We summarize the performance index for stage 1 as:
Attraction efficiency,
Ql number of attendees from target audience who visited the firm's booth vi = - = Q size of target audience
where "target audience" refers to the number of attendees at the show who had an interest in the products exhibited by the firm.
The second and third stages of our framework concern the interested attendee given that he/she has been attracted to the booth. In the second stage, we consider the contact established by the booth salesperson with the interested visitor. This stage represents the performance of the booth personnel, which we refer to as "contact efficiency" (qz). The average contact at a busy show may last only 3 to 5 minutes and a salesperson might interact with 20 or more prospectsicustomers in an hour (Resnick 1991). Therefore, booth personnel must effectively separate "lookers" fkom "buyers". Contact eflicicncy measures thc effect of factors under a firm's control, such as booth staffing and personnel training, and is an appropriate performance index when the firm's objective includes
INDUSTRIAL TRADE SHOW PERFORMANCE
Flows Tactical Activities
I he-show and At-show
Impersonal - Stage 1 ' 14-1 homtional
Activities k 1
Ataacted to I the ~ a o t i ~ I Stage2 V2 Personal
" notional Contact with Salesperson Activities
Stage3 9 I Sales Lead
FIGURE 2. Representation of Traffic Row Model at Trade Shows as a Sequence of Stages, where Qa People Attend the Show, Q (<Qo) are the Target Audience, and so Forth.
dealing with customer complaints, finding new dealers for products, etc. Our performance index for stage 2 is:
number of attendees from target autirence who Q2 cls~tcd the firm's booth and were contacted
Contact efficrency, i j 2 = -- = --- Q, number of attendees from target aud~ence
who vtstted the booth
In the third stage, we address sales leads. I.eads can originate fronl existing as well as
28 SRlNATFI GOPALAKRISHNA AND GARY L LlLlEN
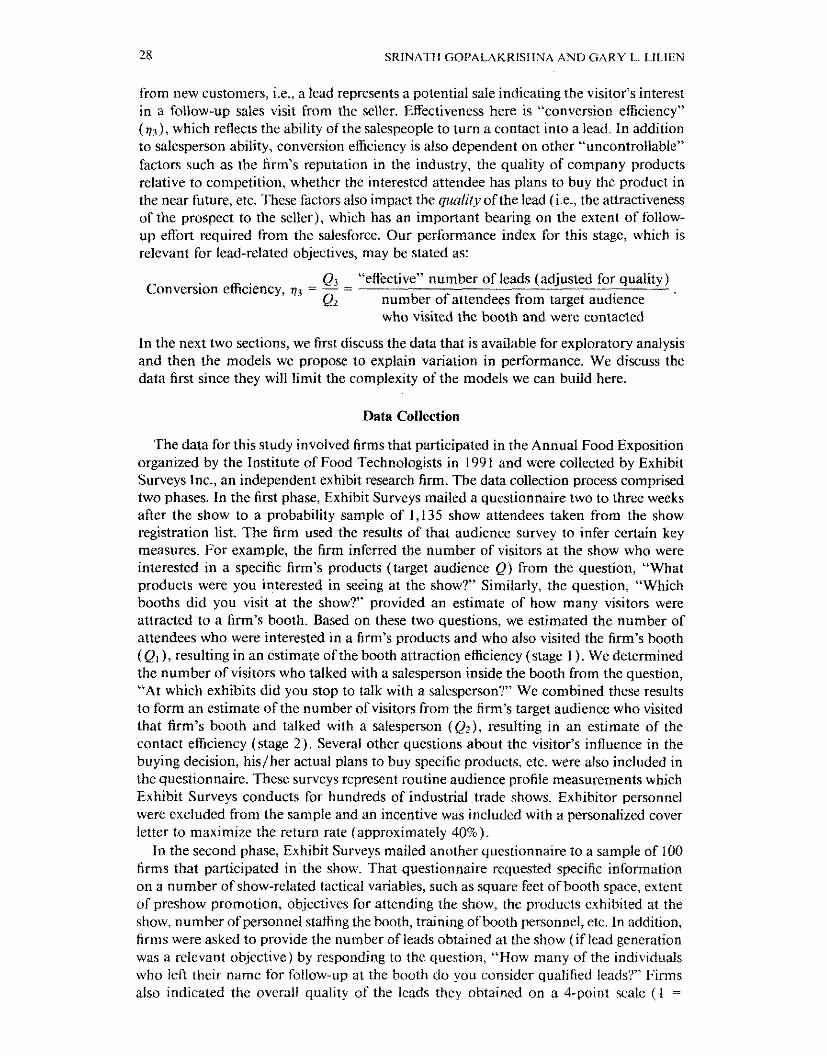
from new customers, i.e., a lead represents a potential sale indicating the visitor's interest in a follow-up sales visit from the seller. Effectiveness here is "conversion efficiency" (v3), which reflects the ability of the salespeople to turn a contact into a lead. In addition to salesperson ability, conversion efficiency is also dependent on other "uncontrollable" factors such as the firm's reputation in the industry, the quality of company products relative to competition, whether the interested attendee has plans to buy the product in the near future, etc. These factors also impact the quality of the lead (i.e., the attractiveness of the prospect to the seller), which has an important bearing on the extent of follow- up effort required from the salesforce. Our performance index for this stage, which is relevant for lead-related objectives, may be stated as:
Q3 "effective" number of leads (adjusted for quality) Conversion efficiency, 113 = - =
02 number of attendees from target audience - who visited the booth and were contacted
In the next two sections, we first discuss the data that is available for exploratory analysis and then the models we propose to explain variation in performance. We discuss the data first since they will limit the complexity of the models we can build here.
Data Collection
The data for this study involved firms that participated in the Annual Food Exposition organized by the Institute of Food Technologists in 1991 and were collected by Exhibit Surveys Inc., an independent exhibit research firm. The data collection process comprised two phases. In the first phase, Exhibit Surveys mailed a questionnaire two to three weeks after the show to a probability sample of 1,135 show attendees taken from the show registration list. The firm used the results of that audience survey to infer certain key measures. For example, the firm inferred the number of visitors at the show who were interested in a specific firm's products (target audience Q) from the question, "What products were you interested in seeing at the show?" Similarly, the question, "Which booths did you visit at the show?'provided an estimate of how many visitors were attracted to a firm's booth. Based on these two questions, we estimated the number of attendees who were interested in a firm's products and who also visited the firm's booth (Q, ), resulting in an estimate of the booth attraction efficiency (stage I ). We determined the number of visitors who talked with a salesperson inside the booth from the question, "At which exhibits did you stop to talk with a salesperson?Ve combined these results to form an estimate of the number of visitors from the firm's target audience who visited that firm's booth and talked with a salesperson (Q2), resulting in an estimate of the contact efficiency (stage 2) . Several other questions about the visitor's influence in the buying decision, his/her actual plans to buy specific products, etc. were also included in the questionnaire. These surveys represent routine audience profile measurements which Exhibit Surveys conducts for hundreds of industrial trade shows. Exhibitor personnel were excluded from the sample and an incentive was included with a personalized cover letter to maximize the return rate (approximately 40%).
In the second phase, Exhibit Surveys mailed another questionnaire to a sample of 100 firms that participated in the show. That questionnaire requested specific information on a number of show-related tactical variables, such as square feet of booth space, extent of prcshow promotion, ob.jectives for attending the show, the products exhibited at the show, number ofpersonnel staffing the booth, training ofbooth personnel, etc. In addition, firms were asked to provide the number of leads obtained at the show (if lead generation was a relevant objective) by responding to the question, "How many of the individuals who left their name for follow-up at the booth do you consider qualified leads'!" Finns also indicated the overall quality of the leads they obtained on a 4-point scale ( 1 =
INDUSTRIAL TRADE SHOW PERFORMANCE 29
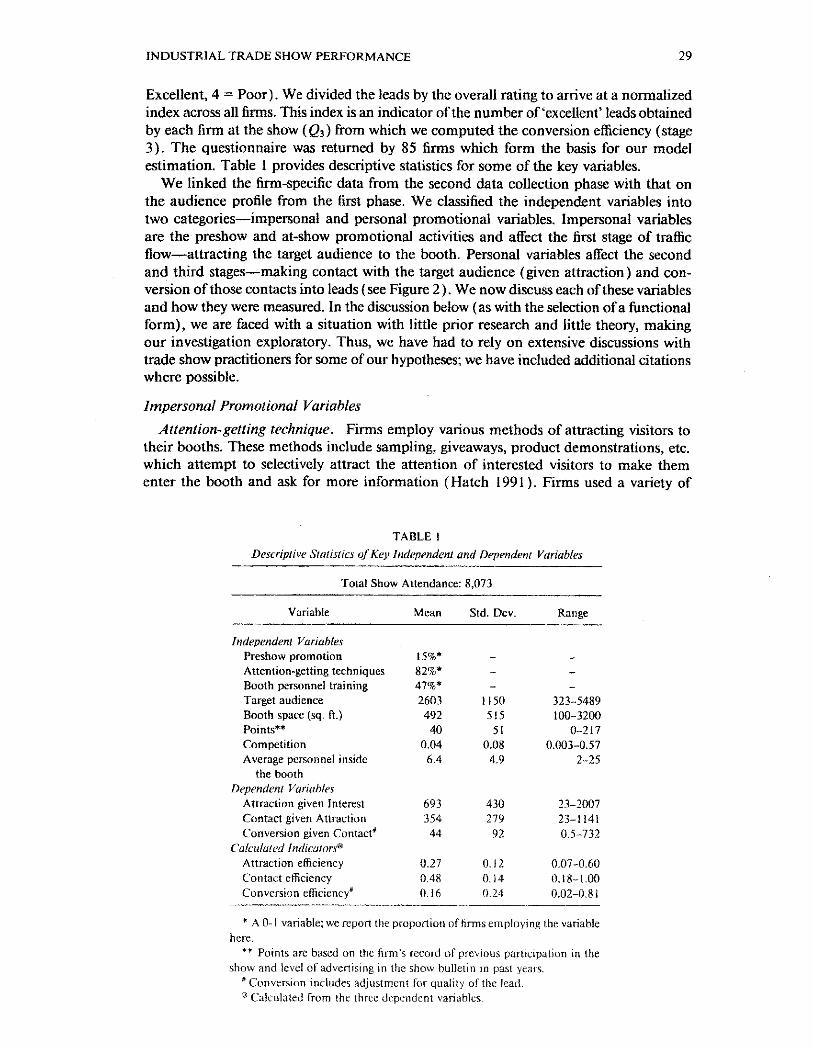
Excellent, 4 = Poor). We divided the leads by the overall rating to arrive at a normalized index across all firms. This index is an indicator of the number of 'exceUent' leads obtained by each firm at the show (Q3) from which we computed the conversion efficiency (stage 3). The questionnaire was returned by 85 firms which form the basis for our model estimation. Table 1 provides descriptive statistics for some of the key variables.
We linked the firm-specific data from the second data collection phase with that on the audience profile from the first phase. We classified the independent variables into two categories-impersonal and personal promotional variables. Impersonal variables are the preshow and at-show promotional activities and affect the first stage of traffic flow-attracting the target audience to the booth. Personal variables affect the second and third stages-making contact with the target audience (given attraction) and con- version of those contacts into leads (see Figure 2). We now discuss each of these variables and how they were measured. In the discussion below (as with the selection of a functional form), we are faced with a situation with little prior research and little theory, making our investigation exploratory. Thus, we have had to rely on extensive discussions with trade show practitioners for some of our hypotheses; we have included additional citations where possible.
Impersonal Promotional Variables
Aftention-getting technique. Firms employ various methods of attracting visitors to their booths. These methods include sampling, giveaways, product demonstrations, etc. which attempt to selectively attract the attention of interested visitors to make them enter the booth and ask for more information (Hatch 1991 ). Firms used a variety of
TABLE I Deseriprivc Slalislics qf Key lndrppndenl and Dependent Vorioblrs
Total Show Attendance: 8,073
Variable Mean Std, Dev. Range
Indepr*ndenl Variublrs Preshow promotion Attention-getting techniques Booth personnel training Target audience Booth space (sq. ft.) Points** Competition Average personnel inside
the hooth Dependent Variuhies
Attraction given Interest Contact given Attraction Conversion given ContactY
(hlcrclu/(~d lndicutors" Attraction efficiency Contact efficiency Conversion efficiency*
* A 0- I variable: we repurl the proportion of firms employing the variable here.
** Points are based on the firm's record of previous paiticipation in the show and level of advertising in the show bulletin in past years.
" Cunvsnion includes adjustment For quality of the lead. "Calculated fiorn the three dependent varidhles.

30 SRINATH GOPALAKKISHNA A N D G A R Y L. I.ILIEN
techniques at this show; however, food samples or giveaways such as pens, cups, etc. were generally the most popular. We classified firms based on whether they used food sampling or giveaways at their booths to attract visitors ( A = 0 ) as opposed to not using such techniques ( A = 1 ). We hypothesize a positive effect on Ql .
Preshow promatlon. Many firms promote the fact that they will be exhibiting at a particular show well in advance (Business Market~ng 1990b). Based on advance regis- tration lists available from show organizers and their own customer/prospect lists, firms use telephone calls, direct mail, etc. to contact customers and invite them to visit their booth at the show. For most firms, the decision is whether or not to: contact the customer/ prospect list by phone, use direct mail with the list, take a page of advertising in the related trade book, etc. The number of different instmments combined with our relatively small sample precluded our including each instrument separately in the analysis and the "lumpy" nature ofthe data suggested a discrete form for this variable. We grouped firms based on extent of promotion-heavy ( M = 0 ) (>$10,000 by our estimate) versus limited or no preshow promotion ( M = 1) . We hypothesize a positive effect of this variable on Qt .
Booth space. The attractiveness of a firm's booth is directly related to booth size. other things being equal. Swandby ( 1982) has suggested that the amount of booth space should be decided in relation to the size of the potential audience. For agiven size ofthe potential audience, an increase in booth size results in a greater number of visitors attracted from that audience. We consider booth size in terms of square feet of space (a continuous variable) and hypothesize a positive effect of this variable on Q, . This is analogous to retail product movement related to shelf space (Bultcz and Naert 1988).
Polnts. "Points" is a continuous variable and represents the exhibiting firm's longevity of association with the 1FT Annual Food Expo. The show management offers preference in booth location to exhibiting firms that have more points. The system is designed to encourage firms to advertise in the show's trade bulletin published every month and to continue exhibiting at the same show every year.' Thus, to some degree. points indicate the firm's visibility /familiarity among the target audience. It is also a reasonable proxy variable for the attractiveness of booth location on the show floor. We hypothesize a positive effect of cumulative points on Q1 (Bultez and Naert 1988).
Competition. Firms exhibiting at a trade show may be involved in competitive activity, in the sense that they compete for the prospect's time. The competition may be more relevant among firms exhibiting "similar" products at the show. However, attendees at a trade show typically visit several hooths, despite time constraints (Trade Show Bureau 1989), similar to the behavior of customers at a shopping mall (Gautchi 1981). The effect of a competitor's hooth on a given firm's booth (measured in terms of the impact on Q,) might then be either one of the following:
( i) no effect on Q, , ( i i ) a synergy or complementary effect where one booth benefits from another booth's
presence nearby (similar to the effect observed in retail stores within a shopping mall) (positive effect on Q , ) ,
(iii) a substitution effect where the presence of one con~petitor directly hurts the other competitors (negative effect on Q,) .
Given our data set, we developed an index of competition based on square feet of space among firms exhibiting "similar" products in the form of an attraction model, i.e.,
' Points are awarded based on the number of pages ofadvefiising in the show bulletin and amount of hooth space in each of the previous 5 years. For examplc. 6 to I I ad pages in one year is worth 4 point? and a I0 feet A 10 feet booth in the past ycar is worth I point.
INDUSTRIAL TRADE SHOW PERFORMANCE 3 1
an us/(us + them) formulation. There were four product categories at this show-in- gredientsfadditives, equipment/supplies, services, and other products. To assess the "competition" variable, we classified firms that exhibited products in multiple categories into the category where they had the greatest number of products.
Personal Promotional Variables
Boolh personnel training. Trade show selling is fast-paced and competitive. Thus, the sales team must meet as many prospects as they can, qualify their leads, then move on to the next ones (Hatch 1991, Resnick 1991 ). In order to maximize effectiveness, per- sonnel must quickly separate "lookers" from "buyers." Booth personnel can be trained to perform these tasks efficiently. Our data indicated whether such training was provided ( T = 0) or not ( T = I ). We hypothesize a positive effect on Q2 and Q3.
Number of booth personnel. The average number of salespeople at the booth should affect contact and conversion efficiency (Lodish et ai. 1988). Clearly, for a given number of interested visitors attracted to the booth (Q,), more booth personnel can make more contacts with visitors. Also, for a given number of contacts, a greater number of booth personnel can have a higher degree of persistence of selling effort, resulting in a greater number of leads. We hypothesize a positive effect of this variable on Q2 and Q3.
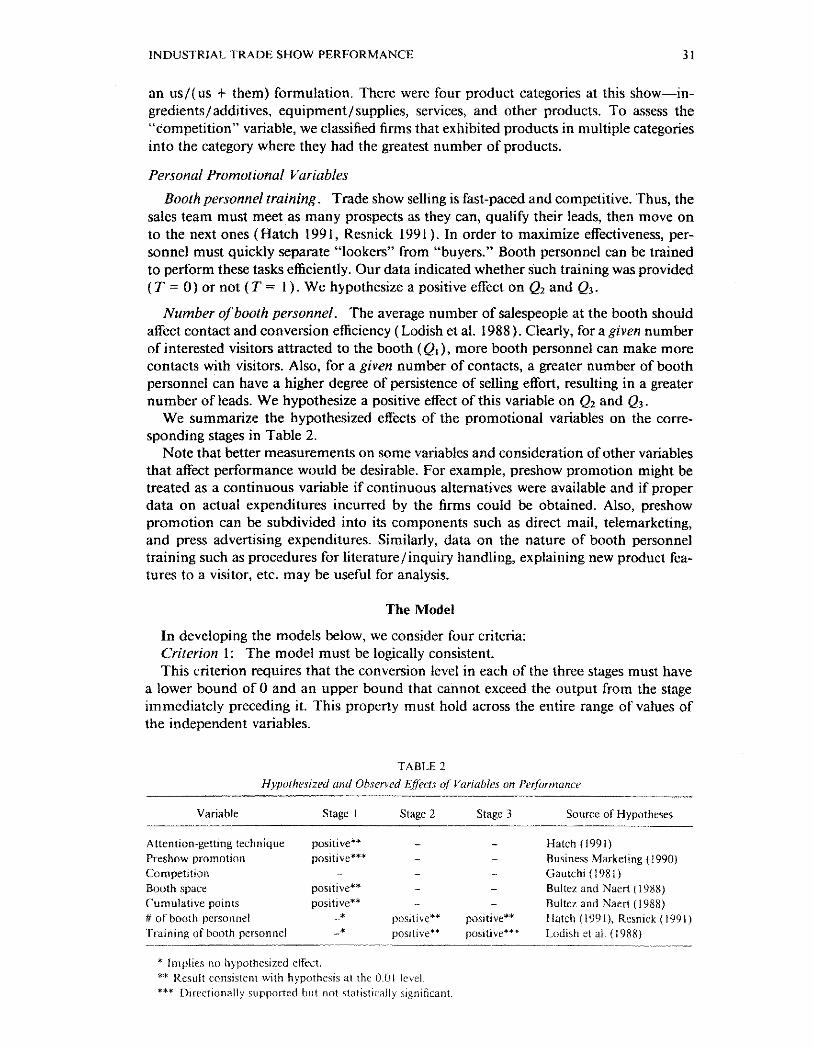
We summarize the hypothesized effects of the promotional variables on the corre- sponding stages in Table 2.
Note that better measurements on some variables and consideration of other variables that affect performance would be desirable. For example, preshow promotion might be treated as a continuous variable if continuous alternatives were available and if proper data on actual expenditures incurred by the firms could be obtained. Also, preshow promotion can be subdivided into its components such as direct mail, telemarketing, and press advertising expenditures. Similarly, data on the nature of booth personnel training such as procedures for literaturefinquiry handling, explaining new product fea- tures to a visitor, etc. may he useful for analysis.
The Model
In developing the models below, we consider four criteria: Criterion 1: The model must be logically consistent. This criterion requires that the conversion level in each of the three stages must have
a lower bound of 0 and an upper bound that cannot exceed the output from the stage immediately preceding it. This property must hold across the entire range of values of the independent variables.
TAB1.E 2 Ilypolh~.sized and Ob5rrved Effeclecir of Varrable~ on Performance
Variable Stage i S t a ~ e 2 Staxe 3 Source of Hvootheses
Attention-getting technique positive'* Preshow promotion po~it ive* '~ Competilion - Booth space positive** Cumulative points positive*'
* 4 of booth personnel - Training of hooth perro~inel - * - --
- -
positive*' positive** posilive" positive***
Hatch (199 1) Business Marketing (1990) Gautchi (1981) Bulter and Naen (1988) Buiter and Naen (1988) Hatch (1991), Resnick (199 I) 1.odish et al. (1988)
Implies no h>pothesixd effect. ** Result consistent with hypothesis at thc 0.01 lcvcl. **' I>ircct~onally supported but not statisiicaliy significant.

32 SRINATH GOPAI.AKR1SHNA A N D G A R Y L. LIL-IEN
Crilerion 2: The model should allow for interaction effects. Practitioners affirm that several factors jointly contribute to the overall "success" at a
trade show (Computer Publicity News 1980). The notion of interaction effects among trade show variables is similar to the consideration of interaction effects in the case of print advertisements (Hanssens and Weitz 1980). The interdependencies among trade show variables can be modeled in various ways. One approach would he to include specific interaction terms. Another approach might be to allow for interactions in an implicit way by using a multiplicative form (Hanssens and Weitz 1980).
Crizerion 3: The model should incorporate the effect of competition and the notion of diminishing returns to marketing expenditure.
The inclusion of competition is clearly a desirable feature, given the competitive nature of most product markets (Eliashberg and Chatterjee 1985). Also, the phenomenon of diminishing returns to spending is commonly observed in marketing (Hanssens et al. 1990, Little 1979). More specifically. while research by Eastlack and Rao ( 1986) and Rao and Miller (1975) for advertising and Lodish et a]. (1988) for personal selling is consistent with S-shaped response, all researchers agree that appropriate response functions see diminishing returns. In addition, data uncertainty and methodological questions gen- erally preclude finding the S-shape part of the curve econometrically (Broadbent 1984, Schultz and Block 1986).
Crilerion 4: The model should be able to be calibrated using the available data. Note that some of the tactical variables in the data set described in the previous section
are continuous (booth space, points, number of booth personnel) while others are discrete (preshow promotion, attention-getting techniques, training of booth personnel). There- fore, the modeling framework and the nature of the functional forms we develop are limited to constructs that can be calibrated with these data (Lilien et al. 1992).
We now state our model for Stage 1 that describes the relationship between the tactical variables and booth attraction efficiency for a given firm:
Ql = Q[afas*C"l - expf-XIS)) { I - p exp(-AzP)}], ( 1 )
a , , az s 1, where A = use ofattention-getting technique ( 0 if food samplingJgiveaway used, 1 otherwise), M = preshow promotion ( 0 if high, 1 if low), C = index of competition (proportion of booth space among firms exhibiting "similar"
products). S = square feet of booth space, P = cumulative "points" accumulated by the firm, Q, = number of interested attendees attracted to the firm's hooth, Q = size of the target audience, and a , , u z , A , , A2, 6 and 8 are parameters. Note that Q, / Q is the attraction efficiency q , ) defined earlier. The structure of the model proposed in Equation ( 1 ) is consistent with the criteria
outlined earlier. The model specification implies a nonlinear relationship, with the mul- tiplicative form allowing for interaction effects. The effcct of an attention-getting technique and preshow promotion are scaled relative to a value of 1.0, since u , and nz i 1. The index of competition is based on square feet of space among firms exhibiting "similar" products and is analogous to an attraction model as described earlier. The coeficient 8 reflects any of the three types of competitive effects discussed earlier. Iff? is positive then there is a substitution effect. Iff) is zero there is no significant effect of competition, while if 8 is negative there is a complementary effect. 1 f S = 0, the firm is not present at the show and therefore no attendees are attracted to the hooth ( Q , - 0 ) . A firm exhibiting at the show for the first time and having no cumulative poinls (I' = 0 ) can expect to achieve a maxirnum attraction cfhciency of ( 1 - - 0). Thus, the model is consistent, shows
INDUSTRIAL TRADE SHOW PERFORMANCE 33
diminishing returns, and, as we will see, can be calibrated using existing data. We will compare the performance of this model form with two alternative structures: a linear form which violates our criteria of diminishing returns to scale and logical consistency, and a Cobb-Douglas form (equivalent to log-linear) which violates the logical consistency criterion.
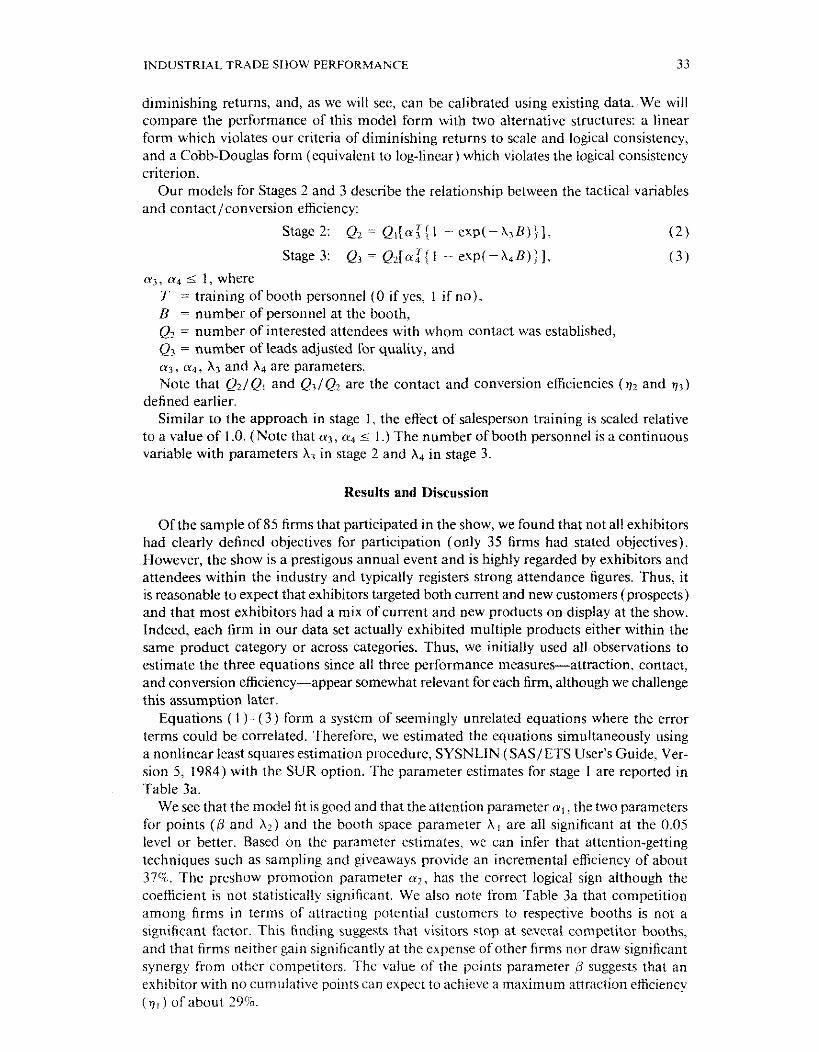
Our models for Stages 2 and 3 describe the relationship between the tactical variables and contact/conversion efficiency:
Stage 2: Q, = Q,[e:{i -- exp(- X,B)j], ( 2 )
Stage 3: Q3 = Q~[(Y:{/ - exp(-A,B)}], ( 3 )
n3, a,, 5 1, where T = training of booth personnel ( 0 if yes, 1 if no). B = number of personnel at the booth, Q: = number of interested attendees with whom contact was established, Q1 = number of leads adjusted for quality, and a?, eq , X j and A, are parameters. Note that Q:/Q, and Q3/Qz are the contact and conversion efficiencies (7: and q3)
defined earlier. Similar to the approach in stage 1 , the effect of salesperson training is scaled relative
to a value of 1 .O. (Note that a,, a, I 1.) The number of booth personnel is a continuous variable with parameters A3 in stage 2 and A, in stage 3.
Results and Discussion
Of the sample of 85 firms that participated in the show, we found that not all exhibitors had clearly defined objectives for participation (only 35 firms had stated objectives). However, the show is a prestigous annual event and is highly regarded by exhibitors and attendees within the industry and typically registers strong attendance figures. Thus, it is reasonable to expect that exhibitors targeted both current and new customers (prospects) and that most exhibitors had a mix of current and new products on display at the show. Indeed, each firm in our data set actually exhibited multiple products either within the same product category or across categories. Thus, we initially used all observations to estimate the three equations since all three performance measures-attraction, contact, and conversion efficiency-appear somewhat relevant for each firm, although we challenge this assumption later.
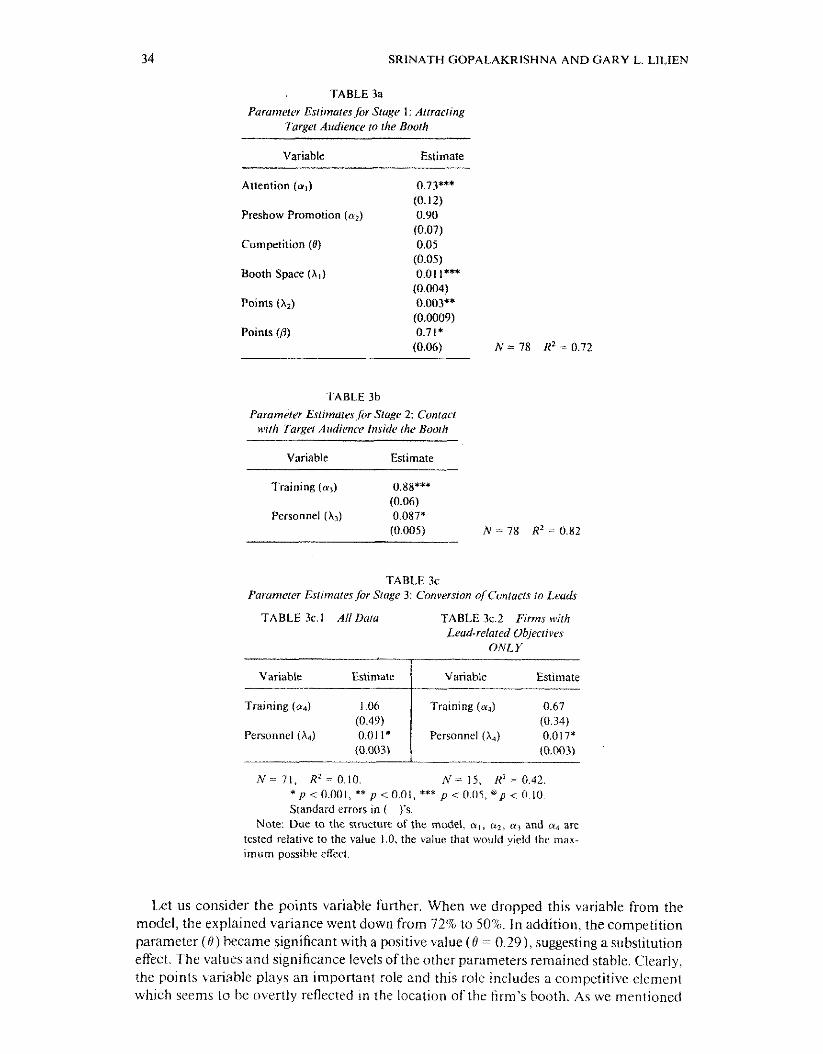
Equations ( 1 )-(3) form a system of seemingly unrelated equations where the error terms could be correlated. Therefore. we estimated the equations simultaneously using a nonlinear least squares estimation procedure, SYSNLIN (SAS/ETS User's Guide. Ver- sion 5, 1984) with the SUR option. The parameter estimates for stage I are reported in Table 3a.
We see that the model fit isgood and that the attention parameter a , , the two parameters for points (0 and A*) and the booth space parameter A , are all significant at the 0.05 level or better. Based on the parameter estimates, we can infer that attention-getting techniques such as sampling and giveaways provide an incremental efficiency of about 37%. The preshow promotion parameter a2. has the correct logical sign although the coefficient is not statistically significant. We also note from Table 3a that competition among firms in terms of attracting potential customers to respective booths is not a significant factor. This finding suggests that visitors stop at sevcrai competitor booths, and that firms neither gain significantly at the expense of other firms nor draw significant synergy from other competitors. The value of the points parameter /3 suggests that an exhibitor with no cumulative points can expect to achieve a maximum attraction efficiency ( v , ) of about 29%.
SRINATH GOPALAKRISHNA AND GARY L. LILIEN
TABLE 3a
Purumeler Esli~nalesfor Stage I: Allrucling Targel Alidience lo rhe Buurh
Variable Estimate
Attention (a,) 0.73*** (0.12)
Preshow Promotion (ai) 0.90 (0.07)
Competition (0) 0.05 (0.05)
Booth Space (A,) 0.01 I*** (0.004)
Poinls (A,) 0.003'* (0.0009)
Points (8) 0.71* (0.06) N = 78 R2 = 0.72
TABLE 3b
Parameter Estrfmaresfi~r Srapr. 2: Conlac1 n,iih Turgel Atidic~ncv Inside rhr, Boorh
Variable Estimate
Training (a,) 0.88*** (0.06)
Personnel (All 0.087*
TABLE 3c Pflrumeler Es1imulrr.for Stage 3: Conversion q/Contacrs io Leads
TABLE 3c.l AN Dolu TABLE 3c.2 Firms wilh Lead-relaled Objeclives
ONI. Y
Variable Estimate
N = 71, R2-0.10. h'= IS, R" 0.42. p<O.OOl , **p<O.Ol, *** p<O.llS,"p ~ 0 . 1 0 . Standard errors in ( )'s.
Note: Due to the structure of the model, a , , u,, a, and n, are tcsted relative to the value 1.0, the value that would yield the max-
imum possible effect.
Variable Estimate
Training (a4) 1.06 (0.49)
Personnel (A4) 0.01 I* (0.003)
Let us consider the points variable further. When we dropped this variable from the model, the explained variance went down from 72% to 50%. In addition. thecompetition parameter ( 0 ) became significant with a positive value ( 0 == 0.291, suggesting a substitution effect. The values and significance levels of the other parameters remained stable. Clearly, the points variahle plays an important role and this role includes a competitive element which sccrns to be ctvertly rcflected in the location of the firm's hooth. As we rnentioncd
I
Training (u,) 0.67 (0.34)
Personnel (A,) 0.017* (0,003)
INDUS'I RIAL TRADE SHOW PERFORMANCE
TABLE 4
Prrdiciive Validit), i$ihe Models for rhr Three S t o ~ r r
Average MSE Average MSPR (estimation) (hold out) Predicted R2
Stage I 54,632 70,833 0.74 Stage 2 14.362 14,993 0.85 SIage 3 7,601 9,121 0.35
earlier, firms with more points leveraged that position into a 'favorable' location on the show floor.
The estimation results for stages 2 and 3 are presented in Tables 3b and 3c respectively. Both in terms of contact and conversion efficiency, adequate staffing of the booth is highly significant ( p < 0.01 for both stages). Training of booth personnel is significant in stage 2 (p < 0.05) but is not significant in stage 3 although it has the correct logical sign. These results are consistent with the findings from studies in the trade press (Bertrand 1989, Wiesendanger 1990) about the importance of having enough booth personnel who are also knowledgeable and well-trained. The parameter estimates suggest that booth personnel training provides an incremental efficiency of about 14% in Stage 2 (all else equal). The relatively poor model fit in Stage 3 (Table 3c.l j can be explained by the fact that we used all available data points for estimation. If we consider only the lead- related objectives relevant for Stage 3, we find that 15 firms in the dataset had such an objective. Estimation using these 15 data points improves the model fit (Table 3c.2 j.
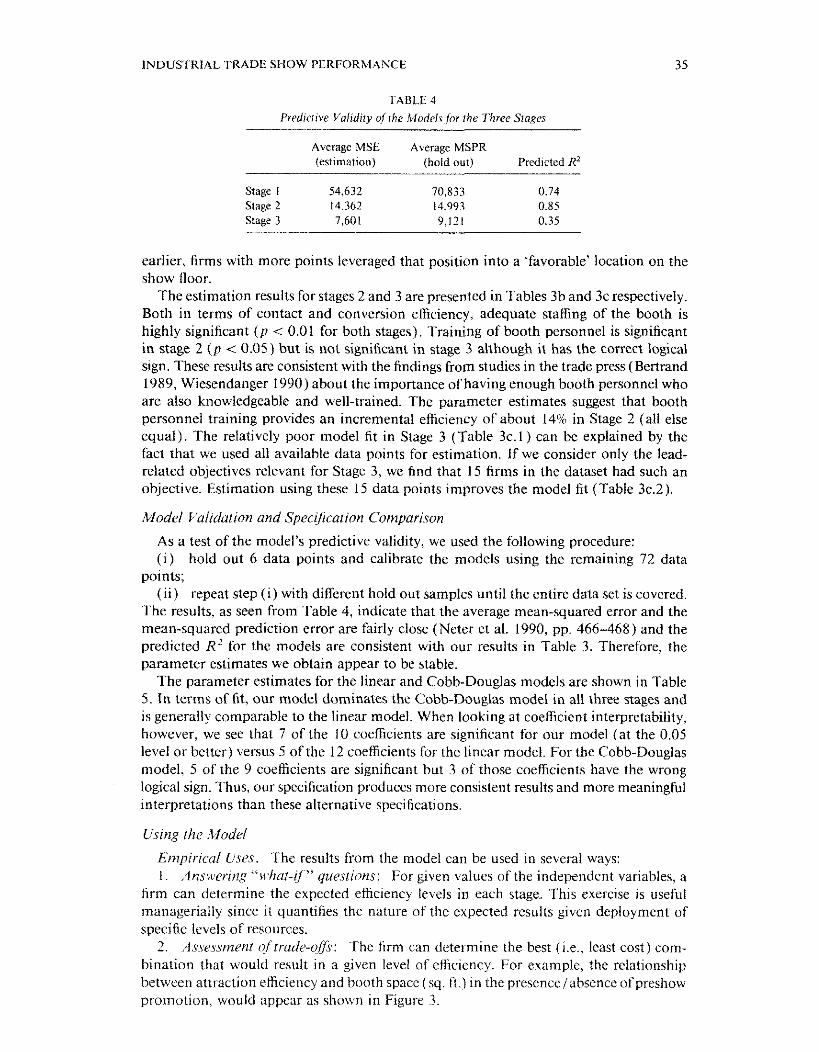
M ~ d e l Vaiidaf ion and Specijication Cornparison
As a test of the model's predictive validity, we used the following procedure: ( i ) hold out 6 data points and calibrate the models using the remaining 72 data
points; ( i i ) repeat step ( i ) with different hold out samples until the entire data set is covered.
The results, as seen from Table 4. indicate that the average mean-squared error and the mean-squared prediction error are fairly close (Neter et al. 1990, pp. 466-468) and the predicted R 2 for the models are consistent with our results in Table 3. Therefore, the parameter estimates we obtain appear to be stable.
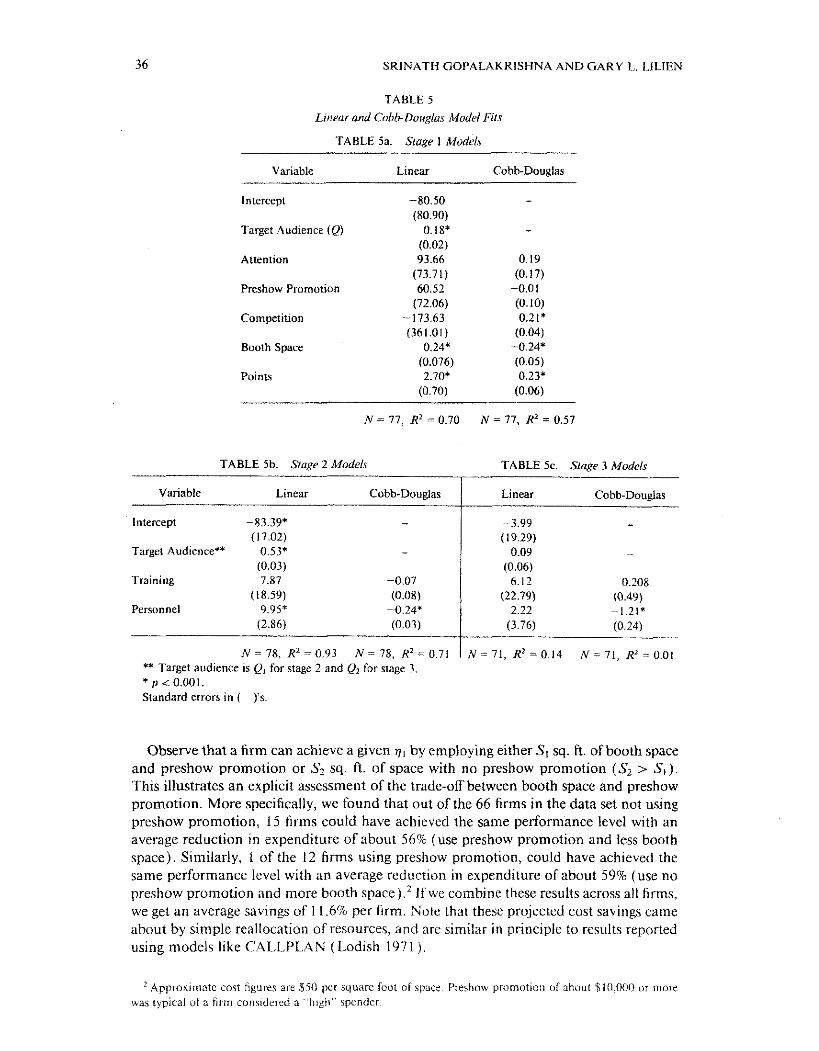
The parameter estimates for the linear and Cobh-Douglas models are shown in Table 5. In terms of fit, our model dominates the Cobb-Douglas model in all three stages and is generally comparable to the linear model. When looking at coefficient interpretability, however, we see that 7 of the 10 coefficients are significant for our model (at the 0.05 level or better) versus 5 of the I2 coefficients for the linear model. For the Cobb-Douglas model, 5 of the 9 coefficients are significant but 3 of those coefficients have the wrong logical sign. Thus, our specification produces more consistent results and more meaningful interpretations than these alternative specifications.
C'sing the .ifode/
Enizpiriccil Usc,s. The results from the model can be used in several ways: 1. ilns~t~ering hat-if" quertions: For given values of the independent variables, a
firm can determine the expected efficiency levels in each stage. This exercise is useful managerially since it quantifies the nature of the expected results given deployment of specific levels of resources.
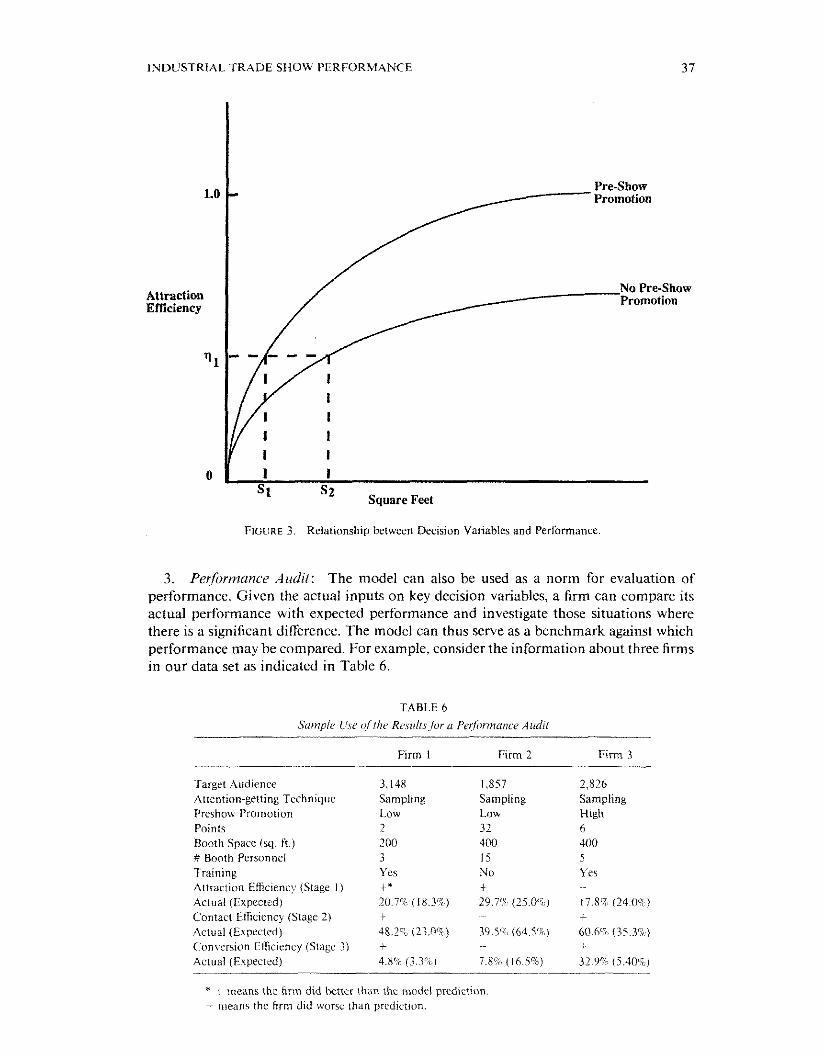
2. A.s.ses.smrnt qffrade-ofi: The firm can determine the best (i.e., least cost) com- bination that woulti result in a given level of efficiency. For example, the relationship between attraction efficiency and booth space (sq. ft.) in the presence/absence of preshow pron~otion. would appear as shown in Figure 3.
SRINATH GOPALAKRISHNA AND GARY L, LlLlEN
TABLE 5
Linear and Cobb-Douglas Model Firs
TABLE 5a. Slage I Modelr
Variable Linear Cobb-Douglas
l ntercept -80.50 (80.90)
Target Audience (Q) 0.18* (0.02)
Attention 93.66 (73.71)
Preshow Promotion 60.52 (72.06)
Competition - 173.63 (361.01)
Booth Space 0.24* (0.076)
Points 2.70* (0.70)
Intercept -83.39* (17.02)
Target Audience** 0.53" (0.03)
Training 7.87 (18.59)
Personnel 9-95' (2.86)
TABLE 5b. Stage 2 Models TABLE 5c. Stage 3 Mod&
I ~-p~p
N = 7 8 , R'-0.93 N = 7 8 , R2=0.71 N = 7 1 , R2=0 .14 h r = 7 1 , R2=0.01 ** Target audience is a, for stage 2 and QI for stage 3. *pco .o01 . Standard errors in ( )'s.
Variable Linear Cobb-Douglas
Observe that a firm can achieve a given q , by employing either S , sq. ft. of booth space and preshow promotion or S2 sq. ft. of space with no preshow promotion ( S 2 > S,). This illustrates an explicit assessment of the trade-off between booth space and preshow promotion. More specifically, we found that out of the 66 firms in the data set not using preshow promotion, 15 firms could have achieved the same performance level with an average reduction in expenditure of about 56% (use preshow promotion and less booth space). Similarly, I of the 12 firms using preshow promotion, could have achieved the same performance level with an average reduction in expenditure of about 59% (use no preshow promotion and more booth space).' If we corxbine these results across all firms, we get an average savings of I 1.6% per firm. Note that these projected cost savings came about by simple reallocation of resources, and are similar in principle to results repofled using models like CALLPLAN (Lodish 1971 ) .
Linear Cobb-Douelas
%Approximate cost figures are $50 per square foot of spucr. Prrihow promotion of ahi~ut 610.000 in more was ry~ical o l a firm cons%dcred a "hsgh" spender^
INDUSTRIAL TRADE SHOW PERFORMANCE
Attraction Efficiency
q1
FIGURE 3. Relationship between Decision Variables and Performance
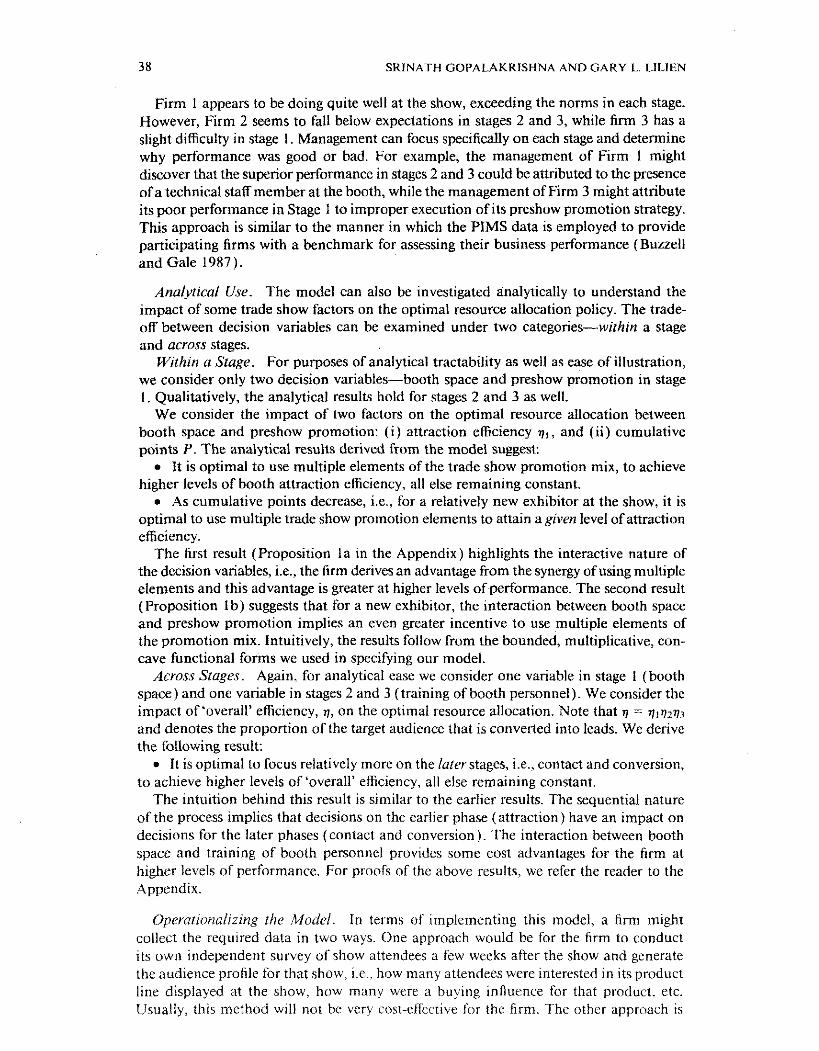
3. Performance Audit: The model can also be used as a norm for evaluation of performance. Given the actual inputs on key decision variables, a firm can compare its actual performance with expected performance and investigate those situations where there is a significant difference. The model can thus serve as a benchmark against which performance may be compared. For example, consider the information about three firms in our data set as indicated in Table 6.
TABLE 6
Sumple L:sr ( f l he R~~,si).irll.s/i~r a Per/ijnniince Aiidil
Firrn I Firm 2 Firm 3
Target Audience Attention-getting Technique Preshow Promotion Points Booth Space Isq. R.) # Booth Personnel Training Attraction Efficient) (Stage I ) Actual (Expected) Contact Eiliciency (Stage 2) Actual (Expected) C'onversion Efficiency (Stage 3) Actual (Expected)
3, 148 Sampling 1.0~. 2 200 3 Yes 4 * 20.7'?0 (18.3%)
1,857 Sampling Low 32 400 I No
2,826 Sampling High 6 400 5 Yes
* i means the hrm did hetter ilian ihc model predicrion. - mealis the tirni did iroisc than prediction.
38 SRINATH GOPALAKRISHNA A N D GARY L. LILIEN
Firm 1 appears to be doing quite well at the show, exceeding the norms in each stage. However, Firm 2 seems to fall below expectations in stages 2 and 3, while firm 3 has a slight difficulty in stage 1. Management can focus specifically on each stage and determine why performance was good or bad. For example, the management of Firm I might discover that the superior performance in stages 2 and 3 could be attributed to the presence of a technical staff member at the booth, while the management of Firm 3 might attribute its poor performance in Stage 1 to improper execution of its preshow promotion strategy. This approach is similar to the manner in which the PIMS data is employed to provide participating firms with a benchmark for assessing their business performance (Buzzell and Gale 1987).
Analytical Use. The model can also be investigated analytically to understand the impact of some trade show factors on the optimal resource allocation policy. The trade- off between decision variables can be examined under two categories-within a stage and across stages.
Withiti a Stage. For purposes of analytical tractability as well as ease of illustration, we consider only two decision variables-booth space and preshow promotion in stage I . Qualitatively, the analytical results hold for stages 2 and 3 as well.
We consider the impact of two factors on the optimal resource allocation between booth space and preshow promotion: ( i ) attraction efficiency q , , and (ii) cumulative points P. The analytical results derived from the model suggest:
It is optimal to use multiple elements of the trade show promotion mix, to achieve higher levels of booth attraction efficiency, all else remaining constant.
As cumulative points decrease, i.e., for a relatively new exhibitor at the show, it is optimal to use multiple trade show promotion elements to attain a given level of attraction efficiency.
The first result (Proposition la in the Appendix) highlights the interactive nature of the decision variables, i.e., the firm derives an advantage from the synergy of using multiple elements and this advantage is greater at higher levels of performance. The second result (Proposition lb) suggests that for a new exhibitor, the interaction between booth space and preshow promotion implies an even greater incentive to use multiple elements of the promotion mix. Intuitively, the results follow from the bounded, multiplicative, con- cave functional forms we used in specifying our model.
Across Stages. Again, for analytical ease we consider one variable in stage 1 (booth space) and one variable in stages 2 and 3 (training of booth personnel). We consider the impact of 'overall' efficiency, v, on the optimal resource allocation. Note that q = v1v2q3
and denotes the proportion of the target audience that is converted into leads. We derive the following result:
It is optimal to focus relatively more on the later stages, i.e., contact and conversion, to achieve higher levels of 'overall' efficiency, all else remaining constant.
The intuition behind this result is similar to the earlier results. The sequential nature of the process implies that decisions on the earlier phase (attraction) have an impact on decisions for the later phases (contact and conversion). The interaction between booth space and training of booth personnel provides some cost advantages for the firm at higher levels of performance. For proofs of the above results, we refer the reader to the Appendix.
Operaticinaiizing t l ~ e Model. In terms of implementing this model, a firm might collect the required data in two ways. One approach would be for the firm to conduct its own independent survey of show attendees a few weeks after the show and generate the audience profile for that show, i.e.. how many attendees were interested in its product line displayed at the show, how many were a buying influence for that product. etc. Usually, this method will not be very cost-effective for the firm. The other approach is

INDUSTRIAL TRADE SHOW PERFORMANCE 39
to become part of a syndicate, where several firms that participate in a given show, sign- up with a trade show survey research firm such as Exhibit Surveys, Inc. and receive information about the profile of the show audience in general and about attendees who visited that firm's booth. The latter approach is similar to a consumer packaged goods company obtaining information on product/brand movement at the retail level from IRI o r Nielsen, resulting in significant scale economies.
Conciusions and Future Research
Our study contributes to trade show research in several ways. First, we provide a conceptual structure that enables a direct and more objective assessment of trade show performance. We developed three indices of performance-booth attraction, contact, and conversion efficiency-based on traffic flow at a firm's booth. More importantly, we point out the explicit link between different objectives of firms at the show and the corresponding indices of performance. Second, we relate the performance indices to tactical variables under the control of the firm such as booth space, preshow promotion, attention-getting techniques, booth staffing and the training of booth personnel. Thus, we have attempted to quantify trade show performance and provide a structure to integrate firm-specific data with data on the profile of attendees at the show. We developed a set of models linking tactical variables in each stage with the appropriate performance mea- sure. Our estimation results suggest that the variables we considered in each ofthe models are important, have a significant impact and provide reasonable forecast quality. We illustrated how the model could be employed to explicitly assess the trade-off between key decision variables in the context of finding the least expensive combination that achieves a given level of performance. We also discussed how the model can serve as a performance "standard." i.e.. a benchmark to compare against actual performance and to examine reasons for deviations. Finally, we derived some analytical results on the allocation of trade show resources under different situations.
Our study has several limitations which we believe provide useful avenues for future research. The list of decision variables that we have considered could be expanded. For example, the type of training given to booth personnel can be included. Similarly, in addition to data on number of leads, better information on the quality of the leads should be obtained. In addition, future models should include more direct location attractiveness measures than our "points" variable. The preshow promotion variable could be subdivided into finer elements such as direct mail, preshow advertising, telemarketing, etc. and this data could be collected as continuous variables. The show we considered in this study is a vertical show, i.e., it attracts visitors within a narrow domain such as the hotel industry or the medical industry (doctors and nurses). In contrast, a horizontal show like a com- puter show attracts visitors from a wider domain. The nature of the show could have an important bearing on the extent of impact of the different tactical variables.
We also believe replications of this exploratory work in different types of shows would enable generalizations to be made. In addition. the models we have developed are static and d o not consider the dynamic aspects of trade show participation, where the effect of one show plays out over time and carries over into future shows. Finally, an investigation of the cross-product effects would be interesting since trade shows routinely feature new products for which visitor interest is high. This creates a situation where a firm could leverage high visitor interest for one of its products to benefit other products it may be exhibiting at the show.
On net, however, we feel this study has provided both a new conceptual/modeiing framework and some useful empirical results that can help understand, assess and improve measurable returns from trade show expenditures.'
'This paper was received January 16. 1993. and hes heen with the autliors 9 months ibr 2 revisions. f'rocessetl hv Scot1 tZ. Nesiin. Area Editor.

40 SRINATH GOPALAKRISHNA AND GARY L. LIISEN
Acknowledgements. The authors wish to thank The Institute for the Study of Business Markets, Penn State University, Exhibit Surveys Inc., and the Institute of Food Technologists for supporting this research. We also thank John Hauser, Scott Neslin, two anonymous referees, Roger Kerin and Rabikar Chatterjee for their useful suggestions.
Appendix Implications for Resource Allocation
Wirhin a Stage
We illustrate the trade-off between two decision variables-preshow promotion ( M ) and booth space (S). Note that M is discrete and S is a continuous variable. We rewrite Equation ( 1 ) as:
QC = QKff?{l -exp(-AlS)I , 0 )
where
K = afCB{l - @exp(-A,P)), a constant. (1')
Since q, = Q, / Q, a firm can attain a given v, by either using ( i ) preshow promotion and S, square feet of booth space, or (ii) no preshow promotion but S? square feet of booth space where S, > S, (see Figure I ). The firm would choose ( i ) over (ii) if
F + 6 S , <6S2 or F < G ( S , - S , ) , (2)
where 6 =. cost per square foot and F = cost of promotion. From Equation ( 1 ) above, we have, after simplification:
Preshuw promotion: exp(-XISt) = I - (q , /K) = (K - ? , ) / t i , ( 3 )
nopreshowpromolion: exp(-A,&) = I - (a , IKo) = (Ko - q,)lKn. (4 )
Dividing(3) by (4) we get
exp{ X,(S, - S I ) / = a ( K - q L ) l ( K a - v,). ( 5 )
An increase in attraction eficiency ( q , ) implies attracting more attendees to the booth out of a target audience of size Q. Intuitively, we expect more lMul communications expenditures to attain higher efficiencies and also the m i r to involve multiple elements.
Cumulative points represent a firm's longevity of association with the show. A firm with mare points would be better known to its target audience and typically has a 'favorable' location on the show floor than a new exhibitor (fewer points). This suggests that the latter firm would have to employ a wider array of promotion activities than the former to be able to attain the same level of attraction eficiency with a given audience size.
The above discussion leads to the following propositions:
PROPOS~TION la. 7h achieve higher levels of booth attracrion eficiency, it is optimal to trse multiple elements oJthe trade .~/r/row prnmotion mix, all else remaining cons ran^.
PROPOSITION lb. As crrmularive points decrease, ir is oprimal IU use muhiple trade show elements ro urtoin a given level ofatrraclion efhcienc)..
PROOFS PROPOSITION la, The derivative of the RHS of Equation ( 5 ) with respect to " is:
a f K - v,)i(Klu - v,)' - a i ( K u -- 7 , ) = a K ( I - a)l(Ko! - o,)',
which is positive. Therefore, (S2 - St) increases with 11, and at some q : , alternative ( i ) is preferred ovcr ( i i ) (see Equation (2 ) ) .
PROPOSITION Ib. We have from Equation ( 1')
d K i d P - oi(Cd(,3A,) exp(-A,P),
which is positive. The derivative of the RHS of Equation ( 5 ) . with respect to P, after simplification, is:
- r \ (dKldP). i , ( i u ) / ( K u - q,)'
which is negative since d K l d P is positive. l'hus, for agrvcn q , , (S2 - S , ) increases as Pdecreases.
For gencrating salcs leads. all three stages are relevant. We can wnte q -- q,.i2v, where q is the 'ovcrali' cficiency (proponion of the target audience convened into leads). To achieve higher overall efficiency, one of two general approechcs may be followed-(i) more efon in stage I and relatively less eifort in stages 2 and 3 , or ( i i ) less effort in strtge I and relatively more elion i n the later stages. Slinilar to Proposition la, we would

INDUS-IRIAL TRADE SHOW PERFORMANCE 41
expect that at "lower" levels of n, approach ( i ) is optimal and at "higher" levels of ?. approach ( i i ) is optimal. Thus, at higher levels of performance standards, the focus shifts in a relative sense to the later stages of the process. Therefore, we can srdte the following proposition:
PROP~SITIOV 2. 7i) i ichii 'v~ hiptier li~i~e1.s oloverufl eficienc>', it i i optrmul 10 fi1cu.s r<~lu i ive/~ more on rh i~ !uier sruges, i . ~ , conlucl iind conl,rrsrori. all ei.se ri 'mainin~. i.on.sianr.
The proof is similar to Proposition la. Detailed prottfs are available from the ar~thors
References
Bellizzi, Joseph A. and Delilah J. Lipps 1 19841, managerial Guidelines (br Trade Show Effectiveness," 1iidu.sirial Murkpiing .Ita,iape,ncnl, 13, 49-52.
Bello. Daniel C. ( 19921, "Industrial Buyer Behavior at Trade Shows: Implications for Selling Eflect~veness," Joicrnal r~/'Bli.sint.r.s Rt.sean.h, 25, 59-80.
Bertrand, Kate ( 1989). "High-Tech Competition Breeds Exhihil Options." B~isineis Ilarkerinp, 70-76. Bonoma. Thomas V. ( 1983), "Get More Out of Your Trade Shows." Ni~rvurri Biirines.~ Review, 61, 75-83. Rroadhent, Simon ( 1984). "Modeling with Ad Stock." J~~irrnulo/ ' ihe Marker Rereutrh Viicie~v, 26 (October),
295-312. Bultez, Alain V, and Philippe A. Naert i 1988). "SHARP: Shelf Allocation for Retailers' Profit," mark el in^
Scient,ia, 7 , 3 (Summer): 21 1-231. Hioinc~ss Marhi~iirzp 11988). "Face Up to Winning Exhibit Design." (March), 82. - ( 1990a), "Marketers Say Ihey'll Boost Spending," (March). 31-32. -(1990b), "Do Your Own Pre-show Marketing," (February) Burrell, Robert D. and Bradley T . Gale ( 1987), The l'I.llS Princip!es_ New York: The Free Press. Cahnen Advertising Research Report 4542.lF ( 1992). Cavanaugh. Suzette ( 1976). "Setting Objectives and Evaluating the EDctiveness of Trade Show Exhibits.''
.Ioilr,ta! <f.2lurkr.iirzg, 40, 100- 103. Choffray. Jean-Marie and Gary L.. L.ilien ( 1980 j. ~%,larkering P!anningfi,r ,Ve$c' lnrluslrial Pr,~diicrs. New York:
John Wiley. Churchill, Cilben A. Jr., Ueil M. Ford. and Orville C. Walker. Jr. 11993). Sales F i m r .Aianagcmcni, 4th ed.,
Homewood. IL: Irwin. Chmpiiler Piihiicity Ncil.s (1Y80). "20 Ways to Turn a So-So Show Into a Bonanza". Eastlack, Joseph 0 . Jr.. and Ambar C . Rao ( 1986 j , "Modelling Response to Advertising and Price Changes
for "V-8" Cocktail Vegetable Juice." h4~rrkcrinp Scii~ncc. 5. 3 (Summer) 245-259. Eliashberg. Jehoshua and Rabikar Cliatterjee ( 1985 ), "Analytical Models of Competition with Implications for
Marketing: Issues, Findings and Outlook," Journal if,\4arkaing Rr-r.ei~n.h, 22 (August). 237-261 Cautchi, David A. 1 I98 I 1. "Speciticalion uf Patronage Models for Retail Center Choice." Joirrnal ,fMarkeiin,q
R<-;~.arch, 18 1 May). 162- 174. Hanssens, Dominique M.. Leonard J. Parsons, and Randall L. Schultz ( IYYO), ,bfarker Responsr moil el,^:
Economelric unii Time .'erres Aniii/?is. Norwell, MA: Kluwer Academic Publishers. - and Barton A. Weitz ( 1980). "The Effectiveness of Industrial Print Advertisements Across Product
Catrgorics," J i~ i~ rno i o/'.Vf<irki.iirrg Rcxearch, I7 (/\ugust). 294-306. Hatch. Michael J . ( 199 I). "Improving Your Sales Success at Trade Shows," Huiirress l . l a r k ~ i i t ~ g ~ (Fall). A26-
28. Hutt, Michael D. and Thomas W. Speh i 1995). Uirrint'r? h l i i r k e ~ ~ n ~ h'aniigt~rncnr, 5th ed.. Fort Worth, TX:
-$.he Dryden Press. Kerin, Roger A. and William L. Cron ( 1987). "Asassing Trade Show Functionsand Performance: ,4n Exploratory
Study." Joirrn~il oI.MII)I<L,IRI~, 5 I . 87-94, Kotler. Philip ( 1991 ). hlarkciiny Zluniigur?irrrl: A~tnli.ric; /'/unrring and Conlro!. 7th d.. Englcwood Cliffs, NJ:
Prentice Ilall. Lllien. Oar) L. ( 1979). "AlfVISOR 2: Modeling the Marketing blix Decision fbr liidustrial Prodiictr," .l/iin.
ugernmi . S ~ . I I ~ ~ ~ . P , 2 5 . 2 (February ). 191-204. ~~. . .. . 11983). "A Descriptive Model of the Trade-Shiiw Budgeting Decision Process," Ini i~r,s/r i~i / .tliirkrriiry
.iiunag~~n?enr. 12. 25-29, -and David Weinstein ( 1084). "An lnternalionnl Cumpanson ofthe Determinants ofindustrial Marketing
irpcnditurcs." .Jolit~~iu/ ~~ / . \ l t i l j i ~ i i , i j ' , 48, 46-53. . .. . Philip Katler. and K. Sridhar ivloorthy ( Ii)9?). .L/iirhi,iiriq .L/oiit,ls. t'nglcbood CliiR. NJ: Pienticc-
tiall. I.ittle. John D. C. ( 1979 1. "Aggrcgati' dyertising ilodcls: Tlie State of the Art:' Opi~irii jnii i Rercnrih. 27
(July/August). (>2U-h67. Lodish. Leonard M. ( 197 I ) . "('AL.I.PI.:lN: An lntcracti~e S;ilesman's ( ' a l l Planning Sjrtem.' Moiiiigi,nimi
7 . . , ri.r:ii,, 18. I ( Dccembcr), 25-40
42 SRINATH GOPALAKRISHNA AND GARY L. ILILIEN
Lodish, Leonard M., Ellen Curtis, Micllael Ness. M. Keny Simpson ( 1988), "Salesforce Sizing and Deployment Using a Decision Calculus Model at Syntex Laboratories," Inrerfhce~.~, 18, 1 (JanIFeh). 5-20.
Moriarty, Rowland T , and Robert E. Spekman ( 1984), "An Empirical Investigation ofthe Sources of Information lJsed During the Industrial Buying Process," Jotrrnui (?/Iifurkefinx Rexeurch, 21 (May), 137-147.
Nerer, John, William Wasserman, and Michael H. Kutner ( 1990),AppIiedLinear Sruti.slicai.hfodcls, Homewood, IL: Inuin.
Parfitt. J . H , and B. J. K. Collins ( 1968), "Use of Consumer Panels for Brand Share Prediction," Jolirnul of ,2furkeiing Rc.,.arch, 5 (May ), 13 1 - 146.
Promolion .Mo~iirkrrint ( 1989), "Trade Show Marketing: Bringing Home the Sales," January, S10. Rao, Ambar G. and P. B. Miller ( 1975), "Advenising/Sales Response Functions," Journal of Adverlrsin~
Re.~earch, 15, 7-15. Resnick. Keith ( 1991 ), "8 Steps to Sales Success," Rusinexs .Mu~kaing, (Fall), ,420-21 Robinson, Patrick J.. Charles W. Faris, and Yoram Wind ( 1967), Indusrriul Buying und Creufive Maricering,
Boston, MA: Aliyn and Bacon, Inc. Rosson. P. .I. and F. H. R. Seringhaus (1990), "Examining Firms' International Trade Fair Performance," in
F. Renato and I. Snehota, eds., Re.st*urch Drvel(~prnenrs in lnrernuri~~nul lndu,sfrial ,Markrtinx and Pur- chasing, Proceedings of the 6th I.M.P. Conference 11, Milan, Italy: Univenita Bocconi.
SASIETS User's Guide, Venion 5 Edition ( 1984). Cary, NC: SAS Institute, lnc. Schultr, Don E. and Manin P. Block (1986). "Empirical Estimation of Advertising Response Functions,"
Journui u/~Mrdra Planning, (Fall). 17-24. Swandhy, Richard K. ( 1982), "Selecting Space. . . How Much and Where," E,x/zihiror, 4-6. Trade Show Birri.afr ( 1986). "Trade Shows Represent a Dynamic Selling Opportunity," Research Repon #1010,
(April), Trade Show Bureau, Denver, CO. -- ( 1989), "Understanding and Influencing Your Audience," Research Repon #AC23, Trade Show Bureau,
Denver, CO. -- (1991). "The Projected Growth of the Exposition Industry: A IO-Year Forecast," Research Report
#1T12, Trade Show Bureau, Denver, CO. -~ ( 1992). "Devclop Your Prospects and Close Sales for Less With Trade Shows," Research Publication
#SM20, Trade Show Bureau, Denver, CO. Wiesendanger, B. ( 1990). "Are Salespeople Trade Show Duds?," Sa1e.s ondjWurkelinp Munu,qenzrnf, (August).
40-46. Wind, Y. and Rohert Thomas ( 19941, "Segmenting Industrial Markets," Advances in Business ,Murkt.iing.,
Vol. 6 , Arch Woodside (Ed.), JAl Press: Greenwich, CT 59-82.