A Test between Pecking Order Hypothesis and Static Trade-Off Theory
19
www.ijbcnet.com International Journal of Business and Commerce Vol. 3, No.5: Jan 2014[99-117] (ISSN: 2225-2436) Published by Asian Society of Business and Commerce Research 99 A Test between Pecking Order Hypothesis and Static Trade-Off Theory: An Analysis from Malaysian Listed Firms for Periods of Year 2007 To 2012 Nazrul Hisyam Ab Razak Faculty of Economic and Management, Universiti Putra Malaysia, Serdang, Malaysia [email protected] Mohd Naim Rosli Putra Business School, Serdang, Malaysia Abstract This paper explore further capital structure theory and test Pecking Order Hypothesis (POH) and Static Trade-off theory (STOT) on 200 Malaysian public listed firms in Bursa Malaysia from 2007 until 2012. The test conducted to explain Malaysian public listed firms finance decision towards issuance of new debt. Statistical evidence from POH suggests internal fund deficiency do not influence issuance of new debt by selected Malaysian listed firms. In contrast, STOT test results are surprisingly significant towards new debt issuance by Malaysian listed firms. This shows Malaysian public listed firms are aware on tax-shield benefit obtain via debt issuance and non-debt tax-shield. Firm’s size, structure and growth are also statistically significant towards new debt acquisitions of selected firms. The research hopefully will offer a better understanding on capital structure matters and issues especially static trade-off and pecking theories as reference and explanatory framework will highlight the importance and consequences of debt in financing choices and decisions. Keywords: Capital structure; trade-off theory; pecking order theory; financial decisions 1. Introduction The capital structure is a well-known subject that related to the financing decisions of a firm. It can be consider as a foundation process that play important roles in a corporation’s business life cycles such as wealth maximization, business expansion, assets financing, investment decision and other fundamental features that related to the firm’s cash flows and shareholders interest. In other words, the capital structure is the financial basis of a firm to fund its business activities and progress by using different sources of funds. A change in capital structure occurs due to fund investment. Capital raising activities commonly materialize through internal or external financing. Internal financing usually considered as a cheaper source of financing due to its nature that do not incur both transaction costs and taxes related to dividend payment. Amortization, building reserves, retained earnings and asset swaps may offer internal financing through accounting practices.
Transcript of A Test between Pecking Order Hypothesis and Static Trade-Off Theory
www.ijbcnet.com International Journal of Business and Commerce Vol. 3, No.5: Jan 2014[99-117]
(ISSN: 2225-2436)
Published by Asian Society of Business and Commerce Research 99
A Test between Pecking Order Hypothesis and Static Trade-Off Theory: An Analysis from
Malaysian Listed Firms for Periods of Year 2007 To 2012
Nazrul Hisyam Ab Razak
Faculty of Economic and Management,
Universiti Putra Malaysia, Serdang, Malaysia
Mohd Naim Rosli
Putra Business School, Serdang, Malaysia
Abstract
This paper explore further capital structure theory and test Pecking Order Hypothesis
(POH) and Static Trade-off theory (STOT) on 200 Malaysian public listed firms in Bursa
Malaysia from 2007 until 2012. The test conducted to explain Malaysian public listed
firms finance decision towards issuance of new debt. Statistical evidence from POH
suggests internal fund deficiency do not influence issuance of new debt by selected
Malaysian listed firms. In contrast, STOT test results are surprisingly significant towards
new debt issuance by Malaysian listed firms. This shows Malaysian public listed firms
are aware on tax-shield benefit obtain via debt issuance and non-debt tax-shield. Firm’s
size, structure and growth are also statistically significant towards new debt acquisitions
of selected firms. The research hopefully will offer a better understanding on capital
structure matters and issues especially static trade-off and pecking theories as reference
and explanatory framework will highlight the importance and consequences of debt in
financing choices and decisions.
Keywords: Capital structure; trade-off theory; pecking order theory; financial decisions
1. Introduction
The capital structure is a well-known subject that related to the financing decisions of a firm. It can be
consider as a foundation process that play important roles in a corporation’s business life cycles such as
wealth maximization, business expansion, assets financing, investment decision and other fundamental
features that related to the firm’s cash flows and shareholders interest. In other words, the capital structure
is the financial basis of a firm to fund its business activities and progress by using different sources of
funds.
A change in capital structure occurs due to fund investment. Capital raising activities commonly
materialize through internal or external financing. Internal financing usually considered as a cheaper
source of financing due to its nature that do not incur both transaction costs and taxes related to dividend
payment. Amortization, building reserves, retained earnings and asset swaps may offer internal financing
through accounting practices.
www.ijbcnet.com International Journal of Business and Commerce Vol. 3, No.5: Jan 2014[99-117]
(ISSN: 2225-2436)
Published by Asian Society of Business and Commerce Research 100
External financing refers to short-term debt, long-term debt, common equity and preferred equity. These
financial resources fund corporation’s overall business operations and growth. The issues involving the
capital structure are actually complex. Acquisition of financial resources as part of the capital structure
involves both risks and benefits. The cost of obtaining and utilizing financial resources involves from
corporate taxes, interest rates, dividend and tax shield. Bankruptcy cost, agency cost and involvement of
third-party shareholders are the risk to bear if external financing materialize.
Debt financing obtains through banks or other legal financial institution in terms of financial loans. Debt
financing is available both in the form of short or long-term debt and obligated to perform repayment.
Interest rate is a part of the risk that available through debt financing. Debtors have to exercise payment in
the form of fixed rate of return that protected by contractual obligations towards the creditors.
Alternatively, bond issuance also is another type of well-known debt financing. However, creditors have
no rights and access towards the debtors’ decision making process.
Equity is the residual claim by corporation founder in the corporation’s assets. Equity financing came into
picture when a corporation decides to sell or issue the residual claim known as share to the public. Equity
holders, generally known as shareholders are qualified to be part of the corporation as the residual
claimants once they acquire the shares of the corporation. Shareholders indeed have greater control over
decisions due to the nature of bearing most of the risk compared to creditors. The control over decisions
however depends on the type of shares that the shareholders have in their hand.
The reasons behind capital structure decisions always motivate and attract researchers to dig deep into
these matters. Credits go to Modigliani,F and Miller,M (1958) due to their tremendous efforts, the
primary basis objectives of the capital structure research developed thus served as a benchmark for further
research. However, many intellectuals doubted the imperfect research due to its nature that based on
perfect market environment.
Positively, researchers became aware towards the imperfect market situations and its consequences
towards capital structure decisions. Countless researches conducted since the Modigliani and Miller
theorem introduced. However, the general objectives of these researches were guided by the same criteria
known for maximization of profits and the maximization of market value.
Vast researches conducted to entangled issues behind the capital structure decision. One of the matters
that differentiate these studies was the focus of the research. The implication studies focus on examining
the impact of financial resource acquisition on the corporate financial status quo. Modigliani et. al (1958)
research were considered as implication studies. Thus, implication studies usually deployed empirical
studies on corporate taxes, debt, dividend policy and other related issues. These issues that may affect
corporate financial status quo when capital structure decision and finance behaviour examined.
Modigliani and Miller (1963), Modigliani (1988) and Welch (1996) were other research that applied
implication studies as the focal point.
Alternatively, capital structure researches spread its attention towards the factors that influenced the
capital structure decisions. The factors usually introduced as determinants in these types of research. In
the determinants studies, researches tend to reveal the factors that influenced capital structure formation
or change decisions via selected proxies. These proxies namely are profitability, tangibility, firm’s size,
sales and other suitable proxies that represent the firms’ condition or situation. One of well-known papers
recognized for this type of research was Rajan and Zingales (1995). However determinants studies also
used agency theories to clarify capital structure decision as explained by Welch (2002).
www.ijbcnet.com International Journal of Business and Commerce Vol. 3, No.5: Jan 2014[99-117]
(ISSN: 2225-2436)
Published by Asian Society of Business and Commerce Research 101
However, implication and determinant studies still inadequate to explain the corporation financing
behaviour. Consequently, researches on capital structure evolve as many frameworks, models and
theories were introduced in order to provide an explanation of the corporate capital structure decision
issues. The well known competing theories are static trade-off theory and pecking order theories that were
usually used to examine the firm’s financing decision. This is because both of the theories frameworks
examine closely at the changes of leverage level in the capital structure decision.
Static trade-off theory is a compilation of theories that examine the debt-ratio level and its relationship
with the corporate taxes, transaction costs, bankruptcy costs and financial distress according to Frank and
Goyal (2007). Further research that applied trade-off framework solely to explain capital structure matters
can be seen through Berens and Cuny (1995) and Carpentier (2006). Pecking order theory is a traditional
system that chose financial resources in capital structure decision via a hierarchical system according to
Myers (1984). In this theory, preference towards internal were shown, followed by safest security and
equity financing will be used if the worst case scenario appears. Due to its simplicity, many studies
applied pecking order theory as measurement tools in their empirical research. This can be seen through
the researches of Frank and Goyal (2002), Karadeniz et al (2009), Gebru (2009), Vasiliou, Eriotis, and
Daskalakis (2009), Sheikh and Wang (2011) and Coleman and Robb (2012).
Further research on corporation financing behaviour shows evolution as many researches utilize both
trade-off and pecking order theory in the empirical studies. In the research both of the theories serve as
competing theories and in certain circumstances compliments each other.
However, researches on the domestic capital structure are still far behind from the trends. Many studies
on domestic market focused on the determinants studies. Pandey and Chotigeat (1993), Mohd Azmi
(2006), Sarma et al (2010) and San and Heng (2011) examine the factors that influence capital structure
formation of Malaysian companies. The lack of studies on domestic market using both trade-off and
pecking order framework were acknowledged. Thus, Ahmed et. al (2009) conducted a research that
examined Malaysian firm capital structure policy choice through Pecking Order and Static Trade-Off
model. However, the research shows uneven result in certain areas. In consequence, this paper will revisit
Ahmed et. al (2009) work in order to examine the latest financing behaviour of the Malaysian market.
Slight innovation will be done in order to ensure that this paper differentiate the referred paper and at the
same time can improvise the lack of domestic studies on financing behaviour of listed firms with the
explanation of pecking order or static trade-off model. Listed firms are carefully selected within specific
areas that synchronize between selected capital structure models, variables and time frames. Thus, this
research will try to analyze the issuance of new debt among listed firms in selected countries capital
market context. Debt level changes will be examines via static trade-off or pecking order model. In
addition, the influential factors behind the issuance of debt of selected countries’ listed firms can be
explained through the framework of the selected theories.
Malaysian capital market experience financial liberation and evolution in past decades. Introduction of
financial resources other than banking loans in the capital market create opportunities for firms to expand
their investment, size and growth. International market nowadays beyond reach as international market
penetration and expansion availability is possible. However, this situation depends on the financial
behaviour and approaches according to the interest of the firms.
This paper investigates financing behaviour among listing firms in Malaysia. Leverage levels were
examined thoroughly in order to find a significant explanatory behind the firms’ financial practices.

www.ijbcnet.com International Journal of Business and Commerce Vol. 3, No.5: Jan 2014[99-117]
(ISSN: 2225-2436)
Published by Asian Society of Business and Commerce Research 102
Preference and the factors that influences of financial practices are observed. In order to do this, static
trade-off and pecking order theory implemented into the research as basis of explanatory. Thus, firms’
financing behaviour can be justified theoretically. Specifically, this research uses the explanatory power
from static trade-off and pecking order theory to explain firms’ financing behaviour. The trade-off theory
presents this research the ability to observe levels of debt-ratio in firms’, debt adjustment target
availability and awareness towards the corporate tax shield. On the other hand, pecking order theory
offers this research the capacity to examine firms’ perception on internal financing and external financing
that lead to hierarchical base financing decisions.
The objectives behind debt financing are observed in this study. To be specific, selected firm’s decisions
on the issuance of new debt and its intention that will be observe via static trade-off and pecking order
theory. The theories will be used as reference in translating firms’ financing behaviour. Thus, conclusions
can be made in relations to the firms' financial behaviour.
This research conducted with the hope to fill the gaps that exist due to lack of research on Malaysian
selected listed firms’ financing behaviour that utilizes both static trade-off and pecking order theory
explanatory power. Furthermore, the selected theoretical frameworks give a better depth in revealing the
reasons behind an external financing decision by Malaysian listed firms. The research hopefully will offer
a better understanding on capital structure matters and issues. The addition of static trade-off and pecking
theories as reference and explanatory framework will highlight the importance and consequences of debt
in financing choices and decisions.
The structure of the paper is as follow. The next section explores the empirical studies on static trade off
theory and pecking order hypothesis. In Section 3 we describe our empirical model and data. We present
our result and analyze our findings in Section 4 and Section 5 concludes.
2. Literature Review
Researches on the impacts of capital structure proportions assert on the implications that arose from the
selections of financial sources use to fund the investment. In 1958, Modigliani and Miller published a
research due to anxiety on inadequacy studies on cost-of-capital issues. This research focused on the
relationship between financial structure decision implications towards dividend, rate of interest and
corporate taxes. Consequently, Modigliani and Miller theorem were established and simply known to the
present day as MM theory or MM proposition.
However, the study was imperfect but on the positive side, it became a benchmark for further researches
regarding capital structure matters. Many criticisms and discussions reflected towards the study as it was
based on perfect market. Responding positively towards the criticism, Modigliani and Miller published a
corrected version regarding their earlier paper in 1963. This correctional study observed issues involved
corporate income taxes and return after taxes in relation to the firms’ market valuation.
Although, correctional study has been made in 1963, earlier Modigliani and Miller research in 1958 still
serve as a benchmark for discussion. Welch (1996) discussed the choice between simple debt and equity
and other financial instruments that can be useful to raise capital. The research also argued that MM
propositions are debatable as in imperfect market and the real world, the formation of capital structure
implicated taxes, bankruptcy costs, operating policy, inside information and transaction costs.
www.ijbcnet.com International Journal of Business and Commerce Vol. 3, No.5: Jan 2014[99-117]
(ISSN: 2225-2436)
Published by Asian Society of Business and Commerce Research 103
On the other hand, Modigliani (1988) emphasizes that there are at least two things that are wrong in the
1963 paper. First, the research made an unjustifiable assumption concerning the appropriate rate for
discounting the flow of tax saving produced by the debt. Second, firms’ valuations were on the basis of
the total stream of net of tax income they generated (dividends plus retained earnings plus interest).
According to Modigliani, this was obviously wrong because the existence of personal taxes, the important
things such as the total return net of personal as well as corporate taxes and in general as the personal
taxes paid depend on the composition of the income generated by the corporation.
The implication studies on capital structure generally hovered on the matters and issues involved tax
implications and dividend policy. Alternatively, researches on capital structure also focus on the factors
and determinants of capital structure formation. These researches emphasize on the preference and the
decisive factors that influence the selection of financial sources use to fund the investment. Capital
structure determinants studies generally focus on the basis that influences corporation financing
behaviour.
Rajan et. al (1995) studied the basis of capital structure preference of public firms in the major
industrialized across the G-7 countries. Leverage represented capital structure in this study. The study
investigated the correlation between leverage and fixed assets, investment opportunities, firm size and
profitability. Fixed assets, investment opportunities, firm size and profitability were measured through
proxies namely as tangibility, market-to-book ratio, sales natural log and return on assets.
The capital determinant studies also cover on managerial involvement in the capital structure formation
process. Welch (2002) conducted a research on managerial involvement in capital structure decisions.
Most of the time according to the research, capital structure was adjusted by lagged stock returns. The
paper found that the failures of capital structure adjustments in reaction to external stock returns caused
by managerial flaws. In addition, external stock market influences the financing structure above all
instead of internal corporate optimizing decisions.
2.1 Empirical Studies on the Trade-off Theory and Pecking Order Hypothesis
One of the famous references on empirical research that applied both static trade-off and pecking order
models was done by Shyam-Sunder and Myers (1994). The purpose of the research was to validate the
explanatory power between the two theories on capital structure decision. 157 firms were selected from
the Industrial Compustat files from 1971 to 1989 and tested in this research to analyze the phenomenon
known as financial behaviour. The research found that tested subjects’ financial behaviour were in line
with the pecking order theory instead of the target adjustment model. However, there were probabilities
that tested firms do have a well-defined optimal capital structure but managers do not show interest in
applying it in practices.
Ahmed et. al (2009) conducted a research on 102 listed firms in Bursa Malaysia that obligated with debt
or bond in their balance sheet over the years 1999-2003. The research was conducted to assess the
probability occurrence of debt acquisition in the presence of internal fund deficiency in Malaysian capital
market. Furthermore, the research performed to examine the level of influence by non-debt tax shield,
expected growth, size and asset structure behind new debt issues via static trade-off hypothesis as
compare to pecking order hypothesis. They found that the issuance of new debt by Malaysian firm
influenced by internal fund deficiency as suggested by the pecking order model. However, this finding
was explained in a low predicting power manner through regression. On the other hand, the static trade-
off framework does not influence the issuance of new debt on tests firms.

www.ijbcnet.com International Journal of Business and Commerce Vol. 3, No.5: Jan 2014[99-117]
(ISSN: 2225-2436)
Published by Asian Society of Business and Commerce Research 104
Numerous empirical researches were done using the trade-off model and pecking order theory as
mainframe in order to test corporation financing behaviour. Zhang and Kanazaki (2007) tested 1,325 non-
financial Japanese firms via the static trade-off model and the pecking order model to explain the capital
raise practices of Japanese firms over the period between 2002 and 2006. The study empirical results
show that the Japanese firms tend to apply both models in some part of their financing practice. Several
determinants from the static trade-off model correlated to the Japanese firm’s leverage level as pecking
order model evidence similar movements between net debt retired and financial surplus. Unfortunately,
the static trade-off model falls short to clarify the negative relationship between profitability and firm
leverage. In contrast, the low deficit coefficient was crucially not defined by the pecking order model.
Sakai (2009) documented his efforts to unfold behind the practices of the capital structure decision among
Japanese firms via the two theories and referred researches by Shyam-Sunder and Myers (1994) and
Frank et. al (2007) as a benchmark. Large sample size of 85178 companies, which includes 1193 to 2802
companies for each year over the sample period from 1964 to 2005 were used in the study. The study
found that most Japanese firms complied with the pecking-order theory for nearly of the entire period
after 1964. In the study, Sakai described that pecking-order theory has no clear stands on optimal capital
structure and at the same time considered interest tax shields or the costs of financial distress to be
second-order. Thus, the study concluded that Japanese firms’ financing behaviour was largely motivated
by the need for external funds and not due to the ability to achieve optimal capital structure.
Via the trade-off and the pecking order model, Yu and Aquino (2009) conducted a research in order to
reveal the financial conduct of Philippine listed firms from 1990 to 2001. 150 publicly listed firms from
1991 to 2001 were selected in this study. In the study, the results tend to back pecking order model with
leverage and profitability were negatively related and financing shortage corresponded most of the time to
the annual change in total liabilities. In regards of the joint tests, additional explanatory power was
experienced to work well with the fitted values from the pecking order model equation instead of trade-
off model. As stock market prices were increasing rapidly in 1990 to 1996, the firms issued more equity
than debt. However, this situation was unable to alter the financial behaviour of Philippine firms that
fitted to the pecking order model.
Tong and Green (2005) conducted a research on the matters of the financial decisions among the Chinese
listed companies. 44 non-financial companies listed on the Shanghai and Shenzhen stock exchanges for
the period 2001–2003 were evaluated. Once more, the results take sides on pecking order hypothesis.
Three reasons were established behind the foundations of the result that support the pecking order
hypothesis in regards to the Chinese firm financing behaviour. First, the result shows a strong negative
relationship between leverage and profitability. Next, an evidence of the strong relationship between
current leverage and past dividends, although at a lower significance level was documented. The last
reasons show an irrelevant negative relationship was found between the growth of investment and the rate
of past dividends thus the investment model is inconclusive.
Further empirical research on Chinese listed companies was done by Chen and Strange (2005). In this
research, the authors deployed the trade-off, pecking order and agency theories to clarify and forecast the
signs and significance of identifying factors that influenced the formation of capital structure on selected
firms. 972 listed companies on the Shanghai Stock Exchange and Shenzhen Stock Exchange in China in
2003 were examined. It was found that profitability do not influence the capital structure decision and tax
does not affect the level of debt ratio of selected Chinese listed firms. In contrast, firms’ size and risk
www.ijbcnet.com International Journal of Business and Commerce Vol. 3, No.5: Jan 2014[99-117]
(ISSN: 2225-2436)
Published by Asian Society of Business and Commerce Research 105
positively affected the debt ratio, on the condition of market value measures of capital structure.
Furthermore, period of enlistment of firms were positively influenced the financial decision as the access
of the firms to debt finance is more easily reviewed by book value.
Eldomiaty (2008) published a paper on focused over the matters involve corporate leverage determinants
in Egypt in regards of trade-off, pecking order, and free cash flow theories. The research used 99 firms
trading firms in the Egypt stock market in 2004 as research samples. Result from the research shows that
firms acquired long-term and short term debt for leverage adjustment with a relative reliance on long-term
debt. The research indicates the factors that involved in trade-off framework for capital structure
decisions are taxes, debt/equity ratio and bankruptcy risk. As for the pecking order framework, growth
and profitability influenced the fund selection process.
Via a research paper, Khalid, S (2011) examined 374 non-financial firms listed on Karachi Stock
Exchange (KSE) of Pakistan for the period 1988-2008. The research was conducted in order To integrate
financial reforms and corporate finance in a dynamic setup. Changes in leverage proportion were
examined via proxies such as tangibility, firm’s Growth, profitability, earning volatility, size and financial
reforms in the research. It was found that tangibility was positively related to leverage in accordance with
the trade-off theory. The research able to relate profitability, size and growth as variables that related to
the pecking order theory. However, level of leverage was not influenced by profitability, size and growth.
The results also conclude in its finding that as firms’ size increases, the leverage decreases. In contrast,
the leverage level is related to earnings volatility via the trade-off theory framework. It was also revealed
through the research that government’s firms were heavily dependent on bank loans as financing
resources for investment.
Viviani,J (2008) put an excellent effort in a research to explain the leverage of French wine companies.
410 companies in the wine industry during the period 2000-2004 involved as a sample in this study. Like
other research, leverage as dependent variables were examined together with independent variables
proxies such as size, tangibility, liquidity, asset turnover, volatility, growth, non-debt tax shield and firm’s
age. The research found that French wine companies financing behaviour towards leverage is well
explained by pecking order theory. Additionally, the research concluded that debt ratios were different
among subsections in the wine industries.
Another empirical study on listed firm in Egypt was done by Eldomiaty and Ismail (2008).The paper was
published with the purpose to justify the most chosen determinants on firms’ debt financing decisions.
The research used 99 trading firms in the Egypt stock market from 1998 to 2004. The research discovered
that short-term debt is renewable and utilized for long term period as a foundation for long-term debt
financing. Meanwhile, accessibility of good investment opportunities in the market caused firms to rely
on long-term debt and retained earnings as financing sources. However, profitability do not solely
influenced short-term debt financing but also changes in total debt ratio. Trade-off theory found to be in
relation to the changes long-term debt financing and short-term debt financing most of the time among
Egypt firms.
Medeiros and Daher (2004) tested the static trade-off model against the pecking order models on
Brazilian firms. Via the two models, the research conducted to find the best empirical explanation for the
capital structure of Brazilian firms. The samples consist of 371 non-financial firms listed in the Brazilian
stock exchanges from 1995 to 2002. The research established pecking order theory as the influential
determinants of Brazilian firm financing decision in the examined period. Assets and tangibility and

www.ijbcnet.com International Journal of Business and Commerce Vol. 3, No.5: Jan 2014[99-117]
(ISSN: 2225-2436)
Published by Asian Society of Business and Commerce Research 106
profitability followed the pecking order framework instead of static trade-off theory. Further results show
both theories recognized the natural log of sales as determinants. In the end, market to book value was not
statistically significant in the research test.
Further empirical research was referred to the research by Swinnen, Voordeckers and Vandemaele
(2005). The static trade-off theory and the pecking order theory were tested on 899 firms for the period of
1993 to 2002 in order to explain the financing decisions of selected firms. The research used firm size,
asset structure, profitability, growth opportunities, historical growth and return on investment to explain
changes in the total financial debt ratio and long-term financial debt ratio. It was found that the tested
firms behave as predicted by the pecking order theory, which firms manage their financial debt level in
response to the internal funds conditions.
Sogorb-Mira and López-Gracia (2003) conducted an empirical analysis via trade-off model and pecking
order model in order to explain capital structure in small medium enterprises. Tested sample comprises of
6482 Spanish small medium enterprises with the examined period from 1994 to 1998. The result found
that financing practices of the inspected firms tend to comply both of the theoretical approaches. Even
though evidence showed that small medium enterprises tend to achieve a target or optimum leverage, it
was also found weak evidence surround on the firms’ practices on leverage level adjustment towards the
financing requirements as suggested by the pecking order model.
3. Data and Methodology
The source of data is another important aspect of the research. If the data selected is unreliable, these will
without doubt make the entire research inconclusive and non concrete. Our data are collected from
databases which are Data stream and Bursa Malaysia itself in order to obtain maximum number of firms
for the analysis. Firms from all sectors which listed in Bursa Malaysia are collected from 1995 until 2012
to be considered for analyzing except for the finance and regulated sectors. After taking consideration to
get accurate data, we excluded incomplete/ missing data from the analysis. The remaining balanced panel
dataset of 200 firms is analyzed over 6 years, from 1997 to 2012, resulting 1,200 firm-year observations.
There are two types of data used in this research paper. The first type of data comprises lists of firms that
used in this research. The processes of firms’ selection of this research are explained in firm screening
and selection process. The second type of data comprises financial information that used as variables in
the analysis process. Financial information used in this research paper was based on book values. These
values are used to calculate the proxies that work as variables for this research. This practice is acceptable
for managers and banks as book values usually being use in order to make decision regarding firms’
financial health, condition and other finance related decisions.
3.1 Variables Clarifications
This research chose pecking order theory and static trade-off theory to explain firms’ capital structure
decisions and financing behaviour. Both theories have dependent and independent variables in order to
justify the theory availability in the real business world practices. Thus, variables are not selected
randomly. Certain variables in both theories are selected to analysis available financial data. Through
these variables the capital structure of selected firms will be explained through both pecking order theory
and static trade-off theory.

www.ijbcnet.com International Journal of Business and Commerce Vol. 3, No.5: Jan 2014[99-117]
(ISSN: 2225-2436)
Published by Asian Society of Business and Commerce Research 107
3.2 Dependent Variables
The firms’ financing behaviour tendency in the fund raising process are analyzed in this research. Both
pecking order theory and static trade-off theory are utilized in order to explain the phenomenon. Thus,
debt issuance seems to be related to both theories as the dependent variables. In this research paper,
changes and proportion of total, long and short term debt issuance by selected firms from 2007 until 2012
will be test against available independent variables in order to explain selected firm financing decision.
3.3 Independent Variables
Collected financial data are key firm-specific variables that available as independent variables. These
independent variables provide explanatory power in explaining changes occurred on dependent variables.
Independent variables are selected based on the theoretical framework used in this research paper.
Independent variables in this research are internal fund deficiency, dividend paid, repaid long-term debt,
working capital, capital expenditure, cash flow from business operation, non debt tax shield (NDTS), size,
structure and growth.
3.4 Method
In reference to Ahmed et. al (2009) prior work, three theoretical frameworks identified to be used in
research explanatory analysis and hypothesis constructions.
3.4.1 Pecking order model
The first theoretical framework, the pecking order model relates debt issuance and internal fund
deficiency. The quantitative formula is:
ΔDit = α+βDEFi+ε
Where,
ΔDit is the amendment of debt issuance for firm i at period t.
DEF is the internal fund deficiency.
As for the amendment of debt issuance (ΔDit), it takes the value of one, if Dit-Dit-1 >0, and zero if Dit-
Dit-1 <0. Internal fund deficiency is a combination of dividend payment, capital expenditure, changes in
working capital and debt repayment. If the combination exceeds firm’s operating cash flows, it equals to
one. The value is zero if firm’s operating cash flows bigger than a combination of dividend payment,
capital expenditure, changes in working capital and debt repayment.
3.4.2 Extended Pecking Order Model
The second theoretical framework is the Extended Pecking Order model that relates debt issuance with
several variables namely dividend paid, long-term debt, changes in working capital, capital expenditure
and cash flow from operation . The quantitative formula is:
ΔDit = β0 + β1 DIVit + β2 Rit + β3 ΔWCit + β4 Xit + β5 CFOit
Where,
ΔDit is the acquisition of new debt issued for firm i at period t.
Div is the dividend paid at period t.
Rit is the amount of repaid long-term debt at period t for firm i.
ΔWCit is the changes in working capital at period t for firm i.
www.ijbcnet.com International Journal of Business and Commerce Vol. 3, No.5: Jan 2014[99-117]
(ISSN: 2225-2436)
Published by Asian Society of Business and Commerce Research 108
Xit is the capital expenditure at period t for firm i.
CFOit is the cash flow from operation at period t for firm i.
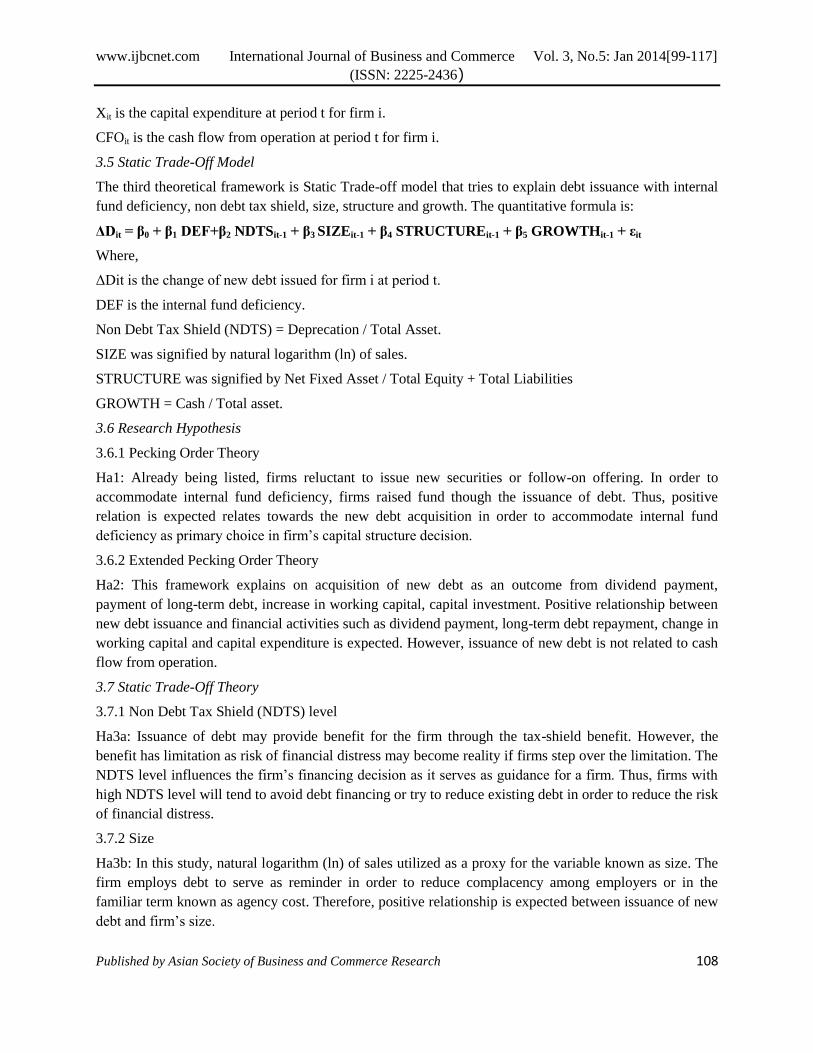
3.5 Static Trade-Off Model
The third theoretical framework is Static Trade-off model that tries to explain debt issuance with internal
fund deficiency, non debt tax shield, size, structure and growth. The quantitative formula is:
ΔDit = β0 + β1 DEF+β2 NDTSit-1 + β3 SIZEit-1 + β4 STRUCTUREit-1 + β5 GROWTHit-1 + εit
Where,
ΔDit is the change of new debt issued for firm i at period t.
DEF is the internal fund deficiency.
Non Debt Tax Shield (NDTS) = Deprecation / Total Asset.
SIZE was signified by natural logarithm (ln) of sales.
STRUCTURE was signified by Net Fixed Asset / Total Equity + Total Liabilities
GROWTH = Cash / Total asset.
3.6 Research Hypothesis
3.6.1 Pecking Order Theory
Ha1: Already being listed, firms reluctant to issue new securities or follow-on offering. In order to
accommodate internal fund deficiency, firms raised fund though the issuance of debt. Thus, positive
relation is expected relates towards the new debt acquisition in order to accommodate internal fund
deficiency as primary choice in firm’s capital structure decision.
3.6.2 Extended Pecking Order Theory
Ha2: This framework explains on acquisition of new debt as an outcome from dividend payment,
payment of long-term debt, increase in working capital, capital investment. Positive relationship between
new debt issuance and financial activities such as dividend payment, long-term debt repayment, change in
working capital and capital expenditure is expected. However, issuance of new debt is not related to cash
flow from operation.
3.7 Static Trade-Off Theory
3.7.1 Non Debt Tax Shield (NDTS) level
Ha3a: Issuance of debt may provide benefit for the firm through the tax-shield benefit. However, the
benefit has limitation as risk of financial distress may become reality if firms step over the limitation. The
NDTS level influences the firm’s financing decision as it serves as guidance for a firm. Thus, firms with
high NDTS level will tend to avoid debt financing or try to reduce existing debt in order to reduce the risk
of financial distress.
3.7.2 Size
Ha3b: In this study, natural logarithm (ln) of sales utilized as a proxy for the variable known as size. The
firm employs debt to serve as reminder in order to reduce complacency among employers or in the
familiar term known as agency cost. Therefore, positive relationship is expected between issuance of new
debt and firm’s size.

www.ijbcnet.com International Journal of Business and Commerce Vol. 3, No.5: Jan 2014[99-117]
(ISSN: 2225-2436)
Published by Asian Society of Business and Commerce Research 109
3.7.3 Structure
Ha3c: The proxy for this variable is net fixed asset over the combination of total equity and total
liabilities. In other words, this proxy measures the stability of a firm. Stability provides confidence to both
investors and financial institutions. Firm considered having a bigger option in acquiring internal financing
when they possess more tangible assets. Thus, debt financing is likely to be materialized as tangible asset
serves as collateral in new debt acquisition.
3.7.4 Growth
Ha3d: The variable of growth represented by cash over total asset. This proxy evaluates firms’ effort in
conducting business operations in term of effectiveness through asset utilization. In order to enhance
effectiveness, firm need to deploy excellent resources and external fund are necessary. Thus, positive
relationship between issuance of new debt and growth is expected.
4. Research Findings
First test we will look on Durbin-Watson statistic for each models. In this test, the dependent variable is
the dummy for amendment of debt issuance (ΔDit). The predictors are internal fund deficiency (DEF) that
is combination of dividend payment, capital expenditure, changes in working capital and debt repayment.
The Durbin-Watson statistic in Table 1 shows that the data is reliable and genuine at the value of 2.253.
This also shows the firms do not have fixed decision in their capital structure decision.
Table 1: Durbin-Watson statistic for Pecking Order Model
R Square
ChangeF Change df1 df2
Sig. F
Change
1 .019a .000 -.002 .488 .000 .189 1 537 .664 2.253
Model Summaryb
Model R R SquareAdjusted
R Square
Std. Error
of the
Estimate
Change StatisticsDurbin-
Watson
a. Predictors: (Constant), Dummy of DEF
b. Dependent Variable: dummy of dit
As for the extended pecking order model, the predictors in this test are capital expenditure (CAPEX),
changes in working capital (WC), long term debt repaid (LTDREPAID) and dividend payment (Divpay)
and the dependent variable is the dummy for amendment of debt issuance (ΔDit). With the Durbin-
Watson statistic value is 2.254 in Table 2, the analysis shows that autocorrelation in not evident through
the collected data. This shows that studied firms are flexible in their capital structure decision within the
studied years.

www.ijbcnet.com International Journal of Business and Commerce Vol. 3, No.5: Jan 2014[99-117]
(ISSN: 2225-2436)
Published by Asian Society of Business and Commerce Research 110
Table 2: Durbin-Watson statistic for Extended Pecking Order Model
R Square
ChangeF Change df1 df2
Sig. F
Change
1 .229a .053 .045 .477 .053 7.390 4 533 .000 2.254
Model Summaryb
Model R R SquareAdjusted
R Square
Std. Error
of the
Estimate
Change StatisticsDurbin-
Watson
a. Predictors: (Constant), CAPEX, WC, LTDREPAID, Divpay
b. Dependent Variable: dummy of dit
The Durbin Watson statistic also applied on the collected data for static trade-off model. The predictors
in this test used proxies such as growth, non debt tax shield (NDTS), size, structure and dummy of
internal fund deficiency. For the dependent variable, the amendment of debt issuance (ΔDit) dummy is
used. As illustrated in Table 3, the statistic result valued for 2.308 concludes that the data is authentic and
not manoeuvred. This finding illustrates that the selected firms in this studied have varied capital structure
decision within the studied years.
Table 3: Durbin-Watson statistic for Static Trade-Off Model
R Square
ChangeF Change df1 df2
Sig. F
Change
1 .205a .042 .033 .480 .042 4.662 5 532 .000 2.308
Std. Error of
the Estimate
Change StatisticsDurbin-
Watson
a. Predictors: (Constant), GROWTH, NDTS, Size, Dummy of DEF, STRUCTURE
b. Dependent Variable: dummy of dit
Model Summaryb
Model R R SquareAdjusted
R Square
Table 4 provides summary results on simple pecking order hypothesis which propose that firm tends to
issue new debt when internal fund deficiency occurs. The Pecking Order model initially combines the
dividend payment, capital expenditure, changes in working capital and debt repayment as internal fund
deficiency. Via the ANOVA regression, the predictors are statistically insignificant at 0.664. This shows
that internal fund deficiency do not influence issuance of new debenture in Malaysian market.

www.ijbcnet.com International Journal of Business and Commerce Vol. 3, No.5: Jan 2014[99-117]
(ISSN: 2225-2436)
Published by Asian Society of Business and Commerce Research 111
Table 4: ANOVA test for Pecking Order Model
Sum of
Squaresdf Mean Square F Sig.
Regression .045 1 .045 .189 .664b
Residual 128.137 537 .239
Total 128.182 538
1
ANOVAa
Model
b. Predictors: (Constant), Dummy of DEF
a. Dependent Variable: dummy of dit
Extended Pecking Order model, this study suggest new debt issuance are finalize due to dividend paid,
long-term debt, changes in working capital, capital expenditure and cash flow from operation. This
hypothesis was analyzed via ANOVA regression and the outcomes can be seen in Table 5. The outcomes
show statistically high significance towards factors involving new debt issuance through the proposed
framework. This is because the significant value is less than 0.01. Thus, this signifies positive relationship
form between new debt issuance and the predictors. This result statistically suggests predictors from the
model do influence firms’ capital structure decision.
Table 5: ANOVA test for Extended Pecking Order Model
Sum of
Squaresdf
Mean
SquareF Sig.
Regression 6.716 4 1.679 7.390 .000b
Residual 121.092 533 .227
Total 127.809 537
b. Predictors: (Constant), CAPEX, WC, LTDREPAID, Divpay
a. Dependent Variable: dummy of dit
ANOVAa
Model
1
Findings from Static Trade-Off model are presented in Table 6. This theoretical framework proposes
changes of debt are manoeuvre by Non Debt Tax Shield (NDTS) level, Size, Structure and Growth. From
the statistical process it was found that the tested predictors were positively related with the issuance of
new debt by selected firms. The relationship between predictors and dependent variable are strongly
related because the level of significance is less than 0.01. Thus, it is statistically proposed that capital
structure practices in Malaysian market do revise Static Trade-Off framework in deciding the outcome of
the firm’s capital proportion level.

www.ijbcnet.com International Journal of Business and Commerce Vol. 3, No.5: Jan 2014[99-117]
(ISSN: 2225-2436)
Published by Asian Society of Business and Commerce Research 112
Table 6: ANOVA test for Static Trade-Off Model
Sum of
Squares df
Mean
Square F Sig.
Regression 5.374 5 1.075 4.662 .000b
Residual 122.656 532 .231
Total 128.030 537
Model
1
a. Dependent Variable: dummy of dit
b. Predictors: (Constant), GROWTH, NDTS, Size, Dummy of DEF, STRUCTURE
ANOVAa
Further regression via confidence interval (CI) is done towards Extended Pecking Order model. As
presented in Table 7, the result statistically identifies independent variables that influence the changes
towards dependent variables. Both long term debenture repayment and capital expenditure were the main
predictors in extended pecking order model. Most of selected firms in this study tend to issues new debt
in order to practice capital expenditure. Capital expenditure is slightly more significant if compared to
long term debt repaid. Long term debenture repayment was statistically significant at 0.054. In other
words, selected firms in this study also take risks through new debt issuance to pay previous year’s long
term debt.
Table 7: Coefficients statistic for Extended Pecking Order Model
Standardized
Coefficients
B Std. Error Beta
(Constant) .310 .026 11.834 .000
Divpay -.003 .008 -.017 -.363 .716
LTDREPAID -.002 .001 -.084 -1.927 .054
WC .000 .000 .039 .882 .378
CAPEX .007 .002 .186 4.000 .000
1
a. Dependent Variable: dummy of dit
Coefficientsa
Model
Unstandardized
Coefficients
t Sig.

www.ijbcnet.com International Journal of Business and Commerce Vol. 3, No.5: Jan 2014[99-117]
(ISSN: 2225-2436)
Published by Asian Society of Business and Commerce Research 113
Static Trade-Off model also received further regression via confidence interval (CI). Table 8 shows
further regression result that identified specific independent variables that statistically influence changes
of dependent variables. It was found that all independent variable statistically synchronize in responsible
changes of dependent variable. In other words, independent variables such as NDTS, SIZE,
STRUCTURE and GROWTH triggered the changes of debt in selected firms. Via confidence interval
(CI) regression, the result statistically stated that selected firms in this study tend to issues new debt as
suggested by the Static Trade-Off framework. NDTS lead the significant statistic number with 0.004. This
is follow closely by SIZE with 0.007 with Growth at third place with 0.028. The least significant
independent variable is STRUCTURE with 0.089.
Table 8: Coefficients statistic for Static Trade-Off Model
Standardize
d
Coefficients
B Std. Error Beta
(Constant) .208 .096 2.173 .030
Dummy of DEF .052 .049 .048 1.055 .292
NDTS -.343 .118 -.134 -2.899 .004
SIZE .045 .016 .116 2.729 .007
STRUCTURE .204 .120 .082 1.703 .089
GROWTH -.507 .231 -.098 -2.200 .028
1
a. Dependent Variable: dummy of dit
Model
Unstandardized
Coefficients
t Sig.
Coefficientsa
5. Conclusion
This study is done to manifest previous empirical finance literature by revisit Pecking Order model and
Static Trade-Off framework in the perspective of Malaysian capital market as 200 selected firms from
2007-2012 were studied. Improvise statistical tools and complete data provide this study with a new edge
in explaining Malaysian capital market latest phenomenon. Durbin-Watson statistic emphasize collected
data were approve to be reliable and were not tainted by autocorrelation.
Regression result via ANOVA on Pecking Order model clearly rejects certain previous empirical studies
claimed and hypothesis. Via ANOVA, this paper witnesses that new debt issuance managed by selected
firms were not influenced by internal fund deficiency scenario. Thus, hypothesis Ha1, that expected new
debt acquisition occur in order to accommodate internal fund deficiency as primary choice in firm’s
capital structure decision is statistically rejected.
However, the extended Pecking Order model shows different story. The regression analysis via ANOVA
shows independent variables are statistically significant influenced the issuance of new debt in selected
Malaysian listed firms. The level of significant was acceptingly high. To this extent, hypothesis Ha2,
which indicates positive relationship between new debt issuance and financial activities such as dividend

www.ijbcnet.com International Journal of Business and Commerce Vol. 3, No.5: Jan 2014[99-117]
(ISSN: 2225-2436)
Published by Asian Society of Business and Commerce Research 114
payment, long term debt repayment, change in working capital and capital expenditure, is statistically
accepted.
Further regression analysis was done via CI on the extended Pecking Order model. The result highly
supports the ANOVA regression. CI regression also specifically determines capital expenditure and long
term debt repayment are statistically significant behind new debt issuance of selected firms. Thus, CI
regression statistically accepted the hypothesis Ha2 on positive relationship between new debt issuance
towards long term debt repayment and capital expenditure but not on the other independent variables.
In contrast to Ahmed et al (2009) previous study, this paper found that Static Trade-Off framework
provides more vibrant explanation on capital structure policy choice of selected firms. Both ANOVA and
CI regression results suggest that all of the determents in Static Trade-Off framework were found highly
significant influenced the issuance of new debt by the selected firms. NDTS level, size, structure and
growth were statistically related with selected firms financing decision.
NDTS may provide benefit for firm through the tax-shield benefit. However, risk of financial distress
limit this benefit. Based on NDTS level of significant it shows that selected firms issue new debt both
because their NDTS level is low and to gain the tax-shield benefit or willingly to face the distress risks.
This result shows accounting procedures Malaysian firms may have move into heights. Using
depreciation can aid firms to generate cash through reclamation the costs of capital assets acquisitions and
also reduce tax liability.
Proxy by natural logarithm of sales, size significantly influences new debt acquisitions of selected firms.
This is proven statistically through both ANOVA and CI. Therefore, hypothesis Ha3b is accepted which
predicted positive relationship between issuance of new debt and firm’s size. In other words, new debt
issuance serves as agency cost complacency parameter in selected firms.
Structure represents as a measure to the stability of a firm in Static Trade-Off framework. This variable is
statistically significant in determine new debt issuance of selected firms. At the same time, the nature of
Malaysian capital market that relies on tangible assets to serve as collateral in approving issuance of new
security. Thus, this can be use as evidence that selected firms tend to issue new debt because of their
possession on tangible assets is acceptable and reliable.
Both ANOVA and CI regression results identified growth contributes as one of the decisive factors in
new debt issuance. This result, approve hypothesis Ha3d that expect positive relationship between
issuance of new debt and growth. Selected firms issue new debt to enhance business operation
effectiveness. Thus, selected firms are able to deploy excellent financial resources.
This research covers five years time frame from 2007 to 2012 with 200 firms selected through strict
selections. As mentioned before, lack of studies on domestic market using both Pecking Order and Static
Trade-Off framework lead this study. Most capital structure studies on Malaysian market focus on
determinants studies rather that empirically involves Pecking Order and Static Trade-Off framework.
Evolution from typical capital determinants studies is engineered via this paper.
This study revisits Ahmed et al (2009) with slight compliment of innovations. No major changes were
applied. The use of different statistical tools, slight changes of proxies, improvise hypothesis, and
adequate data without changing the theoretical framework, improvise understanding on capital structure
issues. Malaysian capital market evolutions were investigated via this paper.
www.ijbcnet.com International Journal of Business and Commerce Vol. 3, No.5: Jan 2014[99-117]
(ISSN: 2225-2436)
Published by Asian Society of Business and Commerce Research 115
This paper study firms finance behaviour that focused on capital structure decision based on issuance of
new debt. Firms’ financial decisions on new debt issuance were explained based on Pecking Order and
Static Trade-Off framework. Determinants of issuance of new debt by selected firms were identified.
Pecking Order and Static Trade-Off framework provide explanation capital structure decision among
selected in consistent and reliable manner with the support of statistical evidence.
Several limitations shadow this study in various ways. Limited data access was one of the culprits. Bursa
Malaysia websites (http://www.bursamalaysia.com) was not reliable as it looks and far from the context
of user friendly websites. However, Capital IQ website (https://www.capitaliq.com) proves to be the
solutions with specific features in order to selected qualified firms as samples for this paper.
At the same time, there is problem with the selected firms in the test set which implement diverse
accounting procedures. This can be seen via practices of annual closing account period as it varies among
the firms. Differed accounting practices could affect the precision of the result. Analyzing longer period
time-series of collected data increase probability of accurate and precise result. In addition, to evade
biases in the analysis, it is vital to perform study in the time that steady economic predicament by specific
precise time period before and during the crisis in order.
The limitation of this study is that the samples are not specifically focus on one industry. Chosen
industries were based on energy, materials, industrials, consumer discretionary, consumer staples,
healthcare, information technology, telecommunication services and utilities. However, the statistical
approach does not analyze industries individually. Thus, the results do not differentiate the industries as
an individual view. In the other flip side of the coin, the results represent Malaysian capital market in a
general view or overall view of selected industries. In addition, a research of comparison between
industries should be conducted in the future.
Lastly, this study only limited to one capital market known as Malaysian capital market. Thus the results
may represent only Malaysian capital market and selected Malaysian listed firms financing behaviour.
Further study should be involved comparison between two or more country. Gurcharan (2010) may have
already conducted a research on optimal capital structure among ASEAN countries but only focus on the
determinants but do not utilize Pecking Order and Static Trade-Off model as explanatory framework.

www.ijbcnet.com International Journal of Business and Commerce Vol. 3, No.5: Jan 2014[99-117]
(ISSN: 2225-2436)
Published by Asian Society of Business and Commerce Research 116
References
I. Ahmed, H.J.A. and Hisham, N. (2009). Revisiting Capital Structure Theory: A Test of Pecking
Order and Static Order Trade-of Model from Malaysian Capital Market. International Research
Journal of Finance and Economics, Issue 30.
II. Berens, J.L. and Cuny, C.J. (1995). The Capital Structure Puzzle Revisited The Review of
Financial Studies. Vol.8, No.4 pp. 1185-1208.
III. Carpentier, C. (2006)."The Valuation Effects of Long-term Changes in Capital Structure".
International Journal of Managerial Finance, Vol. 2 Issue: 1 pp. 4 - 18.
IV. Chen, J. and Strange, R. (2005). The Determinants of Capital Structure: Evidence from Chinese
Listed Companies. Economic Change and Restructuring.
V. Coleman, S. and Robb, A. (2012)."Capital Structure Theory and New Technology Firms: Is there
a match?", Management Research Review, Vol. 35 Issue: 2 pp. 106 - 120.
VI. Eldomiaty, T.I. (2008). Determinants of Corporate Capital Structure: Evidence from an Emerging
Economy. International Journal of Commerce and Management.
VII. Eldomiaty, T.I. and Ismail, M.A. (2008). Modelling Capital Structure Decisions in a Transition
Market: Empirical Analysis of Firms in Egypt. Review of Quantitative Finance and Accounting.
VIII. Frank, M.Z. and Goyal V.K. (2002). Testing the Pecking Order Theory of Capital Structure.
Journal of Financial Economics 00.
IX. Frank, M.Z. and Goyal V.K. (2007). Trade-off and Pecking Order Theories of Debt Handbook of
Corporate Finance: Empirical Corporate Finance.
X. Gebru, G.H. (2009). "Financing Preferences of Micro and Small Enterpr
XI. Gurcharan, S. (2010). A Review of Optimal Capital Structure Determinant of Selected ASEAN
Countries International Research Journal of Finance and Economics. ISSN 1450-2887 Issue 47
XII. Gebru, G.H. (2009). "Financing Preferences of Micro and Small Enterprise Owners in Tigray:
does POH hold?". Journal of Small Business and Enterprise Development, Vol. 16 Issue: 2 pp.
322 - 334.
XIII. Karadeniz, E., Kandir, S.Y., Balcilar, M. and Onal, Y.B. "Determinants of Capital Structure:
Evidence from Turkish Lodging Companies", International Journal of Contemporary Hospitality
Management, Vol. 21 Issue: 5 pp. 594 - 609.
XIV. Khalid, S. (2011). Financial Reforms and Dynamics of Capital Structure Choice: A Case of
Publically Listed Firms of Pakistan. Journal of Management Research.
XV. Medeiros, O.R.D. and Daher, C.E. (2004). Testing Static Tradeoff against Pecking Order Models
of Capital Structure in Brazilian Firms. Economic Research Division.
XVI. Modigliani, F. and Miller, M.H. (1958). The Cost of Capital, Corporation Finance and the Theory
of Investment. The American Economic Review, Vol. 48, No. 3. pp. 261-297.
XVII. Modigliani, F. and Miller, M.H. (1963). Corporate Income Taxes and the Cost of Capital: A
Correction. The American Economic Review, Vol. 53, No. 3. pp. 433-443.
XVIII. Modigliani, F. (1988). MM--Past, Present, Future. The Journal of Economic Perspectives, Vol. 2,
No. 4. pp. 149-158.
XIX. Pandey, I.M. and Chotigeat, T. (1993). "Theories of Capital Structure: Evidence from an
Emerging Market. Studies in Economics and Finance, Vol. 22 Issue: 2 pp. 1 - 19.
XX. Rajan, G.R. and Zingales, L. (1995). What Do We Know about Capital Structure? Some
Evidence from International Data. The Journal of Finance, Vol. 50, No. 5, pp. 1421-1460.

www.ijbcnet.com International Journal of Business and Commerce Vol. 3, No.5: Jan 2014[99-117]
(ISSN: 2225-2436)
Published by Asian Society of Business and Commerce Research 117
XXI. Sakai, K. (2009). Financing Behavior of Japanese Firms. The Japanese Economy, vol. 36, no. 4.
pp. 3–30.
XXII. San, O.T. and Heng, T.B. (2011). Capital Structure and Corporate Performance of Malaysian
Construction Sector International Journal of Humanities and Social Science Vol. 1 No. 2.
XXIII. Sarma, L.V.L.N., Lellapalli, S. and Lellapalli, R.V. (2010). Factors Influencing Capital
Structures: An Analysis of Companies in Malaysia UNITAR E-JOURNAL Vol. 6, No.2.
XXIV. Sheikh, N.A. and Wang, Z. (2011). "Determinants of Capital Structure: An Empirical Study of
Firms in Manufacturing Industry of Pakistan". Managerial Finance, Vol. 37 Issue: 2 pp. 117 -
133.
XXV. Shyam-Sunder, L. and Myers S.C. (1994). Testing Static Trade-Off against Pecking Order
Models of Capital Structure. NBER Working Paper.
XXVI. Sogorb-Mira, F. and López-Gracia, J. (2003). Pecking Order Versus Trade-off: An Empirical
Approach to the small medium enterprise capital structure. IVIE working papers.
XXVII. Swinnen, S., Voordeckers, W. and Vandemaele, S. (2005). Capital Structure in SMEs: Pecking
order versus Static Trade off, Bounded Rationality and the behavioral principle. European
Financial Management Association.
XXVIII. Tong, G. and Green, C.J. (2005). Pecking Order or Trade-off Hypothesis? Evidence on the
Capital Structure of Chinese companies. Applied Economics.
XXIX. Vasiliou, D., Eriotis, N. and Daskalakis, N. (2009)."Testing the Pecking Order Theory: the
importance of methodology". Qualitative Research in Financial Markets, Vol. 1 Issue: 2 pp. 85 -
96.
XXX. Viviani, J. (2008). Capital Structure Determinants: An Empirical Study of French Companies in
the Wine Industry. International Journal of Wine Business Research.
XXXI. Welch, I. (1996). A Primer on Capital Structure. Finanzmarkt und Portfolio Management, 1995-2.
XXXII. Welch, I. (2002). Columbus’ Egg: The Real Determinant of Capital Structure. NBER Working
Paper Series: Working Paper 8782.
XXXIII. Yu, D.D. and Aquino, R.Q. (2009). Testing Capital Structure Models on Philippine Listed Firms.
Applied Economics.
XXXIV. Zhang, R. and Kanazaki, Y. (2007). Testing Static Trade off against Pecking Order Models of
Capital Structure in Japanese Firms. International Journal of Accounting and Information
Management, Vol. 15 Issue: 2 pp. 24 - 36.
Working paper:
Mohd Azmi, J. (2006). Capital Structure and Profitability of the Property and Construction Sectors in
Bursa Malaysia. College of Business Management and Accounting. Universiti Tenaga Nasional.