A Survey on Impediments to Trade and Foreign Direct ... Survey on Impediments to Trade and Foreign...
171
A Survey on Impediments to Trade and Foreign Direct Investment Between Latin American and East Asian Countries March 2005 THE JAPAN INSTITUTE OF INTERNATIONAL AFFAIRS COMMISSIONED BY THE MINISTRY OF FOREIGN AFFAIRS, JAPAN
Transcript of A Survey on Impediments to Trade and Foreign Direct ... Survey on Impediments to Trade and Foreign...
A Survey on Impediments to Trade and Foreign Direct Investment Between Latin American and East Asian Countries
March 2005
THE JAPAN INSTITUTE OF INTERNATIONAL AFFAIRS
COMMISSIONED BY THE MINISTRY OF FOREIGN AFFAIRS, JAPAN
PPPRRREEEFFFAAACCCEEE
The principal aims of this project are to provide a review of the current trends in trade and
Foreign Direct Investment (FDI) between East Asia and Latin America, and to identify how the
private and public sectors in these regions can further enhance their business relationships. At
the request of the Ministry of Foreign Affairs (MOFA), Japan, this report was prepared for the
Forum for East Asia-Latin America Cooperation (FEALAC) by the Japan Institute of
International Affairs (JIIA).
This attempt to draw an overall picture of the economic interdependence between Asia and
Latin America is based upon the Ministry’s strong desire to further enhance inter-regional
relations, also a matter of common interest to the member countries of FEALAC. Established in
2001, FEALAC is a multilateral initiative involving government officials and other experts that
aims to promote better understanding and cooperation between the two regions in various fields.
At the first meeting held in 2001 in Santiago, Chile, three working groups were established:
Politics and Culture, Economy and Society, and Education, Science, and Technology. Japan
has been actively involved in the Economy and Society Working Group and has served as a co-
chair with Latin American countries. One of the major issues that has recently been raised in
the working group is the development and promotion of business relations between East Asia
and Latin America, which have not been drawing enough attention despite their large potential.
In response to such interest among the member countries, the decision has been made by the
Japanese MOFA to conduct a survey on the current situation regarding trade and FDI between
these regions.
To develop this report, three approaches were taken. First, statistical data analysis was
conducted on the trade and FDI trends of the past decade and the result reflected in the
Overview. In addition to statistical data, the results from several existing surveys pursued by
other private and governmental agencies were also studied and utilized. Third and most
importantly, interviews were conducted with business and government agents who are daily
involved in pursuing or promoting economic activities between these two regions. Among them
are the two small workshops held at JIIA in February that focused on issues related to
Japanese-foreign business relations.
In the workshops held at JIIA, four guest speakers contributed extensively to identifying central
problems in business activities between Japanese and foreign firms. Takatomo Tozuka (Japan
External Trade Organization (JETRO)) and Koji Uchida (Corporate Strategy and Research
Department, Mitsui Corporation) discussed general difficulties facing Japanese business in Latin
America. Nicholas Benes (The American Chamber of Commerce in Japan, and JTP
Corporation) and Arthur Lord (The American Chamber of Commerce in Japan) presented
general impediments to foreign businesses in Japan from their own experience. We would like
to express our heartfelt gratitude toward them. We would also like to thank the many other
people to whom we are indebted for providing a substantial amount of useful information
through the interviews conducted in the Asian and Latin American countries.
Finally, this project and the report were shaped by JIIA in extensive cooperation with three
economists: Shujiro Urata, Kozo Kiyota, and Mitsuyo Ando. Without them, it would have been
impossible to conduct all the interviews, to exchange views on the information collected, and to
develop this report. We thank them all.
The opinions and views expressed herein represent those of the individual authors and do not
necessarily reflect those of the government of Japan, nor JIIA. We truly hope this report helps
people in both the private and public sectors who are devotedly engaged in the promotion of
economic and business cooperation between East Asia and Latin America.
March 2005
Makio Miyagawa
Director
The Japan Institute of International Affairs
LLLIIISSSTTT OOOFFF PPPRRROOOJJJEEECCCTTT MMMEEEMMMBBBEEERRRSSS
Shujiro Urata
Professor of International Economics
Graduate School of Asia-Pacific Studies
Waseda University
Kozo Kiyota
Associate Professor
Faculty of Business Administration
Yokohama National University
Mitsuyo Ando
Assistant Professor
Faculty of Economics
Hitotsubashi University
Aya Kachi
Research Fellow
The Japan Institute of International Affairs
TTTAAABBBLLLEEE OOOFFF CCCOOONNNTTTEEENNNTTTSSS PREFACE LIST OF PROJECT MEMBERS 1. INTRODUCTION 2. OVERVIEW:
PATTERNS OF TRADE AND FDI BETWEEN EAST ASIA AND LATIN AMERICA
2-1. TRENDS OF TRADE AND FDI 2-2. FEATURES OF TRADE PROTECTION
IN EAST ASIA AND LATIN AMERICA 3. ISSUES AND IMPEDIMENTS BY COUNTRY:ASIA
3-1. CHINA 3-2. KOREA 3-3. JAPAN 3-4. THAILAND
4. ISSUES AND IMPEDIMENTS BY COUNTRY:LATIN AMERICA
4-1. BRAZIL 4-2. CHILE 4-3. MEXICO
5. CONCLUDING REMARKS:
SOME SUGGESTIONS FOR THE PROMOTION OF TRADE AND FDI BETWEEN EAST ASIA AND LATIN AMERICA
6. REFERENCES
111... IIINNNTTTRRROOODDDUUUCCCTTTIIIOOONNN
The globalization of economic activities has been accelerating rapidly as cross-border
movements of goods, money, information, and people have expanded remarkably in recent
years. Although globalization has allegedly brought some negative consequences such as
widening income gaps among as well as within countries, on the whole it has had positive
impacts on rapid economic growth and technological progress. One factor that has contributed
to globalization is the liberalization of trade and foreign direct investment (FDI) policies which
has been pursued by a large number of countries.
Vying with rapid globalization, regionalization, or regional economic integration, has emerged in
various parts of the world in recent years. Regionalization takes two forms. One type of
regionalization arises as a result of natural economic developments in that the benefits of
agglomeration -- including economies of scope, scale, and speed – outweigh the costs of
agglomeration such as congestion. Indeed, rapidly growing economies in proximity interact with
each other through market and non-market channels, resulting in the promotion of economic
growth. The other type of regionalization involves institutional arrangements such as regional
trade agreements (RTAs), which include free trade agreements (FTAs) and customs unions.
RTAs are discriminatory trade agreements, providing only members with preferential treatment.
The former type of regionalization may be characterized as 'market-driven,' and the latter as
'institution-driven.' Both East Asian and Latin American regions have been witnessing the two
types of regionalization in recent years. Regionalization in East Asia was mainly driven by
market forces until the beginning of the 21st century. However, market-driven regionalization has
been supplemented by institution-driven regionalization in recent years, as many East Asian
countries have begun establishing FTAs with other East Asian countries. Compared to East
Asia, Latin America has had significantly longer and more experience in institution-driven
regionalization, as it began setting up FTAs and customs unions in the 1960s.
In light of these recent developments in the world economy as well as East Asian and Latin
American regional economies, this report examines the recent developments in trade and FDI
relationships between East Asia and Latin America. Specifically, this report attempts to identify
the impediments that have discouraged trade and FDI between the two regions with the view
that removal of the impediments would result in an increase in trade and FDI, which in turn
would contribute to the economic growth of the two regions.
The report has adopted basically three approaches for examining the issues. One is analyzing
statistical data on trade and FDI from the two regions in order to discern relationships from a
broad perspective. Another approach is utilizing the results of the surveys, which have been
conducted by several organizations, in order to identify the impediments to trade and FDI. The
third approach is conducting interviews with relevant organizations and persons knowledgeable
about the impediments. By combining these three approaches, we may be able to obtain an
accurate picture of the problems so that we can formulate recommendations for overcoming the
impediments. In the analysis, we selected six countries, three each from the two regions (Japan,
Korea, and Thailand from East Asia and Brazil, Chile and Mexico from Latin America), in order
to undertake an in-depth analysis. Although there are country-specific impediments, there
appear to be a number of impediments common to many countries. Accordingly, our findings
from these six countries should prove useful for formulating policies to promote trade and FDI
for other countries as well.
This report has been prepared for the Forum for East Asia-Latin America Cooperation
(FEALAC) by the Japan Institute of International Affairs with financial support from Japan’s
Ministry of Foreign Affairs.

22 R2... OOOVVVEEERRRVVVIIIEEEWWW::: PPPAAATTTTTTEEERRRNNNSSS OOOFFF TTTRRAAADDDEEE AAANNNDDD FFFDDDIII
BBBEEETTTWWWEEEEEENNN EEEAAASSSTTT AAASSSIIIAAA AAANNNDDD LLLAAATTTIIINNN AAAMMMEEERRRIIICCCAAA
2-1 Trends in Trade and FDI
(1) Overall Trends
Tables 2-1-1 and 2-1-2 present trade and FDI in East Asia and Latin America, and Table 2-1-3
shows their growth expressed as an index based on 1996 figures (values in 1996 = 100). Here,
trade includes both trade in goods (exports and imports) and trade in services (credit and debit).
Trade in travel services is also presented in the tables since it accounts for a large portion of
trade in services as a whole. Other indicators presented in Table 2-1-1 and 2-1-3 are the level
and growth of FDI (assets and liabilities). Assets and liabilities here are equivalent to the
monetary values of the outward and inward FDI of the country, respectively.
Table 2-1-1. Trade in Goods and Foreign Direct Investment in East Asia and Latin America
(Millions of US Dollars)Trade in goods
Exports Imports Net (Exports - Imports)1996 2000 2001 2002 1996 2000 2001 2002 1996 2000 2001 2002
Argentina 24,043 26,341 26,543 25,709 22,283 23,889 19,158 8,470 1,760 2,452 7,385 17,239Brazil 47,851 55,086 58,223 60,362 53,304 55,783 55,572 47,219 -5,453 -698 2,650 13,143Chile 16,627 19,210 18,466 18,340 17,699 17,091 16,411 15,827 -1,072 2,119 2,054 2,513China 151,077 249,131 266,075 325,651 131,542 214,657 232,058 281,484 19,535 34,474 34,017 44,167Hong Kong n.a. 202,698 190,926 200,220 n.a. 210,891 199,257 205,352 n.a. -8,193 -8,331 -5,132Indonesia 50,188 65,406 57,364 58,773 44,240 40,366 34,669 35,652 5,948 25,040 22,695 23,121Japan 400,287 459,513 383,592 395,581 316,702 342,797 313,378 301,751 83,585 116,716 70,214 93,830Korea 129,968 175,948 151,262 162,554 144,933 159,076 137,770 148,374 -14,965 16,872 13,492 14,180Malaysia 76,985 98,429 87,981 93,383 73,137 77,602 69,597 75,248 3,848 20,827 18,383 18,135Mexico 96,002 166,455 158,443 160,763 89,469 174,458 168,396 168,679 6,533 -8,003 -9,953 -7,916Peru 5,877 6,951 7,007 7,647 7,869 7,407 7,273 7,440 -1,991 -455 -267 207Philippines 20,543 37,295 31,243 34,383 31,885 33,481 31,986 33,975 -11,342 3,814 -743 408Singapore 129,547 139,861 124,443 128,374 123,894 127,563 109,675 109,825 5,653 12,298 14,768 18,549Taiwan 115,462 147,548 122,079 129,882 97,919 133,531 101,898 105,184 17,543 14,017 20,181 24,698Thailand 54,408 67,894 63,202 66,795 63,897 56,193 54,620 57,020 -9,488 11,701 8,582 9,775United States 614,013 774,632 721,842 685,384 803,112 1,224,430 1,145,950 1,164,760 -189,099 -449,798 -424,108 -479,376Foreign direct investment
Asset Liabilities Net (Asset - Liabilities)1996 2000 2001 2002 1996 2000 2001 2002 1996 2000 2001 2002
Argentina 1,601 901 161 -643 6,949 10,418 2,166 775 -5,348 -9,517 -2,005 -1,418Brazil -467 2,282 -2,258 2,482 11,200 32,779 22,457 16,566 -11,667 -30,498 -24,715 -14,084Chile 1,298 3,987 1,432 574 4,979 3,639 4,477 1,713 -3,681 348 -3,045 -1,140China 2,114 916 6,884 2,518 40,180 38,399 44,241 49,308 -38,066 -37,483 -37,357 -46,790Hong Kong n.a. 59,352 11,345 17,694 n.a. 61,924 23,776 13,718 n.a. -2,572 -12,431 3,976Indonesia 600 n.a. n.a. n.a. 6,194 -4,550 -3,278 -1,513 -5,594 n.a. n.a. n.a.Japan 23,447 31,534 38,497 32,017 208 8,227 6,191 9,087 23,239 23,307 32,306 22,930Korea 4,671 4,999 2,420 2,674 2,326 9,283 3,528 1,972 2,345 -4,285 -1,108 703Malaysia n.a. 2,026 267 1,905 5,078 3,788 554 3,203 n.a. -1,762 -287 -1,299Mexico n.a. n.a. 4,404 969 9,186 16,075 26,204 14,622 n.a. n.a. -21,800 -13,653Peru -17 n.a. 74 n.a. 3,471 810 1,144 2,391 -3,488 n.a. -1,070 n.a.Philippines 182 -108 -160 85 1,517 1,345 982 1,111 -1,335 -1,453 -1,142 -1,026Singapore 6,234 6,061 9,548 4,082 9,303 12,463 10,949 6,097 -3,069 -6,402 -1,401 -2,015Taiwan 3,843 6,701 5,480 4,886 1,864 4,928 4,109 1,445 1,979 1,773 1,371 3,441Thailand 931 -23 344 106 2,336 3,366 3,820 900 -1,405 -3,389 -3,476 -794United States 91,880 159,212 119,963 137,836 86,520 321,274 151,581 39,633 5,360 -162,062 -31,618 98,203Source: IMF (2004) Balance of Payments Statistics (CD-ROM), Washington, D.C.: IMF.

Table 2-1-2. Trade in Services and Travel Services in East Asia and Latin America (Millions of US Dollars)Trade in services
Credit Debit Net (Credit - Debit)1996 2000 2001 2002 1996 2000 2001 2002 1996 2000 2001 2002
Argentina 4,339 4,765 4,398 2,945 7,865 9,039 8,298 4,541 -3,527 -4,274 -3,900 -1,595Brazil 4,655 9,498 9,322 9,606 12,714 16,660 17,081 14,644 -8,059 -7,162 -7,759 -5,038Chile 3,588 4,078 4,105 3,960 3,589 4,726 5,023 4,917 -1 -648 -918 -957China 20,601 30,431 33,334 39,745 22,585 36,031 39,267 46,528 -1,984 -5,600 -5,933 -6,784Hong Kong n.a. 40,759 41,428 45,159 n.a. 24,584 24,314 24,204 n.a. 16,175 17,114 20,954Indonesia 6,599 5,213 5,500 6,574 15,139 15,011 15,880 17,117 -8,540 -9,798 -10,380 -10,542Japan 67,712 69,238 64,516 65,712 129,988 116,864 108,249 107,940 -62,276 -47,626 -43,733 -42,228Korea 23,412 30,534 29,055 28,143 29,592 33,423 32,883 35,603 -6,179 -2,889 -3,828 -7,461Malaysia 15,136 13,941 14,455 14,878 17,573 16,747 16,657 16,448 -2,437 -2,807 -2,202 -1,570Mexico 10,723 13,756 12,701 12,740 10,817 17,360 17,194 17,660 -94 -3,604 -4,493 -4,920Peru 1,414 1,604 1,510 1,545 2,085 2,295 2,345 2,493 -671 -691 -835 -948Philippines 12,947 3,972 3,148 3,056 9,429 6,402 5,198 4,320 3,518 -2,430 -2,050 -1,264Singapore 30,453 29,099 28,855 29,702 22,101 26,938 26,886 27,298 8,351 2,161 1,969 2,404Taiwan 16,260 19,952 19,495 21,385 24,381 26,930 24,700 25,217 -8,121 -6,978 -5,205 -3,832Thailand 17,007 13,868 13,024 15,319 19,585 15,460 14,619 16,722 -2,578 -1,592 -1,595 -1,403United States 236,890 295,421 285,738 288,722 150,629 221,012 219,444 227,380 86,261 74,409 66,294 61,342Trade in travel services
Credit Debit Net (Credit - Debit)1996 2000 2001 2002 1996 2000 2001 2002 1996 2000 2001 2002
Argentina 2,621 2,904 2,642 1,535 3,584 4,425 3,893 2,328 -963 -1,521 -1,251 -793Brazil 718 1,810 1,731 1,998 4,387 3,894 3,199 2,396 -3,669 -2,084 -1,468 -398Chile 931 819 799 733 736 620 708 788 195 200 90 -54China 10,200 16,231 17,792 20,385 4,474 13,114 13,909 15,398 5,726 3,117 3,883 4,987Hong Kong n.a. 7,930 n.a. n.a. n.a. 12,502 n.a. n.a. n.a. -4,572 n.a. n.a.Indonesia 6,184 4,974 5,276 5,285 2,399 3,197 3,406 3,368 3,785 1,777 1,870 1,916Japan 4,081 3,373 3,306 3,497 37,058 31,884 26,531 26,656 -32,977 -28,512 -23,224 -23,159Korea 4,880 6,834 6,384 5,294 7,482 7,132 7,617 9,068 -2,603 -298 -1,233 -3,774Malaysia 4,477 5,011 6,863 7,118 2,569 2,075 2,614 2,618 1,908 2,936 4,249 4,500Mexico 6,756 8,294 8,401 8,858 3,388 5,499 5,702 6,060 3,368 2,795 2,699 2,798Peru 670 911 788 801 350 530 592 616 320 381 196 185Philippines 1,546 2,134 1,723 1,740 1,266 1,005 1,229 871 280 1,129 494 869Singapore 7,391 5,202 4,586 4,381 5,003 4,547 5,604 5,213 2,388 656 -1,018 -833Taiwan 3,636 3,738 3,990 4,229 8,152 8,107 7,319 6,963 -4,516 -4,369 -3,329 -2,734Thailand 9,089 7,483 7,075 7,901 4,286 2,772 2,924 3,303 4,803 4,711 4,151 4,598United States 81,786 97,943 88,977 85,262 49,548 67,045 62,788 60,843 32,238 30,898 26,190 24,418Source: IMF (2004) Balance of Payments Statistics (CD-ROM), Washington, D.C.: IMF.

Table 2-1-3. The Growth of Trade in Goods, Foreign Direct Investment, Trade in Services, and Trade in Travel Services in East Asia and Latin America (1996 = 100)Trade in goods Trade in servicesExports Imports Credit Debit
1996 2000 2001 2002 1996 2000 2001 2002 1996 2000 2001 2002 1996 2000 2001 2002Argentina 100.0 109.6 110.4 106.9 100.0 107.2 86.0 38.0 100.0 109.8 101.4 67.9 100.0 114.9 105.5 57.7Brazil 100.0 115.1 121.7 126.1 100.0 104.7 104.3 88.6 100.0 204.0 200.3 206.4 100.0 131.0 134.4 115.2Chile 100.0 115.5 111.1 110.3 100.0 96.6 92.7 89.4 100.0 113.7 114.4 110.4 100.0 131.7 140.0 137.0China 100.0 164.9 176.1 215.6 100.0 163.2 176.4 214.0 100.0 147.7 161.8 192.9 100.0 159.5 173.9 206.0Hong Kong n.a. n.a. n.a. n.a. n.a. n.a. n.a. n.a. n.a. n.a. n.a. n.a. n.a. n.a. n.a. n.a.Indonesia 100.0 130.3 114.3 117.1 100.0 91.2 78.4 80.6 100.0 79.0 83.3 99.6 100.0 99.2 104.9 113.1Japan 100.0 114.8 95.8 98.8 100.0 108.2 99.0 95.3 100.0 102.3 95.3 97.0 100.0 89.9 83.3 83.0Korea 100.0 135.4 116.4 125.1 100.0 109.8 95.1 102.4 100.0 130.4 124.1 120.2 100.0 112.9 111.1 120.3Malaysia 100.0 127.9 114.3 121.3 100.0 106.1 95.2 102.9 100.0 92.1 95.5 98.3 100.0 95.3 94.8 93.6Mexico 100.0 173.4 165.0 167.5 100.0 195.0 188.2 188.5 100.0 128.3 118.4 118.8 100.0 160.5 159.0 163.3Peru 100.0 118.3 119.2 130.1 100.0 94.1 92.4 94.6 100.0 113.4 106.8 109.2 100.0 110.1 112.5 119.5Philippines 100.0 181.5 152.1 167.4 100.0 105.0 100.3 106.6 100.0 30.7 24.3 23.6 100.0 67.9 55.1 45.8Singapore 100.0 108.0 96.1 99.1 100.0 103.0 88.5 88.6 100.0 95.6 94.8 97.5 100.0 121.9 121.7 123.5Taiwan 100.0 127.8 105.7 112.5 100.0 136.4 104.1 107.4 100.0 122.7 119.9 131.5 100.0 110.5 101.3 103.4Thailand 100.0 124.8 116.2 122.8 100.0 87.9 85.5 89.2 100.0 81.5 76.6 90.1 100.0 78.9 74.6 85.4United States 100.0 126.2 117.6 111.6 100.0 152.5 142.7 145.0 100.0 124.7 120.6 121.9 100.0 146.7 145.7 151.0
Foreign direct investment Trade in travel servicesAsset Liabilities Credit Debit
1996 2000 2001 2002 1996 2000 2001 2002 1996 2000 2001 2002 1996 2000 2001 2002Argentina 100.0 56.3 10.1 -40.2 100.0 149.9 31.2 11.1 100.0 110.8 100.8 58.6 100.0 123.5 108.6 64.9Brazil 100.0 483.4 100.0 292.7 200.5 147.9 100.0 252.1 241.0 278.3 100.0 88.8 72.9 54.6Chile 100.0 110.3 100.0 73.1 89.9 34.4 100.0 88.0 85.8 78.8 100.0 84.2 96.2 107.0China 100.0 43.3 325.6 119.1 100.0 95.6 110.1 122.7 100.0 159.1 174.4 199.9 100.0 293.1 310.9 344.2Hong Kong n.a. n.a. n.a. n.a. n.a. n.a. n.a. n.a. n.a. n.a. n.a. n.a. n.a. n.a. n.a. n.a.Indonesia 100.0 n.a. n.a. n.a. 100.0 100.0 80.4 85.3 85.5 100.0 133.3 142.0 140.4Japan 100.0 134.5 164.2 136.6 100.0 3 100.0 82.6 81.0 85.7 100.0 86.0 71.6 71.9Korea 100.0 107.0 51.8 57.3 100.0 399.1 151.7 84.8 100.0 140.1 130.8 108.5 100.0 95.3 101.8 121.2Malaysia n.a. n.a. n.a. n.a. 100.0 74.6 10.9 63.1 100.0 111.9 153.3 159.0 100.0 80.8 101.8 101.9Mexico n.a. n.a. n.a. n.a. 100.0 175.0 285.3 159.2 100.0 122.8 124.3 131.1 100.0 162.3 168.3 178.9Peru 100.0 n.a. n.a. 100.0 23.3 33.0 68.9 100.0 136.0 117.6 119.6 100.0 151.5 169.2 176.0Philippines 100.0 46.7 100.0 88.7 64.7 73.2 100.0 138.0 111.4 112.5 100.0 79.4 97.1 68.8Singapore 100.0 65.5 100.0 134.0 117.7 65.5 100.0 70.4 62.0 59.3 100.0 90.9 112.0 104.2Taiwan 100.0 174.4 142.6 127.1 100.0 264.4 220.4 77.5 100.0 102.8 109.7 116.3 100.0 99.4 89.8 85.4Thailan
-488.6 -531.5 307.1 44.2
-73.5 -52.9 -24.4 ,962.2 2,981.6 4,376.4
-437.4 -59.3 -87.9 97.2 153.2
d 100.0 36.9 11.4 100.0 144.1 163.5 38.5 100.0 82.3 77.8 86.9 100.0 64.7 68.2 77.1United States 100.0 130.6 150.0 100.0 371.3 175.2 45.8 100.0 119.8 108.8 104.2 100.0 135.3 126.7 122.8Source: IMF (2004) Balance of Payments Statistics (CD-ROM), Washington, D.C.: IMF.
-2.5 173.3

Comparing the trade volumes in 1996 and any year in the 2000’s, exports increased rapidly in
all countries in the table. If we look at annual trends, however, the growth is very low or slightly
negative in the 2000’s, except in such countries as Brazil and Peru, where exports continued to
grow after 2000. As for Japan, total exports in 2001 were about 95.8% of those in 1996. Some
attribute this to the gradual recovery of the Japanese economy after the long recession
beginning in 1997. No remarkable feature can be seen in import values either in Asia or in Latin
America, except for China and Mexico having experienced high growth in imports from 1996
through 2002.
The trends in services vary more widely across countries than those in goods. In many
countries and areas such as Brazil, Chile, China, Korea, Mexico, Peru, and Taiwan, trade in
services is higher in the 2000’s than in 1996, while only China experienced significant growth
from 2000 on. If we focus on travel services, Brazil’s large growth in credits is noteworthy:
credits in 2002 were 2.7 times as much as those in 1996.
Trends in FDI also widely vary across countries, both in terms of value and growth rate. By
value, Asian countries generally are larger investors than Latin American countries. Above all,
Japanese outward FDI is particularly large, although it is not growing fast. China in Asia and
Brazil and Mexico in Latin America receive a great amount of FDI each year as host countries.
We will analyze the factors behind the larger investment in these countries in Section 2-1-(3).
If we look at overall trends, China’s growth as seen in all three trade indicators is outstanding.
The annual average growth rate of trade in goods and services is approximately 11.6 percent in
China. Another noteworthy figure in Asia is that of Japanese inward FDI. Although there has
been no remarkable growth since 2000, the level of inflows (liabilities) in the 2000’s has been
far higher than in the 1990’s; the inward FDI in 2002 was 44 times as much as that in 1996.
There are also several features to note concerning Latin American countries. First, Mexico
gives an impression of being an all-rounder. Both in the level and the growth rate of these
indicators, Mexico shows greater performance than other Latin American countries. Although
Brazil and Chile show similarly steady growth in trade, there is a stark difference between these
two countries in that Brazil receives a large amount of FDI every year, while Chile does not.

(2) Trade
Major Trading Partners for Selected East Asian and Latin American Countries
Tables 2-1-4 through 2-1-10 present summaries of the trading partners for seven countries in
East Asia and Latin America, each table describing several indicators, including the exports,
imports, and FDI in/outflows of individual countries. In this section, our discussion will focus on
the trade data in the first and the second rows of each table.
First, if we look at the trade partners of the four East Asian countries, the US is included in the
top five exporting and importing partners of all four Asian countries, and Hong Kong has been
one of the major exporting partners of these countries since 2000. China, Japan, and Korea are
among each other’s top five major partners, both in exports and imports since the 1990’s. It is
particularly noteworthy that China’s share has been consistently increasing, both as an
exporting and importing partner of Japan and Korea, being the largest export destination for
Korea, and the second largest for Japan by 2002. Another feature seen in the Asian countries
is that Japan is the largest importing partner of all the other Asian countries.
Compared to the other three countries, Thailand has a slightly different set of trade partners.
Singapore has ranked among Thailand’s top five exporting partners, and Singapore and
Malaysia among its major importing partners, since the 1990’s.
Looking at the patterns of Asian countries by region, non-Asian countries other than the US,
such as Australia, Germany, and Saudi Arabia have become major trade partners since 2000,
although their shares are only less or around 5 percent. No Latin American countries are listed
in the top five trading partners of these four Asian countries.
Now if we switch our focus to the trade partners of Latin American countries, the patterns seem
to vary more widely than in Asia, partly being affected by their history and regional cooperation
frameworks. Mexico’s trade pattern, for example, shows the clear effect of NAFTA and the
legacy of its historical ties to Spain, and Brazil’s and Argentina’s patterns represent their
economic ties as also symbolized in MERCOSUL (MERCOSUR). For all these Latin American
countries, the US is the largest or at least the second largest trade partner, and among Asian
countries, China and Japan appear in the top five partners.
The US, Argentina, Germany, and the Netherlands have continually been among the major
exporting partners of Brazil since 1995. In addition to these four countries, Japan had been
among the top five until China entered the top five in 2002, replacing Japan. Brazil’s top five

importing partners have been the US, Argentina, Germany, Japan, and Italy, a lineup
unchanged since the 1990’s. The country’s economic ties with Japan, Germany, and Italy are
oftentimes attributed to the large Japanese, German, and Italian immigrant communities in
Brazil.
Japan and the US have been Chile’s two largest exporting partners since the early 1990’s.
Recently, China has been expanding its presence and was Chile’s third largest export
destination in 2003. Mexico became a larger exporter to Latin American countries than Brazil in
2002. Another notable feature is that Korea became one of the top five exporting partners in
2003, and this could be interpreted as a pre-effect of the Chile-Korea FTA that came into force
in 2004. As a result, the three largest economic powers in Asia, i.e., China, Japan, and Korea,
came to be included in Chile’s top five export destinations in 2003. The set of the five major
countries constituting Chile’s key importing partners and their rankings -- Argentina, the US,
Brazil, China, and Germany, in descending order – have remained unchanged. Japan was in
the top five until 2000; however, its presence declined as that of China expanded, putting China
among Chile’s top five importing partners in 2001.
The set of Mexico’s largest trade partners shows the substantial effect of NAFTA, with its largest
partner, the US, accounting for a remarkable 80 to 90 percent share in exports and a 60 to 80
percent share in imports since the 1990’s. No other country’s trade pattern shows such a large
share occupied by a single country. Since 2000, the top four exporting partners have been the
US, Canada, Germany, Spain. Japan and the Netherlands have appeared in the fifth rank,
although the shares of these two countries have been less than 1 percent. The US, Japan, and
Germany, in order of share, have been among the top five importing partners since the 1990’s.
Worthy of note is the rapid increase in China’s presence. In 2003, China became Mexico’s
second largest importing partner, achieving a 5 percent share second only to the US’ 61.8
percent.
Although it is difficult to draw general conclusions, Latin American countries seem to be more
dependent on Asia for trade than vice versa. Other points that stands out from the above
observations are the US’ continuing large presence in both regions, and the clear rise of China.

Table 2-1-4. Major Trading and FDI Partners: China(Millions of US Dollars and Percent)
1990 1995 2000 2001 2002 2003Country Value Share Country Value Share Country Value Share Country Value Share Country Value Share Country Value Share
Exports World 62,760 100.0 World 148,955 100.0 World 249,195 100.0 World 266,698 100.0 World 325,711 100.0 World 438,250 100.01 Hong Kong 27,163 43.3 Hong Kong 36,004 24.2 United States 52,162 20.9 United States 54,395 20.4 United States 70,064 21.5 United States 92,633 21.12 Japan 9,210 14.7 Japan 28,466 19.1 Hong Kong 44,520 17.9 Hong Kong 46,503 17.4 Hong Kong 58,483 18.0 Hong Kong 76,289 17.43 United States 5,314 8.5 United States 24,744 16.6 Japan 41,654 16.7 Japan 45,078 16.9 Japan 48,483 14.9 Japan 59,423 13.64 Germany 2,062 3.3 Korea 6,688 4.5 Korea 11,293 4.5 Korea 12,544 4.7 Korea 15,508 4.8 Korea 20,096 4.65 U.S.S.R. 2,048 3.3 Germany 5,672 3.8 Germany 9,278 3.7 Germany 9,759 3.7 Germany 11,382 3.5 Germany 17,536 4.0
Imports World 53,809 100.0 World 132,163 100.0 World 224,942 100.0 World 243,567 100.0 World 295,440 100.0 World 412,836 100.01 Hong Kong 14,565 27.1 Japan 29,007 21.9 Japan 40,083 17.8 Japan 42,810 17.6 Japan 53,489 18.1 Japan 74,151 18.02 Japan 7,656 14.2 United States 16,123 12.2 Taiwan 25,494 11.3 Taiwan 27,339 11.2 Taiwan 38,061 12.9 Taiwan 49,362 12.03 United States 6,591 12.2 Taiwan 14,784 11.2 Korea 22,452 10.0 United States 26,221 10.8 Korea 28,581 9.7 Korea 43,135 10.44 Germany 2,980 5.5 Korea 10,288 7.8 United States 21,663 9.6 Korea 23,396 9.6 United States 27,251 9.2 United States 33,939 8.25 U.S.S.R. 2,213 4.1 Hong Kong 8,599 6.5 Hong Kong 21,617 9.6 Germany 13,695 5.6 Germany 16,434 5.6 Germany 24,341 5.9
Outward FDI World 55,097 100.0 World 70,754 100.0 World 98,268 100.01 Myanmar 3,287 6.0 Hong Kong 20,067 28.4 Hong Kong 35,560 36.22 Laos 2,440 4.4 United States 5,370 7.6 United States 15,153 15.43 United States 2,314 4.2 Brazil 3,179 4.5 Korea 8,344 8.54 Brazil 2,109 3.8 Vietnam 2,679 3.8 Australia 4,857 4.95 Vietnam 1,761 3.2 Russia 1,240 1.8 Russia 3,545 3.6
Inward FDI World 82,768 100.0 World 115,070 100.01 Hong Kong 383 Hong Kong 40,996 Hong Kong 16,961 Hong Kong 20,685 Hong Kong 25,202 30.4 Hong Kong 40,708 35.42 Taiwan 88 Singapore 8,666 United States 8,000 Virgin Islands 8,771 Virgin Islands 12,650 15.3 Virgin Islands 12,664 11.03 Japan 46 Japan 7,592 Virgin Islands 7,521 United States 7,514 United States 9,156 11.1 United States 10,161 8.84 United States 36 United States 7,471 Taiwan 4,041 Taiwan 6,914 Taiwan 6,741 8.1 Korea 9,177 8.05 Singapore 10 Taiwan 5,849 Japan 3,681 Japan 5,419 Japan 5,298 6.4 Taiwan 8,558 7.4
Outward FDI (slected countries)China China China China China ChinaJapan Japan 130 Japan 26 Japan 167 Japan 1,816 JapanKorea Korea 159 Korea 423 Korea 81 Korea 8,344 KoreaThailand Thailand Thailand Thailand Thailand ThailandBrazil Brazil 20 Brazil 2,109 Brazil 3,179 Brazil 930 BrazilChile Chile 98 Chile Chile Chile ChileMexico Mexico 25 Mexico 1,978 Mexico 23 Mexico 200 Mexico
Inward FDI (selected countries)China China China China China ChinaJapan 46 Japan 7,592 Japan 3,681 Japan 5,419 Japan 5,298 JapanKorea Korea Korea Korea Korea Korea 9,177Thailand Thailand Thailand Thailand Thailand ThailandBrazil Brazil 452 Brazil 425 Brazil n.a. Brazil n.a. Brazil n.a.Chile Chile 597 Chile 18 Chile n.a. Chile n.a. Chile n.a.Mexico Mexico 168 Mexico 118 Mexico n.a. Mexico n.a. Mexico n.a.
Sources: Exports and Imports are obtained from IMF (2004). Inward and outward FDI and trade data for Taiwan are from JETRO (various years).

Table 2-1-5. Major Trading and FDI Partners: Japan(Millions of US Dollars and Percent)
1990 1995 2000 2001 2002 2003Country Value Share Country Value Share Country Value Share Country Value Share Country Value Share Country Value Share
Exports World 287,678 100.0 World 443,047 100.0 World 478,179 100.0 World 403,383 100.0 World 416,632 100.0 World 473,911 100.01 United States 91,121 31.7 United States 122,034 27.5 United States 144,009 30.1 United States 122,701 30.4 United States 120,798 29.0 United States 117,384 24.82 Germany 17,926 6.2 Korea 31,292 7.1 Taiwan 36,054 7.5 China 30,948 7.7 China 39,958 9.6 China 57,480 12.13 Korea 17,500 6.1 Taiwan 28,969 6.5 Korea 30,703 6.4 Korea 25,292 6.3 Taiwan 26,202 6.3 Korea 34,823 7.34 Taiwan 15,430 5.4 Hong Kong 27,780 6.3 China 30,356 6.3 Taiwan 24,337 6.0 Korea 25,292 6.1 Taiwan 31,174 6.65 Hong Kong 13,106 4.6 Singapore 23,006 5.2 Hong Kong 27,187 5.7 Hong Kong 23,352 5.8 Hong Kong 23,252 5.6 Hong Kong 29,918 6.3
Imports World 253,307 100.0 World 336,027 100.0 World 379,530 100.0 World 349,056 100.0 World 337,149 100.0 World 383,025 100.01 United States 52,842 20.9 United States 75,880 22.6 United States 72,514 19.1 United States 63,713 18.3 China 61,792 18.3 China 75,559 19.72 Indonesia 12,774 5.0 China 35,922 10.7 China 55,156 14.5 China 57,780 16.6 United States 58,589 17.4 United States 59,892 15.63 Australia 12,359 4.9 Korea 17,330 5.2 Korea 20,454 5.4 Korea 17,221 4.9 Korea 15,498 4.6 Korea 17,931 4.74 China 12,057 4.8 Australia 14,514 4.3 Taiwan 17,967 4.7 Indonesia 14,883 4.3 Indonesia 14,174 4.2 Indonesia 16,353 4.35 Korea 11,734 4.6 Taiwan 14,366 4.3 Indonesia 16,371 4.3 Australia 14,385 4.1 Australia 13,986 4.1 Australia 15,005 3.9
Outward FDI 56,852 100.0 World 51,101.0 100.0 World 49,030 100.0 World 32,292 100.0 World 36,861 100.0 World 36,092 100.01 United States 26,128 46.0 United States 22,193 43.4 United Kingdom 19,176 39.1 United States 6,461 20.0 United States 8,215 22.3 United States 10,577 29.32 United Kingdom 6,806 12.0 China 4,473 8.8 United States 12,349 25.2 Cayman Islands 4,996 15.5 United Kingdom 4,412 12.0 Netherlands 6,869 19.03 Australia 3,669 6.5 United Kingdom 3,445 6.7 Netherlands 2,764 5.6 Netherlands 4,521 14.0 Cayman Islands 4,036 10.9 China 3,143 8.74 Netherlands 2,744 4.8 Australia 2,635 5.2 Cayman Islands 2,736 5.6 United Kingdom 3,968 12.3 France 3,574 9.7 Cayman Islands 2,123 5.95 Hong Kong 1,785 3.1 Panama 1,660 3.2 Panama 1,325 2.7 China 1,453 4.5 Netherlands 3,295 8.9 United Kingdom 1,785 4.9
Inward FDI 2,788 100.0 World 3,811 100.0 World 28,274 100.0 World 17,402 100.0 World 17,937 100.0 World 18,722 100.01 Netherlands 734 26.3 United States 1,837 48.2 Japan 10,326 36.5 Netherlands 6,575 37.8 United States 4,876 27.2 Japan 3,181 17.02 United States 664 23.8 Netherlands 555 14.6 United States 9,141 32.3 United States 5,139 29.5 Japan 4,462 24.9 United States 3,090 16.53 Japan 350 12.6 Japan 241 6.3 Germany 2,530 8.9 Japan 2,108 12.1 Netherlands 3,221 18.0 Netherlands 2,800 15.04 Germany 259 9.3 Germany 174 4.6 Switzerland 1,966 7.0 United Kingdom 1,164 6.7 Cayman Islands 1,671 9.3 Cayman Islands 2,586 13.85 Canada, Switzerland 142 5.1 United Kingdom 118 3.1 Cayman Islands 1,193 4.2 Canada 394 2.3 Germany 980 5.5 Bermuda 1,431 7.6
Outward FDI (slected countries)China 348 China 4,473 China 1,008 China 1,453 China 1,766 China 3,143Japan Japan Japan Japan Japan JapanKorea 285 Korea 446 Korea 816 Korea 563 Korea 626 Korea 284Thailand 1,154 Thailand 1,233 Thailand 932 Thailand 884 Thailand 504 Thailand 629Brazil 607 Brazil 296 Brazil 236 Brazil 1,373 Brazil 406 Brazil 1,551Chile 29 Chile 140 Chile 28 Chile 52 Chile 6 Chile 4Mexico 169 Mexico 208 Mexico 208 Mexico 46 Mexico 85 Mexico 140
Inward FDI (selected countries)China 3 China 12 China 5 China 3 China 3 China 3Japan 350 Japan 241 Japan 10,326 Japan 2,108 Japan 4,462 Japan 3,181Korea 8 Korea 95 Korea 48 Korea 24 Korea 25 Korea 34Thailand 1 Thailand Thailand 0 Thailand 1 Thailand ThailandBrazil 5 Brazil 0 Brazil Brazil Brazil BrazilChile 0 Chile 0 Chile Chile Chile 0 ChileMexico Mexico Mexico Mexico Mexico Mexico
Notes: investment by the foreign affiliates located in Japan.and outward FDI are notification basis.Sources: Exports and Imports are obtained from IMF (2004). Inward and outward FDI and trade data for Taiwan are from JETRO (various years).
Chile 1 Chile 0 Chile 0 ChileMexico Mexico Mexico 38 Mexico 7 Mexico 43 Mexico 7
Inward FDI (selected countries)China China China China China 249 China 50Japan 236 Japan 418 Japan 2,448 Japan 772 Japan 1,403 Japan 541Korea Korea Korea Korea Korea KoreaThailand Thailand Thailand Thailand Thailand ThailandBrazil Brazil 4 Brazil 0 Brazil 0 Brazil BrazilChile Chile Chile Chile Chile ChileMexico Mexico Mexico Mexico 0 Mexico Mexico
Notes: slected countries) in 1995 indicate net values.
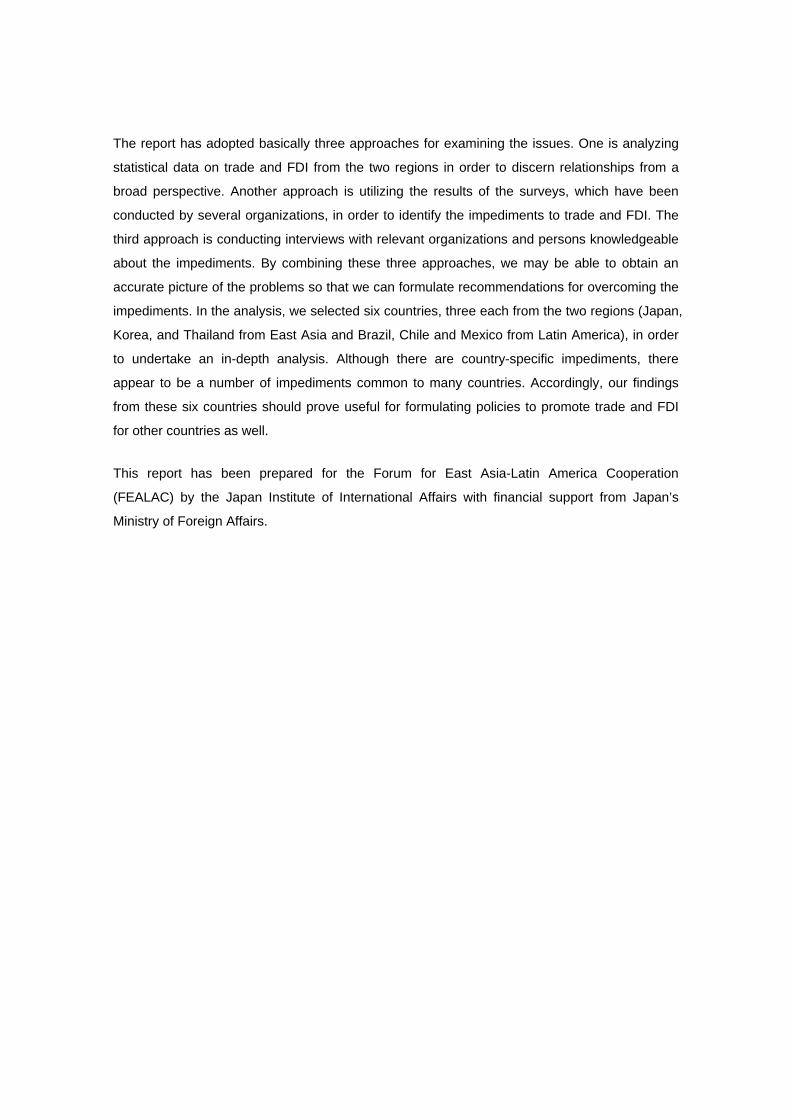
Table 2-1-6. Major Trading and FDI Partners: Korea(Millions of US Dollars and Percent)
1990 1995 2000 2001 2002 2003Country Value Share Country Value Share Country Value Share Country Value Share Country Value Share Country Value Share
Exports World 67,812 100.0 World 131,312 100.0 World 171,826 100.0 World 149,836 100.0 World 161,480 100.0 World 192,750 100.01 United States 19,420 28.6 United States 24,344 18.5 United States 37,806 22.0 United States 31,358 20.9 United States 32,943 20.4 China 35,110 18.22 Japan 12,638 18.6 Japan 17,048 13.0 Japan 20,466 11.9 China 18,190 12.1 China 23,754 14.7 United States 34,369 17.83 Hong Kong 3,780 5.6 Hong Kong 10,682 8.1 China 18,455 10.7 Japan 16,506 11.0 Japan 15,143 9.4 Japan 17,276 9.04 Singapore 1,805 2.7 China 9,144 7.0 Hong Kong 10,708 6.2 Hong Kong 9,452 6.3 Hong Kong 10,146 6.3 Hong Kong 14,654 7.65 United Kingdom 1,751 2.6 Singapore 6,689 5.1 Singapore 5,648 3.3 Germany 4,322 2.9 Taiwan 6,632 4.1 Taiwan 7,045 3.7
Imports World 74,405 100.0 World 135,110 100.0 World 160,479 100.0 World 141,096 100.0 World 152,123 100.0 World 178,824 100.01 Japan 18,574 25.0 Japan 32,606 24.1 Japan 31,828 19.8 Japan 26,633 18.9 Japan 29,856 19.6 Japan 36,313 20.32 United States 16,946 22.8 United States 30,420 22.5 United States 29,286 18.2 United States 22,431 15.9 United States 23,111 15.2 United States 24,935 13.93 Germany 3,283 4.4 China 7,402 5.5 China 12,799 8.0 China 13,303 9.4 China 17,400 11.4 China 21,909 12.34 Australia 2,590 3.5 Germany 6,584 4.9 Saudi Arabia 9,641 6.0 Saudi Arabia 8,058 5.7 Saudi Arabia 7,551 5.0 Saudi Arabia 9,268 5.25 Indonesia 1,601 2.2 Saudi Arabia 5,432 4.0 Australia 5,959 3.7 Australia 5,534 3.9 Australia 5,973 3.9 Germany 6,822 3.8
Outward FDI1 China 814 United States 1,144 Netherlands 1,569 China 896 China 1,3432 United States 534 China 659 United States 1,412 United States 545 United States 1,0093 ASEAN 415 Hong Kong 283 China 547 Netherlands 193 Singapore 2344 Indonesia 200 Singapore 208 United Kingdom 320 Hong Kong 162 Vietnam 1365 Vietnam 178 Japan 139 Indonesia 169 Vietnam 135 United Kingdom 94
Inward FDI1 United States 317 United States 645 United States 2,916 United States 3,890 United States 4,500 Belgium 1,3462 Japan 236 Japan 418 Japan 2,448 Canada 1,506 Japan 1,403 United States 1,2403 Germany 62 Netherlands 170 Germany 1,599 Netherlands 1,245 Netherlands 451 United Kingdom 8714 United Kingdom 46 United Kingdom 87 Malaysia 1,408 Malaysia 785 Germany 284 Japan 5415 Netherlands 36 Singapore 65 Bermuda 1,385 Japan 772 Canada 261 Malaysia 417
Outward FDI (slected countries)China China 814 China 659 China 547 China 896 China 1,343Japan Japan 111 Japan 139 Japan 101 Japan 75 Japan 50Korea Korea Korea Korea Korea KoreaThailand Thailand Thailand Thailand Thailand 31 Thailand 27Brazil Brazil 17 Brazil 5 Brazil 41 Brazil 14 BrazilChile Chile (13)
29
DI: BOP basis for 1996-2000 and the the notification basis after 2001.Sources: Exports and Imports are obtained from IMF (2004). Inward and outward FDI and trade data for Taiwan are from JETRO (various years).

Table 2-1-7. Major Trading and FDI Partners: Thailand(Millions of US Dollars and Percent)
1990 1995 2000 2001 2002 2003Country Value Share Country Value Share Country Value Share Country Value Share Country Value Share Country Value Share
Exports World 23,072 100.0 World 57,201 100.0 World 68,962 100.0 World 65,112 100.0 World 68,851 100.0 World 80,330 100.01 United States 5,240 22.7 United States 10,078 17.6 United States 14,706 21.3 United States 13,246 20.3 United States 13,522 19.6 United States 13,669 17.02 Japan 3,969 17.2 Japan 9,477 16.6 Japan 10,164 14.7 Japan 9,964 15.3 Japan 10,001 14.5 Japan 11,403 14.23 Singapore 1,696 7.4 Singapore 7,917 13.8 Singapore 5,997 8.7 Singapore 5,287 8.1 Singapore 5,554 8.1 Singapore 5,873 7.34 Germany 1,198 5.2 Hong Kong 2,921 5.1 Hong Kong 3,474 5.0 Hong Kong 3,298 5.1 Hong Kong 3,699 5.4 China 5,707 7.1
5 Netherlands 1,115 4.8 Netherlands 1,801 3.1 China 2,806 4.1 China 2,863 4.4 China 3,553 5.2 Hong Kong 4,331 5.4Imports World 33,408 100.0 World 73,692 100.0 World 61,924 100.0 World 62,957 100.0 World 64,721 100.0 World 75,805 100.0
1 Japan 10,144 30.4 Japan 21,625 29.3 Japan 15,315 24.7 Japan 13,881 22.0 Japan 14,902 23.0 Japan 18,267 24.12 United States 3,600 10.8 United States 8,507 11.5 United States 7,291 11.8 United States 7,198 11.4 United States 6,197 9.6 United States 7,185 9.53 Singapore 2,480 7.4 Singapore 4,162 5.6 Singapore 3,416 5.5 China 3,711 5.9 China 4,928 7.6 China 6,067 8.04 Germany 1,702 5.1 Germany 3,748 5.1 China 3,377 5.5 Malaysia 3,078 4.9 Malaysia 3,640 5.6 Malaysia 4,536 6.05 Malaysia 1,125 3.4 Malaysia 3,235 4.4 Malaysia 3,344 5.4 Singapore 2,854 4.5 Singapore 2,904 4.5 Singapore 3,269 4.3
Outward FDI12345
Inward FDI (Millions of Thai Bhat)1 Japan 69,231 Japan 196,613 Japan 107,382 Japan 83,962 Japan 38,398 Japan 97,5972 Europe 37,098 United States 64,335 United States 37,752 United States 40,131 Singapore 13,103 United States 24,5743 United States 27,913 Taiwan 45,098 Singapore 19,910 Singapore 27,895 Taiwan 11,237 United Kingdom 20,5134 Hong Kong 27,412 Korea 42,467 Taiwan 17,632 Taiwan 13,719 United States 11,113 Taiwan 13,5535 United Kingdom 19,567 Singapore 38,055 Germany 10,166 India 9,710 Switzerland 3,727 Singapore 6,730
Outward FDI (slected countries)China China China China China ChinaJapan Japan Japan Japan Japan JapanKorea Korea Korea Korea Korea KoreaThailand Thailand Thailand Thailand Thailand ThailandBrazil Brazil Brazil Brazil Brazil BrazilChile Chile Chile Chile Chile ChileMexico Mexico Mexico Mexico Mexico Mexico
Inward FDI (selected countries, Millions of Thai Baht)China China 723 China 367 China 8,690 China 379 ChinaJapan 69,231 Japan 196,613 Japan 107,382 Japan 83,962 Japan 38,398 Japan 97,597Korea Korea 42,467 Korea 1,394 Korea 1,437 Korea 3,213 KoreaThailand Thailand Thailand Thailand Thailand ThailandBrazil Brazil Brazil Brazil Brazil BrazilChile Chile Chile Chile Chile ChileMexico Mexico Mexico Mexico Mexico Mexico
Sources: Exports and Imports are obtained from IMF (2004). Inward and outward FDI and trade data for Taiwan are from JETRO (various years).

Table 2-1-8. Major Trading and FDI Partners: Brazil(Millions of US Dollars and Percent)
1990 1995 2000 2001 2002 2003Country Value Share Country Value Share Country Value Share Country Value Share Country Value Share Country Value Share
Exports World 31,414 100.0 World 46,605 100.0 World 59,642 100.0 World 63,510 100.0 World 64,132 100.0 World 78,462 100.01 United States 7,734 24.6 United States 8,799 18.9 United States 13,381 22.4 United States 15,597 24.6 United States 16,798 26.2 United States 18,075 23.02 Netherlands 2,494 7.9 Argentina 4,041 8.7 Argentina 6,233 10.5 Argentina 5,402 8.5 Netherlands 3,389 5.3 Argentina 4,789 6.13 Japan 2,349 7.5 Japan 3,102 6.7 Netherlands 2,796 4.7 Netherlands 3,082 4.9 Germany 2,665 4.2 China 4,729 6.04 Germany 1,844 5.9 Netherlands 2,918 6.3 Germany 2,526 4.2 Germany 2,673 4.2 China 2,617 4.1 Netherlands 4,555 5.85 Italy 1,615 5.1 Germany 2,158 4.6 Japan 2,472 4.1 Japan 2,180 3.4 Argentina 2,484 3.9 Germany 3,317 4.2
Imports World 24,977 100.0 World 54,363 100.0 World 61,875 100.0 World 61,412 100.0 World 51,956 100.0 World 57,316 100.01 United States 4,956 19.8 United States 11,499 21.2 United States 14,303 23.1 United States 14,342 23.4 United States 11,482 22.1 United States 11,474 20.02 Germany 2,229 8.9 Argentina 6,127 11.3 Argentina 7,528 12.2 Argentina 6,828 11.1 Argentina 5,222 10.1 Argentina 5,610 9.83 Saudi Arabia 1,816 7.3 Germany 5,192 9.6 Germany 4,863 7.9 Germany 5,293 8.6 Germany 4,838 9.3 Germany 4,974 8.74 Japan 1,773 7.1 Japan 3,607 6.6 Japan 3,255 5.3 Japan 3,370 5.5 Japan 2,582 5.0 Japan 2,994 5.25 Argentina 1,666 6.7 Italy 3,144 5.8 Italy 2,387 3.9 Italy 2,404 3.9 Italy 1,938 3.7 China 2,515 4.4
Outward FDI12345
Inward FDI1 United States 10,488 United States 18,983 Spain 9,593 United States 45,408 Netherlands 3,372 United States 2,3832 Germany 5,615 Germany 7,054 United States 5,398 Spain 2,776 United States 2,614 Cayman Islands 1,9093 Japan 3,440 United Kingdom 5,216 Portugal 2,515 France 1,908 France 1,815 Netherlands 1,4444 Switzerland 3,222 Japan 4,475 Netherlands 2,228 Netherlands 1,897 Cayman Islands 1,555 Japan 1,3685 United Kingdom 2,708 Switzerland 3,637 Cayman Islands 2,035 Cayman Islands 1,752 Bermuda 1,469 France 825
Outward FDI (slected countries)China China China China China ChinaJapan Japan Japan Japan Japan JapanKorea Korea Korea Korea Korea KoreaThailand Thailand Thailand Thailand Thailand ThailandBrazil Brazil Brazil Brazil Brazil BrazilChile Chile Chile Chile Chile ChileMexico Mexico Mexico Mexico Mexico Mexico
Inward FDI (selected countries)China China China China China ChinaJapan 3,440 Japan 4,475 Japan 385 Japan 827 Japan 504 Japan 1,368Korea Korea Korea 25 Korea 25 Korea 4 KoreaThailand Thailand Thailand Thailand Thailand ThailandBrazil Brazil Brazil Brazil Brazil BrazilChile Chile Chile Chile Chile 47 ChileMexico Mexico Mexico Mexico 61 Mexico 24 Mexico
Note: d 1995 are stocks (not flows).Sources: Exports and Imports are obtained from IMF (2004). Inward and outward FDI and trade data for Taiwan are from JETRO (various years).

Table 2-1-9. Major Trading and FDI Partners: Chile(Millions of US Dollars and Percent)
1990 1995 2000 2001 2002 2003Country Value Share Country Value Share Country Value Share Country Value Share Country Value Share Country Value Share
Exports World 8,631 100.0 World 16,538 100.0 World 19,295 100.0 World 18,554 100.0 World 18,285 100.0 World 21,464 100.01 United States 1,489 17.3 Japan 2,906 17.6 United States 3,243 16.8 United States 3,428 18.5 United States 3,484 19.1 United States 3,468 16.22 Japan 1,388 16.1 United States 2,398 14.5 Japan 2,547 13.2 Japan 2,547 13.7 Japan 1,928 10.5 Japan 2,247 10.53 United Kingdom 1,076 12.5 United Kingdom 1,076 6.5 United Kingdom 1,073 5.6 United Kingdom 1,232 6.6 China 1,233 6.7 China 1,847 8.64 Brazil 1,057 12.2 Brazil 1,057 6.4 Brazil 953 4.9 China 1,015 5.5 Mexico 909 5.0 Korea 1,014 4.75 Germany 984 11.4 Korea 897 5.4 China 906 4.7 Brazil 835 4.5 Italy 857 4.7 Mexico 921 4.3
Imports World 7,227 100.0 World 15,479 100.0 World 18,535 100.0 World 17,830 100.0 World 17,014 100.0 World 19,413 100.01 United States 1,373 19.0 United States 3,793 24.5 United States 3,297 17.8 Argentina 3,057 17.1 Argentina 3,059 18.0 Argentina 3,768 19.42 Japan 568 7.9 Argentina 1,385 8.9 Argentina 2,869 15.5 United States 2,867 16.1 United States 2,528 14.9 United States 2,525 13.03 Brazil 564 7.8 Brazil 1,195 7.7 Brazil 1,332 7.2 Brazil 1,492 8.4 Brazil 1,615 9.5 Brazil 2,022 10.44 Germany 523 7.2 Japan 1,013 6.5 China 950 5.1 China 1,014 5.7 China 1,102 6.5 China 1,289 6.65 Argentina 503 7.0 Germany 790 5.1 Japan 706 3.8 Germany 689 3.9 Germany 736 4.3 Germany 711 3.7
Outward FDI 3,587 100.0 3,435 100.0 7,051 100.01 United States 1,702 47.4 United States 2,743 79.9 United States 5,828 82.72 Cayman Islands 1,039 29.0 United Kingdom 175 5.1 Cayman Islands 803 11.43 United Kingdom 391 10.9 Argentina 107 3.1 United Kingdom 96 1.44 Brazil 119 3.3 Netherlands 89 2.6 Ireland 61 0.95 Venezuela 94 2.6 Cayman Islands 65 1.9 Mexico 58 0.8
Inward FDI 4,782 100.0 3,375 100.0 1,276 100.01 Canada 492 Canada 2,012 United States 751 United States 1,759 36.8 United Kingdom 1,504 44.6 United States 480 37.62 United States 229 South Africa 1,500 Spain 723 Italy 920 19.2 United States 594 17.6 Canada 187 14.63 United Kingdom 227 Cayman Islands 353 Canada 713 Australia 430 9.0 Canada 506 15.0 United Kingdom 130 10.24 Finland 255 United Kingdom 180 Spain 393 8.2 Other 289 8.6 Spain 122 9.65 Austria 225 Sweden 116 United Kingdom 382 8.0 Spain 248 7.3 International Organiz 64 5.0
Outward FDI (slected countries)China China China China 0 China 0 China (4)
(18)
Japan Japan Japan Japan Japan JapanKorea Korea Korea Korea Korea KoreaThailand Thailand Thailand Thailand Thailand ThailandBrazil Brazil Brazil Brazil 119 Brazil Brazil 28Chile Chile Chile Chile Chile ChileMexico Mexico Mexico Mexico 32 Mexico 16 Mexico 58
Inward FDI (selected countries)China China 26 China China China ChinaJapan Japan 0 Japan 56 Japan 126 Japan 54 Japan 29Korea Korea Korea 0 Korea 0 Korea 0 KoreaThailand Thailand 24 Thailand Thailand Thailand ThailandBrazil Brazil Brazil 5 Brazil 17 Brazil 9 BrazilChile Chile 1 Chile Chile Chile ChileMexico Mexico Mexico 4 Mexico 14 Mexico 3 Mexico
Sources: Exports and Imports are obtained from IMF (2004). Inward and outward FDI and trade data for Taiwan are from JETRO (various years).

China 6Japan 121 Japan Japan 415 Japan 177 Japan 1 Japan 104Korea Korea Korea Korea 44 Korea 31 Korea 38Thailand Thailand Thailand Thailand Thailand ThailandBrazil Brazil Brazil Brazil Brazil BrazilChile Chile Chile Chile 4 Chile 30 Chile 4Mexico Mexico Mexico Mexico Mexico Mexico
Sources: Exports and Imports are obtained from IMF (2004). Inward and outward FDI and trade data for Taiwan are from JETRO (various years).
Table 2-1-10. Major Trading and FDI Partners: Mexico(Millions of US Dollars and Percent)
1990 1995 2000 2001 2002 2003Country Value Share Country Value Share Country Value Share Country Value Share Country Value Share Country Value Share
Exports World 27,167 100.0 World 79,541 100.0 World 166,455 100.0 World 158,443 100.0 World 160,763 100.0 World 164,922 100.01 United States 18,837 69.3 United States 66,475 83.6 United States 147,686 88.7 United States 140,296 88.5 United States 143,048 89.0 United States 144,466 87.62 Japan 1,502 5.5 Canada 1,979 2.5 Canada 3,353 2.0 Canada 3,070 1.9 Canada 2,806 1.7 Canada 3,022 1.83 Spain 1,445 5.3 Japan 928 1.2 Germany 1,544 0.9 Germany 1,504 0.9 Spain 1,431 0.9 Germany 1,991 1.24 France 549 2.0 Brazil 800 1.0 Spain 1,520 0.9 Spain 1,254 0.8 Germany 1,236 0.8 Spain 1,468 0.95 Germany 341 1.3 Spain 779 1.0 Japan 931 0.6 Netherlands Antilles 824 0.5 Netherlands Antilles 633 0.4 Japan 1,173 0.7
Imports World 33,016 100.0 World 79,697 100.0 World 191,904 100.0 World 185,236 100.0 World 185,547 100.0 World 187,600 100.01 United States 21,830 66.1 United States 59,394 74.5 United States 140,288 73.1 United States 125,143 67.6 United States 117,212 63.2 United States 115,897 61.82 Germany 1,835 5.6 Japan 3,969 5.0 Japan 7,112 3.7 Japan 8,894 4.8 Japan 10,283 5.5 China 10,341 5.53 Japan 1,411 4.3 Germany 2,956 3.7 Germany 6,334 3.3 Germany 6,688 3.6 China 6,902 3.7 Japan 8,355 4.54 France 788 2.4 Canada 1,512 1.9 Canada 4,418 2.3 Canada 4,658 2.5 Germany 6,672 3.6 Germany 6,840 3.65 United Kingdom 649 2.0 France 1,081 1.4 Korea 4,240 2.2 China 4,430 2.4 Canada 4,928 2.7 Korea 4,551 2.4
Outward FDI12345
Inward FDI1 United States 2,308 United States 4,912 United States 10,852 United States 19,115 United States 8,227 United States 5,1012 Germany 288 Netherlands 712 Netherlands 2,233 Netherlands 2,251 Netherlands 1,155 Spain 1,3813 Netherlands 126 Germany 546 Spain 1,726 Canada 803 United Kingdom 1,144 United Kingdom 8534 Japan 121 United Kingdom 207 Canada 558 Spain 156 Germany 583 Netherlands 4705 United Kingdom 114 Switzerland 200 Japan 415 Japan 151 Switzerland 422 Switzerland 318
Outward FDI (slected countries)China China China China China ChinaJapan Japan 111 Japan 357 Japan 101 Japan 53 JapanKorea Korea 44 Korea 0 Korea 26 Korea 19 KoreaThailand Thailand Thailand Thailand Thailand ThailandBrazil Brazil Brazil Brazil Brazil BrazilChile Chile 8 Chile 4 Chile 4 Chile 30 ChileMexico Mexico Mexico Mexico Mexico Mexico
Inward FDI (selected countries)China China China China 1 China (3)
50
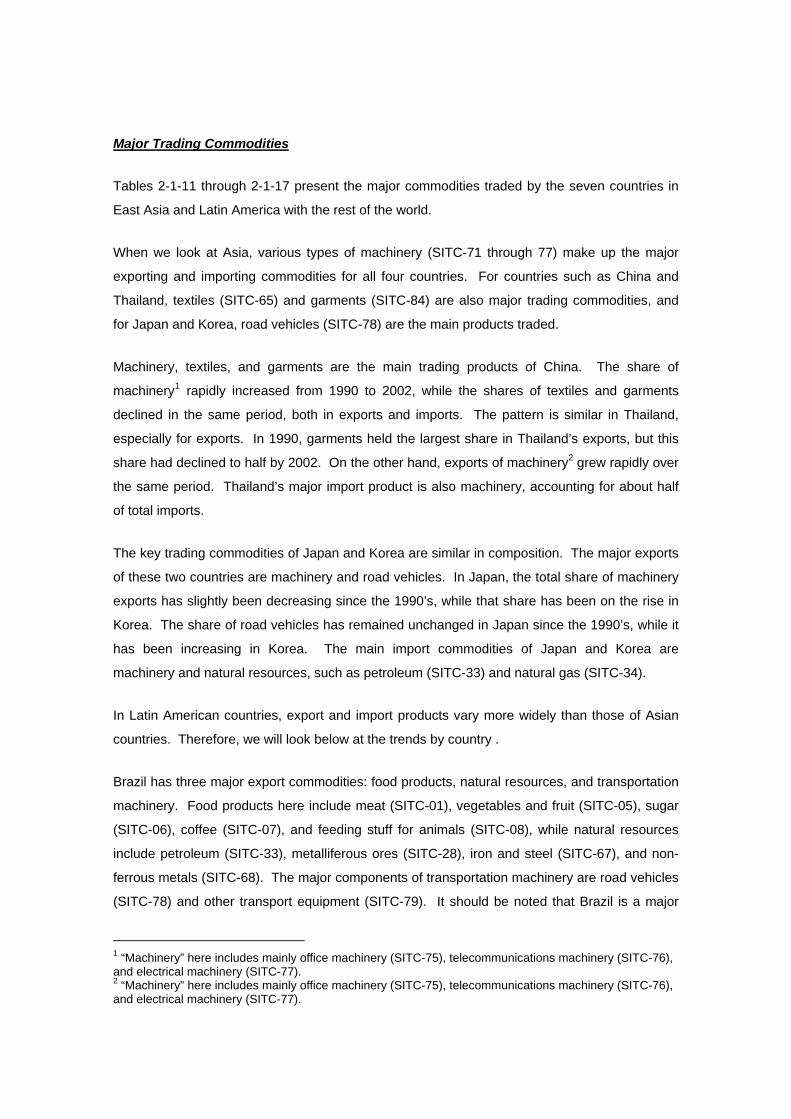
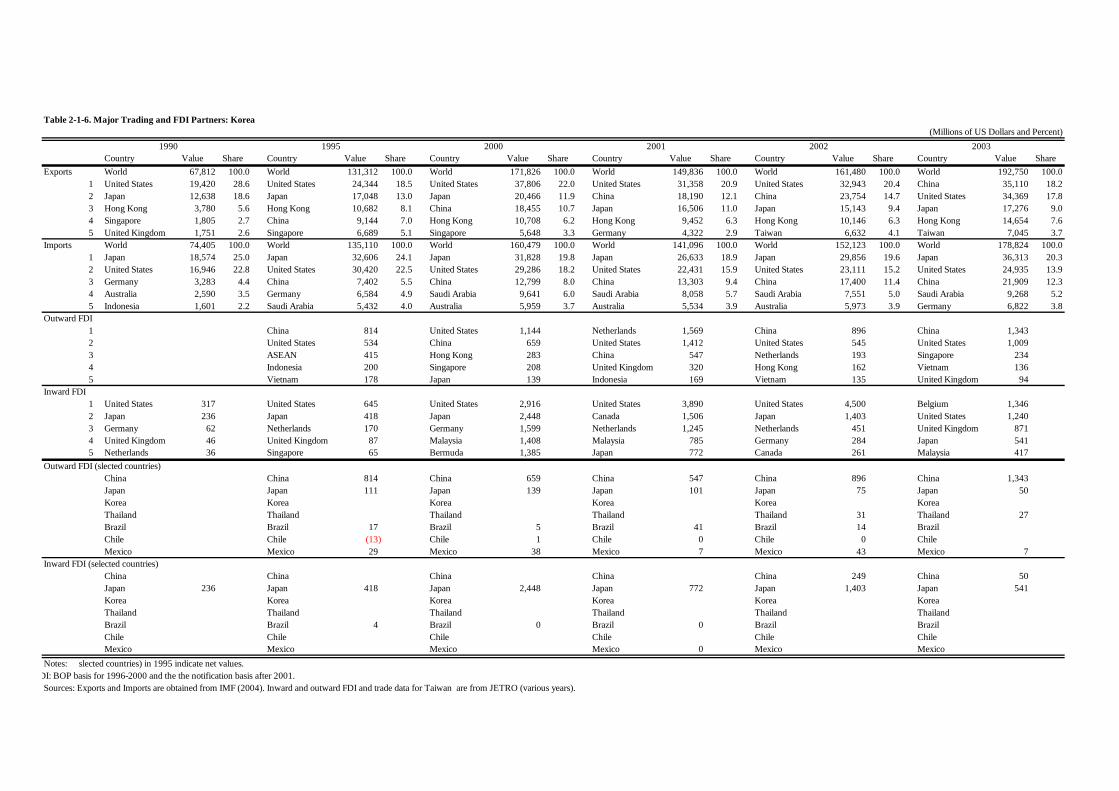
Major Trading Commodities
Tables 2-1-11 through 2-1-17 present the major commodities traded by the seven countries in
East Asia and Latin America with the rest of the world.
When we look at Asia, various types of machinery (SITC-71 through 77) make up the major
exporting and importing commodities for all four countries. For countries such as China and
Thailand, textiles (SITC-65) and garments (SITC-84) are also major trading commodities, and
for Japan and Korea, road vehicles (SITC-78) are the main products traded.
Machinery, textiles, and garments are the main trading products of China. The share of
machinery1 rapidly increased from 1990 to 2002, while the shares of textiles and garments
declined in the same period, both in exports and imports. The pattern is similar in Thailand,
especially for exports. In 1990, garments held the largest share in Thailand’s exports, but this
share had declined to half by 2002. On the other hand, exports of machinery2 grew rapidly over
the same period. Thailand’s major import product is also machinery, accounting for about half
of total imports.
The key trading commodities of Japan and Korea are similar in composition. The major exports
of these two countries are machinery and road vehicles. In Japan, the total share of machinery
exports has slightly been decreasing since the 1990’s, while that share has been on the rise in
Korea. The share of road vehicles has remained unchanged in Japan since the 1990’s, while it
has been increasing in Korea. The main import commodities of Japan and Korea are
machinery and natural resources, such as petroleum (SITC-33) and natural gas (SITC-34).
In Latin American countries, export and import products vary more widely than those of Asian
countries. Therefore, we will look below at the trends by country .
Brazil has three major export commodities: food products, natural resources, and transportation
machinery. Food products here include meat (SITC-01), vegetables and fruit (SITC-05), sugar
(SITC-06), coffee (SITC-07), and feeding stuff for animals (SITC-08), while natural resources
include petroleum (SITC-33), metalliferous ores (SITC-28), iron and steel (SITC-67), and non-
ferrous metals (SITC-68). The major components of transportation machinery are road vehicles
(SITC-78) and other transport equipment (SITC-79). It should be noted that Brazil is a major
1 “Machinery” here includes mainly office machinery (SITC-75), telecommunications machinery (SITC-76), and electrical machinery (SITC-77). 2 “Machinery” here includes mainly office machinery (SITC-75), telecommunications machinery (SITC-76), and electrical machinery (SITC-77).

producer of aircraft, which is included in “other transport equipment (SITC-79)” in this
classification. Among these export commodities, petroleum and road vehicles are seeing their
shares of total exports climb. The major import products are petroleum, machinery, and
transportation machinery, and there have been no noticeable change in their trends.
Chile’s major export products are food products, pulp, and metals. Food products include fish
(SITC-03) and vegetables and fruits (SITC-05). Fish products are mostly related to salmon.
Chile is one of the largest producers of non-ferrous metals such as copper, nickel, and
molybdenum. The share of non-ferrous metals (SITC-68) has, however, been decreasing since
the 1990’s; once at 42.8 percent in 1990, this share decreased to 27.4 percent by 2002. Chile’s
major import products are petroleum (SITC-33), various machinery (SITC-71 through 77)3, and
road vehicles (SITC-78). As road vehicles are not produced in Chile, the majority of automotive
imports are finished cars; their share has been consistently around 10 percent since the 1990’s.
Mexico’s principal export commodities are petroleum (SITC-33), road vehicles (SITC-78), and
machinery. Machinery in Mexico’s exports mainly includes general industrial machinery (SITC-
74), office machines (SITC-75), telecommunications machinery (SITC-76), and electrical
machinery (SITC-77), and the share of machinery expanded remarkably from 6.2 percent in
1990 to 36.5 percent in 2002. The share of road vehicles has also been increasing since the
1990’s. On the other hand, the share of petroleum exports rapidly declined from 35.2 percent in
1990 to 8.9 percent in 2002. The major import products are machinery and road vehicles, both
of which have been maintaining steady shares of just under 40 and 10 percent respectively.
Finally, please refer to Figure 2-2-3 in Section 2-2 for further details of the machinery traded in
East Asia and Latin America. The figure lists the proportions of parts and components, which
are all included in machinery together with final goods in the classifications for trading
commodities used in the above analysis. The figure shows the differences in the trade and
production patterns for machinery in these countries. In some countries such as China, a
clearer pattern of processing trade is demonstrated in the greater proportion of parts and
components in machinery imports than that in exports, while the figure shows that Thailand
exports parts and components that are imported and processed in Thailand. We can also see
from the figure that patterns of machinery trade in Latin America vary more than in Asia.
3 The breakdown is power-generating machinery (SITC-71), machinery specialized for particular industries (SIT-72), metalworking machinery (SITC-73), general industrial machinery and equipment (SITC-74), office machines (SITC-75), telecommunications machinery (SITC-76), and electrical machinery (SITC-77).

Table 2-1-11. Major Exporting Commodities: China (Millions of US Dollars and Percent)Exports Share
Commodity category (classification: SITC 2-digit) 1990 1995 2000 2001 2002 1990 1995 2000 2001 2002Total 64,897 150,105 267,683 294,745 358,565 100.0 100.0 100.0 100.0 100.0 00-Live animals chiefly for food 446 479 412 379 365 0.7 0.3 0.2 0.1 0.1 01-Meat and meat preparations 820 1,379 1,340 1,627 1,502 1.3 0.9 0.5 0.6 0.4 02-Dairy products and birds' eggs 57 61 90 84 104 0.1 0.0 0.0 0.0 0.0 03-Fish, crustaceans, and mollucs 1,441 2,878 3,924 4,424 4,915 2.2 1.9 1.5 1.5 1.4 04-Cereals and cereal preparations 629 354 2,095 1,582 2,257 1.0 0.2 0.8 0.5 0.6 05-Vegetables and fruit 1,847 3,428 3,593 4,152 4,713 2.8 2.3 1.3 1.4 1.3 06-Sugars,sugar preparations and honey 329 322 271 267 325 0.5 0.2 0.1 0.1 0.1 07-Coffee, tea, cocoa, and spices 553 514 579 633 651 0.9 0.3 0.2 0.2 0.2 08-Feeding stuff for animals 788 349 324 369 468 1.2 0.2 0.1 0.1 0.1 09-Miscl.edible products and preparations 111 232 420 464 535 0.2 0.2 0.2 0.2 0.1 11-Beverages 178 374 485 549 607 0.3 0.2 0.2 0.2 0.2 12-Tobacco and tobacco manufactures 177 1,005 317 419 466 0.3 0.7 0.1 0.1 0.1 21-Hides, skins, and furskins 160 51 12 12 14 0.2 0.0 0.0 0.0 0.0 22-Oil-seeds and oleaginous fruits 640 525 437 496 498 1.0 0.3 0.2 0.2 0.1 23-Crude rubber 65 88 113 152 198 0.1 0.1 0.0 0.1 0.1 24-Cork and wood 116 485 484 505 510 0.2 0.3 0.2 0.2 0.1 25-Pulp and waste paper 2 29 11 8 15 0.0 0.0 0.0 0.0 0.0 26-Textile fibres (except wool tops) 1,145 743 1,119 768 951 1.8 0.5 0.4 0.3 0.3 27-Crude fertilizers and crude materials 542 978 1,166 1,299 1,199 0.8 0.7 0.4 0.4 0.3 28-Metalliferous ores and metal scrap 221 164 120 135 217 0.3 0.1 0.0 0.0 0.1 29-Crude animal and vegetable materials, n.e.s 850 1,350 1,302 1,230 1,268 1.3 0.9 0.5 0.4 0.4 2X-Res: Crude materials, inedible, except fuel 0 0 0 0 0 0.0 0.0 0.0 0.0 0.0 32-Coal,coke and briquettes 782 1,702 2,527 3,911 3,795 1.2 1.1 0.9 1.3 1.1 33-Petroleum, and petroleum products 4,690 3,270 4,743 3,881 4,399 7.2 2.2 1.8 1.3 1.2 34-Gas, natural and manufactured 3 11 244 255 295 0.0 0.0 0.1 0.1 0.1 35-Electric current 8 391 649 746 685 0.0 0.3 0.2 0.3 0.2 3X-Res: Mineral fuels, and lubricants 0 0 0 0 0 0.0 0.0 0.0 0.0 0.0 41-Animal oils and fats 1 2 9 6 8 0.0 0.0 0.0 0.0 0.0 42-Fixed vegetable oils and fats 152 444 104 105 88 0.2 0.3 0.0 0.0 0.0 43-Animal or vegetable oils and fats 5 12 10 10 10 0.0 0.0 0.0 0.0 0.0 51-Organic chemicals 877 2,298 3,320 3,806 4,494 1.4 1.5 1.2 1.3 1.3 52-Inorganic chemicals 884 2,236 2,758 3,074 3,295 1.4 1.5 1.0 1.0 0.9 53-Dyeing,tanning and colouring materials 375 707 1,161 1,251 1,449 0.6 0.5 0.4 0.4 0.4 54-Medicinal and pharmaceutical products 679 1,597 1,893 2,172 2,563 1.0 1.1 0.7 0.7 0.7 55-Essential oils & perfume mat.;toilet prep. 333 388 496 592 745 0.5 0.3 0.2 0.2 0.2 56-Fertilizers,manufactured 26 130 324 367 361 0.0 0.1 0.1 0.1 0.1 57-Explosives and pyrotechnic products 0 0 0 0 0 0.0 0.0 0.0 0.0 0.0 58-Artif.resins,plastic mat.,cellulose esters 228 692 954 985 1,258 0.4 0.5 0.4 0.3 0.4 59-Chemical materials and products,n.e.s. 479 912 1,635 1,940 2,202 0.7 0.6 0.6 0.7 0.6 5X-Res: Chemicals and related products, n.e.s. 0 0 0 0 0 0.0 0.0 0.0 0.0 0.0 61-Leather,leather manuf.,n.e.s. 191 935 1,320 1,930 2,049 0.3 0.6 0.5 0.7 0.6 62-Rubber manufactures,n.e.s. 201 696 1,557 1,647 2,017 0.3 0.5 0.6 0.6 0.6 63-Cork and wood manufactures 287 936 1,794 2,075 2,626 0.4 0.6 0.7 0.7 0.7 64-Paper,paperboard,artic.of paper,paper-pulp 306 925 1,474 1,606 1,836 0.5 0.6 0.6 0.5 0.5 65-Textile yarn,fabrics,made-upart. 7,560 14,193 17,506 18,732 22,696 11.6 9.5 6.5 6.4 6.3 66-Non-metallic mineral manufactures,n.e.s. 1,369 3,456 5,119 5,432 6,788 2.1 2.3 1.9 1.8 1.9 67-Iron and steel 1,314 5,493 5,117 3,981 4,366 2.0 3.7 1.9 1.4 1.2 68-Non-ferrous metals 619 1,940 3,530 3,638 4,167 1.0 1.3 1.3 1.2 1.2 69-Manufactures of metal,n.e.s. 1,497 4,399 8,665 9,900 12,111 2.3 2.9 3.2 3.4 3.4 6X-Res: Manufactured goods classified chiefly 0 0 0 0 0 0.0 0.0 0.0 0.0 0.0 71-Power generating machinery and equipment 282 1,450 3,205 3,326 4,061 0.4 1.0 1.2 1.1 1.1 72-Machinery specialized for particular industry 1,542 1,225 2,148 2,708 3,336 2.4 0.8 0.8 0.9 0.9 73-Metalworking machinery 268 380 561 584 623 0.4 0.3 0.2 0.2 0.2 74-General industrial machinery & equipment 566 1,728 5,533 6,998 9,120 0.9 1.2 2.1 2.4 2.5 75-Office machines & automatic data processing 381 4,373 19,209 25,194 38,558 0.6 2.9 7.2 8.5 10.8 76-Telecommunications 2,731 8,493 21,165 26,576 35,400 4.2 5.7 7.9 9.0 9.9 77-Electrical machinery,apparatus & appliance 1,252 9,628 26,681 29,038 36,172 1.9 6.4 10.0 9.9 10.1 78-Road vehicles 3,943 2,717 6,596 6,829 8,349 6.1 1.8 2.5 2.3 2.3 79-Other transport equipment 258 1,093 2,510 2,636 2,776 0.4 0.7 0.9 0.9 0.8 7X-Res: Machinery and transport equipment 0 0 0 0 0 0.0 0.0 0.0 0.0 0.0 81-Sanitary,plumbing,heating and lighting fix 142 1,038 2,438 2,778 3,543 0.2 0.7 0.9 0.9 1.0 82-Furniture and parts thereof 342 1,783 5,012 5,733 7,478 0.5 1.2 1.9 1.9 2.1 83-Travel goods and handbags 405 2,901 4,209 4,393 4,893 0.6 1.9 1.6 1.5 1.4 84-Articles of apparel and clothing accessories 10,171 24,361 38,976 40,835 45,568 15.7 16.2 14.6 13.9 12.7 85-Footwear 2,081 6,341 10,271 10,878 11,851 3.2 4.2 3.8 3.7 3.3 87-Professional, scientific & controling instruments 222 950 3,088 3,088 4,001 0.3 0.6 1.2 1.0 1.1 88-Photographic apparatus,optical goods,watch 1,202 3,438 5,661 5,705 5,959 1.9 2.3 2.1 1.9 1.7 89-Miscellaneous manufactured articles,n.e.s. 3,912 14,105 24,337 25,212 30,094 6.0 9.4 9.1 8.6 8.4 8X-Res: Miscellaneous manufactured articles 0 0 0 0 0 0.0 0.0 0.0 0.0 0.0 91-Postal packages 0 0 0 0 0 0.0 0.0 0.0 0.0 0.0 93-Special transactions & commod. 1,200 511 543 623 683 1.8 0.3 0.2 0.2 0.2 94-Animals,live,n.e.s.,incl. zoo-animals 11 30 11 13 15 0.0 0.0 0.0 0.0 0.0 95-Armoured fighting vehicles,arms of war 0 11 4 2 2 0.0 0.0 0.0 0.0 0.0 96-Coin(other than gold) 0 0 0 0 0 0.0 0.0 0.0 0.0 0.0 97-Gold,non-monetary 0 0 0 0 1 0.0 0.0 0.0 0.0 0.0 99-Non-identified products 0 0 0 0 0 0.0 0.0 0.0 0.0 0.0 9X-Res: Commodities & trans. not classified 0 0 0 0 0 0.0 0.0 0.0 0.0 0.0Source: Statistics Canada (2004)

Table 2-1-11 (continued). Major Importing Commodities: China (Millions of US Dollars and Percent)Imports Share
Commodity category (classification: SITC 2-digit) 1990 1995 2000 2001 2002 1990 1995 2000 2001 2002Total 56,840 166,812 257,279 270,847 328,045 100.0 100.0 100.0 100.0 100.0 00-Live animals chiefly for food 13 20 21 20 38 0.0 0.0 0.0 0.0 0.0 01-Meat and meat preparations 88 435 1,057 1,038 940 0.2 0.3 0.4 0.4 0.3 02-Dairy products and birds' eggs 87 149 320 335 384 0.2 0.1 0.1 0.1 0.1 03-Fish, crustaceans, and mollucs 149 729 1,413 1,415 1,343 0.3 0.4 0.5 0.5 0.4 04-Cereals and cereal preparations 2,113 3,462 645 643 613 3.7 2.1 0.3 0.2 0.2 05-Vegetables and fruit 93 329 857 1,051 938 0.2 0.2 0.3 0.4 0.3 06-Sugars,sugar preparations and honey 367 1,116 215 379 240 0.6 0.7 0.1 0.1 0.1 07-Coffee, tea, cocoa, and spices 47 99 143 118 125 0.1 0.1 0.1 0.0 0.0 08-Feeding stuff for animals 204 420 689 486 648 0.4 0.3 0.3 0.2 0.2 09-Miscl.edible products and preparations 79 194 305 306 260 0.1 0.1 0.1 0.1 0.1 11-Beverages 92 435 256 245 229 0.2 0.3 0.1 0.1 0.1 12-Tobacco and tobacco manufactures 386 840 347 370 247 0.7 0.5 0.1 0.1 0.1 21-Hides, skins, and furskins 27 598 1,118 1,410 1,350 0.0 0.4 0.4 0.5 0.4 22-Oil-seeds and oleaginous fruits 23 138 2,621 3,033 2,530 0.0 0.1 1.0 1.1 0.8 23-Crude rubber 389 1,019 1,378 1,430 1,762 0.7 0.6 0.5 0.5 0.5 24-Cork and wood 464 591 2,406 2,541 3,101 0.8 0.4 0.9 0.9 0.9 25-Pulp and waste paper 270 772 1,814 2,150 2,435 0.5 0.5 0.7 0.8 0.7 26-Textile fibres (except wool tops) 1,910 4,413 2,665 2,489 2,868 3.4 2.6 1.0 0.9 0.9 27-Crude fertilizers and crude materials 60 158 539 583 701 0.1 0.1 0.2 0.2 0.2 28-Metalliferous ores and metal scrap 543 2,668 4,416 5,847 6,478 1.0 1.6 1.7 2.2 2.0 29-Crude animal and vegetable materials, n.e.s 130 231 467 473 471 0.2 0.1 0.2 0.2 0.1 2X-Res: Crude materials, inedible, except fuel 0 0 0 0 0 0.0 0.0 0.0 0.0 0.0 32-Coal,coke and briquettes 71 69 64 82 290 0.1 0.0 0.0 0.0 0.1 33-Petroleum, and petroleum products 1,439 5,549 19,336 14,972 15,074 2.5 3.3 7.5 5.5 4.6 34-Gas, natural and manufactured 23 399 936 875 1,157 0.0 0.2 0.4 0.3 0.4 35-Electric current 102 97 84 100 135 0.2 0.1 0.0 0.0 0.0 3X-Res: Mineral fuels, and lubricants 0 0 0 0 0 0.0 0.0 0.0 0.0 0.0 41-Animal oils and fats 27 143 111 82 114 0.0 0.1 0.0 0.0 0.0 42-Fixed vegetable oils and fats 748 2,441 766 627 1,493 1.3 1.5 0.3 0.2 0.5 43-Animal or vegetable oils and fats 90 101 105 95 216 0.2 0.1 0.0 0.0 0.1 51-Organic chemicals 1,236 3,920 8,170 9,032 10,709 2.2 2.3 3.2 3.3 3.3 52-Inorganic chemicals 241 479 950 1,066 1,292 0.4 0.3 0.4 0.4 0.4 53-Dyeing,tanning and colouring materials 319 1,089 1,867 1,924 2,200 0.6 0.7 0.7 0.7 0.7 54-Medicinal and pharmaceutical products 451 971 1,176 1,354 1,525 0.8 0.6 0.5 0.5 0.5 55-Essential oils & perfume mat.;toilet prep. 159 354 587 588 675 0.3 0.2 0.2 0.2 0.2 56-Fertilizers,manufactured 2,344 3,546 1,461 1,370 1,090 4.1 2.1 0.6 0.5 0.3 58-Artif.resins,plastic mat.,cellulose esters 2,547 10,613 15,794 16,030 18,789 4.5 6.4 6.1 5.9 5.7 59-Chemical materials and products,n.e.s. 561 1,682 3,274 3,232 4,005 1.0 1.0 1.3 1.2 1.2 5X-Res: Chemicals and related products, n.e.s. 0 0 0 0 0 0.0 0.0 0.0 0.0 0.0 61-Leather,leather manuf.,n.e.s. 789 3,470 4,493 4,534 4,688 1.4 2.1 1.7 1.7 1.4 62-Rubber manufactures,n.e.s. 90 350 678 715 876 0.2 0.2 0.3 0.3 0.3 63-Cork and wood manufactures 701 1,455 910 662 672 1.2 0.9 0.4 0.2 0.2 64-Paper,paperboard,artic.of paper,paper-pulp 1,116 2,934 4,436 4,047 4,601 2.0 1.8 1.7 1.5 1.4 65-Textile yarn,fabrics,made-upart. 5,960 16,561 19,108 18,143 18,534 10.5 9.9 7.4 6.7 5.6 66-Non-metallic mineral manufactures,n.e.s. 531 1,614 2,731 3,009 3,364 0.9 1.0 1.1 1.1 1.0 67-Iron and steel 2,881 7,866 10,470 10,559 14,794 5.1 4.7 4.1 3.9 4.5 68-Non-ferrous metals 672 3,797 7,046 6,483 7,777 1.2 2.3 2.7 2.4 2.4 69-Manufactures of metal,n.e.s. 665 1,954 2,242 2,389 3,071 1.2 1.2 0.9 0.9 0.9 6X-Res: Manufactured goods classified chiefly 0 0 0 0 0 0.0 0.0 0.0 0.0 0.0 71-Power generating machinery and equipment 2,056 3,871 5,461 5,517 6,748 3.6 2.3 2.1 2.0 2.1 72-Machinery specialized for particular industry 4,565 12,937 12,110 13,729 17,304 8.0 7.8 4.7 5.1 5.3 73-Metalworking machinery 742 3,490 2,507 2,881 4,137 1.3 2.1 1.0 1.1 1.3 74-General industrial machinery & equipment 2,106 8,605 8,452 9,968 12,610 3.7 5.2 3.3 3.7 3.8 75-Office machines & automatic data processing 889 4,279 13,849 17,306 22,138 1.6 2.6 5.4 6.4 6.7 76-Telecommunications 3,028 11,159 14,623 16,153 19,596 5.3 6.7 5.7 6.0 6.0 77-Electrical machinery,apparatus & appliance 2,901 12,326 40,604 42,944 56,805 5.1 7.4 15.8 15.9 17.3 78-Road vehicles 1,875 4,613 3,653 4,692 7,940 3.3 2.8 1.4 1.7 2.4 79-Other transport equipment 1,760 2,500 3,700 4,614 5,880 3.1 1.5 1.4 1.7 1.8 7X-Res: Machinery and transport equipment 0 0 0 0 0 0.0 0.0 0.0 0.0 0.0 81-Sanitary,plumbing,heating and lighting fix 104 301 202 210 214 0.2 0.2 0.1 0.1 0.1 82-Furniture and parts thereof 84 173 320 375 441 0.1 0.1 0.1 0.1 0.1 83-Travel goods and handbags 27 59 61 73 74 0.0 0.0 0.0 0.0 0.0 84-Articles of apparel and clothing accessories 421 1,300 2,959 2,981 3,237 0.7 0.8 1.2 1.1 1.0 85-Footwear 18 62 65 76 105 0.0 0.0 0.0 0.0 0.0 87-Professional, scientific & controling instruments 974 2,474 6,085 8,632 10,620 1.7 1.5 2.4 3.2 3.2 88-Photographic apparatus,optical goods,watch 1,128 2,580 3,971 3,870 4,433 2.0 1.5 1.5 1.4 1.4 89-Miscellaneous manufactured articles,n.e.s. 1,860 3,807 5,169 5,022 5,776 3.3 2.3 2.0 1.9 1.8 8X-Res: Miscellaneous manufactured articles 0 0 0 0 0 0.0 0.0 0.0 0.0 0.0 91-Postal packages 0 0 0 0 0 0.0 0.0 0.0 0.0 0.0 93-Special transactions & commod. 947 1,950 2,465 3,094 4,732 1.7 1.2 1.0 1.1 1.4 94-Animals,live,n.e.s.,incl. zoo-animals 3 22 21 10 16 0.0 0.0 0.0 0.0 0.0 95-Armoured fighting vehicles,arms of war 2 4 315 4 4 0.0 0.0 0.1 0.0 0.0 97-Gold,non-monetary 51 26 201 364 392 0.1 0.0 0.1 0.1 0.1 9X-Res: Commodities & trans. not classified 0 0 0 0 0 0.0 0.0 0.0 0.0 0.0Source: Statistics Canada (2004)
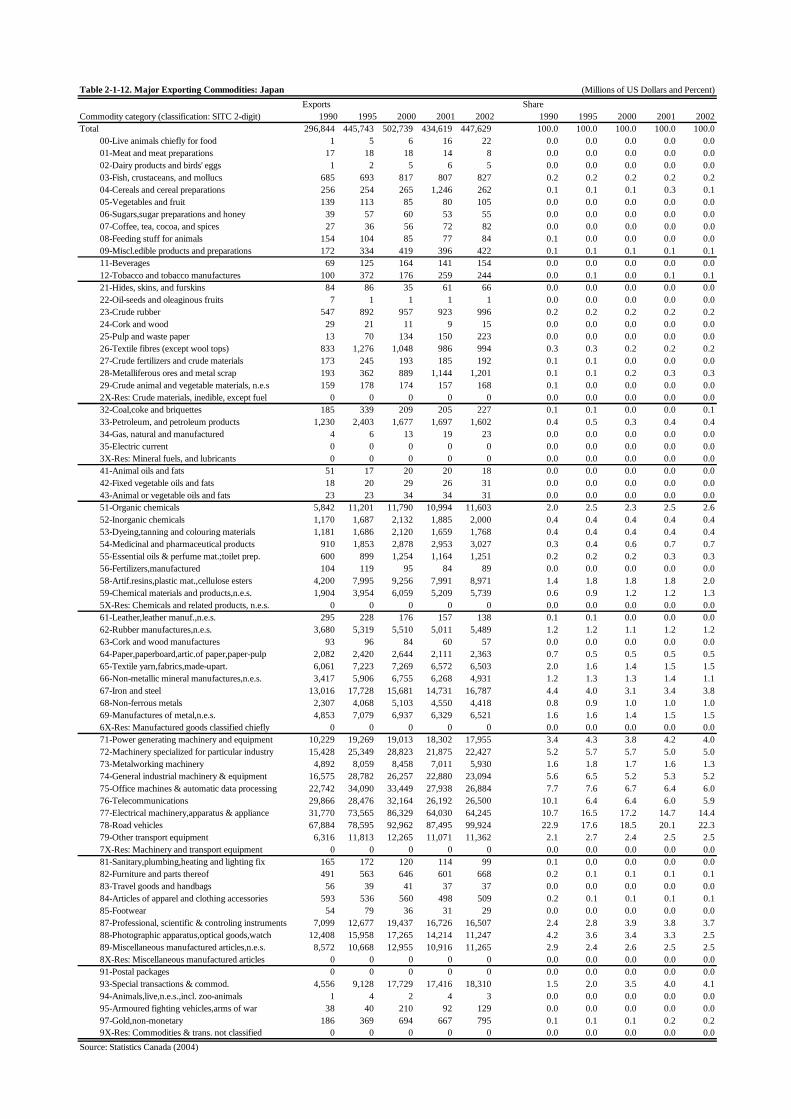
Table 2-1-12. Major Exporting Commodities: Japan (Millions of US Dollars and Percent)Exports Share
Commodity category (classification: SITC 2-digit) 1990 1995 2000 2001 2002 1990 1995 2000 2001 2002Total 296,844 445,743 502,739 434,619 447,629 100.0 100.0 100.0 100.0 100.0 00-Live animals chiefly for food 1 5 6 16 22 0.0 0.0 0.0 0.0 0.0 01-Meat and meat preparations 17 18 18 14 8 0.0 0.0 0.0 0.0 0.0 02-Dairy products and birds' eggs 1 2 5 6 5 0.0 0.0 0.0 0.0 0.0 03-Fish, crustaceans, and mollucs 685 693 817 807 827 0.2 0.2 0.2 0.2 0.2 04-Cereals and cereal preparations 256 254 265 1,246 262 0.1 0.1 0.1 0.3 0.1 05-Vegetables and fruit 139 113 85 80 105 0.0 0.0 0.0 0.0 0.0 06-Sugars,sugar preparations and honey 39 57 60 53 55 0.0 0.0 0.0 0.0 0.0 07-Coffee, tea, cocoa, and spices 27 36 56 72 82 0.0 0.0 0.0 0.0 0.0 08-Feeding stuff for animals 154 104 85 77 84 0.1 0.0 0.0 0.0 0.0 09-Miscl.edible products and preparations 172 334 419 396 422 0.1 0.1 0.1 0.1 0.1 11-Beverages 69 125 164 141 154 0.0 0.0 0.0 0.0 0.0 12-Tobacco and tobacco manufactures 100 372 176 259 244 0.0 0.1 0.0 0.1 0.1 21-Hides, skins, and furskins 84 86 35 61 66 0.0 0.0 0.0 0.0 0.0 22-Oil-seeds and oleaginous fruits 7 1 1 1 1 0.0 0.0 0.0 0.0 0.0 23-Crude rubber 547 892 957 923 996 0.2 0.2 0.2 0.2 0.2 24-Cork and wood 29 21 11 9 15 0.0 0.0 0.0 0.0 0.0 25-Pulp and waste paper 13 70 134 150 223 0.0 0.0 0.0 0.0 0.0 26-Textile fibres (except wool tops) 833 1,276 1,048 986 994 0.3 0.3 0.2 0.2 0.2 27-Crude fertilizers and crude materials 173 245 193 185 192 0.1 0.1 0.0 0.0 0.0 28-Metalliferous ores and metal scrap 193 362 889 1,144 1,201 0.1 0.1 0.2 0.3 0.3 29-Crude animal and vegetable materials, n.e.s 159 178 174 157 168 0.1 0.0 0.0 0.0 0.0 2X-Res: Crude materials, inedible, except fuel 0 0 0 0 0 0.0 0.0 0.0 0.0 0.0 32-Coal,coke and briquettes 185 339 209 205 227 0.1 0.1 0.0 0.0 0.1 33-Petroleum, and petroleum products 1,230 2,403 1,677 1,697 1,602 0.4 0.5 0.3 0.4 0.4 34-Gas, natural and manufactured 4 6 13 19 23 0.0 0.0 0.0 0.0 0.0 35-Electric current 0 0 0 0 0 0.0 0.0 0.0 0.0 0.0 3X-Res: Mineral fuels, and lubricants 0 0 0 0 0 0.0 0.0 0.0 0.0 0.0 41-Animal oils and fats 51 17 20 20 18 0.0 0.0 0.0 0.0 0.0 42-Fixed vegetable oils and fats 18 20 29 26 31 0.0 0.0 0.0 0.0 0.0 43-Animal or vegetable oils and fats 23 23 34 34 31 0.0 0.0 0.0 0.0 0.0 51-Organic chemicals 5,842 11,201 11,790 10,994 11,603 2.0 2.5 2.3 2.5 2.6 52-Inorganic chemicals 1,170 1,687 2,132 1,885 2,000 0.4 0.4 0.4 0.4 0.4 53-Dyeing,tanning and colouring materials 1,181 1,686 2,120 1,659 1,768 0.4 0.4 0.4 0.4 0.4 54-Medicinal and pharmaceutical products 910 1,853 2,878 2,953 3,027 0.3 0.4 0.6 0.7 0.7 55-Essential oils & perfume mat.;toilet prep. 600 899 1,254 1,164 1,251 0.2 0.2 0.2 0.3 0.3 56-Fertilizers,manufactured 104 119 95 84 89 0.0 0.0 0.0 0.0 0.0 58-Artif.resins,plastic mat.,cellulose esters 4,200 7,995 9,256 7,991 8,971 1.4 1.8 1.8 1.8 2.0 59-Chemical materials and products,n.e.s. 1,904 3,954 6,059 5,209 5,739 0.6 0.9 1.2 1.2 1.3 5X-Res: Chemicals and related products, n.e.s. 0 0 0 0 0 0.0 0.0 0.0 0.0 0.0 61-Leather,leather manuf.,n.e.s. 295 228 176 157 138 0.1 0.1 0.0 0.0 0.0 62-Rubber manufactures,n.e.s. 3,680 5,319 5,510 5,011 5,489 1.2 1.2 1.1 1.2 1.2 63-Cork and wood manufactures 93 96 84 60 57 0.0 0.0 0.0 0.0 0.0 64-Paper,paperboard,artic.of paper,paper-pulp 2,082 2,420 2,644 2,111 2,363 0.7 0.5 0.5 0.5 0.5 65-Textile yarn,fabrics,made-upart. 6,061 7,223 7,269 6,572 6,503 2.0 1.6 1.4 1.5 1.5 66-Non-metallic mineral manufactures,n.e.s. 3,417 5,906 6,755 6,268 4,931 1.2 1.3 1.3 1.4 1.1 67-Iron and steel 13,016 17,728 15,681 14,731 16,787 4.4 4.0 3.1 3.4 3.8 68-Non-ferrous metals 2,307 4,068 5,103 4,550 4,418 0.8 0.9 1.0 1.0 1.0 69-Manufactures of metal,n.e.s. 4,853 7,079 6,937 6,329 6,521 1.6 1.6 1.4 1.5 1.5 6X-Res: Manufactured goods classified chiefly 0 0 0 0 0 0.0 0.0 0.0 0.0 0.0 71-Power generating machinery and equipment 10,229 19,269 19,013 18,302 17,955 3.4 4.3 3.8 4.2 4.0 72-Machinery specialized for particular industry 15,428 25,349 28,823 21,875 22,427 5.2 5.7 5.7 5.0 5.0 73-Metalworking machinery 4,892 8,059 8,458 7,011 5,930 1.6 1.8 1.7 1.6 1.3 74-General industrial machinery & equipment 16,575 28,782 26,257 22,880 23,094 5.6 6.5 5.2 5.3 5.2 75-Office machines & automatic data processing 22,742 34,090 33,449 27,938 26,884 7.7 7.6 6.7 6.4 6.0 76-Telecommunications 29,866 28,476 32,164 26,192 26,500 10.1 6.4 6.4 6.0 5.9 77-Electrical machinery,apparatus & appliance 31,770 73,565 86,329 64,030 64,245 10.7 16.5 17.2 14.7 14.4 78-Road vehicles 67,884 78,595 92,962 87,495 99,924 22.9 17.6 18.5 20.1 22.3 79-Other transport equipment 6,316 11,813 12,265 11,071 11,362 2.1 2.7 2.4 2.5 2.5 7X-Res: Machinery and transport equipment 0 0 0 0 0 0.0 0.0 0.0 0.0 0.0 81-Sanitary,plumbing,heating and lighting fix 165 172 120 114 99 0.1 0.0 0.0 0.0 0.0 82-Furniture and parts thereof 491 563 646 601 668 0.2 0.1 0.1 0.1 0.1 83-Travel goods and handbags 56 39 41 37 37 0.0 0.0 0.0 0.0 0.0 84-Articles of apparel and clothing accessories 593 536 560 498 509 0.2 0.1 0.1 0.1 0.1 85-Footwear 54 79 36 31 29 0.0 0.0 0.0 0.0 0.0 87-Professional, scientific & controling instruments 7,099 12,677 19,437 16,726 16,507 2.4 2.8 3.9 3.8 3.7 88-Photographic apparatus,optical goods,watch 12,408 15,958 17,265 14,214 11,247 4.2 3.6 3.4 3.3 2.5 89-Miscellaneous manufactured articles,n.e.s. 8,572 10,668 12,955 10,916 11,265 2.9 2.4 2.6 2.5 2.5 8X-Res: Miscellaneous manufactured articles 0 0 0 0 0 0.0 0.0 0.0 0.0 0.0 91-Postal packages 0 0 0 0 0 0.0 0.0 0.0 0.0 0.0 93-Special transactions & commod. 4,556 9,128 17,729 17,416 18,310 1.5 2.0 3.5 4.0 4.1 94-Animals,live,n.e.s.,incl. zoo-animals 1 4 2 4 3 0.0 0.0 0.0 0.0 0.0 95-Armoured fighting vehicles,arms of war 38 40 210 92 129 0.0 0.0 0.0 0.0 0.0 97-Gold,non-monetary 186 369 694 667 795 0.1 0.1 0.1 0.2 0.2 9X-Res: Commodities & trans. not classified 0 0 0 0 0 0.0 0.0 0.0 0.0 0.0Source: Statistics Canada (2004)
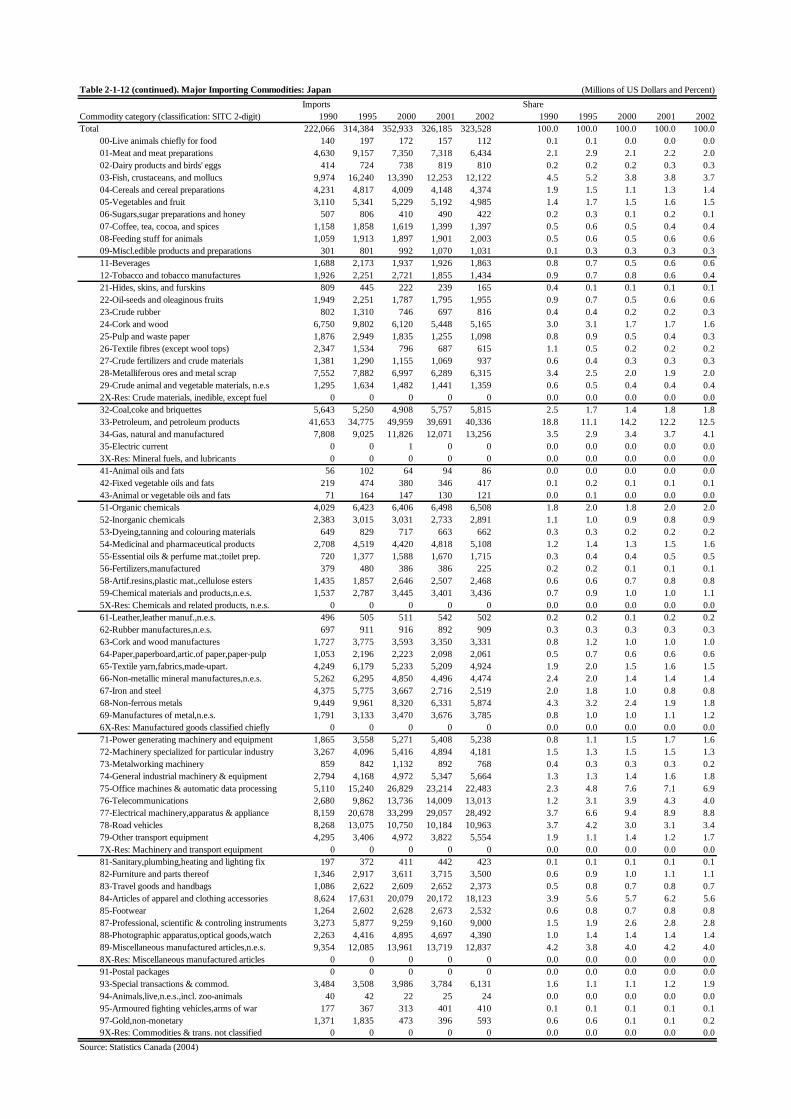
Table 2-1-12 (continued). Major Importing Commodities: Japan (Millions of US Dollars and Percent)Imports Share
Commodity category (classification: SITC 2-digit) 1990 1995 2000 2001 2002 1990 1995 2000 2001 2002Total 222,066 314,384 352,933 326,185 323,528 100.0 100.0 100.0 100.0 100.0 00-Live animals chiefly for food 140 197 172 157 112 0.1 0.1 0.0 0.0 0.0 01-Meat and meat preparations 4,630 9,157 7,350 7,318 6,434 2.1 2.9 2.1 2.2 2.0 02-Dairy products and birds' eggs 414 724 738 819 810 0.2 0.2 0.2 0.3 0.3 03-Fish, crustaceans, and mollucs 9,974 16,240 13,390 12,253 12,122 4.5 5.2 3.8 3.8 3.7 04-Cereals and cereal preparations 4,231 4,817 4,009 4,148 4,374 1.9 1.5 1.1 1.3 1.4 05-Vegetables and fruit 3,110 5,341 5,229 5,192 4,985 1.4 1.7 1.5 1.6 1.5 06-Sugars,sugar preparations and honey 507 806 410 490 422 0.2 0.3 0.1 0.2 0.1 07-Coffee, tea, cocoa, and spices 1,158 1,858 1,619 1,399 1,397 0.5 0.6 0.5 0.4 0.4 08-Feeding stuff for animals 1,059 1,913 1,897 1,901 2,003 0.5 0.6 0.5 0.6 0.6 09-Miscl.edible products and preparations 301 801 992 1,070 1,031 0.1 0.3 0.3 0.3 0.3 11-Beverages 1,688 2,173 1,937 1,926 1,863 0.8 0.7 0.5 0.6 0.6 12-Tobacco and tobacco manufactures 1,926 2,251 2,721 1,855 1,434 0.9 0.7 0.8 0.6 0.4 21-Hides, skins, and furskins 809 445 222 239 165 0.4 0.1 0.1 0.1 0.1 22-Oil-seeds and oleaginous fruits 1,949 2,251 1,787 1,795 1,955 0.9 0.7 0.5 0.6 0.6 23-Crude rubber 802 1,310 746 697 816 0.4 0.4 0.2 0.2 0.3 24-Cork and wood 6,750 9,802 6,120 5,448 5,165 3.0 3.1 1.7 1.7 1.6 25-Pulp and waste paper 1,876 2,949 1,835 1,255 1,098 0.8 0.9 0.5 0.4 0.3 26-Textile fibres (except wool tops) 2,347 1,534 796 687 615 1.1 0.5 0.2 0.2 0.2 27-Crude fertilizers and crude materials 1,381 1,290 1,155 1,069 937 0.6 0.4 0.3 0.3 0.3 28-Metalliferous ores and metal scrap 7,552 7,882 6,997 6,289 6,315 3.4 2.5 2.0 1.9 2.0 29-Crude animal and vegetable materials, n.e.s 1,295 1,634 1,482 1,441 1,359 0.6 0.5 0.4 0.4 0.4 2X-Res: Crude materials, inedible, except fuel 0 0 0 0 0 0.0 0.0 0.0 0.0 0.0 32-Coal,coke and briquettes 5,643 5,250 4,908 5,757 5,815 2.5 1.7 1.4 1.8 1.8 33-Petroleum, and petroleum products 41,653 34,775 49,959 39,691 40,336 18.8 11.1 14.2 12.2 12.5 34-Gas, natural and manufactured 7,808 9,025 11,826 12,071 13,256 3.5 2.9 3.4 3.7 4.1 35-Electric current 0 0 1 0 0 0.0 0.0 0.0 0.0 0.0 3X-Res: Mineral fuels, and lubricants 0 0 0 0 0 0.0 0.0 0.0 0.0 0.0 41-Animal oils and fats 56 102 64 94 86 0.0 0.0 0.0 0.0 0.0 42-Fixed vegetable oils and fats 219 474 380 346 417 0.1 0.2 0.1 0.1 0.1 43-Animal or vegetable oils and fats 71 164 147 130 121 0.0 0.1 0.0 0.0 0.0 51-Organic chemicals 4,029 6,423 6,406 6,498 6,508 1.8 2.0 1.8 2.0 2.0 52-Inorganic chemicals 2,383 3,015 3,031 2,733 2,891 1.1 1.0 0.9 0.8 0.9 53-Dyeing,tanning and colouring materials 649 829 717 663 662 0.3 0.3 0.2 0.2 0.2 54-Medicinal and pharmaceutical products 2,708 4,519 4,420 4,818 5,108 1.2 1.4 1.3 1.5 1.6 55-Essential oils & perfume mat.;toilet prep. 720 1,377 1,588 1,670 1,715 0.3 0.4 0.4 0.5 0.5 56-Fertilizers,manufactured 379 480 386 386 225 0.2 0.2 0.1 0.1 0.1 58-Artif.resins,plastic mat.,cellulose esters 1,435 1,857 2,646 2,507 2,468 0.6 0.6 0.7 0.8 0.8 59-Chemical materials and products,n.e.s. 1,537 2,787 3,445 3,401 3,436 0.7 0.9 1.0 1.0 1.1 5X-Res: Chemicals and related products, n.e.s. 0 0 0 0 0 0.0 0.0 0.0 0.0 0.0 61-Leather,leather manuf.,n.e.s. 496 505 511 542 502 0.2 0.2 0.1 0.2 0.2 62-Rubber manufactures,n.e.s. 697 911 916 892 909 0.3 0.3 0.3 0.3 0.3 63-Cork and wood manufactures 1,727 3,775 3,593 3,350 3,331 0.8 1.2 1.0 1.0 1.0 64-Paper,paperboard,artic.of paper,paper-pulp 1,053 2,196 2,223 2,098 2,061 0.5 0.7 0.6 0.6 0.6 65-Textile yarn,fabrics,made-upart. 4,249 6,179 5,233 5,209 4,924 1.9 2.0 1.5 1.6 1.5 66-Non-metallic mineral manufactures,n.e.s. 5,262 6,295 4,850 4,496 4,474 2.4 2.0 1.4 1.4 1.4 67-Iron and steel 4,375 5,775 3,667 2,716 2,519 2.0 1.8 1.0 0.8 0.8 68-Non-ferrous metals 9,449 9,961 8,320 6,331 5,874 4.3 3.2 2.4 1.9 1.8 69-Manufactures of metal,n.e.s. 1,791 3,133 3,470 3,676 3,785 0.8 1.0 1.0 1.1 1.2 6X-Res: Manufactured goods classified chiefly 0 0 0 0 0 0.0 0.0 0.0 0.0 0.0 71-Power generating machinery and equipment 1,865 3,558 5,271 5,408 5,238 0.8 1.1 1.5 1.7 1.6 72-Machinery specialized for particular industry 3,267 4,096 5,416 4,894 4,181 1.5 1.3 1.5 1.5 1.3 73-Metalworking machinery 859 842 1,132 892 768 0.4 0.3 0.3 0.3 0.2 74-General industrial machinery & equipment 2,794 4,168 4,972 5,347 5,664 1.3 1.3 1.4 1.6 1.8 75-Office machines & automatic data processing 5,110 15,240 26,829 23,214 22,483 2.3 4.8 7.6 7.1 6.9 76-Telecommunications 2,680 9,862 13,736 14,009 13,013 1.2 3.1 3.9 4.3 4.0 77-Electrical machinery,apparatus & appliance 8,159 20,678 33,299 29,057 28,492 3.7 6.6 9.4 8.9 8.8 78-Road vehicles 8,268 13,075 10,750 10,184 10,963 3.7 4.2 3.0 3.1 3.4 79-Other transport equipment 4,295 3,406 4,972 3,822 5,554 1.9 1.1 1.4 1.2 1.7 7X-Res: Machinery and transport equipment 0 0 0 0 0 0.0 0.0 0.0 0.0 0.0 81-Sanitary,plumbing,heating and lighting fix 197 372 411 442 423 0.1 0.1 0.1 0.1 0.1 82-Furniture and parts thereof 1,346 2,917 3,611 3,715 3,500 0.6 0.9 1.0 1.1 1.1 83-Travel goods and handbags 1,086 2,622 2,609 2,652 2,373 0.5 0.8 0.7 0.8 0.7 84-Articles of apparel and clothing accessories 8,624 17,631 20,079 20,172 18,123 3.9 5.6 5.7 6.2 5.6 85-Footwear 1,264 2,602 2,628 2,673 2,532 0.6 0.8 0.7 0.8 0.8 87-Professional, scientific & controling instruments 3,273 5,877 9,259 9,160 9,000 1.5 1.9 2.6 2.8 2.8 88-Photographic apparatus,optical goods,watch 2,263 4,416 4,895 4,697 4,390 1.0 1.4 1.4 1.4 1.4 89-Miscellaneous manufactured articles,n.e.s. 9,354 12,085 13,961 13,719 12,837 4.2 3.8 4.0 4.2 4.0 8X-Res: Miscellaneous manufactured articles 0 0 0 0 0 0.0 0.0 0.0 0.0 0.0 91-Postal packages 0 0 0 0 0 0.0 0.0 0.0 0.0 0.0 93-Special transactions & commod. 3,484 3,508 3,986 3,784 6,131 1.6 1.1 1.1 1.2 1.9 94-Animals,live,n.e.s.,incl. zoo-animals 40 42 22 25 24 0.0 0.0 0.0 0.0 0.0 95-Armoured fighting vehicles,arms of war 177 367 313 401 410 0.1 0.1 0.1 0.1 0.1 97-Gold,non-monetary 1,371 1,835 473 396 593 0.6 0.6 0.1 0.1 0.2 9X-Res: Commodities & trans. not classified 0 0 0 0 0 0.0 0.0 0.0 0.0 0.0Source: Statistics Canada (2004)

Table 2-1-13. Major Exporting Commodities: Korea (Millions of US Dollars and Percent)Exports Share
Commodity category (classification: SITC 2-digit) 1990 1995 2000 2001 2002 1990 1995 2000 2001 2002Total 66,479 125,719 180,571 159,732 174,161 100.0 100.0 100.0 100.0 100.0 00-Live animals chiefly for food 0 0 0 0 1 0.0 0.0 0.0 0.0 0.0 01-Meat and meat preparations 58 109 89 52 32 0.1 0.1 0.0 0.0 0.0 02-Dairy products and birds' eggs 0 3 5 6 6 0.0 0.0 0.0 0.0 0.0 03-Fish, crustaceans, and mollucs 1,401 1,558 1,436 1,222 1,106 2.1 1.2 0.8 0.8 0.6 04-Cereals and cereal preparations 93 220 249 289 325 0.1 0.2 0.1 0.2 0.2 05-Vegetables and fruit 282 335 348 353 337 0.4 0.3 0.2 0.2 0.2 06-Sugars,sugar preparations and honey 156 236 172 182 169 0.2 0.2 0.1 0.1 0.1 07-Coffee, tea, cocoa, and spices 23 54 54 66 79 0.0 0.0 0.0 0.0 0.0 08-Feeding stuff for animals 16 29 33 40 40 0.0 0.0 0.0 0.0 0.0 09-Miscl.edible products and preparations 43 113 120 140 164 0.1 0.1 0.1 0.1 0.1 11-Beverages 43 100 160 173 203 0.1 0.1 0.1 0.1 0.1 12-Tobacco and tobacco manufactures 83 48 89 136 166 0.1 0.0 0.0 0.1 0.1 21-Hides, skins, and furskins 8 25 10 9 7 0.0 0.0 0.0 0.0 0.0 22-Oil-seeds and oleaginous fruits 1 0 0 0 1 0.0 0.0 0.0 0.0 0.0 23-Crude rubber 75 167 390 377 394 0.1 0.1 0.2 0.2 0.2 24-Cork and wood 53 17 10 10 8 0.1 0.0 0.0 0.0 0.0 25-Pulp and waste paper 0 14 2 1 7 0.0 0.0 0.0 0.0 0.0 26-Textile fibres (except wool tops) 369 1,062 1,026 857 846 0.6 0.8 0.6 0.5 0.5 27-Crude fertilizers and crude materials 108 114 116 79 71 0.2 0.1 0.1 0.0 0.0 28-Metalliferous ores and metal scrap 60 52 87 94 176 0.1 0.0 0.0 0.1 0.1 29-Crude animal and vegetable materials, n.e.s 345 344 268 260 233 0.5 0.3 0.1 0.2 0.1 2X-Res: Crude materials, inedible, except fuel 0 0 0 0 0 0.0 0.0 0.0 0.0 0.0 32-Coal,coke and briquettes 1 1 0 0 0 0.0 0.0 0.0 0.0 0.0 33-Petroleum, and petroleum products 703 2,448 9,657 8,230 6,974 1.1 1.9 5.3 5.2 4.0 34-Gas, natural and manufactured 15 53 214 126 70 0.0 0.0 0.1 0.1 0.0 35-Electric current 0 0 0 0 0 0.0 0.0 0.0 0.0 0.0 3X-Res: Mineral fuels, and lubricants 0 0 0 0 0 0.0 0.0 0.0 0.0 0.0 41-Animal oils and fats 0 2 2 4 3 0.0 0.0 0.0 0.0 0.0 42-Fixed vegetable oils and fats 0 12 4 4 7 0.0 0.0 0.0 0.0 0.0 43-Animal or vegetable oils and fats 1 7 11 9 12 0.0 0.0 0.0 0.0 0.0 51-Organic chemicals 705 2,684 5,066 4,389 4,806 1.1 2.1 2.8 2.7 2.8 52-Inorganic chemicals 142 288 466 482 474 0.2 0.2 0.3 0.3 0.3 53-Dyeing,tanning and colouring materials 159 397 575 582 652 0.2 0.3 0.3 0.4 0.4 54-Medicinal and pharmaceutical products 112 261 341 342 382 0.2 0.2 0.2 0.2 0.2 55-Essential oils & perfume mat.;toilet prep. 65 138 253 281 331 0.1 0.1 0.1 0.2 0.2 56-Fertilizers,manufactured 189 254 130 129 135 0.3 0.2 0.1 0.1 0.1 58-Artif.resins,plastic mat.,cellulose esters 985 4,423 6,555 6,137 6,692 1.5 3.5 3.6 3.8 3.8 59-Chemical materials and products,n.e.s. 133 429 832 885 1,013 0.2 0.3 0.5 0.6 0.6 5X-Res: Chemicals and related products, n.e.s. 0 0 0 0 0 0.0 0.0 0.0 0.0 0.0 61-Leather,leather manuf.,n.e.s. 468 1,819 1,823 1,639 1,563 0.7 1.4 1.0 1.0 0.9 62-Rubber manufactures,n.e.s. 1,006 1,527 1,710 1,753 1,873 1.5 1.2 0.9 1.1 1.1 63-Cork and wood manufactures 97 147 106 90 75 0.1 0.1 0.1 0.1 0.0 64-Paper,paperboard,artic.of paper,paper-pulp 459 1,185 2,009 1,773 1,750 0.7 0.9 1.1 1.1 1.0 65-Textile yarn,fabrics,made-upart. 6,107 12,390 13,294 11,297 11,697 9.2 9.9 7.4 7.1 6.7 66-Non-metallic mineral manufactures,n.e.s. 683 693 1,091 1,293 981 1.0 0.6 0.6 0.8 0.6 67-Iron and steel 3,845 5,590 7,146 6,362 6,234 5.8 4.4 4.0 4.0 3.6 68-Non-ferrous metals 381 1,106 2,031 1,838 2,075 0.6 0.9 1.1 1.2 1.2 69-Manufactures of metal,n.e.s. 1,691 3,497 3,031 2,757 2,998 2.5 2.8 1.7 1.7 1.7 6X-Res: Manufactured goods classified chiefly 0 0 0 0 0 0.0 0.0 0.0 0.0 0.0 71-Power generating machinery and equipment 738 1,219 1,675 1,863 1,959 1.1 1.0 0.9 1.2 1.1 72-Machinery specialized for particular industry 681 2,711 3,468 3,154 4,149 1.0 2.2 1.9 2.0 2.4 73-Metalworking machinery 141 400 586 570 576 0.2 0.3 0.3 0.4 0.3 74-General industrial machinery & equipment 999 2,931 4,760 4,865 5,164 1.5 2.3 2.6 3.0 3.0 75-Office machines & automatic data processing 2,739 4,903 20,407 14,320 17,455 4.1 3.9 11.3 9.0 10.0 76-Telecommunications 6,380 8,912 15,065 17,178 21,644 9.6 7.1 8.3 10.8 12.4 77-Electrical machinery,apparatus & appliance 7,778 28,612 33,131 22,826 25,183 11.7 22.8 18.3 14.3 14.5 78-Road vehicles 3,415 10,172 16,149 16,284 18,482 5.1 8.1 8.9 10.2 10.6 79-Other transport equipment 3,132 5,957 9,303 10,619 11,745 4.7 4.7 5.2 6.6 6.7 7X-Res: Machinery and transport equipment 0 0 0 0 0 0.0 0.0 0.0 0.0 0.0 81-Sanitary,plumbing,heating and lighting fix 102 121 99 92 95 0.2 0.1 0.1 0.1 0.1 82-Furniture and parts thereof 235 215 248 237 238 0.4 0.2 0.1 0.1 0.1 83-Travel goods and handbags 1,132 686 350 251 151 1.7 0.5 0.2 0.2 0.1 84-Articles of apparel and clothing accessories 8,267 5,012 5,294 4,425 4,262 12.4 4.0 2.9 2.8 2.4 85-Footwear 4,300 1,253 460 363 269 6.5 1.0 0.3 0.2 0.2 87-Professional, scientific & controling instruments 437 862 1,268 1,279 1,331 0.7 0.7 0.7 0.8 0.8 88-Photographic apparatus,optical goods,watch 530 986 1,039 967 842 0.8 0.8 0.6 0.6 0.5 89-Miscellaneous manufactured articles,n.e.s. 4,088 4,321 4,639 4,509 4,345 6.1 3.4 2.6 2.8 2.5 8X-Res: Miscellaneous manufactured articles 0 0 0 0 0 0.0 0.0 0.0 0.0 0.0 91-Postal packages 0 0 0 0 0 0.0 0.0 0.0 0.0 0.0 93-Special transactions & commod. 0 0 0 0 42 0.0 0.0 0.0 0.0 0.0 94-Animals,live,n.e.s.,incl. zoo-animals 23 10 1 1 0 0.0 0.0 0.0 0.0 0.0 95-Armoured fighting vehicles,arms of war 13 41 23 48 54 0.0 0.0 0.0 0.0 0.0 97-Gold,non-monetary 184 2,445 1,595 1,135 1,007 0.3 1.9 0.9 0.7 0.6 9X-Res: Commodities & trans. not classified 0 0 0 0 0 0.0 0.0 0.0 0.0 0.0Source: Statistics Canada (2004)

Table 2-1-13 (continued). Major Importing Commodities: Korea (Millions of US Dollars and Percent)Imports Share
Commodity category (classification: SITC 2-digit) 1990 1995 2000 2001 2002 1990 1995 2000 2001 2002Total 64,412 127,180 151,711 129,163 145,126 100.0 100.0 100.0 100.0 100.0 00-Live animals chiefly for food 10 20 13 14 15 0.0 0.0 0.0 0.0 0.0 01-Meat and meat preparations 317 745 1,102 877 1,308 0.5 0.6 0.7 0.7 0.9 02-Dairy products and birds' eggs 15 119 131 163 162 0.0 0.1 0.1 0.1 0.1 03-Fish, crustaceans, and mollucs 210 769 1,256 1,632 1,740 0.3 0.6 0.8 1.3 1.2 04-Cereals and cereal preparations 1,157 1,945 1,551 1,574 1,697 1.8 1.5 1.0 1.2 1.2 05-Vegetables and fruit 242 476 534 578 610 0.4 0.4 0.4 0.4 0.4 06-Sugars,sugar preparations and honey 198 502 214 325 287 0.3 0.4 0.1 0.3 0.2 07-Coffee, tea, cocoa, and spices 146 298 225 197 216 0.2 0.2 0.1 0.2 0.1 08-Feeding stuff for animals 186 476 499 609 609 0.3 0.4 0.3 0.5 0.4 09-Miscl.edible products and preparations 52 202 288 367 425 0.1 0.2 0.2 0.3 0.3 11-Beverages 47 167 271 320 405 0.1 0.1 0.2 0.2 0.3 12-Tobacco and tobacco manufactures 154 795 288 291 329 0.2 0.6 0.2 0.2 0.2 21-Hides, skins, and furskins 1,218 1,093 760 787 646 1.9 0.9 0.5 0.6 0.4 22-Oil-seeds and oleaginous fruits 282 478 398 377 403 0.4 0.4 0.3 0.3 0.3 23-Crude rubber 425 718 453 431 473 0.7 0.6 0.3 0.3 0.3 24-Cork and wood 873 1,360 719 648 726 1.4 1.1 0.5 0.5 0.5 25-Pulp and waste paper 764 1,734 1,450 910 1,034 1.2 1.4 1.0 0.7 0.7 26-Textile fibres (except wool tops) 1,294 1,353 724 767 686 2.0 1.1 0.5 0.6 0.5 27-Crude fertilizers and crude materials 228 394 365 363 379 0.4 0.3 0.2 0.3 0.3 28-Metalliferous ores and metal scrap 1,902 2,789 3,320 3,188 3,475 3.0 2.2 2.2 2.5 2.4 29-Crude animal and vegetable materials, n.e.s 222 326 280 257 305 0.3 0.3 0.2 0.2 0.2 2X-Res: Crude materials, inedible, except fuel 0 0 0 0 0 0.0 0.0 0.0 0.0 0.0 32-Coal,coke and briquettes 941 1,761 1,752 2,057 2,040 1.5 1.4 1.2 1.6 1.4 33-Petroleum, and petroleum products 7,696 14,296 24,940 15,003 17,157 11.9 11.2 16.4 11.6 11.8 34-Gas, natural and manufactured 743 1,849 3,951 4,587 4,588 1.2 1.5 2.6 3.6 3.2 35-Electric current 0 0 0 0 0 0.0 0.0 0.0 0.0 0.0 3X-Res: Mineral fuels, and lubricants 0 0 0 0 0 0.0 0.0 0.0 0.0 0.0 41-Animal oils and fats 34 59 34 28 42 0.1 0.0 0.0 0.0 0.0 42-Fixed vegetable oils and fats 101 218 184 177 232 0.2 0.2 0.1 0.1 0.2 43-Animal or vegetable oils and fats 33 73 68 64 80 0.1 0.1 0.0 0.0 0.1 51-Organic chemicals 3,065 5,031 4,220 4,073 4,022 4.8 4.0 2.8 3.2 2.8 52-Inorganic chemicals 610 1,154 1,201 1,193 1,154 0.9 0.9 0.8 0.9 0.8 53-Dyeing,tanning and colouring materials 668 906 883 886 987 1.0 0.7 0.6 0.7 0.7 54-Medicinal and pharmaceutical products 286 686 807 983 1,195 0.4 0.5 0.5 0.8 0.8 55-Essential oils & perfume mat.;toilet prep. 272 544 643 775 1,031 0.4 0.4 0.4 0.6 0.7 56-Fertilizers,manufactured 120 186 223 213 143 0.2 0.1 0.1 0.2 0.1 58-Artif.resins,plastic mat.,cellulose esters 1,118 1,881 1,944 1,829 2,113 1.7 1.5 1.3 1.4 1.5 59-Chemical materials and products,n.e.s. 795 1,819 2,032 1,987 2,217 1.2 1.4 1.3 1.5 1.5 5X-Res: Chemicals and related products, n.e.s. 0 0 0 0 0 0.0 0.0 0.0 0.0 0.0 61-Leather,leather manuf.,n.e.s. 752 949 667 772 799 1.2 0.7 0.4 0.6 0.6 62-Rubber manufactures,n.e.s. 152 329 317 308 421 0.2 0.3 0.2 0.2 0.3 63-Cork and wood manufactures 366 917 577 644 795 0.6 0.7 0.4 0.5 0.5 64-Paper,paperboard,artic.of paper,paper-pulp 428 917 740 704 925 0.7 0.7 0.5 0.5 0.6 65-Textile yarn,fabrics,made-upart. 2,015 4,082 3,509 3,257 3,465 3.1 3.2 2.3 2.5 2.4 66-Non-metallic mineral manufactures,n.e.s. 900 1,656 1,441 1,612 2,066 1.4 1.3 1.0 1.2 1.4 67-Iron and steel 2,635 6,377 5,117 4,121 5,380 4.1 5.0 3.4 3.2 3.7 68-Non-ferrous metals 1,625 4,114 4,266 3,651 3,686 2.5 3.2 2.8 2.8 2.5 69-Manufactures of metal,n.e.s. 766 1,292 1,191 1,195 1,422 1.2 1.0 0.8 0.9 1.0 6X-Res: Manufactured goods classified chiefly 0 0 0 0 0 0.0 0.0 0.0 0.0 0.0 71-Power generating machinery and equipment 1,447 3,547 2,482 2,251 2,946 2.2 2.8 1.6 1.7 2.0 72-Machinery specialized for particular industry 4,048 7,533 6,425 4,400 4,597 6.3 5.9 4.2 3.4 3.2 73-Metalworking machinery 1,163 1,958 1,270 1,043 958 1.8 1.5 0.8 0.8 0.7 74-General industrial machinery & equipment 3,892 7,186 4,461 3,946 4,681 6.0 5.7 2.9 3.1 3.2 75-Office machines & automatic data processing 1,702 3,378 7,586 5,466 5,768 2.6 2.7 5.0 4.2 4.0 76-Telecommunications 1,203 2,810 4,964 4,523 4,951 1.9 2.2 3.3 3.5 3.4 77-Electrical machinery,apparatus & appliance 6,482 14,329 28,172 22,298 24,889 10.1 11.3 18.6 17.3 17.1 78-Road vehicles 999 2,211 1,900 2,028 2,914 1.6 1.7 1.3 1.6 2.0 79-Other transport equipment 1,665 3,122 3,132 3,425 3,147 2.6 2.5 2.1 2.7 2.2 7X-Res: Machinery and transport equipment 0 0 0 0 0 0.0 0.0 0.0 0.0 0.0 81-Sanitary,plumbing,heating and lighting fix 92 92 87 112 158 0.1 0.1 0.1 0.1 0.1 82-Furniture and parts thereof 129 288 300 321 457 0.2 0.2 0.2 0.2 0.3 83-Travel goods and handbags 57 156 332 404 396 0.1 0.1 0.2 0.3 0.3 84-Articles of apparel and clothing accessories 168 1,162 1,492 1,872 2,423 0.3 0.9 1.0 1.4 1.7 85-Footwear 22 190 200 223 301 0.0 0.1 0.1 0.2 0.2 87-Professional, scientific & controling instruments 1,654 3,904 4,827 3,945 4,528 2.6 3.1 3.2 3.1 3.1 88-Photographic apparatus,optical goods,watch 867 2,166 2,243 1,898 2,119 1.3 1.7 1.5 1.5 1.5 89-Miscellaneous manufactured articles,n.e.s. 998 2,358 2,768 2,887 3,233 1.5 1.9 1.8 2.2 2.2 8X-Res: Miscellaneous manufactured articles 0 0 0 0 0 0.0 0.0 0.0 0.0 0.0 91-Postal packages 0 0 0 0 0 0.0 0.0 0.0 0.0 0.0 93-Special transactions & commod. 1,188 1,360 2,485 2,456 3,385 1.8 1.1 1.6 1.9 2.3 94-Animals,live,n.e.s.,incl. zoo-animals 2 7 3 4 5 0.0 0.0 0.0 0.0 0.0 95-Armoured fighting vehicles,arms of war 318 251 258 219 371 0.5 0.2 0.2 0.2 0.3 97-Gold,non-monetary 251 1,316 777 648 1,009 0.4 1.0 0.5 0.5 0.7 9X-Res: Commodities & trans. not classified 0 0 0 0 0 0.0 0.0 0.0 0.0 0.0Source: Statistics Canada (2004)

Table 2-1-14. Major Exporting Commodities: Thailand (Millions of US Dollars and Percent)Exports Share
Commodity category (classification: SITC 2-digit) 1990 1995 2000 2001 2002 1990 1995 2000 2001 2002Total 23,801 57,027 71,744 69,654 68,312 100.0 100.0 100.0 100.0 100.0 00-Live animals chiefly for food 2 7 5 6 6 0.0 0.0 0.0 0.0 0.0 01-Meat and meat preparations 324 557 813 1,067 1,080 1.4 1.0 1.1 1.5 1.6 02-Dairy products and birds' eggs 26 39 42 94 74 0.1 0.1 0.1 0.1 0.1 03-Fish, crustaceans, and mollucs 2,329 4,501 4,576 4,372 3,720 9.8 7.9 6.4 6.3 5.4 04-Cereals and cereal preparations 1,380 2,184 1,943 1,996 1,569 5.8 3.8 2.7 2.9 2.3 05-Vegetables and fruit 1,564 1,497 1,265 1,346 1,436 6.6 2.6 1.8 1.9 2.1 06-Sugars,sugar preparations and honey 777 1,280 767 862 577 3.3 2.2 1.1 1.2 0.8 07-Coffee, tea, cocoa, and spices 69 218 89 69 76 0.3 0.4 0.1 0.1 0.1 08-Feeding stuff for animals 156 239 306 292 311 0.7 0.4 0.4 0.4 0.5 09-Miscl.edible products and preparations 75 273 336 360 371 0.3 0.5 0.5 0.5 0.5 11-Beverages 31 87 106 110 82 0.1 0.2 0.1 0.2 0.1 12-Tobacco and tobacco manufactures 74 54 72 71 68 0.3 0.1 0.1 0.1 0.1 21-Hides, skins, and furskins 3 3 2 2 5 0.0 0.0 0.0 0.0 0.0 22-Oil-seeds and oleaginous fruits 19 11 9 10 5 0.1 0.0 0.0 0.0 0.0 23-Crude rubber 956 2,492 1,665 1,502 1,899 4.0 4.4 2.3 2.2 2.8 24-Cork and wood 58 108 167 177 265 0.2 0.2 0.2 0.3 0.4 25-Pulp and waste paper 2 77 181 130 86 0.0 0.1 0.3 0.2 0.1 26-Textile fibres (except wool tops) 89 216 262 248 250 0.4 0.4 0.4 0.4 0.4 27-Crude fertilizers and crude materials 99 142 319 273 114 0.4 0.2 0.4 0.4 0.2 28-Metalliferous ores and metal scrap 25 95 178 100 80 0.1 0.2 0.2 0.1 0.1 29-Crude animal and vegetable materials, n.e.s 106 123 136 133 192 0.4 0.2 0.2 0.2 0.3 2X-Res: Crude materials, inedible, except fuel 0 0 0 0 0 0.0 0.0 0.0 0.0 0.0 32-Coal,coke and briquettes 0 0 0 0 0 0.0 0.0 0.0 0.0 0.0 33-Petroleum, and petroleum products 91 260 1,865 1,655 1,463 0.4 0.5 2.6 2.4 2.1 34-Gas, natural and manufactured 108 154 277 210 129 0.5 0.3 0.4 0.3 0.2 35-Electric current 0 0 0 1 0 0.0 0.0 0.0 0.0 0.0 3X-Res: Mineral fuels, and lubricants 0 0 0 0 0 0.0 0.0 0.0 0.0 0.0 41-Animal oils and fats 0 1 2 1 1 0.0 0.0 0.0 0.0 0.0 42-Fixed vegetable oils and fats 6 9 43 86 59 0.0 0.0 0.1 0.1 0.1 43-Animal or vegetable oils and fats 1 12 34 27 16 0.0 0.0 0.0 0.0 0.0 51-Organic chemicals 56 240 884 677 645 0.2 0.4 1.2 1.0 0.9 52-Inorganic chemicals 17 65 98 104 141 0.1 0.1 0.1 0.1 0.2 53-Dyeing,tanning and colouring materials 31 463 107 106 103 0.1 0.8 0.1 0.2 0.2 54-Medicinal and pharmaceutical products 28 127 118 126 69 0.1 0.2 0.2 0.2 0.1 55-Essential oils & perfume mat.;toilet prep. 45 148 293 392 341 0.2 0.3 0.4 0.6 0.5 56-Fertilizers,manufactured 2 4 20 19 8 0.0 0.0 0.0 0.0 0.0 58-Artif.resins,plastic mat.,cellulose esters 137 719 2,168 2,014 2,049 0.6 1.3 3.0 2.9 3.0 59-Chemical materials and products,n.e.s. 140 378 465 487 521 0.6 0.7 0.6 0.7 0.8 5X-Res: Chemicals and related products, n.e.s. 0 0 0 0 0 0.0 0.0 0.0 0.0 0.0 61-Leather,leather manuf.,n.e.s. 255 478 453 435 279 1.1 0.8 0.6 0.6 0.4 62-Rubber manufactures,n.e.s. 173 440 705 786 742 0.7 0.8 1.0 1.1 1.1 63-Cork and wood manufactures 154 300 395 391 439 0.6 0.5 0.6 0.6 0.6 64-Paper,paperboard,artic.of paper,paper-pulp 50 346 691 711 643 0.2 0.6 1.0 1.0 0.9 65-Textile yarn,fabrics,made-upart. 963 2,008 2,032 1,986 1,579 4.0 3.5 2.8 2.9 2.3 66-Non-metallic mineral manufactures,n.e.s. 1,115 1,882 1,728 1,726 2,066 4.7 3.3 2.4 2.5 3.0 67-Iron and steel 144 489 957 687 659 0.6 0.9 1.3 1.0 1.0 68-Non-ferrous metals 119 113 394 351 259 0.5 0.2 0.5 0.5 0.4 69-Manufactures of metal,n.e.s. 290 729 1,047 1,028 952 1.2 1.3 1.5 1.5 1.4 6X-Res: Manufactured goods classified chiefly 0 0 0 0 0 0.0 0.0 0.0 0.0 0.0 71-Power generating machinery and equipment 114 541 1,279 1,281 1,355 0.5 0.9 1.8 1.8 2.0 72-Machinery specialized for particular industry 62 206 363 396 353 0.3 0.4 0.5 0.6 0.5 73-Metalworking machinery 33 100 123 84 108 0.1 0.2 0.2 0.1 0.2 74-General industrial machinery & equipment 419 1,711 2,115 2,228 2,190 1.8 3.0 2.9 3.2 3.2 75-Office machines & automatic data processing 1,608 5,586 9,007 8,432 9,247 6.8 9.8 12.6 12.1 13.5 76-Telecommunications 1,091 3,068 4,233 3,789 5,018 4.6 5.4 5.9 5.4 7.3 77-Electrical machinery,apparatus & appliance 1,659 6,441 11,433 9,956 8,796 7.0 11.3 15.9 14.3 12.9 78-Road vehicles 229 731 2,518 2,867 2,849 1.0 1.3 3.5 4.1 4.2 79-Other transport equipment 7 637 113 54 37 0.0 1.1 0.2 0.1 0.1 7X-Res: Machinery and transport equipment 0 0 0 0 0 0.0 0.0 0.0 0.0 0.0 81-Sanitary,plumbing,heating and lighting fix 43 153 170 170 157 0.2 0.3 0.2 0.2 0.2 82-Furniture and parts thereof 321 762 1,002 937 1,132 1.3 1.3 1.4 1.3 1.7 83-Travel goods and handbags 241 458 505 478 364 1.0 0.8 0.7 0.7 0.5 84-Articles of apparel and clothing accessories 2,914 5,099 4,001 3,922 4,071 12.2 8.9 5.6 5.6 6.0 85-Footwear 767 2,112 823 848 878 3.2 3.7 1.1 1.2 1.3 87-Professional, scientific & controling instruments 67 316 502 546 816 0.3 0.6 0.7 0.8 1.2 88-Photographic apparatus,optical goods,watch 250 860 918 923 1,058 1.0 1.5 1.3 1.3 1.5 89-Miscellaneous manufactured articles,n.e.s. 1,604 4,115 2,838 3,024 3,200 6.7 7.2 4.0 4.3 4.7 8X-Res: Miscellaneous manufactured articles 0 0 0 0 0 0.0 0.0 0.0 0.0 0.0 91-Postal packages 0 0 0 0 0 0.0 0.0 0.0 0.0 0.0 93-Special transactions & commod. 281 486 1,715 2,425 1,171 1.2 0.9 2.4 3.5 1.7 94-Animals,live,n.e.s.,incl. zoo-animals 1 4 26 20 14 0.0 0.0 0.0 0.0 0.0 95-Armoured fighting vehicles,arms of war 1 6 3 5 0 0.0 0.0 0.0 0.0 0.0 97-Gold,non-monetary 2 63 43 44 74 0.0 0.1 0.1 0.1 0.1 9X-Res: Commodities & trans. not classified 0 0 0 0 0 0.0 0.0 0.0 0.0 0.0Source: Statistics Canada (2004)

Table 2-1-14 (continued). Major Importing Commodities: Thailand (Millions of US Dollars and Percent)Imports Share
Commodity category (classification: SITC 2-digit) 1990 1995 2000 2001 2002 1990 1995 2000 2001 2002Total 32,064 70,738 59,709 58,005 53,332 100.0 100.0 100.0 100.0 100.0 00-Live animals chiefly for food 20 21 21 25 20 0.1 0.0 0.0 0.0 0.0 01-Meat and meat preparations 5 8 8 7 16 0.0 0.0 0.0 0.0 0.0 02-Dairy products and birds' eggs 94 269 249 289 277 0.3 0.4 0.4 0.5 0.5 03-Fish, crustaceans, and mollucs 525 550 549 794 436 1.6 0.8 0.9 1.4 0.8 04-Cereals and cereal preparations 141 333 281 301 283 0.4 0.5 0.5 0.5 0.5 05-Vegetables and fruit 54 161 105 120 146 0.2 0.2 0.2 0.2 0.3 06-Sugars,sugar preparations and honey 4 15 20 29 33 0.0 0.0 0.0 0.0 0.1 07-Coffee, tea, cocoa, and spices 21 49 58 57 88 0.1 0.1 0.1 0.1 0.2 08-Feeding stuff for animals 171 457 443 509 458 0.5 0.6 0.7 0.9 0.9 09-Miscl.edible products and preparations 27 85 92 92 117 0.1 0.1 0.2 0.2 0.2 11-Beverages 151 188 126 130 160 0.5 0.3 0.2 0.2 0.3 12-Tobacco and tobacco manufactures 84 126 113 127 119 0.3 0.2 0.2 0.2 0.2 21-Hides, skins, and furskins 118 174 139 186 109 0.4 0.2 0.2 0.3 0.2 22-Oil-seeds and oleaginous fruits 11 72 283 297 295 0.0 0.1 0.5 0.5 0.6 23-Crude rubber 67 145 132 135 154 0.2 0.2 0.2 0.2 0.3 24-Cork and wood 455 874 310 281 173 1.4 1.2 0.5 0.5 0.3 25-Pulp and waste paper 112 450 304 221 242 0.3 0.6 0.5 0.4 0.5 26-Textile fibres (except wool tops) 568 843 568 547 512 1.8 1.2 1.0 0.9 1.0 27-Crude fertilizers and crude materials 114 174 121 112 129 0.4 0.2 0.2 0.2 0.2 28-Metalliferous ores and metal scrap 177 254 235 266 192 0.6 0.4 0.4 0.5 0.4 29-Crude animal and vegetable materials, n.e.s 49 94 62 79 68 0.2 0.1 0.1 0.1 0.1 2X-Res: Crude materials, inedible, except fuel 0 0 0 0 0 0.0 0.0 0.0 0.0 0.0 32-Coal,coke and briquettes 24 70 134 151 95 0.1 0.1 0.2 0.3 0.2 33-Petroleum, and petroleum products 3,217 4,439 5,819 4,232 2,384 10.0 6.3 9.7 7.3 4.5 34-Gas, natural and manufactured 51 9 115 652 12 0.2 0.0 0.2 1.1 0.0 35-Electric current 0 0 1 0 1 0.0 0.0 0.0 0.0 0.0 3X-Res: Mineral fuels, and lubricants 0 0 0 0 0 0.0 0.0 0.0 0.0 0.0 41-Animal oils and fats 3 9 5 6 6 0.0 0.0 0.0 0.0 0.0 42-Fixed vegetable oils and fats 9 41 20 22 32 0.0 0.1 0.0 0.0 0.1 43-Animal or vegetable oils and fats 9 31 33 35 32 0.0 0.0 0.1 0.1 0.1 51-Organic chemicals 859 2,246 1,566 1,524 1,464 2.7 3.2 2.6 2.6 2.7 52-Inorganic chemicals 207 362 394 449 428 0.6 0.5 0.7 0.8 0.8 53-Dyeing,tanning and colouring materials 316 536 420 416 458 1.0 0.8 0.7 0.7 0.9 54-Medicinal and pharmaceutical products 219 543 522 579 557 0.7 0.8 0.9 1.0 1.0 55-Essential oils & perfume mat.;toilet prep. 146 287 343 392 393 0.5 0.4 0.6 0.7 0.7 56-Fertilizers,manufactured 424 541 343 407 265 1.3 0.8 0.6 0.7 0.5 58-Artif.resins,plastic mat.,cellulose esters 707 1,366 1,353 1,251 1,248 2.2 1.9 2.3 2.2 2.3 59-Chemical materials and products,n.e.s. 362 840 959 966 924 1.1 1.2 1.6 1.7 1.7 5X-Res: Chemicals and related products, n.e.s. 0 0 0 0 0 0.0 0.0 0.0 0.0 0.0 61-Leather,leather manuf.,n.e.s. 186 336 284 281 205 0.6 0.5 0.5 0.5 0.4 62-Rubber manufactures,n.e.s. 125 316 300 297 230 0.4 0.4 0.5 0.5 0.4 63-Cork and wood manufactures 25 87 46 50 50 0.1 0.1 0.1 0.1 0.1 64-Paper,paperboard,artic.of paper,paper-pulp 291 718 466 462 473 0.9 1.0 0.8 0.8 0.9 65-Textile yarn,fabrics,made-upart. 935 1,616 1,717 1,636 1,234 2.9 2.3 2.9 2.8 2.3 66-Non-metallic mineral manufactures,n.e.s. 1,412 1,986 1,657 1,600 1,642 4.4 2.8 2.8 2.8 3.1 67-Iron and steel 2,465 4,998 2,562 2,290 2,699 7.7 7.1 4.3 3.9 5.1 68-Non-ferrous metals 686 1,726 1,443 1,435 1,343 2.1 2.4 2.4 2.5 2.5 69-Manufactures of metal,n.e.s. 614 1,775 1,377 1,423 842 1.9 2.5 2.3 2.5 1.6 6X-Res: Manufactured goods classified chiefly 0 0 0 0 11 0.0 0.0 0.0 0.0 0.0 71-Power generating machinery and equipment 1,228 1,754 1,275 1,483 1,525 3.8 2.5 2.1 2.6 2.9 72-Machinery specialized for particular industry 2,281 4,487 2,227 2,321 2,232 7.1 6.3 3.7 4.0 4.2 73-Metalworking machinery 434 1,042 562 564 602 1.4 1.5 0.9 1.0 1.1 74-General industrial machinery & equipment 1,681 4,745 2,492 2,628 2,690 5.2 6.7 4.2 4.5 5.0 75-Office machines & automatic data processing 948 2,802 4,139 4,036 3,804 3.0 4.0 6.9 7.0 7.1 76-Telecommunications 1,098 2,774 2,106 2,959 3,256 3.4 3.9 3.5 5.1 6.1 77-Electrical machinery,apparatus & appliance 2,664 9,699 13,172 10,878 9,367 8.3 13.7 22.1 18.8 17.6 78-Road vehicles 2,371 5,371 1,948 1,967 2,317 7.4 7.6 3.3 3.4 4.3 79-Other transport equipment 1,020 1,871 816 1,069 797 3.2 2.6 1.4 1.8 1.5 7X-Res: Machinery and transport equipment 0 0 0 0 48 0.0 0.0 0.0 0.0 0.1 81-Sanitary,plumbing,heating and lighting fix 23 67 38 42 38 0.1 0.1 0.1 0.1 0.1 82-Furniture and parts thereof 24 76 72 102 99 0.1 0.1 0.1 0.2 0.2 83-Travel goods and handbags 7 23 43 46 30 0.0 0.0 0.1 0.1 0.1 84-Articles of apparel and clothing accessories 34 104 180 162 159 0.1 0.1 0.3 0.3 0.3 85-Footwear 7 21 39 34 35 0.0 0.0 0.1 0.1 0.1 87-Professional, scientific & controling instruments 361 1,098 932 908 1,030 1.1 1.6 1.6 1.6 1.9 88-Photographic apparatus,optical goods,watch 382 828 641 621 602 1.2 1.2 1.1 1.1 1.1 89-Miscellaneous manufactured articles,n.e.s. 628 1,967 1,809 1,733 1,508 2.0 2.8 3.0 3.0 2.8 8X-Res: Miscellaneous manufactured articles 0 0 0 0 6 0.0 0.0 0.0 0.0 0.0 91-Postal packages 0 0 0 0 0 0.0 0.0 0.0 0.0 0.0 93-Special transactions & commod. 452 1,373 883 985 1,677 1.4 1.9 1.5 1.7 3.1 94-Animals,live,n.e.s.,incl. zoo-animals 0 1 1 2 3 0.0 0.0 0.0 0.0 0.0 95-Armoured fighting vehicles,arms of war 106 114 67 10 8 0.3 0.2 0.1 0.0 0.0 97-Gold,non-monetary 57 301 170 297 446 0.2 0.4 0.3 0.5 0.8 9X-Res: Commodities & trans. not classified 0 0 0 0 0 0.0 0.0 0.0 0.0 0.0Source: Statistics Canada (2004)

Table 2-1-15. Major Exporting Commodities: Brazil (Millions of US Dollars and Percent)Exports Share
Commodity category (classification: SITC 2-digit) 1990 1995 2000 2001 2002 1990 1995 2000 2001 2002Total 33,437 49,577 58,019 60,964 63,604 100.0 100.0 100.0 100.0 100.0 00-Live animals chiefly for food 4 5 6 5 5 0.0 0.0 0.0 0.0 0.0 01-Meat and meat preparations 673 1,397 2,031 3,049 3,328 2.0 2.8 3.5 5.0 5.2 02-Dairy products and birds' eggs 3 10 25 41 52 0.0 0.0 0.0 0.1 0.1 03-Fish, crustaceans, and mollucs 151 172 253 301 364 0.5 0.3 0.4 0.5 0.6 04-Cereals and cereal preparations 6 45 74 606 348 0.0 0.1 0.1 1.0 0.5 05-Vegetables and fruit 1,850 1,562 1,588 1,331 1,571 5.5 3.2 2.7 2.2 2.5 06-Sugars,sugar preparations and honey 560 2,099 1,360 2,310 2,188 1.7 4.2 2.3 3.8 3.4 07-Coffee, tea, cocoa, and spices 1,876 2,974 2,188 1,824 1,820 5.6 6.0 3.8 3.0 2.9 08-Feeding stuff for animals 1,842 2,288 1,814 2,260 2,371 5.5 4.6 3.1 3.7 3.7 09-Miscl.edible products and preparations 14 40 379 303 177 0.0 0.1 0.7 0.5 0.3 11-Beverages 52 103 73 60 35 0.2 0.2 0.1 0.1 0.1 12-Tobacco and tobacco manufactures 674 1,232 889 1,001 1,079 2.0 2.5 1.5 1.6 1.7 21-Hides, skins, and furskins 1 15 4 9 8 0.0 0.0 0.0 0.0 0.0 22-Oil-seeds and oleaginous fruits 971 815 2,313 2,891 3,228 2.9 1.6 4.0 4.7 5.1 23-Crude rubber 24 125 121 118 148 0.1 0.3 0.2 0.2 0.2 24-Cork and wood 161 523 744 731 810 0.5 1.1 1.3 1.2 1.3 25-Pulp and waste paper 604 1,463 1,668 1,295 1,223 1.8 3.0 2.9 2.1 1.9 26-Textile fibres (except wool tops) 234 175 79 211 161 0.7 0.4 0.1 0.3 0.3 27-Crude fertilizers and crude materials 148 144 294 278 299 0.4 0.3 0.5 0.5 0.5 28-Metalliferous ores and metal scrap 2,933 3,041 3,758 3,605 3,664 8.8 6.1 6.5 5.9 5.8 29-Crude animal and vegetable materials, n.e.s 62 138 148 161 185 0.2 0.3 0.3 0.3 0.3 2X-Res: Crude materials, inedible, except fuel 0 0 0 0 0 0.0 0.0 0.0 0.0 0.0 32-Coal,coke and briquettes 0 0 0 0 0 0.0 0.0 0.0 0.0 0.0 33-Petroleum, and petroleum products 721 434 930 2,075 3,015 2.2 0.9 1.6 3.4 4.7 34-Gas, natural and manufactured 1 0 2 1 21 0.0 0.0 0.0 0.0 0.0 35-Electric current 0 2 3 3 0 0.0 0.0 0.0 0.0 0.0 3X-Res: Mineral fuels, and lubricants 0 0 0 0 0 0.0 0.0 0.0 0.0 0.0 41-Animal oils and fats 0 3 4 11 9 0.0 0.0 0.0 0.0 0.0 42-Fixed vegetable oils and fats 443 1,183 406 577 873 1.3 2.4 0.7 0.9 1.4 43-Animal or vegetable oils and fats 73 131 82 73 64 0.2 0.3 0.1 0.1 0.1 51-Organic chemicals 763 1,155 1,224 1,022 1,314 2.3 2.3 2.1 1.7 2.1 52-Inorganic chemicals 237 332 385 346 351 0.7 0.7 0.7 0.6 0.6 53-Dyeing,tanning and colouring materials 58 169 216 194 151 0.2 0.3 0.4 0.3 0.2 54-Medicinal and pharmaceutical products 82 180 279 292 303 0.2 0.4 0.5 0.5 0.5 55-Essential oils & perfume mat.;toilet prep. 70 211 240 249 295 0.2 0.4 0.4 0.4 0.5 56-Fertilizers,manufactured 41 66 54 60 78 0.1 0.1 0.1 0.1 0.1 58-Artif.resins,plastic mat.,cellulose esters 493 740 814 663 678 1.5 1.5 1.4 1.1 1.1 59-Chemical materials and products,n.e.s. 220 385 447 474 543 0.7 0.8 0.8 0.8 0.9 5X-Res: Chemicals and related products, n.e.s. 0 0 0 0 0 0.0 0.0 0.0 0.0 0.0 61-Leather,leather manuf.,n.e.s. 407 729 916 1,058 1,182 1.2 1.5 1.6 1.7 1.9 62-Rubber manufactures,n.e.s. 303 614 695 643 659 0.9 1.2 1.2 1.1 1.0 63-Cork and wood manufactures 217 611 764 793 985 0.6 1.2 1.3 1.3 1.5 64-Paper,paperboard,artic.of paper,paper-pulp 747 1,425 1,050 1,053 1,038 2.2 2.9 1.8 1.7 1.6 65-Textile yarn,fabrics,made-upart. 864 1,100 957 913 906 2.6 2.2 1.6 1.5 1.4 66-Non-metallic mineral manufactures,n.e.s. 392 764 956 919 1,030 1.2 1.5 1.6 1.5 1.6 67-Iron and steel 3,871 4,666 3,868 3,353 4,138 11.6 9.4 6.7 5.5 6.5 68-Non-ferrous metals 1,446 1,992 1,819 1,391 1,640 4.3 4.0 3.1 2.3 2.6 69-Manufactures of metal,n.e.s. 371 719 712 743 661 1.1 1.5 1.2 1.2 1.0 6X-Res: Manufactured goods classified chiefly 0 0 0 0 0 0.0 0.0 0.0 0.0 0.0 71-Power generating machinery and equipment 1,087 1,408 1,597 1,795 1,906 3.3 2.8 2.8 2.9 3.0 72-Machinery specialized for particular industry 647 1,059 968 1,053 1,152 1.9 2.1 1.7 1.7 1.8 73-Metalworking machinery 65 181 178 154 135 0.2 0.4 0.3 0.3 0.2 74-General industrial machinery & equipment 811 1,611 1,606 1,468 1,561 2.4 3.2 2.8 2.4 2.5 75-Office machines & automatic data processing 181 270 495 404 239 0.5 0.5 0.9 0.7 0.4 76-Telecommunications 472 392 1,711 1,883 1,828 1.4 0.8 2.9 3.1 2.9 77-Electrical machinery,apparatus & appliance 561 1,015 1,276 1,202 1,189 1.7 2.0 2.2 2.0 1.9 78-Road vehicles 1,684 2,856 4,546 4,556 4,535 5.0 5.8 7.8 7.5 7.1 79-Other transport equipment 732 591 3,826 3,837 3,017 2.2 1.2 6.6 6.3 4.7 7X-Res: Machinery and transport equipment 0 0 0 0 0 0.0 0.0 0.0 0.0 0.0 81-Sanitary,plumbing,heating and lighting fix 24 31 27 28 35 0.1 0.1 0.0 0.0 0.1 82-Furniture and parts thereof 49 360 543 536 596 0.1 0.7 0.9 0.9 0.9 83-Travel goods and handbags 9 8 6 5 6 0.0 0.0 0.0 0.0 0.0 84-Articles of apparel and clothing accessories 266 321 296 296 234 0.8 0.6 0.5 0.5 0.4 85-Footwear 1,193 1,523 1,641 1,708 1,542 3.6 3.1 2.8 2.8 2.4 87-Professional, scientific & controling instruments 95 161 304 331 291 0.3 0.3 0.5 0.5 0.5 88-Photographic apparatus,optical goods,watch 151 308 241 189 139 0.5 0.6 0.4 0.3 0.2 89-Miscellaneous manufactured articles,n.e.s. 320 447 593 612 655 1.0 0.9 1.0 1.0 1.0 8X-Res: Miscellaneous manufactured articles 0 0 0 0 0 0.0 0.0 0.0 0.0 0.0 91-Postal packages 0 0 0 0 0 0.0 0.0 0.0 0.0 0.0 93-Special transactions & commod. 406 668 1,132 1,253 1,109 1.2 1.3 2.0 2.1 1.7 94-Animals,live,n.e.s.,incl. zoo-animals 0 0 0 0 0 0.0 0.0 0.0 0.0 0.0 95-Armoured fighting vehicles,arms of war 4 6 3 2 63 0.0 0.0 0.0 0.0 0.1 97-Gold,non-monetary 16 382 396 355 372 0.0 0.8 0.7 0.6 0.6 9X-Res: Commodities & trans. not classified 0 0 0 0 0 0.0 0.0 0.0 0.0 0.0Source: Statistics Canada (2004)

Table 2-1-15 (continued). Major Importing Commodities: Brazil (Millions of US Dollars and Percent)Imports Share
Commodity category (classification: SITC 2-digit) 1990 1995 2000 2001 2002 1990 1995 2000 2001 2002Total 23,867 55,558 60,126 60,059 50,745 100.0 100.0 100.0 100.0 100.0 00-Live animals chiefly for food 106 172 37 22 32 0.4 0.3 0.1 0.0 0.1 01-Meat and meat preparations 312 233 130 71 88 1.3 0.4 0.2 0.1 0.2 02-Dairy products and birds' eggs 153 677 391 188 261 0.6 1.2 0.6 0.3 0.5 03-Fish, crustaceans, and mollucs 176 422 298 264 216 0.7 0.8 0.5 0.4 0.4 04-Cereals and cereal preparations 774 1,780 1,593 1,415 1,362 3.2 3.2 2.6 2.4 2.7 05-Vegetables and fruit 369 922 526 519 409 1.5 1.7 0.9 0.9 0.8 06-Sugars,sugar preparations and honey 15 61 49 36 25 0.1 0.1 0.1 0.1 0.0 07-Coffee, tea, cocoa, and spices 12 178 105 88 150 0.0 0.3 0.2 0.1 0.3 08-Feeding stuff for animals 7 45 69 78 129 0.0 0.1 0.1 0.1 0.3 09-Miscl.edible products and preparations 12 101 125 113 100 0.0 0.2 0.2 0.2 0.2 11-Beverages 77 360 145 153 129 0.3 0.6 0.2 0.3 0.3 12-Tobacco and tobacco manufactures 3 56 27 60 32 0.0 0.1 0.0 0.1 0.1 21-Hides, skins, and furskins 20 16 10 8 14 0.1 0.0 0.0 0.0 0.0 22-Oil-seeds and oleaginous fruits 26 159 150 145 180 0.1 0.3 0.2 0.2 0.4 23-Crude rubber 176 289 254 242 265 0.7 0.5 0.4 0.4 0.5 24-Cork and wood 23 17 14 12 11 0.1 0.0 0.0 0.0 0.0 25-Pulp and waste paper 63 189 253 199 192 0.3 0.3 0.4 0.3 0.4 26-Textile fibres (except wool tops) 214 672 356 143 121 0.9 1.2 0.6 0.2 0.2 27-Crude fertilizers and crude materials 134 172 200 164 164 0.6 0.3 0.3 0.3 0.3 28-Metalliferous ores and metal scrap 510 609 402 372 317 2.1 1.1 0.7 0.6 0.6 29-Crude animal and vegetable materials, n.e.s 52 107 128 121 124 0.2 0.2 0.2 0.2 0.2 2X-Res: Crude materials, inedible, except fuel 0 0 0 0 0 0.0 0.0 0.0 0.0 0.0 32-Coal,coke and briquettes 622 806 646 758 822 2.6 1.5 1.1 1.3 1.6 33-Petroleum, and petroleum products 5,056 5,641 6,786 5,751 5,534 21.2 10.2 11.3 9.6 10.9 34-Gas, natural and manufactured 183 339 600 786 715 0.8 0.6 1.0 1.3 1.4 35-Electric current 0 0 96 126 34 0.0 0.0 0.2 0.2 0.1 3X-Res: Mineral fuels, and lubricants 0 0 0 0 0 0.0 0.0 0.0 0.0 0.0 41-Animal oils and fats 22 28 18 7 7 0.1 0.1 0.0 0.0 0.0 42-Fixed vegetable oils and fats 46 293 181 127 164 0.2 0.5 0.3 0.2 0.3 43-Animal or vegetable oils and fats 2 25 22 20 21 0.0 0.0 0.0 0.0 0.0 51-Organic chemicals 1,327 2,869 2,786 2,962 2,505 5.6 5.2 4.6 4.9 4.9 52-Inorganic chemicals 344 474 534 616 622 1.4 0.9 0.9 1.0 1.2 53-Dyeing,tanning and colouring materials 200 414 425 427 407 0.8 0.7 0.7 0.7 0.8 54-Medicinal and pharmaceutical products 370 933 1,731 1,808 1,830 1.6 1.7 2.9 3.0 3.6 55-Essential oils & perfume mat.;toilet prep. 75 275 348 342 306 0.3 0.5 0.6 0.6 0.6 56-Fertilizers,manufactured 352 587 1,071 1,048 968 1.5 1.1 1.8 1.7 1.9 58-Artif.resins,plastic mat.,cellulose esters 330 1,217 1,592 1,544 1,450 1.4 2.2 2.6 2.6 2.9 59-Chemical materials and products,n.e.s. 272 636 931 972 964 1.1 1.1 1.5 1.6 1.9 5X-Res: Chemicals and related products, n.e.s. 0 0 0 0 0 0.0 0.0 0.0 0.0 0.0 61-Leather,leather manuf.,n.e.s. 103 175 188 184 125 0.4 0.3 0.3 0.3 0.2 62-Rubber manufactures,n.e.s. 112 468 579 582 472 0.5 0.8 1.0 1.0 0.9 63-Cork and wood manufactures 15 36 54 51 39 0.1 0.1 0.1 0.1 0.1 64-Paper,paperboard,artic.of paper,paper-pulp 264 1,032 827 643 471 1.1 1.9 1.4 1.1 0.9 65-Textile yarn,fabrics,made-upart. 269 1,375 1,203 1,055 895 1.1 2.5 2.0 1.8 1.8 66-Non-metallic mineral manufactures,n.e.s. 181 478 439 542 396 0.8 0.9 0.7 0.9 0.8 67-Iron and steel 296 467 655 728 597 1.2 0.8 1.1 1.2 1.2 68-Non-ferrous metals 393 933 1,057 1,082 785 1.6 1.7 1.8 1.8 1.5 69-Manufactures of metal,n.e.s. 261 741 763 818 785 1.1 1.3 1.3 1.4 1.5 6X-Res: Manufactured goods classified chiefly 0 0 0 0 0 0.0 0.0 0.0 0.0 0.0 71-Power generating machinery and equipment 808 1,273 2,319 3,635 3,156 3.4 2.3 3.9 6.1 6.2 72-Machinery specialized for particular industry 1,254 3,137 2,760 2,753 2,204 5.3 5.6 4.6 4.6 4.3 73-Metalworking machinery 290 614 478 577 421 1.2 1.1 0.8 1.0 0.8 74-General industrial machinery & equipment 943 2,526 2,661 3,000 2,719 4.0 4.5 4.4 5.0 5.4 75-Office machines & automatic data processing 525 1,838 2,779 2,547 1,830 2.2 3.3 4.6 4.2 3.6 76-Telecommunications 794 2,734 3,768 3,455 1,969 3.3 4.9 6.3 5.8 3.9 77-Electrical machinery,apparatus & appliance 1,423 3,520 5,331 4,975 3,639 6.0 6.3 8.9 8.3 7.2 78-Road vehicles 675 6,464 4,381 4,279 3,215 2.8 11.6 7.3 7.1 6.3 79-Other transport equipment 1,145 1,045 1,955 2,140 1,871 4.8 1.9 3.3 3.6 3.7 7X-Res: Machinery and transport equipment 0 0 0 0 0 0.0 0.0 0.0 0.0 0.0 81-Sanitary,plumbing,heating and lighting fix 6 35 44 45 26 0.0 0.1 0.1 0.1 0.1 82-Furniture and parts thereof 14 148 203 210 145 0.1 0.3 0.3 0.3 0.3 83-Travel goods and handbags 8 72 66 66 67 0.0 0.1 0.1 0.1 0.1 84-Articles of apparel and clothing accessories 62 364 237 248 183 0.3 0.7 0.4 0.4 0.4 85-Footwear 25 213 51 59 54 0.1 0.4 0.1 0.1 0.1 87-Professional, scientific & controling instruments 581 1,125 1,663 1,793 1,464 2.4 2.0 2.8 3.0 2.9 88-Photographic apparatus,optical goods,watch 311 788 623 603 526 1.3 1.4 1.0 1.0 1.0 89-Miscellaneous manufactured articles,n.e.s. 404 1,653 1,263 1,164 1,099 1.7 3.0 2.1 1.9 2.2 8X-Res: Miscellaneous manufactured articles 0 0 0 0 0 0.0 0.0 0.0 0.0 0.0 91-Postal packages 0 0 0 0 0 0.0 0.0 0.0 0.0 0.0 93-Special transactions & commod. 262 501 710 1,071 903 1.1 0.9 1.2 1.8 1.8 94-Animals,live,n.e.s.,incl. zoo-animals 1 1 2 1 2 0.0 0.0 0.0 0.0 0.0 95-Armoured fighting vehicles,arms of war 5 22 17 15 6 0.0 0.0 0.0 0.0 0.0 97-Gold,non-monetary 3 3 20 31 12 0.0 0.0 0.0 0.1 0.0 9X-Res: Commodities & trans. not classified 0 0 0 0 0 0.0 0.0 0.0 0.0 0.0Source: Statistics Canada (2004)

Table 2-1-16. Major Exporting Commodities: Chile (Millions of US Dollars and Percent)Exports Share
Commodity category (classification: SITC 2-digit) 1990 1995 2000 2001 2002 1990 1995 2000 2001 2002Total 9,031 17,023 19,141 19,630 18,428 100.0 100.0 100.0 100.0 100.0 00-Live animals chiefly for food 5 7 12 12 8 0.1 0.0 0.1 0.1 0.0 01-Meat and meat preparations 22 30 106 167 184 0.2 0.2 0.6 0.8 1.0 02-Dairy products and birds' eggs 7 36 30 56 43 0.1 0.2 0.2 0.3 0.2 03-Fish, crustaceans, and mollucs 503 1,103 1,637 1,714 1,633 5.6 6.5 8.6 8.7 8.9 04-Cereals and cereal preparations 61 100 121 140 146 0.7 0.6 0.6 0.7 0.8 05-Vegetables and fruit 964 1,485 1,628 1,703 1,779 10.7 8.7 8.5 8.7 9.7 06-Sugars,sugar preparations and honey 10 33 25 30 24 0.1 0.2 0.1 0.2 0.1 07-Coffee, tea, cocoa, and spices 10 50 53 72 55 0.1 0.3 0.3 0.4 0.3 08-Feeding stuff for animals 416 715 270 343 366 4.6 4.2 1.4 1.7 2.0 09-Miscl.edible products and preparations 7 188 127 178 161 0.1 1.1 0.7 0.9 0.9 11-Beverages 58 204 626 696 654 0.6 1.2 3.3 3.5 3.5 12-Tobacco and tobacco manufactures 12 15 14 18 12 0.1 0.1 0.1 0.1 0.1 21-Hides, skins, and furskins 6 3 2 3 5 0.1 0.0 0.0 0.0 0.0 22-Oil-seeds and oleaginous fruits 1 10 16 5 4 0.0 0.1 0.1 0.0 0.0 23-Crude rubber 1 3 4 4 5 0.0 0.0 0.0 0.0 0.0 24-Cork and wood 409 759 682 826 801 4.5 4.5 3.6 4.2 4.3 25-Pulp and waste paper 293 1,284 1,174 1,075 848 3.2 7.5 6.1 5.5 4.6 26-Textile fibres (except wool tops) 21 12 4 5 5 0.2 0.1 0.0 0.0 0.0 27-Crude fertilizers and crude materials 57 65 70 89 73 0.6 0.4 0.4 0.5 0.4 28-Metalliferous ores and metal scrap 925 2,699 2,983 2,754 2,357 10.2 15.9 15.6 14.0 12.8 29-Crude animal and vegetable materials, n.e.s 89 172 212 216 188 1.0 1.0 1.1 1.1 1.0 2X-Res: Crude materials, inedible, except fuel 0 0 0 0 0 0.0 0.0 0.0 0.0 0.0 32-Coal,coke and briquettes 0 1 2 0 2 0.0 0.0 0.0 0.0 0.0 33-Petroleum, and petroleum products 46 29 188 263 197 0.5 0.2 1.0 1.3 1.1 34-Gas, natural and manufactured 0 12 25 23 19 0.0 0.1 0.1 0.1 0.1 35-Electric current 0 0 0 0 0 0.0 0.0 0.0 0.0 0.0 3X-Res: Mineral fuels, and lubricants 0 0 0 0 0 0.0 0.0 0.0 0.0 0.0 41-Animal oils and fats 15 54 5 5 14 0.2 0.3 0.0 0.0 0.1 42-Fixed vegetable oils and fats 1 2 3 3 3 0.0 0.0 0.0 0.0 0.0 43-Animal or vegetable oils and fats 1 28 4 7 1 0.0 0.2 0.0 0.0 0.0 51-Organic chemicals 82 181 349 414 356 0.9 1.1 1.8 2.1 1.9 52-Inorganic chemicals 141 243 365 393 388 1.6 1.4 1.9 2.0 2.1 53-Dyeing,tanning and colouring materials 2 7 7 7 6 0.0 0.0 0.0 0.0 0.0 54-Medicinal and pharmaceutical products 11 24 38 45 50 0.1 0.1 0.2 0.2 0.3 55-Essential oils & perfume mat.;toilet prep. 8 35 57 82 77 0.1 0.2 0.3 0.4 0.4 56-Fertilizers,manufactured 23 33 96 100 104 0.3 0.2 0.5 0.5 0.6 58-Artif.resins,plastic mat.,cellulose esters 10 23 87 98 92 0.1 0.1 0.5 0.5 0.5 59-Chemical materials and products,n.e.s. 8 29 48 56 51 0.1 0.2 0.3 0.3 0.3 5X-Res: Chemicals and related products, n.e.s. 0 0 0 0 0 0.0 0.0 0.0 0.0 0.0 61-Leather,leather manuf.,n.e.s. 2 16 29 30 25 0.0 0.1 0.2 0.2 0.1 62-Rubber manufactures,n.e.s. 28 72 85 96 91 0.3 0.4 0.4 0.5 0.5 63-Cork and wood manufactures 39 89 179 255 263 0.4 0.5 0.9 1.3 1.4 64-Paper,paperboard,artic.of paper,paper-pulp 105 256 377 463 415 1.2 1.5 2.0 2.4 2.3 65-Textile yarn,fabrics,made-upart. 39 99 128 128 95 0.4 0.6 0.7 0.7 0.5 66-Non-metallic mineral manufactures,n.e.s. 17 18 37 43 37 0.2 0.1 0.2 0.2 0.2 67-Iron and steel 70 102 99 94 107 0.8 0.6 0.5 0.5 0.6 68-Non-ferrous metals 3,862 5,313 5,457 5,173 5,057 42.8 31.2 28.5 26.4 27.4 69-Manufactures of metal,n.e.s. 30 75 115 113 82 0.3 0.4 0.6 0.6 0.4 6X-Res: Manufactured goods classified chiefly 0 0 0 0 0 0.0 0.0 0.0 0.0 0.0 71-Power generating machinery and equipment 2 4 20 13 16 0.0 0.0 0.1 0.1 0.1 72-Machinery specialized for particular industry 7 35 41 70 33 0.1 0.2 0.2 0.4 0.2 73-Metalworking machinery 0 1 1 1 3 0.0 0.0 0.0 0.0 0.0 74-General industrial machinery & equipment 9 50 63 71 66 0.1 0.3 0.3 0.4 0.4 75-Office machines & automatic data processing 1 7 16 18 16 0.0 0.0 0.1 0.1 0.1 76-Telecommunications 1 5 11 13 16 0.0 0.0 0.1 0.1 0.1 77-Electrical machinery,apparatus & appliance 10 40 71 81 47 0.1 0.2 0.4 0.4 0.3 78-Road vehicles 20 123 215 210 186 0.2 0.7 1.1 1.1 1.0 79-Other transport equipment 46 34 78 67 72 0.5 0.2 0.4 0.3 0.4 7X-Res: Machinery and transport equipment 0 0 0 0 0 0.0 0.0 0.0 0.0 0.0 81-Sanitary,plumbing,heating and lighting fix 9 13 17 20 17 0.1 0.1 0.1 0.1 0.1 82-Furniture and parts thereof 17 42 62 65 63 0.2 0.2 0.3 0.3 0.3 83-Travel goods and handbags 1 2 1 1 1 0.0 0.0 0.0 0.0 0.0 84-Articles of apparel and clothing accessories 41 70 39 47 33 0.5 0.4 0.2 0.2 0.2 85-Footwear 38 28 8 11 7 0.4 0.2 0.0 0.1 0.0 87-Professional, scientific & controling instruments 2 4 8 9 8 0.0 0.0 0.0 0.0 0.0 88-Photographic apparatus,optical goods,watch 2 4 3 3 3 0.0 0.0 0.0 0.0 0.0 89-Miscellaneous manufactured articles,n.e.s. 39 217 168 202 148 0.4 1.3 0.9 1.0 0.8 8X-Res: Miscellaneous manufactured articles 0 0 0 0 0 0.0 0.0 0.0 0.0 0.0 91-Postal packages 0 0 0 0 0 0.0 0.0 0.0 0.0 0.0 93-Special transactions & commod. 122 230 435 478 553 1.3 1.3 2.3 2.4 3.0 94-Animals,live,n.e.s.,incl. zoo-animals 1 2 2 1 1 0.0 0.0 0.0 0.0 0.0 95-Armoured fighting vehicles,arms of war 0 0 2 2 2 0.0 0.0 0.0 0.0 0.0 97-Gold,non-monetary 245 393 306 249 254 2.7 2.3 1.6 1.3 1.4 9X-Res: Commodities & trans. not classified 0 0 0 0 0 0.0 0.0 0.0 0.0 0.0Source: Statistics Canada (2004)
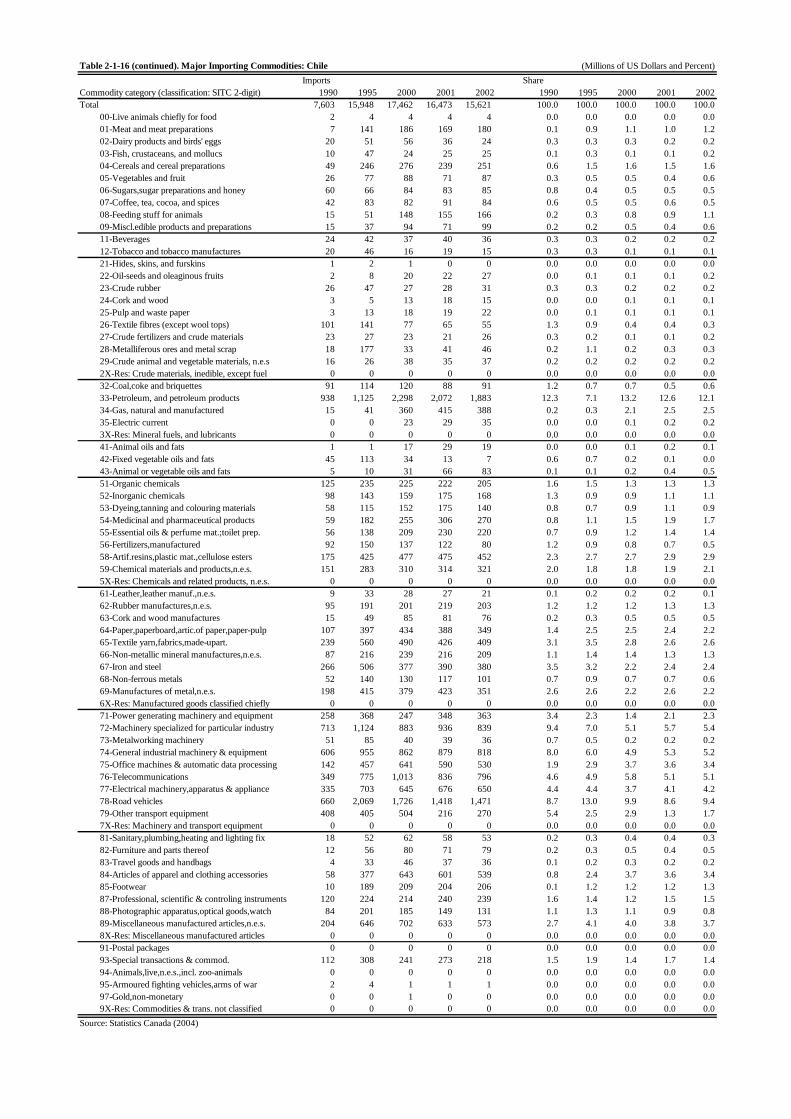
Table 2-1-16 (continued). Major Importing Commodities: Chile (Millions of US Dollars and Percent)Imports Share
Commodity category (classification: SITC 2-digit) 1990 1995 2000 2001 2002 1990 1995 2000 2001 2002Total 7,603 15,948 17,462 16,473 15,621 100.0 100.0 100.0 100.0 100.0 00-Live animals chiefly for food 2 4 4 4 4 0.0 0.0 0.0 0.0 0.0 01-Meat and meat preparations 7 141 186 169 180 0.1 0.9 1.1 1.0 1.2 02-Dairy products and birds' eggs 20 51 56 36 24 0.3 0.3 0.3 0.2 0.2 03-Fish, crustaceans, and mollucs 10 47 24 25 25 0.1 0.3 0.1 0.1 0.2 04-Cereals and cereal preparations 49 246 276 239 251 0.6 1.5 1.6 1.5 1.6 05-Vegetables and fruit 26 77 88 71 87 0.3 0.5 0.5 0.4 0.6 06-Sugars,sugar preparations and honey 60 66 84 83 85 0.8 0.4 0.5 0.5 0.5 07-Coffee, tea, cocoa, and spices 42 83 82 91 84 0.6 0.5 0.5 0.6 0.5 08-Feeding stuff for animals 15 51 148 155 166 0.2 0.3 0.8 0.9 1.1 09-Miscl.edible products and preparations 15 37 94 71 99 0.2 0.2 0.5 0.4 0.6 11-Beverages 24 42 37 40 36 0.3 0.3 0.2 0.2 0.2 12-Tobacco and tobacco manufactures 20 46 16 19 15 0.3 0.3 0.1 0.1 0.1 21-Hides, skins, and furskins 1 2 1 0 0 0.0 0.0 0.0 0.0 0.0 22-Oil-seeds and oleaginous fruits 2 8 20 22 27 0.0 0.1 0.1 0.1 0.2 23-Crude rubber 26 47 27 28 31 0.3 0.3 0.2 0.2 0.2 24-Cork and wood 3 5 13 18 15 0.0 0.0 0.1 0.1 0.1 25-Pulp and waste paper 3 13 18 19 22 0.0 0.1 0.1 0.1 0.1 26-Textile fibres (except wool tops) 101 141 77 65 55 1.3 0.9 0.4 0.4 0.3 27-Crude fertilizers and crude materials 23 27 23 21 26 0.3 0.2 0.1 0.1 0.2 28-Metalliferous ores and metal scrap 18 177 33 41 46 0.2 1.1 0.2 0.3 0.3 29-Crude animal and vegetable materials, n.e.s 16 26 38 35 37 0.2 0.2 0.2 0.2 0.2 2X-Res: Crude materials, inedible, except fuel 0 0 0 0 0 0.0 0.0 0.0 0.0 0.0 32-Coal,coke and briquettes 91 114 120 88 91 1.2 0.7 0.7 0.5 0.6 33-Petroleum, and petroleum products 938 1,125 2,298 2,072 1,883 12.3 7.1 13.2 12.6 12.1 34-Gas, natural and manufactured 15 41 360 415 388 0.2 0.3 2.1 2.5 2.5 35-Electric current 0 0 23 29 35 0.0 0.0 0.1 0.2 0.2 3X-Res: Mineral fuels, and lubricants 0 0 0 0 0 0.0 0.0 0.0 0.0 0.0 41-Animal oils and fats 1 1 17 29 19 0.0 0.0 0.1 0.2 0.1 42-Fixed vegetable oils and fats 45 113 34 13 7 0.6 0.7 0.2 0.1 0.0 43-Animal or vegetable oils and fats 5 10 31 66 83 0.1 0.1 0.2 0.4 0.5 51-Organic chemicals 125 235 225 222 205 1.6 1.5 1.3 1.3 1.3 52-Inorganic chemicals 98 143 159 175 168 1.3 0.9 0.9 1.1 1.1 53-Dyeing,tanning and colouring materials 58 115 152 175 140 0.8 0.7 0.9 1.1 0.9 54-Medicinal and pharmaceutical products 59 182 255 306 270 0.8 1.1 1.5 1.9 1.7 55-Essential oils & perfume mat.;toilet prep. 56 138 209 230 220 0.7 0.9 1.2 1.4 1.4 56-Fertilizers,manufactured 92 150 137 122 80 1.2 0.9 0.8 0.7 0.5 58-Artif.resins,plastic mat.,cellulose esters 175 425 477 475 452 2.3 2.7 2.7 2.9 2.9 59-Chemical materials and products,n.e.s. 151 283 310 314 321 2.0 1.8 1.8 1.9 2.1 5X-Res: Chemicals and related products, n.e.s. 0 0 0 0 0 0.0 0.0 0.0 0.0 0.0 61-Leather,leather manuf.,n.e.s. 9 33 28 27 21 0.1 0.2 0.2 0.2 0.1 62-Rubber manufactures,n.e.s. 95 191 201 219 203 1.2 1.2 1.2 1.3 1.3 63-Cork and wood manufactures 15 49 85 81 76 0.2 0.3 0.5 0.5 0.5 64-Paper,paperboard,artic.of paper,paper-pulp 107 397 434 388 349 1.4 2.5 2.5 2.4 2.2 65-Textile yarn,fabrics,made-upart. 239 560 490 426 409 3.1 3.5 2.8 2.6 2.6 66-Non-metallic mineral manufactures,n.e.s. 87 216 239 216 209 1.1 1.4 1.4 1.3 1.3 67-Iron and steel 266 506 377 390 380 3.5 3.2 2.2 2.4 2.4 68-Non-ferrous metals 52 140 130 117 101 0.7 0.9 0.7 0.7 0.6 69-Manufactures of metal,n.e.s. 198 415 379 423 351 2.6 2.6 2.2 2.6 2.2 6X-Res: Manufactured goods classified chiefly 0 0 0 0 0 0.0 0.0 0.0 0.0 0.0 71-Power generating machinery and equipment 258 368 247 348 363 3.4 2.3 1.4 2.1 2.3 72-Machinery specialized for particular industry 713 1,124 883 936 839 9.4 7.0 5.1 5.7 5.4 73-Metalworking machinery 51 85 40 39 36 0.7 0.5 0.2 0.2 0.2 74-General industrial machinery & equipment 606 955 862 879 818 8.0 6.0 4.9 5.3 5.2 75-Office machines & automatic data processing 142 457 641 590 530 1.9 2.9 3.7 3.6 3.4 76-Telecommunications 349 775 1,013 836 796 4.6 4.9 5.8 5.1 5.1 77-Electrical machinery,apparatus & appliance 335 703 645 676 650 4.4 4.4 3.7 4.1 4.2 78-Road vehicles 660 2,069 1,726 1,418 1,471 8.7 13.0 9.9 8.6 9.4 79-Other transport equipment 408 405 504 216 270 5.4 2.5 2.9 1.3 1.7 7X-Res: Machinery and transport equipment 0 0 0 0 0 0.0 0.0 0.0 0.0 0.0 81-Sanitary,plumbing,heating and lighting fix 18 52 62 58 53 0.2 0.3 0.4 0.4 0.3 82-Furniture and parts thereof 12 56 80 71 79 0.2 0.3 0.5 0.4 0.5 83-Travel goods and handbags 4 33 46 37 36 0.1 0.2 0.3 0.2 0.2 84-Articles of apparel and clothing accessories 58 377 643 601 539 0.8 2.4 3.7 3.6 3.4 85-Footwear 10 189 209 204 206 0.1 1.2 1.2 1.2 1.3 87-Professional, scientific & controling instruments 120 224 214 240 239 1.6 1.4 1.2 1.5 1.5 88-Photographic apparatus,optical goods,watch 84 201 185 149 131 1.1 1.3 1.1 0.9 0.8 89-Miscellaneous manufactured articles,n.e.s. 204 646 702 633 573 2.7 4.1 4.0 3.8 3.7 8X-Res: Miscellaneous manufactured articles 0 0 0 0 0 0.0 0.0 0.0 0.0 0.0 91-Postal packages 0 0 0 0 0 0.0 0.0 0.0 0.0 0.0 93-Special transactions & commod. 112 308 241 273 218 1.5 1.9 1.4 1.7 1.4 94-Animals,live,n.e.s.,incl. zoo-animals 0 0 0 0 0 0.0 0.0 0.0 0.0 0.0 95-Armoured fighting vehicles,arms of war 2 4 1 1 1 0.0 0.0 0.0 0.0 0.0 97-Gold,non-monetary 0 0 1 0 0 0.0 0.0 0.0 0.0 0.0 9X-Res: Commodities & trans. not classified 0 0 0 0 0 0.0 0.0 0.0 0.0 0.0Source: Statistics Canada (2004)

Table 2-1-17. Major Exporting Commodities: Mexico (Millions of US Dollars and Percent)Exports Share
Commodity category (classification: SITC 2-digit) 1990 1995 2000 2001 2002 1990 1995 2000 2001 2002Total 29,180 84,642 174,325 166,638 169,650 100.0 100.0 100.0 100.0 100.0 00-Live animals chiefly for food 393 577 442 434 326 1.3 0.7 0.3 0.3 0.2 01-Meat and meat preparations 40 75 254 271 247 0.1 0.1 0.1 0.2 0.1 02-Dairy products and birds' eggs 0 10 48 53 47 0.0 0.0 0.0 0.0 0.0 03-Fish, crustaceans, and mollucs 375 735 760 663 631 1.3 0.9 0.4 0.4 0.4 04-Cereals and cereal preparations 38 185 350 380 409 0.1 0.2 0.2 0.2 0.2 05-Vegetables and fruit 1,651 2,857 3,486 3,581 3,547 5.7 3.4 2.0 2.1 2.1 06-Sugars,sugar preparations and honey 64 270 325 318 417 0.2 0.3 0.2 0.2 0.2 07-Coffee, tea, cocoa, and spices 456 920 852 401 370 1.6 1.1 0.5 0.2 0.2 08-Feeding stuff for animals 3 15 25 40 46 0.0 0.0 0.0 0.0 0.0 09-Miscl.edible products and preparations 31 93 237 326 289 0.1 0.1 0.1 0.2 0.2 11-Beverages 305 563 1,602 1,733 2,038 1.0 0.7 0.9 1.0 1.2 12-Tobacco and tobacco manufactures 31 56 89 57 58 0.1 0.1 0.1 0.0 0.0 21-Hides, skins, and furskins 6 45 107 121 130 0.0 0.1 0.1 0.1 0.1 22-Oil-seeds and oleaginous fruits 42 23 35 27 15 0.1 0.0 0.0 0.0 0.0 23-Crude rubber 65 114 168 155 162 0.2 0.1 0.1 0.1 0.1 24-Cork and wood 116 179 145 119 109 0.4 0.2 0.1 0.1 0.1 25-Pulp and waste paper 7 26 46 28 27 0.0 0.0 0.0 0.0 0.0 26-Textile fibres (except wool tops) 186 655 343 279 317 0.6 0.8 0.2 0.2 0.2 27-Crude fertilizers and crude materials 354 287 249 216 209 1.2 0.3 0.1 0.1 0.1 28-Metalliferous ores and metal scrap 325 676 664 556 529 1.1 0.8 0.4 0.3 0.3 29-Crude animal and vegetable materials, n.e.s 77 118 178 170 172 0.3 0.1 0.1 0.1 0.1 2X-Res: Crude materials, inedible, except fuel 0 0 0 0 0 0.0 0.0 0.0 0.0 0.0 32-Coal,coke and briquettes 0 0 1 1 2 0.0 0.0 0.0 0.0 0.0 33-Petroleum, and petroleum products 10,285 8,522 16,789 13,163 15,094 35.2 10.1 9.6 7.9 8.9 34-Gas, natural and manufactured 280 160 83 125 22 1.0 0.2 0.0 0.1 0.0 35-Electric current 84 83 6 26 31 0.3 0.1 0.0 0.0 0.0 3X-Res: Mineral fuels, and lubricants 0 0 0 0 0 0.0 0.0 0.0 0.0 0.0 41-Animal oils and fats 1 3 6 5 5 0.0 0.0 0.0 0.0 0.0 42-Fixed vegetable oils and fats 12 46 44 31 27 0.0 0.1 0.0 0.0 0.0 43-Animal or vegetable oils and fats 4 6 10 9 9 0.0 0.0 0.0 0.0 0.0 51-Organic chemicals 593 1,281 1,054 914 935 2.0 1.5 0.6 0.5 0.6 52-Inorganic chemicals 402 438 468 407 421 1.4 0.5 0.3 0.2 0.2 53-Dyeing,tanning and colouring materials 113 251 287 361 374 0.4 0.3 0.2 0.2 0.2 54-Medicinal and pharmaceutical products 113 421 921 1,146 1,237 0.4 0.5 0.5 0.7 0.7 55-Essential oils & perfume mat.;toilet prep. 65 307 827 933 1,145 0.2 0.4 0.5 0.6 0.7 56-Fertilizers,manufactured 122 262 101 108 36 0.4 0.3 0.1 0.1 0.0 58-Artif.resins,plastic mat.,cellulose esters 386 876 1,160 1,118 1,140 1.3 1.0 0.7 0.7 0.7 59-Chemical materials and products,n.e.s. 133 263 649 606 533 0.5 0.3 0.4 0.4 0.3 5X-Res: Chemicals and related products, n.e.s. 0 0 0 0 0 0.0 0.0 0.0 0.0 0.0 61-Leather,leather manuf.,n.e.s. 55 261 394 284 238 0.2 0.3 0.2 0.2 0.1 62-Rubber manufactures,n.e.s. 43 252 618 451 527 0.1 0.3 0.4 0.3 0.3 63-Cork and wood manufactures 40 216 433 298 280 0.1 0.3 0.2 0.2 0.2 64-Paper,paperboard,artic.of paper,paper-pulp 173 674 986 972 971 0.6 0.8 0.6 0.6 0.6 65-Textile yarn,fabrics,made-upart. 384 1,378 2,690 2,203 2,342 1.3 1.6 1.5 1.3 1.4 66-Non-metallic mineral manufactures,n.e.s. 505 1,101 2,020 1,984 1,860 1.7 1.3 1.2 1.2 1.1 67-Iron and steel 828 2,476 1,922 1,430 1,926 2.8 2.9 1.1 0.9 1.1 68-Non-ferrous metals 918 1,446 1,403 1,317 1,230 3.1 1.7 0.8 0.8 0.7 69-Manufactures of metal,n.e.s. 428 1,562 3,977 4,489 4,587 1.5 1.8 2.3 2.7 2.7 6X-Res: Manufactured goods classified chiefly 0 0 0 0 0 0.0 0.0 0.0 0.0 0.0 71-Power generating machinery and equipment 1,696 4,145 6,548 6,356 6,650 5.8 4.9 3.8 3.8 3.9 72-Machinery specialized for particular industry 213 1,126 1,577 1,509 1,474 0.7 1.3 0.9 0.9 0.9 73-Metalworking machinery 32 114 54 50 56 0.1 0.1 0.0 0.0 0.0 74-General industrial machinery & equipment 504 1,908 4,885 4,804 5,629 1.7 2.3 2.8 2.9 3.3 75-Office machines & automatic data processing 572 2,863 12,135 13,714 12,557 2.0 3.4 7.0 8.2 7.4 76-Telecommunications 60 8,112 20,121 20,072 19,178 0.2 9.6 11.5 12.0 11.3 77-Electrical machinery,apparatus & appliance 659 12,530 27,320 23,391 23,741 2.3 14.8 15.7 14.0 14.0 78-Road vehicles 3,444 13,009 29,351 29,417 29,548 11.8 15.4 16.8 17.7 17.4 79-Other transport equipment 189 448 952 951 964 0.6 0.5 0.5 0.6 0.6 7X-Res: Machinery and transport equipment 0 0 0 0 0 0.0 0.0 0.0 0.0 0.0 81-Sanitary,plumbing,heating and lighting fix 56 356 1,010 1,155 1,220 0.2 0.4 0.6 0.7 0.7 82-Furniture and parts thereof 71 958 3,494 3,477 3,622 0.2 1.1 2.0 2.1 2.1 83-Travel goods and handbags 17 102 239 147 112 0.1 0.1 0.1 0.1 0.1 84-Articles of apparel and clothing accessories 111 2,929 9,044 8,415 8,182 0.4 3.5 5.2 5.0 4.8 85-Footwear 84 204 337 300 269 0.3 0.2 0.2 0.2 0.2 87-Professional, scientific & controling instruments 130 1,042 3,600 4,310 4,671 0.4 1.2 2.1 2.6 2.8 88-Photographic apparatus,optical goods,watch 186 657 1,215 1,187 1,034 0.6 0.8 0.7 0.7 0.6 89-Miscellaneous manufactured articles,n.e.s. 515 3,144 4,998 4,898 5,477 1.8 3.7 2.9 2.9 3.2 8X-Res: Miscellaneous manufactured articles 0 0 0 0 0 0.0 0.0 0.0 0.0 0.0 91-Postal packages 0 0 0 0 0 0.0 0.0 0.0 0.0 0.0 93-Special transactions & commod. 10 53 96 112 106 0.0 0.1 0.1 0.1 0.1 94-Animals,live,n.e.s.,incl. zoo-animals 1 0 0 1 0 0.0 0.0 0.0 0.0 0.0 95-Armoured fighting vehicles,arms of war 0 4 7 7 7 0.0 0.0 0.0 0.0 0.0 97-Gold,non-monetary 99 174 85 60 87 0.3 0.2 0.0 0.0 0.1 9X-Res: Commodities & trans. not classified 0 0 0 0 0 0.0 0.0 0.0 0.0 0.0Source: Statistics Canada (2004)

Table 2-1-17 (continued). Major Importing Commodities: Mexico (Millions of US Dollars and Percent)Imports Share
Commodity category (classification: SITC 2-digit) 1990 1995 2000 2001 2002 1990 1995 2000 2001 2002Total 39,692 72,819 170,360 162,813 163,758 100.0 100.0 100.0 100.0 100.0 00-Live animals chiefly for food 109 44 213 221 210 0.3 0.1 0.1 0.1 0.1 01-Meat and meat preparations 407 501 1,605 1,811 1,732 1.0 0.7 0.9 1.1 1.1 02-Dairy products and birds' eggs 570 387 553 749 602 1.4 0.5 0.3 0.5 0.4 03-Fish, crustaceans, and mollucs 55 65 117 147 172 0.1 0.1 0.1 0.1 0.1 04-Cereals and cereal preparations 1,024 1,216 1,914 2,243 2,472 2.6 1.7 1.1 1.4 1.5 05-Vegetables and fruit 417 314 885 989 1,027 1.0 0.4 0.5 0.6 0.6 06-Sugars,sugar preparations and honey 575 82 156 172 122 1.4 0.1 0.1 0.1 0.1 07-Coffee, tea, cocoa, and spices 87 106 301 430 275 0.2 0.1 0.2 0.3 0.2 08-Feeding stuff for animals 166 247 357 580 459 0.4 0.3 0.2 0.4 0.3 09-Miscl.edible products and preparations 94 220 545 626 635 0.2 0.3 0.3 0.4 0.4 11-Beverages 143 150 196 284 302 0.4 0.2 0.1 0.2 0.2 12-Tobacco and tobacco manufactures 44 29 43 41 59 0.1 0.0 0.0 0.0 0.0 21-Hides, skins, and furskins 109 78 193 181 168 0.3 0.1 0.1 0.1 0.1 22-Oil-seeds and oleaginous fruits 285 810 1,146 1,199 1,290 0.7 1.1 0.7 0.7 0.8 23-Crude rubber 137 251 267 217 264 0.3 0.3 0.2 0.1 0.2 24-Cork and wood 171 167 375 345 379 0.4 0.2 0.2 0.2 0.2 25-Pulp and waste paper 399 730 563 488 548 1.0 1.0 0.3 0.3 0.3 26-Textile fibres (except wool tops) 180 352 734 704 606 0.5 0.5 0.4 0.4 0.4 27-Crude fertilizers and crude materials 188 225 290 254 232 0.5 0.3 0.2 0.2 0.1 28-Metalliferous ores and metal scrap 291 349 665 607 754 0.7 0.5 0.4 0.4 0.5 29-Crude animal and vegetable materials, n.e.s 144 200 323 456 581 0.4 0.3 0.2 0.3 0.4 2X-Res: Crude materials, inedible, except fuel 0 0 0 0 0 0.0 0.0 0.0 0.0 0.0 32-Coal,coke and briquettes 36 107 129 192 266 0.1 0.1 0.1 0.1 0.2 33-Petroleum, and petroleum products 847 1,077 3,972 3,221 2,799 2.1 1.5 2.3 2.0 1.7 34-Gas, natural and manufactured 187 329 918 840 1,043 0.5 0.5 0.5 0.5 0.6 35-Electric current 0 0 0 0 0 0.0 0.0 0.0 0.0 0.0 3X-Res: Mineral fuels, and lubricants 0 0 0 0 0 0.0 0.0 0.0 0.0 0.0 41-Animal oils and fats 80 153 110 107 123 0.2 0.2 0.1 0.1 0.1 42-Fixed vegetable oils and fats 220 347 238 193 307 0.6 0.5 0.1 0.1 0.2 43-Animal or vegetable oils and fats 25 66 56 61 110 0.1 0.1 0.0 0.0 0.1 51-Organic chemicals 1,007 1,899 3,167 3,023 3,224 2.5 2.6 1.9 1.9 2.0 52-Inorganic chemicals 286 435 707 709 669 0.7 0.6 0.4 0.4 0.4 53-Dyeing,tanning and colouring materials 167 402 813 775 809 0.4 0.6 0.5 0.5 0.5 54-Medicinal and pharmaceutical products 292 572 1,307 1,554 1,747 0.7 0.8 0.8 1.0 1.1 55-Essential oils & perfume mat.;toilet prep. 181 387 739 988 1,001 0.5 0.5 0.4 0.6 0.6 56-Fertilizers,manufactured 30 93 285 264 93 0.1 0.1 0.2 0.2 0.1 58-Artif.resins,plastic mat.,cellulose esters 862 1,928 4,363 4,344 4,574 2.2 2.6 2.6 2.7 2.8 59-Chemical materials and products,n.e.s. 405 858 1,881 2,006 2,017 1.0 1.2 1.1 1.2 1.2 5X-Res: Chemicals and related products, n.e.s. 0 0 0 0 0 0.0 0.0 0.0 0.0 0.0 61-Leather,leather manuf.,n.e.s. 88 294 756 761 746 0.2 0.4 0.4 0.5 0.5 62-Rubber manufactures,n.e.s. 284 776 1,922 1,919 1,953 0.7 1.1 1.1 1.2 1.2 63-Cork and wood manufactures 92 174 437 423 480 0.2 0.2 0.3 0.3 0.3 64-Paper,paperboard,artic.of paper,paper-pulp 751 1,833 3,092 3,039 3,027 1.9 2.5 1.8 1.9 1.8 65-Textile yarn,fabrics,made-upart. 812 1,801 5,889 5,400 5,601 2.0 2.5 3.5 3.3 3.4 66-Non-metallic mineral manufactures,n.e.s. 367 679 1,718 1,649 1,825 0.9 0.9 1.0 1.0 1.1 67-Iron and steel 1,275 1,910 3,645 3,465 3,455 3.2 2.6 2.1 2.1 2.1 68-Non-ferrous metals 481 1,060 2,369 2,161 2,128 1.2 1.5 1.4 1.3 1.3 69-Manufactures of metal,n.e.s. 1,045 2,741 6,091 5,286 5,265 2.6 3.8 3.6 3.2 3.2 6X-Res: Manufactured goods classified chiefly 0 0 0 0 0 0.0 0.0 0.0 0.0 0.0 71-Power generating machinery and equipment 1,228 2,443 6,512 6,399 6,412 3.1 3.4 3.8 3.9 3.9 72-Machinery specialized for particular industry 2,100 3,026 6,329 5,828 5,170 5.3 4.2 3.7 3.6 3.2 73-Metalworking machinery 407 641 1,220 1,341 949 1.0 0.9 0.7 0.8 0.6 74-General industrial machinery & equipment 1,897 3,425 7,609 7,241 7,129 4.8 4.7 4.5 4.4 4.4 75-Office machines & automatic data processing 1,126 2,460 6,417 7,595 9,882 2.8 3.4 3.8 4.7 6.0 76-Telecommunications 2,565 3,509 9,240 8,931 7,653 6.5 4.8 5.4 5.5 4.7 77-Electrical machinery,apparatus & appliance 4,215 13,020 33,329 27,410 25,197 10.6 17.9 19.6 16.8 15.4 78-Road vehicles 4,079 5,995 17,213 17,360 19,419 10.3 8.2 10.1 10.7 11.9 79-Other transport equipment 686 359 1,035 1,424 910 1.7 0.5 0.6 0.9 0.6 7X-Res: Machinery and transport equipment 0 0 0 0 0 0.0 0.0 0.0 0.0 0.0 81-Sanitary,plumbing,heating and lighting fix 68 158 220 225 275 0.2 0.2 0.1 0.1 0.2 82-Furniture and parts thereof 365 699 1,281 1,279 1,215 0.9 1.0 0.8 0.8 0.7 83-Travel goods and handbags 31 43 144 162 162 0.1 0.1 0.1 0.1 0.1 84-Articles of apparel and clothing accessories 591 1,941 3,716 3,587 3,457 1.5 2.7 2.2 2.2 2.1 85-Footwear 79 85 195 243 289 0.2 0.1 0.1 0.1 0.2 87-Professional, scientific & controling instruments 989 1,537 3,774 3,673 4,208 2.5 2.1 2.2 2.3 2.6 88-Photographic apparatus,optical goods,watch 452 616 1,309 1,429 1,562 1.1 0.8 0.8 0.9 1.0 89-Miscellaneous manufactured articles,n.e.s. 1,626 4,153 8,959 8,646 8,734 4.1 5.7 5.3 5.3 5.3 8X-Res: Miscellaneous manufactured articles 0 0 0 0 0 0.0 0.0 0.0 0.0 0.0 91-Postal packages 0 0 0 0 0 0.0 0.0 0.0 0.0 0.0 93-Special transactions & commod. 1,670 2,204 5,380 4,611 4,772 4.2 3.0 3.2 2.8 2.9 94-Animals,live,n.e.s.,incl. zoo-animals 2 1 6 3 3 0.0 0.0 0.0 0.0 0.0 95-Armoured fighting vehicles,arms of war 2 6 15 11 18 0.0 0.0 0.0 0.0 0.0 97-Gold,non-monetary 99 55 408 292 195 0.2 0.1 0.2 0.2 0.1 9X-Res: Commodities & trans. not classified 0 0 0 0 0 0.0 0.0 0.0 0.0 0.0Source: Statistics Canada (2004)

Trade between Selected Countries in Asia and Latin America
There are several points worthy of mention concerning trade between East Asia and Latin
America. First of all, as can be seen in Tables 2-1-4 through 2-1-7, the volume of trade
between these two regions is small, and no Latin American countries appear in the top five
trade partners of the Asian countries. Some Asian countries, such as China, Japan, and Korea,
however, are included in the top five partners of the Latin American countries (as can be
observed in Tables 2-1-8 through 2-1-10), showing the significance and the potential of the
inter-regional economic relationship.
Tables 2-1-18 through 2-1-21 summarize the trading commodities between East Asia and Latin
America – more specifically for China, Japan, Korea, Thailand, Brazil, Chile, and Mexico – in
2002. It is difficult to generalize from the patterns of trade for each and every case of bilateral
trade between these two regions, because the trade volume is small and the patterns vary
among pairs of countries. It can still be concluded, though, that various types of machinery are
the major products exported from Asia to Latin America. Natural resources or primary products
such as metals and ores, vegetal products, and machinery are the major products exported
from Latin America to Asia. At the same time, however, it should also be noted that these
trends are not necessarily peculiar to trade between these two regions.
(3) FDI
Major FDI Partners for Selected East Asian and Latin American Countries
The major FDI partners for each of the seven countries are summarized in the third and the
fourth rows of Tables 2-1-4 through 2-1-10. Each table also contains the data for
inward/outward FDI volume between the selected seven East Asian and Latin American
countries in the fifth and the sixth rows, whenever available. The data are, however, rather
scarce because there is little FDI between these two regions.
These countries can be categorized into three types based on their FDI patterns. First, Brazil,
Mexico, and Thailand are net receivers of FDI, while China, Japan, and Korea serve both as
investors and receivers. Japan is a particularly big investor in absolute terms. Chile falls into
the third category, which is of countries with little FDI inflow nor outflow.
If we look at the net receivers of FDI, sets of partners vary to a great extent. In Thailand, Japan
and the US have been the two largest investors since the 1990’s. Taiwan and Singapore have
also always been among Thailand’s five major partners since the 1990’s. The Netherlands,
Japan, France, and Spain have been in and out of the top five partners for Brazil, while the US
has remained within the top five since the 1990’s. The US and the Netherlands have always
been in the major FDI partners for Mexico since the 1990’s. In addition to those two investors,
Spain, the UK, Switzerland, and Japan have appeared among Mexico’s major FDI partners in
some years.
Now if we look at the “investor and receiver” type of countries, i.e., China, Japan, and Korea,
again their FDI partners vary widely, although to a lesser extent than for net receivers. The
leading investors in China have been Hong Kong, the US, Taiwan, and Japan or Korea, and
Chinese capital has invested in such countries/areas as Hong Kong, the US, Korea, Australia,
Russia, Vietnam, and Laos; however, the pattern varies from year to year, and it is hard to
describe the overall trend. The principal investors in Japan have been the US, Netherlands,
and capital based in Cayman Islands or Bermuda Islands. It is also notable that foreign
affiliates located in Japan have recently been increasing their presence in FDI in Japan,
becoming the largest investor in 2003. The major host countries for Japanese capital have
been the US, the Netherlands, China, and (from 2000) the Cayman Islands. The flow of funds
to China has been increasing, as can easily be surmised. For Korea, Japan and the US have
always been the major investors since the 1990’s. Other than these two countries, the UK,
Malaysia, Germany, the Netherlands, Canada, have also been among the top 5 countries in
some years. Regarding Korea’s outward FDI, China and the US have always been in top 5
since the 1990’s.
FDI between Asia and Latin America for Selected Countries
Finally, if we look at inter-regional FDI between East Asia and Latin America, it can easily be
seen that there has been almost no FDI from Latin America. However, some Asian countries
invest in Latin America. For example, the Japanese automobile industry invests a substantial
amount in Brazil and Mexico, and Japanese companies in the fishery industry invest in Chile.
Chinese, Korean and Japanese electronics companies also have plants in Mexico. It should be
pointed out that Japan has even been ranked among the top five investors in Brazil and Mexico
several times since the 1990’s.

36
Table 2-1-18. Trade Matrix, 2002: World and China (Millions of US Dollars and Percent)Importers Importers
Exporters Commodity category (classification: SITC) World Japan Korea Thailand China Brazil Chile Mexico World Japan Korea Thailand China Brazil Chile MexicoWorld TOTL-Total - All commodities 6,705,971 323,528 145,126 53,332 328,045 50,745 15,621 163,758 100.0 100.0 100.0 100.0 100.0 100.0 100.0 100.0
0-Food and live animals chiefly for food 378,274 33,690 7,070 1,873 5,529 2,772 1,006 7,705 5.6 10.4 4.9 3.5 1.7 5.5 6.4 4.7 1-Beverages and tobacco 63,446 3,297 734 279 475 161 51 361 0.9 1.0 0.5 0.5 0.1 0.3 0.3 0.2 2-Crude materials, inedible, except fuels 198,840 18,425 8,127 1,874 21,697 1,389 259 4,823 3.0 5.7 5.6 3.5 6.6 2.7 1.7 2.9 3-Mineral fuels, lubricants and related materials 607,433 59,407 23,785 2,491 16,656 7,105 2,397 4,108 9.1 18.4 16.4 4.7 5.1 14.0 15.3 2.5 32-Coal,coke and briquettes 25,090 5,815 2,040 95 290 822 91 266 0.4 1.8 1.4 0.2 0.1 1.6 0.6 0.2 33-Petroleum and petroleum products 489,693 40,336 17,157 2,384 15,074 5,534 1,883 2,799 7.3 12.5 11.8 4.5 4.6 10.9 12.1 1.7 34-Gas,natural and manufactured 80,424 13,256 4,588 12 1,157 715 388 1,043 1.2 4.1 3.2 0.0 0.4 1.4 2.5 0.6 35-Electric current 12,226 0 0 1 135 34 35 0 0.2 0.0 0.0 0.0 0.0 0.1 0.2 0.0 4-Animal and vegetable oils, fats and waxes 25,895 624 353 70 1,823 191 109 540 0.4 0.2 0.2 0.1 0.6 0.4 0.7 0.3 5-Chemicals and related products, n.e.s. 673,794 23,013 12,862 5,737 40,284 9,051 1,855 14,134 10.0 7.1 8.9 10.8 12.3 17.8 11.9 8.6 6-Manufactured goods classified chiefly by material 930,014 28,378 18,958 8,729 58,377 4,565 2,098 24,479 13.9 8.8 13.1 16.4 17.8 9.0 13.4 14.9 7-Machinery and transport equipment 2,714,420 96,358 54,850 26,639 153,160 21,025 5,772 82,720 40.5 29.8 37.8 49.9 46.7 41.4 37.0 50.5 71-Power generating machinery and equipment 178,776 5,238 2,946 1,525 6,748 3,156 363 6,412 2.7 1.6 2.0 2.9 2.1 6.2 2.3 3.9 72-Machinery specialized for particular industry 193,218 4,181 4,597 2,232 17,304 2,204 839 5,170 2.9 1.3 3.2 4.2 5.3 4.3 5.4 3.2 73-Metalworking machinery 32,734 768 958 602 4,137 421 36 949 0.5 0.2 0.7 1.1 1.3 0.8 0.2 0.6 74-General industrial machinery & equipment 231,999 5,664 4,681 2,690 12,610 2,719 818 7,129 3.5 1.8 3.2 5.0 3.8 5.4 5.2 4.4 75-Office machines & automatic data processing 359,898 22,483 5,768 3,804 22,138 1,830 530 9,882 5.4 6.9 4.0 7.1 6.7 3.6 3.4 6.0 76-Telecommunications 307,418 13,013 4,951 3,256 19,596 1,969 796 7,653 4.6 4.0 3.4 6.1 6.0 3.9 5.1 4.7 77-Electrical machinery,apparatus & appliance 587,635 28,492 24,889 9,367 56,805 3,639 650 25,197 8.8 8.8 17.1 17.6 17.3 7.2 4.2 15.4 78-Road vehicles (incl. air cushion vehicles 642,166 10,963 2,914 2,317 7,940 3,215 1,471 19,419 9.6 3.4 2.0 4.3 2.4 6.3 9.4 11.9 79-Other transport equipment 180,146 5,554 3,147 797 5,880 1,871 270 910 2.7 1.7 2.2 1.5 1.8 3.7 1.7 0.6 8-Miscellaneous manufactured articles 866,623 53,178 13,616 3,507 24,900 3,563 1,856 19,902 12.9 16.4 9.4 6.6 7.6 7.0 11.9 12.2 9-Commodities & trans. not classified 247,232 7,158 4,771 2,134 5,145 923 219 4,987 3.7 2.2 3.3 4.0 1.6 1.8 1.4 3.0
China TOTL-Total - All commodities 358,565 54,436 16,478 3,161 1,422 947 2,718 100.0 100.0 100.0 100.0 100.0 100.0 100.0 0-Food and live animals chiefly for food 15,835 5,728 1,888 126 28 3 28 4.4 10.5 11.5 4.0 2.0 0.3 1.0 1-Beverages and tobacco 1,073 53 13 9 0 0 0 0.3 0.1 0.1 0.3 0.0 0.0 0.0 2-Crude materials, inedible, except fuels 4,870 1,181 492 71 8 4 27 1.4 2.2 3.0 2.2 0.6 0.4 1.0 3-Mineral fuels, lubricants and related materials 9,174 2,029 1,417 36 248 2 148 2.6 3.7 8.6 1.1 17.4 0.2 5.5 32-Coal,coke and briquettes 3,795 1,190 829 12 222 0 90 1.1 2.2 5.0 0.4 15.6 0.0 3.3 33-Petroleum and petroleum products 4,399 838 587 24 25 2 58 1.2 1.5 3.6 0.8 1.8 0.2 2.1 34-Gas,natural and manufactured 295 1 1 0 0 0 0 0.1 0.0 0.0 0.0 0.0 0.0 0.0 35-Electric current 685 0 0 0 0 0 0 0.2 0.0 0.0 0.0 0.0 0.0 0.0 4-Animal and vegetable oils, fats and waxes 106 6 7 1 0 0 0 0.0 0.0 0.0 0.0 0.0 0.0 0.0 5-Chemicals and related products, n.e.s. 16,367 1,760 1,126 391 227 41 220 4.6 3.2 6.8 12.4 16.0 4.3 8.1 6-Manufactured goods classified chiefly 58,658 6,650 3,772 547 142 139 425 16.4 12.2 22.9 17.3 10.0 14.7 15.6 7-Machinery and transport equipment 138,395 17,636 5,040 1,749 545 196 1,401 38.6 32.4 30.6 55.3 38.3 20.6 51.6 71-Power generating machinery and equipment 4,061 675 307 57 17 1 28 1.1 1.2 1.9 1.8 1.2 0.1 1.0 72-Machinery specialized for particular industry 3,336 269 67 75 15 6 48 0.9 0.5 0.4 2.4 1.0 0.6 1.8 73-Metalworking machinery 623 64 13 9 3 2 13 0.2 0.1 0.1 0.3 0.2 0.2 0.5 74-General industrial machinery & equipment 9,120 1,134 219 133 44 21 78 2.5 2.1 1.3 4.2 3.1 2.2 2.9 75-Office machines & automatic data processing 38,558 5,858 1,052 536 74 22 356 10.8 10.8 6.4 17.0 5.2 2.3 13.1 76-Telecommunications 35,400 4,142 1,023 490 222 62 415 9.9 7.6 6.2 15.5 15.6 6.6 15.3 77-Electrical machinery,apparatus & appliance 36,172 4,181 1,908 363 141 53 366 10.1 7.7 11.6 11.5 9.9 5.6 13.5 78-Road vehicles (incl. air cushion vehicles 8,349 1,028 383 42 29 23 97 2.3 1.9 2.3 1.3 2.0 2.4 3.6 79-Other transport equipment 2,776 283 68 45 0 5 1 0.8 0.5 0.4 1.4 0.0 0.5 0.0 8-Miscellaneous manufactured articles 113,387 19,353 2,723 223 223 564 468 31.6 35.6 16.5 7.1 15.7 59.5 17.2 9-Commodities & trans. not classified 701 41 1 6 0 0 1 0.2 0.1 0.0 0.2 0.0 0.0 0.0
Source: Statistics Canada (2004).

37
Table 2-1-19. Trade Matrix, 2002: Japan and Korea (Millions of US Dollars and Percent)Importers Importers
Exporters Commodity category (classification: SITC) World Japan Korea Thailand China Brazil Chile Mexico World Japan Korea Thailand China Brazil Chile MexicoJapan TOTL-Total - All commodities 447,629 30,443 14,091 49,788 2,166 578 5,645 100.0 100.0 100.0 100.0 100.0 100.0 100.0
0-Food and live animals chiefly for food 1,872 243 96 187 4 1 3 0.4 0.8 0.7 0.4 0.2 0.1 0.1 1-Beverages and tobacco 398 49 2 2 0 0 0 0.1 0.2 0.0 0.0 0.0 0.0 0.0 2-Crude materials, inedible, except fuels 3,855 589 167 1,252 12 2 5 0.9 1.9 1.2 2.5 0.5 0.4 0.1 3-Mineral fuels, lubricants and related materials 1,852 561 64 413 43 0 6 0.4 1.8 0.5 0.8 2.0 0.0 0.1 32-Coal,coke and briquettes 227 6 0 0 39 0 0 0.1 0.0 0.0 0.0 1.8 0.0 0.0 33-Petroleum and petroleum products 1,602 533 63 412 4 0 6 0.4 1.8 0.4 0.8 0.2 0.0 0.1 34-Gas,natural and manufactured 23 22 0 1 0 0 0 0.0 0.1 0.0 0.0 0.0 0.0 0.0 35-Electric current 0 0 0 0 0 0 0 0.0 0.0 0.0 0.0 0.0 0.0 0.0 4-Animal and vegetable oils, fats and waxes 80 13 3 4 0 0 0 0.0 0.0 0.0 0.0 0.0 0.0 0.0 5-Chemicals and related products, n.e.s. 34,447 4,254 1,186 5,671 223 24 185 7.7 14.0 8.4 11.4 10.3 4.1 3.3 6-Manufactured goods classified chiefly by material 47,207 5,502 2,639 9,220 188 56 670 10.5 18.1 18.7 18.5 8.7 9.7 11.9 7-Machinery and transport equipment 298,320 14,545 8,586 26,991 1,451 455 4,153 66.6 47.8 60.9 54.2 67.0 78.7 73.6 71-Power generating machinery and equipment 17,955 680 732 1,151 195 19 524 4.0 2.2 5.2 2.3 9.0 3.3 9.3 72-Machinery specialized for particular industry 22,427 1,936 848 3,940 93 15 167 5.0 6.4 6.0 7.9 4.3 2.7 3.0 73-Metalworking machinery 5,930 500 428 885 48 0 40 1.3 1.6 3.0 1.8 2.2 0.0 0.7 74-General industrial machinery & equipment 23,094 1,503 1,320 3,061 263 31 309 5.2 4.9 9.4 6.1 12.1 5.3 5.5 75-Office machines & automatic data processing 26,884 779 399 1,801 101 11 308 6.0 2.6 2.8 3.6 4.7 1.9 5.5 76-Telecommunications 26,500 1,261 402 1,906 87 19 558 5.9 4.1 2.9 3.8 4.0 3.3 9.9 77-Electrical machinery,apparatus & appliance 64,245 6,892 3,073 11,293 305 14 1,288 14.4 22.6 21.8 22.7 14.1 2.4 22.8 78-Road vehicles (incl. air cushion vehicles 99,924 877 1,343 2,681 350 346 957 22.3 2.9 9.5 5.4 16.1 59.8 17.0 79-Other transport equipment 11,362 116 42 272 9 0 1 2.5 0.4 0.3 0.5 0.4 0.0 0.0 8-Miscellaneous manufactured articles 40,361 3,527 912 4,325 214 33 523 9.0 11.6 6.5 8.7 9.9 5.7 9.3 9-Commodities & trans. not classified 19,238 1,160 437 1,723 31 7 100 4.3 3.8 3.1 3.5 1.4 1.2 1.8
Korea TOTL-Total - All commodities 174,161 16,023 2,496 27,413 953 481 2,740 100.0 100.0 100.0 100.0 100.0 100.0 100.0 0-Food and live animals chiefly for food 2,257 1,233 43 121 2 1 8 1.3 7.7 1.7 0.4 0.2 0.2 0.3 1-Beverages and tobacco 369 119 3 11 0 0 0 0.2 0.7 0.1 0.0 0.0 0.0 0.0 2-Crude materials, inedible, except fuels 1,743 262 27 486 9 2 1 1.0 1.6 1.1 1.8 1.0 0.5 0.0 3-Mineral fuels, lubricants and related materials 7,045 2,599 27 1,382 62 48 1 4.0 16.2 1.1 5.0 6.5 10.1 0.0 32-Coal,coke and briquettes 0 0 0 0 0 0 0 0.0 0.0 0.0 0.0 0.0 0.0 0.0 33-Petroleum and petroleum products 6,974 2,584 27 1,338 62 48 1 4.0 16.1 1.1 4.9 6.5 10.1 0.0 34-Gas,natural and manufactured 70 15 0 44 0 0 0 0.0 0.1 0.0 0.2 0.0 0.0 0.0 35-Electric current 0 0 0 0 0 0 0 0.0 0.0 0.0 0.0 0.0 0.0 0.0 4-Animal and vegetable oils, fats and waxes 22 3 2 4 0 0 0 0.0 0.0 0.1 0.0 0.0 0.0 0.0 5-Chemicals and related products, n.e.s. 14,486 1,075 311 5,368 105 46 223 8.3 6.7 12.5 19.6 11.0 9.6 8.1 6-Manufactured goods classified chiefly 29,247 2,120 536 6,801 255 84 539 16.8 13.2 21.5 24.8 26.8 17.5 19.7 7-Machinery and transport equipment 106,357 6,803 1,444 11,913 452 283 1,767 61.1 42.5 57.9 43.5 47.5 58.9 64.5 71-Power generating machinery and equipment 1,959 120 15 262 9 4 60 1.1 0.7 0.6 1.0 1.0 0.8 2.2 72-Machinery specialized for particular industry 4,149 222 100 1,189 18 7 113 2.4 1.4 4.0 4.3 1.9 1.4 4.1 73-Metalworking machinery 576 54 13 146 2 0 15 0.3 0.3 0.5 0.5 0.2 0.0 0.5 74-General industrial machinery & equipment 5,164 481 100 809 45 12 158 3.0 3.0 4.0 3.0 4.8 2.4 5.8 75-Office machines & automatic data processing 17,455 1,568 196 1,966 71 3 397 10.0 9.8 7.9 7.2 7.5 0.7 14.5 76-Telecommunications 21,644 821 300 3,086 91 57 417 12.4 5.1 12.0 11.3 9.5 11.8 15.2 77-Electrical machinery,apparatus & appliance 25,183 3,272 439 4,047 147 40 468 14.5 20.4 17.6 14.8 15.5 8.4 17.1 78-Road vehicles (incl. air cushion vehicles 18,482 254 47 387 69 160 138 10.6 1.6 1.9 1.4 7.2 33.3 5.0 79-Other transport equipment 11,745 10 234 22 0 0 1 6.7 0.1 9.4 0.1 0.0 0.0 0.0 8-Miscellaneous manufactured articles 11,532 1,783 73 1,296 67 15 202 6.6 11.1 2.9 4.7 7.0 3.1 7.4 9-Commodities & trans. not classified 1,104 26 29 30 0 0 0 0.6 0.2 1.2 0.1 0.0 0.0 0.0
Source: Statistics Canada (2004).
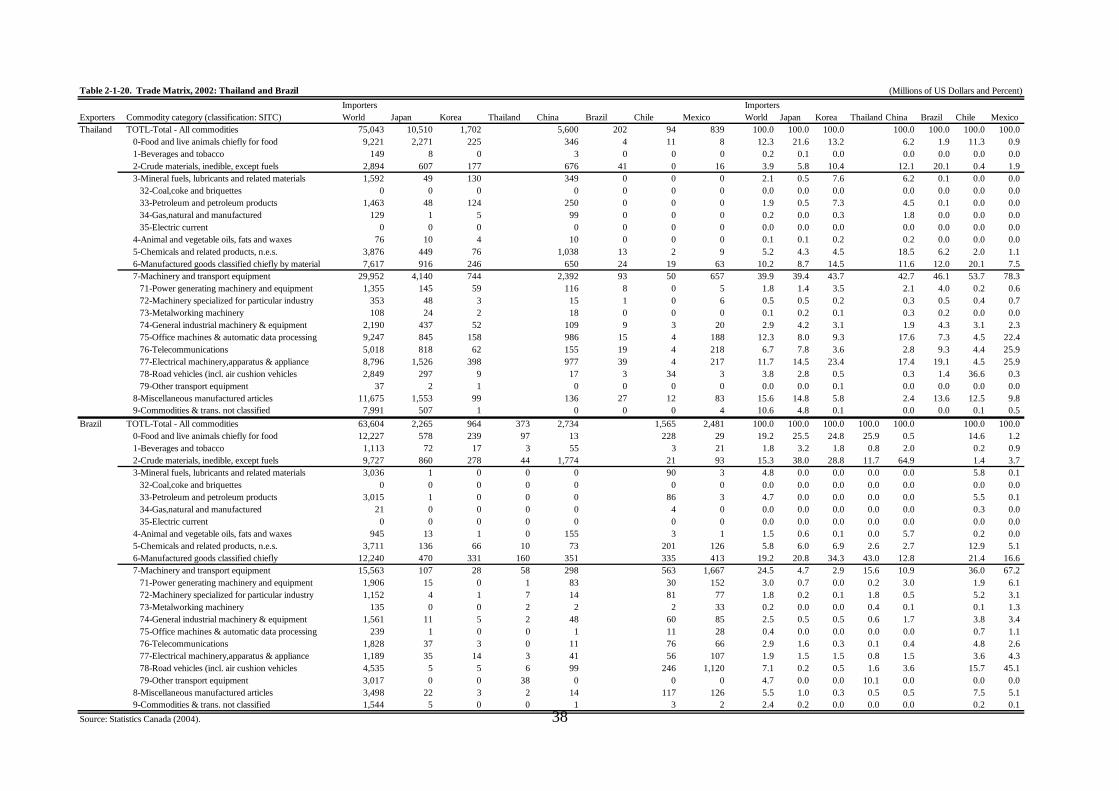
38
Table 2-1-20. Trade Matrix, 2002: Thailand and Brazil (Millions of US Dollars and Percent)Importers Importers
Exporters Commodity category (classification: SITC) World Japan Korea Thailand China Brazil Chile Mexico World Japan Korea Thailand China Brazil Chile MexicoThailand TOTL-Total - All commodities 75,043 10,510 1,702 5,600 202 94 839 100.0 100.0 100.0 100.0 100.0 100.0 100.0
0-Food and live animals chiefly for food 9,221 2,271 225 346 4 11 8 12.3 21.6 13.2 6.2 1.9 11.3 0.9 1-Beverages and tobacco 149 8 0 3 0 0 0 0.2 0.1 0.0 0.0 0.0 0.0 0.0 2-Crude materials, inedible, except fuels 2,894 607 177 676 41 0 16 3.9 5.8 10.4 12.1 20.1 0.4 1.9 3-Mineral fuels, lubricants and related materials 1,592 49 130 349 0 0 0 2.1 0.5 7.6 6.2 0.1 0.0 0.0 32-Coal,coke and briquettes 0 0 0 0 0 0 0 0.0 0.0 0.0 0.0 0.0 0.0 0.0 33-Petroleum and petroleum products 1,463 48 124 250 0 0 0 1.9 0.5 7.3 4.5 0.1 0.0 0.0 34-Gas,natural and manufactured 129 1 5 99 0 0 0 0.2 0.0 0.3 1.8 0.0 0.0 0.0 35-Electric current 0 0 0 0 0 0 0 0.0 0.0 0.0 0.0 0.0 0.0 0.0 4-Animal and vegetable oils, fats and waxes 76 10 4 10 0 0 0 0.1 0.1 0.2 0.2 0.0 0.0 0.0 5-Chemicals and related products, n.e.s. 3,876 449 76 1,038 13 2 9 5.2 4.3 4.5 18.5 6.2 2.0 1.1 6-Manufactured goods classified chiefly by material 7,617 916 246 650 24 19 63 10.2 8.7 14.5 11.6 12.0 20.1 7.5 7-Machinery and transport equipment 29,952 4,140 744 2,392 93 50 657 39.9 39.4 43.7 42.7 46.1 53.7 78.3 71-Power generating machinery and equipment 1,355 145 59 116 8 0 5 1.8 1.4 3.5 2.1 4.0 0.2 0.6 72-Machinery specialized for particular industry 353 48 3 15 1 0 6 0.5 0.5 0.2 0.3 0.5 0.4 0.7 73-Metalworking machinery 108 24 2 18 0 0 0 0.1 0.2 0.1 0.3 0.2 0.0 0.0 74-General industrial machinery & equipment 2,190 437 52 109 9 3 20 2.9 4.2 3.1 1.9 4.3 3.1 2.3 75-Office machines & automatic data processing 9,247 845 158 986 15 4 188 12.3 8.0 9.3 17.6 7.3 4.5 22.4 76-Telecommunications 5,018 818 62 155 19 4 218 6.7 7.8 3.6 2.8 9.3 4.4 25.9 77-Electrical machinery,apparatus & appliance 8,796 1,526 398 977 39 4 217 11.7 14.5 23.4 17.4 19.1 4.5 25.9 78-Road vehicles (incl. air cushion vehicles 2,849 297 9 17 3 34 3 3.8 2.8 0.5 0.3 1.4 36.6 0.3 79-Other transport equipment 37 2 1 0 0 0 0 0.0 0.0 0.1 0.0 0.0 0.0 0.0 8-Miscellaneous manufactured articles 11,675 1,553 99 136 27 12 83 15.6 14.8 5.8 2.4 13.6 12.5 9.8 9-Commodities & trans. not classified 7,991 507 1 0 0 0 4 10.6 4.8 0.1 0.0 0.0 0.1 0.5
Brazil TOTL-Total - All commodities 63,604 2,265 964 373 2,734 1,565 2,481 100.0 100.0 100.0 100.0 100.0 100.0 100.0 0-Food and live animals chiefly for food 12,227 578 239 97 13 228 29 19.2 25.5 24.8 25.9 0.5 14.6 1.2 1-Beverages and tobacco 1,113 72 17 3 55 3 21 1.8 3.2 1.8 0.8 2.0 0.2 0.9 2-Crude materials, inedible, except fuels 9,727 860 278 44 1,774 21 93 15.3 38.0 28.8 11.7 64.9 1.4 3.7 3-Mineral fuels, lubricants and related materials 3,036 1 0 0 0 90 3 4.8 0.0 0.0 0.0 0.0 5.8 0.1 32-Coal,coke and briquettes 0 0 0 0 0 0 0 0.0 0.0 0.0 0.0 0.0 0.0 0.0 33-Petroleum and petroleum products 3,015 1 0 0 0 86 3 4.7 0.0 0.0 0.0 0.0 5.5 0.1 34-Gas,natural and manufactured 21 0 0 0 0 4 0 0.0 0.0 0.0 0.0 0.0 0.3 0.0 35-Electric current 0 0 0 0 0 0 0 0.0 0.0 0.0 0.0 0.0 0.0 0.0 4-Animal and vegetable oils, fats and waxes 945 13 1 0 155 3 1 1.5 0.6 0.1 0.0 5.7 0.2 0.0 5-Chemicals and related products, n.e.s. 3,711 136 66 10 73 201 126 5.8 6.0 6.9 2.6 2.7 12.9 5.1 6-Manufactured goods classified chiefly 12,240 470 331 160 351 335 413 19.2 20.8 34.3 43.0 12.8 21.4 16.6 7-Machinery and transport equipment 15,563 107 28 58 298 563 1,667 24.5 4.7 2.9 15.6 10.9 36.0 67.2 71-Power generating machinery and equipment 1,906 15 0 1 83 30 152 3.0 0.7 0.0 0.2 3.0 1.9 6.1 72-Machinery specialized for particular industry 1,152 4 1 7 14 81 77 1.8 0.2 0.1 1.8 0.5 5.2 3.1 73-Metalworking machinery 135 0 0 2 2 2 33 0.2 0.0 0.0 0.4 0.1 0.1 1.3 74-General industrial machinery & equipment 1,561 11 5 2 48 60 85 2.5 0.5 0.5 0.6 1.7 3.8 3.4 75-Office machines & automatic data processing 239 1 0 0 1 11 28 0.4 0.0 0.0 0.0 0.0 0.7 1.1 76-Telecommunications 1,828 37 3 0 11 76 66 2.9 1.6 0.3 0.1 0.4 4.8 2.6 77-Electrical machinery,apparatus & appliance 1,189 35 14 3 41 56 107 1.9 1.5 1.5 0.8 1.5 3.6 4.3 78-Road vehicles (incl. air cushion vehicles 4,535 5 5 6 99 246 1,120 7.1 0.2 0.5 1.6 3.6 15.7 45.1 79-Other transport equipment 3,017 0 0 38 0 0 0 4.7 0.0 0.0 10.1 0.0 0.0 0.0 8-Miscellaneous manufactured articles 3,498 22 3 2 14 117 126 5.5 1.0 0.3 0.5 0.5 7.5 5.1 9-Commodities & trans. not classified 1,544 5 0 0 1 3 2 2.4 0.2 0.0 0.0 0.0 0.2 0.1
Source: Statistics Canada (2004).

39
Table 2-1-21. Trade Matrix, 2002: Chile and Mexico (Millions of US Dollars and Percent)Importers Importers
Exporters Commodity category (classification: SITC) World Japan Korea Thailand China Brazil Chile Mexico World Japan Korea Thailand China Brazil Chile MexicoChile TOTL-Total - All commodities 18,428 2,015 751 54 1,352 727 985 100.0 100.0 100.0 100.0 100.0 100.0 100.0
0-Food and live animals chiefly for food 4,399 785 37 15 144 102 241 23.9 39.0 5.0 27.3 10.6 14.1 24.4 1-Beverages and tobacco 666 30 1 1 10 14 14 3.6 1.5 0.2 2.7 0.7 1.9 1.4 2-Crude materials, inedible, except fuels 4,285 1,064 268 28 481 198 134 23.3 52.8 35.7 52.4 35.6 27.3 13.6 3-Mineral fuels, lubricants and related materials 218 0 0 0 0 3 0 1.2 0.0 0.0 0.2 0.0 0.4 0.0 32-Coal,coke and briquettes 2 0 0 0 0 0 0 0.0 0.0 0.0 0.0 0.0 0.1 0.0 33-Petroleum and petroleum products 197 0 0 0 0 2 0 1.1 0.0 0.0 0.2 0.0 0.3 0.0 34-Gas,natural and manufactured 19 0 0 0 0 0 0 0.1 0.0 0.0 0.0 0.0 0.0 0.0 35-Electric current 0 0 0 0 0 0 0 0.0 0.0 0.0 0.0 0.0 0.0 0.0 4-Animal and vegetable oils, fats and waxes 18 5 0 2 0 1 1 0.1 0.3 0.0 4.6 0.0 0.1 0.1 5-Chemicals and related products, n.e.s. 1,123 25 8 1 39 121 52 6.1 1.2 1.1 1.1 2.9 16.6 5.3 6-Manufactured goods classified chiefly by material 6,172 100 435 6 674 218 378 33.5 4.9 58.0 11.2 49.8 30.0 38.4 7-Machinery and transport equipment 456 0 0 0 3 42 127 2.5 0.0 0.0 0.5 0.2 5.7 12.9 71-Power generating machinery and equipment 16 0 0 0 0 0 4 0.1 0.0 0.0 0.0 0.0 0.0 0.4 72-Machinery specialized for particular industry 33 0 0 0 0 1 1 0.2 0.0 0.0 0.5 0.0 0.1 0.1 73-Metalworking machinery 3 0 0 0 0 2 0 0.0 0.0 0.0 0.0 0.0 0.3 0.0 74-General industrial machinery & equipment 66 0 0 0 0 1 7 0.4 0.0 0.0 0.0 0.0 0.2 0.7 75-Office machines & automatic data processing 16 0 0 0 0 1 0 0.1 0.0 0.0 0.0 0.0 0.1 0.0 76-Telecommunications 16 0 0 0 0 0 1 0.1 0.0 0.0 0.0 0.0 0.1 0.1 77-Electrical machinery,apparatus & appliance 47 0 0 0 0 3 2 0.3 0.0 0.0 0.0 0.0 0.4 0.2 78-Road vehicles (incl. air cushion vehicles 186 0 0 0 0 12 109 1.0 0.0 0.0 0.0 0.0 1.7 11.1 79-Other transport equipment 72 0 0 0 3 21 3 0.4 0.0 0.0 0.0 0.2 2.9 0.3 8-Miscellaneous manufactured articles 280 1 0 0 0 20 32 1.5 0.0 0.0 0.0 0.0 2.8 3.3 9-Commodities & trans. not classified 811 5 0 0 0 9 7 4.4 0.2 0.0 0.0 0.0 1.2 0.7
Mexico TOTL-Total - All commodities 169,650 614 165 47 617 618 473 100.0 100.0 100.0 100.0 100.0 100.0 100.0 0-Food and live animals chiefly for food 6,328 88 10 0 5 11 10 3.7 14.4 6.2 0.8 0.9 1.8 2.0 1-Beverages and tobacco 2,095 15 3 0 14 2 4 1.2 2.4 1.6 0.9 2.3 0.4 0.7 2-Crude materials, inedible, except fuels 1,670 56 3 2 40 9 10 1.0 9.2 1.7 4.0 6.5 1.5 2.1 3-Mineral fuels, lubricants and related materials 15,149 107 0 0 0 0 10 8.9 17.5 0.0 0.1 0.0 0.0 2.2 32-Coal,coke and briquettes 2 0 0 0 0 0 0 0.0 0.0 0.0 0.0 0.0 0.0 0.0 33-Petroleum and petroleum products 15,094 107 0 0 0 0 10 8.9 17.5 0.0 0.1 0.0 0.0 2.2 34-Gas,natural and manufactured 22 0 0 0 0 0 0 0.0 0.0 0.0 0.0 0.0 0.0 0.0 35-Electric current 31 0 0 0 0 0 0 0.0 0.0 0.0 0.0 0.0 0.0 0.0 4-Animal and vegetable oils, fats and waxes 41 1 0 0 0 0 0 0.0 0.2 0.0 0.0 0.0 0.0 0.0 5-Chemicals and related products, n.e.s. 5,821 52 34 6 71 180 130 3.4 8.5 20.6 12.6 11.5 29.1 27.6 6-Manufactured goods classified chiefly 13,962 50 27 1 18 32 62 8.2 8.2 16.5 2.2 3.0 5.2 13.0 7-Machinery and transport equipment 99,798 181 78 36 453 345 223 58.8 29.5 47.0 76.5 73.5 55.9 47.2 71-Power generating machinery and equipment 6,650 24 0 0 21 52 2 3.9 3.9 0.2 0.0 3.4 8.4 0.4 72-Machinery specialized for particular industry 1,474 5 0 0 3 15 3 0.9 0.7 0.2 0.4 0.5 2.4 0.7 73-Metalworking machinery 56 0 0 0 0 2 0 0.0 0.0 0.1 0.0 0.0 0.3 0.0 74-General industrial machinery & equipment 5,629 15 3 3 11 15 7 3.3 2.4 1.6 6.0 1.8 2.4 1.5 75-Office machines & automatic data processing 12,557 57 7 21 362 42 40 7.4 9.3 4.1 45.0 58.6 6.8 8.4 76-Telecommunications 19,178 28 46 0 12 83 130 11.3 4.6 28.0 0.1 1.9 13.4 27.4 77-Electrical machinery,apparatus & appliance 23,741 28 5 8 26 45 14 14.0 4.6 2.9 16.6 4.2 7.3 2.9 78-Road vehicles (incl. air cushion vehicles 29,548 24 17 4 18 91 27 17.4 3.9 10.0 8.3 3.0 14.8 5.8 79-Other transport equipment 964 0 0 0 0 0 1 0.6 0.1 0.0 0.0 0.0 0.0 0.2 8-Miscellaneous manufactured articles 24,587 57 10 1 14 36 23 14.5 9.3 6.3 2.1 2.3 5.9 4.8 9-Commodities & trans. not classified 200 6 0 0 0 2 1 0.1 0.9 0.1 0.7 0.0 0.3 0.2
Source: Statistics Canada (2004).
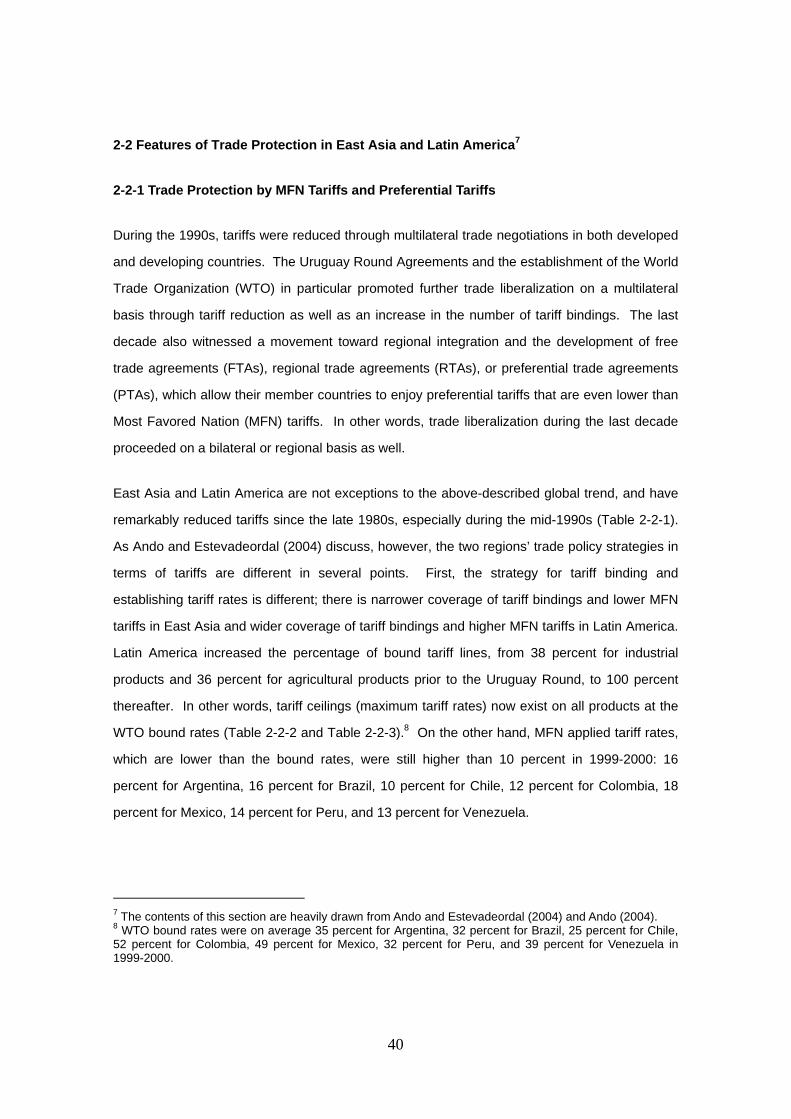
2-2 Features of Trade Protection in East Asia and Latin America7
2-2-1 Trade Protection by MFN Tariffs and Preferential Tariffs
During the 1990s, tariffs were reduced through multilateral trade negotiations in both developed
and developing countries. The Uruguay Round Agreements and the establishment of the World
Trade Organization (WTO) in particular promoted further trade liberalization on a multilateral
basis through tariff reduction as well as an increase in the number of tariff bindings. The last
decade also witnessed a movement toward regional integration and the development of free
trade agreements (FTAs), regional trade agreements (RTAs), or preferential trade agreements
(PTAs), which allow their member countries to enjoy preferential tariffs that are even lower than
Most Favored Nation (MFN) tariffs. In other words, trade liberalization during the last decade
proceeded on a bilateral or regional basis as well.
East Asia and Latin America are not exceptions to the above-described global trend, and have
remarkably reduced tariffs since the late 1980s, especially during the mid-1990s (Table 2-2-1).
As Ando and Estevadeordal (2004) discuss, however, the two regions’ trade policy strategies in
terms of tariffs are different in several points. First, the strategy for tariff binding and
establishing tariff rates is different; there is narrower coverage of tariff bindings and lower MFN
tariffs in East Asia and wider coverage of tariff bindings and higher MFN tariffs in Latin America.
Latin America increased the percentage of bound tariff lines, from 38 percent for industrial
products and 36 percent for agricultural products prior to the Uruguay Round, to 100 percent
thereafter. In other words, tariff ceilings (maximum tariff rates) now exist on all products at the
WTO bound rates (Table 2-2-2 and Table 2-2-3).8 On the other hand, MFN applied tariff rates,
which are lower than the bound rates, were still higher than 10 percent in 1999-2000: 16
percent for Argentina, 16 percent for Brazil, 10 percent for Chile, 12 percent for Colombia, 18
percent for Mexico, 14 percent for Peru, and 13 percent for Venezuela.
7 The contents of this section are heavily drawn from Ando and Estevadeordal (2004) and Ando (2004). 8 WTO bound rates were on average 35 percent for Argentina, 32 percent for Brazil, 25 percent for Chile, 52 percent for Colombia, 49 percent for Mexico, 32 percent for Peru, and 39 percent for Venezuela in 1999-2000.
40
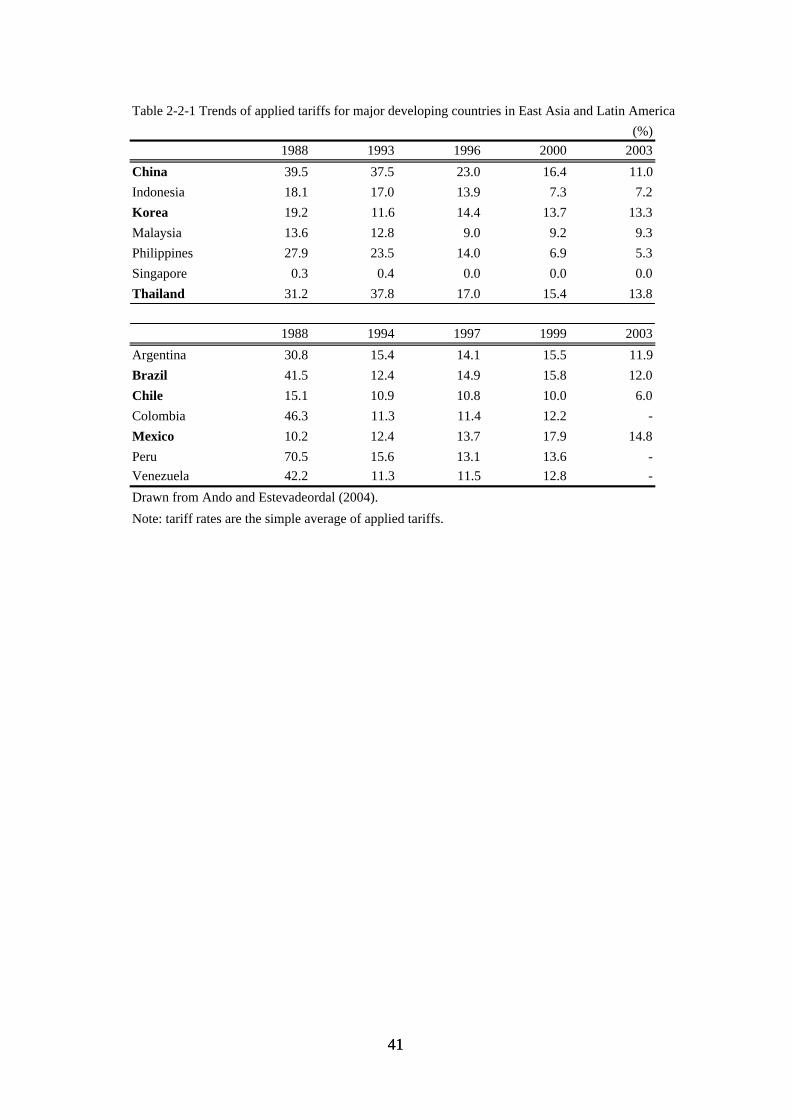
Table 2-2-1 Trends of applied tariffs for major developing countries in East Asia and Latin America(%)
1988 1993 1996 2000 2003China 39.5 37.5 23.0 16.4 11.0Indonesia 18.1 17.0 13.9 7.3 7.2Korea 19.2 11.6 14.4 13.7 13.3Malaysia 13.6 12.8 9.0 9.2 9.3Philippines 27.9 23.5 14.0 6.9 5.3Singapore 0.3 0.4 0.0 0.0 0.0Thailand 31.2 37.8 17.0 15.4 13.8
1988 1994 1997 1999 2003Argentina 30.8 15.4 14.1 15.5 11.9Brazil 41.5 12.4 14.9 15.8 12.0Chile 15.1 10.9 10.8 10.0 6.0Colombia 46.3 11.3 11.4 12.2 -Mexico 10.2 12.4 13.7 17.9 14.8Peru 70.5 15.6 13.1 13.6 -Venezuela 42.2 11.3 11.5 12.8 -Drawn from Ando and Estevadeordal (2004).Note: tariff rates are the simple average of applied tariffs.
41 41

Table 2-2-2 WTO bound tariffs and applied tariffs by sector in major APEC member countries in East Asia and Latin America
1996 2000 2003
All products All
productsAll
products AgricultureFish and
Fishproducts
Petroleumoils
Wood,pulp,
paper, andfurniture
Texitile and
clothing Leather,
rubber, andfootwear etc.
MetalsChemicals
andphotographic
supplies
Transportequipment
Non-electric
machineryElectric
machinery
Mineralproducts and
preciousstones etc.
Manufactu red
articles, n.e.s
East Asia China
WTO bound rate: simple average (%) n.a. n.a. 11.0 - - - - - - - - - - - - -MFN applied rate: simple average (%) 23.0 16.4 11.0 16.8 12.2 6.1 7.0 15.2 13.6 7.4 7.4 15.9 8.6 9.9 9.4 12.3Bound tariff lines (%) n.a. n.a. 100.0 100.0 100.0 100.0 100.0 100.0 100.0 100.0 100.0 100.0 100.0 100.0 100.0 100.0Specific tariff lines 52 (7445) 7 (1061) 0 (171) 1 (19) 0 (348) 0 (1069) 0 (217) 0 (737) 36 (1235) 0 (296) 0 (876) 8 (482) 0 (356) 0 (578)
Indonesia WTO bound rate: simple average (%) 37.2 37.2 37.2 47.7 40.0 39.6 29.2 39.7 38.4 38.2 39.0 34.0 28.1 39.1 36.0MFN applied rate: simple average (%) 13.9 7.3 7.2 8.6 5.0 5.0 4.1 10.5 6.6 8.1 5.5 17.0 2.3 6.1 4.6 7.7Bound tariff lines (%) 93.9 93.9 93.9 100.0 100.0 100.0 98.7 100.0 99.6 93.8 96.3 31.4 92.3 90.1 94.8 85.1Specific tariff lines 12 (7542) 12 (1045) 0 (154) 0 (20) 0 (551) 0 (1203) 0 (271) 0 (883) 0 (1240) 0 (225) 0 (645) 0 (402) 0 (346) 0 (557)
Japan WTO bound rate: simple average (%) 8.0 23.8 5.0 3.4 1.9 7.1 20.5 1.1 2.5 0.1 0.0 0.2 0.8 1.4WTO bound rate: import-weighted (%) 7.4 5.7 3.5 15.3 4.4 3.6 2.0 8.9 11.3 0.6 2.0 0.0 0.0 0.1 0.3 0.7MFN applied rate: simple average (%) 7.5 21.5 6.0 3.5 1.7 7.0 20.5 1.0 2.5 0.1 0.0 0.2 0.9 1.3MFN applied rate: import-weighted (%) 5.0 4.4 2.5 9.8 4.5 0.9 1.5 8.8 11.3 0.6 2.0 0.0 0.0 0.1 0.3 0.7Bound tariff lines (%) 98.9 98.9 99.9 88.1 40.4 93.3 100.0 100.0 100.0 100.0 100.0 100.0 100.0 99.4 100.0Specific tariff lines 661 (9303) 302 (1813) 3 (327) 24 (47) 0 (465) 258 (2106) 28 (435) 33 (883) 8 (1174) 0 (151) 0 (592) 0 (387) 2 (344) 2 (579)
Korea WTO bound rate: simple average (%) 27.6 19.5 17.7 6.1 15.3 11.5 4.8 19.7 12.5 8.2 8.3 8.4 6.6 7.6 9.3 9.5WTO bound rate: import-weighted (%) 15.4 9.6 10.2 89.2 4.0 0.8 3.1 22.3 10.6 5.2 8.7 7.7 6.2 2.3 5.2 7.1MFN applied rate: simple average (%) 14.4 13.7 13.3 52.2 16.8 5.8 3.7 9.8 8.9 5.2 7.0 6.0 6.1 5.5 6.0 6.4MFN applied rate: import-weighted (%) 10.9 8.3 9.0 79.7 13.4 4.5 3.8 10.0 7.2 3.5 6.8 5.6 5.0 2.1 3.1 5.8Bound tariff lines (%) 90.4 91.8 91.4 97.6 34.0 54.6 87.5 99.3 85.7 99.4 95.5 79.6 93.6 70.3 91.4 95.0Specific tariff lines 31 (11261) 0 (1537) 0 (341) 0 (77) 0 (519) 0 (1363) 0 (371) 0 (938) 30 (2313) 0 (319) 0 (1179) 0 (644) 0 (666) 1 (994)
Malaysia WTO bound rate: simple average (%) 17.2 17.2 - - - - - - - - - - - - -MFN applied rate: simple average (%) 9.0 9.2 9.3 - - - - - - - - - - - - -Bound tariff lines (%) 61.8 61.8 - - - - - - - - - - - - -Specific tariff lines 83 (10458) 70 (1316) 0 (144) 0 (30) 2 (2305) 0 (1089) 5 (399) 4 (1044) 1 (1508) 0 (481) 1 (714) 0 (494) 0 (350) 0 (584)
PhilippinesWTO bound rate: simple average (%) 31.6 27.6 25.5 33.9 33.5 - 24.4 29.2 32.8 26.1 20.3 20.0 17.9 19.4 22.3 22.6WTO bound rate: import-weighted (%) 14.5 20.0 28.7 11.5 24.7 27.0 32.2 25.6 22.4 13.4 26.1 4.4 13.9 10.3MFN applied rate: simple average (%) 14.0 6.9 5.3 7.0 7.1 2.6 6.0 9.5 5.6 4.5 3.6 8.1 2.1 3.9 4.3 4.0MFN applied rate: import-weighted (%) 3.9 3.1 5.1 3.8 3.0 5.5 6.3 6.6 3.5 5.2 8.6 1.8 1.0 3.9 2.6Bound tariff lines (%) 63.3 64.6 12.3 0.1 0.0 2.0 14.6 1.1 3.6 11.7 1.0 7.8 4.2 2.4 4.1Specific tariff lines (5556) (685) (109) (10) (297) (820) (173) (648) (910) (161) (572) (389) (313) (469)
42

(Continue)1996 2000 2003
Allproducts
Allproducts
Allproducts Agriculture
Fish andFish
productsPetroleum
oils
Wood,pulp,
paper, andfurniture
Texitileand
clothing
Leather,rubber, and
footwear etc.Metals
Chemicalsand
photographicsupplies
Transportequipment
Non-electric
machineryElectric
machinery
Mineralproducts and
preciousstones etc.
Manufactured
articles,n.e.s
SingaporeWTO bound rate: simple average (%) 10.0 6.5 5.3 6.2 6.5 6.5 2.3 6.5 6.5 4.3 5.0 6.2 4.5 4.0 6.5 4.9WTO bound rate: import-weighted (%) 3.0 3.1 4.2 6.5 6.5 1.6 6.5 6.5 4.6 5.0 6.4 1.5 1.0 6.5 3.6MFN applied rate: simple average (%) 0.0 0.0 0.0 0.0 0.0 0.0 0.0 0.0 0.0 0.0 0.0 0.0 0.0 0.0 0.0 0.0MFN applied rate: import-weighted (%) 0.0 0.0 0.0 0.0 0.0 0.0 0.0 0.0 0.0 0.0 0.0 0.0 0.0 0.0 0.0Bound tariff lines (%) 70.0 85.0 91.1 99.8 100.0 100.0 96.2 82.6 100.0 86.9 97.6 99.4 88.9 89.3 99.0 72.7Specific tariff lines 4 (6036) 4 (871) 0 (121) 0 (23) 0 (293) 0 (930) 0 (198) 0 (663) 0 (987) 0 (158) 0 (602) 0 (408) 0 (293) 0 (473)
ThailandWTO bound rate: simple average (%) 39.7 28.2 31.9 8.4 23.0 24.6 33.2 29.1 22.5 26.4 50.8 28.0 19.8 27.4 29.6MFN applied rate: simple average (%) 17.0 15.4 13.8 27.4 5.4 3.3 14.7 21.4 19.5 12.2 5.6 26.0 1.0 11.5 7.4 14.4Bound tariff lines (%) 73.1 68.4 94.0 100.0 7.6 82.2 92.3 49.5 48.8 54.7 16.7 83.0 57.4 51.0 75.0Specific tariff lines 93 (6204) 59 (780) 0 (97) 15 (53) 5 (314) 0 (896) 0 (303) 0 (637) 9 (923) 0 (215) 1 (629) 0 (453) 0 (522) 4 (208)
Latin AmericaChile
WTO bound rate: simple average (%) 25.0 25.1 25.1 25.6 25.0 25.0 25.0 25.0 25.0 25.0 25.0 25.0 25.0 25.0 25.0 25.0MFN applied rate: simple average (%) 11.0 9.2 6.0 6.0 6.0 6.0 6.0 6.0 6.0 6.0 6.0 6.0 6.0 6.0 6.0 6.0Bound tariff lines (%) 100.0 100.0 100.0 100.0 100.0 100.0 100.0 100.0 100.0 100.0 100.0 100.0 100.0 100.0 100.0Specific tariff lines 0 (7901) 0 (1125) 0 (383) 0 (24) 0 (397) 0 (1144) 0 (276) 0 (704) 0 (1305) 0 (343) 0 (745) 0 (520) 0 (336) 0 (599)
MexicoWTO bound rate: simple average (%) 36.2 36.2 47.9 35.0 35.0 35.0 35.0 35.0 35.0 35.0 35.0 35.0 35.0 35.0 35.0WTO bound rate: import-weighted (%) - - 35.0 35.0 35.0 35.0 35.0 35.0 35.0 35.0 35.0 35.0 35.0 35.0MFN applied rate: simple average (%) 16.2 16.4 25.9 27.7 10.5 15.2 23.5 20.1 15.3 10.8 17.1 12.8 16.2 12.3 17.4MFN applied rate: import-weighted (%) 3.1 2.8 6.3 8.3 1.5 1.5 2.2 3.9 1.4 2.3 3.0 1.3 1.0 1.0 2.2Bound tariff lines (%) 100.0 100.0 100.0 100.0 100.0 100.0 100.0 100.0 100.0 100.0 100.0 100.0 100.0 100.0 100.0Specific tariff lines 58 (11809) 55 (1054) 0 (130) 0 (73) 0 (385) 0 (1244) 0 (364) 0 (922) 3 (2811) 0 (370) 0 (1432) 0 (1063) 0 (201) 0 (1760)
Drawn from Ando and Estevadeordal (2004). Data for Japan, Chile, and Mexico are added to the original table, based on APEC Individual Action Plan for each country.Notes: data for 2000 are of 2000 or 2001. Bound tariff lines (%) present the shares in total tariff lines in corresponding sectors. Figures in parenthesis for specific tariff lines are the total number of tariff lines in corresponding sectors. WTO bound rates for Indonesia in 2003 are of 2001. WTO bound rates for Malaysia are the simple average of tariffs on industrial products. Data for applied tariffs and the total number of tariff lines in the Philippines do not include "sensitive" agriculture products under E.O. 313 and E.O. 328. In calcurating applied tariffs in Thailand, the ad valorem equivalents of specific tariffs are assumed to be 30 percent for rice and 20% and 25% for sugar.
43

Table 2-2-3 WTO Bound Tariffs and Applied Tariffs by Sector in Latin America: 1999-2000
All products Agriculture Manufacturing
ArgentinaWTO bound rate (%) 35.0 23.0 31.0MFN applied rate (%) 15.5 13.5 15.8MFN applied rate (stand.dev.) 6.1 4.9 6.3
BrazilWTO bound rate (%) 32.0 36.0 32.0MFN applied rate (%) 15.7 13.1 16.1MFN applied rate (stand.dev.) 6.2 5.2 6.2
ChileWTO bound rate (%) 25.0 32.0 25.0MFN applied rate (%) 9.9 10.0 9.9MFN applied rate (stand.dev.) 0.4 0.0 0.5
ColombiaWTO bound rate (%) 52.0 85.0 40.0MFN applied rate (%) 12.2 16.1 11.5MFN applied rate (stand.dev.) 6.1 4.6 6.1
MexicoWTO bound rate (%) 49.0 47.0 49.0MFN applied rate (%) 17.8 24.8 16.7MFN applied rate (stand.dev.) 14.8 33.7 8.0
PeruWTO bound rate (%) 32.0 38.0 30.0MFN applied rate (%) 13.6 16.6 13.1MFN applied rate (stand.dev.) 3.6 6.0 2.7
VenezuelaWTO bound rate (%) 39.0 50.0 35.0MFN applied rate (%) 12.8 16.9 12.1MFN applied rate (stand.dev.) 6.4 5.2 6.3
Drawn from Ando and Estevadeordal (2004).Note: WTO bound rates and applied rates are the simple average.
44

In contrast, East Asian countries other than China have not bound all tariff lines (Table 2-2-2).
Coverage of bound tariffs was 94 percent for Indonesia, 99 percent for Japan, 91 percent for
Korea, 62 percent for Malaysia, 63 percent for the Philippines, 85 percent for Singapore, and 73
percent for Thailand in 2000 and 100 percent for China in 2003.9 Average tariffs per se,
however, are lower in East Asia: the average MFN tariff rate in the region is approximately
seven percent, which is much lower than the 10+ percent rate in Latin America (Figure 2-2-1).
MFN applied rates (simple average) for each country were 16 percent for China, seven percent
for Indonesia, 14 percent for Korea, nine percent for Malaysia, seven percent for the Philippines,
0 percent for Singapore, and 15 percent for Thailand in 2000.10 Although some tariffs could
theoretically be raised without a ceiling since they are not bounded, contrary to Latin America,
overall tariff rates in terms of ad valorem tariffs are actually lower in East Asia.
Second, the two regions take different approaches to import substitution and export promotion.
East Asian countries have gradually shifted their focus to export orientation from import
substitution, though they have long taken “the dual-track approach”.11 Particularly since the
mid-1980s or the early 1990s, they have implemented various types of trade and FDI facilitation
measures to aggressively attract incoming FDI, formulate industrial clusters, and develop
international production/distribution networks. 12 As one export-oriented policy, East Asian
countries have effectively utilized a duty drawback system, i.e., a system of refunds of duties
and indirect taxes on imported intermediate inputs used in producing exported goods. Under
this system, export-oriented affiliates of multinational enterprises (MNEs), who account for a
large share of imports particularly in manufacturing sectors such as general machinery and
electric machinery, pay extremely low tariffs on imported intermediate goods used for the
production of exports. As Figure 2-2-2 clearly shows, average tariff rates in terms of custom
duty import ratios are adjusted down to rates far below the MFN rates.
9 China bound all tariffs upon its accession to the WTO. 10 Korea’s simple average of MFN applied tariffs exceeds 10 percent, as do the corresponding averages of China and Thailand. The high simple average tariff rate is due to much higher tariffs imposed on the agricultural and fishery sectors than on manufacturing sectors, particularly high out-quota tariffs. The import-weighted average tariff rates are much lower. 11 Pangestu (2003, Tables 17.1 and 17.2) provides an excellent review on the evolution of industrial policies in East Asia in the 1950s-1990s as well as various policies and measures for promoting exports implemented in Asian countries. Also, see Ando and Kimura (2005) for further discussion on the drastic changes in export promotion and development strategies applied by the East Asian developing economies. 12 See Ando and Kimura (2005) and Kimura and Ando (2003, 2005a, 2005b) for micro-data analysis of MNEs (Japanese and U.S. firms) and discussion on the formation of international production/distribution networks in East Asia and other regions.
45

Figure 2-2-1 MFN and preferential tariffs in East Asia and Latin America: 2000
Drawn from Ando and Estevadeordal (2004).Notes: “Tariffs_sd” and “Pref. Tariffs_sd” stand for standard deviation of MFN tariffs and preferential tariffs,respectively. Data includes preferential tariffs in most Latin American Agreements currently in force for LatinAmerica and those in AFTA and ANZSCEP agreements for Asia. In the figure, average level (medium) isexpressed by the horizontal line within each box. Boxes surround the interquartile range from the 25th to 75thpercentile, and whiskers extend up and down to “adjacent values”, defined as 1.5 times the length of theinterquartile range. Each plot outside the box and line presents an outlier.
Latin AmericaAsia
%
40
35
30
25
20
15
10
5
0
-5
Tariffs
Tariffs_sdLatin AmericaAsia
%
40
35
30
25
20
15
10
5
0
-5
Pref.Tariffs
Pref.Tariffs_sd
46
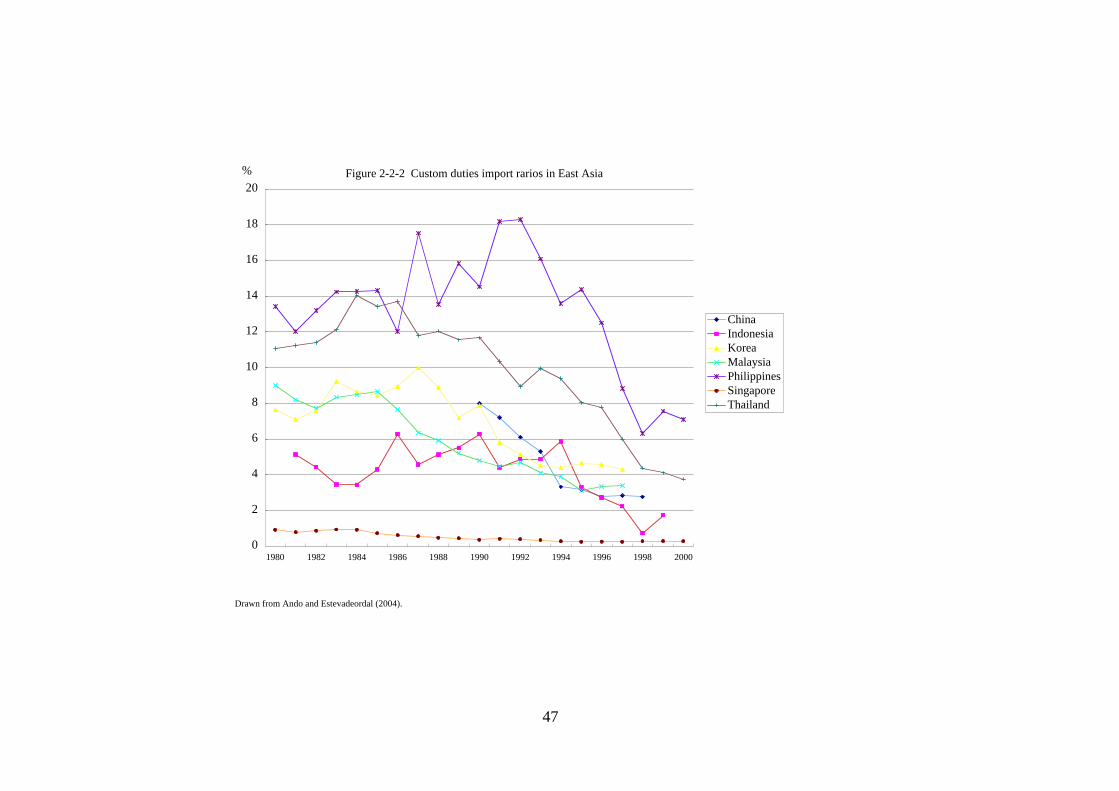
Drawn from Ando and Estevadeordal (2004).
Figure 2-2-2 Custom duties import rarios in East Asia
0
2
4
6
8
10
12
14
16
18
20
1980 1982 1984 1986 1988 1990 1992 1994 1996 1998 2000
%
ChinaIndonesiaKoreaMalaysiaPhilippinesSingaporeThailand
47

In East Asia, trade in machinery goods, particularly machinery parts and components, is
astonishingly sizeable. Figure 2-2-3 presents the shares of machinery goods and machinery
parts and components in each country’s total exports and imports, where machinery goods
include general machinery, electric machinery, transport equipment, and precision machinery
(HS 84-92). The shares of machinery goods for most of the East Asian countries reach as high
as 40 percent or even up to around 70 percent. Moreover, the shares of parts and components
in machinery trade are also very high: more than half of machinery trade is in machinery parts
and components. East Asian trade includes a large portion of back-and-forth transactions of
parts and components of manufactured products among countries in the region, utilizing various
types of trade facilitation measures, including the duty drawback system.13
In contrast, Latin America has not actively implemented those types of export-oriented policies.
Rather, import-substituting policies in manufacturing sectors seem to be reflected in their tariff
rates by sector: tariffs in manufacturing sectors are almost the same or even higher than those
in agricultural sectors in some countries such as Argentina and Brazil, while tariffs in
manufacturing sectors are basically much lower than those in agricultural sectors in East Asia
(Table 2-2-2 and Table 2-2-3). Of course, Latin American countries provide many member
countries of FTAs/PTAs with preferential tariffs that are much lower than MFN tariffs since they
have concluded FTAs/PTAs (Table 2-2-4). As Figure 2-2-1 clearly shows, the gap between
MFN tariffs and preferential tariffs, or the marginal preference, is much wider in Latin America
than in East Asia. These lower preferential tariffs may contribute to an increase in exports
to/imports from the member countries, but non-members are doubtlessly forced to bear much
higher MFN tariffs when they export to Latin America.14
13 See Ando (2005) for an analysis of the development of trade structures and vertical production sharing in East Asia in the 1990s. 14 Since local supporting industries are typically immature in developing countries, MNEs must often import key parts and components from the home country. Thus, MNEs from non-member countries would face serious disadvantages in competition with intra-regional MNEs.
48

Drawn from Ando and Estevadeordal (2004).Notes: Machinery goods are defined as HS 84-92; i.e., they include general machinery, electric machinery,transport equipment, and precision machinery.
East Asia
0
10
20
30
40
50
60
70
80
Philipp
ines
Singap
ore
Malaysi
aJap
anKore
a
Thaila
nd
Hong K
ong
China
Indon
esia
%
Exports: machinery goods Imports: machinery goodsExports: parts and components in machinery goods Imports: parts and components in machinery goods
Figure 2-2-3 Trade in machinery goods and machinery parts and componentsin 2000:
Latin America
0
10
20
30
40
50
60
70
80
U.S.A.
Mexico
Brazil
Argenti
na
Colombia
Chile
Hondu
ras
Venezu
ela
Guatem
ala Peru
Ecuad
or
%
49

Given/
ReceivingAll Products Argentina 7.7 0 7.6 11.9 10.2 11.1 11.9 0.1 0.1 12.1 7.3 15.5
Bolivia 5.4 5.4 8.6 0 0 2 0 5.4 5.4 0 3.2 9.7Brazil 0 6.2 6.5 11.8 9.4 12.9 11.8 0.2 0.1 11.8 7.1 15.7Chile 4.1 7 4.1 0.9 0.3 9.1 5.6 4 4 0.2 3.9 9.9Colombia 10.9 0 11.1 1.3 0 7 4.2 9.4 10.5 0 5.4 12.2Ecuador 13.5 0 13.7 0.6 0 13.7 4.3 8.9 8.8 0 6.4 14.2Mexico 13 2.9 15.2 14.1 6.5 11.4 13.1 8.9 4.2 8.1 9.7 17.8Peru 12.8 0 13 9.4 4.1 1.6 12.8 12.2 12.6 3.9 8.2 13.6Paraguay 0.4 6 0.4 6.2 12.2 8.1 12.1 12.1 0.4 11.9 7 13.1Uruguay 0.5 6.3 0.5 6.4 12.1 8 6.7 12.1 0.7 12.1 6.6 13.7Venezuela 11.6 0 11.7 0.3 0 0 8.5 4 9.4 10.9 5.6 12.8
Agriculture Argentina 5.1 0 4.5 9.5 7 8.1 9.1 0 0 9.5 5.3 13.5Bolivia 6 6 8.1 0 0 6.5 0 5.8 5.9 0 3.8 9.9Brazil 0 3.2 3.7 9.7 7.4 10.8 9.7 0 0 9.7 5.4 13.1Chile 3.3 5.6 3.3 2 1.3 8.9 4.7 3.3 3.3 0.6 3.6 10Colombia 13.7 0 14.1 3.4 0 11.4 3.1 10.9 13 0 7 16.1Ecuador 17 0 17.4 3.2 0 17.9 3.1 10.7 9.6 0 7.9 18.3Mexico 19.3 13.7 21.7 20.5 14.4 17.4 19.3 13.1 10.6 14.2 16.4 24.8Peru 14.6 0 15.1 11.4 3.5 1.8 15.8 13.5 14.4 3.3 9.3 16.6Paraguay 0.3 4.7 0.3 4.1 12.4 7.6 12.4 12.3 0.3 12.4 6.7 13.3Uruguay 0.3 4.6 0.3 3.9 11.5 6.7 7 11.4 0.4 11.5 5.8 13Venezuela 15.1 0 15.3 1.3 0 0 11.3 3.1 11.8 14.5 7.2 16.9
Manufactures Argentina 8 0 8 12.2 10.6 11.5 12.3 0.1 0.1 12.5 7.5 15.8Bolivia 5.3 5.3 8.6 0 0 1.3 0 5.3 5.3 0 3.1 9.6Brazil 0 6.7 6.9 12.1 9.7 13.2 12.1 0.2 0 12.1 7.3 16.1Chile 4.1 7.2 4.1 0.6 0 9.1 5.7 4.1 4.1 0.1 3.9 9.9Colombia 10.4 0 10.6 0.9 0 6.3 4.3 9 10 0 5.2 11.5Ecuador 12.8 0 13.1 0.1 0 12.9 4.5 8.5 8.7 0 6.1 13.6Mexico 11.9 1.1 14.1 13 5.1 10.4 12 8.1 3.2 7 8.6 16.7Peru 12.4 0 12.6 9.1 4.1 1.5 12.3 12 12.3 3.9 8 13.1Paraguay 0.4 6.1 0.4 6.5 12.1 8.2 12 12 0.4 11.8 7 13.1Uruguay 0.5 6.5 0.5 6.7 12.2 8.1 6.6 12.2 0.7 12.2 6.6 13.8Venezuela 11 0 11 0.1 0 0 8 4.1 9 10.3 5.4 12.1
Drawn from Ando and Estevadordal (2004).
MFNtariffs
(average)Argentina Bolivia Brazil
Table 2-2-4 Preferential tariff rates in Latin America, 1999-2000
Preferentialtariffs
(average)Peru Paraguay Uruguay VenezuelaChile Colombia Ecuador Mexico
51

In fact, Latin American countries, with Mexico as a notable exception, present by far lower
shares of machinery exports than those observed for countries in East Asia (Figure 2-2-3). In
particular, the shares of machinery parts and components are fairly low: 26 percent for Mexico,
11 percent for Brazil, and less than 5 percent for the remaining countries. Furthermore, the
shares of machinery imports are much higher than the shares of exports. These indicate that
manufacturing production activities in Latin America are basically of an import-substituting type,
except the production sharing between the United States and Mexico.
Third, the types of tariffs implemented are different. Latin America imposes only ad valorem
tariffs on imports; Chile, a typical country, has applied uniform tariffs. In contrast, East Asia still
implements not only ad valorem tariffs but also specific tariffs or a combination of the two. In
2003, for instance, China has 52 specific tariff lines out of 7,445 tariff lines, Indonesia 12 out of
7,542, Japan 661 out of 9,303, Korea 31 out of 11,261, Malaysia 83 out of 10,458, Singapore 4
out of 6,036, and Thailand 93 out of 6,204 (Table 2-2-2). The sectors in which specific tariffs
are implemented vary among countries, but many of the tariff lines with specific tariffs are
commonly found in sectors such as agriculture and chemicals. Since specific tariffs cannot
automatically be converted into ad valorem rates, average rates of ad valorem tariffs may in
some cases underestimate the degree of trade protection created by tariffs on the whole in East
Asia.
Fourth, methods for protecting specific products are different. In Latin America, the standard
deviations of MFN tariffs are small (less than 10 percent), except for the agricultural sector in
Mexico, indicating that MFN tariffs are relatively uniform across products (Table 2-2-3). In
addition, when dispersion (standard deviation) among MFN tariffs is compared to dispersion
among preferential tariffs, Latin America shows greater spreads among preferential tariffs
(Figure 2-2-1). Latin America is perhaps protecting specific products by imposing differentiated
levels of preferential tariffs in addition to higher MFN tariffs that are relatively uniform across
products. In contrast, East Asia shows greater spreads among MFN tariffs than among
preferential tariffs (Figure 2-2-1). Moreover, East Asian countries present variation across
sectors in MFN tariff rates, the percentage of bound tariff lines, and the application of specific
tariffs (Table 2-2-2). East Asia seems to favor the use of MFN tariffs over preferential tariffs as
a method for effectively protecting specific products.P
52
2-2-2 Trade Protection by Non-tariff Measures
So far, we have discussed tariff policies in the two regions, focusing on their differences. Yet
differences are also reflected in measures other than tariffs, or non-tariff measures (NTMs).
Table 2-2-5 and Table 2-2-6 present by-type frequency ratios of NTMs, i.e., the percentage of
tariff lines subject to NTMs, in 21 sectors and all sectors in East Asia and Latin America,
respectively.15 In constructing by-type frequency ratios, based on the information available from
the UNCTAD database, variable measures that are reported by each country are categorized
into the following types since they are inconsistent across countries: 1. Price control measures,
1-(1) Administrative pricing, 1-(3) Variable charges, 1-(4) Anti-dumping (AD) measures, 1-(5)
Countervailing (CV) measures, 3. Automatic licensing measures, 4. Quantity control measures,
4-(1) Non-automatic licensing measures, 4-(2) Import quota, 4-(3) Import prohibition, 4-(4)
Export restraint agreements, 5. Monopolistic measures, 5-(1) Single channel for imports, 6.
Technical measures, 6-(1) Technical regulations, and 6-(3) Special customs formalities. Note
that the types of measures reported are inconsistent among countries, and thus a small number
of incidences does not necessarily mean low protection provided by NTMs in the case of
countries with only a few types of NTMs reported. Also, unfortunately, the NTM data for some
countries is several years old.
The tables illustrate that both East Asia and Latin America implement NTMs, in particular price
control measures, quantity control measures, and technical measures. Two significant
differences are observed. First, the scope of NTM application considerably varies. In Latin
America, NTMs are implemented more widely within and across sectors than in East Asia. It
should be borne in mind, however, that the UNCTAD database Trade Analysis and Information
System (TRAINS), used for frequency-ratio calculations, is provided on a reporting base. Data
for Latin America have been firmly corrected with additional data collection at the Inter-
American Development Bank, while data for East Asia have not. Even so, a difference in the
range of products subject to NTMs is clearly apparent. Second, the principal measures
implemented in the two regions are dissimilar. Latin America as a whole generally depends
upon technical measures while East Asia mainly employs quantity control measures.
15 See Ando (2002) and Ando (2004) for the details of frequency ratios of NTMs.
53
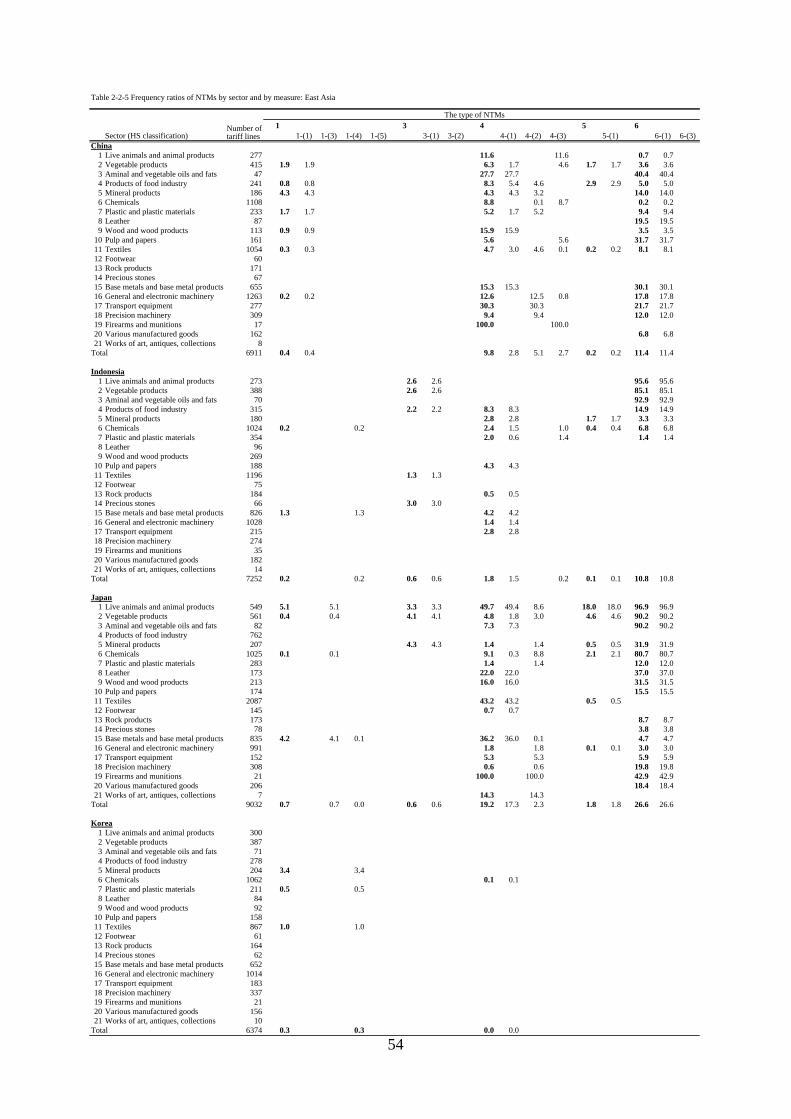
54
Table 2-2-5 Frequency ratios of NTMs by sector and by measure: East Asia
The type of NTMs1 3 4 5 6
Sector (HS classification) 1-(1) 1-(3) 1-(4) 1-(5) 3-(1) 3-(2) 4-(1) 4-(2) 4-(3) 5-(1) 6-(1) 6-(3)China
1 Live animals and animal products 277 11.6 11.6 0.7 0.72 Vegetable products 415 1.9 1.9 6.3 1.7 4.6 1.7 1.7 3.6 3.63 Aminal and vegetable oils and fats 47 27.7 27.7 40.4 40.44 Products of food industry 241 0.8 0.8 8.3 5.4 4.6 2.9 2.9 5.0 5.05 Mineral products 186 4.3 4.3 4.3 4.3 3.2 14.0 14.06 Chemicals 1108 8.8 0.1 8.7 0.2 0.27 Plastic and plastic materials 233 1.7 1.7 5.2 1.7 5.2 9.4 9.48 Leather 87 19.5 19.59 Wood and wood products 113 0.9 0.9 15.9 15.9 3.5 3.5
10 Pulp and papers 161 5.6 5.6 31.7 31.711 Textiles 1054 0.3 0.3 4.7 3.0 4.6 0.1 0.2 0.2 8.1 8.112 Footwear 6013 Rock products 17114 Precious stones 6715 Base metals and base metal products 655 15.3 15.3 30.1 30.116 General and electronic machinery 1263 0.2 0.2 12.6 12.5 0.8 17.8 17.817 Transport equipment 277 30.3 30.3 21.7 21.718 Precision machinery 309 9.4 9.4 12.0 12.019 Firearms and munitions 17 100.0 100.020 Various manufactured goods 162 6.8 6.821 Works of art, antiques, collections 8
Total 6911 0.4 0.4 9.8 2.8 5.1 2.7 0.2 0.2 11.4 11.4
Indonesia1 Live animals and animal products 273 2.6 2.6 95.6 95.62 Vegetable products 388 2.6 2.6 85.1 85.13 Aminal and vegetable oils and fats 70 92.9 92.94 Products of food industry 315 2.2 2.2 8.3 8.3 14.9 14.95 Mineral products 180 2.8 2.8 1.7 1.7 3.3 3.36 Chemicals 1024 0.2 0.2 2.4 1.5 1.0 0.4 0.4 6.8 6.87 Plastic and plastic materials 354 2.0 0.6 1.4 1.4 1.48 Leather 969 Wood and wood products 269
10 Pulp and papers 188 4.3 4.311 Textiles 1196 1.3 1.312 Footwear 7513 Rock products 184 0.5 0.514 Precious stones 66 3.0 3.015 Base metals and base metal products 826 1.3 1.3 4.2 4.216 General and electronic machinery 1028 1.4 1.417 Transport equipment 215 2.8 2.818 Precision machinery 27419 Firearms and munitions 3520 Various manufactured goods 18221 Works of art, antiques, collections 14
Total 7252 0.2 0.2 0.6 0.6 1.8 1.5 0.2 0.1 0.1 10.8 10.8
Japan1 Live animals and animal products 549 5.1 5.1 3.3 3.3 49.7 49.4 8.6 18.0 18.0 96.9 96.92 Vegetable products 561 0.4 0.4 4.1 4.1 4.8 1.8 3.0 4.6 4.6 90.2 90.23 Aminal and vegetable oils and fats 82 7.3 7.3 90.2 90.24 Products of food industry 7625 Mineral products 207 4.3 4.3 1.4 1.4 0.5 0.5 31.9 31.96 Chemicals 1025 0.1 0.1 9.1 0.3 8.8 2.1 2.1 80.7 80.77 Plastic and plastic materials 283 1.4 1.4 12.0 12.08 Leather 173 22.0 22.0 37.0 37.09 Wood and wood products 213 16.0 16.0 31.5 31.5
10 Pulp and papers 174 15.5 15.511 Textiles 2087 43.2 43.2 0.5 0.512 Footwear 145 0.7 0.713 Rock products 173 8.7 8.714 Precious stones 78 3.8 3.815 Base metals and base metal products 835 4.2 4.1 0.1 36.2 36.0 0.1 4.7 4.716 General and electronic machinery 991 1.8 1.8 0.1 0.1 3.0 3.017 Transport equipment 152 5.3 5.3 5.9 5.918 Precision machinery 308 0.6 0.6 19.8 19.819 Firearms and munitions 21 100.0 100.0 42.9 42.920 Various manufactured goods 206 18.4 18.421 Works of art, antiques, collections 7 14.3 14.3
Total 9032 0.7 0.7 0.0 0.6 0.6 19.2 17.3 2.3 1.8 1.8 26.6 26.6
Korea1 Live animals and animal products 3002 Vegetable products 3873 Aminal and vegetable oils and fats 714 Products of food industry 2785 Mineral products 204 3.4 3.46 Chemicals 1062 0.1 0.17 Plastic and plastic materials 211 0.5 0.58 Leather 849 Wood and wood products 92
10 Pulp and papers 15811 Textiles 867 1.0 1.012 Footwear 6113 Rock products 16414 Precious stones 6215 Base metals and base metal products 65216 General and electronic machinery 101417 Transport equipment 18318 Precision machinery 33719 Firearms and munitions 2120 Various manufactured goods 15621 Works of art, antiques, collections 10
Total 6374 0.3 0.3 0.0 0.0
Number oftariff lines
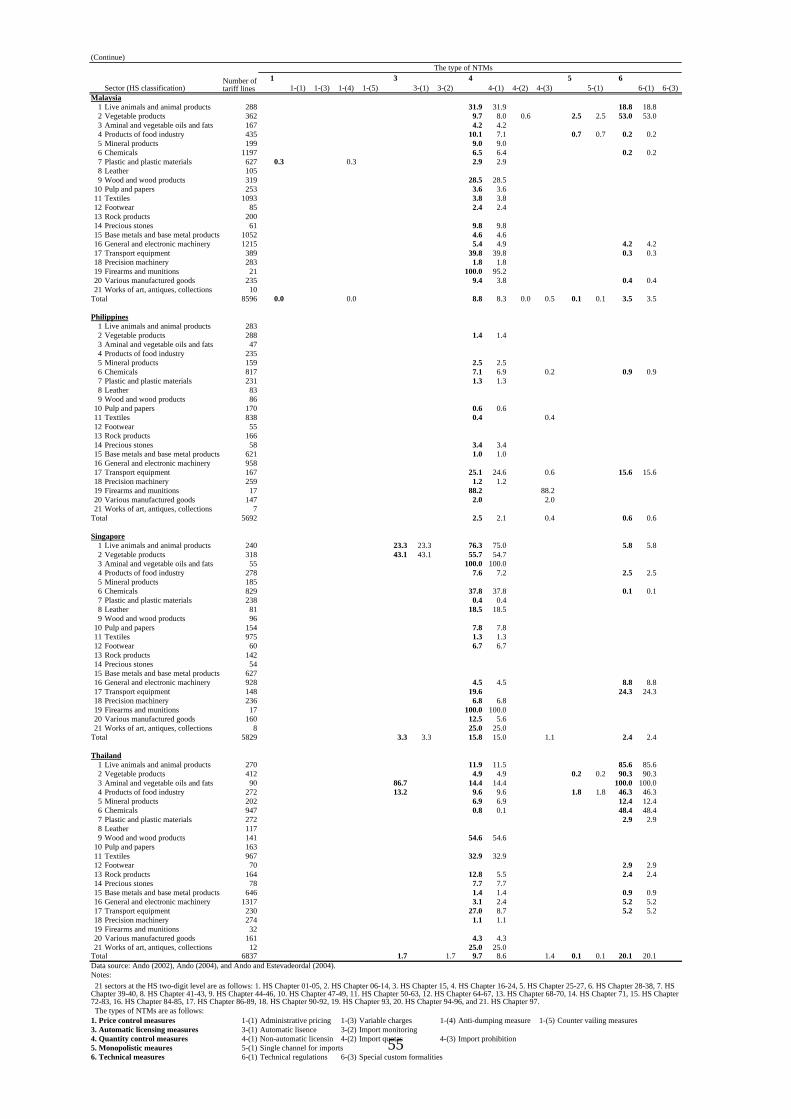
55
(Continue)The type of NTMs
1 3 4 5 6Sector (HS classification) 1-(1) 1-(3) 1-(4) 1-(5) 3-(1) 3-(2) 4-(1) 4-(2) 4-(3) 5-(1) 6-(1) 6-(3)
Malaysia1 Live animals and animal products 288 31.9 31.9 18.8 18.82 Vegetable products 362 9.7 8.0 0.6 2.5 2.5 53.0 53.03 Aminal and vegetable oils and fats 167 4.2 4.24 Products of food industry 435 10.1 7.1 0.7 0.7 0.2 0.25 Mineral products 199 9.0 9.06 Chemicals 1197 6.5 6.4 0.2 0.27 Plastic and plastic materials 627 0.3 0.3 2.9 2.98 Leather 1059 Wood and wood products 319 28.5 28.5
10 Pulp and papers 253 3.6 3.611 Textiles 1093 3.8 3.812 Footwear 85 2.4 2.413 Rock products 20014 Precious stones 61 9.8 9.815 Base metals and base metal products 1052 4.6 4.616 General and electronic machinery 1215 5.4 4.9 4.2 4.217 Transport equipment 389 39.8 39.8 0.3 0.318 Precision machinery 283 1.8 1.819 Firearms and munitions 21 100.0 95.220 Various manufactured goods 235 9.4 3.8 0.4 0.421 Works of art, antiques, collections 10
Total 8596 0.0 0.0 8.8 8.3 0.0 0.5 0.1 0.1 3.5 3.5
Philippines1 Live animals and animal products 2832 Vegetable products 288 1.4 1.43 Aminal and vegetable oils and fats 474 Products of food industry 2355 Mineral products 159 2.5 2.56 Chemicals 817 7.1 6.9 0.2 0.9 0.97 Plastic and plastic materials 231 1.3 1.38 Leather 839 Wood and wood products 86
10 Pulp and papers 170 0.6 0.611 Textiles 838 0.4 0.412 Footwear 5513 Rock products 16614 Precious stones 58 3.4 3.415 Base metals and base metal products 621 1.0 1.016 General and electronic machinery 95817 Transport equipment 167 25.1 24.6 0.6 15.6 15.618 Precision machinery 259 1.2 1.219 Firearms and munitions 17 88.2 88.220 Various manufactured goods 147 2.0 2.021 Works of art, antiques, collections 7
Total 5692 2.5 2.1 0.4 0.6 0.6
Singapore1 Live animals and animal products 240 23.3 23.3 76.3 75.0 5.8 5.82 Vegetable products 318 43.1 43.1 55.7 54.73 Aminal and vegetable oils and fats 55 100.0 100.04 Products of food industry 278 7.6 7.2 2.5 2.55 Mineral products 1856 Chemicals 829 37.8 37.8 0.1 0.17 Plastic and plastic materials 238 0.4 0.48 Leather 81 18.5 18.59 Wood and wood products 96
10 Pulp and papers 154 7.8 7.811 Textiles 975 1.3 1.312 Footwear 60 6.7 6.713 Rock products 14214 Precious stones 5415 Base metals and base metal products 62716 General and electronic machinery 928 4.5 4.5 8.8 8.817 Transport equipment 148 19.6 24.3 24.318 Precision machinery 236 6.8 6.819 Firearms and munitions 17 100.0 100.020 Various manufactured goods 160 12.5 5.621 Works of art, antiques, collections 8 25.0 25.0
Total 5829 3.3 3.3 15.8 15.0 1.1 2.4 2.4
Thailand1 Live animals and animal products 270 11.9 11.5 85.6 85.62 Vegetable products 412 4.9 4.9 0.2 0.2 90.3 90.33 Aminal and vegetable oils and fats 90 86.7 14.4 14.4 100.0 100.04 Products of food industry 272 13.2 9.6 9.6 1.8 1.8 46.3 46.35 Mineral products 202 6.9 6.9 12.4 12.46 Chemicals 947 0.8 0.1 48.4 48.47 Plastic and plastic materials 272 2.9 2.98 Leather 1179 Wood and wood products 141 54.6 54.6
10 Pulp and papers 16311 Textiles 967 32.9 32.912 Footwear 70 2.9 2.913 Rock products 164 12.8 5.5 2.4 2.414 Precious stones 78 7.7 7.715 Base metals and base metal products 646 1.4 1.4 0.9 0.916 General and electronic machinery 1317 3.1 2.4 5.2 5.217 Transport equipment 230 27.0 8.7 5.2 5.218 Precision machinery 274 1.1 1.119 Firearms and munitions 3220 Various manufactured goods 161 4.3 4.321 Works of art, antiques, collections 12 25.0 25.0
Total 6837 1.7 1.7 9.7 8.6 1.4 0.1 0.1 20.1 20.1Data source: Ando (2002), Ando (2004), and Ando and Estevadeordal (2004).Notes:
The types of NTMs are as follows:1. Price control measures 1-(1) Administrative pricing 1-(3) Variable charges 1-(4) Anti-dumping measures 1-(5) Counter vailing measures3. Automatic licensing measures 3-(1) Automatic lisence 3-(2) Import monitoring4. Quantity control measures 4-(1) Non-automatic licensin 4-(2) Import quotas 4-(3) Import prohibition5. Monopolistic meaures 5-(1) Single channel for imports6. Technical measures 6-(1) Technical regulations 6-(3) Special custom formalities
Number oftariff lines
21 sectors at the HS two-digit level are as follows: 1. HS Chapter 01-05, 2. HS Chapter 06-14, 3. HS Chapter 15, 4. HS Chapter 16-24, 5. HS Chapter 25-27, 6. HS Chapter 28-38, 7. HSChapter 39-40, 8. HS Chapter 41-43, 9. HS Chapter 44-46, 10. HS Chapter 47-49, 11. HS Chapter 50-63, 12. HS Chapter 64-67, 13. HS Chapter 68-70, 14. HS Chapter 71, 15. HS Chapter72-83, 16. HS Chapter 84-85, 17. HS Chapter 86-89, 18. HS Chapter 90-92, 19. HS Chapter 93, 20. HS Chapter 94-96, and 21. HS Chapter 97.
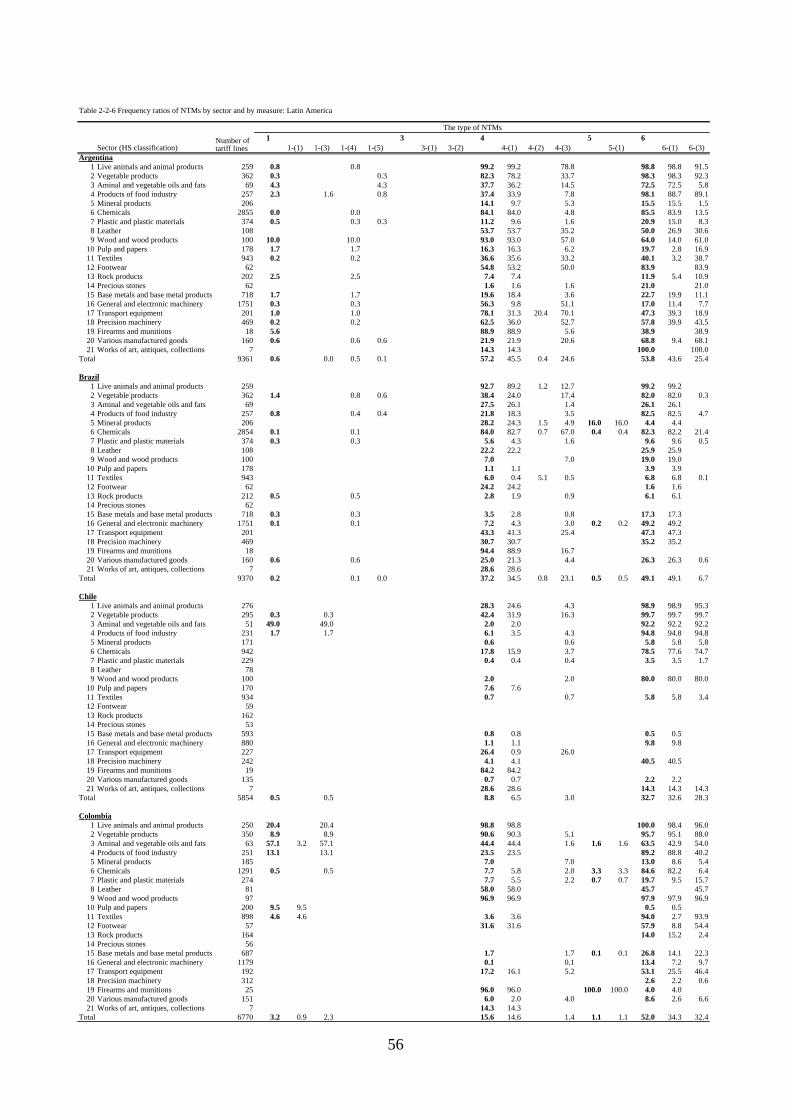
Table 2-2-6 Frequency ratios of NTMs by sector and by measure: Latin America
The type of NTMs1 3 4 5 6
Sector (HS classification) 1-(1) 1-(3) 1-(4) 1-(5) 3-(1) 3-(2) 4-(1) 4-(2) 4-(3) 5-(1) 6-(1) 6-(3)Argentina
1 Live animals and animal products 259 0.8 0.8 99.2 99.2 78.8 98.8 98.8 91.52 Vegetable products 362 0.3 0.3 82.3 78.2 33.7 98.3 98.3 92.33 Aminal and vegetable oils and fats 69 4.3 4.3 37.7 36.2 14.5 72.5 72.5 5.84 Products of food industry 257 2.3 1.6 0.8 37.4 33.9 7.8 98.1 88.7 89.15 Mineral products 206 14.1 9.7 5.3 15.5 15.5 1.56 Chemicals 2855 0.0 0.0 84.1 84.0 4.8 85.5 83.9 13.57 Plastic and plastic materials 374 0.5 0.3 0.3 11.2 9.6 1.6 20.9 15.0 8.38 Leather 108 53.7 53.7 35.2 50.0 26.9 30.69 Wood and wood products 100 10.0 10.0 93.0 93.0 57.0 64.0 14.0 61.0
10 Pulp and papers 178 1.7 1.7 16.3 16.3 6.2 19.7 2.8 16.911 Textiles 943 0.2 0.2 36.6 35.6 33.2 40.1 3.2 38.712 Footwear 62 54.8 53.2 50.0 83.9 83.913 Rock products 202 2.5 2.5 7.4 7.4 11.9 5.4 10.914 Precious stones 62 1.6 1.6 1.6 21.0 21.015 Base metals and base metal products 718 1.7 1.7 19.6 18.4 3.6 22.7 19.9 11.116 General and electronic machinery 1751 0.3 0.3 56.3 9.8 51.1 17.0 11.4 7.717 Transport equipment 201 1.0 1.0 78.1 31.3 20.4 70.1 47.3 39.3 18.918 Precision machinery 469 0.2 0.2 62.5 36.0 52.7 57.8 39.9 43.519 Firearms and munitions 18 5.6 88.9 88.9 5.6 38.9 38.920 Various manufactured goods 160 0.6 0.6 0.6 21.9 21.9 20.6 68.8 9.4 68.121 Works of art, antiques, collections 7 14.3 14.3 100.0 100.0
Total 9361 0.6 0.0 0.5 0.1 57.2 45.5 0.4 24.6 53.8 43.6 25.4
Brazil1 Live animals and animal products 259 92.7 89.2 1.2 12.7 99.2 99.22 Vegetable products 362 1.4 0.8 0.6 38.4 24.0 17.4 82.0 82.0 0.33 Aminal and vegetable oils and fats 69 27.5 26.1 1.4 26.1 26.14 Products of food industry 257 0.8 0.4 0.4 21.8 18.3 3.5 82.5 82.5 4.75 Mineral products 206 28.2 24.3 1.5 4.9 16.0 16.0 4.4 4.46 Chemicals 2854 0.1 0.1 84.0 82.7 0.7 67.0 0.4 0.4 82.3 82.2 21.47 Plastic and plastic materials 374 0.3 0.3 5.6 4.3 1.6 9.6 9.6 0.58 Leather 108 22.2 22.2 25.9 25.99 Wood and wood products 100 7.0 7.0 19.0 19.0
10 Pulp and papers 178 1.1 1.1 3.9 3.911 Textiles 943 6.0 0.4 5.1 0.5 6.8 6.8 0.112 Footwear 62 24.2 24.2 1.6 1.613 Rock products 212 0.5 0.5 2.8 1.9 0.9 6.1 6.114 Precious stones 6215 Base metals and base metal products 718 0.3 0.3 3.5 2.8 0.8 17.3 17.316 General and electronic machinery 1751 0.1 0.1 7.2 4.3 3.0 0.2 0.2 49.2 49.217 Transport equipment 201 43.3 41.3 25.4 47.3 47.318 Precision machinery 469 30.7 30.7 35.2 35.219 Firearms and munitions 18 94.4 88.9 16.720 Various manufactured goods 160 0.6 0.6 25.0 21.3 4.4 26.3 26.3 0.621 Works of art, antiques, collections 7 28.6 28.6
Total 9370 0.2 0.1 0.0 37.2 34.5 0.8 23.1 0.5 0.5 49.1 49.1 6.7
Chile1 Live animals and animal products 276 28.3 24.6 4.3 98.9 98.9 95.32 Vegetable products 295 0.3 0.3 42.4 31.9 16.3 99.7 99.7 99.73 Aminal and vegetable oils and fats 51 49.0 49.0 2.0 2.0 92.2 92.2 92.24 Products of food industry 231 1.7 1.7 6.1 3.5 4.3 94.8 94.8 94.85 Mineral products 171 0.6 0.6 5.8 5.8 5.86 Chemicals 942 17.8 15.9 3.7 78.5 77.6 74.77 Plastic and plastic materials 229 0.4 0.4 0.4 3.5 3.5 1.78 Leather 789 Wood and wood products 100 2.0 2.0 80.0 80.0 80.0
10 Pulp and papers 170 7.6 7.611 Textiles 934 0.7 0.7 5.8 5.8 3.412 Footwear 5913 Rock products 16214 Precious stones 5315 Base metals and base metal products 593 0.8 0.8 0.5 0.516 General and electronic machinery 880 1.1 1.1 9.8 9.817 Transport equipment 227 26.4 0.9 26.018 Precision machinery 242 4.1 4.1 40.5 40.519 Firearms and munitions 19 84.2 84.220 Various manufactured goods 135 0.7 0.7 2.2 2.221 Works of art, antiques, collections 7 28.6 28.6 14.3 14.3 14.3
Total 5854 0.5 0.5 8.8 6.5 3.0 32.7 32.6 28.3
Colombia1 Live animals and animal products 250 20.4 20.4 98.8 98.8 100.0 98.4 96.02 Vegetable products 350 8.9 8.9 90.6 90.3 5.1 95.7 95.1 88.03 Aminal and vegetable oils and fats 63 57.1 3.2 57.1 44.4 44.4 1.6 1.6 1.6 63.5 42.9 54.04 Products of food industry 251 13.1 13.1 23.5 23.5 89.2 88.8 40.25 Mineral products 185 7.0 7.0 13.0 8.6 5.46 Chemicals 1291 0.5 0.5 7.7 5.8 2.0 3.3 3.3 84.6 82.2 6.47 Plastic and plastic materials 274 7.7 5.5 2.2 0.7 0.7 19.7 9.5 15.78 Leather 81 58.0 58.0 45.7 45.79 Wood and wood products 97 96.9 96.9 97.9 97.9 96.9
10 Pulp and papers 200 9.5 9.5 0.5 0.511 Textiles 898 4.6 4.6 3.6 3.6 94.0 2.7 93.912 Footwear 57 31.6 31.6 57.9 8.8 54.413 Rock products 164 14.0 15.2 2.414 Precious stones 5615 Base metals and base metal products 687 1.7 1.7 0.1 0.1 26.8 14.1 22.316 General and electronic machinery 1179 0.1 0.1 13.4 7.2 9.717 Transport equipment 192 17.2 16.1 5.2 53.1 25.5 46.418 Precision machinery 312 2.6 2.2 0.619 Firearms and munitions 25 96.0 96.0 100.0 100.0 4.0 4.020 Various manufactured goods 151 6.0 2.0 4.0 8.6 2.6 6.621 Works of art, antiques, collections 7 14.3 14.3
Total 6770 3.2 0.9 2.3 15.6 14.6 1.4 1.1 1.1 52.0 34.3 32.4
Number oftariff lines
56

(Continue)The type of NTMs
1 3 4 5 6Sector (HS classification) 1-(1) 1-(3) 1-(4) 1-(5) 3-(1) 3-(2) 4-(1) 4-(2) 4-(3) 5-(1) 6-(1) 6-(3)
Mexico1 Live animals and animal products 281 53.4 53.4 69.0 69.02 Vegetable products 411 7.5 7.5 84.9 84.93 Aminal and vegetable oils and fats 66 24.2 24.2 30.3 30.34 Products of food industry 310 21.0 21.0 87.7 87.75 Mineral products 191 13.6 13.6 4.2 4.26 Chemicals 2694 0.1 0.1 26.4 26.1 0.4 71.7 71.77 Plastic and plastic materials 514 1.4 1.4 1.6 1.6 14.0 14.08 Leather 89 82.0 82.09 Wood and wood products 123 2.4 2.4 56.1 56.1
10 Pulp and papers 294 14.6 14.611 Textiles 1204 2.2 2.2 0.1 0.1 97.6 97.612 Footwear 101 5.0 5.0 79.2 79.213 Rock products 291 4.8 4.8 0.3 0.3 20.3 20.314 Precious stones 62 9.7 9.715 Base metals and base metal products 1153 1.6 1.6 0.9 0.9 18.2 18.216 General and electronic machinery 2453 1.4 1.4 17.3 17.317 Transport equipment 353 0.6 0.6 22.9 22.9 13.3 13.318 Precision machinery 458 6.6 6.6 52.0 52.019 Firearms and munitions 29 93.1 93.1 34.5 34.520 Various manufactured goods 230 0.4 0.4 0.4 0.4 66.1 66.121 Works of art, antiques, collections 12 41.7 41.7
Total 11319 0.7 0.7 10.5 10.5 0.1 48.1 48.1
Peru1 Live animals and animal products 271 4.1 4.1 24.7 10.7 14.0 49.1 49.12 Vegetable products 356 2.2 2.2 2.0 1.4 0.6 96.3 96.33 Aminal and vegetable oils and fats 62 35.5 35.54 Products of food industry 267 1.1 1.1 6.4 6.4 95.9 95.95 Mineral products 186 9.7 2.7 7.06 Chemicals 1343 8.9 6.6 2.9 11.9 11.97 Plastic and plastic materials 282 3.5 0.7 2.8 1.8 1.88 Leather 82 29.3 29.39 Wood and wood products 97 91.8 91.8
10 Pulp and papers 199 11.1 11.1 11.1 85.4 85.411 Textiles 939 0.1 0.1 0.1 0.1 100.0 100.012 Footwear 5713 Rock products 16314 Precious stones 5615 Base metals and base metal products 665 4.2 0.8 3.5 0.8 0.816 General and electronic machinery 1167 1.5 1.4 1.3 1.6 1.617 Transport equipment 203 28.6 28.618 Precision machinery 311 0.3 0.3 8.4 8.419 Firearms and munitions 25 56.0 56.020 Various manufactured goods 152 1.3 1.321 Works of art, antiques, collections 7 28.6 28.6
Total 6890 0.3 0.3 0.0 4.7 2.8 2.6 32.6 32.6
Venezuela1 Live animals and animal products 259 19.4 19.4 88.7 32.7 85.5 97.6 97.6 10.52 Vegetable products 362 7.2 7.2 87.6 77.5 23.3 0.6 0.6 96.5 96.53 Aminal and vegetable oils and fats 69 54.8 54.8 12.9 9.7 4.8 64.5 64.54 Products of food industry 257 12.9 12.9 24.9 10.8 20.9 96.0 96.05 Mineral products 206 9.3 1.0 9.3 21.1 21.1 2.6 2.66 Chemicals 2855 75.9 12.5 75.1 2.9 2.9 74.3 74.37 Plastic and plastic materials 374 1.5 0.7 1.58 Leather 108 58.8 26.3 46.3 26.3 26.39 Wood and wood products 100 11.3 10.3 1.0 49.5 49.5
10 Pulp and papers 17811 Textiles 943 49.5 49.5 1.2 0.9 0.3 3.8 3.812 Footwear 62 31.6 1.8 31.6 1.8 1.813 Rock products 20214 Precious stones 6215 Base metals and base metal products 718 2.4 0.3 2.416 General and electronic machinery 1751 1.0 0.5 0.517 Transport equipment 201 14.1 1.1 14.118 Precision machinery 469 2.6 2.619 Firearms and munitions 18 96.0 96.0 12.020 Various manufactured goods 160 1.3 1.3 1.3 1.3 0.7 0.721 Works of art, antiques, collections 7 12.5 12.5
Total 6699 8.7 6.6 2.1 26.4 9.4 21.6 1.2 1.2 28.6 28.6 0.4Data source: Ando (2002), Ando (2004), and Ando and Estevadeordal (2004).Notes:
The types of NTMs are as follows:1. Price control measures 1-(1) Administrative pricing 1-(3) Variable charges 1-(4) Anti-dumping measures 1-(5) Counter vailing measures3. Automatic licensing measures 3-(1) Automatic lisence 3-(2) Import monitoring4. Quantity control measures 4-(1) Non-automatic licensing 4-(2) Import quotas 4-(3) Import prohibition5. Monopolistic meaures 5-(1) Single channel for imports6. Technical measures 6-(1) Technical regulations 6-(3) Special custom formalities
Number oftariff lines
40, 8. HS Chapter 41-43, 9. HS Chapter 44-46, 10. HS Chapter 47-49, 11. HS Chapter 50-63, 12. HS Chapter 64-67, 13. HS Chapter 68-70, 14. HS Chapter 71, 15. HS Chapter 72-83, 16. HS Chapter
57

33... IIISSSSSSUUUEEESSS AAANNNDDD IIIMMMPPPEEEDDDIIIMMMEEENNTTTSSS BBBYY CCCOOOUUUNNNTTTRRRYYY:::AAASSSIIIAAA 3 N Y
58
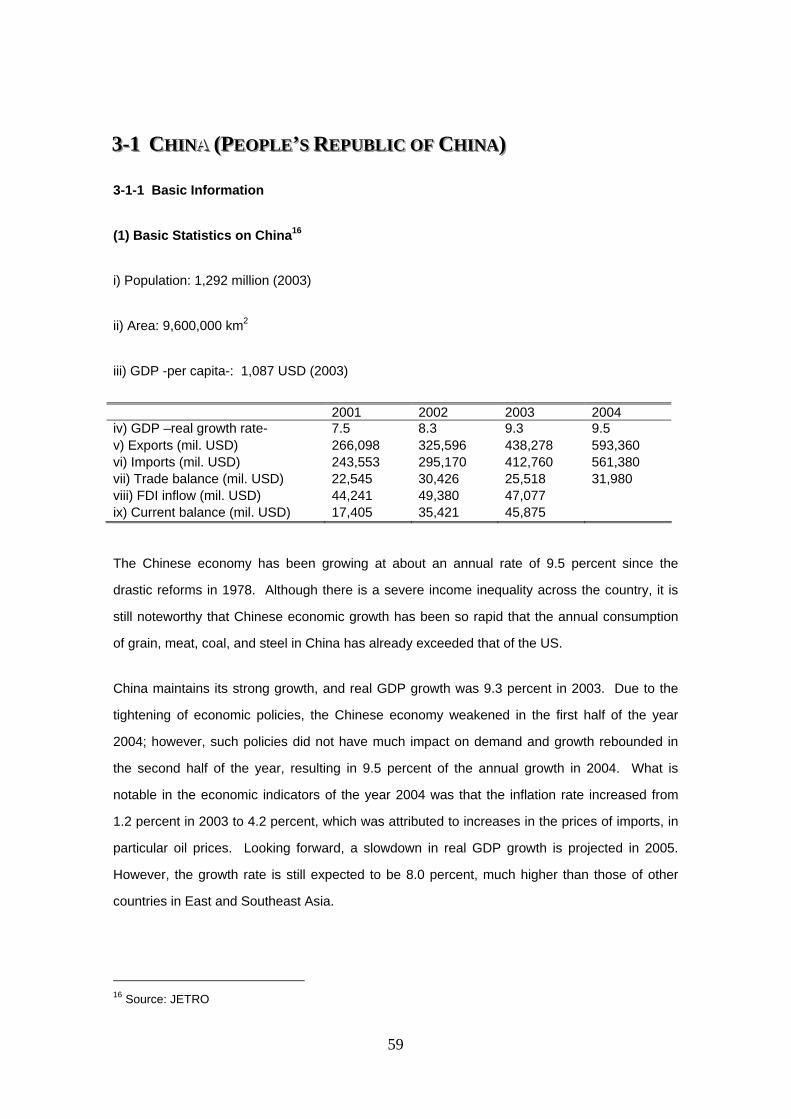
333---111 CCCHHHIIINNNAA (((PPPEEEOOOPPPLLLEEE’A ’’SSS RRREEEPPPUUUBBBLLLIIICCC OOOFFF CCCHHHIIINNNAAA)))
3-1-1 Basic Information
(1) Basic Statistics on China16
i) Population: 1,292 million (2003)
ii) Area: 9,600,000 km2
iii) GDP -per capita-: 1,087 USD (2003)
2001 2002 2003 2004 iv) GDP –real growth rate- 7.5 8.3 9.3 9.5 v) Exports (mil. USD) 266,098 325,596 438,278 593,360 vi) Imports (mil. USD) 243,553 295,170 412,760 561,380 vii) Trade balance (mil. USD) 22,545 30,426 25,518 31,980 viii) FDI inflow (mil. USD) 44,241 49,380 47,077 ix) Current balance (mil. USD) 17,405 35,421 45,875
The Chinese economy has been growing at about an annual rate of 9.5 percent since the
drastic reforms in 1978. Although there is a severe income inequality across the country, it is
still noteworthy that Chinese economic growth has been so rapid that the annual consumption
of grain, meat, coal, and steel in China has already exceeded that of the US.
China maintains its strong growth, and real GDP growth was 9.3 percent in 2003. Due to the
tightening of economic policies, the Chinese economy weakened in the first half of the year
2004; however, such policies did not have much impact on demand and growth rebounded in
the second half of the year, resulting in 9.5 percent of the annual growth in 2004. What is
notable in the economic indicators of the year 2004 was that the inflation rate increased from
1.2 percent in 2003 to 4.2 percent, which was attributed to increases in the prices of imports, in
particular oil prices. Looking forward, a slowdown in real GDP growth is projected in 2005.
However, the growth rate is still expected to be 8.0 percent, much higher than those of other
countries in East and Southeast Asia.
16 Source: JETRO
59

Total trade volume in 2003 was 851 billion US dollars, a year-on-year increase of 37.1 percent.
This was due to the 30-40 percent increases in both exports and imports. In 2004, too, Chinese
exports and imports achieved 30-40 percent growth, and the total volume reached 1,155 billion
dollars. Among the largest trade partners were Japan, the US, the EU, Hong Kong, Korea, and
Taiwan. One of the notable features of Chinese external trade is that more than 50 percent of
total trade is attributable to trade by foreign firms located in China.
Chinese exports have been growing at more than 20 percent every year since 2001, reaching
approximately 593 billion dollars in 2004. The top five destinations of the exports in 2003 were
(1) the US, (2) Hong Kong, (3) the EU, (4) Japan, and (5) Korea, and slightly above one-third of
the total exports were in the form of processing trade. Analyzing the transactions by product,
more than half of the exports were machinery, electric machinery, and electronics; other major
export item were textiles and apparel.
Imports have also been growing at more than 20 percent every year since 2001, reaching 561
billion dollars in 2004. The top five origins of Chinese imports in 2003 were (1) Japan, (2) the
EU, (3) Taiwan, (4) Korea, and (5) the US. About 55 percent of the total imports were
machinery, electronic machinery, and electronics, including parts and components. Among
these, imports of high-value-added items such as microelectronic parts and ICs have been
significantly increasing. It can be seen in these figures that more and more production sites for
high-tech products have been shifting to China.
If we look at Chinese trade policy from the viewpoint of institutional frameworks, there are
mainly three aspects to be noted. One is tariff reduction or tariff removal based on the WTO
scheme. Adjusting to the WTO standard, China successfully lowered its average import tariff
from 12.0 percent to 11.0 percent in 2003, and to 10.4 percent in 2004. In addition, the Chinese
government has been making an effort to establish and reform domestic laws and rules in
compliance with the WTO scheme. Countries such as Japan, the US, and EU claim, however,
that further efforts to secure the rule of law have yet to be made in China.
Another issue is that China has been increasingly filing antidumping suits since it became a
WTO member in 2001. The cases are mainly for chemical products and newly developed items
such as optical fiber. In most cases, Japan and the US have been included in the targeted
countries, and Korea has been included in about half of the suits.
60

The third aspect is China’s increasing pursuit of FTAs with various countries and areas.
Already in force (as of March 2005) are three Early Harvest programs agreed in the Framework
Agreement on Comprehensive Economic Cooperation signed between China and ASEAN in
2004. Based on the Early Harvest programs, tariffs for certain items have already been
reduced or removed between China and Thailand in 2003, and between China and Malaysia
and Indonesia in 2004. The Early Harvest program between China and the Philippines,
scheduled to start in January 2005, has been postponed. There are also a number of cases
where China has agreed to start negotiations in the near future. Such cases include FTAs with
Singapore, New Zealand, the Gulf Cooperation Council (GCC), and the Southern Africa
Customs Union (SACU). China began FTA negotiations with Chile in January 2005.
Finally, if we look at foreign investments in China, the inflow has not increased rapidly since
2001, and only a slight decline in FDI inflow was observed in 2003. This is mainly due to (1) the
negative effect of the SARS outbreak, (2) a rebound from the increase in foreign investment in
2002, (3) the effect of a worldwide downturn in direct investment, and (4) the shift of FDI toward
other areas in the world due to the recovery of developed economies. The major sources of
FDI in 2003 were (1) Hong Kong, (2) the British Virgin Islands, (3) Japan, (4) Korea, and (5) the
US. Most of the investment from the British Virgin Islands, the Cayman Islands, and Samoa
seems to be by Taiwanese firms taking advantage of tax havens in these areas. Investment by
Japanese and Korean companies has rapidly been increasing as Chinese domestic demand
has been dramatically expanding.
3-1-2 Relationship with Latin America
International trade between China and Latin American countries is rapidly increasing and China
is becoming a major destination for exports and imports for Latin American countries. For
instance, in 2003, China was the third largest export destination for both Brazil and Chile.17
Similarly, China was ranked the fifth largest import partner for Brazil and the fourth for both
Chile and Mexico. In contrast, the scale of FDI between China and Latin America is still
negligibly small.
17 See Tables from 2-1-8 through 2-1-10.
61
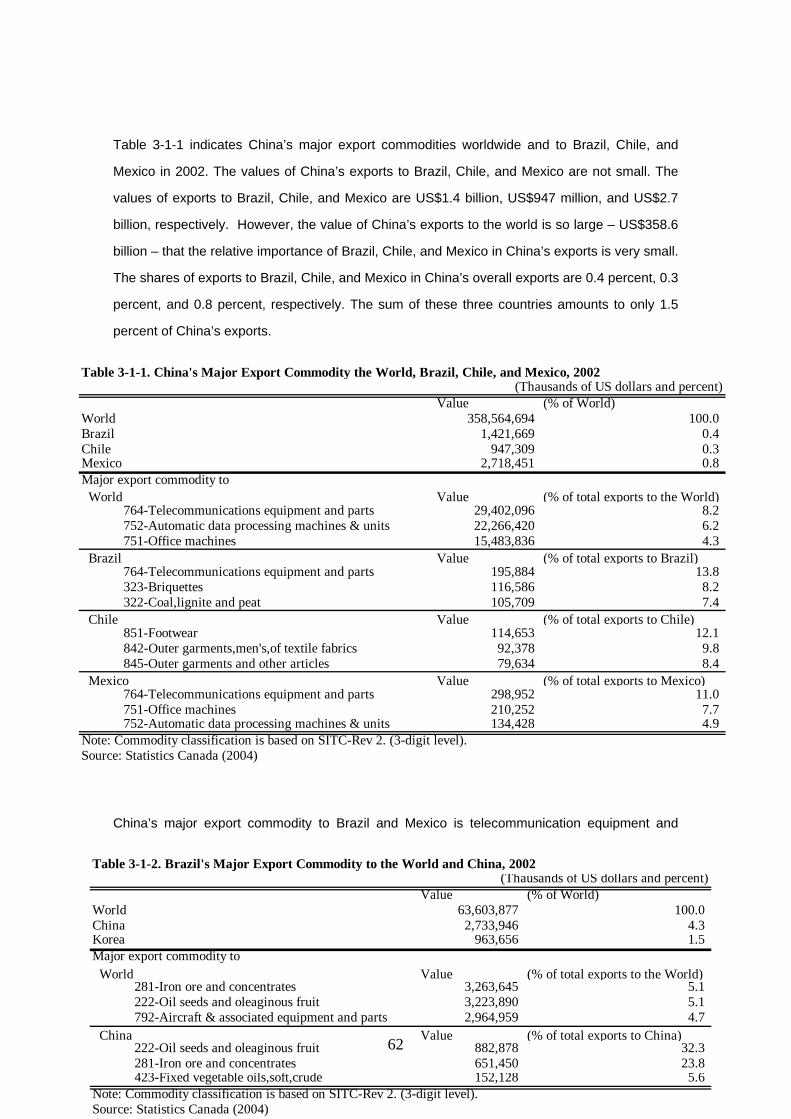
Table 3-1-1 indicates China’s major export commodities worldwide and to Brazil, Chile, and
Mexico in 2002. The values of China’s exports to Brazil, Chile, and Mexico are not small. The
values of exports to Brazil, Chile, and Mexico are US$1.4 billion, US$947 million, and US$2.7
billion, respectively. However, the value of China’s exports to the world is so large – US$358.6
billion – that the relative importance of Brazil, Chile, and Mexico in China’s exports is very small.
The shares of exports to Brazil, Chile, and Mexico in China’s overall exports are 0.4 percent, 0.3
percent, and 0.8 percent, respectively. The sum of these three countries amounts to only 1.5
percent of China’s exports.
Table 3-1-1. China's Major Export Commodity the World, Brazil, Chile, and Mexico, 2002(Thausands of US dollars and percent)
Value (% of World)World 358,564,694 100.0Brazil 1,421,669 0.4Chile 947,309 0.3Mexico 2,718,451 0.8Major export commodity to World Value (% of total exports to the World) 764-Telecommunications equipment and parts 29,402,096 8.2 752-Automatic data processing machines & units 22,266,420 6.2 751-Office machines 15,483,836 4.3 Brazil Value (% of total exports to Brazil) 764-Telecommunications equipment and parts 195,884 13.8 323-Briquettes 116,586 8.2 322-Coal,lignite and peat 105,709 7.4 Chile Value (% of total exports to Chile) 851-Footwear 114,653 12.1 842-Outer garments,men's,of textile fabrics 92,378 9.8 845-Outer garments and other articles 79,634 8.4 Mexico Value (% of total exports to Mexico) 764-Telecommunications equipment and parts 298,952 11.0 751-Office machines 210,252 7.7 752-Automatic data processing machines & units 134,428 4.9Note: Commodity classification is based on SITC-Rev 2. (3-digit level).Source: Statistics Canada (2004)
China’s major export commodity to Brazil and Mexico is telecommunication equipment and
62
Table 3-1-2. Brazil's Major Export Commodity to the World and China, 2002(Thausands of US dollars and percent)
Value (% of World)World 63,603,877 100.0China 2,733,946 4.3Korea 963,656 1.5Major export commodity to World Value (% of total exports to the World) 281-Iron ore and concentrates 3,263,645 5.1 222-Oil seeds and oleaginous fruit 3,223,890 5.1 792-Aircraft & associated equipment and parts 2,964,959 4.7 China Value (% of total exports to China) 222-Oil seeds and oleaginous fruit 882,878 32.3 281-Iron ore and concentrates 651,450 23.8 423-Fixed vegetable oils,soft,crude 152,128 5.6Note: Commodity classification is based on SITC-Rev 2. (3-digit level).Source: Statistics Canada (2004)

parts (SITC-764), accounting for 13.8 percent of China’s exports to Brazil and 11.0 percent of
China’s exports to Mexico. China’s major export commodities to Chile are footwear (SITC-851),
men’s outer garments (SITC-842), and other outer garments (SITC-845). The shares of
footwear, men’s outer garments, and other outer garments are 12.1 percent, 9.8 percent, and
8.4 percent, respectively.
Table 3-1-3. Chile's Major Export Commodity to the World and China, 2002(Thausands of US dollars and percent)
Value (% of World)World 18,428,136 100.0China 1,351,681 7.3Korea 751,177 4.1Major export commodity to World Value (% of total exports to the World) 682-Copper 4,953,355 26.9 287-Ores and concentrates of base metals, n.e.s. 2,070,596 11.2 057-Fruit & nuts 1,413,890 7.7 China Value (% of total exports to China) 682-Copper 667,060 49.4 251-Pulp and waste paper 218,569 16.2 287-Ores and concentrates of base metals, n.e.s. 202,487 15.0Note: Commodity classification is based on SITC-Rev 2. (3-digit level).Source: Statistics Canada (2004)
Table 3-1-4. Mexico's Major Export Commodity to the World and China, 2002(Thausands of US dollars and percent)
Value (% of World)World 169,649,967 100.0China 617,048 0.4Korea 164,978 0.1Major export commodity to World Value (% of total exports to the World) 781-Passenger motor cars,for transport of passangers 14,858,033 8.8 333-Petrol.oils & crude oils obt.from bitumin. 13,875,927 8.2 764-Telecommunications equipment and parts 10,239,388 6.0 China Value (% of total exports to China) 751-Office machines 357,395 57.9 513-Carboxylic acids,& their anhydrides 34,727 5.6 266-Synthetic fibres suitable for spinning 26,672 4.3Note: Commodity classification is based on SITC-Rev 2. (3-digit level).Source: Statistics Canada (2004)
Tables 3-1-2, 3-1-3, and 3-1-4 present Brazil’s, Chile’s, and Mexico’s major export commodities
to Korea and China. In Brazil and Chile, the presence of China is relatively large, accounting for
4.3 percent of Brazil’s exports and 7.3 percent of Chile’s exports. Brazil’s major export
commodities to China are oil seeds and oleaginous fruit (SITC-222) and iron ore and
63

concentrates (SITC-281). Oil seeds and oleaginous fruit account for 32.3 percent of Brazil’s
exports to China while iron ore and concentrates account for 23.8 percent. The sum of these
commodities is 56.1 percent. Chile’s major export commodity to China is copper (SITC-682),
accounting for 49.4 percent of Chile’s exports to China.
For Mexico, the relative importance of China is very small, accounting for 0.4 percent of
Mexico’s total exports. Mexico’s major export commodity to China is office machines (SITC-751).
The share of office machines in Mexico’s exports to China is 57.9 percent.
3-1-3 Specific Impediments
(1) General Issues
Japan PECC (2002) reported several impediments. Some of them are summarized as follows.
Foreign investment entry-related regulations
There are several regulations governing the entry of foreign firms. Further, some of the
regulations are regarded as unfair or unclear. For instance, despite the fact that foreign
investments in photosensitive materials and cameras are not allowed, investments from certain
countries are exempted.
Regulations concerning domestic production ratios and local procurement ratios
Regulations on domestic production and local procurement ratios have been reported. For
instance, textile-processing firms have to use domestically produced cotton. It has also been
pointed out that the Chinese state/central government sometimes provides “guidance” on the
utilization of domestic parts.
Export obligation
Several export balance obligations have been identified. For instance, foreign firms are required
to attain a foreign currency balance from the combination of foreign parts procurement and
exports.
64

Withdrawal regulations
Regulations on withdrawal exist as well. Capital reduction is prohibited. Merger periods must
be ten years or longer.
Exchange controls
The Chinese government strictly controls remittances of foreign currency. This results in
complex and time-consuming remittance procedures
Taxation
The categorization of value-added tax (VAT) and business tax is not clear. Moreover, to refund
VAT on export products, complex documentation and procedures are required. It has also been
pointed out that tax rules are different across regions because the Chinese government has not
developed a centralized tax system. Tax rates are thus sometimes determined by negotiation.
Employment
In China, it is difficult for workers to move from one region to another. This causes several
problems. For instance, foreign firms located in outlying regions find it difficult to hire highly
skilled workers. Another problem is related to visa acquisition and extension. The procedures
for visa extension, resident certification, and work certification are very complicated. Complex
procedures have also been identified in the issue of passports for Chinese employees.
(2) Issues related to Latin America
It is interesting that business people do not identify specific impediments for trade and FDI in
China. There are two possible reasons. First, the relationship between Latin America and China
is based on trade rather than FDI. Therefore, Latin American firms have not faced the problems
of doing business in the domestic Chinese market (such as labor affairs).18
18 Indeed, many foreign firms found some impediments to doing business in the Chinese market. For more details, see Japan PECC (2002).
65

Second, the products traded between China and Latin America are not substitutes but rather
complements to each other. The major export products from Latin American to China are
agricultural and mining products while the major export products from China to Latin America
are manufactured products. For instance, Brazil’s major export product to China is “crude
materials, inedible, except fuels (SITC-2).”19 On the other hand, China’s major export product to
Brazil is “machinery and transport equipment (SITC-7).”20 These complementarities seem to
work very well at the moment.
However, some firms in Latin America observe many problems in Chinese export products. For
instance, some of the exported products are illegally produced, violating intellectual property
rights (IPR). Therefore, a large variety of “made in China” counterfeits are found in Latin
American countries. These violations of IPR make it difficult for firms that develop original
products to compete with other firms, as innovation itself is quite costly. Moreover, violations of
IPR take the incentive away from innovative firms to create new products, which results in
setbacks in technological progress.
3-1-4 FTA-related Issues and Suggestions to Deepen the Relationship Between China
and Latin America
According to Kishida (2004a, b), China has signed FTA framework agreements with ASEAN,
Australia, and New Zealand. China also seeks possible FTAs with India, Japan, Korea,
Singapore, and South Africa. It is clear that China still mainly focuses on Asia-Pacific countries,
but it is also worth noting that China is now seeking bilateral trade partners outside Asia such as
South Africa. Although China has not yet begun considering FTAs with Latin American countries,
it may be possible to start FTA negotiations with some of those countries.
In negotiating FTA, it is important to address not only trade-related issues but also investment-
related issues. Although Latin American countries do not find serious impediments to trade in
China, several impediments have been identified by the foreign companies that have already
entered into the Chinese market, as we discussed in Section 3-1-3. Indeed, discussion on
19 See Table 2-1-20. 20 See Table 2-1-18.
66
investment-related issues is thus essential to deepen the economic relationships between
China and other countries, including those in Latin America. One of the next steps is thus to
develop more favorable environments for investments, solving the problems proposed by Japan
PECC (2002). Also, it is clear that strictly upholding IPR is an important step for Chinese firms
in doing business in Latin American countries. Since recent FTA negotiations tend to cover not
only trade-related issues but also various issues related to FDI and IPR, FTAs can be catalysts
to help deepen relations between these two regions.
Finally, we should note that FTAs are not a tool for excluding non-member countries. In other
words, FTAs should be regarded as a step toward global free trade. Membership should not be
limited to some countries. If membership is closed, trade wars could break out between trading
blocs. We expect a “domino” effect: falling trade barriers in one set of countries trigger a fall in
the barriers of other countries, which ultimately results in global free trade.21
21 For “domino” effect, see Baldwin (1996).
67

333---222 JJJAAAPPPAAANNN
3-2-1 Basic Information
(1) Basic Statistics on Japan
General Indicators22
i) Population: 127.33 million (July, 2004 est.)
ii) Area: 377,835 km2
iii) GDP -per capita-: 28,200 USD (2003 est.)
2001 2002 2003 2004 (Q1)
2004 (projected)
iv) GDP –real growth rate- 0.4 -0.3 2.5 5.6 3.4 v) Export (mil. USD) 403,247 415,862 469,862 vi) Import (mil. USD) 349,235 336,832 381,528 vii) Trade balance (mil. USD) 54,012 79,030 88,334 viii) FDI inflow (mil. USD) 17,402 17,937 18,722 ix) Current balance (mil. USD) 87,921 112,490 135,928
Growth of Japanese economy for the three decades from 1960 was remarkable. The average
growth rate of each decade was approximately 10 percent in the 1960’s, 5 percent in the 70’s,
and 4 percent in the 80’s. Due to the burst of the bubble economy, however, the economy
experienced a deep and long recession during the 90’s. It has slowly been recovering since
2003, recording 2.5 percent of annual growth in 2003, and 3.4 percent of projected growth in
2004. Japanese economy is currently the second largest in the world after the US. The
recovery of the Japanese economy was first observed in the production side, such as the
situation concerning domestic employment, and also started to appear in household
consumption.23 One of the major factors of this recent upturn is growth of Chinese economy.
22 Source: (i)(ii)(iii) CIA, (iv)(v)(vi)(vii)(viii) WTO and IMF, (ix) JETRO 23Getsurei keizai houkoku (getsuji), Naikakufu, January 2003 – December 2004, (http://www5.cao.go.jp/keizai3/getsurei.html)
68

An increase in worldwide consumption in digital electronic items, is also mentioned as an
important element of the economic upturn in 2003 in Japan24.
Japanese exports increased for three straight years, recording 474 billion dollars in 2003.
However, it should be noted that the total volume in 2003 is still below the level in 2000, and the
growth rate is not very large. As in Table 3-2-1, the top five destinations of Japanese exports
are (1) the United States, (2) China, (3) Korea, (4) Taiwan, and (5) Hong Kong in 2003.
It is clear that China has rapidly been increasing its share, while exports to the US, which still
remains the largest, has not increased in volume terms, and has decreased in share terms.
The major reason of the increase in exports to China was a surge in automobile production and
capital investment in China, which increased the Japanese exports of automobile parts and
components, precision instruments, and general machinery. The major factor that decreased
the exports to the US was also machinery and equipments. More precisely, exports of
automobile and IT-related products declined substantially25.
Other than the increasing exports to China, it could be claimed that the trend of Japanese
exports, both in terms of the destination and the volume has not been changed much from 1998
to 2003.
24 JETRO boueki toushi hakusho 2004, JETRO, 2004 25 2004 JETRO White Paper on International Trade and Foreign Direct Investment (Summary),
2004, JETRO (http://www.jetro.go.jp/en/stats/white_paper/004.pdf)
69

Table 3-2-1: Major Export Partners of Japan(Millions of US Dollars and Percent)
1990 1995 2000Country Value Country Value Country ValueWorld 287,678 World 443,047 World 478,179
1 United States 91,121 1 United States 122,034 1 United States 144,0092 Germany 17,926 2 Korea 31,292 2 Taiwan 36,0543 Korea 17,500 3 Taiwan 28,969 3 Korea 30,7034 Taiwan 15,430 4 Hong Kong 27,780 4 China 30,3565 Hong Kong 13,106 5 Singapore 23,006 5 Hong Kong 27,187
2001 2002 2003Country Value Country Value Country ValueWorld 403,383 World 416,632 World 473,911
1 United States 122,701 1 United States 120,798 1 United States 117,3842 China 30,948 2 China 39,958 2 China 57,4803 Korea 25,292 3 Taiwan 26,202 3 Korea 34,8234 Taiwan 24,337 4 Korea 25,292 4 Taiwan 31,1745 Hong Kong 23,352 5 Hong Kong 23,252 5 Hong Kong 29,918
Source:IMF (2004)
Table 3-2-2. Major Import Partners of Japan(Millions of US Dollars and Percent)
1990 1995 2000Country Value Country Value Country ValueWorld 253,307 World 336,027 World 379,530
1 United States 52,842 1 United States 75,880 1 United States 72,5142 Indonesia 12,774 2 China 35,922 2 China 55,1563 Australia 12,359 3 Korea 17,330 3 Korea 20,4544 China 12,057 4 Australia 14,514 4 Taiwan 17,9675 Korea 11,734 5 Taiwan 14,366 5 Indonesia 16,371
2001 2002 2003Country Value Country Value Country ValueWorld 349,056 World 337,149 World 383,025
1 United States 63,713 1 China 61,792 1 China 75,5592 China 57,780 2 United States 58,589 2 United States 59,8923 Korea 17,221 3 Korea 15,498 3 Korea 17,9314 Indonesia 14,883 4 Indonesia 14,174 4 Indonesia 16,3535 Australia 14,385 5 Australia 13,986 5 Australia 15,005
Source:IMF (2004)
Japanese imports in 2003 were approximately 383 billion dollars, and increased for the first time
in three years. The increase could be explained partly by the overall economic upturn in Japan,
and partly by the newly developed demand for digital consumer electronics.
The top five origins of imports are (1) China, (2) the United States, (3) Korea, (4) Indonesia, and
(5) Australia. Although there has not been a drastic change in the overall trend in the Japanese
imports in since the late 90’s, both in terms of origin and volume, one notable feature is that
China has been increasing its presence, and it became the largest import partner in 2002,
overtaking the US. The major items imported from China are machinery and equipment, and in
2003, more than 60 percent of the imports from China in this category were related to IT
products.
70

FTAs in East Asia have been expanding since 2000. Japan has also been making a great effort
to establish FTAs with countries in and outside of Asia; however, it seems that some other
Asian countries, such as China, Korea, or ASEAN countries, have been more successful in
reaching the final or partial agreement with other countries. In general, tariff removal in the
Japanese agricultural sector is requested by other parties in negotiations with Japan.
So far, Japan has enacted two EPAs: one with Singapore, and the other with Mexico. Japan
and Singapore signed EPA in January 2002, and it went into effect in November 2002. The
EPA was realized after a relatively short negotiation period, which was mostly because
agricultural products were not the issue between these two counties. As a result, tariffs were
removed for more than 98 percent of bilateral trade. Japan and Mexico singed the EPA in
September 2004, and it was enforced in April 2005. Japan experienced for the first time an FTA
negotiation including agricultural products. In the Japan-Mexico FTA negotiation, liberalization
of steel and automobile imports by Mexico was also the central issue, and it took them as many
as 16 months to sign the agreement. Although it has not been enforced, Japan and the
Philippines reached the agreement for the most part in November 2004.
There are also ongoing FTA or EPA negotiations for Japan with Thailand, Malaysia, ASEAN,
and Korea. Negotiation with Korea, which started in December 2003, has not seen much
progress so far, mainly due to the issues on Japanese agricultural and fishery products. It is
also said that the hard-line stance of the current Korean administration, in terms of foreign
policies, and the recent strained Korea-Japan relationship might be part of the factor for the
delayed FTA negotiation.
Another possible EPA in the future is the one between Japan and Chile. They have just
launched a joint study group in January 2005, and especially the private sectors from both sides
have great expectation for the future agreement.
Japan has thus made a great effort to establish FTAs and EPAs; however, when we look at
their effects on the Japanese economic relations with other countries, it should be noted that
agreements between Latin American countries and other Asian countries than Japan could also
affect the performance of the Japanese private sector. Particularly when we examine the
activities of the manufacturing sector, it is perfectly possible that the FTA made by other Asian
countries, such as China or ASEAN countries, can have larger impacts on the performance of
71

the Japanese private sector, because they have invested actively and expanded regional
production networks in East Asia.
The other form of the Japanese economic relationship with other parts of the world is FDI. Both
the stock and the flow of incoming investment are very low compared to other developed
countries, and the volume has not been increasing much since 2001, despite the declaration of
Japan’s intention made by Prime Minister Koizumi in 2003 to double FDI in five years.
Table 3-2-3: FDI flows toward Japan by Five Major Investors
1990 1995 2000Country Value Country Value Country ValueWorld 2,788 World 3,811 World 28,274
1 Netherlands 734 1 United States 1,837 1 Japan 10,3262 United States 664 2 Netherlands 555 2 United States 9,1413 Japan 350 3 Japan 241 3 Germany 2,5304 Germany 259 4 Germany 174 4 Swizerland 1,9665 Canada, Swizerland 142 5 United Kingdom 118 5 Cayman Islands 1,193
2001 2002 2003Country Value Country Value Country ValueWorld 17,402 World 17,937 World 18,722
1 Netherlands 6,575 1 United States 4,876 1 Japan 3,1812 United States 5,139 2 Japan 4,462 2 United States 3,0903 Japan 2,108 3 Netherlands 3,221 3 Netherlands 2,8004 United Kingdom 1,164 4 Cayman Islands 1,671 4 Cayman Islands 2,5865 Canada 394 5 Germany 980 5 Bermuda Islands 1,431
Notes: 1) Inward investment by "Japan" means the investment by foreign affiliates located in Japan.2) Inward and outward FDI are notification basis.
(Millions of US Dollars and Percent)
Source: JETRO
If we look at a breakdown of the inflow in 2003, investment in manufacturing sector fell by about
35 percent, while investment in non-manufacturing sector grew by slightly less than 30 percent.
Within non-manufacturing, investment in finance and insurance contributed, and trade and
commerce mainly contributed to the growth. The top five origin of FDI inflows in 2003 were (1)
Japan, (2) the United States, (3) Netherlands, (4) Cayman Islands, and (5) Bermuda Islands.
The expansion of the presence of Japan, i.e. the investment by foreign affiliates in Japan, and
the emergence of Cayman Islands and Bermuda Islands, serving as tax havens, might reflect
the concentration of the investment in financial and insurance sector. With respect to the
general causes of the sluggish growth of incoming FDI to Japan, we will come back to the topic
later in the section 3-2-3, “Issues and Impediments on Latin American Countries’ trade and
investment in Japan.”
72
Finally, there is a notable recent trend in production in Japan, although it might not necessarily
be a direct example of FDI in Japan Since the 1970’s, as is well known, the Japanese
manufacturing industries had been shifting their production operation overseas, such as ASEAN
countries or China, seeking labor with average to high skills and of lower cost. The trend,
however, has begun to change. Now Japan has again come to draw attention as a potential
production base for advanced products, and some Japanese manufacturing companies have
already launched their production sites in Japan. These plants in Japan are for advanced
products which usually require advanced or newly-developed components.
There seem to be at least three major reasons for the comeback of Japan as manufacturing
base; (1) its relatively large demand for high-end products, (2) ability of local intermediate good
supplier to produce advanced and newly-invented parts and components, and (3) high ability of
Japanese manufacturing companies and their employees to improve their technology and
production process. When a firm considers these advantages to be substantially large, it could
launch its plant in Japan, despite its high labor cost. This phenomenon might also be
noteworthy, when we discuss the future trend in determinants and the effects of FDI in Japan.
3-2-2 Features of Latin American Countries’ Trade and Investment in Japan
(1) FDI
As was described in the previous section, inward FDI to Japan is relatively small, and the
volume has not been increased much since 2001. Regarding FDI flows from Latin American
countries, there has been almost no investment in Japan, so far. For the discussion on general
impediments to FDI in Japan, please refer to Section 3-2-4 (1).
(2) Trade
The major business activity between Japan and Latin America is through trade; however, the
volume is not very large as can be observed in Table 3-2-3 and Table 3-2-4. Table 3-2-3 and
Table 3-2-4 describe the volume of exports and imports of Japan with three Latin American
countries and top five trade partners in each year from 2002 to 2004.
73

Export 2002 2003 2004Country Value Country Value Country ValueWorld 415,862 World 469,862 World 565,039Brazil 1,810 Brazil 1,867 Brazil 2,344Chile 495 Chile 573 Chile 721Mexico 3,758 Mexico 3,625 Mexico 5,182
1 United States 118,550 1 United States 115,412 1 United States 126,8392 China 39,866 2 China 57,219 2 China 73,8183 Korea 28,547 3 Korea 34,675 3 Korea 44,2004 Taiwan 26,202 4 Taiwan 31,174 4 Taiwan 41,9595 Hong Kong 25,377 5 Hong Kong 29,784 5 Hong Kong 35,374
Source: JETRO
Table 3-2-4: Presence of Latin American Countries in Japanese Exports: Comparison with Major Trade Partners of Japan
(Millions of US Dollars)
LatinAmericanCountriesTop 5Countries
Import 2002 2003 2004Country Value Country Value Country ValueWorld 336,832 World 381,528 World 454,669Brazil 2,659 Brazil 1,868 Brazil 3,643Chile 2,139 Chile 2,611 Chile 4,174Mexico 1,785 Mexico 1,770 Mexico 2,170
1 China 61,692 1 China 75,193 1 United States 94,2272 United States 57,634 2 United States 58,658 2 China 62,4353 Korea 15,450 3 Korea 17,841 3 Korea 22,0274 Indonesia 14,174 4 Indonesia 16,358 4 Taiwan 19,4305 Australia 13,987 5 Australia 14,989 5 Hong Kong 18,670
Source: JETRO
Top 5Countries
LatinAmericanCountries
Table 3-2-5: Presence of Latin American Countries in Japanese Imports: Comparison with Major Trade Partners of Japan
(Millions of US Dollars)
The major products exported from Japan to Latin American countries is in the categories of
“machinery and transport equipment” based on the SITC classification, and it accounts for
around 70 percent of the total exports to these three countries. The products in this category
include parts and components for industrial machinery, electronic machinery, and automobile.
The products imported to Japan from these three Latin American countries are mainly in the
category of “food and live animals chiefly for food” and “crude materials, inedible, except fuels”
for primary goods, and “machinery and transport equipment” for manufacturing goods. Food
and crude materials in this case mainly indicate fruits, vegetables, and ferrous or non-ferrous
metals.
The following describes several features of trade between Japan and each of the three Latin
American countries.
74

Table 3-2-6: Exports toward Latin American Countries: by Product
ImportersBrazil Chile MexicoVolume Share Volume Share Volume Share
TOTL-Total - All commodities 2,166 100.0 578 100.0 5,645 100.0 5-Chemicals and related products, n.e.s. 223 10.3 24 4.1 185 3.3 6-Manufactured goods classified chiefly by material 188 8.7 56 9.7 670 11.9 7-Machinery and transport equipment 1,451 67.0 455 78.7 4,153 73.6 71-Power generating machinery and equipment 195 9.0 19 3.3 524 9.3 74-General industrial machinery & equipment,a 263 12.1 31 5.3 309 5.5 75-Office machines & automatic data processin 101 4.7 11 1.9 308 5.5 76-Telecommunications & sound recording appar 87 4.0 19 3.3 558 9.9 77-Electrical machinery,apparatus & appliance 305 14.1 14 2.4 1,288 22.8 78-Road vehicles (incl. air cushion vehicles 350 16.1 346 59.8 957 17.0 8-Miscellaneous manufactured articles 214 9.9 33 5.7 523 9.3Note: Commodity classification is based on SITC.Source: Statistics Canada (2004).
Millions of US Dollars and Percent)
Table 3-2-7: Imports from Latin American Countries: by Product
ExportersBrazil Chile MexicoVolume Share Volume Share Volume Share
TOTL-Total - All commodities 2,265 100.0 2,015 100.0 614 100.0 0-Food and live animals chiefly for food 578 25.5 785 39.0 88 14.4 1-Beverages and tobacco 72 3.2 30 1.5 15 2.4 2-Crude materials, inedible, except fuels 860 38.0 1,064 52.8 56 9.2 3-Mineral fuels, lubricants and related mate 1 0.0 0 0.0 107 17.5 33-Petroleum,petroleum products and related m 1 0.0 0 0.0 107 17.5 5-Chemicals and related products, n.e.s. 136 6.0 25 1.2 52 8.5 6-Manufactured goods classified chiefly by material 470 20.8 100 4.9 50 8.2 7-Machinery and transport equipment 107 4.7 0 0.0 181 29.5 71-Power generating machinery and equipment 15 0.7 0 0.0 24 3.9 74-General industrial machinery & equipment,a 11 0.5 0 0.0 15 2.4 75-Office machines & automatic data processin 1 0.0 0 0.0 57 9.3 76-Telecommunications & sound recording appar 37 1.6 0 0.0 28 4.6 77-Electrical machinery,apparatus & appliance 35 1.5 0 0.0 28 4.6 78-Road vehicles (incl. air cushion vehicles 5 0.2 0 0.0 24 3.9 8-Miscellaneous manufactured articles 22 1.0 1 0.0 57 9.3Note: Commodity classification is based on SITC.Source: Statistics Canada (2004).
(Millions of US Dollars and Percent)
Trade with Brazil
There are approximately 1.5 million Brazilians of Japanese ancestry residing in Brazil, and
about 0.27 million of Brazilian workers, including Japanese ancestry, reside in Japan. In this
sense, it is not that Japan and Brazil are totally foreign to each other historically. However, the
economic relations between these two countries have not been very vigorous recently.
As indicated in Table 3-2-4, exports to Brazil have not increased much in these three years.
The slight increase in 2004 is mainly due to the recovery of Brazilian economy. Almost 70
percent of the exported products to Brazil are in the category of “machinery and transport
75

equipment” in the SITC classification, and it includes final products and parts of automobile and
electronic machinery. The largest item in share is parts and components for automobiles.
Another feature is that the most part of the Japanese exports are the items related to operations
by the Japanese affiliates located in Brazil.
Regarding the Japanese imports from Brazil, the major items are “crude materials, inedible,
except fuels,” such as steel, aluminum, and other non-ferrous metals. And if we look at the data
for the year 2004, items in “food and live animals chiefly for food” also account for 10 percent of
total imports. The most part of this category is the import of chicken, and the volume increased
by as much as 115 percent, due to the switch of origin to Brazil from Asia because of the bird flu
outbreak in Asian countries.
Finally, it is also noteworthy that official visits by the government ministries to each other
country have been increasing recently. The official visit by Prime Minister Koizumi to Brazil in
2004 might also be one of the symbolic phenomena of such relations. In 2004, there also
realized visits to Japan by several Brazilian ministers and governors, including the Foreign
Minister Amorim, the Finance Minister Palocci, and Agriculture Minister Rodrigues. And another
event which should not be overlooked is the official visit by President Lula to Japan planned in
the end of May 2005.
With respect to economic issues, the followings are said to be the current major interests of the
Japanese and Brazilian government.
What seems to be the central interest of the Japanese government is to jointly finance, with the
Brazilian government, large projects related to infrastructure development and natural resources
in Brazil. This might not appear to be a dramatic commitment; however, this is an important
approach for both parties, in that the Japanese private sector heavily relies on natural resources
produced in Brazil. And the importance of the Japanese government in securing the supply
from Brazil will certainly be increased in the future, given that the price of iron ore has already
been gradually rising, reflecting the increasing worldwide demand for Brazilian iron ore;
especially, the recent increase in Chinese demand for Brazilian natural resources is remarkable.
76

The major interests of the Brazilian government are the future possibility of exporting fuel
ethanol and beef to Japan. Currently, Japan is hesitant to import these product for different
reasons described below.
First, positions of Japan and Brazil in the issues on ethanol can be explained as follows. Brazil,
the world’s largest ethanol producer, is seeing Japan as a potential market for fuel ethanol,
because using fuel ethanol would help Japan to meet the CO2 emission target designated in the
Kyoto Protocol26. This is because sugarcane, the raw material for ethanol, absorbs as much or
more carbon dioxide than what is emitted by ethanol combustion, and under the Kyoto Protocol,
greenhouse gases emitted from ethanol are considered to be offset by the cultivation of
sugarcane. Especially, after the Japanese government approved of a mix of gasoline and
three-percent of ethanol as car fuel in 2003, expectation by the Brazilian government to the
Japanese market has been increasing. Although they have not reached any agreement on this
issue, this example of ethanol might be a great hint for a new type of business to the Japanese
private sector.
Trade with Chile
Although total trade volume between Japan and Chile is not substantial (Table 3-2-4 and 3-2-5),
it is safe to claim that these two countries have maintained a friendly economic relationship.
Not only that Chile is an important trade partner for Japan, as a supplier of some essential
primary products, Japan is also significant trade partner. In fact, Japan was Chile’s first export
partner in Asia, and was the first country in Asia which invested in Chile.
The effort to promote trade between these two countries can also be seen in the active
performance of Comite Empresarial Chile-Japon (Japan-Chile Committee for Enterprises). The
private sectors of both countries have been meeting regularly to discuss further promotion of
trade, since its establishment in 1977. The possibility of the future Japan-Chile FTA has been
one of the central topics in the committee.
Exports to Chile are very small, and almost 80 percent of the total volume is “machinery and
transport equipment.” The breakdown is, from the largest, automobile, bus and truck, general
machinery, and electric machinery.
26 The protocol obliges Japan to reduce its emissions of greenhouse gases by at least 6% from 1990 levels between 2008 and 2012.
77

Imports from Chile mainly consist of two categories: one is “crude materials, inedible, except
fuels,” and the other is “food and live animals chiefly for food.” The most part of the crude
materials are non-ferrous metals, such as copper and molybdenum, and the rest are lumber
and wood products. Molybdenum, whose demand form all over the world has rapidly increasing,
is mined as a byproduct of copper, an in Japan, the demand for molybdenum as a material of
electronic parts has been expanding recently. About two thirds of food imported from Chile is
marine products and processed marine products(魚介類の加工食品). The rests are meat and
fruit, such as pork, cherry, or grape.
Trade with Mexico
Trade activity between Japan and Mexico has rapidly been expanding, and the EPA was finally
enforced in April 2005. Increases both in Japanese exports and imports with Mexico in 2004
are claimed to have been due to the expectation for merits brought by the future EPA between
these countries.
There is one particular point to be noted, when we look at the data for trade volumes between
Japan and Mexico. The export data in Tables 3-2-4 and 3-2-6 are from different sources and
the import data in Tables 3-2-5 and 3-2-7 are also from the same set of different sources,
JETRO and Statistics Canada, respectively. It can easily be noted that the Japanese imports
form Mexico described in Table 3-2-7 (614 million dollars) is extremely smaller than the ones
shown in Table 3-2-5 (1,785 million dollars).
This is because the data in Tables 3-2-4 and 3-2-5 are based on the report at origins of exports,
while the data in Table 3-2-6s and 3-2-7 are from the report at the destinations. This large
difference between the two ways of measuring trade volume can be explained by the trade
pattern between Japan and Mexico, where part of the items are traded via ports in the US. If
we only look at the data taken at destinations, as in Tables 3-2-6 and 3-2-7, the goods exported
from Japan to Mexico through the US are not captured in the data, and it underestimates the
actual volume of goods transferred from Japan to Mexico. Thus, the actual flow of goods can
be learned more accurately through the data by origin, although the data by destination is used
in Tables 3-2-6 and 3-2-7 because of data availability.
78

The story mentioned about is related to the feature of the Mexican economy which is closely
related to the US economy, through NAFTA scheme and by its geographical closeness to the
US. For the detailed description of Mexico’s trade in relation to the US, please refer to Chapter
4-3, “Mexico”.
Japan’s exports to Mexico were approximately 5,182 million dollars in 2004. More than 70
percent is in the category of “Machinery and transport equipment,” and automobile, parts and
components for electric appliances and parts and components for electronics occupy the most
of it. Japan’s Imports from Mexico were about 2,170 million dollars in 2004. There are mainly
four major categories of products imported to Japan from Mexico: (1) “Machinery and transport
equipment,” (2) Mineral fuels, lubricant and related materials,” (3) “Food and live animals
chiefly for food,” and (4) “Crude materials, inedible, except fuels.” Among these categories are
automobiles and parts and components for automobile and electric parts, crude oil, pork, salt,
avocado, silver, and molybdenum.
3-2-3 Issues and Impediments Regarding Latin American Countries’ Trade and
Investment in Japan
(1) FTA-related Issues
The following describes the status of the EPA (or would-be EPA) with each of the three Latin
American countries. Of these three countries, Japan has enacted an EPA only with Mexico so
far. However, it seems that both the Japanese and Latin American private sectors think that
they could be benefited by the agreement, and especially the Japanese private sector worries
that Japan has (or would have) stark disadvantages by being left behind with the high tariffs
when other countries have (or will) signed for the FTA with these three countries.
Japan-Brazil
According to the survey conducted by the Japanese Chamber of Commerce and Industry in
Brazil (Câmara de Comércio e Indústria Japonesa do Brasil) in October 2003, it turned out that
56 percent of the responders think that the future FTAA and the FTA between EU and
MERCOCUR would bring the comparative disadvantage to the business activities between
79
Japan and Brazil. And 68 percent voted for the necessity of the future Japan-Brazil FTA, at
least to make up for the disadvantage which probably would be caused by the FTAA or the EU-
Brazil FTA.
In addition to the issue mentioned above, the Japanese private sector expects that so-called
brazil cost would be lowered by the EPA. Brazil cost includes the problems related to custom
clearing process and the delay in visa issuing process by the Brazilian government. The EPA
would also be welcome by the Brazilian side, in that it would not only increase the total trade
volume between Japan and Brazil, but also would make it easier for Brazil to overcome issues
related to quarantine and export more fruits and vegetables to Japan.
However, the current situation is that there has been no particular action by either government
to move forward regarding the Japan-Brazil EPA, and some points out that the Brazilian
government is too much preoccupied by the effort for the FTAA and the EU-Brazil FTA to focus
on another FTA/EPA issue at the moment.
Japan-Chile: Joint Study Group Launched in January 2005
The Japanese and Chilean governments have been making an effort for an EPA, through
commencing a joint study group of the government, industry, and academia. The study group
has been launched in January 2005, based on the agreement in the top-level meeting held in
November 2004. The direct merit for the Japanese side is said to be the removal of the current
six-percent tariff on automobile exports to Chile. And the merit for the Chilean side would be a
removal of the 6-percent average tariff imposed on Chilean exports and a more stable export of
the goods that are currently traded between Japan and Chile.
What would be a difficult issue in the negotiation is the importation of fruits and fish from Chile,
due to the Japanese government’s hesitation. It is seen by the Chilean government as an
excessive protection of the Japanese domestic market, while the Japanese government puts an
emphasis on the issues in sanitation and quarantine as the reason for their hesitation.
Concerning the Japanese domestic fruits and vegetable producers, some claims that their
business would not be affected very much by the importation from Chile. Concerning fish and
fishery-related products, the Japanese salmon cultivation industry would strongly be against the
importation of Chilean cultivated salmon, while the Chilean government claims that there would
80

be a clear difference between the market for Chilean cultivated salmon, which would be
imported as frozen fish, and the market for fresh salmon in Japan.
Comite Empresarial Chile-Japon (Japan-Chile Committee for Enterprises) has also been
contributing to the study on the possibility of the future FTA between Japan and Chile, by
conducting surveys and making suggestions to the public and private sectors of both countries.
They say, however, there are a number of issues to be solved, and attitude toward the future
FTA still varies between and within the public and private sector. Another point to be noted
regarding the FTA is that Korea-Chile FTA has already been in force, and that China has begun
negotiation with Chile in January 2005. Members of the committee worry about the indirect
negative effects to the Japanese business which occur because of the absence of the further
delay of signing the FTA with Chile.
Japan-Mexico: Enforced in April 2005
Japan and Mexico signed the EPA in September 2004, and it has been enforced in April 2005.
One of the notable features of the EPA is that it includes a bilateral framework where
improvement of business environment in these two countries could be consulted. One of the
major expectations of the Japanese government is to catch up with the US and the EU
countries that had already established the FTAs with Mexico and gained comparative
advantages.
Although it is too early to evaluate the effect of the EPA on the Japanese economy, it can be
concluded from the data and the interviews that both exports and imports have recently
increased in expectation of the future expansion of the business relationship between Japan
and Mexico. Especially for the Japanese automobile sectors, for both those export cars from
Japan and those produce in Mexico, the EPA has some positive effect. Before the EPA, only
the automobile producers that have production sites in Mexico were allowed to import final cars
of the amount up to 10 percent of Mexican domestic unit sales with no tariff, and MFN tariffs
were imposed upon the amount that exceeded the limit. The MFN tariff for final cars is 50
percent, as of January 2004, and 13 to 23 percent for parts and components. With the
enforcement of the EPA, Japanese automobile companies became allowed to import final cars
with no tariff to the amount of 5 percent of domestic sales in Mexico, regardless of its
81

possessing production sites in Mexico, which definitely brought positive effects for the Japanese
automobile sector.
Tariff removal through the EPA was also beneficial for the Japanese makers of electric
appliances and electronics; both for those export parts to Mexico and those import parts and
produce final products in Mexico. It should, at the same time, be noted that some Japanese
companies that have production sites in Mexico also import parts from other Asian countries.
Therefore it is not always the case that the Japan-Mexico EPA equally brings a benefit to all the
Japanese-affiliated maquiladora companies in this sector, through tariff removal. However, the
overall positive effects of the EPA, including the effort to improve business environment through
the consultation mechanism within this scheme, are substantial.
(2) Issues and Impediments on Trade with Latin American countries
The followings are some of the major impediments these three Latin American countries claim
that they face in trade with Japan. All these countries are the members of the WTO, and in this
sense, they are following the same rules in trading goods and services to each other. However,
there are still a number of points that are claimed to be unfair by one of the parties in their
bilateral trade activities. Especially, regarding the three issues included in the following,
complexity of the tariff system, complexity of trade rules and regulations, and protection of
domestic products, have also been pointed out in a survey report prepared by the WTO. Some
factors in the following are applicable to trade with other countries as well. It should also be
noted that the factors in the following are not based on the comparison with other countries’
trade policy.
Complexity of the Tariff System
Not only these Latin American countries, but also the report by the WTO points out the
complexity of the Japanese tariff system. One of the sources of the complication is various kind
of differentiation in tariff rates, especially in the agricultural sector.
In the report by the Chilean government, two examples are mentioned; tariffs on refined copper
and grape. The tariff for refined copper is 15 yen per kilogram in general, with certain
82

preferential measures in some cases. However, these measures have a cap for developing
countries, and no country could have more than 20 percent of market share. The normal tariff
would be imposed for the amount exceeding the cap. With respect to the tariff on grape, the
rate is from 17 percent between March 1 and October 31. From November 1 through the end of
February, the rate is lowered to 7.8 percent. Approximately 70 percent of the grape importation
from Chile, a country of the Southern Hemisphere, is in the period of 17-percent tariff. Chile
claims that the tariff rate for grape is not only complicated, but also unfair in terms of the rate
differences.
Complexity of Trade Rules and Regulations
Norms and technical regulations are what most of the exporters are faced with, especially in the
sectors of agriculture and forestry. And they are oftentimes considered as non-tariff barriers by
foreign exporters. Especially, foreign exporters claim that Japan is very conservative in the use
of rules related to sanitary and phytosanitary measures, and the quarantine procedure. This is
also the point mentioned in the report by the WTO.
The types of regulation vary from product to product. For Chilean exporters, for example,
protection during transportation, labeling, and detection of a certain moth for cherry exportation
are what they think unnecessarily costly. Also they are concerned about fumigation of fresh
fruits, which is strictly stipulated by the Ministry of Agriculture, Forestry, and Fisheries (MAFF)
but could cause deterioration of fresh products. After the repeated petition by the Chilean
exporters, the MAFF eased the regulation, although the exporters claim that there are still a
number of products that would not need fumigation, or the current high level of fumigation.
With respect to the trade with Brazil, importation of beef is one of the big issues of debate. It is
currently prohibited to import beef from Brazil, due to the outbreak of foot-and-mouth disease in
a certain district. Brazilian government has been requesting the Japanese government to lift the
ban on beef import at least from the other areas of Brazil. The argument by the Brazil is based
on the fact that the US and the EU have already resumed the import of Brazilian beef from the
districts that are thought to be safe.
Japan and Brazil have also been debating over importing other perishables from Brazil. For
example, after a long debate over quarantine issues, Prime Minister Koizumi agreed on the lift
83
of the ban on importation of mango, during his visit to Brazil in 2004. Now that the quarantine
problem was cleared about Mango, it can easily be guessed that Brazil and also other Latin
American agricultural exporters will address its request on export of other perishable goods,
including beef, more strongly than before.
It is not that petitions on deregulation submitted by foreign exporters cannot be accepted by the
Japanese government, as the ban on Brazilian mango was lifted in 2004. However, it usually
takes the Japanese government quite long to make some changes in their trade policies, if it
occurs. It took, for instance, 32 years until it permitted to import Brazilian mango, due to a long
debate on quarantine issue.
Another particular example of strict regulations is related to the issuer of certain certificates. For
example, importation of chemical products to Japan requires a certificate issued in an OECD
country to show where the product was developed, unless there is an FTA between Japan and
the exporting country. Thus, if the exporter is not an OECD country, it has to bear an extra cost
to obtain a proper certificate.
Trade in Services
Foreign firms which provide professional services in Japan are faced with obstacles of very
complicated legal and regulatory barriers. For example, foreigners are required to pass an
additional examination particularly made for foreigners to serve as an accountant, and there are
also very restrictive regulations on medical and educational services. The Chilean government
claims, in a report on the Japanese trade and investment policies, that it concerns these
regulations not only limit the possibility of the future business opportunity beneficial to the both
parties, but also discourage foreign universities to develop a cooperative relationship with the
Japanese academia.
Regarding judicial services, there have been gradual deregulation in the Lawyers Law, through
the “Reform of the Judicial System” passed in the ordinary Diet in 2003. One of the major
features is the change in the field of association between the Japanese and foreign lawyers,
and the new system of “Joint Law Firms” is planned to be implemented in 2005.
84

Protection of Domestic Production
Latin American exporters, as well as the WTO report, indicate that there is an excessive
protection of domestic agricultural products in Japan. Most of the points mentioned above are
thought to be protective measures by foreign exporters, and there have also been repeated
petitions to lift import quota on agricultural products and processed food.
(3) General Issues and Impediments to FDI in Japan
Although there has been almost no FDI in Japan by Latin American countries, it would certainly
be useful to review the current situation of FDI inflow toward Japan. The following part briefly
reviews the current situation and claims frequently made by foreign affiliates in Japan, regarding
FDI. There have been a number of studies on the reasons for stagnation of the Japanese
incoming FDI. In this section, however, I will only mention what seem to be the widely shared
view on this issue, and introduce some relevant observations.
Overview of FDI inflows toward Japan in 2003
As was described in Section 3-2-1, FDI inflows are very low in Japan, contrary to the
government’s intention. Some point out that the Japanese small FDI inflows are due to Japan’s
post-war domestic policies that promoted some targeted domestic industries, based on the
specific national industrial structure goals.
”FDI inflows in 2003 were 18,722 million US dollars, increasing by 4.4 percent from the previous
year. The top five origin of FDI inflows in 2003 were (1) Japan, (2) the United States, (3)
Netherlands, (4) Cayman Islands, and (5) Bermuda Islands. The expansion of the presence of
Japan, i.e. the investment by foreign affiliates in Japan, and the emergence of Cayman Islands
and Bermuda Islands, serving as tax havens, reflect the concentration of the investment in
financial and insurance sector, and FDI inflows in the form of M&As have been increasing. If we
look at the breakdown of the FDI flows to Japan, the volume in the non-manufacturing sector
increased by 28.8 percent from the previous year, while that of the manufacturing sector
decreased by 36.1 percent. More than 60 percent of the FDI in non-manufacturing sector in
2003 was in financial and insurance sector, and it recorded 69.7 percent growth.
85

M&A Stigma in the Japanese Society
FDI among developed countries occurs mainly through means of M&A. This is mainly because
of its merits of short investment gestation period and low initial costs and risks. For instance,
since the mid 1980’s, the UK government has committed to a laissez-faire policy in terms of
cross-border M&As in the UK, despite strong opposition by the British private sector. As a
result of the laissez-faire policy, M&As by foreign capitals, especially in the financial, automobile,
and computer sectors, rapidly increased in the UK, and the employment and exports increased.
However, there is a tendency in the Japanese society, both in the public and private sectors, to
consider M&A as something undesirable. And generally greenfield investment is thought to be
better than M&A, and that mainly greenfield investment should be approved by the government
However, there is a tendency in the Japanese society to consider M&A as an undesirable
business conduct. Although recently the perception of M&A has been changing and it has
gradually becoming accepted in the society, distaste for cross-border M&A still remains, and as
far as FDI is concerned, it is sometimes understood that greenfield investment is more
beneficial to the Japanese economy compared to M&A, particularly in terms of domestic
employment.
One of the reasons for this stereotypical view is that they think, that through cross-border M&As,
foreign affiliates acquiring Japanese firms might drastically restructure operations by cutting
employment. They fear that the decrease of employment would be more than the results of
attrition, bankruptcy, and what the Japanese acquirers would do. Another reason for the M&A
stigma is that some believe that only a greenfield investment could yield more employment,
because they would, by definition, introduce new plants and new workers.
Foreign investors claim that if the Japanese government has any intention to increase FDI
inflow to Japan, promoting M&A is the most natural and effective way to achieve the goal.
Observing the current situation, where the Japanese government desires to increase FDI
inflows on the one hand and takes almost no action to accommodate cross-border M&As on the
other hand, foreign companies are puzzled about the true intention of the Japanese government.
They even say that the Japanese government is “not serious,” due to the contradiction.
Norms, Regulations, and Legal System
86

It is difficult for foreign firms to utilize various financial transactions under the current
Commercial Law. There are a number of specific problems that the foreign affiliates are faced
with, but the bottom line is that the current Japanese Commercial law is only partly applicable to
the operation by foreign capitals, and as a result, they are unable to fully participate in business
transaction in Japan. Another notable legal problem is the vague demarcation between the
Commercial Law and the Securities and Exchange Law. For example, stock swap and IPO are
the major transactions that the foreign firms would like to execute and the current Japanese
legal system does not allow them to do. This prevents foreign capitals from pursuing M&As in
Japan, and thus they strongly request that this point should be amended soon. And they believe
that it would facilitate their operations and would increase the Japanese FDI inflow.
What is possible for foreign firms under the current law is to enter the market as a new player.
Only in this case, the firm is treated in the same manner as Japanese firms based on the
Commercial Law. However, foreign firms are not particularly interested in entering market as a
new comer: they are usually in the situation where they have substantial money but do not have
strong connections or accumulation of know-how within the Japanese domestic market.
Foreign firms also point out that one of the major factors preventing the laws and regulations
from being amended is the tatewari (vertical) bureaucratic system. Especially the conflicts in
attitudes among the Financial Supervisory Agency (FSA), the Ministry of Finance (MOF), and
the Ministry of Justice (MOJ). As long as there is this kind of conflict within bureaucracy, it
would be very difficult to pursue the policies made in the legislature.
Immature Capital Market
Some claim that there is no free and reliable capital market in Japan. Price setting is not fully
based on market mechanism for various sectors, especially in financial services, and the
liquidity is very low. In addition, lack of concept of corporate governance and lack of an
information disclosure system make it difficult for foreign firms to participate in business
activities in Japan. Foreign firms located in Japan seem to find it rather serious that the
Financial Supervisory Agency (FSA) of Japan is not willing to face with the structural problem of
the Japanese financial system and conduct a reform to establish a freer market mechanism.
3-2-4 Japanese Government’s Effort to Promote Trade and FDI
87

Trade
With respect to trade in goods, the Japanese government has been making an effort to
accommodate transactions, by reacting to each of the petitions submitted by the foreign
exporters. A small set of examples is included in Section 3-2-3 (2). Japan’s major trade
partners claim, however, that these efforts by the Japanese government are not enough.
Regarding trade in services, the Japanese government has been taking measures to improve
environments in the field of service trade, too; for example, deregulation of the Lawyers Law.
For quite some time, there had been a strong request from foreign lawyers and the relevant
private companies in Japan for freedom of association between Japanese lawyers and foreign
attorneys. Under the original regulations by the Japan Federation of Bar Association
(Nichibenren), this kind of association was not possible, except in some special joint enterprise
system, where they could work together. Due to these strict regulations and the limits for their
activities, the number of foreign lawyers in Japan is extremely small, compared to other
countries where international business activities are developed.
Corresponding to the demand, the Koizumi administration launched the Judicial Reform Council
(JRC) in 2001, and since then, the Reform of Judicial System has gradually been progressing.
And finally in 2005, changes in the Lawyers Law will be implemented, so that foreign and the
Japanese lawyers will have more freedom in association. Although foreign firms and lawyers
claim that the reform has been very slow and it is not sufficient, this reform should still be
appreciated, in that the Lawyers law was revised for the first time in fifty-four years.
FDI
A recent notable event related to the Japanese FDI promotion policy is the Prime Minister
Koizumi’s announcement in January 2003. He officially declared the government’s commitment
to double the total stock of Japanese inward FDI in five years, and various promotion measures
for inward FDI started to be implemented in March 2005, based on the Japan Investment
Council (JIC) Expert Committee Report and the “Program for the Promotion of Foreign Direct
Investment into Japan.”
More than 70 items, including suggestions, plans, and policies to be implemented, are included
88

in the “Program for the Promotion of Foreign Direct Investment into Japan, and they are
categorized in five core concepts as follows;
(1) Dissemination of information within Japan and abroad
(2) Improvements in the business environment
(3) Reviewing administrative procedures
(4) Create favorable employment and living environments
(5) Improve local and national structures and systems
The main issue in the first category is on public relations of opportunities and the importance of
FDI in Japan toward people inside and outside Japan, and the second category shows Japan’s
intention to “examine” the possibility of improvements in legal and taxation systems to facilitate
cross-border M&A. This includes “examinations” of the diverse ways of settlement in M&A
procedure. This is the only discussion that focuses on cross-border M&A in Japan. The
category also emphasizes enhancement of transparency in the capital market system and
facilitation of procedure in starting new business, including tax incentives for some particular
sectors. The third category promises the future establishment of easier access to information
related to investment opportunity and to consultation for the difficulties the company is faced
with. The fourth category elaborates how the public sectors could further improve working and
living environment for foreign workers in Japan. And finally, the last part suggests the closer
relationship between the central and local governments in promoting FDI.
3-2-5 Suggestions to Strengthen Business Activities between Japan and Latin America
(1) Trade
The Japanese government has been making great effort to achieve free trade and to facilitate
trade with countries all over the world, based on the WTO rules and through signing FTAs.
Further progress in signing EPAs or FTAs is strongly expected, and improvements in bilateral
relations with China and Korea is also an important factor for the Japanese economy.
(2) FDI
89

As was emphasized above, the Japanese government needs to further promote FDI in general.
This is not only to meet the target that Prime Minister Koizumi set in his remarks in 2003, but to
raise productivity by acquiring know-how of business and technology through FDI. What is
typically requested to the Japanese government by the foreign private firms is to accommodate
foreign investment, through further deregulation in relation to the commercial law, the effort to
reduce the negative image of M&A, and establishment of free capital market.
M&A Stigma in the Japanese Society
Foreigners operating business in Japan claim that the Japanese government should make
greater effort to eradicate a negative image of M&A from the Japanese society. Foreign firms
also claim that the Japanese government should make a clearer announcement regarding their
intention and the way to promote inward FDI. And it should more clearly publicize that the most
effective and feasible means of FDI among developed countries is M&A, rather than greenfield
investments. They claim that it is also necessary that the Japanese government analyze and
explain to the public that M&A does not always mean cutoff of employment. The current
situation, where the government has an intention to increase inward FDI but is hesitant to
accommodate cross-border M&As, does not do any good to the Japanese economy. And if it
prefers to promote more greenfield investment, foreign business people think that the
government should explicitly announce their plan to the public, and implement promotion
measures particularly for greenfield investment, although it would not be as beneficial to the
Japanese economy as investments through M&A.
In addition, the Japanese government should provide more information on the effects of FDI,
based on reliable analysis of data. This could contribute to counter existing negative images of
M&A in the society. For example, according to the report by the American Chamber of
Commerce in Japan (ACCJ), an analysis by JETRO reveals that 599 new businesses were
launched by foreign capitals from 1995 to 2000, and the average revenue growth of such
foreign companies is higher than that of Japanese companies. And potential foreign acquirers
emphasize that the Japanese people should understand that the temporary cutoff of workers
after M&As by foreign companies could be a better result, compared to the bankruptcy the
company would go through without the takeover.
Some suggested during the interviews that a TV program which vividly describes and advertises
cross-border business activities in Japan, including M&As by foreign capitals, might also
contribute to eradicate the negative image of M&As that the Japanese people have.
90

Norms, Regulations, and Legal System
Government should further implement deregulation and privatization measures. Although
certain sectors have gradually been deregulated, foreign firms emphasize that deregulation and
privatization do not have strong impacts on FDI flows, unless they include so-called “protected”
sectors, such as healthcare services, education, and other publicly-operated areas.
Another central request by foreign firms is the further reform of the Commercial Law. As was
mentioned in Section 3-2-3, “Issues and Impediments on Latin American Countries’ trade and
investment in Japan,” it is necessary to implement more consistent and comprehensive law,
which enables foreign firms to participate in various financial transactions related to M&A. It is
also crucial to clarify the demarcation of the Commercial Law and the Securities and Exchange
Law. In this way, foreign corporations could for the first time manage their operations in Japan,
following and being protected by a proper legal system, which no doubt would increase FDI
toward Japan and be beneficial to the Japanese economy. In addition, there are other parts to
be deregulated to facilitate consultations by foreign firms regarding their business operations.
As mentioned in the section for service trade impediments, further deregulation in certification
for lawyers and accountants are among them.
Immature Capital Market
Suggestions for this issue are closely related to the arguments in the above section “Norms,
Regulations, and Legal System.” Foreign business people in Japan claim that a drastic
government reform is necessary for Japan to achieve truly free capital market.
They strongly suggest that the Japanese government conduct careful studies on corporate
governance and capital market. For example, capital market in the US has highly been
deregulated, and the Securities and Exchange Commission (SEC) is playing an important role
in conducting analyses and making suggestions on possibilities of further utilizing the market
system. They also point out that what is making it possible for the US SEC to make such
contribution is its independence in terms of research, relatively large scale of budget, and the
large number of staffs.
91

What could be a Japanese counterpart of the US SEC is the Business Value Study Group,
established by the METI in September 2004, for the purpose of the legal adjustment and
modernization to deal with increasing cases of M&A in Japan. However, it is a smaller
institution compared to the US SEC with the smaller budget, and what foreigners point out to be
the largest caveat is that discussions within the study group are rather defensive against M&A
and they do not seem to contribute to the future FDI or M&A in Japan. Thus, improvement of
the functions of such institutions as the Business Value Study Group is one thing the Japanese
government could do.
However, it is also pointed out that this kind of improvement would hard to be achieved due to
Japan’s tatewari (vertical) bureaucratism. In the above case, for example, nobody could
demand that the METI should work on the reform of the Business Value Study Group, because
the METI is not responsible for nurturing capital market. Then the question is who is
responsible for it: the answer is the FSA. However, discussions on corporate value and
corporate governance are not within the territory of the FSA. Thus, one of the most important
issues has been put aside so far.
This is another reason why foreign firms in Japan strongly request reform of the government
structure. Of course, it is not only government that is responsible for the immaturity of capital
market and the concept of corporate governance in Japan. The private sector as well should
establish the internal monitoring mechanism for corporate value, such as the position of CFO.
This kind of internationalization of corporate system would contribute to its business activities
and to facilitation of inward FDI through M&As.
Other Suggestions
Another effort possibly made by the public sector is to make maximum use of such opportunities
as official meetings by the top government officials from these two regions, in order to promote
economic activities. What has become clearer in the interviews is that the private sector pays
close attention to those governmental meetings. Especially in the case of official meetings
between Asian and Latin American delegates, it seems that the private firms in both regions pay
greater attention to what is discussed and announced in the meetings, mainly because business
relationship between these two regions have not sufficiently been developed, and any kind of
positive announcement by the governmental delegates could be a sign for the larger
92
commitment to the economic activities by the two governments, which would back up the future
activities of the private sectors.
For instance, the official visit to Japan by Brazilian President Lula in May might have been the
closest example for the situation described above. Before the President’s visit, it was widely
presumed that President Lula would probably raise the issue regarding fuel ethanol during his
visit to Japan, while the Japanese government had not shown particularly positive attitude in
introducing it, for several reasons mentioned in the previous sections. However, in the
interviews conducted in this project, the private sectors, whether or not it is related to oil or
sugarcane industries, claimed that the Japanese government should at least show the will of
their future commitment to business promotion between Japan and Brazil. By the end of the
president’s visit, various forms of future cooperation in business, tourism, and energy resources,
has been confirmed between the two countries, including several financial offers through JBIC
(Japan Bank for International Cooperation). Although it is still too early to evaluate the
achievement of this meeting, this could be one factor that contributes to avoid further downturn
of business relationship between these two countries would be avoided. Thus, it is very
important for the public sector to pay attention not only to what they can promise to make
commitments in the near future, but also to what kind of announcement they should make to
induce further private investments.
Another point emphasized in the interviews that major agencies promoting investment in Japan
should pay more attention to business opportunities in local areas, in cooperation with the local
governments. Although there would be a number of issues to be solved in the relations
between central and local governments, including debates regarding local allocation tax and
other political issues, it might still be beneficial to the Japanese economy to strengthen the
autonomy and authority of local governments and attract more foreign investment.
Finally, regardless of the possibility and feasibility, foreign business people in Japan also point
out that it is necessary to reinforce the Japanese Cabinet, in order for its industrial and judicial
policies to actually be implemented. In this way, they suggest, that the ministries would have to
solve the conflicts among them and overcome the tatewari (vertical) bureaucratic system, which
93
for the first time would enable the Japanese government to establish a consistent legal and
institutional environment for foreign firms.
32 Sources: (i)(ii)(iii)(v)(vi)(vii)(viii)(ix) JETRO, (iv) Bank of Korea
94

333---333 KKKOOORRREEEAAA (((RRREEEPPPUUUBBBLLLIIICCC OOOFFF KKKOOORRREEEAAA)))
3-3-1 Basic Information
(1) Basic Statistics on Korea32
i) Population: 47.93 million (2003 est.)
ii) Area: 99,585 km2
iii) GDP -per capita-: 12,499 USD (2003)
2001 2002 2003 2004
iv) GDP –real growth rate- 3.8 7.0 3.1 5.0 v) Export (mil. USD) 150,439 162,471 193,817 vi) Import (mil. USD) 141,098 152,126 178,827 vii) Trade balance (mil. USD) 13,488 14,777.4 21,952 viii) FDI inflow (mil. USD) 11,292 9,111 6,468 ix) Current balance (mil. USD) 8,032.6 5,393.9 11,949.5
The GDP growth rate was 5.0 percent in 2004 and is expected to be 4.5 percent in 200533. The
high growth rate in 2004 was mainly due to the growth in exports (21.1 percent) that was largely
driven by external demand, mainly by China (including Hong Kong). While strong external
demand supports the growth of the Korean economy, domestic consumption has been declining
since 2003 due to the household debt overhang. The growth of private consumption was –1.4
percent in 2003 and –0.5 percent in 2004. Maintaining Korea’s economic growth in future thus
depends on the resiliency of export growth and a rebound in private consumption.
Total exports were 193,817 million dollars in 2003, recording approximately 19.3 percent growth
from the previous year. Among the major factors for this large growth are the increase in
exports toward China, and the upturn in external demand for IT-related products, whose share
is the largest in Korea’s total exports (40 percent in 2003). What is notable here is that China
has been growing as an export destination for Korea every year; finally in 2003, it overtook the
US and became the largest export partner. China’s share was 18.1 percent and that of the US,
the second largest export partner, was 17.7 percent in 2003.
33 OECD (2005).
95
Total imports were 178,827 million dollars in 2003, marking annual growth of approximately
17.6 percent. As in the previous year, the major import products were electrical and electronics
equipment. This is mainly due to the increase in the import of parts for the production of IT-
related products, whose export share has rapidly been increasing. As is also described in the
following section, the volume of trade between Korea and Latin American countries is still very
small.
The FTA between Korea and Chile went into force in April 2004, and a positive impact has
already been seen in the increase in automobile exports to Chile. In addition to the Korea-Chile
FTA, the Korean government confirmed, in the Roadmap for FTA Promotion announced in
August 2003, that it would make further efforts to promote FTAs with Singapore, ASEAN, and
Mexico in the short term, and with the US, the EU, Japan, and China in the medium to long term.
As of March 2005, Korea is in the negotiation stage with Japan, Singapore, ASEAN, and the
EFTA, and it is in the pre-negotiation stage with the US. Also in May 2004, Korea agreed with
Mexico to establish a joint research group on the FTA between the two countries.
FDI flows into Korea have been declining for four successive years. Among the major factors
for the decline is said to be President Roh’s laborer-friendly solutions for a number of labor-
management-related issues. MNEs have recently become more cautious in their investment
decisions. However, FDI from the EU increased by 84.1 percent in 2003, accounting for
approximately 50 percent of the FDI flows into Korea. This increase is mainly due to the M&A
activities of certain European companies. FDI from Japan and the US declined in 2003,
although they still remain among the top five investors in Korea. As is also mentioned in the
following section, there is little direct investment from Latin American countries.
With regard to the outflows, the largest FDI partner for Korea is China. In 2003, FDI toward
China was 1,344 million US dollars, which marked a 50.0 percent annual growth.
3-3-2 Relations with Latin America
Table 3-3-1 indicates Korea’s major export commodities to the world, Brazil, Chile, and Mexico
in 2002. Korea’s exports to Brazil, Chile, and Mexico were relatively substantial. The values of
96
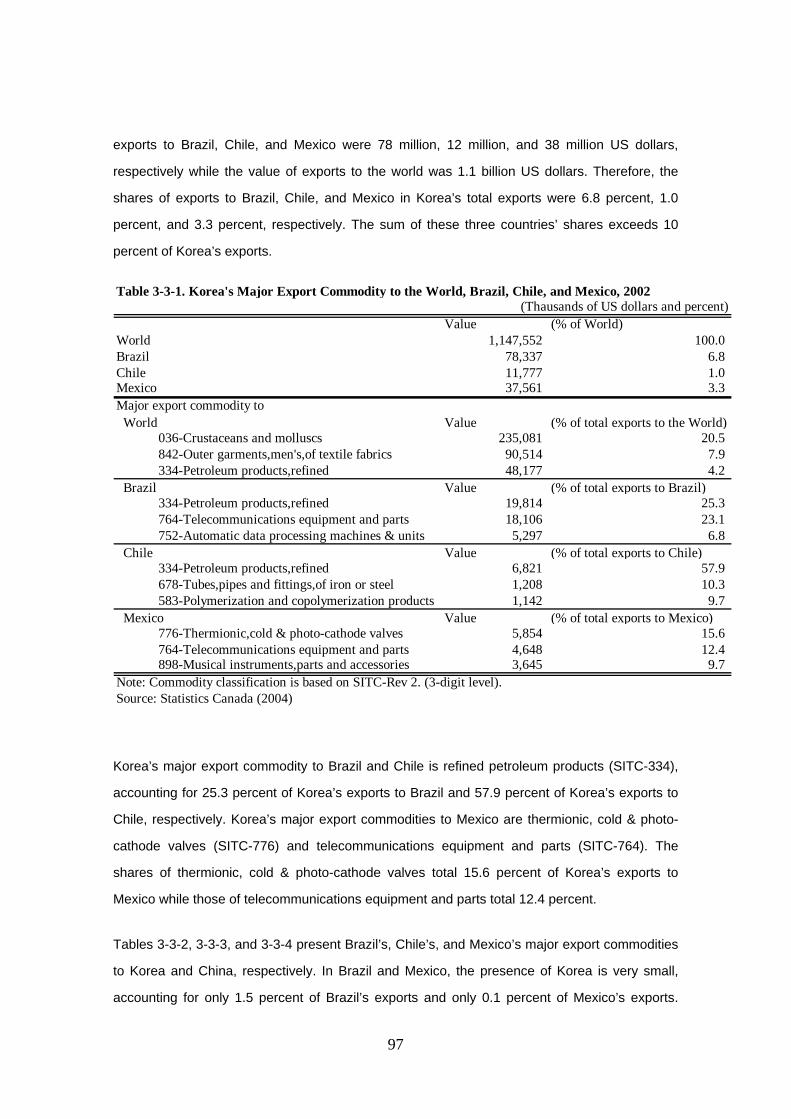
exports to Brazil, Chile, and Mexico were 78 million, 12 million, and 38 million US dollars,
respectively while the value of exports to the world was 1.1 billion US dollars. Therefore, the
shares of exports to Brazil, Chile, and Mexico in Korea’s total exports were 6.8 percent, 1.0
percent, and 3.3 percent, respectively. The sum of these three countries’ shares exceeds 10
percent of Korea’s exports.
orea’s major export commodity to Brazil and Chile is refined petroleum products (SITC-334),
accounting for 25.3 percent of Korea’s exports to Brazil and 57.9 percent of Korea’s exports to
commodities
to Korea and China, respectively. In Brazil and Mexico, the presence of Korea is very small,
accounting for only 1.5 percent of Brazil’s exports and only 0.1 percent of Mexico’s exports.
Table 3-3-1. Korea's Major Export Commodity to the World, Brazil, Chile, and Mexico, 2002(Thausands of US dollars and percent)
Value (% of World)World 1,147,552 100.0Brazil 78,337 6.8Chile 11,777 1.0Mexico 37,561 3.3Major export commodity to World Value (% of total exports to the World) 036-Crustaceans and molluscs 235,081 20.5 842-Outer garments,men's,of textile fabrics 90,514 7.9 334-Petroleum products,refined 48,177 4.2 Brazil Value (% of total exports to Brazil) 334-Petroleum products,refined 19,814 25.3 764-Telecommunications equipment and parts 18,106 23.1 752-Automatic data processing machines & units 5,297 6.8 Chile Value (% of total exports to Chile) 334-Petroleum products,refined 6,821 57.9 678-Tubes,pipes and fittings,of iron or steel 1,208 10.3 583-Polymerization and copolymerization products 1,142 9.7 Mexico Value (% of total exports to Mexico) 776-Thermionic,cold & photo-cathode valves 5,854 15.6 764-Telecommunications equipment and parts 4,648 12.4 898-Musical instruments,parts and accessories 3,645 9.7Note: Commodity classification is based on SITC-Rev 2. (3-digit level).Source: Statistics Canada (2004)
K
Chile, respectively. Korea’s major export commodities to Mexico are thermionic, cold & photo-
cathode valves (SITC-776) and telecommunications equipment and parts (SITC-764). The
shares of thermionic, cold & photo-cathode valves total 15.6 percent of Korea’s exports to
Mexico while those of telecommunications equipment and parts total 12.4 percent.
Tables 3-3-2, 3-3-3, and 3-3-4 present Brazil’s, Chile’s, and Mexico’s major export
97
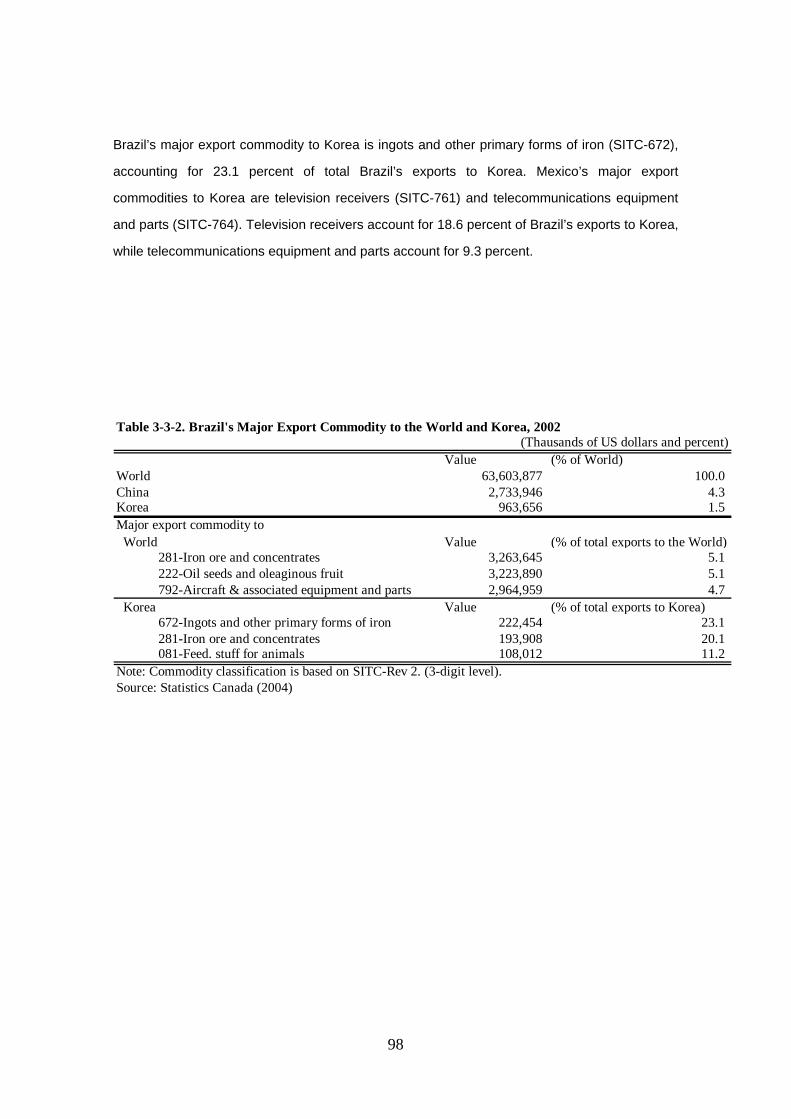
Brazil’s major export commodity to Korea is ingots and other primary forms of iron (SITC-672),
accounting for 23.1 percent of total Brazil’s exports to Korea. Mexico’s major export
commodities to Korea are television receivers (SITC-761) and telecommunications equipment
and parts (SITC-764). Television receivers account for 18.6 percent of Brazil’s exports to Korea,
while telecommunications equipment and parts account for 9.3 percent.
Table 3-3-2. Brazil's Major Export Commodity to the World and Korea, 2002(Thausands of US dollars and percent)
Value (% of World)World 63,603,877 100.0China 2,733,946 4.3Korea 963,656 1.5Major export commodity to World Value (% of total exports to the World) 281-Iron ore and concentrates 3,263,645 5.1 222-Oil seeds and oleaginous fruit 3,223,890 5.1 792-Aircraft & associated equipment and parts 2,964,959 4.7 Korea Value (% of total exports to Korea) 672-Ingots and other primary forms of iron 222,454 23.1 281-Iron ore and concentrates 193,908 20.1 081-Feed. stuff for animals 108,012 11.2Note: Commodity classification is based on SITC-Rev 2. (3-digit level).Source: Statistics Canada (2004)
98
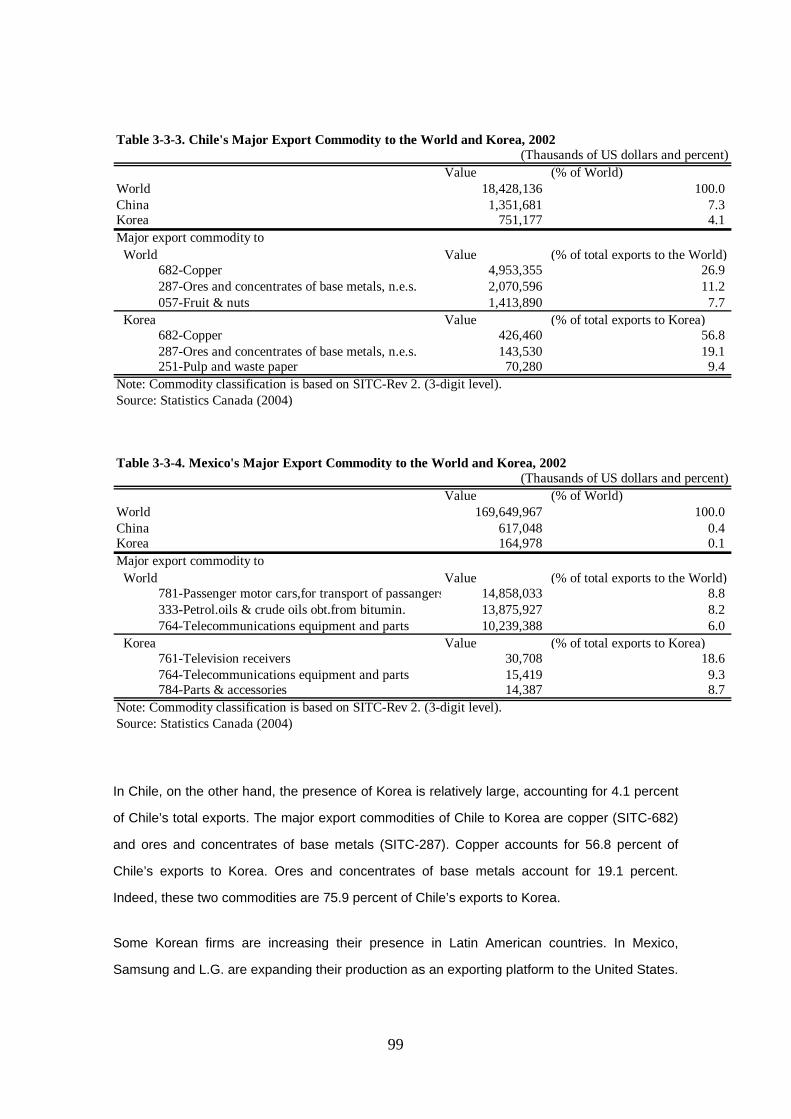
Table 3-3-3. Chile's Major Export Commodity to the World and Korea, 2002(Thausands of US dollars and percent)
Value (% of World)World 18,428,136 100.0China 1,351,681 7.3Korea 751,177 4.1Major export commodity to World Value (% of total exports to the World) 682-Copper 4,953,355 26.9 287-Ores and concentrates of base metals, n.e.s. 2,070,596 11.2 057-Fruit & nuts 1,413,890 7.7 Korea Value (% of total exports to Korea) 682-Copper 426,460 56.8 287-Ores and concentrates of base metals, n.e.s. 143,530 19.1 251-Pulp and waste paper 70,280 9.4Note: Commodity classification is based on SITC-Rev 2. (3-digit level).Source: Statistics Canada (2004)
99
Chile, on the other hand, the presence of Korea is relatively large, accounting for 4.1 percent
of Chile’s total exports. The major export commodities of Chile to Korea are copper (SITC-682)
ntries. In Mexico,
Samsung and L.G. are expanding their production as an exporting platform to the United States.
Table 3-3-4. Mexico's Major Export Commodity to the World and Korea, 2002(Thausands of US dollars and percent)
Value (% of World)World 169,649,967 100.0China 617,048 0.4Korea 164,978 0.1Major export commodity to World Value (% of total exports to the World) 781-Passenger motor cars,for transport of passangers 14,858,033 8.8 333-Petrol.oils & crude oils obt.from bitumin. 13,875,927 8.2 764-Telecommunications equipment and parts 10,239,388 6.0 Korea Value (% of total exports to Korea) 761-Television receivers 30,708 18.6 764-Telecommunications equipment and parts 15,419 9.3 784-Parts & accessories 14,387 8.7Note: Commodity classification is based on SITC-Rev 2. (3-digit level).Source: Statistics Canada (2004)
In
and ores and concentrates of base metals (SITC-287). Copper accounts for 56.8 percent of
Chile’s exports to Korea. Ores and concentrates of base metals account for 19.1 percent.
Indeed, these two commodities are 75.9 percent of Chile’s exports to Korea.
Some Korean firms are increasing their presence in Latin American cou

In Chile, Korean automobiles such as Hyundai are becoming popular. In Brazil, FDI from Korea
is rapidly increasing in the electric machinery sector.
The expansion of the activity of Korean firms is closely related to the FTA. Mexico was chosen
as an exporting platform to the United States because of NAFTA. Similarly, Brazil is regarded
-3-3 Specific Impediments
Japan PECC (2002) pointed out several impediments in Korea. Some of them are summarized
irements
as an exporting platform to other Mercado Comun del Sur (MERCOSUR) countries. On the
other hand, the rapid increase of Korean automobile exports to Chile is largely attributed to the
Korea-Chile FTA.
3
(1) General Issues
as follows.
Export requ
not allowed to sell products in the domestic market (foreign firms must
export the products). For instance, a Japanese fastener firm was obliged to export all goods
egulations
Foreign firms are often
produced in Korea.
Monetary transfer r
share of a firm is owned by a Japanese firm, the affiliate is
regarded as the same firm as the Japanese parent firm. This thus implies that royalty transfers
s and trade financing
If more than half of the equity
are not permitted.
Exchange control
of foreign currency to/from Korean Won. Moreover,
foreign firms are not able to receive export financing for export business.
There are restrictions on the conversion
100

(2) Issues related to Latin America
market is not a place for investment but a destination for
exports. Since only a few Latin American firms have entered the Korean market, the
and some manufacturing products. In addition, business people noted several non-tariff
-3-4 FTA-related Issues and Suggestions to Deepen Relations Between Korea and Latin
America
dministration is making a great effort to develop Korea as the hub of logistics and
business in North East Asia. For the purpose of promoting further FDI in this area, the Korean
s in Korea and Latin American countries suggest that, with a
small degree of effort, the Korean market could be made a more attractive place for Latin
For Latin American firms, the Korean
impediments for Latin American firms are concentrated in trade-related aspects.
Many business people believed that there still exist tariff barriers for most agricultural products
measures that constitute major impediments in Korea. For instance, the enforcement of
sanitary conditions is sometimes unclear. Contracts without written documentation by the
government are not always kept on file and are sometimes unclear, which makes it difficult for
Latin American firms to do business in Korea. Latin American firms sometimes found that legal
documents and information on trade and FDI were not always provided in English.
3
The Roh a
government designated three areas – Inchon, Busan/Jinhae, and Gwangyang – as Free
Economic Zones in 2003. Foreign companies located in any of these three areas are eligible
for various preferential policies, such as tax exemptions (partial or full) and rent waivers (partial
or full). There are also facilities such as schools and hospitals particularly designed to
accommodate foreigners living in these areas. The Korean government is also planning to build
new ports in Busan and Gwangyang by 2011, as the competition to attract large ships has been
intensifying in North East Asia.
The results from some interview
American firms. For instance, providing all legal documentation and information on trade in
English is a possible first step. Similarly, Latin American firms might export more easily if the
Korean government were to prepare written documentation of contracts more actively.
101

Latin American firms need some effort to expand their activities in Korea. Latin America is not a
familiar region for Korean people since Latin America is far from Korea. Therefore, to make
ontribute to deeper understanding
between the two regions through the Business Council. In other words, the two regions should
e relations between Korea
and Latin America, although some sectors such as agriculture are against FTAs. According to
ss not only trade-related issues but also other issues
such as FDI. As we discussed in Section 3-3-3, several impediments have been identified by
ber countries. In other
words, FTAs should be regarded as a step toward global free trade. Membership should not be
Latin American culture as well as products popular seems to be a necessary step for Latin
American firms to expand their business in Korea. For instance, exhibitions of Latin American
products in Korean cities would be one possible approach.
The government and government-related agencies can c
point out the particular facets that make each attractive to the other.
To establish FTAs is one of the most powerful solutions to deepen th
Kishida (2004a, b), Korea has completed FTA negotiations with Chile and now is examining the
possibility of FTAs with ASEAN, Japan, and Singapore. It is clear that Korea is currently focused
on East and Southeast Asian countries, but it is also worth noting that the first country with
which Korea completed FTA negotiations was not an East and Southeast Asian country but one
of the Latin American countries. Thus, there is some possibility of expanding bilateral Korea
FTAs with other Latin American countries.
In negotiating FTAs, it is important to addre
the foreign companies that have already entered Korea. Indeed, the discussion on investment-
related issues is essential to deepen economic relations between Korea and other countries,
including Latin America. One of the next steps is thus to develop more favorable environments
for investments, solving the problems proposed by Japan PECC (2002) so that FTAs can be
catalysts to help deepen the relations between these two regions.
Finally, we should note that FTAs are not a tool for excluding non-mem
limited only to certain countries. If the membership is closed, trade wars could break out
between trading blocs. We expect a “domino” effect: falling trade barriers in one set of countries
102

will trigger a fall in the barriers of other countries, which ultimately will result in global free
trade.34
34 For the “domino” effect, see Baldwin (1996).
103

333---444 TTTHHHAAAIIILLLAAANNNDDD (((KKKIIINNNGGGDDDOOOMMM OOOFFF TTTHHHAAAIIILLLAAANNNDDD)))
3-4-1 Basic Information
(1) Basic Statistics on Thailand35
i) Population: 63.360 million (2003 est.)
ii) Area: 513,115 km2
iii) GDP -per capita-: 2,230 USD (2003)
2001 2002 2003 2004 iv) GDP –real growth rate- 2.1 5.4 6.8 6.1 v) Export (mil. USD) 65,235 68,156 80,049 vi) Import (mil. USD) 61,754 64,243 75,018 vii) Trade balance (mil. USD) 2,494 2,739 3,759 viii) FDI inflow (mil. USD) 3,873 1,023 1,882 ix) Current balance (mil. USD) 6,250 7,080 7,965
Thailand has a free-enterprise economy and foreign investment has been one of the major
drivers of its economic development. The government of Thailand implemented intensive
industrial policies during the 1970s to promote foreign investment, and by the 1980s, there was
a great amount of FDI flowing into Thailand. Strongly supported by FDI and the upturn in
exporting industries, the economy experienced significant growth until it was faced with the
Asian financial crisis of 1997. Due to the crisis, the real GDP growth rate hit bottom at -10.4
percent in 1998.
In 1999, the economy started to recover, mainly due to external demand. Since then, domestic
consumption has also been recovering and the relatively large growth rate in 2002 has
reportedly been boosted both by external and domestic demand. In 2002, private consumption
and investment grew by 4.7 and 13.3 percent, respectively. With stronger consumer confidence,
an increase in exports, and an expansion of private investment as the main supporting factors
for private consumption, real GDP growth in 2003 was 6.8 percent, despite a sluggish world
economy. The main factors that boosted private consumption were a low interest rate
35 Source: JETRO
104

environment and the rise in incomes in the agricultural sector. The decline in GDP growth in
2004 was mainly due to increases in oil prices, a downturn in the agricultural sector, and the
avian flu outbreak.
In 2003, both exports and imports increased. Total exports in 2003 were approximately 80
billion US dollars, representing an annual growth of 17.4 percent. Although the increase in
exports toward the US, the largest export partner, was modest in 2003, exports to Japan and
the EU increased significantly due to the recovery in their economies. It is also noteworthy that
there was a positive impact from the tariff reductions stipulated in the FTA with China36 and
ASEAN countries; precisely, exports to China increased by 60.1 percent and exports to ASEAN
countries increased by 21.9 percent.
As can be seen in Table 3-4-1, the top three export partners of Thailand – the United States,
Japan, and Singapore – have not changed since 1990, and their shares have remained
essentially the same although the total volume itself has been gradually growing. By 2003, the
export volume had become far larger than the pre-crisis level.
Table 3-4-5 Trade and FDI-related problems and requests raised by Japanese firms in ThailandImpediments
1
2 Complications and delays in port entry procedures3 High tariffs4 Assessment and application of tariffs are sometimes arbitrary.5 Abuse of anti-dumping measures on steel products6 Strict regulation of foreign exchange 7 Taxation at the source for international money transfers8 Difficulty of tax returns for corporate tax, value-added tax, and tariffs 9
10 Inadequate protection of property rights11 Restrictions on land possession12 Insufficient industrial waste facilities despite strict regulations13 Inadequate port and road infrastructure
A wide range of restrictions on the entry of foreign capital still exist in both the manufacturing and servicesectors, despite the government's implementation of deregulation policies
Difficulty in obtaining permission related to labor, including regulations on the foreign-domesticemployment ratio, and working permission for foreign employees (especially in the construction sector);
Source: Kakkoku chiiki no boueki toushi-jo no mondaiten to youbou (Issues and requests relating to foreign tradeand investment), Nihon Kikai Yushutsu Kumiai, 2003
36Based on the Framework Agreement on ASEAN-China Comprehensive Economic Cooperation signed in 2002, tariffs on several items have already been removed or reduced, starting from October 2003, as an early harvest.
105
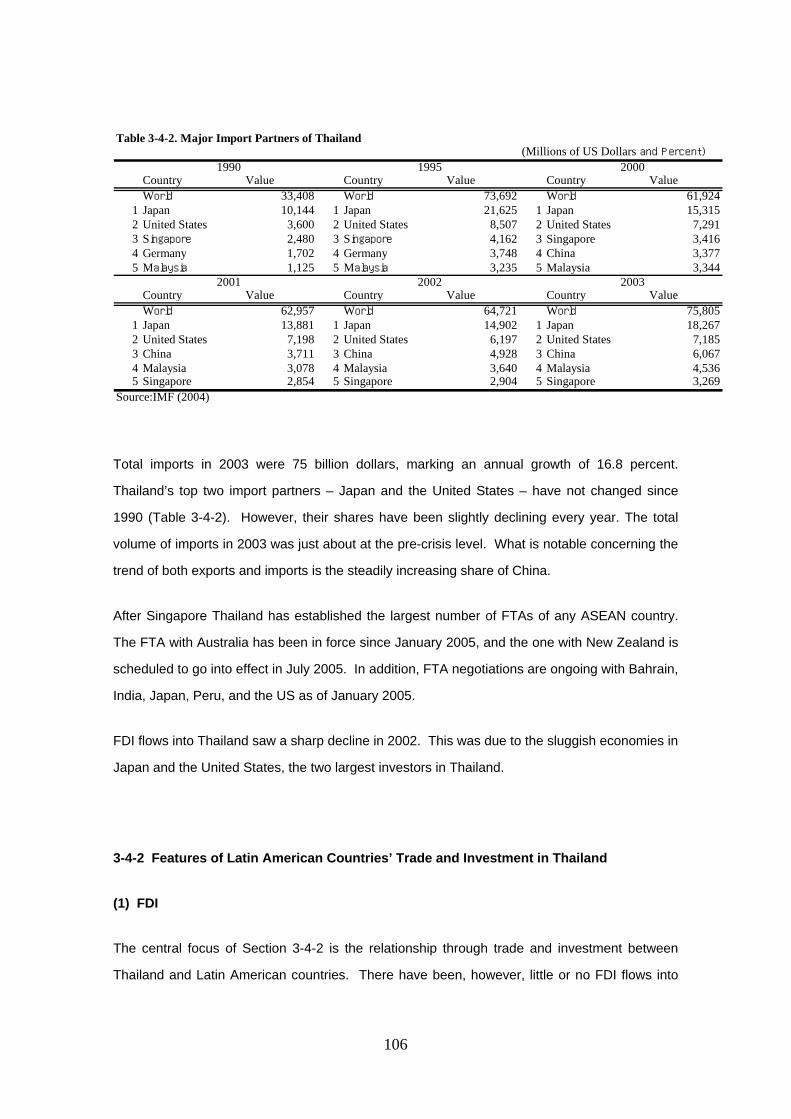
106
Japan and the United States, the two largest investors in Thailand.
investment between
Thailand and Latin American countries. There have been, however, little or no FDI flows into
Table 3-4-2. Major Import Partners of Thailand(Millions of US Dollars and Percent)
1990 1995 2000Country Value Country Value Country ValueWorld 33,408 World 73,692 World 61,924
1 Japan 10,144 1 Japan 21,625 1 Japan 15,3152 United States 3,600 2 United States 8,507 2 United States 7,2913 Singapore 2,480 3 Singapore 4,162 3 Singapore 3,4164 Germany 1,702 4 Germany 3,748 4 China 3,3775 Malaysia 1,125 5 Malaysia 3,235 5 Malaysia 3,344
2001 2002 2003Country Value Country Value Country ValueWorld 62,957 World 64,721 World 75,805
1 Japan 13,881 1 Japan 14,902 1 Japan 18,2672 United States 7,198 2 United States 6,197 2 United States 7,1853 China 3,711 3 China 4,928 3 China 6,0674 Malaysia 3,078 4 Malaysia 3,640 4 Malaysia 4,5365 Singapore 2,854 5 Singapore 2,904 5 Singapore 3,269
Source:IMF (2004)
Total imports in 2003 were 75 billion dollars, marking an annual growth of 16.8 percent.
Thailand’s top two import partners – Japan and the United States – have not changed since
1990 (Table 3-4-2). However, their shares have been slightly declining every year. The total
volume of imports in 2003 was just about at the pre-crisis level. What is notable concerning the
trend of both exports and imports is the steadily increasing share of China.
After Singapore Thailand has established the largest number of FTAs of any ASEAN country.
The FTA with Australia has been in force since January 2005, and the one with New Zealand is
scheduled to go into effect in July 2005. In addition, FTA negotiations are ongoing with Bahrain,
India, Japan, Peru, and the US as of January 2005.
FDI flows into Thailand saw a sharp decline in 2002. This was due to the sluggish economies in
3-4-2 Features of Latin American Countries’ Trade and Investment in Thailand
(1) FDI
The central focus of Section 3-4-2 is the relationship through trade and
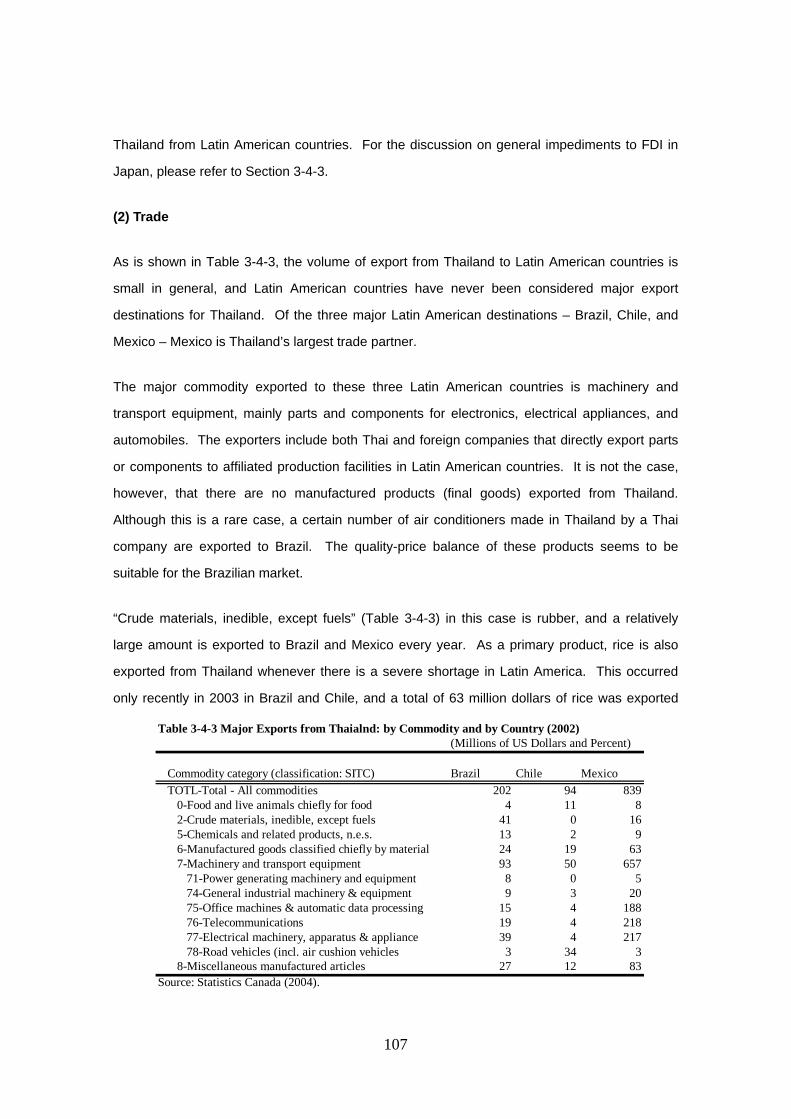
Thailand from Latin American countries. For the discussion on general impediments to FDI in
Japan, please refer to Section 3-4-3.
(2) Trade
As is shown in Table 3-4-3, the volume of export from Thailand to Latin American countries is
small in general, and Latin American countries have never been considered major export
destinations for Thailand. Of the three major Latin American destinations – Brazil, Chile, and
exico – Mexico is Thailand’s largest trade partner.
inery and
transport equipment, mainly parts and components for electronics, electrical appliances, and
iles. The exporters include both Thai and foreign companies that directly export parts
price balance of these products seems to be
suitable for the Brazilian market.
“Crude materials, inedible, except fuels” (Table 3-4-3) in this case is rubber, and a relatively
modity and by Country (2002)(Millions of US Dollars and Percent)
M
The major commodity exported to these three Latin American countries is mach
automob
or components to affiliated production facilities in Latin American countries. It is not the case,
however, that there are no manufactured products (final goods) exported from Thailand.
Although this is a rare case, a certain number of air conditioners made in Thailand by a Thai
company are exported to Brazil. The quality-
large amount is exported to Brazil and Mexico every year. As a primary product, rice is also
exported from Thailand whenever there is a severe shortage in Latin America. This occurred
only recently in 2003 in Brazil and Chile, and a total of 63 million dollars of rice was exported
Table 3-4-3 Major Exports from Thaialnd: by Com
Commodity category (classification: SITC) Brazil Chile Mexico TOTL-Total - All commodities 202 94 839 0-Food and live animals chiefly for food 4 11 8 2-Crude materials, inedible, except fuels 41 0 16 5-Chemicals and related products, n.e.s. 13 2 9 6-Manufactured goods classified chiefly by material 24 19 63 7-Machinery and transport equipment 93 50 657 71-Power generating machinery and equipment 8 0 5
75-Office machines & automatic data processing 15 4 188 76-Telecommunications 19 4 218 77-Electrical machinery, apparatus & appliance 39 4 217 78-Road vehicles (incl. air 8-Miscellaneous manufacture
74-General industrial machinery & equipment 9 3 20
cushion vehicles 3 34 3d articles 27 12 83
Source: Statistics Canada (2004).
107

from Thailand.
Next, as is described in Table 3-4-4, the volume of import from Latin America to Thailand is also
small in general, and Latin American countries have never become major exporters toward
TOTL-To
Thailand. Of the three exporters in this table, Brazil is Thailand’s largest partner. The major
nimal
imports
a small am
Thailan ile’s
major exp er, is
and Impediments Regarding Latin American Countries’ Trade and
Investment in Thailand
(1) General Problems: Before Entry
The specific factors that have been preventing the development of a strong business
relationship between the Thai and Latin American private sectors are the geographical distance
and the language problem. These two factors seem to create two problems for private
Table 3-4-4 Major Imports of Thailand by Commodity and by Country (2002)(Millions of US Dollars and Percent)
Commodity category (classification: SITC) Brazil Chile Mexicotal - All commodities 373 54 47
0-Food and live animals chiefly for food 97 15 0 2-Crude materials, inedible, except fuels 44 28 2
72-Machinery specialized for particular industr
factors that make Brazil the largest exporter to Thailand are iron and steel, soy waste as a
feed, and soybeans. All of them are major export goods for Brazil. In addition, Thailand
ount of agricultural machinery from Brazil.
d’s major imports from Chile – salmon, pulp, and copper-related items – are Ch
ort commodities. The total amount of trade between Thailand and Chile, howev
relatively small.
5-Chemicals and related products, n.e.s. 10 1 6 6-Manufactured goods classified chiefly by material 160 6 1 7-Machinery and transport equipment 58 0 36
y 7 0 0 74-General industrial machinery & equipment 2 0 3 75-Office machines & automatic data processing 0 0 21 77-Electrical machinery, apparatus & appliance 3 0 8 78-Road vehicles (incl. air cushion vehicles 6 0 4 79-Other transport equipment 38 0 0Source: Statistics Canada (2004).
3-4-3 Issues
108

comp er is
in
gene sions;
oppo
(2) Ge
The previo vate
rms in these regions to enter Thai markets. Table 3-4-5 describes examples of the principal
reported by companies already engaged in trade or investment in Thailand. Note
that these are difficulties reported by Japanese firms and compiled by the JMC37 in 2003.
l information in connection with doing business in Thailand.
ere are a number of impediments for foreign firms. The
problems are related either to the unfavorable taxation system, high tariffs, infrastructure, and
ed through careful
planning by private firms and applying for the promotion policies implemented by the Thai
overnment, as described in the next section (Section 3-4-4). The JMC website provides
further details on various issues in Thailand38.
anies. One is the cost of overcoming the distance and language barriers, and the oth
the lack of knowledge about the other party, including business opportunities and culture
ral. The former impediment has been discussed more often on various occa
however, the latter problem also seems to be serious, given the possibility that business
rtunities could be overlooked simply because of a lack of information.
neral Problems: After Entry
us section focused on the problems that make it difficult for Latin American pri
fi
difficulties
Although these are not problems faced only by Latin American companies, it could still be useful
to examine them as genera
As can be observed in Table 3-4-5, th
various restrictions on foreign labor and capital. With respect to trade, high tariffs and arbitrary
application of tariffs seem to be the central impediments for foreign exporters, and the strict
regulations applied to foreign capital and labor are still large impediments for foreign firms
pursuing FDI. Insufficient infrastructure, especially in terms of ports, roads, and industrial waste
facilities, seems to be a common problem for trade and FDI.
Although there are a number of impediments, it should be noted that some of them (for example,
taxation or restrictions on foreign labor and capital) could partly be avoid
g
37 JMC: Japan Machinery Center for Trade and Investment. 38 http://www.jmcti.org/cgibin/main.cgi?Kind=Country
109

(3) FTA-related Issues
The overall impression is that neither Thailand nor Latin American countries are very keen on
impacts due to the linkage with NAFTA. In
signing an FTA, at least in the near future. In 2003, Thailand successfully signed a Framework
Agreement with Peru, and FTA negotiations are currently in progress. The Thai government
le
ss
particular, private companies in the electronics,
electric appliances, and automobile industries that procure parts and components from Thailand
nd operate production lines in Latin America would possibly benefit from the FTA.
3 High tariffs4 Assessment and application of tariffs are sometimes arbitrary.
6
Difficulty of tax returns for corporate tax, value-added tax, and tariffs
Table 3-4-5 Trade and FDI-related problems and requests raised by Japanese firms in ThailandImpediments
1
2 Complications and delays in port entry procedures
A wide range of restrictions on the entry of foreign capital still exist in both the manufacturing and servicesectors, despite the government's implementation of deregulation policies
5 Abuse of anti-dumping measures on steel productsStrict regulation of foreign exchange
7 Taxation at the source for international money transfers89
10 Inadequate protection of property rights11 Restrictions on land possession12 Insufficient industrial waste facilities despite strict regulations13 Inadequate port and road infrastructure
Difficulty in obtaining permission related to labor, including regulations on the foreign-domesticemployment ratio, and working permission for foreign employees (especially in the construction sector);
Source: Kakkoku chiiki no boueki toushi-jo no mondaiten to youbou (Issues and requests relating to foreign tradeand investment), Nihon Kikai Yushutsu Kumiai, 2003
has great expectations for the positive impacts of the Thai-Peru FTA, in that it could facilitate
access to Latin American markets.
Other than the case of Peru, Thailand does not seem to be very intent on pursuing possib
FTAs with Latin American countries. Practically speaking, it would also be difficult to enter
negotiations with Latin American countries in the near future because Latin American countries
are currently preoccupied with negotiations with the US and the EU and are thus giving le
priority to Asian countries.
However, it can be claimed that an FTA with Mexico, for instance, would contribute to the Thai
economy in that Mexico is the largest trade partner of the three, and that there would be positive
a
110

3-4-4 Promotion of Trade and FDI in Thailand
(1) Trade
Export Promotion
The Thai government, especially the Department of Export Promotion within the Ministry of
Commerce, is making a great effort to accommodate requests from the private sectors of both
ssions, including trade missions to Latin American countries, usually
and rubber
have been central foci so far.
One of the agents from the DEP claims that further systematic effort in promotion from both
relationship between these two regions. The
main argument is that the government agents do feel the significant potential of some tradable
wever, there is currently little or no effective effort to promote specific products with
countries. This seems to be what the governments from these two
regions need to overcome.
regions. There are mainly two kinds of promotion activities: organizing trade missions and
conducting market research on behalf of Thai companies.
The Department of Export Promotion (DEP) has three offices in Latin America39 that are in
charge of trade promotion for Thai products in Latin American markets. The ministry also
organizes various trade mi
involving jewelry, gifts, and decorative items, for groups of Thai exporters to visit Brazilian
importers. The latter is ad hoc and less frequent than other trade missions. Another central
activity of the DEP is to attend international trade fairs both in Brazil and Thailand to learn about
the products and enterprises of both countries. The DEP also conducts market studies for
particular products of interest. Auto parts, jewelry, gift and decorative items, rice,
sides is necessary to develop a stronger business
products; ho
large potential in specific
Customs Procedures: EDI
One of the major efforts to facilitate customs clearance taken by the Customs Department of
Thailand is Electronic Data Interchange (EDI). The department computerized customs clearing
procedures in order for traders to save time and cost by submitting, via an online system, entry
39 The Department of Export Promotion (DEP) offices in Latin America are in Santiago (Chile), Sao Paulo (Brazil), and Mexico City (Mexico).
111

data for preliminary verification by customs officers. Exporters only need to meet customs
officers for final document verification.
(2) FDI
Export Processing Zones
Thailand has several Export Processing Zones (EPZs). These free trade zones were
established in 1997 to boost key export-oriented industries such as electronics and automobiles
DI in Thailand by Latin American Countries
hese two regions.
thanol
and parts. Private companies located in the EPZs are exempt from import duties and other
taxes. Within EPZs, foreign firms are permitted to own land and employ foreign technicians and
experts. Other merits of operating in EPZs are their full-fledged infrastructure and good access
to transportation.
3-4-5 Future Prospects in F
Finally, the following are two specific examples of possible future investment by Brazil,
presented by the Embassy of Brazil in Thailand and a Japanese trading company in Brazil. In
particular, the ethanol case implies that the agricultural and industrial network between Asia and
Latin America could be further expanded and deepened and might serve as a catalyst for a
stronger business relationship between t
E
zilian government is now making an effort to market ethanol as a substitute for gasoline
in some highly industrialized Asian countries such as Japan and Korea. At the same time,
rest in an expansion of the Thai sugarcane industry as a potential
ethanol producer in Asia, and Brazil would be willing to offer contributions to the further
The Bra
Brazil is showing a great inte
development of the sugarcane industry in Thailand through technology transfer. The following
briefly describes the current situation and the future potential of the sugarcane/ethanol industry
through the incentives available for each player: Brazil, Japan, and Thailand.
112
First of all, the incentive for Brazil is obvious: it is profitable for Brazil, the world’s largest ethanol
producer, to seek potential markets for ethanol. Brazil is the world’s largest sugarcane producer,
and the sugarcane is utilized mainly for producing sugar and ethanol. In Brazil, ethanol is used
as fuel alcohol for automobiles in addition to gasoline. In the 1970s, Brazil’s automotive
industry started to use fuel alcohol as a means of combating the oil crisis, after which the use of
el alcohol gradually declined. However, recently it has been increasing again since flex fuel
fuel
cars, run on gasoline, ethanol, or a mix of both.
ses emitted from ethanol are
considered to be offset by the cultivation of sugarcane. This is the reason for the effort by the
government to market fuel alcohol in Japan.
ese products, and
as a result, the supply of ethanol varies from year to year.
fu
cars were marketed by Volkswagen and General Motors in 2003. Flex fuel cars, or dual
The major purpose for which Japan might be interested in introducing ethanol as a substitute for
gasoline is to meet the CO2 emission target designated in the Kyoto Protocol40. Sugarcane, the
raw material for ethanol, absorbs as much or more carbon dioxide as that emitted by ethanol
combustion and, under the Kyoto Protocol, greenhouse ga
Brazilian
However, there are two key factors that make it difficult to introduce ethanol as a substitute for
gasoline in Japan. First of all, it is at least temporarily very costly to introduce flex-fuel or
ethanol-fueled cars41 . Secondly, some visible or invisible opposition by the Japanese oil
industry is expected. For these reasons, the Japanese government has so far been relatively
negative toward the introduction of fuel ethanol. As well as the above difficulties, the Japanese
government claims that the supply of ethanol would not be stable because sugarcane producers
determine the supplies of sugar and ethanol based on the market prices of th
This concern regarding the stable supply of ethanol is related to Brazil’s strong interest in
contributing to the expansion of the Thai sugarcane industry as a complementary producer to
Brazil. Brazil claims that the potential demand for ethanol by Japan and/or Korea would further
vitalize the sugarcane industry in Thailand, and also that demand in highly industrialized
countries in Asia would after all increase ethanol export from Brazil.
40 The protocol obliges Japan to reduce its emissions of greenhouse gases by at least 6% from 1990 levels between 2008 and 2012. 41 Currently, gasoline containing 3% bio-ethanol, “E3”, can be used legally in Japan, as the law stipulates that fuel can contain other substances as long as they do not make up more than 3% of the volume.
113

44.. IISSSSSSUUUEEESSS AAANNNDDD IIMMMPPPEEEDDDIIIMMMEEENNNTTTSSS BBBYYY CCOOOUUUNNNTTTRRRYYY::LLAAATTTIIINNN AAAMMMEEERRRIIICCCAAA 4. I I C :L
114
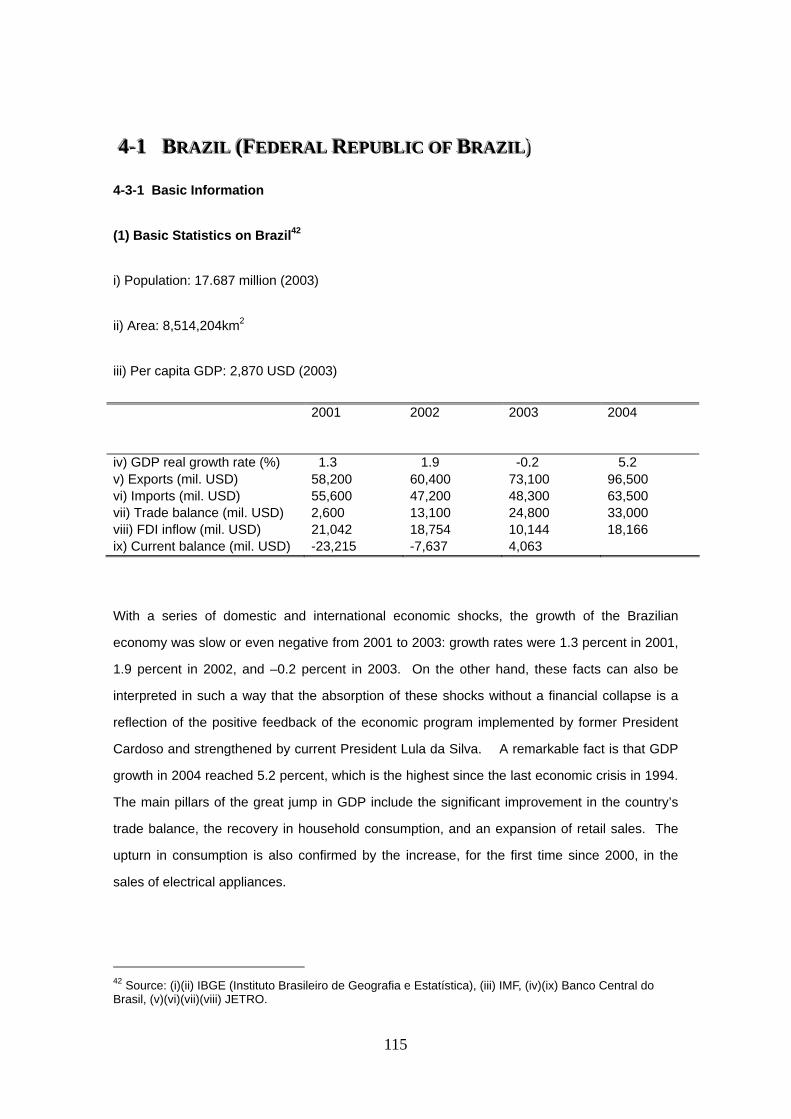
444--111 RAZIL FFFEDERAL EPUBLIIICCC OF RAZILLL))- BBBRRAAZZIILL ((( EEDDEERRAALL RRREEPPUUBBLL OOFF BBBRRAAZZII )
4-3-1 Basic Information
(1) Basic Statistics on Brazil42
i) Population: 17.687 million (2003)
ii) Area: 8,514,204km2
iii) Per capita GDP: 2,870 USD (2003)
2001 2002 2003 2004
iv) GDP real growth rate (%) 1.3 1.9 -0.2 5.2 v) Exports (mil. USD) 58,200 60,400 73,100 96,500 vi) Imports (mil. USD) 55,600 47,200 48,300 63,500 vii) Trade balance (mil. USD) 2,600 13,100 24,800 33,000 viii) FDI inflow (mil. USD) 21,042 18,754 10,144 18,166 ix) Current balance (mil. USD) -23,215 -7,637 4,063
With a series of domestic and international economic shocks, the growth of the Brazilian
economy was slow or even negative from 2001 to 2003: growth rates were 1.3 percent in 2001,
1.9 percent in 2002, and –0.2 percent in 2003. On the other hand, these facts can also be
interpreted in such a way that the absorption of these shocks without a financial collapse is a
reflection of the positive feedback of the economic program implemented by former President
Cardoso and strengthened by current President Lula da Silva. A remarkable fact is that GDP
growth in 2004 reached 5.2 percent, which is the highest since the last economic crisis in 1994.
The main pillars of the great jump in GDP include the significant improvement in the country’s
trade balance, the recovery in household consumption, and an expansion of retail sales. The
upturn in consumption is also confirmed by the increase, for the first time since 2000, in the
sales of electrical appliances.
42 Source: (i)(ii) IBGE (Instituto Brasileiro de Geografia e Estatística), (iii) IMF, (iv)(ix) Banco Central do Brasil, (v)(vi)(vii)(viii) JETRO.
115
The tra e surplus in 2004 was 33,000 million U.S. dollars, the largestd ever for Brazil. Total
exports were 96,500 million U.S. dollars, recording an annual growth rate of more than 30
behind this remarkable growth in exports include the recovery of the
st destination of Brazilian exports; the increase
in exports to China; and the boost in the prices of primary products, which comprise one-third of
in the prices of primary goods in addition to the increase
in export volume, export values of primary products increased by as much as 42 percent.
n increase in exports of primary products were soybeans,
iron ore, semi-finished steel products, oil, and pulp. In 2004, Brazil significantly increased its
imports as well: total imports were 63,500 million US dollars, marking an approximate annual
rowth rate of 30 percent. The share of imports from China e ed by more than one
percent in 2004.
ct of the B conomy was th ry of FD into
wer 66 million llars, w quivalent to a 79.1
s is was m e to the in inves the
ansport equipment industry (particularly automobiles) in addition to export industries such as
iron and steel, pulp, and agriculture. Further FDI, particularly FDI to develop infrastructure, will
43
untries’ Trade and Investment in Brazil
percent. The major factors
Argentinean economy, which is the second large
total Brazilian exports. Due to the rise
Commodities contributing to such a
g xpand
Another positive aspe razilian e in 2004 e recove I flows
Brazil. FDI inflows in 2004 e 18,1 U.S. do hich is e
percent growth from the previou year. Th ainly du increase tment in
tr
be indispensable for stable economic growth in Brazil.
There are three more noteworthy positive developments in the economy in 2004. First, the
surplus in the primary balance in the public sector (fiscal balance of the government, excluding
interest payments) improved; the GDP ratio was 4.61 percent, which is even higher than the
figure of 4.25 percent recommended by the IMF. Second, the current account balance
continued to be positive. Finally, the country risk indicator successfully fell to 403 points in
February 2005 from, for instance, 2,443 points in September 2002.
(2) Features of East Asian Co
43 The country risk here is based on the EMBI indicator provided by JP Morgan.
116
Trade
East Asian countries, particularly Japan and China, are important trading partners for Brazil: in
2003, East Asian countries accounted for a 16 percent share of total Brazilian exports. As Table
2-1-8 suggests, Japan was one of the five largest trading partners in both exports and imports in
the 1990s. Japan has a diminished presence in Brazilian trade these days, but it still remains
one of the ten largest trading partners in both exports and imports (Table 4-1-1). On the other
hand, China has rapidly become one of the major partners for both Brazilian exports and
imports during the last few years, though it did not appear in the list of the five largest trading
partners in the 1990s.
The major commodities that Brazil exports to East Asian countries, including China and Japan,
are primary products and semi-manufactured products (Table 4-1-2 and Table 4-1-3). Among
44
d components from East Asia have been
on the rise, driven by the expansion of machinery production by Japanese and multinational
Brazilian exports to China, exports of soybeans and iron ore in particular have drastically
increased, reflecting the large domestic demand for its economic growth; China is the largest
importer of soybeans and iron ore from Brazil. In 2004, Chinese imports of soybeans and iron
ore exceeded half of the total Chinese imports from Brazil. In contrast, the major commodities
Brazil imports from East Asian countries include various types of machinery parts and
components and cokes. Imports of machinery parts an
enterprises (MNEs) in Brazil, particularly in the automobile industry. Cokes are imported for
production activities in the iron and steel industry. The Korean presence is not as notable as
the Chinese or Japanese, but Korea has been relatively important to Brazil for imports.
44 To secure natural resources, a Chinese company in the iron and steel industry, for instance, made a long-term contract in 2003 to purchase iron ore from 2006 to 2016 with one of the largest Brazilian companies in the mining industry.
117
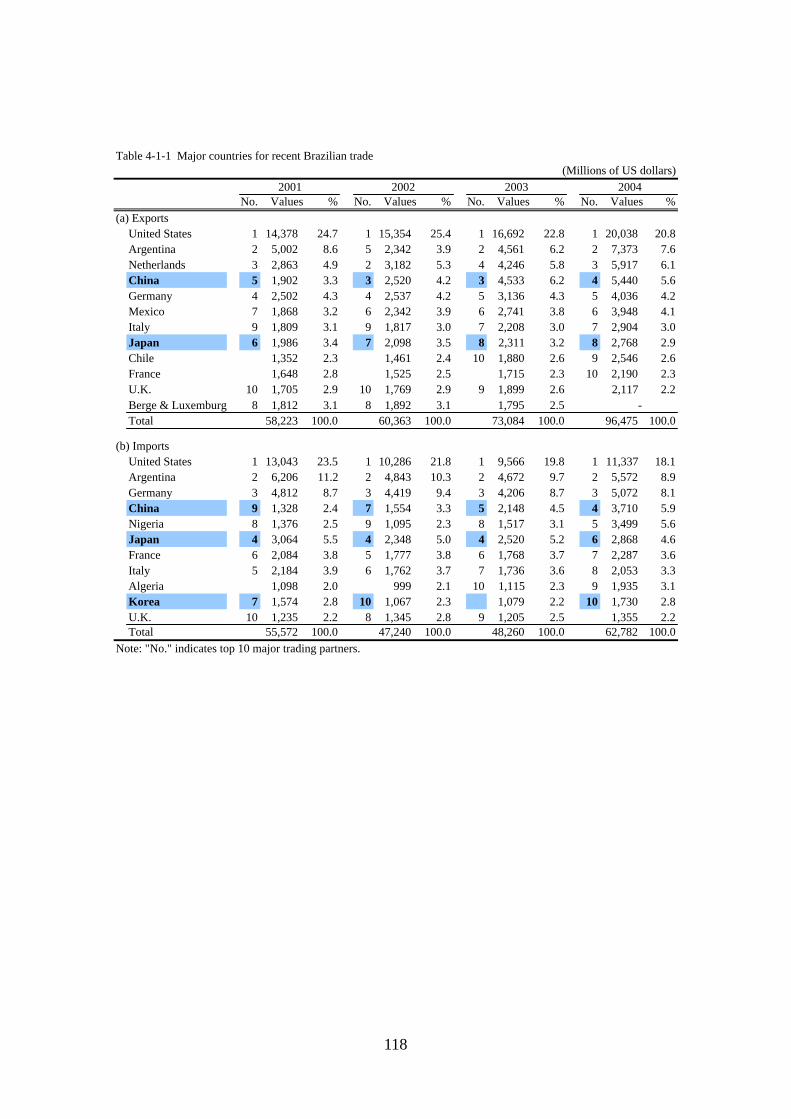
Table 4-1-1 Major countries for recent Brazilian trade(Millions of US dollars)
1,648 2.8 1,525 2.5 1,715 2.3 10 2,190 2.3U.K. 10 1,705 2.9 10 1,769 2.9 9 1,899 2.6 2,117 2.2Berge & Luxemburg 8 1,812 3.1 8 1,892 3.1 1,795 2.5 -
United States 1 13,043 23.5 1 10,286 21.8 1 9,566 19.8 1 11,337 18.1
Note: "No." indicates top 10 major trading partners.
2001 2002 2003 2004No. Values % No. Values % No. Values % No. Values %
(a) ExportsUnited States 1 14,378 24.7 1 15,354 25.4 1 16,692 22.8 1 20,038 20.8Argentina 2 5,002 8.6 5 2,342 3.9 2 4,561 6.2 2 7,373 7.6Netherlands 3 2,863 4.9 2 3,182 5.3 4 4,246 5.8 3 5,917 6.1China 5 1,902 3.3 3 2,520 4.2 3 4,533 6.2 4 5,440 5.6Germany 4 2,502 4.3 4 2,537 4.2 5 3,136 4.3 5 4,036 4.2Mexico 7 1,868 3.2 6 2,342 3.9 6 2,741 3.8 6 3,948 4.1Italy 9 1,809 3.1 9 1,817 3.0 7 2,208 3.0 7 2,904 3.0Japan 6 1,986 3.4 7 2,098 3.5 8 2,311 3.2 8 2,768 2.9Chile 1,352 2.3 1,461 2.4 10 1,880 2.6 9 2,546 2.6France
Total 58,223 100.0 60,363 100.0 73,084 100.0 96,475 100.0
(b) Imports
Argentina 2 6,206 11.2 2 4,843 10.3 2 4,672 9.7 2 5,572 8.9Germany 3 4,812 8.7 3 4,419 9.4 3 4,206 8.7 3 5,072 8.1China 9 1,328 2.4 7 1,554 3.3 5 2,148 4.5 4 3,710 5.9Nigeria 8 1,376 2.5 9 1,095 2.3 8 1,517 3.1 5 3,499 5.6Japan 4 3,064 5.5 4 2,348 5.0 4 2,520 5.2 6 2,868 4.6France 6 2,084 3.8 5 1,777 3.8 6 1,768 3.7 7 2,287 3.6Italy 5 2,184 3.9 6 1,762 3.7 7 1,736 3.6 8 2,053 3.3Algeria 1,098 2.0 999 2.1 10 1,115 2.3 9 1,935 3.1Korea 7 1,574 2.8 10 1,067 2.3 1,079 2.2 10 1,730 2.8U.K. 10 1,235 2.2 8 1,345 2.8 9 1,205 2.5 1,355 2.2Total 55,572 100.0 47,240 100.0 48,260 100.0 62,782 100.0
118
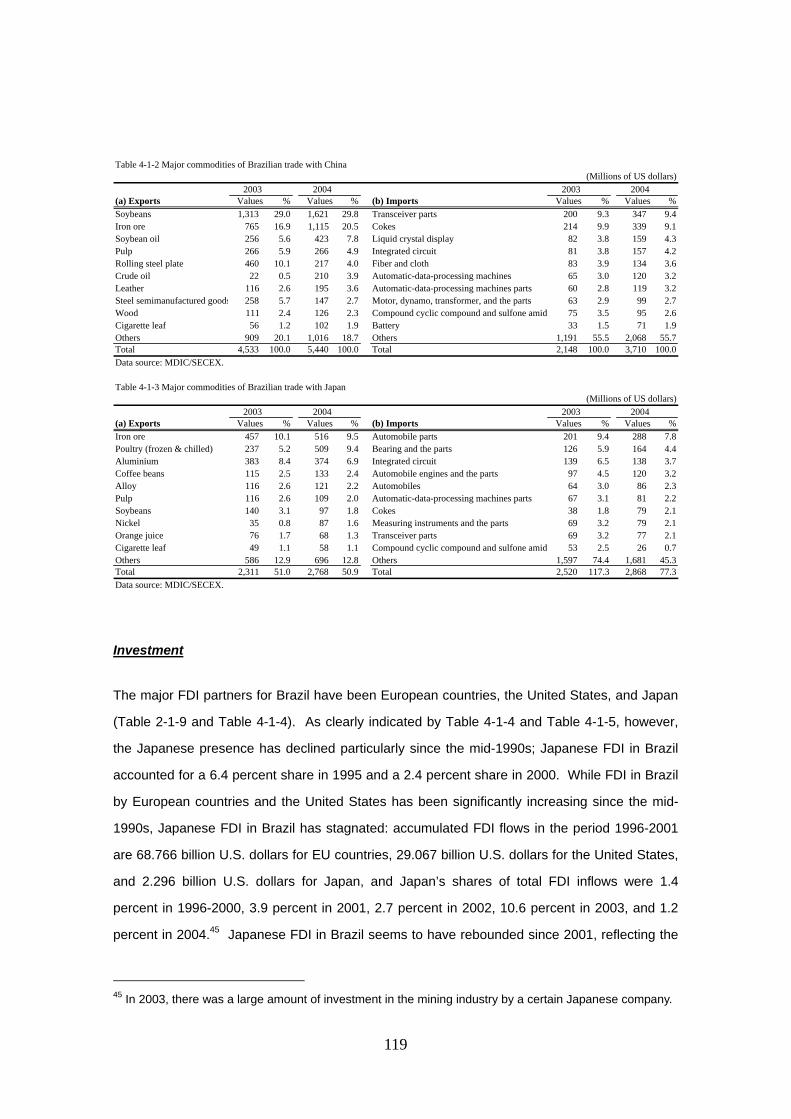
Investment
The major FDI partners for Brazil have been European countries, the United States, and Japan
able 2-1-9 and Table 4-1-4). As clearly indicated by Table 4-1-4 and Table 4-1-5, however,
the Japanese presence has declined particularly since the mid-1990s; Japanese FDI in Brazil
accounted for a 6.4 percent share in 1995 and a 2.4 percent share in 2000. While FDI in Brazil
y European countries and the United States has been significantly increasing since the mid-
1990s, Japanese FDI in Brazil has stagnated: accumulated FDI flows in the period 1996-2001
re 68.766 billion U.S. dollars for EU countries, 29.067 billion U.S. dollars for the United States,
and 2.296 billion U.S. dollars for Japan, and Japan’s shares of total FDI inflows were 1.4
percent in 1996-2000, 3.9 percent in 2001, 2.7 percent in 2002, 10.6 percent in 2003, and 1.2
percent in 2004.45 Japanese FDI in Brazil seems to have rebounded since 2001, reflecting the
(T
b
a
45 In 2003, there was a large amount of investment in the mining industry by a certain Japanese company.
Table 4-1-2 Major commodities of Brazilian trade with China(Millions of US dollars)
2003 2004 2003 2004(a) Exports Values % Values % (b) Imports Values % Values %Soybeans 1,313 29.0 1,621 29.8 Transceiver parts 200 9.3 347 9.4Iron ore 765 16.9 1,115 20.5 Cokes 214 9.9 339 9.1Soybean oil 256 5.6 423 7.8 Liquid crystal display 82 3.8 159 4.3Pulp 266 5.9 266 4.9 Integrated circuit 81 3.8 157 4.2Rolling steel plate 460 10.1 217 4.0 Fiber and cloth 83 3.9 134 3.6Crude oil 22 0.5 210 3.9 Automatic-data-processing machines 65 3.0 120 3.2Leather 116 2.6 195 3.6 Automatic-data-processing machines parts 60 2.8 119 3.2Steel semimanufactured goods 258 5.7 147 2.7 Motor, dynamo, transformer, and the parts 63 2.9 99 2.7Wood 111 2.4 126 2.3 Compound cyclic compound and sulfone amid 75 3.5 95 2.6Cigarette leaf 56 1.2 102 1.9 Battery 33 1.5 71 1.9Others 909 20.1 1,016 18.7 Others 1,191 55.5 2,068 55.7Total 4,533 100.0 5,440 100.0 Total 2,148 100.0 3,710 100.0Data source: MDIC/SECEX.
Table 4-1-3 Major commodities of Brazilian trade with Japan(Millions of US dollars)
2003 2004 2003 2004(a) Exports Values % Values % (b) Imports Values % Values %Iron ore 457 10.1 516 9.5 Automobile parts 201 9.4 288 7.8Poultry (frozen & chilled) 237 5.2 509 9.4 Bearing and the parts 126 5.9 164 4.4Aluminium 383 8.4 374 6.9 Integrated circuit 139 6.5 138 3.7Coffee beans 115 2.5 133 2.4 Automobile engines and the parts 97 4.5 120 3.2Alloy 116 2.6 121 2.2 Automobiles 64 3.0 86 2.3Pulp 116 2.6 109 2.0 Automatic-data-processing machines parts 67 3.1 81 2.2Soybeans 140 3.1 97 1.8 Cokes 38 1.8 79 2.1Nickel 35 0.8 87 1.6 Measuring instruments and the parts 69 3.2 79 2.1Orange juice 76 1.7 68 1.3 Transceiver parts 69 3.2 77 2.1Cigarette leaf 49 1.1 58 1.1 Compound cyclic compound and sulfone amid 53 2.5 26 0.7Others 586 12.9 696 12.8 Others 1,597 74.4 1,681 45.3Total 2,311 51.0 2,768 50.9 Total 2,520 117.3 2,868 77.3Data source: MDIC/SECEX.
119
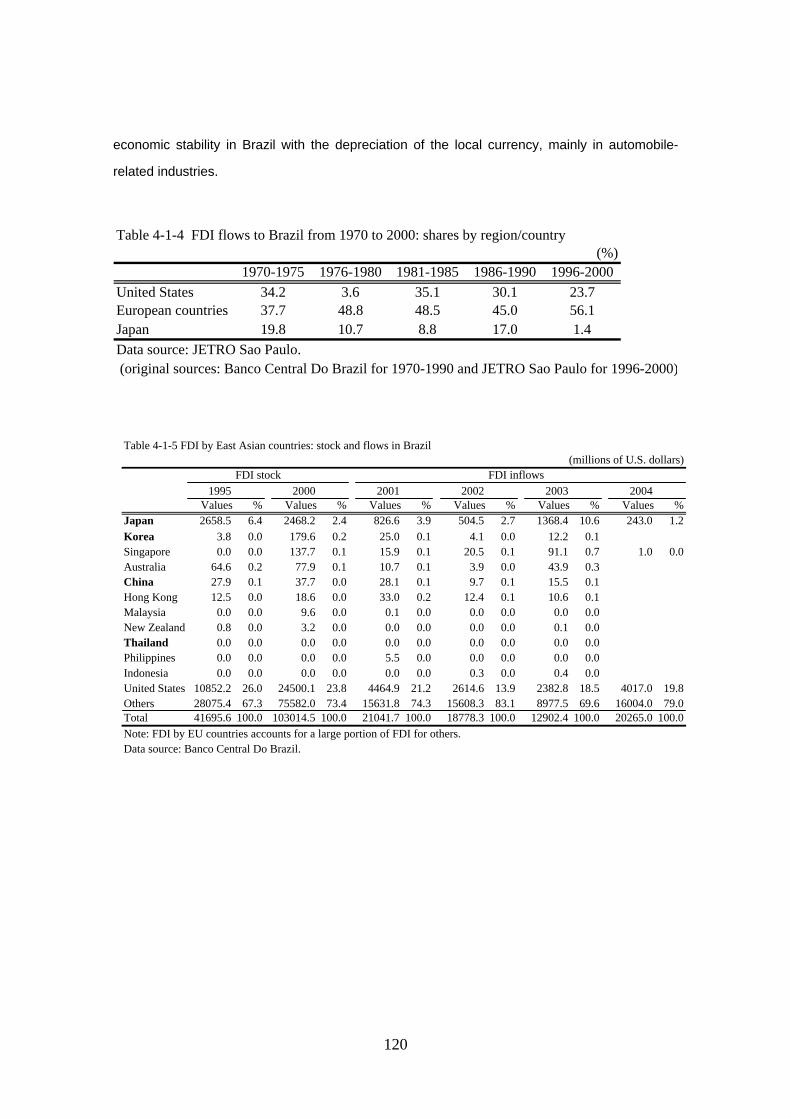
economic stability in Brazil with the depreciation of the local currency, mainly in automobile-
Table 4-1-4 FDI flows to Brazil from 1970 to 2000: shares by region/country(%)
1970-1975 1976-1980 1981-1985 1986-1990 1996-2000United States 34.2 3.6 35.1 30.1 23.7European countries 37.7 48.8 48.5 45.0 56.1Japan 19.8 10.7 8.8 17.0 1.4Data source: JETRO Sao Paulo. (original sources: Banco Central Do Brazil for 1970-1990 and JETRO Sao Paulo for 1996-2000
related industries.
)
Table 4-1-5 FDI by East Asian countries: stock and flows in Brazil(millions of U.S. dollars)
FDI stock FDI inflows1995 2000 2001 2002 2003 2004
Values % Values % Values % Values % Values % Values %Japan 2658.5 6.4 2468.2 2.4 826.6 3.9 504.5 2.7 1368.4 10.6 243.0 1.2Korea 3.8 0.0 179.6 0.2 25.0 0.1 4.1 0.0 12.2 0.1Singapore 0.0 0.0 137.7 0.1 15.9 0.1 20.5 0.1 91.1 0.7 1.0 0.0Australia 64.6 0.2 77.9 0.1 10.7 0.1 3.9 0.0 43.9 0.3China 27.9 0.1 37.7 0.0 28.1 0.1 9.7 0.1 15.5 0.1Hong Kong 12.5 0.0 18.6 0.0 33.0 0.2 12.4 0.1 10.6 0.1Malaysia 0.0 0.0 9.6 0.0 0.1 0.0 0.0 0.0 0.0 0.0New Zealand 0.8 0.0 3.2 0.0 0.0 0.0 0.0 0.0 0.1 0.0
0.0 0.0 0.0 0.0 0.0 0.0 0.0 0.0 0.0 0.00.0 0.0 0.0 0.0 5.5 0.0 0.0 0.0 0.0 0.0
Indonesia 0.0 0.0 0.0 0.0 0.0 0.0 0.3 0.0 0.4 0.0
ThailandPhilippines
United States 10852.2 26.0 24500.1 23.8 4464.9 21.2 2614.6 13.9 2382.8 18.5 4017.0 19.8Others 28075.4 67.3 75582.0 73.4 15631.8 74.3 15608.3 83.1 8977.5 69.6 16004.0 79.0Total 41695.6 100.0 103014.5 100.0 21041.7 100.0 18778.3 100.0 12902.4 100.0 20265.0 100.0Note: FDI by EU countries accounts for a large portion of FDI for others.Data source: Banco Central Do Brazil.
120

Table 4-1-6 Japanese and U.S. manufacturing affiliates in Latin America
(a) Japanese affiliates
121
in Latin America, 2000F/Y
SectorValue Share in
total (%)Value Share in
total (%)Value Share in
total (%)
(i) Sales (million JPY)Manufacturing total 1,774,501 46.8 251,753 19.7 1,522,748 60.7 85.8
Machinery total (290-320) 1,274,789 33.6 199,764 15.6 1,075,025 42.8 84.3290: general machinery 53,596 1.4 1,258 0.1 52,338 2.1 97.7300: electronic machinery 287,584 7.6 30,054 2.3 257,530 10.3 89.5310: transport equipment 920,179 24.3 168,452 13.2 751,727 30.0 81.7320: precision machinery 13,430 0.4 0 0.0 13,430 0.5 100.0
Total 3,789,197 100.0 1,279,716 100.0 2,509,481 100.0 66.2
(million JPY)Manufacturing total 581,965 39.8 151,956 24.2 430,009 51.5 73.9
Machinery total (290-320) 465,667 31.8 148,900 23.8 316,767 37.9 68.0290: general machinery 16,820 1.2 806 0.1 16,014 1.9 95.2300: electronic machinery 177,349 12.1 21,477 3.4 155,872 18.7 87.9310: transport equipment 265,962 18.2 126,617 20.2 139,345 16.7 52.4320: precision machinery 5,536 0.4 0 0.0 5,536 0.7 100.0
Total 1,462,568 100.0 626,870 100.0 835,698 100.0 57.1
(b) U.S. affiliates in Latin America, 1999F/Y
Value Share intotal (%)
Value Share intotal (%)
Value Share intotal (%)
(i) Sales (million US$)Manufacturing 130,977 53.3 35,156 31.7 95,821 71.2 73
Non-machinery sectors 73,155 29.8 29,152 26.3 44,003 32.7 60Machinery sectors 57,822 23.5 6,004 5.4 51,818 38.5 90
Machinery 7,342 3.0 285 0.3 7,057 5.2 96Computer and electronic products 14,382 5.9 1,456 1.3 12,926 9.6 90Electrical equipment, appliances, e
(ii) Purchases
t 2,747 1.1 234 0.2 2,513 1.9 91Transport equipments 33,351 13.6 4,029 3.6 29,322 21.8 88
Total 245,569 100.0 110,995 100.0 134,574 100.0 55
(million US$)Manufacturing 33,833 57.0 9,120 34.9 24,713 74.3 73
Non-machinery manufacturing 23,164 39.0 8,080 30.9 15,084 45.4 65Machinery sectors 10,669 18.0 1,040 4.0 9,629 29.0 90
Machinery 2,220 3.7 71 0.3 2,149 6.5 97Computer and electronic products 1,069 1.8 232 0.9 837 2.5 78Electrical equipment, appliances, e
(ii) Gross products
t 805 1.4 59 0.2 746 2.2 93Transport equipments 6,575 11.1 678 2.6 5,897 17.7 90
Total 59,361 100.0 26,120 100.0 33,241 100.0 56Data source: Kimura and Ando (2005a) for Japanese affiliates and Kimura and Ando (2005b) for U.S. affiliates.
Share ofBraziland
Mexico(%)
Total Total excl. Brazil andMexico Brazil and Mexico
Share ofBraziland
Mexico(%)
Total Total excl. Brazil andMexico Brazil and Mexico
Japanese FDI in Brazil can be observed in various industries such as transport equipment,
mining, iron and steel, electronic machinery, food processing, and services, but the major ones
are the transport equipment and mining (including iron and steel) industries. Brazil is one of the
most important countries for manufacturing FDI in Latin America; in the case of Japanese FDI
(or U.S. FDI) in machinery industries, for instance, approximately 80 to 90 percent of the
production activities of Japanese (U.S.) affiliates in Latin America are conducted by those in
Brazil and Mexico in 2000 (1999) (Table 4-1-6). The purposes of current FDI by Japanese firms
investing in Brazil are 1) to get access to natural resources and 2) to produce final goods mainly
for the domestic market and partially for exports to countries in Latin America and other
regions.46
The presence of other East Asian countries is much smaller than that of Japan, but investment
by East Asian countries such as Korea, China, and Taiwan in the electronic machinery industry
has been on an uptrend.
4-1-2 Issues in Major Industries Connected with FDI by East Asian Countries
(1) Features of East Asian Firms’ Operation in Brazil and Sectoral Issues
Transport Equipment Industry
The transport equipment industry is one of the most important industries for Japanese FDI in
Brazil. In particular, the last few years have witnessed large investments by major Japanese
automobile producers to expand their production capacity and/or to produce new models. In
accordance with the expansion of their operations in existing plants or newly established plants,
Japanese investment through their suppliers of parts and components has also been increasing.
In the past, some Japanese automobile producers came to Brazil to sell their products
46
a Japanese FDI in Brazil in the period from 1951 to 1963 witnessed investment mainly in the textile, iron nd steel, machinery, and shipbuilding industries, in response to Brazil’s industrial promotion policies and
import substitution policies. FDI in the period 1964-1979 was partially for “national projects” conducted by ian and Japanese governments such as "Usiminas" (iron and steel), " Cenibura (paper
anufacturing)", "Serrado development (agriculture development)" and partially for access to natural resources. In addition, as discussed below, some firms invested in Brazil for domestic sales, in light of trade measures such as high import tariffs and/or import prohibition.
the Brazilm
122
domestically, given the high import tariffs and/or import prohibitions. MFN (Most Favored
Nation) tariffs imposed on imports of automobile-related products are still high: import tariffs
(common tariffs for non-MERCOSUR member countries) are 35 percent for automobiles and
16-18 percent for their parts and components. Due to other taxes imposed on imports besides
import tariffs that will be explained in the next subsection, the prices of imported cars are very
high.
The current operations of Japanese automobile producers (and MNEs with other nationalities)
in Brazil are aimed at production not only for domestic sales but also for exports, with global
strategies to allocate production sites around the world in view of their target markets. Exports
to other Latin American countries, of course, account for a large portion of Brazilian automobile
een Brazil and Mexico” that went into force in September 2002.47
Argentina and other MERCOSUR member countries are also increasing their automobile
ports from Brazil under MERCOSUR. Importantly, exports to non-Latin American countries 48 a
stronger tendency to aggressively utilize their production sites in Brazil as a base for their global
ot been sufficiently developed, unlike in East Asian countries.
In other words, suppliers of parts and components are not located in close proximity to each
exports; Mexico, for instance, is now the largest importer of Brazilian automobiles, followed by
the United States, due to the increase in imports with the preferential treatment under the
“Automobile Treaty betw
im
are increasing simultaneously. U.S. and European automobile producers, in particular, have
supply (exports).49
In Brazil, industrial clusters have n
other. Thus, it is difficult to have parts and components ready on time. To overcome this
47 Under the automobile treaty between Brazil and Mexico, tariffs imposed on Mexican automobile imports from Brazil were 1.1 percent in 2003 for imports within the quota in 2003, i.e., 140 million automobiles, and zero percent in 2004 for imports within the quota in 2004, i.e., 165 million automobiles (an MFN tariff, 20 or 50 percent, is applied for imports beyond the quota). The no-tariff quota is supposed to be removed by
automobiles went up sufficiently for export in a rather unusual situation. By 1997, when inflation stopped and domestic purchasing power started to increase, most automobile producers in Brazil already had (still have) production capacity exceeding domestic demand. As the Brazilian economy got worse, however,
2007 to allow free trade in automobiles without restriction between the two countries. 48 One of the reasons why Brazil was able to increase automobile exports is that the quality of Brazilian
Brazilian purchasing power again decreased. Therefore, automobile producers, including local indigenous suppliers, had no choice but to improve the quality of their products in Brazil so that they could export them. As a result, Brazil was able to succeed in improving quality and increase their automobile exports. 49 If we look at the Big 4 makers (GM, VW, FIAT, FORD), for example, their destinations have rapidly changed over a short period: while the share of non-South American countries was 21 percent of total exports in 1997, the share became 74 percent in 2003. Note that Mexico is included in the countries not in South America.
123
problem, TOYOTA, for instance, has introduced an interesting system of logistics (please see
the end of this section).
Mining and Iron and Steel Industries
Mining, iron and steel, and petroleum are the major industries among Brazil’s natural resource-
related industries. Although most firms in these industries were state-owned firms, privatization
g the downstream flow in the domestic iron and steel industry. While
The current import tariffs on iron and steel products are about 12 to 14 percent, except some
high value-added products such as hot-rolled coil whose tariffs have been significantly reduced
has been pursued since the 1990s. Japan has long been involved in these industries since the
1950s in accordance with Brazil’s industry promotion policies and import substitution policies,
“national projects” by the Brazilian and Japanese governments, and others; some Brazilian
firms in the iron and steel industry, for instance, were established through technology transfers
by Japanese firms. Recent commitments in these industries by Japanese firms include
significant participation through stock purchases in the largest Brazilian company in the mining
industry, international bidding, and the operation of firms with long relationships and relatively
new firms in Brazil. Commitments by Korea and China are greater than ever. Large Korean
and Chinese companies in the iron and steel industry have expressed interest in expanding
their operations in Brazil by establishing new iron mills in the future.
Brazil seems to have adopted trade policies in the mining and iron and steel industries aimed at
protecting and developin
Brazil was imposing high tariffs on iron and steel products (and other manufacturing products), it
was implementing a price control system for iron ore until around 1994: the domestic price of
iron ore had been kept lower than the international price (export price) by about 30 percent.
very recently, and the tariffs on iron-manufacturing machine are about 14 to 16 percent.
One of the recent issues regarding the price of iron ore is the sudden rise of that price. In line
with expanding demand for iron and steel products, particularly by China, the prices of iron ore
and coking coal have been rapidly increasing: the f.o.b. price of iron ore (for export to Japan) in
2004 and 2005, for instance, rose by 18 percent and 72 percent, respectively. The major
destinations of iron ore and slabs are the United States and East Asia, with the shares of East
124

Asia, particularly of China, rapidly rising.50 Concerns about exports of iron ore and slabs include
the safeguard issue and, particularly for the U.S. market, the high transport cost for East Asia,
which derives from the physical distance with low value added.51
Electronic Machinery Industry
2002 for the choices in the
short run, and Brazil came in higher, at 7th place, in both FY 2001 and FY 2002 due to its
ected
Recent investment by East Asian countries other than Japan has been observed mainly in the
electronic machinery industry: cellular phones, PC-related products, air conditioning, and so on.
Firms have invested (and continue to invest) to expand their production sites located in the
Magnus Free Trade Zone or to establish new plants in the Magnus Free Trade Zone and others.
(2) General Problems in Operating in Brazil
According to the results of an annual survey of Japanese MNEs conducted by the Japan Bank
for International Cooperation (JBIC), Brazil is regarded as a key potential destination for
Japanese FDI: Brazil was in 13th place in FY 2001 and 10th in FY
market potential, not far behind major East Asian countries (Table 4-1-7 and Table 4-1-8).
Despite the relatively desirable evaluation toward investment in Brazil, actual investment by
Japanese firms has not accelerated as has investment by MNEs from Europe or the U.S. What
sorts of problems exist for private enterprises, particularly for East Asian MNEs, in starting
and/or operating businesses in Brazil? The lower part of Table 4-1-8 presents the concerns that
Japanese manufacturing firms have in investing their FDI funds in each prospective destination,
including Brazil. As suggested by Table 4-1-8, insufficient information on Brazil is one of the
reasons; 40 percent of firms that chose Brazil as a prospective destination for their FDI sel
“insufficient information on the host country” as one of the weak points of Brazil. In addition,
there exist various difficulties in starting and operating businesses in Brazil, referred to as the
“Brazil cost”. The concerns that many potential investors selected include “instability of local
currency (47 percent)”, “political and social environment (40 percent)”, “high import tariffs (33
though it is not high enough to satisfy the conditions of Japanese automobile makers such as Toyota and Honda. 51 The value added to these products is low vis-à-vis the transport cost: the transport cost between Japan and Latin America, for instance, is three times the cost between Japan and Australia.
50 The quality of slabs made in Brazil is high enough to supply them to the Big 3 automobile makers,
125

percent)”, “insufficient infrastructure (20 percent)”, “complicated taxation system (20 percent)”,
and “non-transparency in the implementation of taxation system (20 percent)”.
126

Table 4-1-7 Prospective destination countries for Japanese FDI
Country Number Country Number
of firms of firms
%2 United States 127 32% 2 Thailand 118 28%3 Thailand 99 25% 3 United States 108 26%4 Indonesia 56 14% 4 Indonesia 63 15%5 India 52 13% 5 Vietnam 62 15%6 Vietnam 48 12% 6 India 54 13%7 Taiwan 44 11% 7 Korea 34 8%8 Korea 33 8% 7 Taiwan 34 8%9 Malaysia 32 8% 9 Malaysia 33 8%10 Singapore 24 6% 10 Brazil 19 5%11 The Philippines 22 5% 11 Singapore 18 4%12 Germany 19 5% 12 The Philippines 17 4%13 Brazil 18 4% 13 Germany 16 4%13 Mexico 18 4% 14 Mexico 15 4%15 France 17 4% 15 Czech 13 3%16 Czech 15 4% 16 United Kingdom 11 3%17 United Kingdom 14 3% 16 Russia 11 3%18 Hungary 12 3% 18 Poland 10 2%19 Poland 11 3% 19 Hong Kong 9 2%20 Hong Kong 8 2% 19 Hungary 9 2%
(b) Long run (incoming 10 years)318 100% 344 100%
1 China 274 86% 1 China 306 89%2 India 88 28% 2 United States 92 27%3 United States 80 25% 3 India 89 26%4 Thailand 59 19% 4 Vietnam 70 20%5 Vietnam 46 14% 5 Thailand 56 16%6 Indonesia 43 14% 6 Indonesia 49 14%7 Brazil 25 8% 7 Brazil 28 8%8 Taiwan 22 7% 8 Russia 27 8%9 Malaysia 20 6% 9 Malaysia 20 6%10 Korea 17 5% 10 Korea 15 4%10 The Philippines 17 5% 10 Germany 15 4%12 Russia 14 4% 12 Taiwan 14 4%13 Singapore 12 4% 13 Singapore 11 3%14 United Kingdom 11 3% 13 The Philippines 11 3%15 Mexico 10 3% 15 Mexico 10 3%15 Germany 10 3% 15 Czech 10 3%17 Hungary 9 3% 17 Myanmar 7 2%18 Myanmar 7 2% 17 United Kingdom 7 2%18 France 7 2% 19 Italy 6 2%20 Australia 6 2% 19 Poland 6 2%
19 Hungary 6 2%Drawn from Kimura and Ando (2005b). (Original data sources: Kaburagi, et al. (2002) for the 2001 F/Y survey and Marugami, et al. (2003) for the 2002 F/Y surveNotes:
"Prospective destination country" means that the firm would consider FDI to the country in the short or long run. Multiple listings of destination countries are allowed.
2001 F/Y 2002 F/Y
This JBIC questionnaire survey was conducted for Japanese firms with three or more foreign affiliatesincluding at least one manufacturing foreign affiliate at the end of October 2000 (2000 F/Y survey)/ November2001 (2001 F/Y survey), in which 501/ 508 firms out of 792 / 812 returned effective answers.
(a) Short run (incoming 3 years)401 100% 418 100%
1 China 327 82% 1 China 373 89
127

Table 4-1-8 Prospective destination countries for Japanese manufacturing FDI: their strong and weak pointsRanking 1 2 3 4 5 6 7 7 9 1Country China Thailand U.S. Indonesia Vietnam India Korea Taiwan Malaysia Brazil(a) Strong points
Number of firm
0
s1) 373 112 108 61 54 50 32 32 30 19
Market potential 86.3 54.5 39.8 47.5 55.6 84.0 53.1 53.1 33.3 73.7
Inexpensive labor 68.9 48.2 0.9 73.8 70.4 60.0 12.5 15.6 40.0 26.3
To supply intermediate goods for assemblers 28.7 33.0 26.9 21.3 9.3 16.0 25.0 37.5 23.3 26.3
Present market size 17.2 9.8 62.0 9.8 1.9 14.0 28.1 43.8 10.0 10.5
To export to the third countries 25.2 32.1 2.8 36.1 24.1 16.0 6.3 21.9 30.0 5.3
Inexpensive parts and components / raw materials 30.0 9.8 2.8 16.4 11.1 16.0 12.5 9.4 10.0 15.8
To export to Japan 26.8 21.4 - 24.6 7.4 16.0 15.6 12.5 13.3 -
Human capital 11.0 8.0 16.7 - 33.3 6.0 25.0 25.0 10.0 -
R&D for the local market 9.9 6.3 27.8 4.9 5.6 30.0 6.3 9.4 3.3 15.8
Development of infrastructure 5.6 7.1 9.3 1.6 3.7 10.0 9.4 18.8 13.3 -
Investment incentives / deregulation measures 7.2 11.6 - 1.6 3.7 6.0 3.1 9.4 13.3 5.3
Investment by other firms in the same industry 9.1 7.1 4.6 4.9 3.7 - 3.1 9.4 10.0 -
Advancement of regional integration 1.3 5.4 - 6.6 - 4.0 - 13.3 10.5
(b) Weak pointsNumber of firms2) 356 89 73 60 43 43 28 31 28 15
Insufficient infrastructure 24.4 12.4 - 26.7 41.9 44.2 - - 14.3 20.0
Underdevelopment of legal system 46.3 4.5 - 8.3 46.5 32.6 - - 7.1 -
Nontransparency in the legal system 55.6 10.1 - 23.3 27.9 20.9 - 6.2 3.6 6.7
Frequent and sudden changes in institutionalarrangements 51.7 4.5 - 10.0 11.6 7.0 3.6 3.2 7.1 6.7
Complicated taxation system 17.7 5.6 6.8 10.0 11.6 9.3 3.6 - 3.6 20.0
Nontransparency in the implementation of taxationsystem 37.4 10.1 - 10.0 9.3 16.3 3.6 - - 20.0
Frequent and sudden changes in taxation system 36.5 3.4 - 3.3 11.6 2.3 3.6 3.2 - 13.3
High import tariffs 19.9 13.5 2.7 8.3 11.6 9.3 3.6 - - 33.3
Insufficient deregulation for foreign capital 27.5 11.2 - 5.0 20.9 11.6 14.3 - 25.0 13.3
Complicated administrative procedure 41.0 7.9 1.4 13.3 16.3 11.6 3.6 3.2 3.6 6.7
Political and social environment 27.8 11.2 2.7 81.7 32.6 55.8 3.6 12.9 28.6 40.0
Instability of local currency 8.7 46.1 9.6 58.3 27.9 20.9 17.9 16.1 17.9 46.7
Difficulty in purchasing raw materials and parts andcomponents in local market 20.5 20.2 5.5 18.3 25.6 18.6 10.7 6.5 7.1 6.7
Underdevelopment of indigenous supporting industries 10.1 7.9 - 15.0 20.9 9.3 - 3.2 10.7 6.7
Difficulty in local financing 15.4 10.1 8.2 13.3 11.6 14.0 14.3 3.2 7.1 -
Harsh competition with other firms in the local market 27.5 25.8 68.5 23.3 9.3 18.6 64.3 54.8 25.0 6.7
Insufficient human capital for managerial positions 25.8 30.3 24.7 30.0 16.3 16.3 17.9 16.1 25.0 6.7
Low level of local labor 12.9 9.0 9.6 11.7 2.3 11.6 3.6 6.5 3.6 13.3
Rising labor costs in host country 16.0 25.8 20.5 20.0 4.7 4.7 21.4 32.3 21.4 6.7
Local labor problems 11.8 7.9 16.4 25.0 7.0 14.0 25.0 - 7.1 13.3
Insufficient information on the host country 9.6 5.6 - 5.0 18.6 32.6 3.6 3.2 7.1 40.0
Drawn from Kimura and Ando (2005b). (Original data source: Marugami, et al. (2003).)Notes: 1) Number of Japanese manufacturing firms who answered the question on strong points among those who chose the country as a prospective destination for their FD 2) Number of Japanese manufacturing firms who answered the question on weak points among those who chose the country as a prospective destination for their FD
4) Multiple listings of destination countries are allowed.
3) This JBIC 2002 F/Y questionnaire survey was conducted for Japanese manufacturing firms with three or more foreign affiliates including at least onemanufacturing foreign affiliate at the end of November 2001, in which 508 firms out of 812 returned effective answers.
128
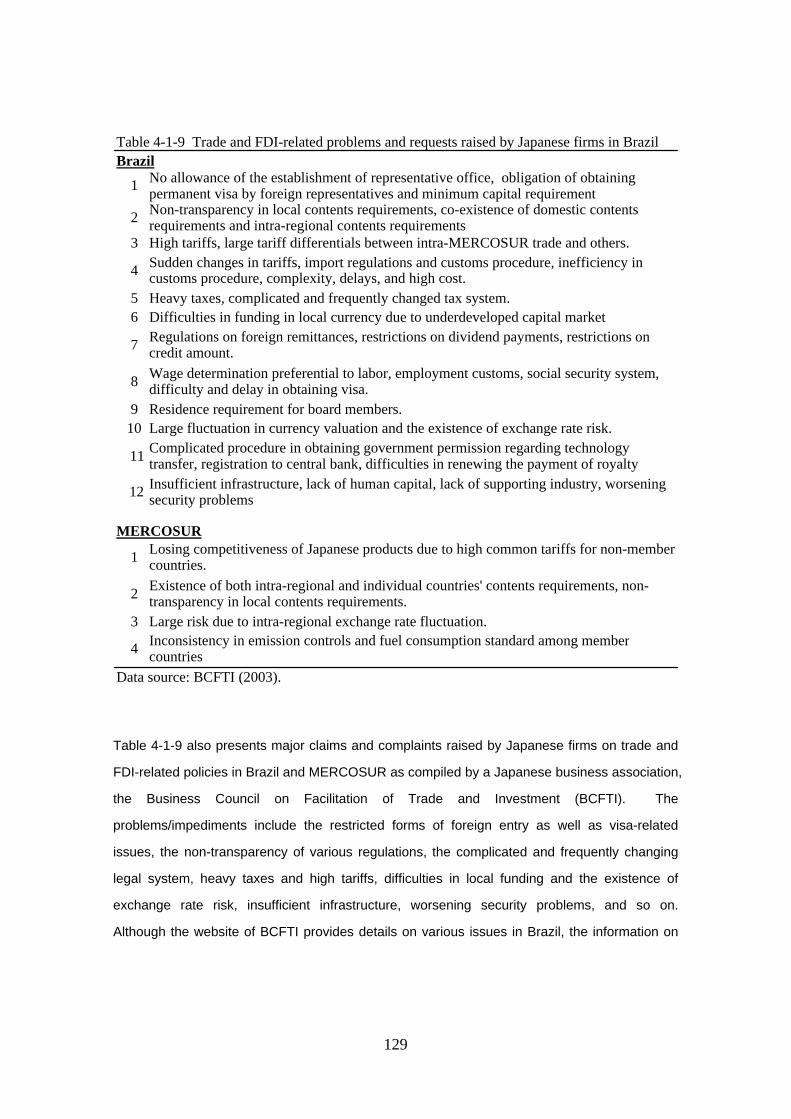
Table 4-1-9 also presents major claims and complaints raised by Japanese firms on trade and
FDI-related policies in Brazil and MERCOSUR as compiled by a Japanese business association,
the Business Council on Facilitation of Trade and Investment (BCFTI). The
problems/impediments include the restricted forms of foreign entry as well as visa-related
issues, the non-transparency of various regulations, the complicated and frequently changing
legal system, heavy taxes and high tariffs, difficulties in local funding and the existence of
exchange rate risk, insufficient infrastructure, worsening security problems, and so on.
Although the website of BCFTI provides details on various issues in Brazil, the information on
Brazil
1 No allowance of the establishment of representative office, obligation of obtainingpermanent visa by foreign representatives and minimum capital requirement
2 Non-transparency in local contents requirements, co-existence of domestic contentsrequirements and intra-regional contents requirements
3 High tariffs, large tariff differentials between intra-MERCOSUR trade and others.
4 Sudden changes in tariffs, import regulations and customs procedure, inefficiency incustoms procedure, complexity, delays, and high cost.
5 Heavy taxes, complicated and frequently changed tax system.6 Difficulties in funding in local currency due to underdeveloped capital market
7 Regulations on foreign remittances, restrictions on dividend payments, restrictions oncredit amount.
8 Wage determination preferential to labor, employment customs, social security system,difficulty and delay in obtaining visa.
9 Residence requirement for board members.10 Large fluctuation in currency valuation and the existence of exchange rate risk.
11 Complicated procedure in obtaining government permission regarding technologytransfer, registration to central bank, difficulties in renewing the payment of royalty
12 Insufficient infrastructure, lack of human capital, lack of supporting industry, worseningsecurity problems
MERCOSUR
1 Losing competitiveness of Japanese products due to high common tariffs for non-membercountries.
2 Existence of both intra-regional and individual countries' contents requirements, non-transparency in local contents requirements.
3 Large risk due to intra-regional exchange rate fluctuation.
4 Inconsistency in emission controls and fuel consumption standard among membercountries
Data source: BCFTI (2003).
Table 4-1-9 Trade and FDI-related problems and requests raised by Japanese firms in Brazil
129

Brazil is unfortunately available only in Japanese from the website.52 Thus, in the following, we
discuss the details of general issues based on the information collected during interviews in
Brazil as well as the results of the BCFTI survey.
Heavy Taxes Imposed on Imports53
In Brazil, various duties besides import tariffs (common duties for non-MERCOSUR member
countries) are imposed on imports: these include IPI (industrial products duty), ICMS (goods
and services distribution duty), PIS (social integration fund), and COFINS (social insurance loan
charge). IPI is imposed when industrial products are imported and also when industrial
products are shipped out from production sites.54 ICMS (State duty), a sort of value added tax,
is imposed by each State on distribution, transportation, and telecommunication services.55 PIS
and COFINS have been introduced since May 2004. In addition to these taxes, AFRMM
(merchant vessel duty), which is 25 percent of freight, is generally imposed in addition to other
port-related duties. In practice, these duties are cumulatively calculated. Therefore, when
some industrial product is imported with an import tariff rate of 14 percent, for example, total
duties are equivalent to approximately 67 percent of the c.i.f. price and 71 percent of the f.o.b.
price.56
There exist special legal schemes that reduce duties for specific products such as capital goods
that are not domestically produced, IT-related products, automobile parts and components, and
aircraft parts and components as well as a duty drawback system and a free trade zone with
import tariff exemptions in Manaus. These duties, however, no doubt significantly increase the
prices of imported goods in the domestic market, and some MNEs with imported parts and
components face difficulties in price competition.
Another serious consequence is that these heavy taxes have accelerated product pirating,
illegal imports, and smuggling in the Brazilian market.
52 Questions and requests relating to foreign trade and investment in other countries can be submitted in English at the BCFTI website (http://www.jmcti.org/mondai/top_e.html). 53 See “Features of East Asian firms’ operation in Mexico and sectoral issues” for sectoral information on tariffs. 54 IPI is exempted when Brazilian ships are used. This is a discriminatory measure toward foreign ships. 55 Examples of ICMS are as follows: 18 percent to 25 percent for inter-state transactions in Sao Paulo, Rio de Janeiro, and Minas Gerais, 12 percent for intra-state transactions inSao Paulo, Rio de Janeiro, and Minas Gerais, Rio Grande do Sul, Santa Catarina, and Parana, and seven percent for other states (BCFTI, 2003). 56 The information here is based on the JETRO file, available at http://www3.jetro.go.jp/jetro-file/country.do
130
Complicated Legal Regulations and Frequent Changes
There are various legal regulations in Brazil: there exist around 50 kinds of taxes, including a
range of commission taxes. In addition, they are too often changed – reportedly more than 10
ation in advance. Furthermore, the interpretation of legal
regulations and laws often depends on government officials. Uncertainties and inconsistencies
times a year – without enough notific
in the legal regulations and laws cause additional costs for firms operating in Brazil.
Simplification of and greater transparency in the legal system are important.
Tax incentives are different among States. Surprisingly, tax incentives are provided for firms
that own farms; there are some Japanese firms that do not belong to the agriculture industry but
own farms to utilize these tax incentives.
The co-existence of MERCOSUR local contents requirements and domestic contents
requirements in some industries is also problematic.
Restricted Form of Foreign Entry and Difficulties in Obtaining Brazilian Visas
The establishment of representative offices is prohibited. In addition, it is quite difficult for
foreign firms to get permission to establish branches. In other words, the form of foreign entry
h investment.
zilian visas. First, to have foreign
r
in practice is restricted to the establishment of affiliates. Moreover, there is a residence
requirement for board members: board members (head representatives) of foreign affiliates in
Brazil must be Brazilian or foreign representatives with permanent residence visas. Above all,
Brazilians must account for more than two-thirds of total workers (except board members) and
total wages. These restrictions related to foreign entry clearly prevent foreign firms, including
East Asian MNEs, from entering the Brazilian market throug
Obtaining a permanent visa basically obliges foreign representatives to work at their affiliates in
Brazil. There exist regulatory problems in obtaining Bra
representatives and to obtain permanent visas for them, there are minimum capital
requirements: more than 200 million Brazilian reals of capital (foreign investment) registered
ith thw e central bank is required to have one foreign representative and to obtain his/he
permanent residence visa, and an additional 200 million reals of capital is required per
additional foreign representative. Thus, to have two foreign representatives and to obtain their
131
permanent residence visas, for instance, more than 400 million reals of capital is required.
Second, it takes time to obtain a permanent residence visa: roughly speaking, it takes about a
and an expensive
consular fee (close to 100 USD for Japanese) are required to get short-time business visas.
ree months for Japanese. Thus, some foreigners are
year. Due to such a heavy capital requirement, small and medium-size enterprises (SMEs) face
difficulties in entering the Brazilian market to operate businesses.
There are also problems regarding temporary visas for engineers and other experts and short-
time business visas. Temporary visas are restricted to two years, and may only be renewed
once: the maximum stay for those with this visa is four years. About 10 days
The time required to obtain a visa is a particularly serious matter hen firms need to urgently
send engineers for technical support. In addition, the short-time business visa is a single-entry
type (not multiple-entry type), valid for th
forced to re-apply for each urgent visit, generating additional costs.
Labor-Related Issues
The Labor Act in Brazil was written in favor of labors. For instance, wage rates cannot be
their operations in 58
lowered. In addition, lawsuits are always decided in favor of laborers. Furthermore, under the
Labor Act, registration in labor unions by industry and occupation is obligatory for laborers.
Revisions of wage rates and working conditions are determined by each labor union. 57
Therefore, firms face complaints among laborers about the inconsistent revision of wage rates
and working conditions.
On the other hand, there is also good news for Japanese firms. Since there is a large
community of Japanese-Brazilians, Japanese firms can more easily employ Japanese-
Brazilians speaking both Japanese and Portuguese who can facilitate
Brazil.
Insufficient Infrastructure and Logistics
Infrastructure such as roads, ports, and power plants in Brazil is underdeveloped. As exports
increase, the problem of insufficient infrastructure is becoming more serious. Therefore, Private
Labor unions in the metal, machinery, and banking industries are relatively strong while those in the
trade and commerce industry are relatively weak. 57
58 See the column on Toyota for a discussion of workers’ education.
132

Public Partnership (PPP) projects to improve the development of infrastructure are on the rise at
present.
The Manaus free trade zone offers tax incentives. There are, ho
59
wever, difficulties in logistics.
For instance, lead-time is very long partially because parts and components come from Sao
Paulo, and the roads from Sao Paulo to Manaus are not sufficiently maintained.60 Other
problems related to infrastructure include the poor condition of telephone lines, sudden power
failures, stock management in a moist environment, and insufficient human capital. Even if
there are tax incentives, these conditions cause additional costs for firms or lower their
competitiveness. Given that tax incentives are being reduced, the enticements for locating in
the Magnus free trade zone are being lost.
Lack of Supporting Industries
Due to the lack of supporting industries, foreign firms need to import a certain portion of parts
and components. Since the prices of imported goods significantly rise with accumulated high
import tariffs, IPI, ICMS and so on, some of them face difficulties in price competition. It seems,
however, that the quality of goods produced by local indigenous firms has been improving
particularly in the last few years.61
Worsening Security
Security in large cities such as Sao Paulo and Rio de Janeiro, where the operations of East
Asian MNEs are concentrated, has been worsening.
Inefficient Custom Procedures
The morale and attitude of customs officers are extremely poor. Moreover, customs procedures
are inefficient and take a long time; for instance, invoices for parts and components must be
guese (English is not allowed).
prepared by item and must also be prepared in Portu
In the Magnus free trade zone, the destinations of products must be determined at the time of
59 Brazil is now developing a road from the grain belt in the Amazon to Peru. The distance between Brazil
lmost 4,000 km from Sao Paulo. of local indigenous firms.
and Asia would be shortened with this road. 60 Manaus is the center of the Amazon rainforest, a61 See the column on Toyota for a discussion on its technical support
133
custom clearance and cannot be changed later.
Local Fund Raising and Exchange Rate Risk
Local fund raising is very difficult in the country’s underdeveloped capital market. In addition,
interest rates are very high. For fund raising in foreign currencies, however, there exists
exchange rate risk since currency valuation largely fluctuates.
Regulations on Foreign Remittances
There exist regulations on foreign remittances. For instance, it is quite difficult for firms to
obtain permission for foreign remittances of royalties. In addition, foreign remittances for the
payments of claims other than purchases are basically prohibited. Due to such restrictions and
ng procedures, there are difficulties in the collection of
Japan-Brazil (MERCOSUR) FTA/EPA
complicated and time-consumi
receivables.
(3) FTA/EPA-Related Issues (Including Future Prospects)
Regarding FTAs/EPAs, Brazil (MERCOSUR) has given priority to North America (FTAA: Free
effects of FTAA and/or EU-
MERCOSURE FTA on the operation of Japanese firms in Brazil, 56 percent of the firms that
red that the conclusion of these agreements would
eaken the
competitiveness of Japanese manufacturing firms in Brazil vis-à-vis U.S. or European MNEs in
the reduction of capital goods purchased (imported) from Japan.62
Trade Area of the Americas) and Europe. According to a survey conducted by Camara de
Comercio e Industria Japonesa do Brazil regarding the
returned the questionnaire answe
disadvantage their operations (JETRO 2004). Since the major origins of their purchases were
local companies (59 percent of total purchases) and Japan (22 percent), purchases of high
value-added parts and components from Japan with high tariffs would definitely w
Brazil. The lack of an FTA between Japan and the high-tariff MERCOSUR might also result in
62 The tariffs on iron-manufacturing machinery, for instance, are around 14 to 16 percent.
134
The Korean and Chinese governments have made more aggressive attempts than the
Japanese government to conclude FTAs with Brazil (MERCOSUR). Korea already has a study
R. group for an FTA between Korea and MERCOSU
Possibility of Ethanol Business
Brazil is the largest producer of sugarcane alcohol: the production was 12.645 billion liters in
n, mixing ethanol with gasoline has been allowed, up to
a maximum of three percent, since August 2003. Considering the potential new demand for fuel
dards assigned to developed countries in the Kyoto Protocol.
2002/2003 (JETRO Sao Paulo). In Japa
alcohol in Japan, expectations are high of exports of fuel ethanol (biomass fuel) from Brazil to
Japan. A potential concern might be that Brazilian procedures would allocate more sugarcane
to produce sugars when the prices of sugars increase rather than producing alcohol. It is,
however, important for Japan to use biomass fuel so that Japan can satisfy the carbon-dioxide
emission stan
135
Column on Toyota’s Operations in Brazil
In Brazil, industrial clusters have not been effectively developed, and the suppliers of parts and
cated nearby. To overcome this situation, Toyota in Brazil
has introduced an efficient system (called Milk Run) to ensure “just-in-time” production by
ppliers and 26
pick-ups) out to a radius of 100km. With such an effective outsourcing system, Toyota’s
operations have been running smoothly.
Given that there are insufficient supporting industries that can supply parts and components of
satisfactory quality, Toyota has provided local suppliers with technical support by directly
sending engineers to their suppliers for half a year or so. Although some local suppliers
expressed confusion about such close involvement at the beginning, they noticed that the
technical support did help improve the quality of their products sold not only to Toyota but also
to other major car producers. Now other major car producers regard suppliers dealing with
Toyota as able to supply products with satisfactory quality.
The attitude of Brazilian workers is serious, though education of workers is necessary and
important to raise their awareness: a good example is that the safety index showing the
frequency of injuries has drastically improved within a short period as workers become more
educated. A comparison with other Toyota’s factories worldwide also indicates a high level of
production in Brazil: one index shows the quality of finished cars made in the factory in Brazil is
the second best among Toyota’s factories globally, following the factory in Turkey.
components are not necessarily lo
outsourcing local logistics to other firms located next to Toyota’s factory. Its 102 suppliers are
spread out across seven areas of Brazil, and the firm taking care of local logistics picks up their
parts and components several times a day using 79 trucks: the Bandeirantes road area (20
suppliers and 46 pick-ups per day), the Sorocaba city area (eight suppliers and 15 pick-ups per
day), the Sao Paulo city area (42 suppliers and 86 pick-ups per day), the local area with direct
delivery (four suppliers) within a radius of 100km and Rio Grande do Sul State (1220km, three
suppliers, and three pick-ups), Parana State (450km, four suppliers, and eight pick-ups), the
Dutra road area (10 suppliers and 24 pick-ups), and Minas Gerais State (11 su
136

4---222 CCCHHHIIILLLEEE (((RRREEEPPPUUUBBBLLLIIICCC OOOFFF CCCHHHIIILLLEEE))) 444-2-1 Basic Information
(1) Basic Statistics on Chile63
i) Population: 15.96 million (June 2004)
ii) Area: 756,626km2
iii) GDP -per capita-: 4,557USD (2003)
2001 2002 2003 iv) GDP –real growth rate (%)- 3.1 2.1 3.3 v) Export (mil. USD) 18,554 18,285 21,464 vi) Import (mil. USD) 17,830 17,014 19,413 vii) Trade balance (mil. USD) 724 1,271 2,051 viii) FDI inflow (mil. USD) 4,200 1,888 2,982 ix) Current balance (mil. USD) -1,100 -885 594
GDP per capita in 2003 was 4,557 US dollars, approximately one-sixth that of Japan. The
the
period from 1991 to 1997 was eight percent, and the growth rate fell to half of that level in 1998.
re
three
the
estic consumption. Another reason
for the rapid economic recovery is an increase in equipment investment, in line with
ilean
EU in
Total exports in 2003 were approximately 21.5 billion US dollars, marking an annual growth of
of domestic
Chilean economy was stably and rapidly growing for more than 15 years until 1998, when the
economic growth slightly slowed down; the annual average rate of real GDP growth in
By the end of 1999, the economy began to recover, and the growth rate rebounded to mo
than four percent in 2000. Although the GDP growth rate again slightly fell down to
percent in 2001 and two percent in 2002, due to slowdown of the world economy and decline in
the price of primary products, it went up to three percent in 2003. Such a rapid recovery by
Chilean economy mainly resulted from the recovery of dom
expectations of the positive effects of the FTA with the US agreed upon between the Ch
and U.S. governments in 2002, and the temporary application of the FTA with the
February 2003.
17.4 percent, and total imports were 19.4 billion dollars for an annual growth of 14.1 percent.
The increase both in exports and imports in 2003 was partially due to the recovery
Sources: (i)(ii) INE, (iii)(v)(vi)(vii) IMF, (iv)(ix) Banco Central de Chile, (viii) UNCTAD. 63
137

consumptio quip lly
prices f copper and pulp. The major export commodi
n and e ment investment and partia due to the rise in the international market
o ties include fishery and fishery processing
metals such as copper, nickel, and molybdenum. In 2003, Chile
became the largest exporter of molybdenum in the world, followed by China and the U.S.
m will possibly continue to increase in the future, considering the
facts that U.S. and Chinese exports are already close to their limits, and that molybdenum is
ss steel but also for the production of electronic
automobiles.
ed to international trade is the recent enforcement of
FTAs between Chile and Korea (April 2004) and between Chile and the U.S. (January 2004).
he enactment of an FTA betwe d Kore e, seems to have had a
sh rean produ ile.
untries’ Trade and Inv
Trade
products and non-ferrous
Chilean exports of molybdenu
now used not only for the production of stainle
machinery goods and
Another noteworthy phenomenon relat
T en Chile an a, for instanc
significant impact on the market are of Ko cts in Ch
(2) Features of East Asian Co estment in Chile
n include non-ferrous metals such as copper, molybdenum, fishery products
(particularly salmon), and wood chips (Table 4-2-2).65 Half of Japanese copper imports during
Chile has an abundance of natural resources. As Table 4-2-1 indicates, East Asian countries
are important partners for Chilean trade: trade with China, Japan, and Korea accounts for more
than 20 percent of Chilean total exports and more than 10 percent of total imports in terms of
value. While Japan has long been the second largest partner for Chilean exports following the
United States, other East Asian countries such as China and Korea also have become more
important destinations than before (Table 2-1-9). For Chilean imports, Japan was one of the
major partners in the 1990s, but China has become a larger exporter to Chile than Japan since
2000.64 In other words, the Chinese presence as a trading partner, in terms of both exports and
imports, has rapidly become larger in Chile.
If we look at bilateral trade between Chile and Japan, for instance, the major commodities
exported to Japa
the last decade have been from Chile. Although Canada, Australia, and Indonesia had been
the major exporters of copper to Japan until 10 years ago, Chile has been the largest exporter
64 Chinese products such as apparel, clothes, stationery goods, and toys account for a significant portion of the Chilean market. 65 More than half of Japan’s molybdenum imports are from Chile.
138
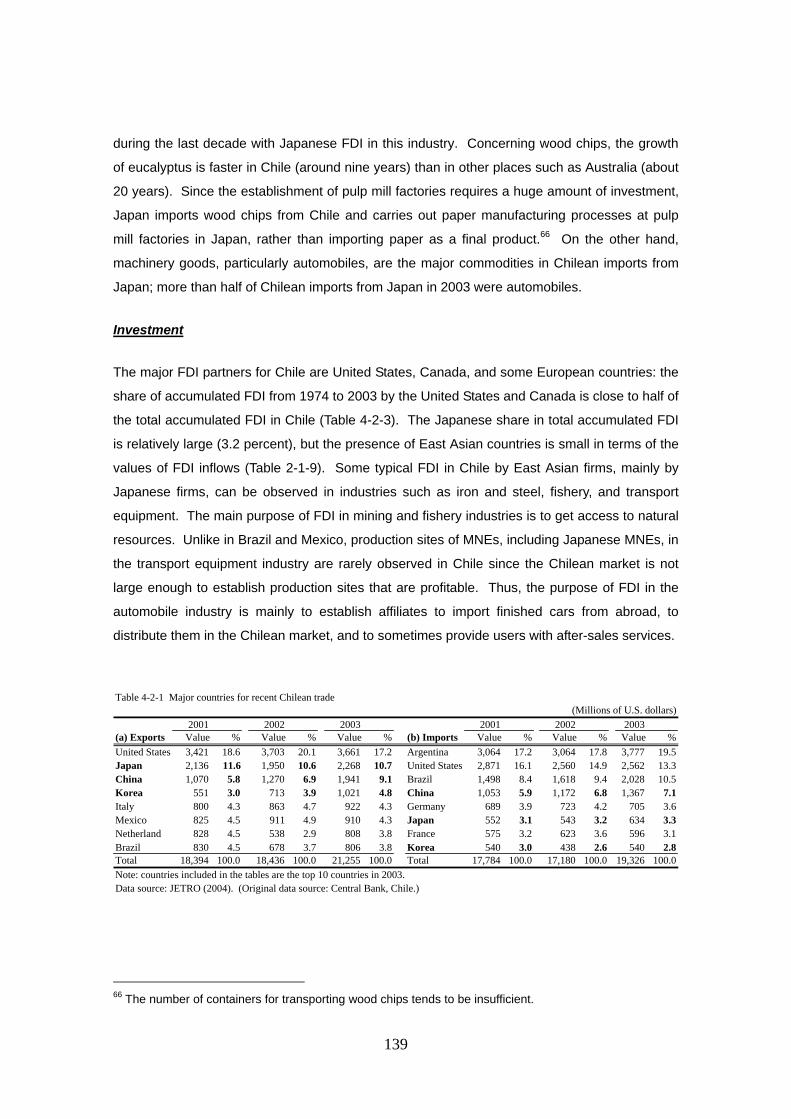
during the last decade with Japanese FDI in this industry. Concerning wood chips, the growth
of eucalyptus is faster in Chile (around nine years) than in other places such as Australia (about
20 years). Since the establishment of pulp mill factories requires a huge amount of investment,
Japan imports wood chips from Chile and carries out paper manufacturing processes at pulp
mill factories in Japan, rather than importing paper as a final product.66 On the other hand,
machinery goods, particularly automobiles, are the major commodities in Chilean imports from
Japan; more than half of Chilean imports from Japan in 2003 were automobiles.
Investment
re in total accumulated FDI
is relatively large (3.2 percent), but the presence of East Asian countries is small in terms of the
alues of FDI inflows (Table 2-1-9). Some typical FDI in Chile by East Asian firms, mainly by
Japanese firms, can be observed in industries such as iron and steel, fishery, and transport
get access to natural
resources. Unlike in Brazil and Mexico, production sites of MNEs, including Japanese MNEs, in
ort equipment industry are rarely observed in Chile since the Chilean market is not
The major FDI partners for Chile are United States, Canada, and some European countries: the
share of accumulated FDI from 1974 to 2003 by the United States and Canada is close to half of
the total accumulated FDI in Chile (Table 4-2-3). The Japanese sha
v
equipment. The main purpose of FDI in mining and fishery industries is to
the transp
large enough to establish production sites that are profitable. Thus, the purpose of FDI in the
automobile industry is mainly to establish affiliates to import finished cars from abroad, to
distribute them in the Chilean market, and to sometimes provide users with after-sales services.
66 The number of containers for transporting wood chips tends to be insufficient.
9.1 Brazil 1,498 8.4 1,618 9.4 2,028 10.54.8 China 1,053 5.9 1,172 6.8 1,367 7.1
Italy 800 4.3 863 4.7 922 4.3 Germany 689 3.9 723 4.2 705 3.6
Table 4-2-1 Major countries for recent Chilean trade(Millions of U.S. dollars)
2001 2002 2003 2001 2002 2003(a) Exports Value % Value % Value % (b) Imports Value % Value % Value %United States 3,421 18.6 3,703 20.1 3,661 17.2 Argentina 3,064 17.2 3,064 17.8 3,777 19.5Japan 2,136 11.6 1,950 10.6 2,268 10.7 United States 2,871 16.1 2,560 14.9 2,562 13.3China 1,070 5.8 1,270 6.9 1,941Korea 551 3.0 713 3.9 1,021
Mexico 825 4.5 911 4.9 910 4.3 Japan 552 3.1 543 3.2 634 3.3Netherland 828 4.5 538 2.9 808 3.8 France 575 3.2 623 3.6 596 3.1Brazil 830 4.5 678 3.7 806 3.8 Korea 540 3.0 438 2.6 540 2.8Total 18,394 100.0 18,436 100.0 21,255 100.0 Total 17,784 100.0 17,180 100.0 19,326 100.0Note: countries included in the tables are the top 10 countries in 2003.Data source: JETRO (2004). (Original data source: Central Bank, Chile.)
139

Wood and the processing products 198 10.2 232 10.2 -Wood tips 115 5.9 125 5.5 -Lumber 53 2.7 72 3.2 -Pulp 25 1.3 29 1.3
Table 4-2-2 Major commodities of Chilean trade with Japan(Millions of US dollars)
2002 2003Values % Values %
(a) ExportsFishery and the processing products 572 29.3 562 - Salmon and trout 396 20.3 419 18.5 -Fish meal 67 3.4 60 2.6 -Sea urchins 72 3.7 47 2.1Agriculture and the processing products 132 6.8 150 6.6 -Pork 71 3.6 92 4.1
Mineral and metal products 848 43.5 1,105 48.7 -Copper 716 36.7 956 42.1 -Molybdenum 63 3.2 74 3.3Others 199 10.2 219 9.6Total 1,950 100.0 2,268 100.0
(b) ImportsGeneral machinery goods 48 8.8 41 6.4Electronic machinery goods 10 1.8 21 3.3Transport equipment 265 48.9 343 54.1 -Automobiles 260 47.9 338 53.4 -Automobile parts 6 1.0 5 0.8Presition machinery goods 4 0.7 6 1.0Lubber products 34 6.3 42 6.6Others 182 33.5 181 28.5Total 543 100.0 634 100.0
Data source: JETRO (2004). (Original data source: Central Bank, Chile.)
Table 4-2-3 Major FDI countries in Chile(millions of U.S. dollars)
Annual FDI inflows
1,318 27.6 289 8.6 78 6.1 8,867 16.6Total 4,781 100.0 3,376 100.0 1,276 100.0 53,449 100.0Note: data are based on the actual investment.Data source: CIE, Chile.
Accumulate
2001 2002 2003Values % Values % Values % Values %
United States 1,776 37.1 594 17.6 480 37.6 15,891 29.7Canada 207 4.3 506 15.0 19 1.5 8,027 15.0U.K 390 8.2 1,504 44.5 130 10.2 5,213 9.8Spain 351 7.3 248 7.3 122 9.6 9,678 18.1International Organization 31 0.6 7 0.2 64 5.0 308 0.6Sweden 79 1.7 29 0.9 56 4.4 224 0.4Panama 2 0.0 2 0.1 51 4.0 252 0.5France 39 0.8 41 1.2 41 3.2 1,342 2.5Australia 461 9.6 102 3.0 39 3.1 1,917 3.6Japan 126 2.6 54 1.6 29 2.3 1,729 3.2Others
dFDI inflows1974-2003
140
4-2-2 Issues
(1) Features
Mining Indu
in Major Industries for FDI by East Asian Countries
of East Asian Firms’ Operations in Chile and Sectoral Issues
stry
Japanese investors in this industry are Japanese trading compan
Japan has a good reputation with the Chilean governmen
pan (JOGMEC67) has taken measures to alleviate pollution. Another rea
s worked on human development and technology educatio
n the JOCMEC office was established in Santiago, most projects
of technological cooperation with Chilean public corporations.
cooperation is being conducted more frequently with private comp
ries, including Chile, Canada, and the UK.68
g domestic demand for natural resources, China’s investment in
stry in Chile has been rapidly increasing. For instance, a Chines
g M&A with a major Canadian company in the non-ferrous metal industry so that it
g rights. The concern about the Chinese investment is that Chin
sically given little consideration to environmental issues.
The major ies and metal
companies. t, one of the reasons
being that Ja son is that
JOGMEC ha n in this industry in Chile.
In 1994, whe were conducted
in the form These days,
technological anies from
various count
With a stron the non-ferrous
metal indu e company is
pursuin can
obtain minin ese companies
have ba
On the other hand, Korean companies have no investment in the iron and steel industry in Chile
environ
at this moment, but they purchase iron ores from Chile and demonstrate concern for the
ment.
Fishery Industry
The main purpose of FDI in the fishery industry is to get access to natural resources. Since
stic market is not very large, the major destinations of products from Japanese MNE
are Europe and Japan; the major commodities exported to Japan are salmon, fish me
fish oil, and so on.
romotion of the salmon-related industry is one Chilean national strategy to incre
he major tasks of JOGMEC (Japan Oil, Gas Metals National Corporation) in Chile are 1) to prov
on on the Chilean government’s industrial policy, including environmental regulations, and uct geological surveys and provide the results to Japanese companies. When Japanese firms n
act the Chilean government regarding business, they generally contact JOGMEC first.
67 T ide informati 2) to cond eed to cont68 In such cases, mining rights for newly discovered deposits are divided among these parties according to their shares of capital. The rights allocated to JOGMEC are then transferred to a Japanese firm that actually mines.
the
dome s in
Chile al,
The p ase
141
employment. The Chilean government implements an employment subsidy for fishery
processing. At the same time, Chile regulates investment in fishing vessels, aiming to increase
of vessels) must
be accompanied by at least the same amount of investment in land in the southern area below
rds, firms that would like to invest in vessels need twice the amount of the
sult, fishery management in Chile 70
domestic employment: investment in vessels (in terms of the assessed value
44’30’’. In other wo
vessel investment. In addition, their land operations are limited to the southern part of Chile,
which is far from the capital Santiago. It seems quite difficult for small and medium-sized
enterprises (SMEs) to enter and operate in the fishery industry in Chile.
To avoid over-fishing, new licenses for Chilean flag vessels have not been issued since 1991.69
Fishing quotas for each type of fish for each firm, depending on fish hauls in the past, have also
been in place since December 2002. These regulations apparently prevent new entry by firms
and limit the operations of existing firms. Such a limited number of vessels, on the other hand,
allows the Chilean government to easily control them. As a re
is more rational, planned, and clean than that in other countries, including Japan.
Automobile Industry
In Chile, more than 30 automobile producers in the world have entered the domestic market,
and the Chilean automobile market is very competitive. In Chile, Japanese automobiles have a
certain portion of market share. In addition, the market share of Korean automobiles such as
ese automobiles are not yet on the Chilean market, motorcycles made in
es of Honda or Yamaha motorcycles at one-third to one-half their regular
prices, now account for 60 percent of the motorcycle market in Chile.
an countries. While most of the major Japanese automobile producers
conduct their business in Chile together with one of the major Japanese trading companies,
addition to their import-sales activities.
Hyundai has been rapidly increasing during the last 10 to 15 years, partially due to their better
quality and relatively low prices and partially due to the lifting of tariffs under the Chile-Korea
FTA. Although Chin
China, which are copi
The main purpose of FDI in the automobile industry by Japanese MNEs, for instance, is to
establish affiliates to import finished cars from abroad to sell them in the Chilean market and
other Latin Americ
some have their own affiliates in Chile that focus on providing users with after-sales services in
69 There is an example of a Spanish vessel purchased with Chilean capital. Although it is possible to get national flag registration through M&A, the size of the vessel must be limited to the size of the original Chilean capital. 70 For instance, there are too many vessels in Argentina, and it is difficult for the Argentina government to control them.
142
Chile has introduced Euro 3 emission controls as its environmental standard. In connection with
this, some Japanese automobile producers have aggressively tried to sell cars with hybrid
engines in Chile. It is, however, still difficult for them to increase their market shares because
those eco-friendly cars are more expensive than others. Some promotion policies to produce or
sell such eco-friendly cars would be helpful to increase their market shares, and as a result, to
reduce emissions in Chile.
Tax policies in Chile deserve some discussion. Chile has applied uniform tariffs since trade
liberalization started in the late 1980s. The import tariff rates have been reduced by one percent
ssed above. Table 4-2-4
presents some examples of claims and complaints raised by Japanese firms on trade and FDI-
per year, and the import tariff rate in 2005 is six percent for basically all commodities, including
automobile products. There exist, however, domestic taxes that apparently increase the prices
of some imported commodities. Chile imposes luxury taxes on imported luxury cars with prices
higher than a certain threshold; the minimum threshold c.i.f. price was 15,834.65 U.S. dollars in
2003, and a luxury tax of 85 percent is imposed on the price differential between the minimum
threshold c.i.f. price and the actual c.i.f price of those luxury cars.71
(2) General Problems in Doing Business in Chile
Security in Chile is much better than in other Latin American countries. In addition, government
officials are cooperative and administration procedures, including custom procedures, are clear,
transparent, and speedy. Moreover, unlike other Latin American countries, there exists no
problem in collecting receivables in Chile. Thus, operating a business in Chile is relatively easy.
For private enterprises, particularly for East Asian MNEs, however, there are several difficulties
in operating businesses in Chile beyond the sectoral regulations discu
related policies in Chile (BCFTI, 2003).72 Let us explain some general difficulties that were
identified during the interviews in Chile.73
71 The luxury tax rates are supposed to be gradually reduced, and at the same time the minimum threshold
raised as follows: 63.75 percent and 18,334.65 U.S. dollars in 2004, 42.50
x for details of the claims compiled by BCFTI.
tions.
c.i.f. prices are to be graduallypercent and 20,834.65 U.S. dollars in 2005, 21.25 percent and 23,334.65 U.S. dollars, and zero percent in 2007. 72 See the Appendi73 See “Features of East Asian firms’ operation in Chile and their sectoral issues” for a discussion on sectoral regula
143
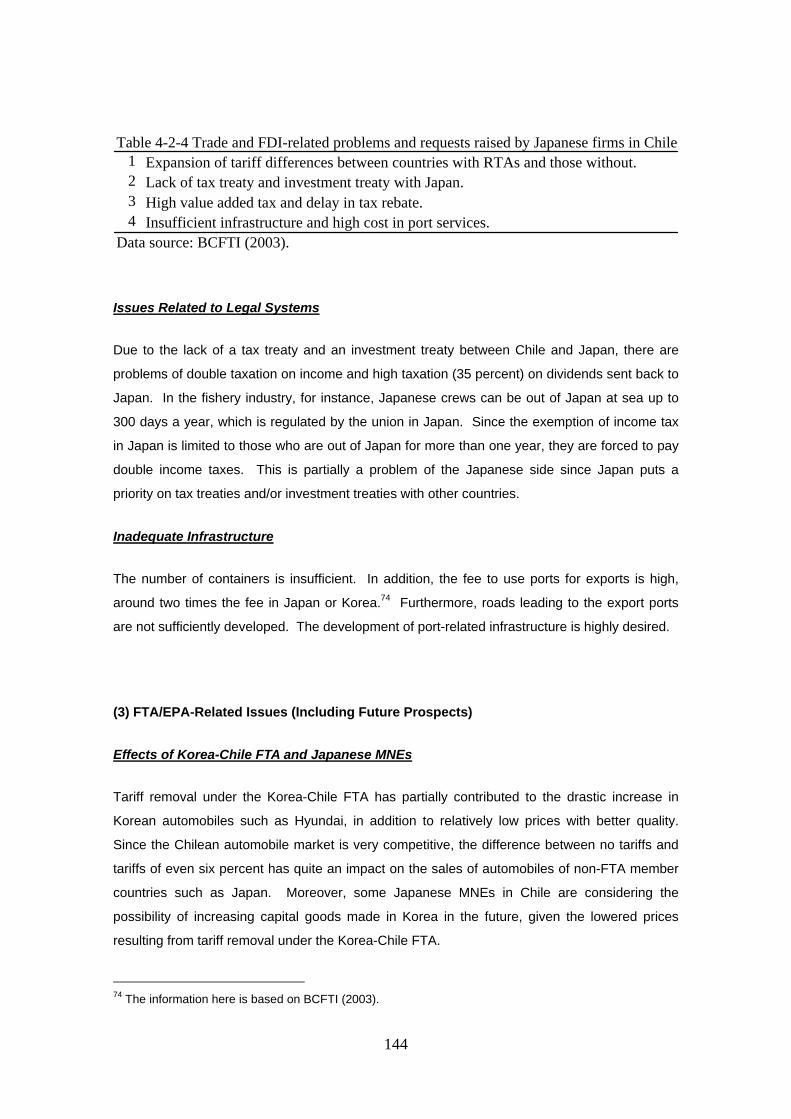
1 Expansion of tariff differences between countries with RTAs and those without.2 Lack of tax treaty and investment treaty with Japan.3 High value added tax and delay in tax rebate.4 Insufficient infrastructure and high cost in port services.
Data source: BCFTI (2003).
Table 4-2-4 Trade and FDI-related problems and requests raised by Japanese firms in Chile
Issues Related to Legal Systems
Due to the lack of a tax treaty and an investment treaty between Chile and Japan, there are
problems of double taxation on income and high taxation (35 percent) on dividends sent back to
Japan. In the fishery industry, for instance, Japanese crews can be out of Japan at sea up to
300 days a year, which is regulated by the union in Japan. Since the exemption of income tax
in Japan is limited to those who are out of Japan for more than one year, they are forced to pay
double income taxes. This is partially a problem of the Japanese side since Japan puts a
priority on tax treaties and/or investment treaties with other countries.
Inadequate Infrastructure
The number of containers is insufficient. In addition, the fee to use ports for exports is high,
around two times the fee in Japan or Korea.74 Furthermore, roads leading to the export ports
are not sufficiently developed. The development of port-related infrastructure is highly desired.
(3) FTA/EPA-Related Issues (Including Future Prospects)
Effects of Korea-Chile FTA and Japanese MNEs
Tariff removal under the Korea-Chile FTA has partially contributed to the drastic increase in
Korean automobiles such as Hyundai, in addition to relatively low prices with better quality.
Since the Chilean automobile market is very competitive, the difference between no tariffs and
tariffs of even six percent has quite an impact on the sales of automobiles of non-FTA member
countries such as Japan. Moreover, some Japanese MNEs in Chile are considering the
possibility of increasing capital goods made in Korea in the future, given the lowered prices
resulting from tariff removal under the Korea-Chile FTA.
74 The information here is based on BCFTI (2003).
144
The brand image of Korean home appliances such as Samsung and LG has been rapidly
improving in Chile. In light of the enforcement of the FTA between Korea and Chile, the LG
group invested in the electronic industry in 2003, the first Korean investment in five years since
the last Korean investment in 1998 (JETRO, 2004).
Japan-Chile FTA/EPA
s with most developed countries. Japan’s competitiveness
in the Chilean market is apparently dropping due to the lack of an FTA with Chile. Besides the
ial commodities (for the
Japanese side) in considering a potential Japan-Chile FTA. Since Chilean cultivated salmon is
r, the markets for fresh salmon in Japan and frozen salmon
imported from Chile would be different enough. In addition, as Table 4-2-5 suggests, the tariff
salmon and smoked salmon are higher.
Regarding copper, Japan imports ores from Chile and refines them in Japan at the moment.
g the locations for the refinement
cheaper labor resources of Chile. This
seems to be a concern for the Japanese side.
Chile already has FTAs or agreement
direct effects in the commercial market, the lack of an FTA with Chile also affects the results of
international bidding by Japanese firms such as bidding for power plants. Although Japan can
participate in such international bidding, Japanese firms face difficulties in being bidders, due to
the constraints of additional costs derived from tariffs that will be imposed on imports for the
project.
Cultivated salmon imported from Chile is one of the controvers
imported as frozen fish, howeve
rate imposed by Japan on imports of salmon, which account for more than 30 percent (10
percent) of agriculture and fishery-related imports from Chile (total imports from Chile), is
already as low as 3.5 percent, though tariff rates imposed on imports of prepared or preserved
With a Japan-Chile FTA, there would be a possibility of shiftin
process from Japan to Chile, utilizing the relatively
A Japan-Chile FTA would enlarge the range of consumption in Japan, particularly for agriculture
and fishery products.
145
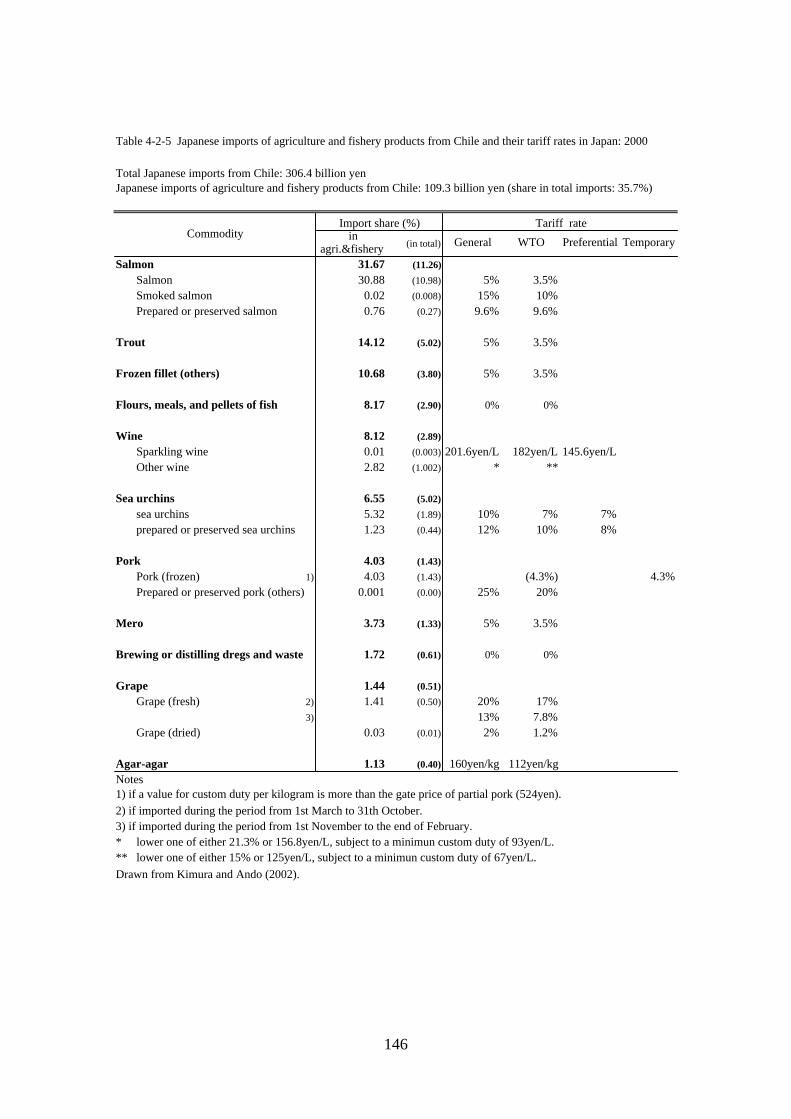
inagri.&fishery (in total) General WTO Preferential Temporary
31.67 (11.26)Salmon 30.88 (10.98) 5% 3.5%
8.12 (2.89)ling wine 0.01 (0.003) 201.6yen/L 182yen/L 145.6yen/L
Other wine 2.82 (1.002) * **
1.72 (0.61) 0% 0%
(0.40) 160yen/kg 112yen/kg
riod from 1st November to the end of February.3% or 156.8yen/L, subject to a minimun custom duty of 93yen/L.
** lower one of either 15% or 125yen/L, subject to a minimun custom duty of 67yen/L.Drawn from Kimura and Ando (2002).
CommodityTariff rate
1) if a value for custom duty per kilogram is more than the gate price of partial pork (524yen).
Table 4-2-5 Japanese imports of agriculture and fishery products from Chile and their tariff rates in Japan: 2000
Total Japanese imports from Chile: 306.4 billion yenJapanese imports of agriculture and fishery products from Chile: 109.3 billion yen (share in total imports: 35.7%)
Import share (%)
Salmon
Smoked salmon 0.02 (0.008) 15% 10%Prepared or preserved salmon 0.76 (0.27) 9.6% 9.6%
Trout 14.12 (5.02) 5% 3.5%
Frozen fillet (others) 10.68 (3.80) 5% 3.5%
Flours, meals, and pellets of fish 8.17 (2.90) 0% 0%
WineSpark
Sea urchins 6.55 (5.02)sea urchins 5.32 (1.89) 10% 7% 7%prepared or preserved sea urchins 1.23 (0.44) 12% 10% 8%
Pork 4.03 (1.43)Pork (frozen) 1) 4.03 (1.43) (4.3%) 4.3%Prepared or preserved pork (others) 0.001 (0.00) 25% 20%
Mero 3.73 (1.33) 5% 3.5%
Brewing or distilling dregs and waste
Grape 1.44 (0.51)Grape (fresh) 2) 1.41 (0.50) 20% 17%
3) 13% 7.8%Grape (dried) 0.03 (0.01) 2% 1.2%
Agar-agar 1.13Notes
2) if imported during the period from 1st March to 31th October.3) if imported during the pe* lower one of either 21.
146

China-Related Factors
Roughly speaking, wage rates are as follows: China=1; Chile=4; the U.S.=20-22; Japan=20;
Argentina=5. Therefore, some Japanese MNEs in Chile are increasing the portion of food
processing within bonded areas in the coastal regions of China for re-export to Japan.
Around 60 percent of home appliances in Chile are sold through three major department stores,
and the rest are Chinese-made with their own department store brand names.
Chile is attempting to be a gateway for IT centers, and Chile’s relationships with China and India
through IT might be strengthened in the future. Also, Chile is pursuing PTA/FTAs with India and
China.
(4) Policies Adopted by the Government to Promote Foreign Investment75
Chile has provided a stable and transparent legal framework for foreign investment,
characterized by clear, non-discriminatory, and non-discretionary rules. These principles are
embodied both in the 1980 Political Constitution and in all laws, including the Foreign
Investment Statute, known as Decree Law 600 (D.L. 600).
All the rights guaranteed by Chile's legal framework are also protected by Bilateral Investment
Treaties (BITs). As of February 2005, Chile had signed 52 BITs, 38 of which were in force. In
addition, Chile's FTAs with Canada, Mexico, South Korea, and the United States include
specific chapters on investment-related issues, including dispute-settlement mechanisms that
are similar to those used in BITs. Moreover, Chile has double-taxation treaties in force, as of
March 2005, with Argentina, Canada, Mexico, Brazil, Ecuador, Peru, Norway, South Korea,
Poland, Spain, the United Kingdom, Denmark, and Croatia.
Worth mentioning above all is the approach recently taken by the Chilean government to
introduce a new law allowing Chile to serve as an investment platform. In November 2002, the
Chilean Government launched an Investment Platform Initiative, as a part of a Pro-Growth
genda, to encourage foreign investors to make more use of the country as a platform for
investing in other Latin American countries and world markets. In line with Chile's rules-based
A
75 This part is based on the information available from the website of the Foreign Investment Committee, Chile (available at http://www.foreigninvestment.cl).
147

approach to economic management, the new law offers investors the guarantee of even greater
clarity and fairness in the treatment of their investments.
Similarly,
the initiative includes safeguards to prevent loss of tax revenue and its use as a tax loophole.
-- A company that is set up exclusively as a platform for investments abroad and in Chile is
but, in the latter case, must submit to the same regulation as public companies;
percent of the platform company’s shareholders may be resident in Chile; non-
resident shareholders may not reside in tax havens;
-- Shareholders in the platform company can contribute capital either in the form of shares or
ean assets, it must pay tax on profits
derived from these investments;
eparate accounting is required for
earnings from investments abroad and on assets in Chile;
While offering new incentives for the use of Chile as an investment platform, the initiative does
so without endangering its low country-risk level or exposing it to use as a tax haven.
The principal provisions of the initiative are summarized as follows:
exempt from Chilean earnings tax on the profits that overseas shareholders derive from its
investments outside Chile. These platform companies can be either publicly or privately-
held
-- Up to 75
equity in other companies, as well as in foreign currency;
-- In regards to taxes on local shareholders and on investments in Chile, a platform company is
treated as a foreign company. Thus, if it invests in Chil
-- Similarly, the earnings of the platform company paid to Chilean shareholders are liable for
the same tax and have the same right to tax credits (as an investment abroad that
repatriates profits to Chile);
-- Platform companies that invest in Chile must distribute earnings in the order in which they
were obtained, starting with the oldest. As a result, s
-- There are no restrictions on domestic borrowing by a platform company, but its overseas
debt cannot exceed the value of the capital contributed by overseas shareholders;
-- The platform company cannot invest in tax havens76; and
r 76 See the website of the Foreign Investment Committee, Chile for a detailed explanation of exceptions fo
countries that may be classified as tax havens.
148
-- Platform companies are not entitled to bank secrecy.
By exempting platform companies from Chilean tax on overseas earnings, the initiative
on to move their
operation centers to Chile without incurring the transaction costs involved in selling and re-
addresses the problem of three-way taxation and provides foreign investors with additional
incentive to invest in Chile. This initiative is expected to foster regional joint ventures between
foreign investors and Chilean partners. Also, in order to facilitate the entry of foreign capital into
Chile, the initiative allows companies that are already established in the regi
buying assets.
149

44--33 MMEEEXXXIIICCCOOO ((UUNNNIIITTTEEEDDD MMEEEXXXIIICCCAAANNN SSTTTAAATTTEEESSS)))
lion km2
) GDP -per capita-: 6,112USD (2003)
2001 2002 2003 2004
(Q1)
(Q2)
(Q3)
4-3 M (U M S
4-3-1 Basic Information
(1) Basic Statistics on Mexico77
i) Population: 104.21 million (2003)
ii) Area: 1.96 mil
iii
iv) GDP –real growth rate (%)-
-0.1 0.7 1.3 1.35 1.19 0.64
v) Export (mil. USD) 158,443 160,763 164,922 vi) Import (mil. USD) 185,236 185,547 187,600 vii) Trade balance (mil. USD) -27,793 -24,884 -22,678 viii) FDI inflow (mil. USD) 26,776 14,745 10,783 ix) Current balance (mil. USD)
-18,195 -14,082 -9,298
GDP per capita in 2003 was 6,112 US dollars, which is approximately one-fourth of Japan’s
GDP per capita. In Mexico, income distribution remains highly unequal.
Real GDP growth rate remained relatively low until 2003, reflecting the slowdown of the U.S.
economy: –0.3 percent in 2001, 0.7 percent in 2002, and 1.3 percent in 2003. The Mexican
economy has, however, started to gradually recover since 2004. In the manufacturing sector,
production increased in 2004 after three successive years of negative growth, supported by
strong external demand, especially from the U.S. economy. The production growth rates were
2.8 percent in Q1, 4.0 percent in Q2, and 5.0 percent in Q3 of 2004. Note that, in the
manufacturing sector, the increasing competitiveness and presence of Chinese products in the
Mexican market has recently become as influential on the Mexican economy as fluctuations of
the U.S. economy.
77 Sources: (i) CONAPO, (ii)(iv)(ix) INEGI, (v)(vi)(vii) IMF, (viii) JETRO
150

While tota in 2 ap 1 U
growth of 2.9 percent, total imports were 188 billion dollars, re
l exports 003 were proximately 65 billion S dollars, recording an annual
aching an annual growth of 1.1
percent. It should be noted that oil-related exports substantially contributed to the decrease in
of only non-petroleum commodities, the trade
deficit went up. Mexico experie se in exports of industrial products in 2003, which
exports. This is largely due to the decline in
ich make up more than half of industrial exports. One of
the major reasons for such a decrease in exports of Maquiladora products would be the
incentives accompanying a switchover to the PROSEC system.78
Another reason would be the explosive increase in exports from China to the U.S. market.
Total FDI flows into Mexico in 2003 were the smallest in the last five years. FDI flows from
ome East Asian countries s Kor Ta owe rea d mainly in the
electronic machinery industry.
ra nv in exico
the overall trade deficit. If we focus on trade
nced a decrea
account for more than 80 percent of total Mexican
exports of Maquiladora products, wh
reduction in Maquiladora
s uch as ea and iwan, h ver, inc se
(2) Features of East Asian Countries’ T de and I estment M
Trade
The most important trading partner for Mexico has been no doubt the United States. East Asian
dition, as discussed in
Section 2, the Chinese position has suddenly changed very recently; China became the second
ample of Mexican trade with Japan. Table 4-3-2 presents trade between
Mexico and Japan in 2003. The table clearly shows two important points about Japanese
countries, however, are becoming more important as trading partners. Japan has been one of
Mexico’s major trading partners, particularly for Mexican imports. In ad
largest importer of Mexican products in 2003, following the United States, while it did not appear
among the five largest importers in the 1990s. The major commodities imported from East
Asian countries are machinery goods and machinery parts and components, particularly in the
electronic machinery industry. In the case of Mexican imports from Japan, for instance, the
shares of electronic machinery and total machinery (including electronic machinery) industries
are 41 percent and 77 percent in 2003, respectively (Table 4-3-1).
To highlight some features of Mexican trade and multinational enterprises’ (MNEs’) operations,
let us provide an ex
78 See the part on the electronic machinery industry in “Features of East Asian firms’ operation in Mexico
d the PROSEC regime. and sectoral issues” for further discussion on Maquiladora incentives an
151

Table 4-3-1 Major commodities of Mexican imports from East Asia: the case of Japan(Millions of U.S. dollars)
2002 2003Values % Values %
Agriculture, fishery, and mini 57.3 0.6 25.8 0.3Metal products 665 7.1 641 8.4
Iron and steel 537 5.7 490 6.5Machinery products 7211 77.1 5812 76.5
Electronic machinery 4356 46.6 3100 40.8Integrated circuit 1019 10.9 565 7.4
General machinery 1666 17.8 1393 18.3Transport equipment 859 9.2 921 12.1
Automobiles 287 3.1 488 6.4Automobile parts 381 4.1 291 3.8
Precision machinery 305 3.3 377 5.0
ia.
Others 1415 15.1 1116 14.7Total 9349 100.0 7595 100.0Note: imports are the f.o.b values.Data source: Secretaria de Econom
Table 4-3-2 Trade between Mexico and Japan: 2003(millions of U.S. dollars)
Values %
direct imports from Japan 3,625 47.6orts through the U.S. 3,998 52.4
(ii) Japanese imports from Mexico (total) 1,776 100.0
(i) Mexican imports from Japan (total) 7,623 100.0
imp
direct imports from Mexico 606 34.1imports through the U.S. 1,170 65.9
Data source: JETRO Mexico.
Note: values of imports through the U.S. are estimated as "Mexican(Japanese) imports from Japan (Mexico) - Japanese (Mexican) exports toMexico (Japan).
manufacturing MNEs’ operations in Mexico. First, a certain portion of trade between Mexico
and Japan goes through the United States. In 2003, more than half of Mexican imports from
Japan went through the United Sates. When Japanese manufacturing firms (and other MNEs)
operating in Tijuana and other western parts of the U.S.-Mexico border area import parts and
components from abroad, for instance, they often import the goods to the United States at Long
izing
the Maquiladora or PITEX systems (Table 4-3-3). In 2003, the Japanese domestic sales ratio in
Beach, L.A., and then transport them to their factories in Mexico. This kind of operation is
partially the result of insufficient port capacity in Mexico.
Second, a large portion of imports from Japan is for U.S. sales operations in Mexico, util
Mexico, i.e., the domestic sales ratio in total Japanese exports to Mexico, was approximately 39
152

percent. In other words, over 60 percent of imports from Japan are used by Jap
Mexico to produce final goods that are exported to the United States and other countrie
domestic sales ratios are even lower for imports from Korea (34 percent), Thaila
and Malaysia (19 percent), while they are higher for imports from China (40 pe
(39 percent). As Table 4-3-2 indicates, the top 10 importer countries un
scheme in 2003 are all East Asian countries except the United States and Malta.
anese MNEs in
s. The
nd (25 percent),
rcent) and Taiwan
der the Maquiladora
Investment
The largest FDI partner for Mexico has been the United States (Table 2-1-9). East Asian
countries have a small share in total inward FDI in Mexico, and most FDI by Asia-Pacific
countries is Japanese FDI (Table 4-3-4). The presence of other East Asian countries,
particularly that of Korean MNEs, however, has been increasing in some industries.79
The major industries for East Asian FDI in Mexico are the electronic machinery and transport
equipment (automobile) industries, in addition to the wholesale industry. As discussed in
Section 4.1, Mexico is one of the more important countries for manufacturing FDI in Latin
79 Although the amount of Korean investment in Mexico is by far smaller than the amount of Japanese investment, the number of Korean affiliates in Mexico is larger than that of Japanese affiliates. According to
important sectors. Looking at Thai FDI, we find only three affiliates in Mexico.
Table 4-3-3 Imports and export-oriented operation in Mexico: 2003(Millions of U.S. dollars)
Country No.
Totalimports % No
.
Importsunder
Maquila% No
.
Importsunder
PITEX(temporary)
%
Domestic salesratio(%)
World 170,956 100.0 59,058 100.0 26,885 100.0 49.7United States 1 105,686 61.8 1 40,782 69.1 1 18,297 68.1 44.1China 2 9,401 5.5 2 4,896 8.3 5 747 2.8 40.0Taiwan 9 2,509 1.5 6 1,221 2.1 9 304 1.1 39.2Japan 3 7,623 4.5 3 3,844 6.5 4 808 3.0 39.0Korea 6 4,113 2.4 4 2,372 4.0 7 351 1.3 33.8Thailand 16 987 0.6 8 677 1.1 24 60 0.2 25.3Malaysia 8 2,761 1.6 5 1,914 3.2 8 311 1.2 19.4Singapore 13 1,338 0.8 7 753 1.3 15 189 0.7 29.6Philippines 20 784 0.5 9 455 0.8 14 213 0.8 14.8Note: "No." indicates the ranking of each coutnry.Data source: JETRO Mexico (original source: BANCOMEXT, CD-ROM).
the information provided by the Secretaria de Economia (http://www.economia.gob.mx), the number of Korean affiliates in Mexico as of September 2004 was 904 (309 for Japanese affiliates in Mexico), 60 percent of which are involved in the wholesale sector, with the fabric and apparel sectors being the next largest areas of activity. The number of Chinese affiliates in Mexico was 307, and again 60 percent of them are in the wholesale sector, with the apparel and restaurant sectors constituting the next most
153

America; in the case of Japanese FDI (or U.S. FDI) in machinery industries, for instan
80-90 percent of production activities by Japanese (U.S.) affiliates in Latin Ameri
conducted by those in Brazil and Mexico (Table 4-1-6). The purposes of FDI
ce, around
ca are
by East Asian
anufacturing firms investing in Mexico are/were 1) to produce final goods mainly for the U.S.
market or for the domestic market (including some countries in Latin America) with lower tariff
2) to produce products locally to maintain sales in the domestic market, in light of
m
incentives or
trade restrictions such as import prohibitions or import quotas.
4-3-2 Issues in Major Industries for FDI by East Asian Countries
(1) Features of East Asian Firms’ Operation in Mexico and Sectoral Issues
Electronic Machinery Industry
East Asian MNEs operating in Mexico in the electronic machinery industry produce their
products either for export mainly to the United States or for domestic sales, depending on the
products, but the majority of their business is production for the U.S. market80 81. In addition to
80 In the case of televisions, for example, CRT (cathode-ray tube) TVs are produced for the domestic
2,197,858 2.3Singapore 66,066 80,949 320,904 49,843 18,287 30,754 566,803 0.6Korea 46,180 29,925 44,083 30,159 34,872 11,309 196,528 0.2Taiwan 19,832 11,494 40,888 14,006 18,562 5,684 110,465 0.1New Zealand 39 25 1,655 43,126 5,719 19 50,582 0.1China 4,984 10,771 2,389 -2,232 5,733 6,666 28,311 0.0Australia 7,912 7,470 4,292 -2,095 4,279 4,129 25,987 0.0Hong Kong 2,349 4,009 -1,049 -110 2,114 1,400 8,714 0.0Indonesia 0 0 0 550 0 0 550 0.0Malaysia 5 84 13 426 7 0 536 0.0Thailand 25 10 -78 0 81 5 43 0.0Philippines -3,218 113 95 25 0 5 -2,981 0.0Notes: data are on the notification basis. Data for 2004 is the one from January to September, 2004.Data source: Secretaria de Economia.
Table 4-3-4 Recent trend of inward FDI in Mexico by East Asian countries(Millions of U.S. dollars)
1999 2000 2001 2002 2003 2004 Accumulation: 1999-2004 %
Total 13,196,460 16,763,754 27,549,601 15,043,008 11,039,909 12,976,202 96,568,934 100.0
Asia-pacific 1,376,923 561,740 592,608 283,970 202,742 165,448 3,183,431 3.3Japan 1,232,714 416,889 179,416 150,270 113,090 105,479
154
such operations for U.S. sales, MNEs located in the western areas along the U.S.-Mexico
onded import measures was abolished in 2001 for exports to North America in accordance
with NAFTA Article 303, and tariffs were imposed on imported raw materials and parts and
The serious problem for Japanese or other East Asian MNEs in Mexico in the electronic
achinery sector is/has been that many raw materials and parts and components important for
their production were excluded from the PROSEC commodity list. Since supporting industries
port those products with
much higher MFN tariffs. Although the Mexican government returned some electronic parts and
border often import parts and components into the United States at Long Beach, Los Angeles,
and then transport these goods to their factories in Mexico. Thus, let us examine the case of
tariffs on TVs both in Mexico and the United States: tariff rates on TVs are 20 percent for final
goods (23 percent until December 2004) in Mexico and five percent for final goods and 2.9
percent for parts and components in the United States. MNEs in Tijuana, for instance, have
utilized Maquiladora incentives and North American Free Trade Agreement (NAFTA) regimes;
under the bond system in the Maquiladora scheme, they can receive back tariffs imposed on
their imported raw materials, parts and components, and machinery equipment to produce
exported goods in Mexico. They can also export their final goods to the U.S without tariffs
under NAFTA with a certificate of NAFTA origin. Table 4-3-2 clearly indicates how large a
portion of products are imported under Maquiladora or PITEX schemes by East Asian MNEs in
Mexico.
However, Maquiladola-incentives have been significantly reduced since 2001; the application of
b
components for export to the United States and Canada.82 Instead, as a replacement for the
Maquiladora-system, the PROSEC system (Los Programas de Promocion Sectorial) was
introduced in 2001. Under this system, PROSEC tariff rates, which are lower than MFN tariffs,
are applied to those products included in the PROSEC commodity list for 22 manufacturing
sectors, and MFN tariffs (for imports from non-FTA member countries such as East Asian
countries) are applied to the rest.83
m
have not been well developed in Mexico, they have been forced to im
n TVs, and rear projection TVs (PTV) are produced mainly for the
U.S. market. 81 There are three approaches to sales in the U.S. market: one is direct export from China or other
compliance with the FTA between the EU and Mexico. 83 Among commodities included in the PROSEC commodity list in 2001, tariffs were zero percent for those
market, and LCD TVs, plasma scree
countries in Asia, another one is production and sales in the U.S., and the third is production in Mexico and export to the U.S. Some Korean MNEs such as Samsung and LG have been successfully gaining market share in the U.S for home appliances, TVs, and so on through production in Mexico, an improved brand image and development technology. 82 The application of bonded import measures was also abolished in January 2003 for exports to the EU in
products not produced in Mexico and five percent for those products produced in Mexico.
155

components and other machinery goods to the PROSEC commodity list after it received a
number of claims from Maquiladora MNEs, chemical products such as resins and adhesives
and some steel products, which are used to produce electronic machinery goods, have been
still excluded from the PROSEC commodity list. Due to such disadvantages, particularly for
non-FTA members, in addition to the increasing competitiveness of manufacturing in China, the
number of Japanese affiliates and other MNEs in Mexico has drastically fallen since 2000.84
The current presence of MNEs in Maquiladora in terms of employment is roughly speaking as
follows: one-third are Japanese firms, around 20 percent are Korean and Taiwanese firms, 20-
30 percent are U.S. firms, and the rest are local indigenous firms (based on the interview). The
presence of East Asian MNEs in Maquiladora is indeed large. Although the Japan-Mexico EPA
has been in force since April 2005, Japanese affiliates in Mexico in the electronic machinery
sector import parts and components not only from Japan but also from other East Asian
countries such as Malaysia, Thailand, and China (sometimes through Hong Kong or Singapore).
As discussed above, domestic sales ratios in total imports from East Asian countries are low: 19
percent for Malaysia, 25 percent for Thailand, 34 percent for Korea, 39 percent for Japan and
Taiwan, and 40 percent for China (Table 4-3-2). These figures indicate how significant imports
from East Asian countries are for business operations in the electronic machinery industry in
Mexico. Even at the level of trade measures, there seems to be plenty of room to improve
business environments in Mexico to strengthen economic relations between East Asian
countries and Mexico.
Automobile Industry
The Mexican government has attempted to make this industry a basic industry for
manufacturing in Mexico and has implemented various regulations to protect the domestic auto
industry. Until the end of 2003, the Mexican automobile industry was heavily protected by “the
Automobile Act” for around four decades; in the mid-1960s, the import of final cars was
prohibited. At that time, Japanese and other automobile producers started production in Mexico
to maintain sales in the domestic market. Then the Mexican government raised the local
content requirement from 50 percent to 60 percent in order to protect and develop the domestic
auto industry. It also implemented regulations covering exports of parts and components in the
1980s and introduced a trade balance requirement, i.e., a requirement that the values of
84 In the electronic machinery industry, the number of firms in the Maquiladora area and their work forces decreased by 123 and 120 million respectively during the period January 2001 - September 2003 (JETRO 2004). Some Japanese firms in the electronic machinery industry also shifted their operations from Mexico to Asian countries such as China and Malaysia during the same period.
156
imported finished cars should be equal to the values of exported finished cars, in the 1990s. In
other words, those who have no production site in Mexico cannot import finished cars.
From June 2003, automobile producers can import finished cars up to a maximum of one-tenth
of their production in Mexico with no tariff and have to pay a 50 percent MFN tariff for those
exceeding the non-tariff quota (the MFN tariff was 20 - 30 percent before January 2004).85
Although automobile producers with no production site in Mexico have been allowed to import
Now we shall focus on problems confronting private enterprises, particularly East Asian MNEs,
s in Mexico. Table 4-3-5 presents some examples of claims and
finished cars since the abolishment of the Automobile Act in January 2004, the 50 percent MFN
tariff imposed on finished cars (13 to 23 percent MFN tariffs on the parts and components) is
too high for them to import finished cars to Mexico.
Now most of the world’s major automobile producers have production sites in Mexico.86 As
discussed above, some of them came to Mexico to maintain domestic sales in the face of the
import prohibition introduced in the mid-1960s. The current operations of Japanese (and other)
automobile producers in Mexico naturally include production for domestic sales, but they tend to
have global strategies for allocating production sites for different types of automobiles in line
with their markets.
(2) General Problems in Operating in Mexico
in operating businesse
complaints raised by Japanese firms on trade and FD-related policies in Mexico (BCFTI,
2002).87 Let us explain the details of problems, difficulties, and impediments beyond trade
measures collected during the interview in Mexico.88
85 The no-tariff import quota for finished cars can be adjusted through negotiations. Also, the total no-tariff import quota with no tariff can be transferred to other automobile producers in the same auto group. Therefore, even though a certain automobile producer may have no production site, it could import finished cars tariff-free within the amount of its group quota if other producers in the same group produce finished cars in Mexico. 86 Mexico is a successful case in the sense that the automobile sector has been developed in the domestic market with foreign capital. Peru was not able to develop the automobile sector though it implemented protection policies similar to those of Mexico; Peru allowed imports of used cars. Since purchasing power in Peru was much smaller than in Mexico, a market for new finished cars sufficient to support the
measures.
production within the country was naturally not developed. 87 See the Appendix for details of the claims complied by BCFTI. 88 See “Features of East Asian firms’ operation in Mexico and their sectoral issues” for a discussion of trade measures, including import tariff-related issues and trade promotion
157

1 Restriction on foreign ownership ratios, industries with foreign entry ban.2 Leftover of local contents requirements, trade balance requirements.
Table 4-3-5 Trade and FDI-related problems and requests raised by Japanese firms in Mexico
Complicated Legal Regulations and Frequent Changes
9 policy.10 Worsening security problem.
Data source: BCFTI (2003).
There are a wide variety of legal regulations. In addition, they are frequently changed without
gh notification in advance. Uncertainties, inconsistencies, and grey zones in the Mexican
osts for firms operating in Mexico. Simplifying
regulations and making their application more transparent are important.
an market to engage in business in Mexico.
The influence of the U.S. lobby is large in implementing commercial policies. In general, tariffs
imposed on intermediate goods are lower than those on final goods. To protect the glass
stry in the U.S., for instance, cathode-ray tubes are regarded as a final TV product in
val. See the discussion on government
tandard system and its annual changesInsufficient capability of supporting industry, lack of supporting industry promotion
3 Sudden changes and instability in PROSEC-applied products as a substitution ofMaquiladora system.
4 Uncertainty of policies on transitions from Maquiladora related to permanentestablishments, value added taxes, and others.
5 Continual tariff increases, high tariffs.
6 Expansion of tariff differences between countries with RTAs and those without,participation in international bidding by only those with FTAs.
7 Excessive preferential arrangements for labor such as profit sharing and wage/retirementpayment system, cost elevation due to wage increases, difficulty in meeting labor demand.
8 Delay and complexity due to peculiar NOMS s
enou
legal systems and other laws cause additional c
Since legal regulations and laws are often changed, and their interpretation depends on
government officials, negotiations with governments – and even lawsuits – are sometimes
required, entailing additional costs for firms. Thus, it seems to be quite difficult for small and
medium-sized enterprises (SMEs) to enter the Mexic
indu
Mexico when the image simply comes up on the panel, reflecting the power of the U.S. lobby.
This kind of interpretation and implementation of Mexican commercial policies is to protect
mestic indusdo tries in the U.S.
Another invisible barrier for MNEs is that Mexican commercial policies favor FTA-member
countries in many circumstances beyond tariff remo
procurement below.
158

Worsening Security
Security has been worsening, particularly in Tijuana and Mexico City, where the operations of
East Asian MNEs are concentrated,. For security reasons, for example, Japanese staff
belonging to factories in Tijuana lives in San Diego (in the United States), commute to their
factories in Tijuana, Mexico from their San Diego offices by company bus, and return to San
Diego by bus through time-consuming immigration processes every day. Facilitating the
movement of laborers between the U.S. and Mexico is desired, at least for those who have to
cross the border every day due to their operations in Maquiladora and security problems.
Trucks are robbed of their loads – parts, components, or final products – more frequently than
before. Worsening security hinders the smooth business operations of companies and requires
additional costs for production in Mexico.
Labor-Related Issues
wage rates cannot be lowered; a
guideline for raising wages is issued every year. In the Tijuana area, wage rates have been
ason are around three
The Labor Act in Mexico favors laborers. For instance,
raised by three to four percent per year during the last few years. In addition, the employment
of temporary workers is severely restricted by the Labor Act to three-month contracts up to a
maximum of one year. Thus, it is very difficult for firms to adjust the number of workers
according to changes in production/demand, though sales in the peak se
to four times sales in the low season in the electronic machinery industry. Furthermore, there is
no retirement age, and thus firms have to provide workers with substantial compensation to
have workers leave their jobs. Other example in favor of laborers is that lawsuits are always
decided in favor of laborers.
Turnover ratios are high. One of the reasons is job-hopping. Another reason is that some
workers do not come back to work after long holidays. Many workers are from outside the city
where the factory is located. Thus, they go back to their hometowns for the Christmas holidays,
etc., to stay with their families and relatives, and some of them decide not to come back to work.
Insufficient Infrastructure and Logistics
The capacity of some ports in Mexico is insufficient. Although there is a port at Ensenada near
road, they often use the U.S. port at Long Beach in Los Angeles and then
Tijuana, for instance, it is too shallow for large vessels to enter and it has insufficient docks.
Therefore, when Japanese firms (and other MNEs) operating at Tijuana import parts and
components from ab
159
transport the imported parts and components to their factories in Mexico by truck. Another
issue in this type of operation exists. The port at Long Beach is sometimes much too crowded,
exico
(strictly speaking, from the U.S. side of the U.S.-Mexico border) to major department stores and
Roads on the Mexican side have not been well developed or maintained, a particularly serious
ng precision machinery parts and components.
and thus it takes a long time to have parts and components transported to the factories even
after they are on board; in the worst cases, factories have to wait for two weeks. Considering
the serious situation of purchasing parts and components in terms of logistics and timing,
Japanese firms are sometimes forced to use air shipments with much higher costs.
In the electronic machinery industry, all of the logistics on the U.S. side are done by the U.S.
logistics firms, including cases when final products are distributed by firms located in M
other retailers in the U.S. Even for logistics on the U.S. side, there are difficulties in securing
the needed number of trailers, headers, and drivers in the peak season.
problem when transporti
The supply of electricity power has become stable. The prices, however, go up when the
consumption of electricity goes up. Therefore, costs rise in the peak season of production in the
electronic machinery sector.
Lack of Supporting Industries
Due to the lack of supporting industries in the electronic machinery industry, a large portion of
parts and components are imported from East Asian countries. The quality of goods produced
by local indigenous firms has improved. However, when a firm attempts to introduce new
environmentally friendly standards for their parts and components, for instance, the local
indigenous suppliers cannot necessarily adopt them.
Inefficient Custom Procedures
Customs procedures are said to be inefficient. In many export processing zones in developing
East Asian countries, customs clearance can be done when containers depart from factories. In
introduced in bonded areas. Such a system would
partially but significantly facilitate customs procedures.
Mexico, this sort of system has rarely been
Problems Regarding Intellectual Property Rights
Pirated software and various other illegal goods produced in China or Mexico can be found in
160

the Mexican market, and they are sold at much lower prices than the genuine goods.
Collection System for Receivables
There are difficulties in collecting receivables, and thus a collection system for receivables must
be established.
(3) FTA/EPA-Related Issues (Including Future Prospects)
Government Procurement
Government procurement in Mexico is basically supposed to be domestic procurement.
r countries is extremely
difficult or impossible. So far, East Asian countries have rarely been able to participate in
exico.
International bidding, however, is allowed among FTA/EPA member countries under certain
constraints.89 In other words, international bidding by non-FTA membe
international bidding limited to FTA-member countries. The implementation of the Japan-
Mexico EPA in April 2005 has at least provided Japanese firms with the right to participate in
such international bidding in M
Japan-Mexico EPA
With the enforcement of the Japan-Mexico EPA, Japanese affiliates in Mexico can purchase
parts and components or capital goods from Japan with lowered/no import tariffs. Japanese
firms in Mexico, particularly in the electronic machinery sector, however, purchase their parts
and components not only from Japan but also from other East Asian countries such as Malaysia,
Thailand, and China (partially through Hong Kong). In addition, there are cases where parts
used in products they purchase even from other
Japanese affiliates in Mexico. Therefore, the Japan-Mexico EPA might not bring a significant
includes a chapter referring to the improvement of the business environment. Japan and
a more favorable business environment to
promote trade and investment activities by their private enterprises and from time to time
and components originally made in Asia are
benefit, in terms of additional costs due to trade measures, for those firms using a large amount
of imports of parts and components from Asian countries other than Japan.
What is a very important outcome of the Japan-Mexico EPA beyond tariff removal is that it
Mexico have confirmed their commitment to creating
89 Mexico has 12 FTA/EPAs with 43 economies.
161

holding consultations on the business environment between Japan and Mexico. At the same
time, they have agreed to establish a committee for the improvement of the business
panies; the Japan External Trade Organization (JETRO),
Camara Japonesa de Comercio e Industria de Mexico. A.C., and the Japanese Maquiladora
ess environment in Mexico.
obile sector, as discussed above, there is a non-tariff import quota for finished cars
at can be transferred to other
automobile producers in the same auto group. Since the enforcement of the EPA with Mexico,
riff quota that is equivalent to five percent of the domestic sales of
automobiles in Mexico per year. In addition, the tariff on automobiles, which was 50 percent
ease in investment by Japanese automobile producers
without production sites in Mexico. For instance, Isuzu has just established an affiliate in
Japanese trading company, to distribute automobiles imported from Japan
not only in the Mexican market but also in the North American market, considering the reduced
environment that includes private com
Association (JMA) have participated in the committee as representatives of private parties to
improve the busin
In the autom
dependent on the production of automobiles in Mexico th
Japan has obtained a non-ta
until March 2005, is supposed to be gradually reduced and removed within six years from the
enforcement of the EPA. One of the possible effects is that Japanese automobile producers
with production sites in Mexico, who could utilize some of the non-tariff quota under the Japan-
Mexico EPA as well, will transfer their own non-tariff quota of finished cars to Korean
automobile producers and others in the same auto group.
Another important effect is an incr
Mexico, jointly with a
tariffs on finished cars under the Japan-Mexico EPA. It will start exporting small-sized trucks
from Japan to its affiliate in October 2005 and might also start local production in Mexico in the
future with the cooperation of GM, the largest shareholder of Isuzu.
Korea- and China-Related Issues
Korea has already started a study group to examine an FTA with Mexico, while China has
already established high-level dialogue with Mexico to identify potential business opportunities
and to address Sanitary and Phytosanitary (SPS) measures and illegal trade; the aim is to
strengthen economic relations between the two countries rather than to conclude an FTA
China has been exporting its TVs to the US and other countries since 2000. Chinese TVs are
between them.
Regarding TV production, China has a domestic demand of 20 million but has a production
capacity of 40 million TVs with a cheap labor force (one-fourth or less the wages in Mexico).
162
cheaper by 20-30 percent, and the United States has imposed anti-dumping (AD) duties on TVs
imported from China.
Apparel made in China is sometimes treated as “NAFTA origin” (for instance, apparel produced
by U.S. affiliates in China), and accounts for more than 60% of the market.
In the automobile sector, Chinese automobile producers will not get a significant market share
Economy (Secretaria de Economia)
presented “Concrete actions to increase competitiveness (Acciones concretas para incrementar
tion on the instrument of
tation, preparations, and the expected effects of each
policy.
n future so that they will be close to the lowered preferential tariffs applied
to the U.S. Other important purposes of i) trade policies include the simplification and
for at least the next decade or so. In China, there exist only joint ventures with Chinese firms
(foreign capital shares of less than 50%).
(4) Policies Adapted by The Government to Deal with Issues/Impediments
In Mexico, the necessity of strengthening international competitiveness has been often
addressed these days. In order to improve competitiveness, the Mexican government has
made various efforts, including those that directly and indirectly influence trade and investment
patterns. As one such effort, for instance, the Ministry of
la competitivedad)” in October 2004. Aiming at clarifying government policies and realizing
them, this action plan classifies 74 policies/measures that were and will be individually planned
and implemented during 2001-2006 into four categories – i) trade policies (politica commercial)
(14 policies), ii) sectoral policies (policies sectorial) (49 policies), iii) development of domestic
markets (desarrollo del mercado interno) (seven policies), and iv) innovation and development
of high value-added technology and services (innovation, desarrollo tecnologico y servicios de
alto valor agregado) (four policies) – and summarizes informa
implementation, the date of implemen90
One of the main purposes of i) trade policies is to lower MFN tariffs on raw materials and
machines/equipment. MFN tariffs are at first to be reduced to pre-1998 levels when those on
10,000 items (85 percent of total tariff lines) were raised by three percent or 10 percent, and are
to be further reduced i
computerization of administrative procedures. As an important part of logistics, for example,
90 The detailed contents of “Acciones concretas para incrementar la competitivedad” can be downloaded at the following website: http://www.economia.gob.mx/?P=2025 .
163

cases that require prior permission for imports will be limited to the lowest levels to improve the
temporal and physical costs of customs procedures.91
PROSEC, lowering
tariffs in the automobile, iron/steel and other industries, hosting FDI, and developing a loan
The policies for iii) development of domestic markets include those aimed at modernization of
omestic markets, improvement of logistics, and further utilization of government procurement.
The policies for iv) innovation and development of high value-added technology and services
th cheap labor;
by both government and private parties to improve the business environment have also
been made within the framework of FTAs/EPAs such as the Japan and Mexico EPA (as
The purposes of policies categorized as ii) sectoral policies include lowering tariffs on raw
materials in the textile, leather, footwear and other industries by utilizing
system. Lowering tariffs in general/by sector is aimed at not only decreasing the cost of
production, using imported raw materials and machinery, but also reducing smuggling.
d
aim at producing high value-added products rather than products produced wi
the major goals include attracting production sites for the next-generation models of home
electronics and cellular phones, and attracting the semiconductor industry to the northern part of
Mexico.
Another approach taken by the Mexican government worth mentioning is the implementation of
an “administrative procedure moratorium,” which prohibits the establishment of new
administrative procedures by the central government and government agencies. The “agenda
of competitiveness (agenda de competitividad)” adopted by the Fox administration has five
themes – i) logistics, ii) business environment, iii) energy, iv) finance, and v) innovation and
human capital development – and this moratorium is one of the more important policies for
improving the ii) business environment. The moratorium originally targeted the period from May
13, 2004 to April 29, 2005, but the period was extended until the end of November 2006,
reflecting the success achieved in simplifying administrative procedures.
Efforts
discussed above). In addition, a Competitiveness Committee has been established in the
Mexican Senate.
91 In Mexico, only those who have registrations are permitted to import. Furthermore, registration to import
ortadores”. sensitive products for the domestic economy is distinct from registration to import general products; the former is called “Padron Sectorial” and the latter “Padron de imp
164

555... CCCOOONNNCCCLLLUUUDDDIIINNNGGG RRREEEMMMAAARRRKKKSSS:::
SSSOOOMMMEEE SSSUUUGGGGGGEEESSSTTTIIIOOONNNSSS FFFOOORRR TTTHHHEEE PPPRRROOOMMMOOOTTTIIIOOONNN OOOFFF TTTRRRAAADDDEEE AAANNNDDD FFFDDDIII
rease in
trade and FDI between the partner countries. Specifically, the Chile-Korea FTA resulted in an
Our study examined trade and FDI barriers for selected East Asian and Latin American
t Bank as well as the
information obtained from our interviews with business people, government officials, and
opolistic measures, and technical measures. It was found that the types
of NTMs used by East Asian and Latin American countries differ; East Asian countries tend to
use quantity control measures while Latin American countries tend to depend on technical
measures.
BBBEEETTTWWWEEEEEENNN EEEAAASSSTTT AAASSSIIIAAA AAANNNDDD LLLAAATTTIIINNN AAAMMMEEERRRIIICCCAAA
Trade and FDI between East Asia and Latin America remain significantly small in spite of recent
increases in trade and FDI involving rapidly growing China. In addition, the establishment of
free trade agreements involving countries across the Pacific has contributed to an inc
increase in exports of Korean cars to Chile, while it contributed to the expansion of Chilean wine
sales in Korea. The enactment of the Japan-Mexico FTA has reportedly resulted in an increase
in FDI by Japanese automobile companies in Mexico. In light of the difficulties in promoting
multilateral trade negotiations (Doha Development Agenda, or DDA) under the WTO because of
differing views on DDA among the WTO members, FTAs involving countries on both sides of
the Pacific can be an effective policy option for promoting trans-Pacific trade and FDI.
countries. For identifying trade barriers we examined tariff and non-tariff barriers or non-tariff
measures (NTMs). Our examination revealed that, for all the countries under study, tariff
barriers have come down significantly in recent years, although there still remains room for
further reduction for many countries excluding Singapore, whose tariff rates for many products
are already zero. Between East Asian and Latin American countries, the average tariff rates in
East Asian countries are lower than those in Latin America. However, it is important to note that
the coverage of tariff binding is greater for Latin American than for East Asia. These
observations point to room for further trade liberalization. An investigation of NTMs by using
information collected by UNCTAD and the Inter-American Developmen
academic researchers reveals various NTMs. An examination of UNCTAD and Inter-American
Development Bank databases on NTMs indicates that both East Asian and Latin American
countries use a wide variety of NTMs such as price controls, automatic licensing measures,
quantity controls, mon
To examine FDI impediments we relied on mainly two types of information. One was the results
of surveys conducted by business associations and others. The other source of information
165

was
acce (entry barriers), restrictions on fo
our interviews. We found a variety of FDI impediments, including restrictions on market
ss reign exchange transactions, performance
requirem t the degree of
seriousn lthough it is difficult to make an overall
assessment of FDI impediments for the countries studied because of a lack of numerical
tribute to
expanding trade and FDI. One important factor for promoting trade and FDI between East Asia
governments may find it advisable to establish a comprehensive FTA, economic
partnership agreement (EPA), or comprehensive economic partnership agreement (CEPA) in
ents such as export requirements, and others. We also found tha
ess of the impediments vary among countries, a
indicators such as tariffs in the case of foreign trade.
There exist a variety of trade and FDI impediments. However, the governments of the countries
under study have adopted various policies and measures to promote trade and FDI, as they
recognize the important roles that trade and FDI could play in achieving economic growth.
Some of these measures include simplification of administrative procedures for trade and FDI
and provision of FDI incentives such as tax relief.
Although we recognize the efforts of the governments in promoting trade and FDI by various
measures, we would like to make several policy recommendations that would con
and Latin America is to increase and deepen mutual understanding between countries of their
respective markets, people, and societies. Without knowing each other, East Asia and Latin
America cannot find business opportunities that would give rise to trade and FDI. Specifically,
interpersonal exchanges between the two regions at all levels, ranging from top leaders to
students, should be enhanced by establishing a variety of exchange programs. To supplement
face-to-face communications through personal exchange, communications via TV conferences
and other telecommunications channels should be strongly pursued.
We would also propose that governments establish FTAs both bilaterally and multilaterally.
FTAs should be comprehensive in that they contain not only trade and FDI liberalization but
also trade and FDI facilitation. Inclusion of facilitation is important because many impediments
involve systems and procedures, which can be dealt with by facilitation but not by liberalization.
Moreover, FTAs should also include economic cooperation programs that would contribute to
implementing facilitation measures. For example, introduction and enforcement of intellectual
property rights protection in developing countries, which would promote FDI, requires not only a
legal framework but also capable personnel to run the system effectively. Development of such
human resources may be realized with economic cooperation from developed countries.
Indeed, the
order to establish a comprehensive framework for promoting trade and FDI, which in turn would
contribute to economic growth.
166
We do hope this report will be of use for policy makers, who are responsible for formulating and
implementing trade and FDI policies, as well as for a number of business people who are daily
engaged in the development of new relationships in these regions. Since there are a variety of
trade and FDI impediments, we could not identify or examine all of them. We hope further
investigation of trade and FDI impediments will continue so that we may achieve freer trade and
a more favorable FDI environment, which would promote economic growth by increasing trade
and FDI.
167

666... RRREEEFFFEEERRREEENNNCCCEEESSS The American Chamber of Commerce in Japan (ACCJ). From Goals to Reality: FDI Policy in Japan. Tokyo: The American Chamber of Commerce in Japan, 2003.
Ando, Mitsuyo. “The Pervasiveness of Non Tariff Measures in APEC Countries.” COE Discussion Paper 0201. Tokyo: Keio University, 2002
Ando, Mitsuyo, and Antoni Estevadeordal. “Trade Policy Formation in Latin America and Asia-Pacific: A Comparative Analysis.” COE Discussion Paper 2004-27. Tokyo: Keio University, 2004. The previous version was presented at LAEBA panel at 11th FIEALC (Federacion Internacional de Estudios sobre America Latina y el Caribe) 2003 Osaka “Globalization in Asia and Latin America: Trade, Investment, and Finance.”
Ando, Mitsuyo. “Estimating Tariff Equivalents of Non-tariff Measures in APEC Member Economies.” In Philippa Dee and Michael Ferrantino eds. Quantitative Methods for Assessing the Effects of Non-Tariff Measures and Trade Facilitation. World Scientific, 2005
Ando, Mitsuyo. “Fragmentation and Vertical Intra-industry Trade in East Asia.” Forthcoming in North American Journal of Economics and Finance (after final review). The previous version was appeared in COE discussion paper 2004-25. Tokyo: Keio University, 2005
Ando, Mitsuyo, and Fukunari Kimura. “The Formation of International Production and Distribution Networks in East Asia.” In Takatoshi Ito and Andrew Rose, eds. International Trade (NBER-East Asia Seminar on Economics 14), Chicago: The University of Chicago Press, 2005. The former version was appeared in NBER Working Paper 10167.
Baldwin, R. “A Domino Theory of Regionalism.” in R. Baldwin, P. Haaparanta, and J. Kiander eds. Expanding Membership of the EU. Cambridge, UK: Cambridge University Press, 1996.
Benes, Nicholas E. “Kin-yu kaikaku puroguramu kakushin wo kiku 2: ‘yusei’ furezu kakuron D hyouka.” Nikkei Kin-yu Shimbun, 1 February 2005, p.1.
Brown, Lester. “Chuugoku don-yoku na shigen shouhi.” Yomiuri Shimbun, 2 May 2005, p.1.
Japan External Trade Organization (JETRO). 2004 JETRO White Paper on International Trade and Foreign Direct Investment (Summary). Tokyo: JETRO, 2004. http://www.jetro.go.jp/en/stats/white_paper/004.pdf 27 March 2005.
Japan External Trade Organization (JETRO). JETRO boueki toushi hakusho 2004. Tokyo: JETRO, 2004.
Japan External Trade Organization (JETRO). Shinten suru chuunanbei ikinai sabisu kyoten to gurobaru shigen syokuryou seisan no shuuseki (chili). Tokyo: JETRO, 2005. http://www.jetro.go.jp/biz/world/cs_america/cl/reports/05000921?print=1 27 March 2005.
Japan External Trade Organization (JETRO). Nihon no makuro keizai doukou (2005-nen 3-gatsu). Tokyo: JETRO, 2005. http://www.jetro.go.jp/jpn/reports/05000916?print=1 27 March2005.
Japan External Trade Organization (JETRO). Sekai to nihon no shuyou na FTA ichiran. Tokyo: JETRO, 2005. http://www.jetro.go.jp/jpn/reports/05000906?print=1 27 March 2005.
169

Japan Machinery Center for Trade and Investment. Issues and Requests relating to Foreign Trade and Investment in 2004. Tokyo: Japan Machinery Center for Trade and Investment, 2005. http://www.jmcti.org/mondai/top_e.html 27 March 2005.
Japan PECC. An Assessment of Impediments to Foreign Direct Investment in APEC Member Economies. Tokyo: Japan PECC, 2002.
Kimura, Fukunari, and Mitsuyo Ando. “Fragmentation and Agglomeration Matter: Japanese Multinationals in Latin America and East Asia.” North American Journal of Economics and Finance 14, no.3 (2003), 287-317.
Kimura, Fukunari, and Mitsuyo Ando. “Two-dimensional Fragmentation in East Asia: Conceptual Framework and Empirics”. International Review of Economics and Finance 14 (2005a), 317-348.
Kimura, Fukunari, and Mitsuyo Ando. “The Economic Analysis of International Production/Distribution Networks in East Asia and Latin America: The Implication of Regional Trade Arrangements” Business and Politics 7, no.1 (2005b), Article 1.
Kimura, Fukunari and Mitsuyo Ando. “Jiyuu boueki kyoutei to nougyou mondai (Free Trade Agreements and Controversy about Agricultural Protection).” Mita Gakkai Zasshi (Mita Journal of Economics) 95, no. 1 (2002), 111-137.
Kishida, Hideki. “FTA in ASEAN.” Economic Research 04-003. Tokyo: Nomura Securities (In Japanese), 2004a.
Kishida, Hideki. “FTA in ASEAN.” Economic Research 04-011. Tokyo: Nomura Securities (In Japanese), 2004b.
Ministerio de Economia, Gobierno de Chile. Quinto Catastro Nacional Sobre Barreras Externas al Comercio: 2004. Santiago de Chile: Ministerio de Economia, Gobierno de Chile, 2004.
The Ministry of Economy Trade and Industry. Japan’s Policy on FTAs/EPAs. Tokyo: The Ministry of Economy Trade and Industry, 2005. http://www.meti.go.jp/english/information/downloadfiles/FTAprogress200503.pdf 27 March 2005.
Naikakufu (The Cabinet Office). Getsurei keizai houkoku (getsuji). Tokyo: Naikakufu (Cabinet Office), January 2003 – December 2004. http://www5.cao.go.jp/keizai3/getsurei.html 27 March 2005.
Organization for Economic Co-operation and Development (OECD). OECD Economic Outlook 76, no. 2, Paris: OECD, 2005.
Pangestu, Mari. “Industrial Policy and Developing Countries” in Bernard Hoekman, Philip English and, Aaditya Matto eds. Development, Trade, and the WTO: A Handbook. Washington D.C.: World Bank, 2003.
170