A study on the impacts toward the loyalty of the employee...
116
A STUDY ON THE IMPACTS TOWARDS THE LOYALTY OF THE EMPLOYEE AMONG THE BACK OF HOUSE STAFFS IN HOTEL INDUSTRY BY KEE HUI POO LOW PEI WA OOI CHONG KING SAM MAN KEONG TENG CHOON HOU A research project submitted in partial fulfillment of the requirement for the degree of BACHELOR OF BUSINESS ADMINISTRATION (HONS) UNIVERSITI TUNKU ABDUL RAHMAN FACULTY OF BUSINESS AND FINANCE DEPARTMENT OF BUSINESS AUGUST 2012
Transcript of A study on the impacts toward the loyalty of the employee...
A STUDY ON THE IMPACTS TOWARDS THE
LOYALTY OF THE EMPLOYEE AMONG THE BACK
OF HOUSE STAFFS IN HOTEL INDUSTRY
BY
KEE HUI POO
LOW PEI WA
OOI CHONG KING
SAM MAN KEONG
TENG CHOON HOU
A research project submitted in partial fulfillment of the
requirement for the degree of
BACHELOR OF BUSINESS ADMINISTRATION (HONS)
UNIVERSITI TUNKU ABDUL RAHMAN
FACULTY OF BUSINESS AND FINANCE
DEPARTMENT OF BUSINESS
AUGUST 2012
A study on the impacts toward the loyalty of the employee among the back of house staffs in hotel industry. 2012
ii
Copyright @ 2012
ALL RIGHTS RESERVED. No part of this paper may be reproduced,
stored in a retrieval system, or transmitted in any form or by any means,
graphic, electronic, mechanical, photocopying, recording, scanning, or
otherwise, without the prior consent of the authors.
A study on the impacts toward the loyalty of the employee among the back of house staffs in hotel industry. 2012
iii
DECLARATION
We hereby declare that:
(1) This undergraduate research project is the end result of our own work and that
due acknowledgement has been given in the references to ALL sources of
information be they printed, electronic, or personal.
(2) No portion of this research project has been submitted in support of any
application for any other degree or qualification of this or any other university,
or other institutes of learning.
(3) Equal contribution has been made by each group member in completing the
research project.
(4) The word count of this research report is _____________________________.
Name of Student Student ID Signature
1. KEE HUI POO 09ABB08132 ____________________
2. LOW PEI WA 10ABB03620 ____________________
3. OOI CHONG KING 09ABB06296 ____________________
4. SAM MAN KEONG 10ABB06010 ____________________
5. TENG CHOON HOU 10ABB06084 ____________________
Date: 17th August 2012
A study on the impacts toward the loyalty of the employee among the back of house staffs in hotel industry. 2012
iv
ACKNOWLEDGEMENT
We are students from the Faculty of Business and Finance (FBF), our research project
has been successfully done with the assistance of various authorities. Therefore, we
would like to take this opportunity to acknowledge the contribution parties who have
helped and guided us in completing this project.
Firstly, we would like to thank UTAR. It is because UTAR gives provide us a course
to participate in this thesis. Next, we would like to give our greatest gratitude and
appreciation to our project supervisor, Ms. Ophelia Ann Fredericks, who has provided
us a lot of assistance, guidance and advice throughout this research. Besides, we
would also like to thank to all the lecturers who have shared their knowledge and
information regarding the usage of SPSS and other relevant theories in this research.
In addition, we would like to thank our family members for gave us physical,
financial and mental support during research period. We also grateful to the
contribution and collaboration from friends in terms of ideas and discussion had
helped us towards the completion of the research. Hence, we are sincerely appreciated
to our family members and friends.
Furthermore, we would like to appreciate to all the respondents who spend their
precious time and efforts in helping us filled up the questionnaires. The valuable
information they given enabled us to analyze and complete the research.
Finally, the contributions from the group members in time, efforts, ideas and
knowledge for the completion of this research are appreciated. We are fully
corporative with each other and willing to sacrifice our valuable time and involve in
completing this research project. Once again, we are truly grateful and honestly
thankful to all the people who assist us in our research project.
A study on the impacts toward the loyalty of the employee among the back of house staffs in hotel industry. 2012
v
DEDICATION
We would like to dedicate this dissertation to our beloved parents who provide us the
opportunity to pursue studies in UTAR. Besides, they are the backbone for us to
complete this dissertation by supporting us in term of finance and mental.
Next, we will dedicate to our respected supervisor, Ms. Ophelia Ann Fredericks, who
provides motivation, guideline, and valuable suggestion to us and gave us the
inspiration in doing this research paper.
Lastly, we will dedicate ourselves for the cooperation, motivation, support and
tolerance to each other whenever the occurrence of conflicts in this research paper.
A study on the impacts toward the loyalty of the employee among the back of house staffs in hotel industry. 2012
vi
TABLE OF CONTENTS
Page
Copyright…………………………………………………………………….………ii
Declaration………………………………………………………………….……….iii
Acknowledgement………………………………………………………….……….iv
Dedication……………………………………………………………………………v
List of Tables………………………………………………………….……...…….xii
List of Figures……………………………………………………………...………xiii
List of Appendices ………………………………………………………………...xiv
List of Abbreviations ……………………………………………………….……...xv
Preface………….……………………………………………………………..……xvi
Abstract………………………………………………………………….……..….xvii
CHAPTER 1 Introduction……………………………………….………………….1
1.0 Introduction………………………………………………………1
1.1 Research Background…………………….………………………1
1.2 Problem Statement……………………….……………………....3
1.3 Research Objective………………………………………………4
1.3.1 General Objective……………………………………...4
1.3.2 Specific Objectives…………………………………….4
1.4 Research Questions………………………………………………5
1.5 Hypothesis of the Study……………………………………….....6

A study on the impacts toward the loyalty of the employee among the back of house staffs in hotel industry. 2012
vii
1.6 Significant of the Study………………………………………….7
1.6.1 Individual Perspective…………………………………7
1.6.2 Organization Perspective………………………………7
1.7 Chapter Layout……………………………………………….......8
1.8 Conclusion………………………………………….……………9
CHAPTER 2 Review of Literature………………………………………………..10
2.0 Introduction……………………………………………………..10
2.1 Review of Literature……………………………………………10
2.1.1 Dependent variable…………………………………...10
2.1.2 Relationship with Supervisor…………………………12
2.1.3 Reward and Recognition….………………………….13
2.1.4 Teamwork and Cooperation……………….………….14
2.1.5 Working Condition…………………………………...15
2.2 Review of Relevant Theoretical Framework…………….……..17
2.2.1Theoretical models of Employee Loyalty……………..17
2.3 Proposed Theoretical Framework………………………………21
2.4 Hypothesis Development……………………………………….22
2.4.1 Relationship with Supervisor…………………………22
2.4.2 Reward and Recognition……………………………..23
2.4.3 Teamwork and Cooperation…………………………..24
2.4.4 Working Condition………………………...…………25
A study on the impacts toward the loyalty of the employee among the back of house staffs in hotel industry. 2012
viii
2.4.5 Dependent Variable VS Independent Variable……….26
2.5 Conclusion……………………………………………………...26
CHAPTER 3
METHODOLOGY……………………………………………….……...27
3.0 Introduction……………………………………………………..27
3.1 Research Design………………………………………………..27
3.2 Data Collection Method………………………………………..28
3.2.1 Primary Data…………………………………….…....28
3.2.2 Secondary Data…………………………………….…28
3.3 Sampling Design………………………………………………..29
3.3.1 Target Population……………………………………..29
3.3.2 Sampling Frame and Sampling Location……………..29
3.3.3 Sampling Elements…………………………………...30
3.3.4 Sampling Techniques…………………………………30
3.3.5 Sampling Size………………………………………...31
3.4 Research Instrument………………………………………........31
3.4.1 Purpose of Using Questionnaire……………………...31
3.4.2 Questionnaire Design…………………….…………...32
3.4.3 Pilot Test………………………………….…………..33
3.5 Construct Measurement…………………………….…………..33
A study on the impacts toward the loyalty of the employee among the back of house staffs in hotel industry. 2012
ix
3.6 Data Processing…………………………………………….…...35
3.7 Data Analysis…………………………………………………...37
3.7.1 Descriptive Analysis………………………………….37
3.7.2 Scale Measurement…………………………………...37
3.7.3 Inferential Analysis…………………………………...38
3.8 Conclusion……………………………………………………...38
CHAPTER 4 DATA ANALYSIS…………………………………………………39
4.0 Introduction……………………………………………………..39
4.1 Descriptive Statistics……………………………………………39
4.1.1 Respondents’ Demographic Profile…………………..40
4.1.1.1 Gender………………………………………40
4.1.1.2 Ethnic….. …………………………………..41
4.1.1.3Marital Status…………………………………42
4.1.1.4 Age..........................................................…...43
4.1.1.5 Working Position………………………….....45
4.1.1.6 Education Level...............................................47
4.1.1.7 Working Experience………………..……......48
4.1.2 Central Tendencies Measurement of Construct……….50
4.1.2.1Reward and Recognition...................................50
4.1.2.2Working Condition...........................................51
4.1.2.3 Relationship with Supervisor…….......51
A study on the impacts toward the loyalty of the employee among the back of house staffs in hotel industry. 2012
x
4.1.2.4 Teamwork and Cooperation………..……...52
4.1.2.5 Employee Loyalty…………………………..53
4.2 Scale Measurement……………………………………………..54
4.2.1 Internal Reliability Test……………………………....54
4.3 Inferential Analysis …………………………………………….56
4.3.1 Pearson Correlation Coefficient………………….…..56
4.3.1.1 Hypothesis 1………………………………..57
4.3.1.2 Hypothesis 2…………………………...……58
4.3.1.3 Hypothesis 3………………………….….….59
4.3.1.4 Hypothesis 4………………………..……….59
4.3.2 Multiple Regression Analysis…………….………….60
4.4 Conclusion……………………………………………………...62
CHAPTER 5 Discussions, Implications and Conclusion…………………63
5.0 Introduction……………………………………………..………63
5.1 Summary of Statistical Analysis…………………………….….63
5.1.1 Respondents’ Demographic Profile……………….….63
5.1.2 Central Tendencies Measurement of Construct……...63
5.1.3 Scale Measurement…………….…….……………….64
5.1.3.1 Internal Reliability Test…………………….64
5.1.4 Summary of Inferential Analysis ……..….….……….64
5.1.4.1 Pearson’s Correlation Analysis…………….64
5.1.4.2 Multiple Regression Analysis……………....65
A study on the impacts toward the loyalty of the employee among the back of house staffs in hotel industry. 2012
xi
5.2 Discussion on Major Findings……………….…………65
5.3 Implications of the Study…………………….…………66
5.3.1 Managerial Implications……………………..66
5.4 Limitations of the Study………………………………..69
5.5 Recommendations for Future Research………………..70
5.6 Conclusion…………………………………….………..70
References………………………………………………………….…….…71
Appendices………………………………………………………….………79
A study on the impacts toward the loyalty of the employee among the back of house staffs in hotel industry. 2012
xii
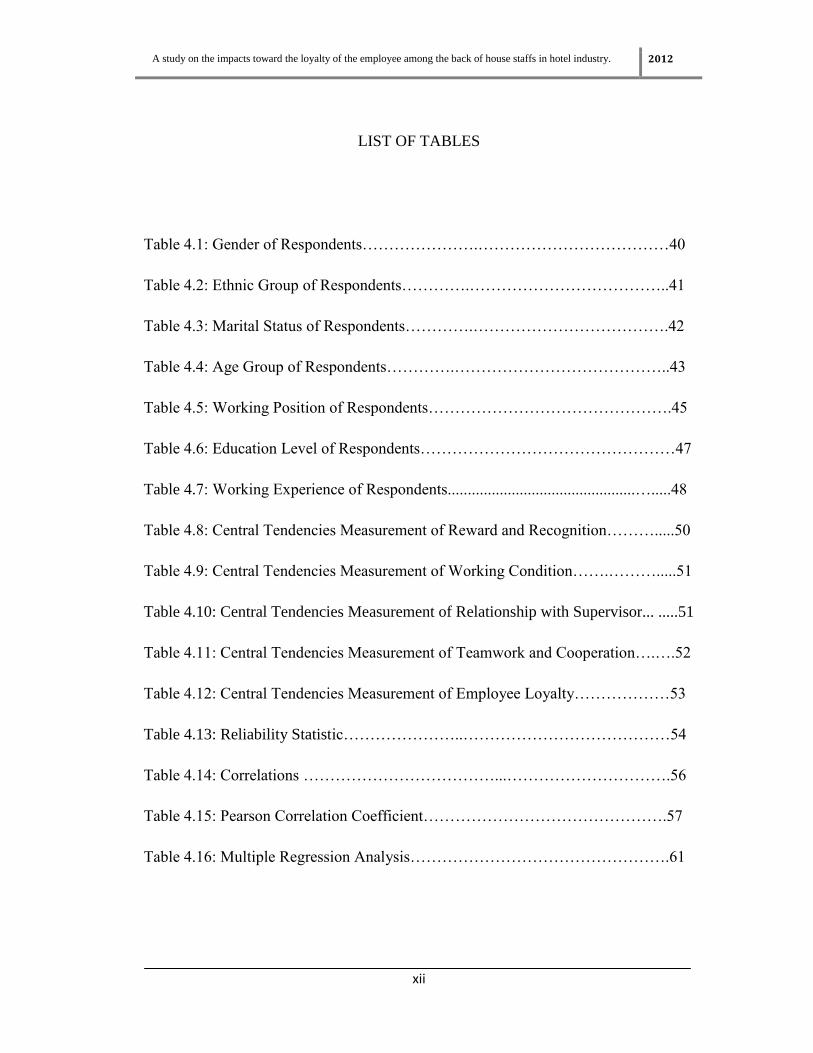
LIST OF TABLES
Table 4.1: Gender of Respondents………………….………………………………40
Table 4.2: Ethnic Group of Respondents………….………………………………..41
Table 4.3: Marital Status of Respondents………….……………………………….42
Table 4.4: Age Group of Respondents………….…………………………………..43
Table 4.5: Working Position of Respondents……………………………………….45
Table 4.6: Education Level of Respondents…………………………………………47
Table 4.7: Working Experience of Respondents...............................................….....48
Table 4.8: Central Tendencies Measurement of Reward and Recognition……….....50
Table 4.9: Central Tendencies Measurement of Working Condition…….……….....51
Table 4.10: Central Tendencies Measurement of Relationship with Supervisor... .....51
Table 4.11: Central Tendencies Measurement of Teamwork and Cooperation….….52
Table 4.12: Central Tendencies Measurement of Employee Loyalty………………53
Table 4.13: Reliability Statistic…………………..…………………………………54
Table 4.14: Correlations ………………………………...………………………….56
Table 4.15: Pearson Correlation Coefficient……………………………………….57
Table 4.16: Multiple Regression Analysis………………………………………….61
A study on the impacts toward the loyalty of the employee among the back of house staffs in hotel industry. 2012
xiii
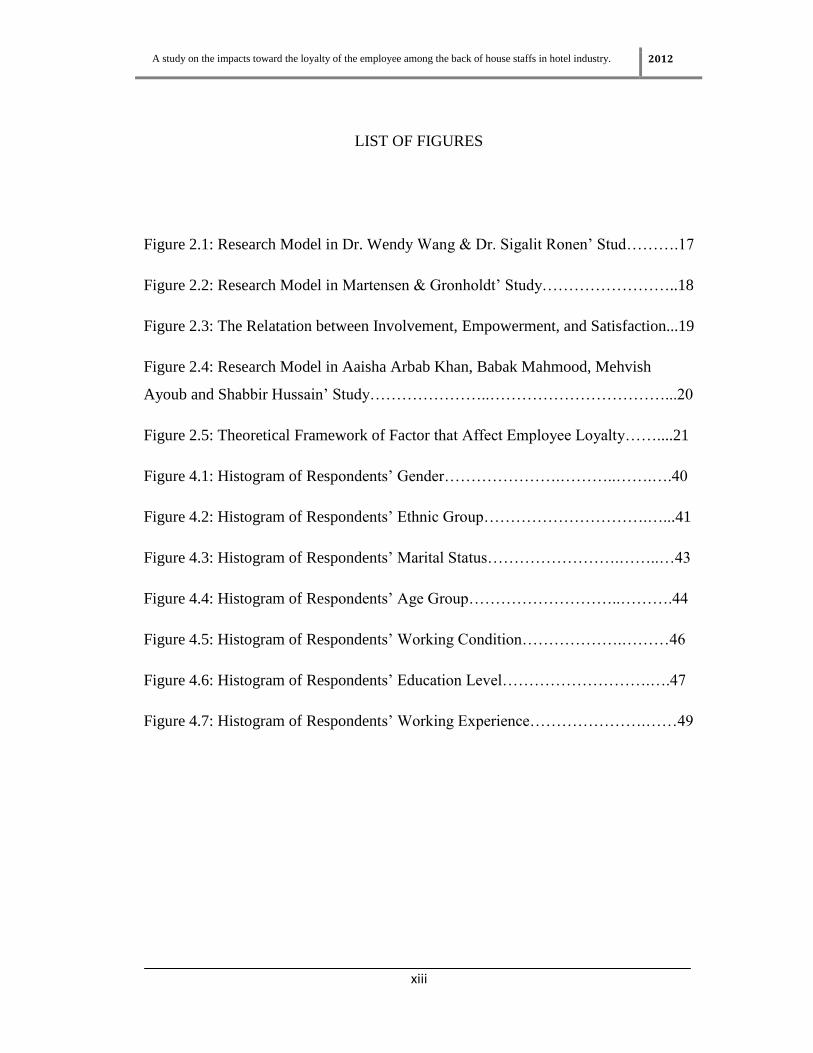
LIST OF FIGURES
Figure 2.1: Research Model in Dr. Wendy Wang & Dr. Sigalit Ronen’ Stud……….17
Figure 2.2: Research Model in Martensen & Gronholdt’ Study……………………..18
Figure 2.3: The Relatation between Involvement, Empowerment, and Satisfaction...19
Figure 2.4: Research Model in Aaisha Arbab Khan, Babak Mahmood, Mehvish
Ayoub and Shabbir Hussain’ Study…………………..……………………………...20
Figure 2.5: Theoretical Framework of Factor that Affect Employee Loyalty……....21
Figure 4.1: Histogram of Respondents’ Gender………………….………..…….….40
Figure 4.2: Histogram of Respondents’ Ethnic Group………………………….…...41
Figure 4.3: Histogram of Respondents’ Marital Status…………………….……..…43
Figure 4.4: Histogram of Respondents’ Age Group………………………..……….44
Figure 4.5: Histogram of Respondents’ Working Condition……………….………46
Figure 4.6: Histogram of Respondents’ Education Level……………………….….47
Figure 4.7: Histogram of Respondents’ Working Experience………………….……49

A study on the impacts toward the loyalty of the employee among the back of house staffs in hotel industry. 2012
xiv
LIST OF APPENDICES
Appendix A: Histogram of Employee Turnover by Industry ……………………..79
Appendix B: Histogram of Voluntary Quits by Industry…………………………..79
Appendix C: Histogram of Turnover Replacement Cost by Industry…………...…80
Appendix D: Pilot Test – Reliability………………………………………….……81
Appendix E: Questionnaire…………………………………………………………89

A study on the impacts toward the loyalty of the employee among the back of house staffs in hotel industry. 2012
xv
LIST OF ABBRVATION
A Agree
D Disagree
i.e. id est (that is)
N Neutral
SA Strongly Agree
SD Strongly Disagree
SPSS Statistical Package for Social Science
UTAR Universiti Tunku Abdul Rahman
A study on the impacts toward the loyalty of the employee among the back of house staffs in hotel industry. 2012
xvi
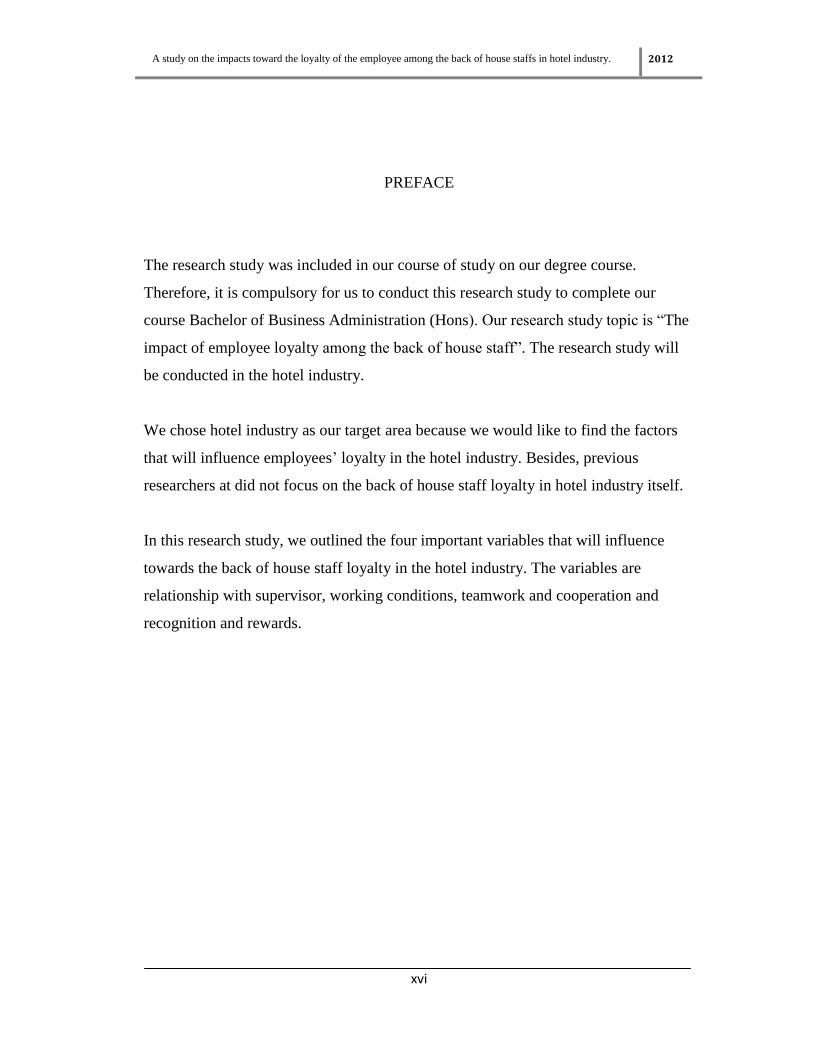
PREFACE
The research study was included in our course of study on our degree course.
Therefore, it is compulsory for us to conduct this research study to complete our
course Bachelor of Business Administration (Hons). Our research study topic is “The
impact of employee loyalty among the back of house staff”. The research study will
be conducted in the hotel industry.
We chose hotel industry as our target area because we would like to find the factors
that will influence employees’ loyalty in the hotel industry. Besides, previous
researchers at did not focus on the back of house staff loyalty in hotel industry itself.
In this research study, we outlined the four important variables that will influence
towards the back of house staff loyalty in the hotel industry. The variables are
relationship with supervisor, working conditions, teamwork and cooperation and
recognition and rewards.
A study on the impacts toward the loyalty of the employee among the back of house staffs in hotel industry. 2012
xvii
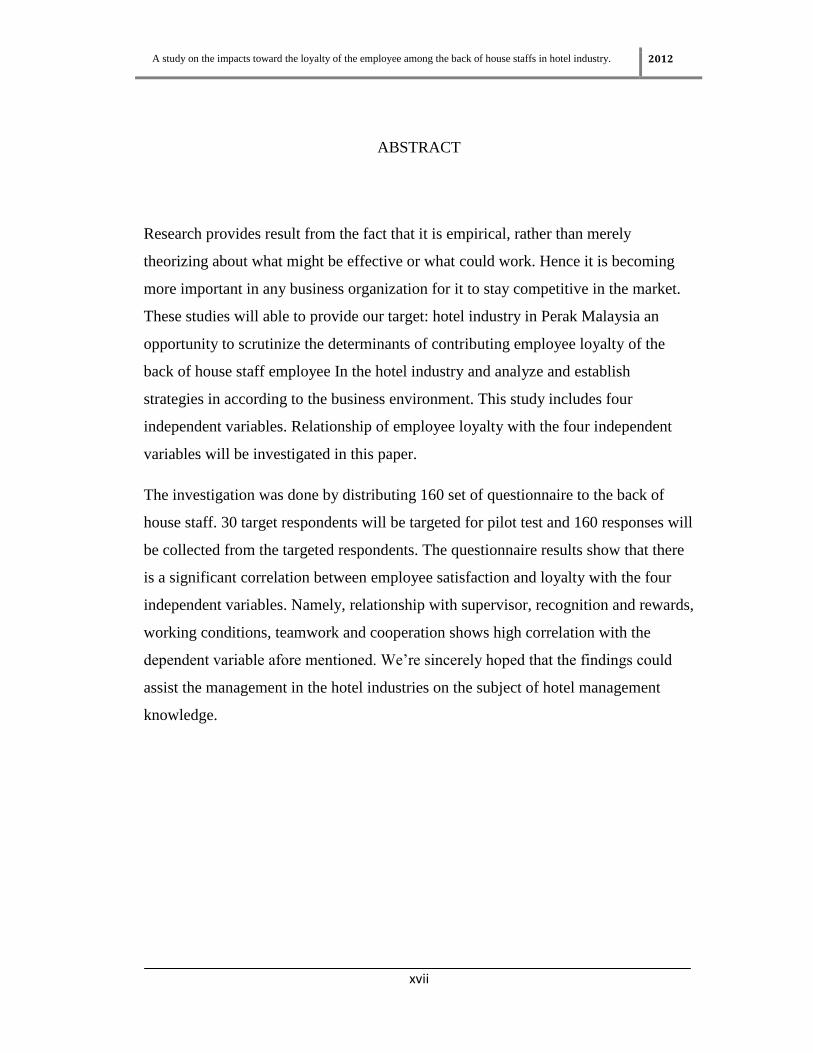
ABSTRACT
Research provides result from the fact that it is empirical, rather than merely
theorizing about what might be effective or what could work. Hence it is becoming
more important in any business organization for it to stay competitive in the market.
These studies will able to provide our target: hotel industry in Perak Malaysia an
opportunity to scrutinize the determinants of contributing employee loyalty of the
back of house staff employee In the hotel industry and analyze and establish
strategies in according to the business environment. This study includes four
independent variables. Relationship of employee loyalty with the four independent
variables will be investigated in this paper.
The investigation was done by distributing 160 set of questionnaire to the back of
house staff. 30 target respondents will be targeted for pilot test and 160 responses will
be collected from the targeted respondents. The questionnaire results show that there
is a significant correlation between employee satisfaction and loyalty with the four
independent variables. Namely, relationship with supervisor, recognition and rewards,
working conditions, teamwork and cooperation shows high correlation with the
dependent variable afore mentioned. We’re sincerely hoped that the findings could
assist the management in the hotel industries on the subject of hotel management
knowledge.
A study on the impacts toward the loyalty of the employee among the back of house staffs in hotel industry. 2012
Page 1 of 98
Chapter 1: Introduction
1.0 Introduction
This chapter will provide an overview outline of this research. A research background
and problem statement has drawn to let readers have a basic knowledge of the
research. The research objectives and benefits related are identified and discussed.
Lastly, research question and hypothesis of the study have been prepared and these
gave researchers a clear guideline to precede the research to the next chapters.
1.1 Research Background
This section of the research project is mainly concerned with the determinants
towards the employee loyalty among the back of house staff in the hotel industry. It
differentiates the determinants which factors are able to affect the back of house staff
loyalty and performance in Malaysia’s hotel industry. This research would also act as
a guideline for the potential new entrants who wish to enter the hotel industry on
issues that will need to be considered before starting the business.
Apart from that, the objective of this project is intended to develop a methodology
that can be applied to the analysis of the determinants towards the employee job
satisfaction and performances. The purpose of this study is to examine the factors
which can potentially affect the employee loyalty. To begin with, a brief review of the
determinants such as relationship with supervisor, working conditions, teamwork and
cooperation and recognition and rewards.
The success of the employee-supervisor dyad is important to the business
organizations, especially for the services industry. First, followers are critical to
approximately 80% of organizational success (Hall & Densten, 2002). A good and
healthy employee-supervisor relationship directly affects employee job satisfaction

A study on the impacts toward the loyalty of the employee among the back of house staffs in hotel industry. 2012
Page 2 of 98
and performance. People may join an employing organization and want to work for a
vision, but when they leave an organization, it largely because of their boss;
employees quit their bosses, not their job or their employer (Buckingham & Coffman,
First break all the rules: What the world's greatest managers do differently, 1999)
(Kaye & Jordan-Evans, 2003). Hence, the explanation to an organization’s success is
lie upon the success of the employee-supervisor relationship.
Meanwhile, the study is also conducted to assess the employee loyalty among the
back of house staff to determine whether the quality of working conditions can affect
the employee loyalty. The important of a proper working condition is essential in an
organization. If the organization has all the skilled and expertise staff but does not
have proper facilities, the organization is on the path to failure.
Motivation is such a factor that exerts a driving force on our actions and work (Baron,
Behaviour in organisations, 1983). Hence, recognition and reward has become a vital
determinant to increase the sense of appreciation towards the staff in an organization.
Within an organization, the best performance is feasible with most committed
employees that can only be achieved through employee motivation and presume that
motivation is included recognition and rewards (Kreitner & Kinicki, 2004). Hence,
rewards such as incentives, intangible reward, compensation and others will be most
preferred for the organization staff.
Meanwhile, teamwork and cooperation is also an essence of workplace productivity.
This approach has improved employee morale and increased input when a team is
managed correctly. The benefits of the cooperation can make a positive effect on any
of the organization that adopted this type teamwork. In addition, it does improve the
job commitment; decrease the absenteeism, increase participation and others by the
staff.
A study on the impacts toward the loyalty of the employee among the back of house staffs in hotel industry. 2012
Page 3 of 98
Therefore, this study will explore the influence of these determinants in Malaysia
hotel industry and how it can affect the employee loyalty among the back of house
staffs
1.2 Problem Statement
Employee loyalty is a key challenge in most of the organization today to
encourage the best and most desirable employees to remain in the organization for
maximum period of time employees today are different. Once employees feel
dissatisfied with the current employer or the job, they switch over to the next job.
It is the responsibility of the employer to know how to attract, satisfied and retains
its best employees. However, many organizations are facing problems to retain
their employees due to certain factors. Employment Policy Foundation tabulation
and analysis of Bureau of Labor Statistic, Job Openings and Labor Turnover
Survey data show that the average of employment turnover by private sector
industry for twelve months ending August 2001 (Appendix A) (employee
turnover is expensive, 2004), is 25.1 percent. Among these industries, the
turnover rates in leisure and hospitality industry are the highest one, which was
46.4 percent. Besides that, the voluntary quit rates of the leisure and hospitality
industry is the highest one among the industries, which is 43.9 percent (Appendix
B) (Employee Turnover). These will bring a serious impact to the leisure and
hospitality industry because the high turnover rates would incurred a cost to the
organization in order to reduce the profit earn of the organization. Based on the
survey data, it shows that the turnover replacement cost of the business services
industry is 15,000 dollars per employee (Appendix C) (Employee Turnover). If
the turnover rate of leisure and hospitality industry is high, definitely it will bring
a huge cost to the organization to replace the employee who is left from the
organization. The costs that are involved in replacing the employee included the
cost of attracting applicants, testing, medical exams, and entrance interview and
so on. Besides of the replacement cost, the turnover of employees incurred cost of
A study on the impacts toward the loyalty of the employee among the back of house staffs in hotel industry. 2012
Page 4 of 98
separation and training cost. This cost will have direct effect on organizational
productivity. The organization will fall short of its targets stated under the
business plan because of the cost incurred in employee’s retention. There is the
risk of losing your competitive advantage due to loss of capable employees in
critical sectors or positions.
The previous study (The Study of Employee Satisfaction and its Effects towards
Loyalty in Hotel Industry in Klang Valley, Malaysia, 2011), has investigated the
factors that affect the job satisfaction of front line employees and towards their
loyalty in hotel industry of Klang Valley. In our study, we emphasize the same
factors from the study, namely relationship between supervisor, recognition and
rewards, working condition and teamwork and cooperation to the back of house
employees because the back of house employees is the important support and
resource for the hotel to retain the customer and increase the profit. We believe
that the factors that affected the front line employee loyalty would bring the same
impact to the back of house staff. Besides, our study focuses on the hotel industry
at Perak state. Since the turnover rates of leisure and hospitability industry are
high, therefore, it is possible to happen to the hotels in Perak state although there
is no any evidence to prove it. All of these issues show that employee loyalty is
very beneficial to the organizational performance. Purpose of this study is to
investigate the significant factors, namely relationship with supervisor,
recognition and rewards, working condition and teamwork and cooperation how
to influence the back of house staffs’ loyalty.
1.3 Research Objectives
1.3.1 General Objectives
Identify the factors that affect the back of house employee satisfaction towards the
employee loyalty in hotel industry.
A study on the impacts toward the loyalty of the employee among the back of house staffs in hotel industry. 2012
Page 5 of 98
1.3.2 Specific Objectives
The purpose of the study is to investigate the four factors that affected the
employee loyalty among the back of house staff in hotel industry. The objectives
were as below:
1) To determine whether there is a significant relationship between
relationship with supervisor and the loyalty among the back of house
staffs in hotel industry.
2) To determine whether there is a significant recognition and rewards and
the loyalty among the back of house staffs in hotel industry.
3) To determine whether there is a significant relationship between working
condition and the loyalty among the back of house staffs in hotel industry.
4) To determine whether there is a significant relationship between teamwork
and cooperation and the loyalty among the back of house staffs in hotel
industry.
1.4 Research Questions
In this study, some of research questions have created and which to be
investigated. These research questions are generally asking about the relationship
between dependent variables and independent variables.
1) Is there any significant relationship between relationship with supervisor
and the loyalty among the back of house staffs in hotel industry?
2) Is there any significant relationship between recognition and rewards and
the loyalty among the back of house staffs in hotel industry?
3) Is there any significant relationship between working condition and the
loyalty among the back of house staffs in hotel industry?

A study on the impacts toward the loyalty of the employee among the back of house staffs in hotel industry. 2012
Page 6 of 98
4) Is there any significant relationship between teamwork and cooperation
and the loyalty among the back of house staffs in hotel industry?
1.5 Hypotheses of the Study
Hypothesis 1
H0: There is no significant relationship between relationship with supervisor and
the loyalty among the back of house staffs in hotel industry.
H1: There is a significant relationship between relationship with supervisor and
the loyalty among the back of house staffs in hotel industry.
Hypothesis 2
H0: There is no significant relationship between recognition and rewards and the
loyalty among the back of house staffs in hotel industry.
H1: There is a significant relationship between recognition and rewards and the
loyalty among the back of house staffs in hotel industry.
Hypothesis 3
H0: There is no significant relationship between working condition and the
loyalty among the back of house staffs in hotel industry.
H1: There is a significant relationship between working condition and the loyalty
among the back of house staffs in hotel industry.
Hypothesis 4
H0: There is no significant relationship between teamwork and cooperation the
loyalty among the back of house staffs in hotel industry.

A study on the impacts toward the loyalty of the employee among the back of house staffs in hotel industry. 2012
Page 7 of 98
H1: There is a significant relationship between teamwork and cooperation and the
loyalty among the back of house staffs in hotel industry.
1.6 Significance of the Study
This study is beneficial to two parties, which were back of house employee and
the organization in the hotel industry. From the study, we have investigated what
are the factors which will their loyalty to their current organization.
1.6.1 Individual Perspective
The poor level of the employee turnover management and human resource
management bring a serious impact to the back of house employee in the hotel
industry. Their contribution normally ignore by the top management of the
hotel industry. It will affect the loyalty of the back of house employees.
Through the study, the ideas and needs of the back of house employees can
transmit to the top management of the hotel industry. As the results, they need
the improvement of management skill and policy, controlling the management
process and performance to let the back of house employees feel more secure,
ease and motivated to their job task.
1.6.2 Organization Perspective
The study will help the hotel industry to identify the impact of low employee
loyalty. If the hotel industry is unable to retain the back of house employees, it
will increase the turnover rate of them and the cost of retraining or
replacement program to new employees. The cooperation and teamwork is
needed between the front line employees and back of house employees to
improve the performance of the hotel industry and profit maximization.
A study on the impacts toward the loyalty of the employee among the back of house staffs in hotel industry. 2012
Page 8 of 98
Through the study, the hotel industry can understand the factors that affected
the loyalty of the back house employees. The top management of hotel
industry can implement the relevant strategies in term to increase loyalty of
back of employees. Thus, the hotel industry can able to retain the employees
and improves its operation performance.
1.7 Chapter Layout
Chapter 1
This chapter gives an overall review of entire research; a brief background of the
research was included in this chapter. The problem statement and the research
objectives of the research justify other items such as the significance of the study;
hypotheses of the study and significance of the research study are also explained
in this chapter.
Chapter 2
This chapter is heavily based on the reviews of the various literature and previous
studies done on this research topic. It contains the discussion of the various
articles, journals and research studies. This chapter is divided into 6 parts which
are the introduction, review of the literature, review of relevant theoretical models,
proposed theoretical/conceptual framework, hypothesis development and the
conclusion.
A study on the impacts toward the loyalty of the employee among the back of house staffs in hotel industry. 2012
Page 9 of 98
Chapter 3
This chapter focus on discussion of research of research method where it describe
the procedure of how the research carry out in terms of the research design and
setting, data collection method, sampling design, research instrument, constructs
measurement scales, data processing and the data analysis.
Chapter 4
Chapter 4 includes the overall result and analysis of questionnaire will be present
in chart and table with using the Statistical Package of Social Science (SPSS). The
interpretation of result will explained in depth.
Chapter 5
Chapter 5 will be presenting and discussing the overall of descriptive and
inferential analyses from previous chapter, and also discussion the major finding.
The implication of study will be discussed in depth. Lastly the limitation of study
and recommendation for future research will be presented.
1.8 Conclusion
This chapter provides an introductory study and overview of the entire structure
of the research. The research background of the factors of employee
dissatisfaction to the job and the employee loyalty are discussing. Besides, the
statement of problem is also investigated. The general and specific research
objective, questions of research, hypotheses of study and the definition of terms
were discussed. Thus, readers can get an idea on what to expect in the following
chapters. The next chapter is the literature and studies review done by previous
researchers.
A study on the impacts toward the loyalty of the employee among the back of house staffs in hotel industry. 2012
Page 10 of 98
Chapter 2: Literature Review
2.0 Introduction
Literature review is an important chapter in a thesis where we used to review
others’ work and the information obtained is based on text such as journals, articles,
newspaper, internet and other aims to review the critical points of current
knowledge on a particular topic. In short, this chapter information obtained is all
secondary sources. This chapter is divided into four parts which are review of
literature, review of relevant theoretical framework, proposed conceptual
framework and hypothesis development. Finally, we were concluding chapter 2
with a conclusion.
2.1 Review of Literature
In this topic, we would define and provide the explanations of the factors below that
were related to the research topic and consistent with the research objectives. It means
that it is used to provide a clear background and justification for the research.
Moreover, we would further explain the relationship of the factors with the employee
loyalty.
Dependent Variable
2.1.1 Employee Loyalty
Our dependent variable is employee loyalty. Employee loyalty can be defined in
different ways by many researchers. Employee loyalty is all about an employee’s
feeling of attachment or concept deals with the behavior of the employees to an
A study on the impacts toward the loyalty of the employee among the back of house staffs in hotel industry. 2012
Page 11 of 98
organization (Meryer Meyer & Allen, 1991). This attachment was later connected
to more specific behaviors such as supporting an organization and the individuals
within it (Butler & Cantrell, 1984) and practicing good citizenship (Rusbult, 1988).
Such attachment was also thought to be evident when an employee passed on an
attractive position with another organization (Logan, 1984) or simply remained with
one organization for some length of time (Pina e Cunha, 2002).
But, recently, employee loyalty could be defined as employees are being committed
to the success of the organization and believing that their best choice is working for
the organization. Not only did they plan to retain in the organization, but they also
did not search for alternative employment and reject the offers they have (Part 1:
What is Employee Loyalty? (And Why Should We Care?)).
There were three dimensions found in Allport’s suggestion, which were voluntary
nature, its demand for ongoing adherence, and its grounding in morality--set it apart
from current descriptions of organizational commitment. Support for their inclusion
in descriptions of loyalty could be found in a variety of sources, including fairly
recent writings by philosophers (Oldenquist, 1982)
Seema Mehta stated that loyalty has two dimensions which were internal and
external. The internal dimension is the emotional component such as feelings of
caring, of affiliation and of commitment. The external dimension has to do with the
way loyalty manifests itself. This dimension is comprised of the behaviors that
display the emotional component and is the part of loyalty that changes the most
(Mehta, Singh, Bhakar, & Sinha, 2010).
Today's average job tenure was under five years and declining. Employee loyalty
plays an important role in achieving organizational goal. So it is vital for
organization to identify the reason for leaving and frequently changed the job to
make them happy and stayed with current company.
A study on the impacts toward the loyalty of the employee among the back of house staffs in hotel industry. 2012
Page 12 of 98
Independent Variable
2.1.2 Relationship with supervisor
A good relationship between worker and their immediate supervisor is very important
since both are working in the same organization and share the same workplace
(Sturgeon, 2006). A good relationship can be formed through two way
communication. The supervisor plays an important role in an organization for
monitoring the employee’s performance and leading them toward goal achievement.
Besides, supervisor must have a clear clarification about their follower task and duty
and try to understand what their follower think. The employees may leave their job
because they are not satisfied. Sometimes, they don’t leave their job and company,
but they are divorcing their manager or supervisor. Therefore, supervisor also need
ensured to provide the good working environment, available resources and supporting.
Supervisor is responsible to develop the good relationship with the employees for
narrow the employee’s productivity gap. There was a positively relationship between
loyalty to supervisor and employee outcome variable, i.e. intent to stay (Zhenxiong
Chen, 2001).
According Lavelle, Rupp and Brockner research, there were 2 dimensions which are
perception of support and trust (Tepper, 2003) Findings suggest that supervisors may
view their advantageous position for helping subordinates to literature reports positive
relationships between supportive supervision and employee in-role and extra-role
performance (Bhanthumnavin, 2003). Thus, subordinates’ perceived supervisor
support must be enhanced subordinate’s in-role and extra role performance (Figure
2.1.2.1). Highly support from supervisor can lead subordinate feel more satisfy and
loyal to the organization.
The trust in supervisors is important for investigated in the management literature,
especially leadership studies. Leader-member exchange (LMX) theory consider trust
A study on the impacts toward the loyalty of the employee among the back of house staffs in hotel industry. 2012
Page 13 of 98
to be one of the core indicators reflecting the quality of the relationship between
leader and subordinates, which has a positive effect on various measures of job
attitudes and performance (Liden, 2007). Outside of LMX theory, many leadership
scholars consider trust a core basis of effective leadership (Fairholm, 1994). This
research, accordingly, assumes that trust in supervisors will enhance both employee
satisfaction and commitment. Besides, trust in co-workers has gain attention in the
widespread transformation of work environments, such as the emergence of the work
team in the early 1990s (Ingraham, 1999). Trust built among colleagues will faster the
problem solving by sharing information within groups (Zand, 1972). In addition,
trusts also will increasing the collaboration among the colleagues and develop a
harmony working environment.
2.1.3 Rewards and recognition
Organizational reward allocations are one of the dimensions in explaining the reason
why employees are willing to stay in the organization. All employees including the
low level employees are sensitive in receiving fair rewards for their efforts and may
leave when opportunities to receive greater rewards exist elsewhere. There are three
forms of reward and recognition most cited by respondents was the verbal praise
from supervisor and leaders, compensation and salary increases and gift certificates
(Ramlall, 2003).
Employees cited compensation is the most frequent reason for them to stay in the
company. As employees satisfied with their rewards and recognition they receive,
they have no reason for leaving the company and seek for other position in other
company (Ramlall, 2003). The rewards worked well when they stimulate high
involvement on the part of employees.
Recognition is a form of non-financial award given to employees selectively as an
appreciation in return of their high level of accomplishment for the organization
A study on the impacts toward the loyalty of the employee among the back of house staffs in hotel industry. 2012
Page 14 of 98
(Milne, 2007). Feeling being appreciated and worthy contributions by employees
reduces the chances to leave the organization. In addition, employees are likely to
leave the organization when employers treat them poorly and did not meet their
needs of feedback and recognition (Hausknecht, Rodda, & Howard, 2008).
Organizations can give benefit for those employee who get commitment and loyal to
the organization (Fischer). The employees will loyal if they can get a fair reward.
Therefore, the employees will perceive that their organization consider their levels of
commitment and loyalty and more loyal to the organization if the organization
rewarding them (Fischer).
2.1.4 Teamwork and cooperation
Teamwork and cooperation can be defined as a group of people with different skill
and knowledge working together in a team for achieving a common purpose and goal.
Besides, each member in team is ready to share the information and trust each other
in order to achieve organizational goals effectiveness and efficiency.
In order to improve teamwork of a team, Bruce Tuckman defined a life cycle for team
development has proven very effective in teamwork with the four stages of his theory
which are forming, storming, norming and performing (Tuckman, 1965). With this
theory, a team can be form more effectively which will indirectly increase employee
satisfaction towards their team. Meanwhile, according to (Yun, Cox, Henry P.Sims,
& Salam, The effects of leadership and job satisfaction on team citizenship, 2007)
indicate that both transformational and empowering leadership can enhance
teamwork through the influence of job satisfaction. Employee will loyal to the
organization when they are satisfied. So, other than team development theory by
Tuckman, leadership is also important for enhancing teamwork.
According to Heskett et al., the internal quality of work life simply indicates the
feelings of employees towards their colleagues, jobs, and the organization. In other
words, it means that feeling of staying in organization is the way employee
A study on the impacts toward the loyalty of the employee among the back of house staffs in hotel industry. 2012
Page 15 of 98
performing in a team. So, team with good teamwork can strengthen loyalty of
employee to their organization.
Besides, a study has been conduct that integrates total quality management (TQM)
practices by introducing teamwork into a theoretical model for understanding
relationship of employee loyalty (Chang, Chiu, & Chen, The effect of TQM practices
on employee satisfaction and loyalty in government, 2010). In this study, it mentions
that teamwork is one of the total quality management and positively associated with
employee satisfaction. It means that people will loyal once they are satisfied.
On the other hand, the quality of collaboration in teams can be capture through the six
facets of teamwork quality, i.e., communication, coordination, balance of member
contributions, mutual support, effort, and cohesion (Hoegl. & Gemuenden., Team
Work Quality and Success of Innovative Projects, 2001).
Besides that, size will also affect teamwork. A larger size team will tend to have
communication difficulty thus will indirect increase the time consuming in doing task
that will affect teamwork (Hoegl M. , Smaller teams-better teamwork: How to keep
project teams small, 2005).
2.1.5 Working Conditions
Working condition may also one of the factors that will affect employee loyalty.
Individuals differ in personality, as well as emotions and cognitive process (Diener,
Suh, Lucas, Smith, Schwarz, & Strack, 1999). In additions, the employees will
constantly compare and judge the current working conditions from the past and even
future. These standards are varied as differences of life experience and living standard
in each of the people.
Each of the employees has different aspiration levels (Stutzer, 2004). In some cases,
some work activities may create a psychological frustration or state of decline, if the

A study on the impacts toward the loyalty of the employee among the back of house staffs in hotel industry. 2012
Page 16 of 98
employee expected himself or herself to gain a better valued job, while the other
employee, may have a very low desire on gaining better valued job due to a lower
level of education or other reasons. Hence, at this point the topic produces an entire
new view, where the same work may be associated with quality views. Meanwhile,
the research also found that the objective working conditions is not only the important
determinant that motivates people positional concerns. In fact, environment and the
past or expectation towards the future has also become aspirations about working
conditions.
People adapt to the contexts they live in (Clark, Diener, Georgellis, & Lucas, 2008).
In business organization context, it would mean that employee able to adjust
themselves when they encounter adverse working condition. This is due to the
adaptability skills that everyone possesses of when they enter or facing a whole new
working condition.
Furthermore, the author believes that individuals look both upward and downwards
when making comparisons and aspirations (Poggi, 2010). Looking downward,
individuals set a lower aspiration bounds representing minimum acceptable working
conditions. Looking upward, workers set an upper aspiration bounds representing the
best working conditions they can obtain on the labor market. The results of the study
show that reality lies between the lower and the upper aspiration bounds. Therefore,
the larger the distances between reality and lower aspiration bounds, the more
satisfied workers will feel. Instead, the larger the distances between reality and upper
aspiration bounds, the more unsatisfied workers will feel. Besides that, adverse
working conditions has been shown to increase either worker’ intentions to quit or
actual quits. In brief, there is a general agreement that improved working conditions
and the work environment is certainly one of the more important working conditions,
tending to increase productivity (Levy-Garboua, 2007).
Meanwhile, according result from other research indicate that employees in larger
firms face a worse work environment. This is due to the reason of working in large
firms significantly reduces job satisfaction due to no controls for working conditions
A study on the impacts toward the loyalty of the employee among the back of house staffs in hotel industry. 2012
Page 17 of 98
are included, yet taking them into account across size categories was no significant
differences and no systematic differences exist in intentions to quit across firm size
categories, regardless of amount of salary (Serrano, 2011).
2.2 Review of Relevant Theoretical Models
Theoretical models of Employee Loyalty
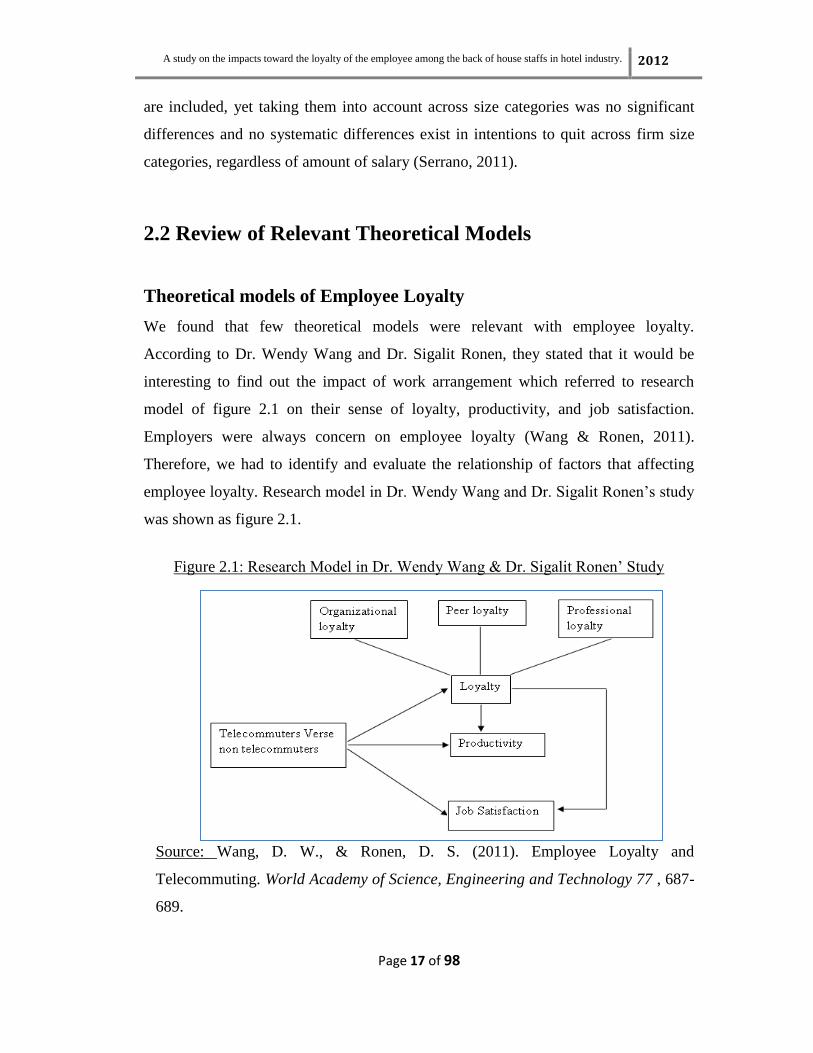
We found that few theoretical models were relevant with employee loyalty.
According to Dr. Wendy Wang and Dr. Sigalit Ronen, they stated that it would be
interesting to find out the impact of work arrangement which referred to research
model of figure 2.1 on their sense of loyalty, productivity, and job satisfaction.
Employers were always concern on employee loyalty (Wang & Ronen, 2011).
Therefore, we had to identify and evaluate the relationship of factors that affecting
employee loyalty. Research model in Dr. Wendy Wang and Dr. Sigalit Ronen’s study
was shown as figure 2.1.
Figure 2.1: Research Model in Dr. Wendy Wang & Dr. Sigalit Ronen’ Study
Source: Wang, D. W., & Ronen, D. S. (2011). Employee Loyalty and
Telecommuting. World Academy of Science, Engineering and Technology 77 , 687-
689.
A study on the impacts toward the loyalty of the employee among the back of house staffs in hotel industry. 2012
Page 18 of 98
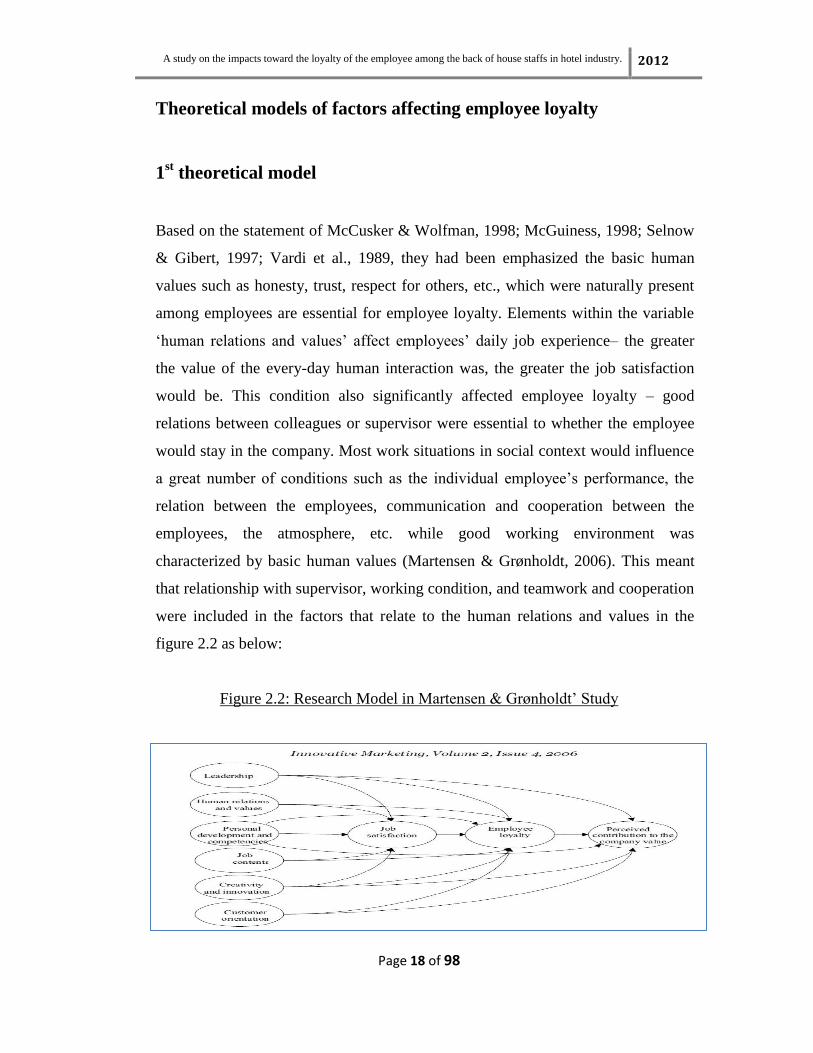
Theoretical models of factors affecting employee loyalty
1st theoretical model
Based on the statement of McCusker & Wolfman, 1998; McGuiness, 1998; Selnow
& Gibert, 1997; Vardi et al., 1989, they had been emphasized the basic human
values such as honesty, trust, respect for others, etc., which were naturally present
among employees are essential for employee loyalty. Elements within the variable
‘human relations and values’ affect employees’ daily job experience– the greater
the value of the every-day human interaction was, the greater the job satisfaction
would be. This condition also significantly affected employee loyalty – good
relations between colleagues or supervisor were essential to whether the employee
would stay in the company. Most work situations in social context would influence
a great number of conditions such as the individual employee’s performance, the
relation between the employees, communication and cooperation between the
employees, the atmosphere, etc. while good working environment was
characterized by basic human values (Martensen & Grønholdt, 2006). This meant
that relationship with supervisor, working condition, and teamwork and cooperation
were included in the factors that relate to the human relations and values in the
figure 2.2 as below:
Figure 2.2: Research Model in Martensen & Grønholdt’ Study
A study on the impacts toward the loyalty of the employee among the back of house staffs in hotel industry. 2012
Page 19 of 98
Source: Martensen, A., & Grønholdt, L. (2006). Internal Marketing: A study of
employee loyalty, its determinants and consequences. Innovative Marketing, Volume
2, Issue 4 , 92-116.
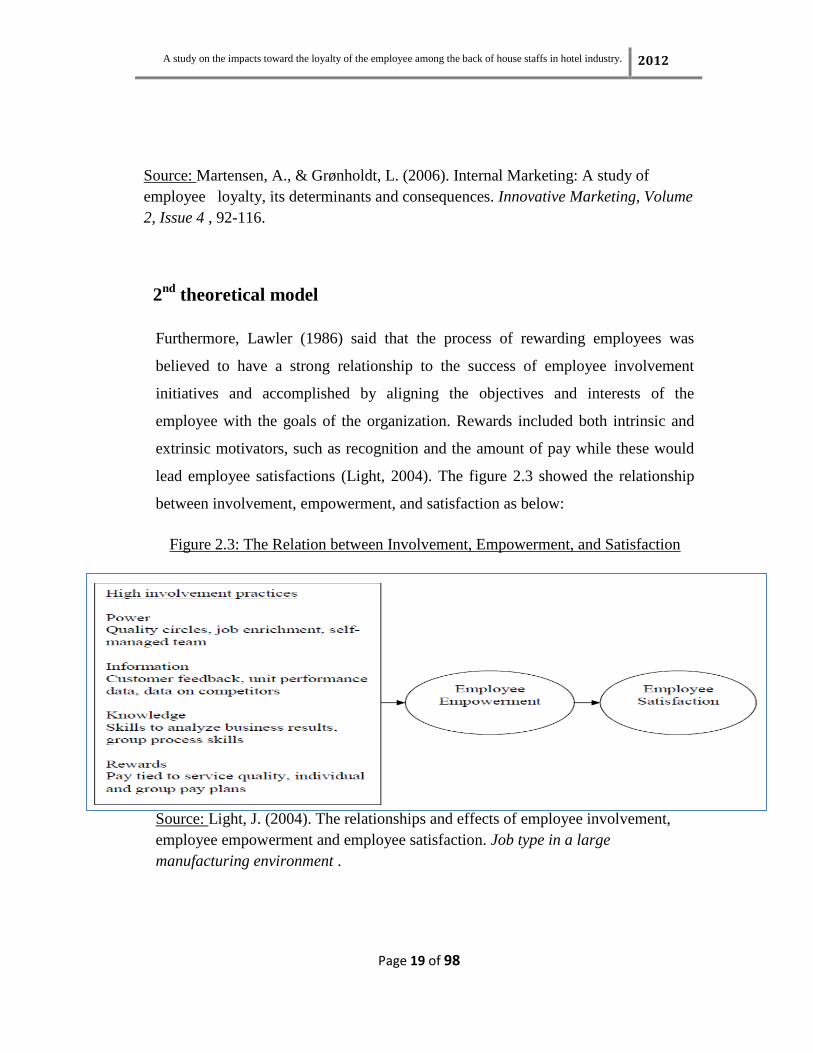
2nd
theoretical model
Furthermore, Lawler (1986) said that the process of rewarding employees was
believed to have a strong relationship to the success of employee involvement
initiatives and accomplished by aligning the objectives and interests of the
employee with the goals of the organization. Rewards included both intrinsic and
extrinsic motivators, such as recognition and the amount of pay while these would
lead employee satisfactions (Light, 2004). The figure 2.3 showed the relationship
between involvement, empowerment, and satisfaction as below:
Figure 2.3: The Relation between Involvement, Empowerment, and Satisfaction
Source: Light, J. (2004). The relationships and effects of employee involvement,
employee empowerment and employee satisfaction. Job type in a large
manufacturing environment .
A study on the impacts toward the loyalty of the employee among the back of house staffs in hotel industry. 2012
Page 20 of 98
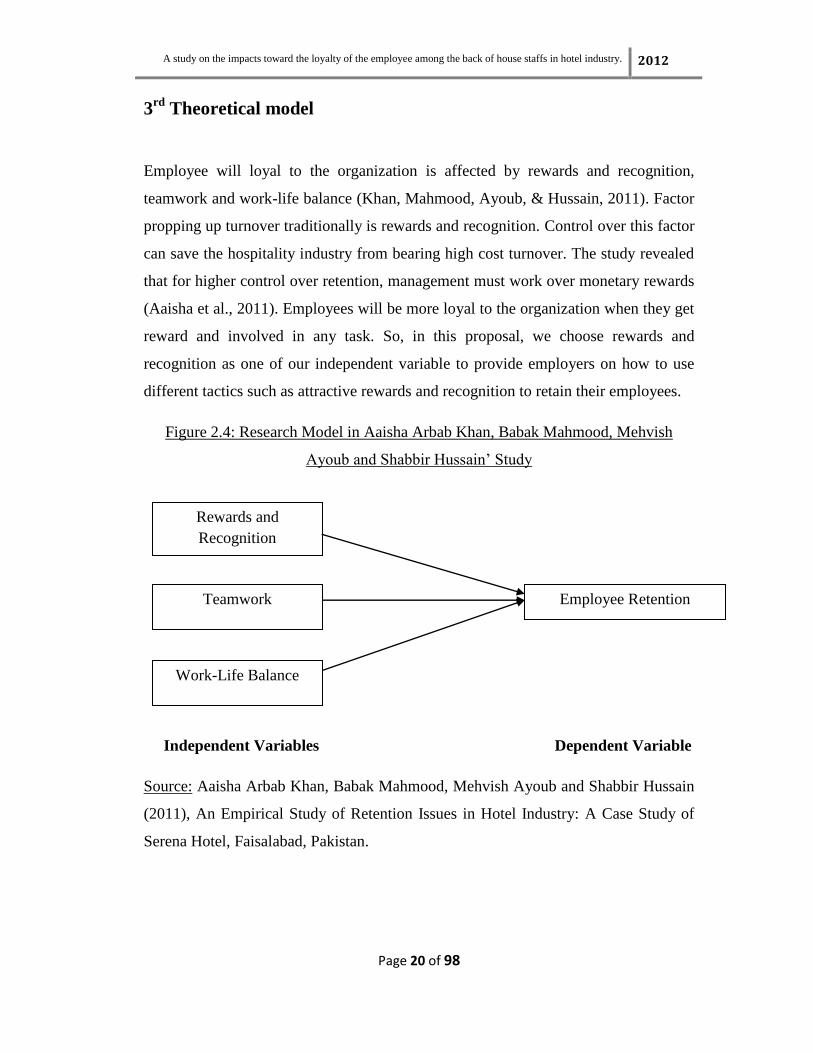
3rd
Theoretical model
Employee will loyal to the organization is affected by rewards and recognition,
teamwork and work-life balance (Khan, Mahmood, Ayoub, & Hussain, 2011). Factor
propping up turnover traditionally is rewards and recognition. Control over this factor
can save the hospitality industry from bearing high cost turnover. The study revealed
that for higher control over retention, management must work over monetary rewards
(Aaisha et al., 2011). Employees will be more loyal to the organization when they get
reward and involved in any task. So, in this proposal, we choose rewards and
recognition as one of our independent variable to provide employers on how to use
different tactics such as attractive rewards and recognition to retain their employees.
Figure 2.4: Research Model in Aaisha Arbab Khan, Babak Mahmood, Mehvish
Ayoub and Shabbir Hussain’ Study
Independent Variables Dependent Variable
Source: Aaisha Arbab Khan, Babak Mahmood, Mehvish Ayoub and Shabbir Hussain
(2011), An Empirical Study of Retention Issues in Hotel Industry: A Case Study of
Serena Hotel, Faisalabad, Pakistan.
Rewards and
Recognition
Teamwork Employee Retention
Work-Life Balance
A study on the impacts toward the loyalty of the employee among the back of house staffs in hotel industry. 2012
Page 21 of 98
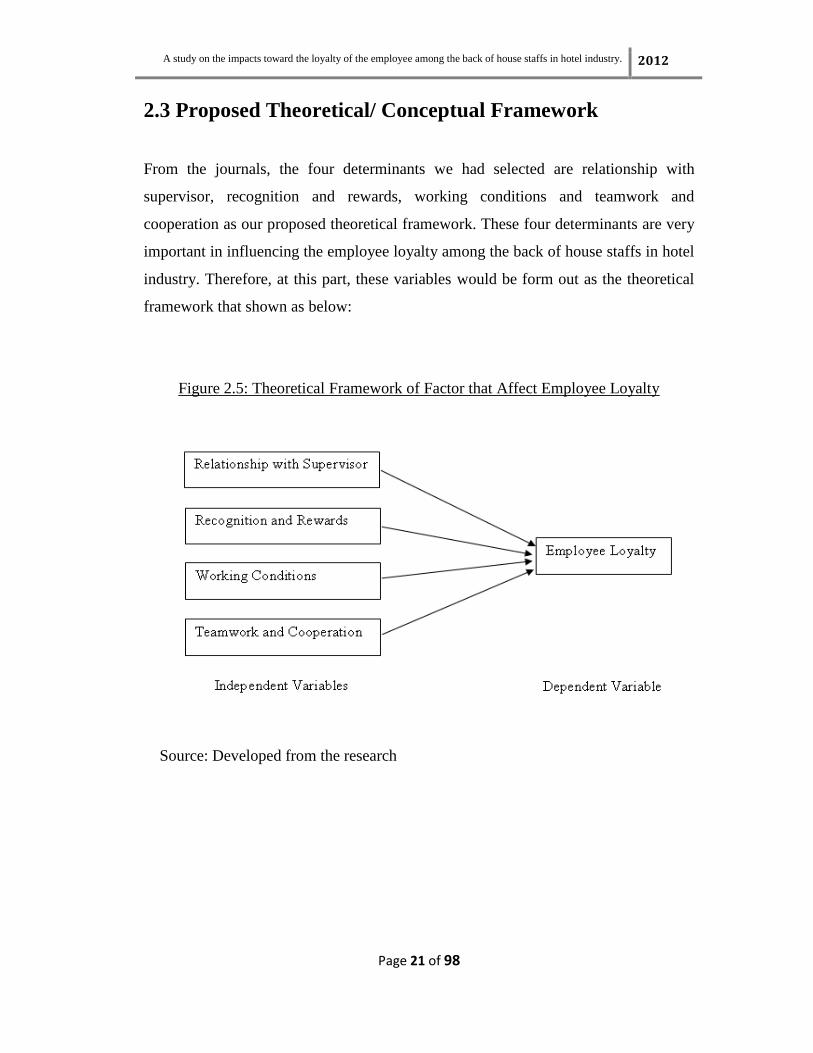
2.3 Proposed Theoretical/ Conceptual Framework
From the journals, the four determinants we had selected are relationship with
supervisor, recognition and rewards, working conditions and teamwork and
cooperation as our proposed theoretical framework. These four determinants are very
important in influencing the employee loyalty among the back of house staffs in hotel
industry. Therefore, at this part, these variables would be form out as the theoretical
framework that shown as below:
Figure 2.5: Theoretical Framework of Factor that Affect Employee Loyalty
Source: Developed from the research
A study on the impacts toward the loyalty of the employee among the back of house staffs in hotel industry. 2012
Page 22 of 98
2.4 Hypothesis Development
2.4.1 Relationship with Supervisor
Based on the journal “A closer look at the relationship between affective commitment
to supervisors and organizations and turnover” by Christian Vendenberghe and
Kathleen Bentein, the author stated that if the employees had high levels of affective
commitment to their supervisors, their turnover intentions were expect to be reduce
and they are willingness to stay at the organization.
According to Sturgeon’s research, it indicates that is significant relation between the
relationships of subordinate-supervisor. The subordinates perceive that the
commitment of supervisor will get their job easily and effectiveness. They will
believe their supervisor and willing to contribute to the organization. The level of
loyalty will increase reflect by the level of relationship with supervisor.
Based on the above research conducted by those researches we can conclude that
relationship with supervisor have significant positive relationship with back of house
employee loyalty.
H1: There is a significant relationship between relationship with supervisor and the
loyalty among the back of house staffs in hotel industry.
A study on the impacts toward the loyalty of the employee among the back of house staffs in hotel industry. 2012
Page 23 of 98
2.4.2 Reward and Recognition
Organization that offers competitive salary with attractive benefits has high potential
to retain their employees (Ramlall, 2003). From research, participants responded that
they have an average satisfaction with the rewards and recognition they received from
organization. In addition, further analysis as indication of employees’ satisfaction
with their position showed that they satisfied with the rewards and recognition
received from the company (Ramlall, 2003).
From the research carried out by Solon Fire Rescue (2001), recognition seems to be
the most prevalent types of reward for employees to stay in the organization (William
J.Shaw, Rescue, & Solon, 2001). The reward or recognition programmed survey by
William J. Shaw, Solon Fire Rescue (2001) shows that most of the employees feel
that they are adequately recognized by for their contribution to the organization. The
result of research also shows that higher employee retention can be assisted by reward
and recognition programs (William J.Shaw, Rescue, & Solon, 2001). From previous
theory and research proposed that rewards and recognition were the most frequently
reasons for staying in an organization (John et al., 2008).
On the other hand, findings indicated that high performers are more loyal to the
organization when there is an opportunity for salary growth and the availability of
contingent rewards (Allen & Griffeth, 2001) as cited by (Hausknecht, Rodda, &
Howard, 2008). Employees’ commitment and rewards are important factors for them
to retain in the company (Griffeth & et al., 2000).
Based on all the studies conducted by these researchers we can conclude that rewards
and recognition implement by organizations have significant positive relationship
with back of house employee loyalty.
H2: There is a significant relationship between recognition and rewards and the
loyalty among the back of house staffs in hotel industry.
A study on the impacts toward the loyalty of the employee among the back of house staffs in hotel industry. 2012
Page 24 of 98
2.4.3 Teamwork and Cooperation
A study integrates total quality management (TQM) practices by introducing
employee training, teamwork, employee empowerment employee compensation into
a theoretical model for understanding relationship of employee satisfaction and
loyalty (Chang, Chiu, & Chen, The effect of TQM practices on employee satisfaction
and loyalty in government, 2010). Based on the result of this study, teamwork has
positive relationship with employee loyalty.
Furthermore, cooperation from employee and low turnover rate of employee are
positively affected by job satisfaction (Dow, Bishop, & Chen, 2003). From this
research, we can understand that employee cooperation positively affects individual
job satisfaction which can lower their intention to quit as well. Also, satisfaction in
nurse field of working environment will reduce intention to quit and improve quality
of work. (Park & Kim, 2009). From two researches above, we can understand that
employee from any industry as well as service industry with high job satisfaction can
lower the intention and reduce turnover. Besides, due to the nature of loyalty, the
intention of turnover is used as an alternative indicator for employee loyalty (Soo-
young & Whitford, 2008).
When turnover rate is lower, employee loyalty will be higher. Meanwhile, teamwork
can enhance performance which can reduce turnover and indirectly strengthen loyalty.
Besides that, clear visions that are reasonable and can be pursuing together with
teamwork should be provided by leaders for their employee in order to strengthen job
satisfaction (Yun, Cox, Henry P.Sims, & Salam, 2007). The teamwork that shows
between employee and their leader can enhance job satisfaction and indirectly
enhance loyalty when they pursue the same vision together.
Based on all the studies conducted by these researchers we can conclude that
teamwork and cooperation of employee in organizations have significant positive
relationship with back of house employee loyalty.
A study on the impacts toward the loyalty of the employee among the back of house staffs in hotel industry. 2012
Page 25 of 98
H3: There is a significant relationship between teamwork and cooperation and the
loyalty among the back of house staffs in hotel industry.
2.4.4 Working condition
Refer to the journal of “work environment factors and job performance: the
construction project manager’s perspective” by Arman Abdul Razak, Mastura Jaafar,
Shardy Abdullah and Samsiah Muhammad. From the result of the analysis conducted
on the gathered data, it was found that the job satisfaction (one of the determinants in
working conditions) has influenced on work performance and research also find out
that the importance ranking of work environment factors were dominated by factors
attributed to the projects being undertaken. The findings of the study further support
that a more attention need to be given to these work environment factors in the hopes
of enhancing job performance of the construction project manager (Razak, Jaafar,
Abdullah, & Muhammad, 2009).
Meanwhile, based on the journal “Relationships among leadership empowerment, job
satisfaction, and employee loyalty in university dining student workers” by Seung
Suk Lee, the author stated that confidence in high performance and autonomy were
significant indicators of employee loyalty to non-supervisory student workers while
goal accomplishment was a significant indicator of employee loyalty to supervisory
student workers (Lee, 2008).
In overall, research result found from the two studies conducted by these researchers
indicates that proper working conditions implement by organizations have significant
positive relationship with back of house employee loyalty.
H4: There is a significant relationship between working conditions and the loyalty
among the back of house staffs in hotel industry.
A study on the impacts toward the loyalty of the employee among the back of house staffs in hotel industry. 2012
Page 26 of 98
2.4.5 Dependent Variable VS Independent Variable
Based on the journal above, “A closer look at the relationship between affective
commitment to supervisors and organizations and turnover”, “A Reward, Recognition,
and “Appraisal System for Future Competitiveness: A UK Survey of Best Practices”,
“Recognition: A Powerful, but often Overlooked, leadership tool to improve
employee performance”, “The relationship between leader-member relations, job
satisfaction and organizational commitment in international tourist hotels in Taiwan”
and “The study of the antecedent factors of organizational commitment for high-tech
industries in Taiwan”, we concluded that the four independent variables (relationship
with supervisor, recognition and rewards, working conditions and teamwork and
cooperation) which can affect employee loyalty.
H5: The four independent variables (relationship with supervisor, recognition and
rewards, working conditions and teamwork and cooperation) have significant
relationship with employee loyalty.
2.5 Conclusion
This chapter provided literature survey for identifying the dependent variable which
are back of house employee loyalty whereas the independent variables which are
relationship with supervisor, recognition and rewards, working condition and
teamwork and cooperation. Based on foundation of Based on foundation of literature
review, the theoretical framework had been developed and to advance the
investigation and hypothesis testing. Perhaps with the references of the journals can
make the aspects in this become more reliable.
A study on the impacts toward the loyalty of the employee among the back of house staffs in hotel industry. 2012
Page 27 of 98
Chapter 3: Methodology
3.0 Introduction
This chapter is used to refine the study that enables researchers to generate
information which will be able to answer the hypotheses and research questions. The
purpose of completing this chapter is to point up the background of the research
methodology. It also describes how the research is carried out in terms of research
design, data collection methods, sampling design, research instrument, scale and
operational definitions, data processing and methods of data analysis. At the end, a
conclusion will be provided as a summary of this chapter.
3.1 Research Design
There are three type of research design, which is exploratory research, casual research
and descriptive research. In this research, the descriptive research is conducted. By
using descriptive data will enable the researcher to obtain information with reference
for the research. The researchers can know a substantial amount about the research
problem and clearly defines what should be measured on this research.
Researchers used quantitative methods in this study. Quantitative research generates
statistics through the use of survey research, using methods such as questionnaires or
structured interviews. It concerned with numbers and data which are easily quantified.
The reason of choosing descriptive research method is because by distributing
questionnaires, researchers can collect information from a large sample of individuals
and usually take less time to complete by the respondents and relatively inexpensive.
A study on the impacts toward the loyalty of the employee among the back of house staffs in hotel industry. 2012
Page 28 of 98
3.2 Data Collection Method
There are two types of data which are primary data and secondary data. In our
research, we use the questionnaire survey to obtain the primary data while we also
use secondary data which is obtained from online database were helpful for
researchers to obtain information regarding this research in different areas.
3.2.1 Primary Data
Primary data is the data that has been collected at first hand to address a specific
marketing research problem. We are using questionnaires as our methods for
collecting primary data which have been conducted by researchers are helpful to
answer the research questions set in Chapter 1, and to develop hypotheses through
the feedback of relevant respondents. This method providing anonymity, so the
answer of respondent are kept strictly confidential. However, the collection time
is long and the collection cost higher compare to secondary data.
3.2.2 Secondary Data
In our research, secondary data were obtained as supporting information to further
enhance the literatures and results tabulated in this research project. Perhaps, most
of the information used is mostly obtained from journals and articles sourced from
search engines such as Yahoo and Google, online data bases which include
Emerald, Proquest, JStor and SpringerLink. Besides that, information was also
obtained from several universities and public libraries.

A study on the impacts toward the loyalty of the employee among the back of house staffs in hotel industry. 2012
Page 29 of 98
3.3 Sampling Design
Sampling means selecting a sample from population. Sampling design includes five
steps which are defining the population, determine the sampling frame, select
sampling techniques, determine the sample size and execute the sampling process.
This will help us to identify the qualified target respondents to participate in the
survey.
3.3.1 Target Population
The target population of this research study is back of house staff employee in
hotel industry. This study aided to reveal which factors has the significant
influence the back of house staff employees’ loyalty in hotel industry. The
population that researchers target is at Perak state. Besides, it is also
convenient for the researchers to collect data as there are respondents needed
by the researchers to distribute the questionnaire in areas for the questionnaire
to be distributed.
3.3.2 Sampling Frame and Sampling Location
The sampling frame for this study has accomplished 160 respondents.
Researchers not just specially focused on a single group of people, for
example bottom level employees it is because different group of people
possibly have different reason to loyal to the company. The sampling location
was located at Perak State consists of city areas in Kampar Tapah. The
research is conducted in city areas due to it provides the researchers the
highest percentages to reach target population.
3.3.3 Sampling Elements
A study on the impacts toward the loyalty of the employee among the back of house staffs in hotel industry. 2012
Page 30 of 98
In this study, the respondents of the survey were back of house staff employee.
Back of house staff employees were chosen as respondents because previous
research did not focus on those respondents. Not only that, those respondents
may have high impact toward company performance. So, it is essential for
researchers to focus on those employees and find out the reason in order to
maximize the number of loyalty. To maintain a level of reliability on the
responses by the respondents, certain consumers will not be chosen due to
factors such as age (i.e., when respondents are too young, they might not be
able to understand the questionnaire well), time available (i.e., when
respondents are in a hurry, they might simply fill in the questionnaire as soon
as possible, providing misguiding answers).
3.3.4 Sampling Technique
In this research project, non-probability sampling was used for this survey.
Non-probability sampling consists of convenience sampling, judgmental
sampling, quota sampling, and snowball sampling.
In this survey, convenience sampling is used because it is the most suitable
and capable to obtain sample of elements. The convenience sampling is the
best ways of getting the information quickly, low cost, convenient and time
saving. As the result, researchers can collect large completed questionnaire
and information with low cost and less time consuming. It is also considered
available and straightforward sampling from various types of non-probability
sampling technique.
3.3.5 Sampling Size
A sample is the actual number of that is important to establish the
representative of the sample for generalizes 96 of population characteristics
A study on the impacts toward the loyalty of the employee among the back of house staffs in hotel industry. 2012
Page 31 of 98
(Sekaran, 2010). A sample of 160 sample size was used in this survey for
quantitative research. The questionnaires were randomly distributed among
the respondents at city areas in Kampar and Tapah.
3.4 Research Instrument
In this proposal, the research instrument that the researchers used to collect data is
self-administered questionnaire. The questionnaire is a formalized set of question for
obtaining information from a large number of respondents. Questionnaire is used
rather than other instrument method because it is low cost, faster ways to gather data
and more convenient. The questionnaire was developed based on the literature review
and has been stated in the front page of the questionnaire that all the information
provided by the respondent will be remain private and confidential. Therefore, it can
reduce the respondent bias. Questionnaire was designed in English language because
it is an international language and a common language that respondents used to
communicate and understand.
3.4.1 Purpose of Using Questionnaire
Questionnaire has been used as a research instrument because questionnaire is
generally designed for large quantities of data, which is suitable for a
quantitative research (Hair, Babin, Money & Samuel 2003). The questionnaire
is the only instrument researchers used to collect the primary data for research
since it is more convenient and efficient way of collection primary data. By
using questionnaire, it allowed the researchers immediately obtained the
response from the respondents. Not only that, it is low cost compared to other
methods of retrieving information.
A study on the impacts toward the loyalty of the employee among the back of house staffs in hotel industry. 2012
Page 32 of 98
3.4.2 Questionnaire Design
There are three types of questions which can be used in conducting in a
research included open-ended, close-ended and scaled response questions
(Burns & Bush, 2006). For this research, closed-ended questions and scale
response question will be used. Open-ended question will not be used as they
are design for exploratory research and it requires more administration effort
(Maholtra, Peterson & Uslay, 2006).
Basically, the questionnaire consists of three major sections, which include
Section A (respondent demographic profile), Section B (measurement of
independent variables), and Section C (measurement of dependent variable).
In Section A, we are using demographic questions that required about some
brief personal information such as gender, age, race, education level, and
others. It is used to understanding on demographic features of the respondent.
In Section B and C, the question is designed to evaluate and test the factors
that affect employee to loyal to company. We are using 5 points Likert scale
to design for the questionnaire. It is using the measurement scale with five
response categories ranging from “strongly disagree” to “strongly agree”,
which requires respondents to indicate their level of agreement with each of a
series of statement related to the stimulus object.
3.4.3 Pilot Test
Questionnaires were tested for the first time in which 30 sets of questionnaires
of the total target of survey sample were distributed to respondents in Grand
Kampar Hotel. The questionnaires were printed and distributed to the large
A study on the impacts toward the loyalty of the employee among the back of house staffs in hotel industry. 2012
Page 33 of 98
number of employees in Grand Kampar Hotel. It takes approximately 1 day to
complete 30 sets of questionnaire. The result of pilot test shows that the value
of reliability of all the variables is above 0.7, so it is considers being good
reliability of the questionnaire (Appendix D). Therefore, we can move to test
the target sample size of 160 respondents.
3.5 Construct Measurement (Scale and Operational
Definition)
The primary scale of measurement in questionnaire is the interval scale. The
questionnaires are asking the 4 factors that influence employee loyalty which were
relationship with supervisor, teamwork, working condition and reward and
recognition. Besides, the questionnaires also ask about the dimension of the
employee loyalty. The description range was from strongly disagree, disagree,
neutral, agree and strongly agree.
The questionnaires are divided into 3 parts which are Part A, B and C. Part A has
15 questions while Part B has 10 questions which are question of the perception
measures, followed by demographic detail of the user. Most of the question are
using the fixed – alternative responses and ask to choose the one closest to their
own viewpoint. Fixed – alternative is used because there are less interview skill
require, saved time to answer, easier to answer by respondent, and provided
comparability of answer.
There are total of 15 questions in the Part A of the questionnaire. Inherent of Part A,
all are interval scale. Interval scale has both nominal scale and ordinal properties
but they
also capture information about differences in quantities of a concept. The interval
scale is a scale that not only arranges objects or alternatives according to their

A study on the impacts toward the loyalty of the employee among the back of house staffs in hotel industry. 2012
Page 34 of 98
magnitudes but also distinguishes the ordered arrangement in units or equal interval.
Such scale is designed to allow respondents to indicate how strongly they agree,
neutral or disagree with carefully construct statements that can rate their level of
loyalty while they are answering the question.
The range of the scale listed as below:
1 = Strongly Disagree
2 = Disagree
3 = Neutral
4 = Agree
5 = Strongly Disagree
Foremost, the following shows the way part B has divided which according to the
dimension of the dependent variables of this study.
On the other hand, nominal scale represents the most element level of measurement.
Nominal scale assigns a value to an object for identification or classification
purpose. The example of question includes gender, race, religion, marital status and
job position.
One of the examples of question from Part C is as follow:
Please indicate your current marital status:
Single
Married
Last but not least, Ordinal scale is a scale that arranges objects or alternatives
according to their magnitudes in an ordered relationship. In part B, the age range
and education level are those questions using this scale.
Example is as below:
A study on the impacts toward the loyalty of the employee among the back of house staffs in hotel industry. 2012
Page 35 of 98
Please indicate your age range:
Below 25
Between 25 years old to 34 years old
Between 35 years old to 44 years old
Between 45 years old to 54 years old
Above 54 years old
3.6 Data Processing
After data has been collected from a representative sample of the population, the next
step is to analyze them to test the research hypothesis. However, we need to ensure
that the data were accurate, complete and suitable for further analysis. Therefore,
some preliminary steps are needed to be completed.
This first step is data checking. All questionnaires are screened and checked by
researcher to see whether the data from respondents are valid for the research. Next
step is data coding. In this study, coding is used in the seven demographic variables
such as gender which assign 1=male and 2= female. Race (1=Malay, 2= Chinese, 3=
Indian, 4= other) and Status code as (1=Single, 2=Married).
Besides, age range also being coded as (1=Below 20 years old, 2=20-34years old,
3=35-44 years old, 4=45-54 years old, and 5=above 54 years old), position that
respondent work code as (1= Kitchen assistant, 2= Section chef, 3= Under chef,
4=Chief of chef, 5=Dessert chef, 6=Dishwasher, 7= Executive housekeeper, 8=Chief
of housekeeper, 9=Deputy housekeeper, 10=Human Resource Administrator,
11=Human Resource Officer, 12=Others). Level of education code as (1=Less than
high school, 2= SPM, 3= STPM or other similar level of Pre-Universities Program,
4=Diploma, 5=Degree, 6=Master, 7=PHD).Lastly, the working experience period
code as (1= less than 6 months, 2= exactly 6 months to less than 1 year, 3= exactly 1
A study on the impacts toward the loyalty of the employee among the back of house staffs in hotel industry. 2012
Page 36 of 98
year to less than 3 years, 4= exactly 3 years to less than 5 years, 5= exactly 5 years to
less than 7 years and 6= more than 7 years)
Thirdly, data must be edited after keyed in by researcher. Data editing dealt with the
detecting and correcting illogical, inconsistent, or illegal data and omissions in the
information returned by the participants of the study. For example, outlier response as
an observation that is substantially different from the other observations which are
illogical. We could check the dispersion of nominal and/or ordinal variables by
obtaining minimum and maximum values and frequency tables. Scatter plot or box
plot are good methods for checking the outliers.
When responses or results from questionnaire are not in harmony with other
information, inconsistent responses is detected. Researchers might edit the response
based on the style of answering in previous questions. Other than that, we shall have
frequency distribution system to check for illegal codes which the values that are not
specified in coding instruction. When respondents don’t understand the question or
answer and are unwilling to answer, omissions would occur. Therefore, we shall not
include that questionnaire in the data set for analysis or just ignore the blank response.
Last step of the data processing is data transcribing or data transformation. Data
transformation is a process of changing the original form of data to a new format.
This stage has being carried out when researchers finished collecting the data
manually and then keyed-in into computer as computerized database. This step is
essential because data needs to be transformed into a form that is more suitable to
perform data analyses which accomplished the research objectives.
3.7 Data analysis
Statistical Package for Social Science (SPSS) software has been used for analyzing all
the data collected. Steps of SPSS are as following:
1. Creating the data file
A study on the impacts toward the loyalty of the employee among the back of house staffs in hotel industry. 2012
Page 37 of 98
2. Defining the variables
3. Key in data
4. Recode the value of the variable
5. Computing a new variable
6. Summarizing data
7. Exploring differences between two variable
8. Exploring relationship between two variable
9. Analyze exploratory factors
3.7.1 Descriptive Analysis
In this study, frequency distribution is used to analyze the demographics or
general profile information of respondent under part A of questionnaire. For
instance, to identify the respondent’s gender, age range, race, religion, marital
status, education level, and departmentalization.
3.7.2 Scale Measurement
The scale of measurement in this research is to test the reliability of the responses
in questionnaires. The researchers use the Software Package for Social Sciences
(SPSS version 16.0) in this research to determine the reliability. Reliability is the
degree of error-free and yield consistent result (Zikmund, 2003). Cronbach‟s
Alpha is reliability coefficient that indicates how well the items in a set are
positively correlated to one another, Generally, scales with coefficient alpha
between 0.8 and 0.95 is very good reliability, 0.7-0.79 is good reliability, 0.6-0.69
is fair reliability and below 0.6 is poor reliability.
3.7.3 Inferential Analysis
Based on the questionnaires, there are including four independent variables and
one dependent variable. Both of them are metric variables and under interval
scale. Therefore, we are choosing Person Correlation Coefficient to test on the
relationship between the dependent and independent variable and Multiple
A study on the impacts toward the loyalty of the employee among the back of house staffs in hotel industry. 2012
Page 38 of 98
Regression Analysis to test on the group relationship between the group of
independent and a dependent variable.
3.8 Conclusion
One of the most valuable assets of organization is a stable work force. Since hotel
industry has high turnover rate while Grand Kampar Hotel might face employee
loyalty problem. The factors contributing to the loyalty of the work force are
extremely important to the health of an organization. This study shows four factors
that affected the sense of loyalty an employee for his organization.
This chapter described the method uses to conduct the research study, sample size,
data analysis techniques and the progression of completing the research study. The
sampling size of this study is 160 respondents from the hotel located in Kampar and
Tapah area. Moreover, the construct of questionnaire is discussed. It also tests the
hypothesis by using multiple regression analysis and Pearson correlation and
coefficient analysis in which result of the statistical analysis will be interpreted. We
complete all parts in chapter 3 with the evaluation of the research method for the
research study.
A study on the impacts toward the loyalty of the employee among the back of house staffs in hotel industry. 2012
Page 39 of 98
Chapter 4: Data Analysis
4.0 Introduction
In the previous chapter, 30 target respondents will be targeted for pilot test and 160
responses will be collected from the targeted respondents. This chapter will illustrate
the major methodologies used to collect data and to conduct detail analysis on the
collected data. Then the data will be analyzed and processed by using Statistical
Package social Science (SPSS) software. This chapter starts with the descriptive
analysis for the targeted respondent’s demographic profile and central tendencies
measurement of constructs. Then scale measurement is developed to provide the
result of reliability test. Next is the inferential analysis with the Pearson correlation
analysis and this is followed by the multiple linear regression analysis. It is aimed to
examine the proposed hypothesis (relationship with supervisor, recognitions and
rewards, working condition and teamwork and cooperation).
4.1 Description Analysis
Seven questions were asked under the demographic profile section in questionnaire
which is included the gender, ethnic, marital status, age, working position; education
level and how long had been working.
4.1.1 Respondents’ Demographic Profile
4.1.1.1 Gender
Table 4.1: Gender of Respondents
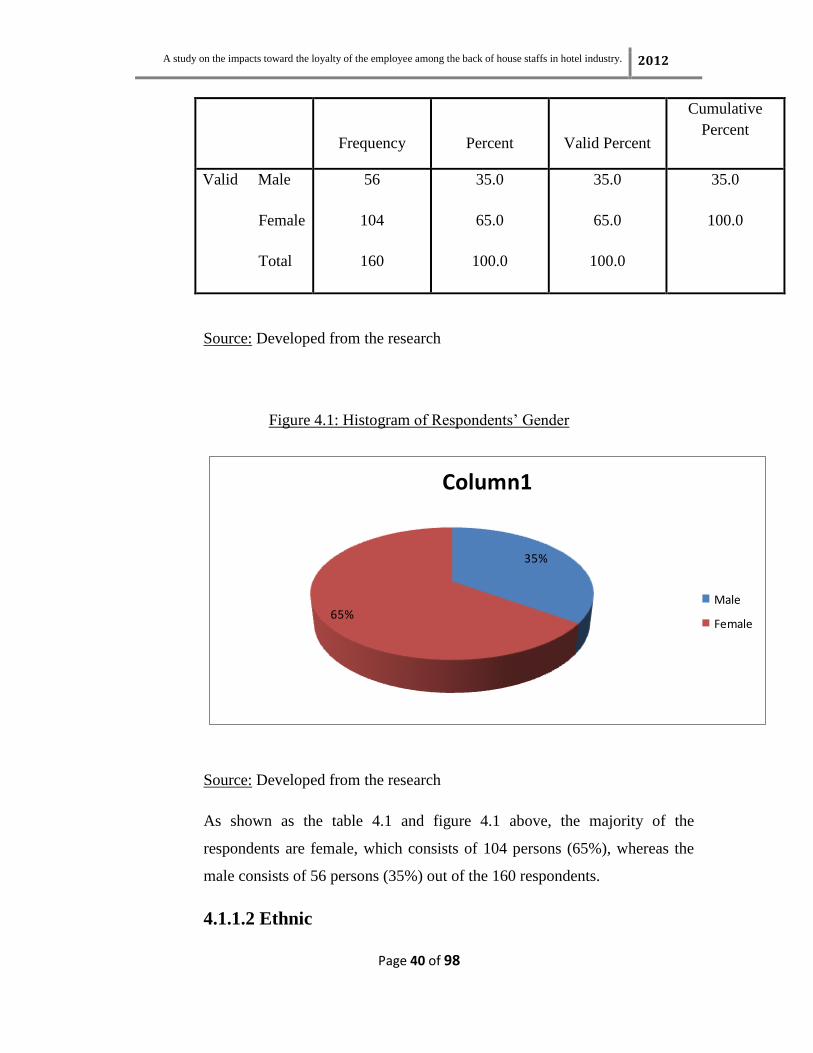
A study on the impacts toward the loyalty of the employee among the back of house staffs in hotel industry. 2012
Page 40 of 98
Frequency
Percent
Valid Percent
Cumulative
Percent
Valid Male
Female
Total
56
104
160
35.0
65.0
100.0
35.0
65.0
100.0
35.0
100.0
Source: Developed from the research
Figure 4.1: Histogram of Respondents’ Gender
35%
65%
Column1
Male
Female
Source: Developed from the research
As shown as the table 4.1 and figure 4.1 above, the majority of the
respondents are female, which consists of 104 persons (65%), whereas the
male consists of 56 persons (35%) out of the 160 respondents.
4.1.1.2 Ethnic
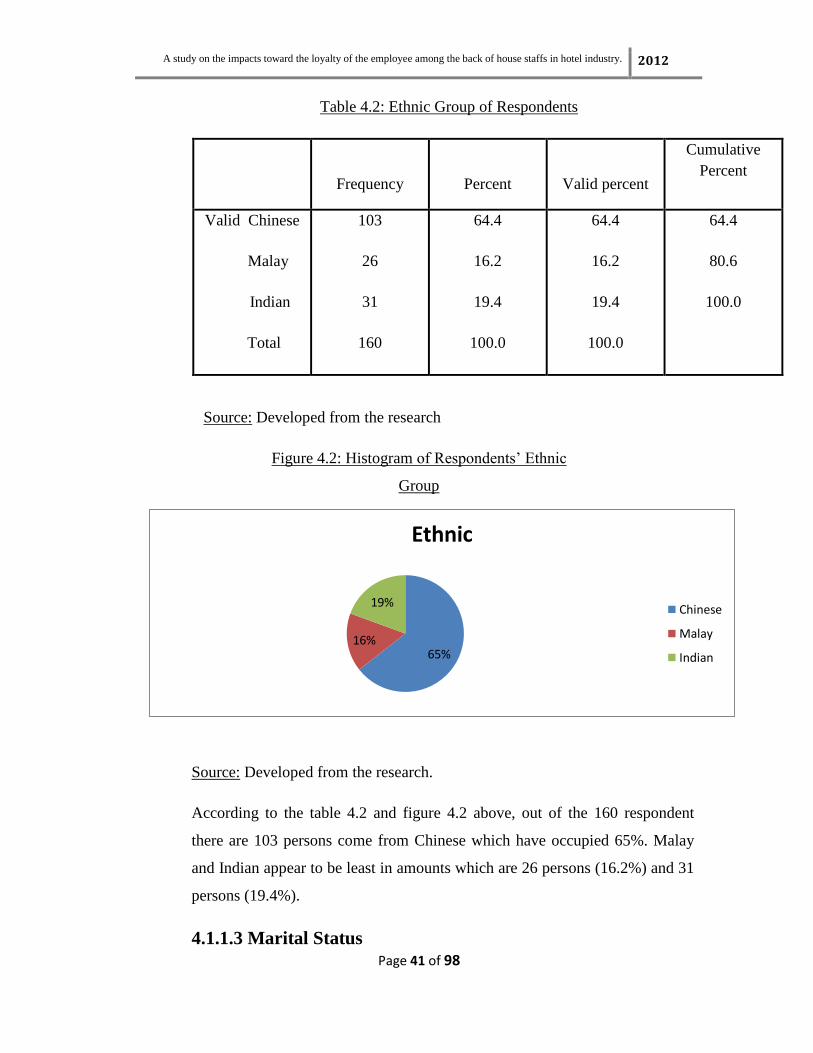
A study on the impacts toward the loyalty of the employee among the back of house staffs in hotel industry. 2012
Page 41 of 98
Table 4.2: Ethnic Group of Respondents
Frequency
Percent
Valid percent
Cumulative
Percent
Valid Chinese
Malay
Indian
Total
103
26
31
160
64.4
16.2
19.4
100.0
64.4
16.2
19.4
100.0
64.4
80.6
100.0
Source: Developed from the research
Figure 4.2: Histogram of Respondents’ Ethnic
Group
65%16%
19%
Ethnic
Chinese
Malay
Indian
Source: Developed from the research.
According to the table 4.2 and figure 4.2 above, out of the 160 respondent
there are 103 persons come from Chinese which have occupied 65%. Malay
and Indian appear to be least in amounts which are 26 persons (16.2%) and 31
persons (19.4%).
4.1.1.3 Marital Status
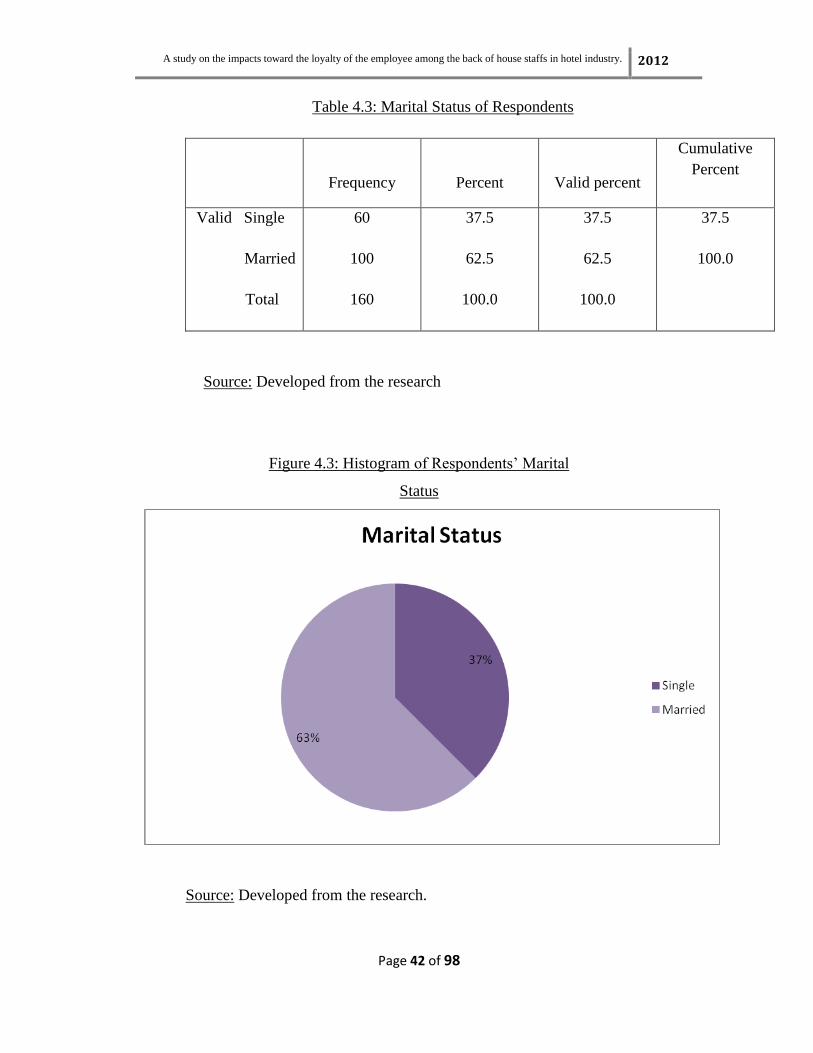
A study on the impacts toward the loyalty of the employee among the back of house staffs in hotel industry. 2012
Page 42 of 98
Table 4.3: Marital Status of Respondents
Frequency
Percent
Valid percent
Cumulative
Percent
Valid Single
Married
Total
60
100
160
37.5
62.5
100.0
37.5
62.5
100.0
37.5
100.0
Source: Developed from the research
Figure 4.3: Histogram of Respondents’ Marital
Status
Source: Developed from the research.
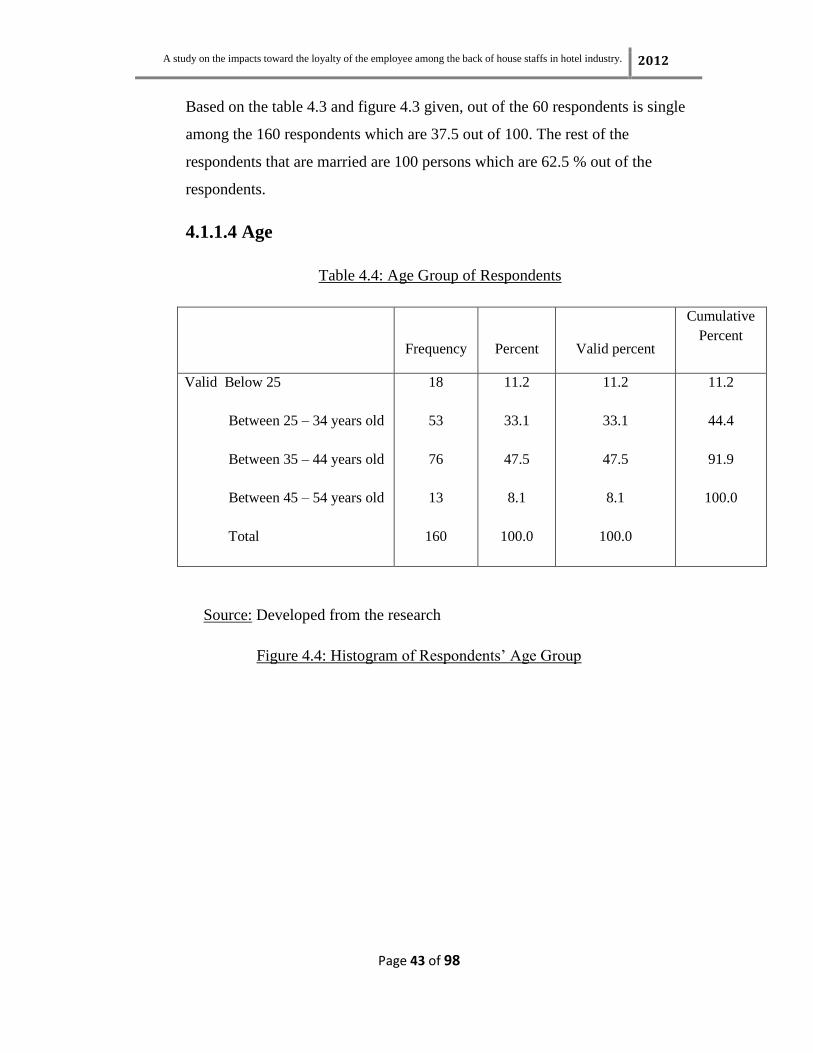
A study on the impacts toward the loyalty of the employee among the back of house staffs in hotel industry. 2012
Page 43 of 98
Based on the table 4.3 and figure 4.3 given, out of the 60 respondents is single
among the 160 respondents which are 37.5 out of 100. The rest of the
respondents that are married are 100 persons which are 62.5 % out of the
respondents.
4.1.1.4 Age
Table 4.4: Age Group of Respondents
Frequency
Percent
Valid percent
Cumulative
Percent
Valid Below 25
Between 25 – 34 years old
Between 35 – 44 years old
Between 45 – 54 years old
Total
18
53
76
13
160
11.2
33.1
47.5
8.1
100.0
11.2
33.1
47.5
8.1
100.0
11.2
44.4
91.9
100.0
Source: Developed from the research
Figure 4.4: Histogram of Respondents’ Age Group
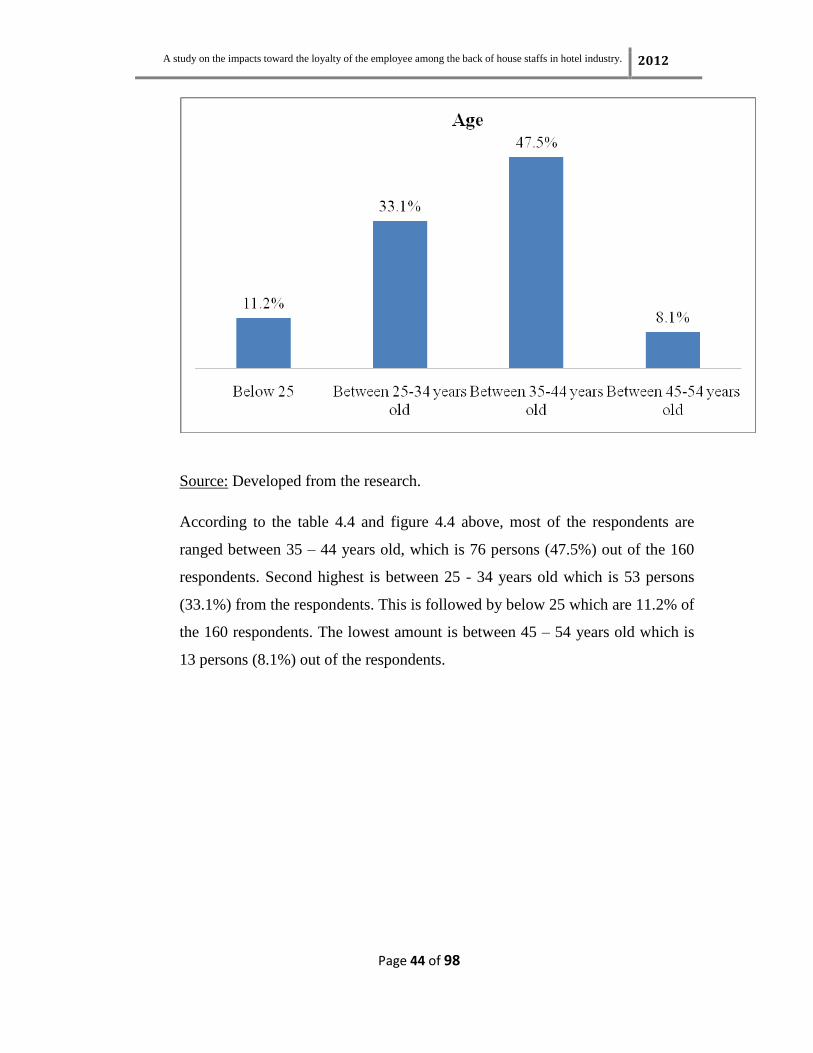
A study on the impacts toward the loyalty of the employee among the back of house staffs in hotel industry. 2012
Page 44 of 98
Source: Developed from the research.
According to the table 4.4 and figure 4.4 above, most of the respondents are
ranged between 35 – 44 years old, which is 76 persons (47.5%) out of the 160
respondents. Second highest is between 25 - 34 years old which is 53 persons
(33.1%) from the respondents. This is followed by below 25 which are 11.2% of
the 160 respondents. The lowest amount is between 45 – 54 years old which is
13 persons (8.1%) out of the respondents.
A study on the impacts toward the loyalty of the employee among the back of house staffs in hotel industry. 2012
Page 45 of 98
4.1.1.5 Working Position
Table 4.5: Working Position of Respondents
Frequency
Percent
Valid percent
Cumulative
Percent
Valid Kitchen assistant
Section chef
Under-chef
Chief of chef
Dessert chef
Dishwasher
Executive housekeeper
Chief of housekeeper
Deputy housekeeper
Human resource
administer
Human resource officer
Total
7
26
17
3
3
8
6
16
50
18
6
160
4.4
16.2
10.6
1.9
1.9
5.0
3.8
10.0
31.2
11.2
3.8
100.0
4.4
16.2
10.6
1.9
1.9
5.0
3.8
10.0
31.2
11.2
3.8
100.0
4.4
20.6
31.2
33.1
35.0
40.0
43.8
53.8
85.0
96.2
100.0
Source: Developed from the research
Figure 4.5: Histogram of Respondents’ Working Position

A study on the impacts toward the loyalty of the employee among the back of house staffs in hotel industry. 2012
Page 46 of 98
Source: Developed from the research.
From the questionnaires collected, working position of the 160 respondents
included kitchen assistant, section chef, under-chef, chief of chef, dessert chef,
dishwasher, executive housekeeper, chief of housekeeper, deputy housekeeper,
human resource administer and human resource officer. Most of the respondents
deputy housekeeper which have occupied 31.2%, followed by section chef and
human resource administer, which is 16.2% and 11.2% respectively. The lowest
percentage of respondent’s working position is chief of chef and dessert chef,
both of the position is only 1.9% from the 160 respondents.
A study on the impacts toward the loyalty of the employee among the back of house staffs in hotel industry. 2012
Page 47 of 98
4.1.1.6 Education Level
Table 4.6: Education Level of Respondents
Frequency
Percent
Valid
percent
Cumulative
Percent
Valid Less than higher school
SPM
STPM or other similar
Level of Pre-
Universities
Program
Diploma
Degree
Total
13
66
10
48
23
160
8.1
41.2
6.2
30.0
14.4
100.0
8.1
41.2
6.2
30.0
14.4
100.0
8.1
49.4
55.6
85.6
100.0
Source: Developed from the research.
Figure 4.6: Histogram of Respondents’ Education Level

A study on the impacts toward the loyalty of the employee among the back of house staffs in hotel industry. 2012
Page 48 of 98
Source: Developed from the research.
Based on the figure 4.6, most of the respondents are come from SPM which
consists of 66 persons, occupied 41.2% of the 160 respondents. This followed by
the Diploma which is consists of 48 persons (30.0%) out of the respondents. The
lowest education level of the respondents is STPM or other similar level of Per-
Universities Program which is only 6.2% of the respondents.
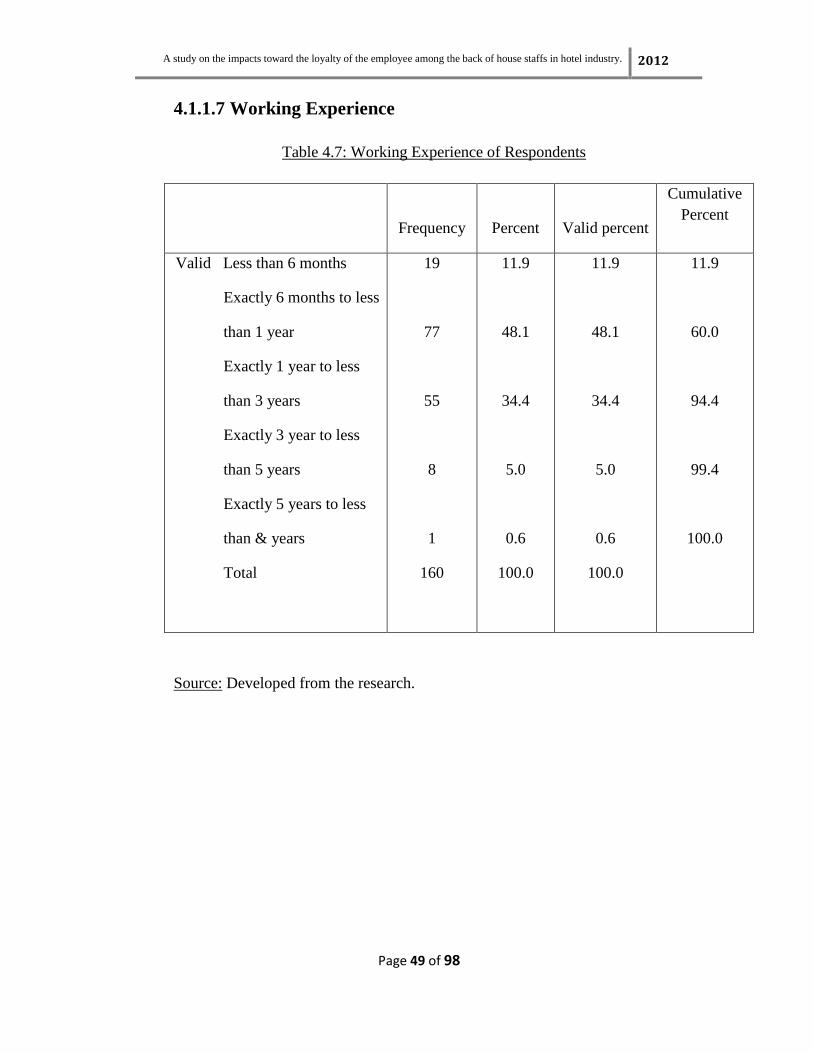
A study on the impacts toward the loyalty of the employee among the back of house staffs in hotel industry. 2012
Page 49 of 98
4.1.1.7 Working Experience
Table 4.7: Working Experience of Respondents
Frequency
Percent
Valid percent
Cumulative
Percent
Valid Less than 6 months
Exactly 6 months to less
than 1 year
Exactly 1 year to less
than 3 years
Exactly 3 year to less
than 5 years
Exactly 5 years to less
than & years
Total
19
77
55
8
1
160
11.9
48.1
34.4
5.0
0.6
100.0
11.9
48.1
34.4
5.0
0.6
100.0
11.9
60.0
94.4
99.4
100.0
Source: Developed from the research.
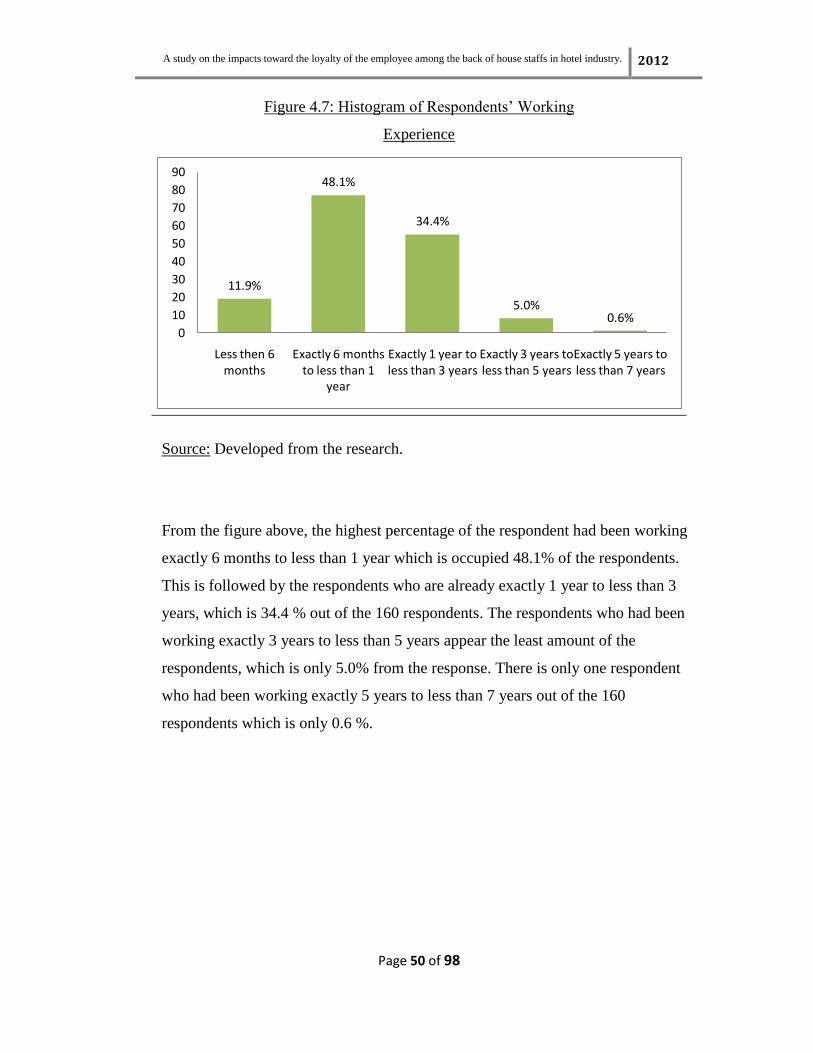
A study on the impacts toward the loyalty of the employee among the back of house staffs in hotel industry. 2012
Page 50 of 98
Figure 4.7: Histogram of Respondents’ Working
Experience
11.9%
48.1%
34.4%
5.0%0.6%
0
10
20
30
40
50
60
70
80
90
Less then 6 months
Exactly 6 months to less than 1
year
Exactly 1 year to less than 3 years
Exactly 3 years to less than 5 years
Exactly 5 years to less than 7 years
Source: Developed from the research.
From the figure above, the highest percentage of the respondent had been working
exactly 6 months to less than 1 year which is occupied 48.1% of the respondents.
This is followed by the respondents who are already exactly 1 year to less than 3
years, which is 34.4 % out of the 160 respondents. The respondents who had been
working exactly 3 years to less than 5 years appear the least amount of the
respondents, which is only 5.0% from the response. There is only one respondent
who had been working exactly 5 years to less than 7 years out of the 160
respondents which is only 0.6 %.
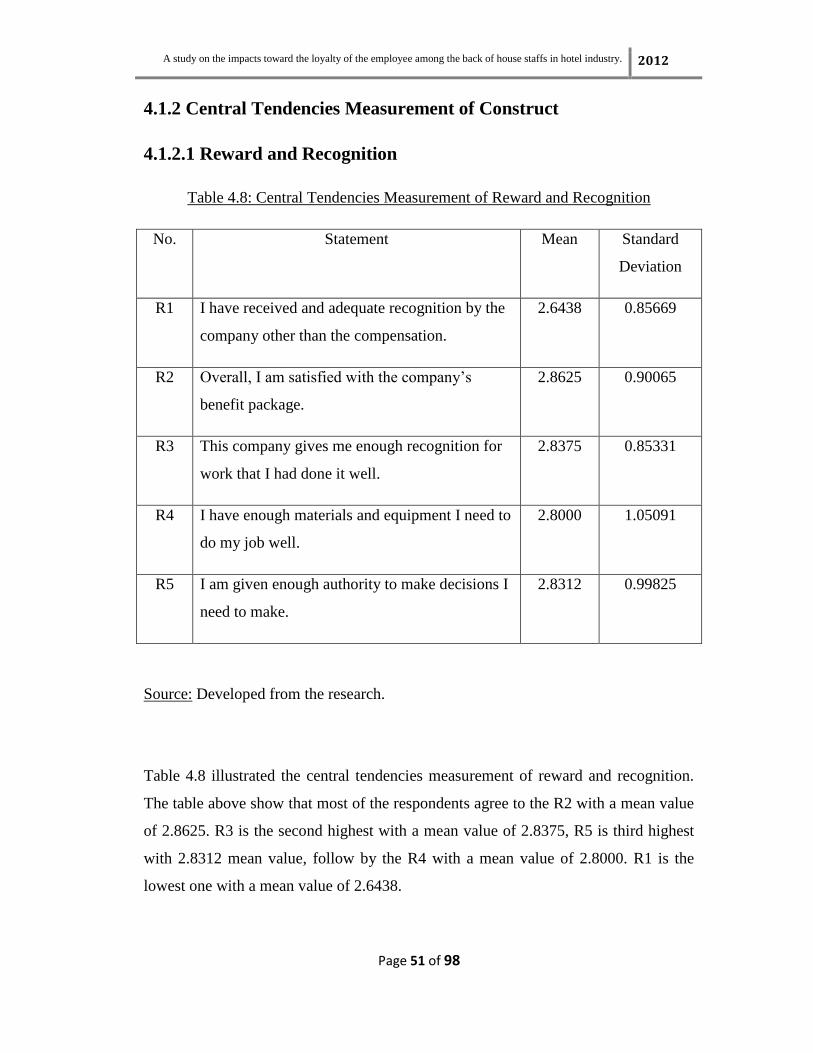
A study on the impacts toward the loyalty of the employee among the back of house staffs in hotel industry. 2012
Page 51 of 98
4.1.2 Central Tendencies Measurement of Construct
4.1.2.1 Reward and Recognition
Table 4.8: Central Tendencies Measurement of Reward and Recognition
No. Statement Mean Standard
Deviation
R1 I have received and adequate recognition by the
company other than the compensation.
2.6438 0.85669
R2 Overall, I am satisfied with the company’s
benefit package.
2.8625 0.90065
R3 This company gives me enough recognition for
work that I had done it well.
2.8375 0.85331
R4 I have enough materials and equipment I need to
do my job well.
2.8000 1.05091
R5 I am given enough authority to make decisions I
need to make.
2.8312 0.99825
Source: Developed from the research.
Table 4.8 illustrated the central tendencies measurement of reward and recognition.
The table above show that most of the respondents agree to the R2 with a mean value
of 2.8625. R3 is the second highest with a mean value of 2.8375, R5 is third highest
with 2.8312 mean value, follow by the R4 with a mean value of 2.8000. R1 is the
lowest one with a mean value of 2.6438.

A study on the impacts toward the loyalty of the employee among the back of house staffs in hotel industry. 2012
Page 52 of 98
According to the table above, R4 has the highest value of standard deviation with
1.05091. R5 is second highest of standard deviation with 0.99825, R2 and R1 is the
third and forth with a respectively standard deviation value of 0.90065 and 0.85669.
The lowest one is R3 is with a value 0.85331.
4.1.2.2 Working Condition
Table 4.9: Central Tendencies Measurement of Working Condition
No. Statement Mean Standard
Deviation
W1 My job is secure. 2.9188 0.94484
W2 My physical working conditions are good. 2.8750 0.95001
W3 My workload is reasonable 2.9312 0.83268
Source: Developed from the research.
The Table 4.9 illustrated that the central tendencies measurement of working
condition. Based on the table 4.9 above, W3 has the highest value of mean with
2.9312, follow by the W1 and W2 with the mean value of 2.9188 and 2.8750. The
highest standard deviation value is under W2 with 0.95001, follow by the W1 and W3
with the value of 0.94484 and 0.83268.
4.1.2.3 Relationship with Supervisor
Table 4.10: Central Tendencies Measurement of Relationship with Supervisor
No. Statement Mean Standard
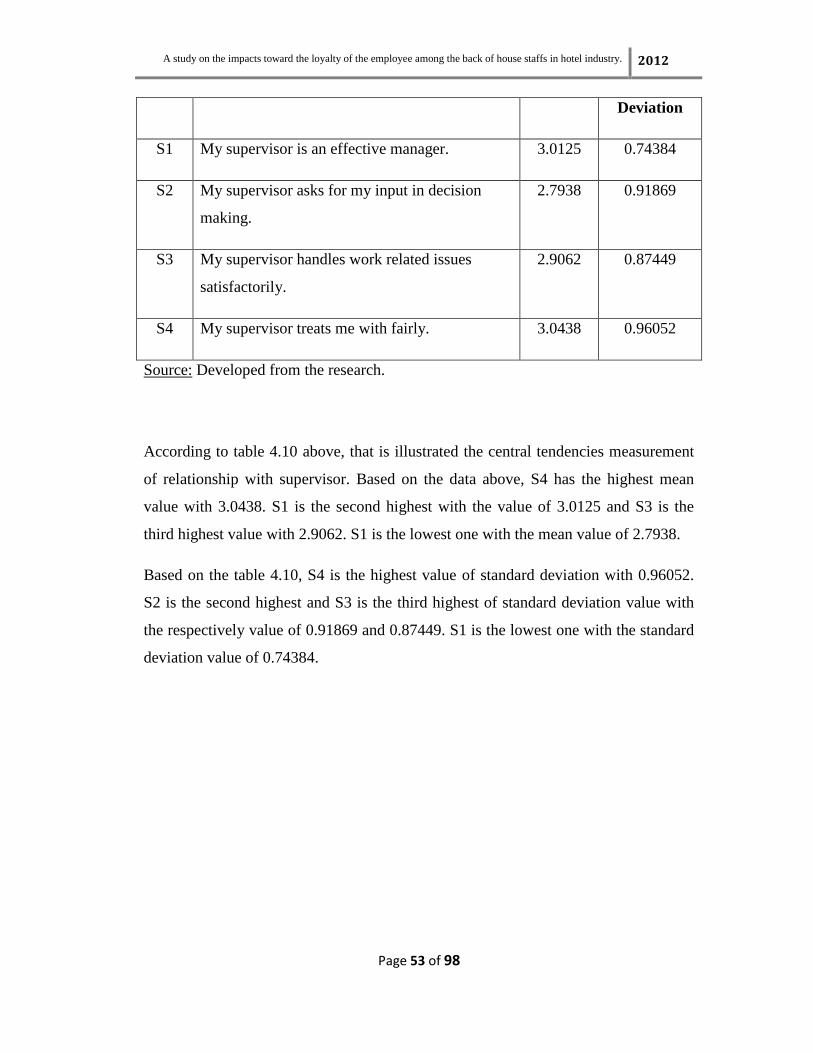
A study on the impacts toward the loyalty of the employee among the back of house staffs in hotel industry. 2012
Page 53 of 98
Deviation
S1 My supervisor is an effective manager. 3.0125 0.74384
S2 My supervisor asks for my input in decision
making.
2.7938 0.91869
S3 My supervisor handles work related issues
satisfactorily.
2.9062 0.87449
S4 My supervisor treats me with fairly. 3.0438 0.96052
Source: Developed from the research.
According to table 4.10 above, that is illustrated the central tendencies measurement
of relationship with supervisor. Based on the data above, S4 has the highest mean
value with 3.0438. S1 is the second highest with the value of 3.0125 and S3 is the
third highest value with 2.9062. S1 is the lowest one with the mean value of 2.7938.
Based on the table 4.10, S4 is the highest value of standard deviation with 0.96052.
S2 is the second highest and S3 is the third highest of standard deviation value with
the respectively value of 0.91869 and 0.87449. S1 is the lowest one with the standard
deviation value of 0.74384.
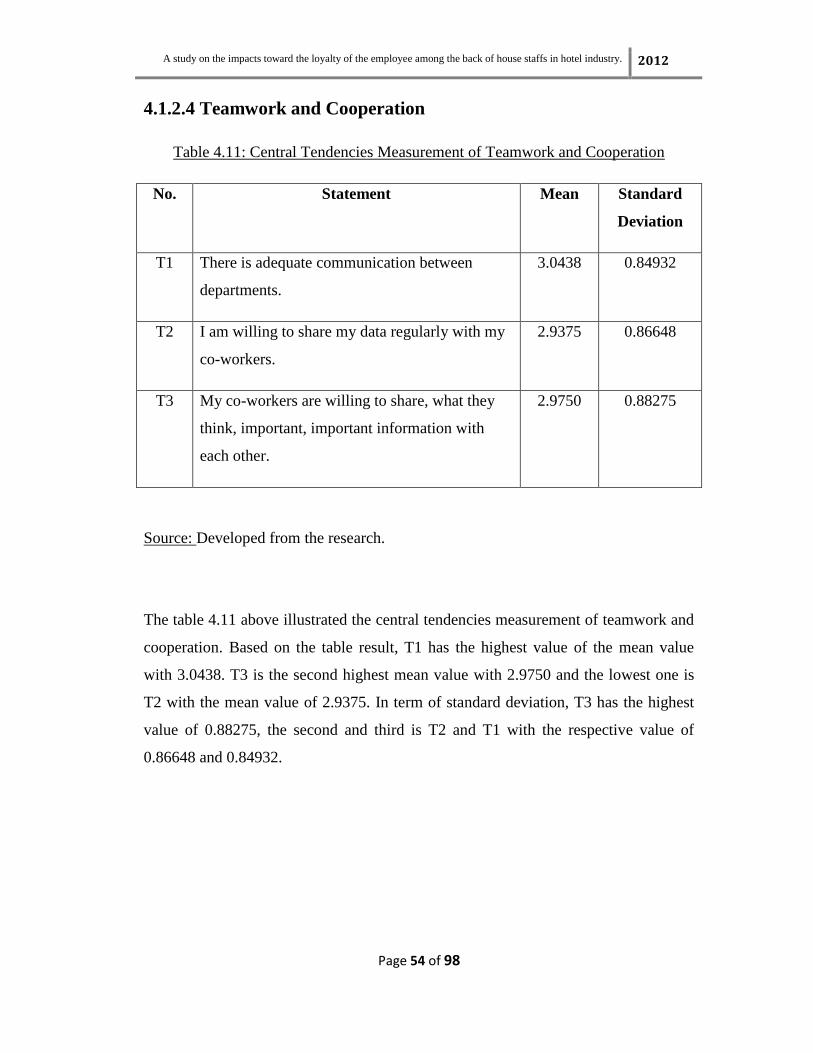
A study on the impacts toward the loyalty of the employee among the back of house staffs in hotel industry. 2012
Page 54 of 98
4.1.2.4 Teamwork and Cooperation
Table 4.11: Central Tendencies Measurement of Teamwork and Cooperation
No. Statement Mean Standard
Deviation
T1 There is adequate communication between
departments.
3.0438 0.84932
T2 I am willing to share my data regularly with my
co-workers.
2.9375 0.86648
T3 My co-workers are willing to share, what they
think, important, important information with
each other.
2.9750 0.88275
Source: Developed from the research.
The table 4.11 above illustrated the central tendencies measurement of teamwork and
cooperation. Based on the table result, T1 has the highest value of the mean value
with 3.0438. T3 is the second highest mean value with 2.9750 and the lowest one is
T2 with the mean value of 2.9375. In term of standard deviation, T3 has the highest
value of 0.88275, the second and third is T2 and T1 with the respective value of
0.86648 and 0.84932.
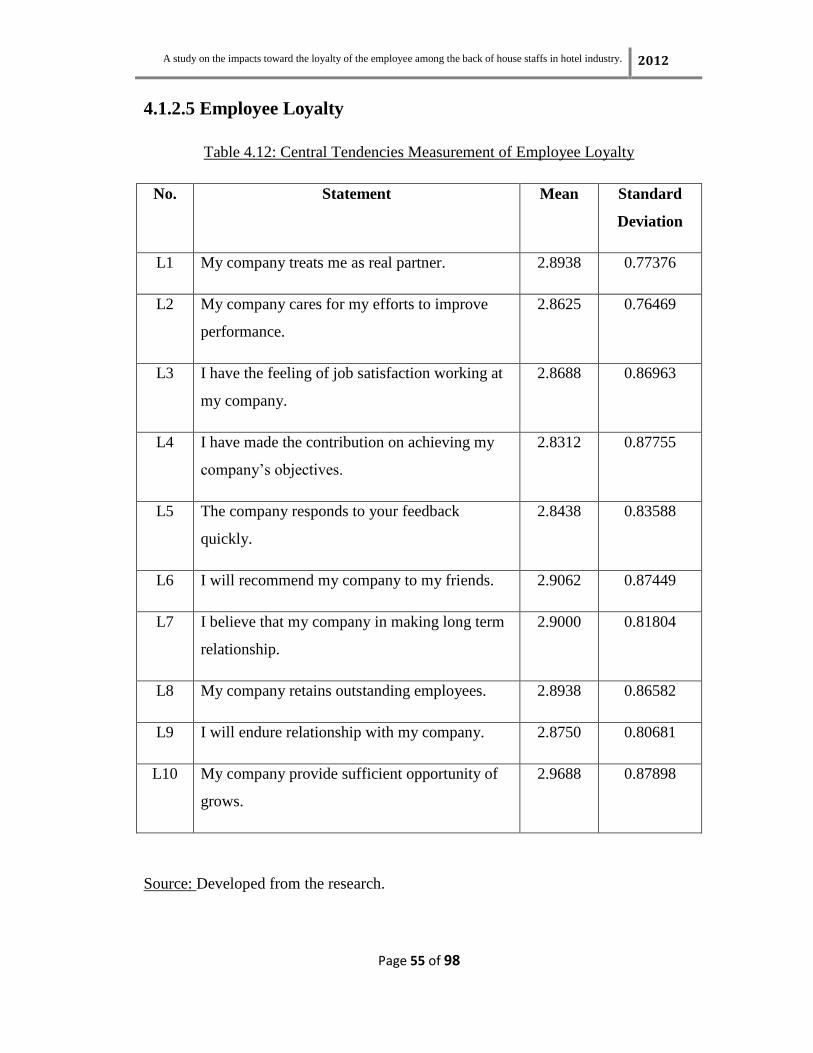
A study on the impacts toward the loyalty of the employee among the back of house staffs in hotel industry. 2012
Page 55 of 98
4.1.2.5 Employee Loyalty
Table 4.12: Central Tendencies Measurement of Employee Loyalty
No. Statement Mean Standard
Deviation
L1 My company treats me as real partner. 2.8938 0.77376
L2 My company cares for my efforts to improve
performance.
2.8625 0.76469
L3 I have the feeling of job satisfaction working at
my company.
2.8688 0.86963
L4 I have made the contribution on achieving my
company’s objectives.
2.8312 0.87755
L5 The company responds to your feedback
quickly.
2.8438 0.83588
L6 I will recommend my company to my friends. 2.9062 0.87449
L7 I believe that my company in making long term
relationship.
2.9000 0.81804
L8 My company retains outstanding employees. 2.8938 0.86582
L9 I will endure relationship with my company. 2.8750 0.80681
L10 My company provide sufficient opportunity of
grows.
2.9688 0.87898
Source: Developed from the research.
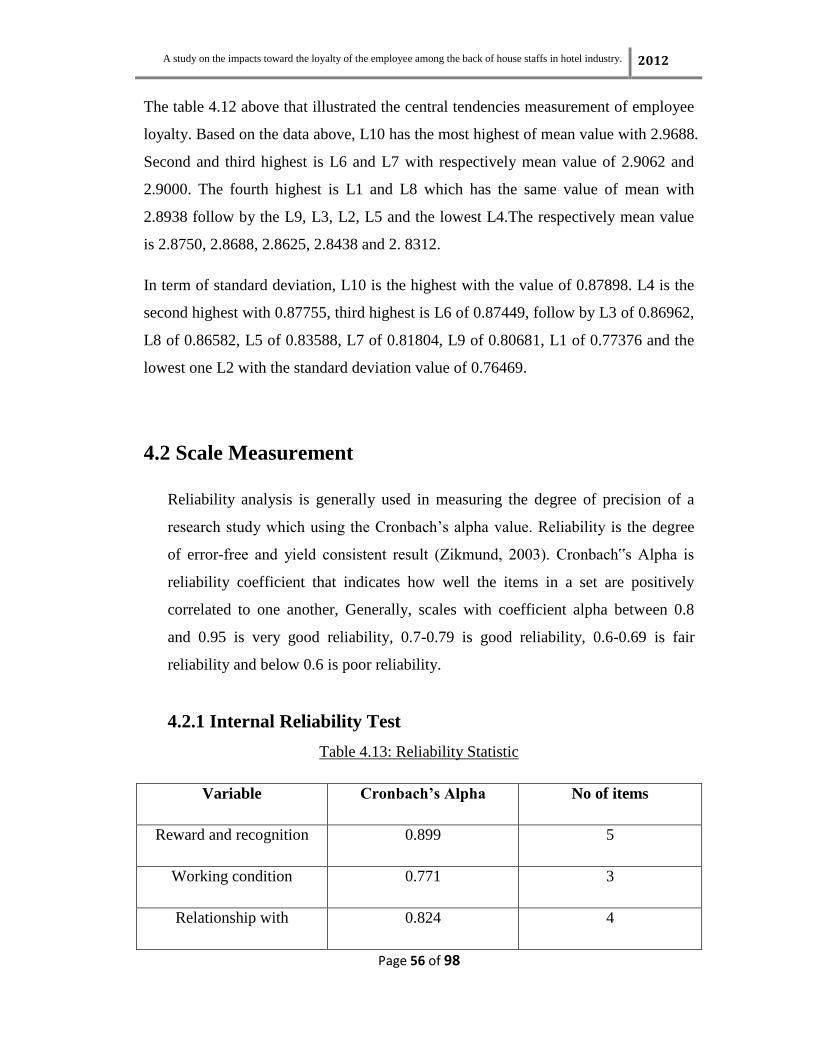
A study on the impacts toward the loyalty of the employee among the back of house staffs in hotel industry. 2012
Page 56 of 98
The table 4.12 above that illustrated the central tendencies measurement of employee
loyalty. Based on the data above, L10 has the most highest of mean value with 2.9688.
Second and third highest is L6 and L7 with respectively mean value of 2.9062 and
2.9000. The fourth highest is L1 and L8 which has the same value of mean with
2.8938 follow by the L9, L3, L2, L5 and the lowest L4.The respectively mean value
is 2.8750, 2.8688, 2.8625, 2.8438 and 2. 8312.
In term of standard deviation, L10 is the highest with the value of 0.87898. L4 is the
second highest with 0.87755, third highest is L6 of 0.87449, follow by L3 of 0.86962,
L8 of 0.86582, L5 of 0.83588, L7 of 0.81804, L9 of 0.80681, L1 of 0.77376 and the
lowest one L2 with the standard deviation value of 0.76469.
4.2 Scale Measurement
Reliability analysis is generally used in measuring the degree of precision of a
research study which using the Cronbach’s alpha value. Reliability is the degree
of error-free and yield consistent result (Zikmund, 2003). Cronbach‟s Alpha is
reliability coefficient that indicates how well the items in a set are positively
correlated to one another, Generally, scales with coefficient alpha between 0.8
and 0.95 is very good reliability, 0.7-0.79 is good reliability, 0.6-0.69 is fair
reliability and below 0.6 is poor reliability.
4.2.1 Internal Reliability Test
Table 4.13: Reliability Statistic
Variable Cronbach’s Alpha No of items
Reward and recognition 0.899 5
Working condition 0.771 3
Relationship with 0.824 4
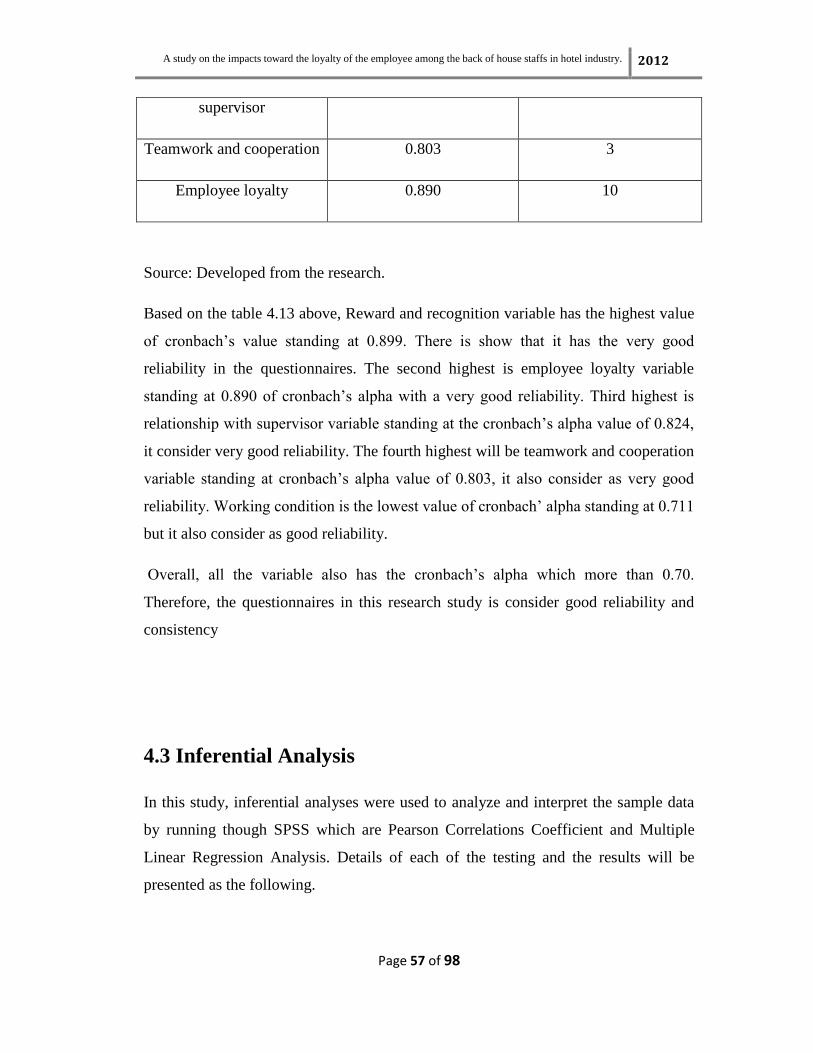
A study on the impacts toward the loyalty of the employee among the back of house staffs in hotel industry. 2012
Page 57 of 98
supervisor
Teamwork and cooperation 0.803 3
Employee loyalty 0.890 10
Source: Developed from the research.
Based on the table 4.13 above, Reward and recognition variable has the highest value
of cronbach’s value standing at 0.899. There is show that it has the very good
reliability in the questionnaires. The second highest is employee loyalty variable
standing at 0.890 of cronbach’s alpha with a very good reliability. Third highest is
relationship with supervisor variable standing at the cronbach’s alpha value of 0.824,
it consider very good reliability. The fourth highest will be teamwork and cooperation
variable standing at cronbach’s alpha value of 0.803, it also consider as very good
reliability. Working condition is the lowest value of cronbach’ alpha standing at 0.711
but it also consider as good reliability.
Overall, all the variable also has the cronbach’s alpha which more than 0.70.
Therefore, the questionnaires in this research study is consider good reliability and
consistency
4.3 Inferential Analysis
In this study, inferential analyses were used to analyze and interpret the sample data
by running though SPSS which are Pearson Correlations Coefficient and Multiple
Linear Regression Analysis. Details of each of the testing and the results will be
presented as the following.
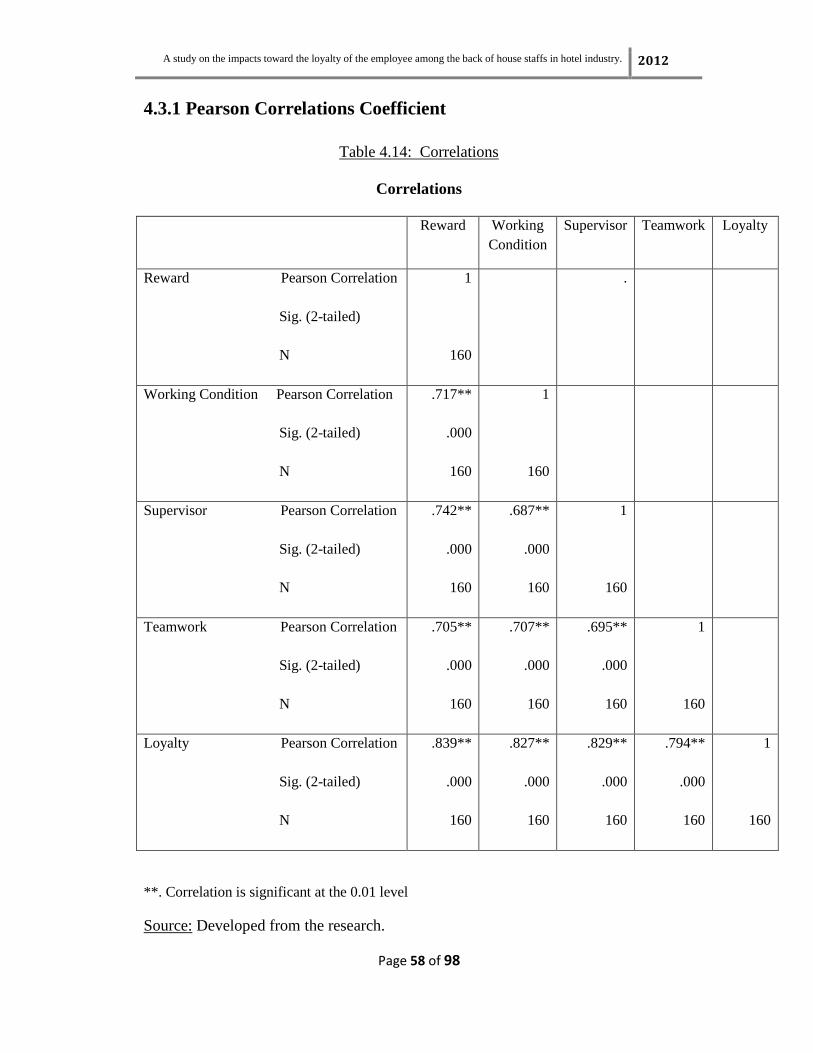
A study on the impacts toward the loyalty of the employee among the back of house staffs in hotel industry. 2012
Page 58 of 98
4.3.1 Pearson Correlations Coefficient
Table 4.14: Correlations
Correlations
Reward Working
Condition
Supervisor Teamwork Loyalty
Reward Pearson Correlation
Sig. (2-tailed)
N
1
160
.
Working Condition Pearson Correlation
Sig. (2-tailed)
N
.717**
.000
160
1
160
Supervisor Pearson Correlation
Sig. (2-tailed)
N
.742**
.000
160
.687**
.000
160
1
160
Teamwork Pearson Correlation
Sig. (2-tailed)
N
.705**
.000
160
.707**
.000
160
.695**
.000
160
1
160
Loyalty Pearson Correlation
Sig. (2-tailed)
N
.839**
.000
160
.827**
.000
160
.829**
.000
160
.794**
.000
160
1
160
**. Correlation is significant at the 0.01 level
Source: Developed from the research.

A study on the impacts toward the loyalty of the employee among the back of house staffs in hotel industry. 2012
Page 59 of 98
Table 4.15: Pearson Correlation Coefficient
Coefficient Range Strength
± 0.91 to ± 1.00 Very strong
± 0.71 to ± 0.90 High
± 0.41 to ± 0.70 Moderate
± 0.21 to ± 0.40 Small but definite relationship
± 0.00 to ± 0.20 Slight, almost negligible
Source: Pearson Correlation Coefficient from Hair, et al. (2007)
In this study, Pearson Correlation Coefficient was used to test H1 of the
independent variables (relationship with supervisor, recognitions and rewards,
working condition and teamwork and cooperation) with the dependent variable
(Employee Loyalty). This testing indicates the direction, strength, and significance
among all the variables that. The standard of the alpha level usually set the value at
0.05 for two-wailed tests, therefore, if the p-value is less than or equal to the alpha
value (p ≤ 0.05), the null hypothesis need to be rejected and mean that there is
significant between the variables.
4.3.1.1 Hypothesis 1
H0 = There is no significant relationship between relationship between supervisor
and the loyalty among the back of house staffs in hotel industry.
H1= There is a significant relationship between relationship between supervisor
and the loyalty among the back of house staffs in hotel industry.
A study on the impacts toward the loyalty of the employee among the back of house staffs in hotel industry. 2012
Page 60 of 98
From the table 4.14, correlation between relationship between supervisor and
back of house staff loyalty is 0.829, so that is a positive correlation between the
two variables. If the relationship between supervisors is closer, the back of house
staff loyalty will increase. The value of this correlation coefficient r = 0.829 is
fall under the range ± 0.71 to ± 0.90 which show that there is a high relationship
between the both dependant and independent variable. The P-value is 0.00 which
is less than 0.05. Therefore, we can prove that H1 is accepted and there is a
significant positive relationship between relationship between supervisors and
back of house staff loyalty.
4.3.1.2 Hypothesis 2
H0 = There is no significant relationship between recognitions and rewards and
the loyalty among the back of house staffs in hotel industry.
H2= There is a significant relationship between recognitions and rewards and the
loyalty among the back of house staffs in hotel industry.
From the table 4.14, correlation between relationship between supervisor and
back of house staff loyalty is 0.839, so that is a positive correlation between the
two variables. If the recognitions and rewards given are higher, the back of house
staff loyalty will increase. The value of this correlation coefficient r = 0.839 is
fall under the range ± 0.71 to ± 0.90 which show that there is a high relationship
between the both dependant and independent variable. The P-value is 0.00 which
is less than 0.05. Therefore, we can prove that H1 is accepted and there is a
significant positive relationship between recognitions and rewards and back of
house staff loyalty.
A study on the impacts toward the loyalty of the employee among the back of house staffs in hotel industry. 2012
Page 61 of 98
4.3.1.3 Hypothesis 3
H0 = There is no significant relationship between working condition and the
loyalty among the back of house staffs in hotel industry.
H3= There is a significant relationship between working condition and the loyalty
among the back of house staffs in hotel industry.
From the table 4.14, correlation between working condition and back of house
staff loyalty is 0.827, so that is a positive correlation between the two variables.
If the working condition is better, the back of house staff loyalty will increase.
The value of this correlation coefficient r = 0.827 is fall under the range ± 0.71 to
± 0.90 which show that there is a high relationship between the both dependant
and independent variable. The P-value is 0.00 which is less than 0.05. Therefore,
we can prove that H1 is accepted and there is a significant positive relationship
between working condition and back of house staff loyalty.
4.3.1.4 Hypothesis 4
H0 = There is no significant relationship between teamwork and the loyalty
among the back of house staffs in hotel industry.
H4= There is a significant relationship between teamwork and the loyalty among
the back of house staffs in hotel industry.
From the table 4.14, correlation between teamwork and back of house staff
loyalty is 0.794, so that is a positive correlation between the two variables. If the
teamwork in company is better, the back of house staff loyalty will increase. The
value of this correlation coefficient r = 0.794 is fall under the range ± 0.71 to ±
0.90 which show that there is a high relationship between the both dependant and
independent variable. The P-value is 0.00 which is less than 0.05. Therefore, we
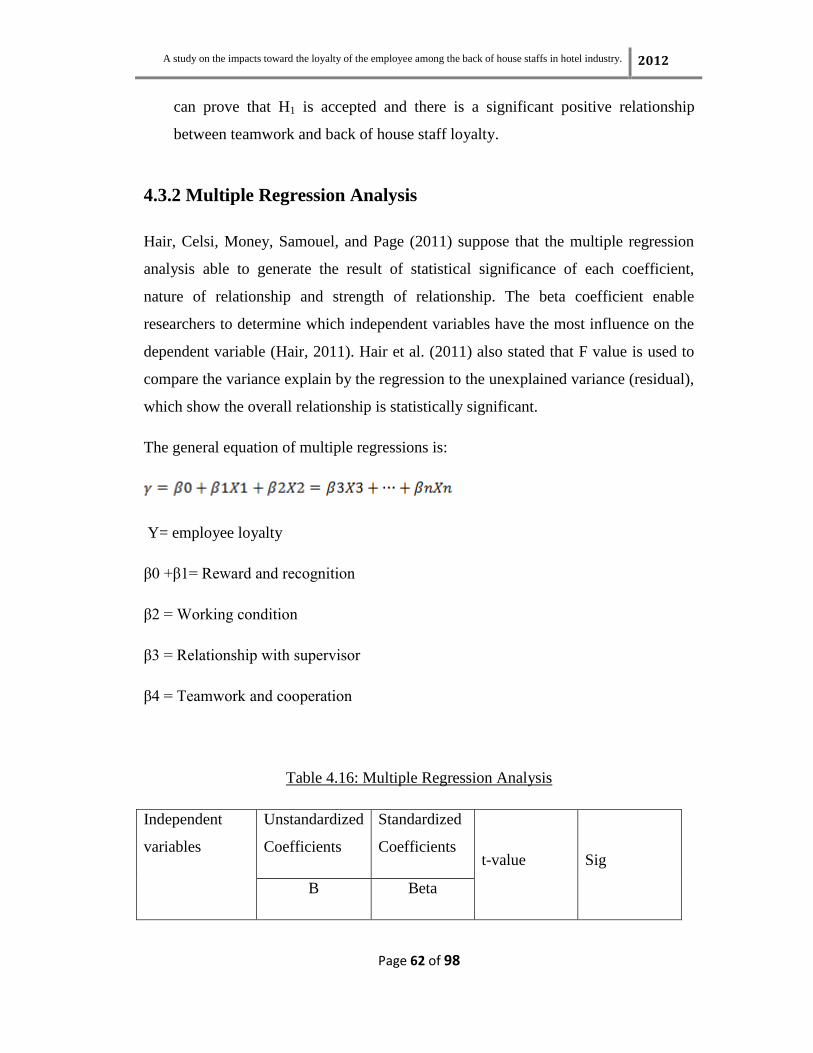
A study on the impacts toward the loyalty of the employee among the back of house staffs in hotel industry. 2012
Page 62 of 98
can prove that H1 is accepted and there is a significant positive relationship
between teamwork and back of house staff loyalty.
4.3.2 Multiple Regression Analysis
Hair, Celsi, Money, Samouel, and Page (2011) suppose that the multiple regression
analysis able to generate the result of statistical significance of each coefficient,
nature of relationship and strength of relationship. The beta coefficient enable
researchers to determine which independent variables have the most influence on the
dependent variable (Hair, 2011). Hair et al. (2011) also stated that F value is used to
compare the variance explain by the regression to the unexplained variance (residual),
which show the overall relationship is statistically significant.
The general equation of multiple regressions is:
Y= employee loyalty
β0 +β1= Reward and recognition
β2 = Working condition
β3 = Relationship with supervisor
β4 = Teamwork and cooperation
Table 4.16: Multiple Regression Analysis
Independent
variables
Unstandardized
Coefficients
Standardized
Coefficients
t-value
Sig
B Beta
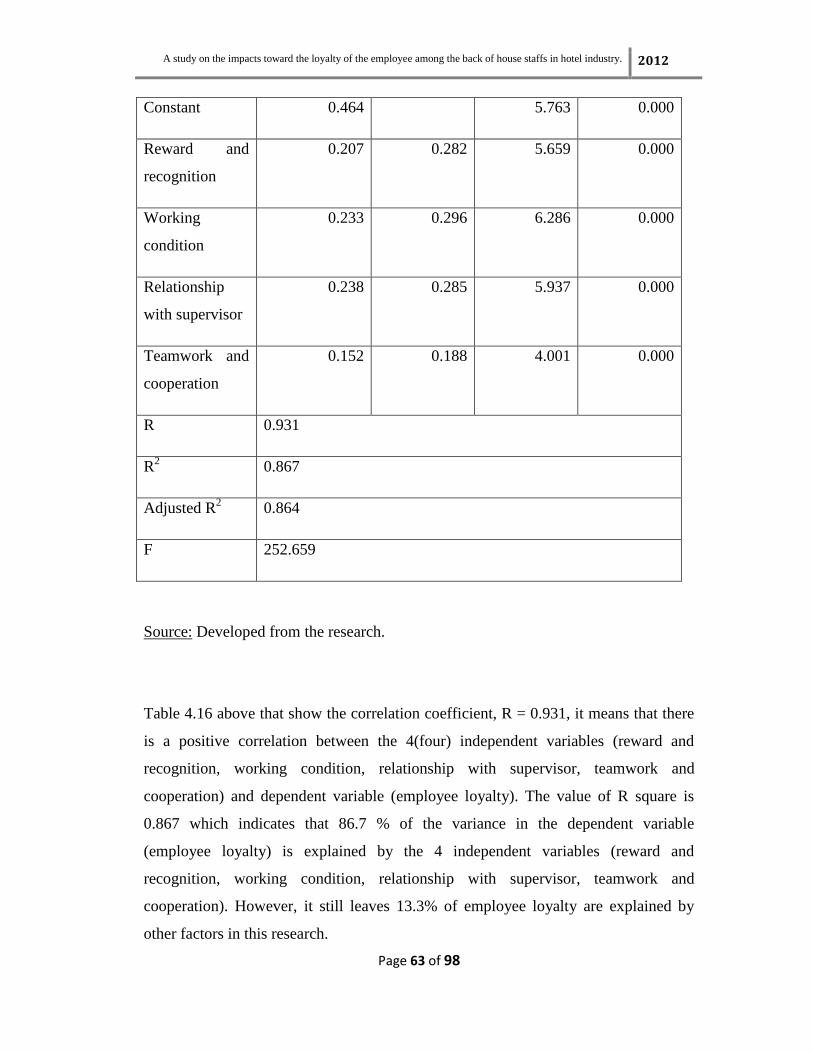
A study on the impacts toward the loyalty of the employee among the back of house staffs in hotel industry. 2012
Page 63 of 98
Constant 0.464 5.763 0.000
Reward and
recognition
0.207 0.282 5.659 0.000
Working
condition
0.233 0.296 6.286 0.000
Relationship
with supervisor
0.238 0.285 5.937 0.000
Teamwork and
cooperation
0.152 0.188 4.001 0.000
R 0.931
R2
0.867
Adjusted R2
0.864
F 252.659
Source: Developed from the research.
Table 4.16 above that show the correlation coefficient, R = 0.931, it means that there
is a positive correlation between the 4(four) independent variables (reward and
recognition, working condition, relationship with supervisor, teamwork and
cooperation) and dependent variable (employee loyalty). The value of R square is
0.867 which indicates that 86.7 % of the variance in the dependent variable
(employee loyalty) is explained by the 4 independent variables (reward and
recognition, working condition, relationship with supervisor, teamwork and
cooperation). However, it still leaves 13.3% of employee loyalty are explained by
other factors in this research.

A study on the impacts toward the loyalty of the employee among the back of house staffs in hotel industry. 2012
Page 64 of 98
According the table above, p-value (Sig. 0.000) is less that alpha value 0.05, thus the
F- statistic which equal to 252.659 is significant. That mean this model is a good
descriptor for the relation between the residual and predictors. Therefore, the
independent variables are significantly explaining the variance in the employee
loyalty among the back house staff in hotel industry.
Table 4.16 above show that all the independent variable p-value is equal to 0.000; it
means that all the independent variables (reward and recognition, working condition,
relationship with supervisor, teamwork and cooperation) are significantly to predict
the dependent variable (employee loyalty). This is because that all the independent
variable p-value is less than the 0.05.
Therefore, the multiple regression equation is formed which show it the below:
Employee loyalty = 0.464 + 0.207 reward and recognition + 0.233 working condition
+ 0.238 relationship with supervisor + 0.152 teamwork and cooperation
4.4 Conclusion
In chapter 4, it is interpreted and provides the result of data obtain from survey after
analyzed by SPSS version 16.0. A series of analyses consists of three parts which are
descriptive analysis, scale measurement and inferential analysis. Thus, the further
discussion and conclusion will be conduct in chapter 5 by using the date source of the
series analysis in this chapter.

A study on the impacts toward the loyalty of the employee among the back of house staffs in hotel industry. 2012
Page 65 of 98
Chapter 5: Discussions, Implications and Conclusion
5.0 Introduction
Chapter 4 has shown the result and the analysis from the respondents. In this chapter,
we will discuss the summary of statistical analysis from the result. In addition, major
findings and implications of the study will be further elaborate. Several limitations
and recommendations are provided to improve the future research.
5.1 Summary of Statistical Analysis
5.1.1 Respondent Demographic Profile
From the result in chapter 4, most of the respondent is female (65%) and
Chinese (64.4%). The majority age range among the respondents is 35-44
years old (47.5) and married (62.5). The survey is majority distributed to the
deputy housekeeper 31.2) Most of the respondents are a SPM holder which is
41.2% of total respondent. The majority of respondents are 48.1% that have
exactly 6 months to less than 1 year working experience.
5.1.2 Central Tendencies Measurement of Construct
Based on the analysis, majority of the respondents are agreed with the questions
regarding the factors (relationship with supervisor, reward and recognitions, working
condition and teamwork and cooperation) lead to employee loyalty in hotel industry.
The result shows that the mean of all the items are within the range of 8.7250 to
28.8438 while the standard deviation range is 2.20162 to 5.93841.
A study on the impacts toward the loyalty of the employee among the back of house staffs in hotel industry. 2012
Page 66 of 98
5.1.3 Scale Measurement
5.1.3.1 Internal Reliability Test
Reliability test and Cronbach’s alpha were applied to observe the 25 items
which used to measure the independent and dependent variable. The variable
of reward and recognition (5 items) has the Cronbach’s Alpha of 0.899,
working condition (3 items) has the Cronbach’s Alpha of 0.771, relationship
with supervisor (4 items) has the Cronbach’s Alpha of 0.824, teamwork and
cooperation (3 items) has the Cronbach’s Alpha of 0.803 and lastly the
employee loyalty (10 items) has the Cronbach’s Alpha of 0.890.According to
the scales, alpha between 0.8 and 0.95 is very good reliability thus, other than
variable of working condition, all other variable is consider as good reliability.
Meanwhile, working condition with the alpha of 0.771 drop under scale of 0.7
and 0.79 will be considered as good reliability.
5.1.4 Summary of Inferential Analysis
5.1.4.1 Pearson’s Correlation Analysis
The computed correlation between back of house staff loyalty and relationship
between supervisor is 0.829, back house staff loyalty and recognitions and
reward is 0.839, back house staff loyalty and working condition is 0.827 and
back house staff loyalty and relationship between teamwork is 0.794. The
entire variable is statistically significant at the coefficient range of ± 0.71 to ±
0.90 which consider as high in strength. Hence, the results proved that the
entire variable has a significant positive relationship with back of house
loyalty.
A study on the impacts toward the loyalty of the employee among the back of house staffs in hotel industry. 2012
Page 67 of 98
5.1.4.2 Multiple Regression Analysis
Hair, Celsi, Money, Samouel, and Page (2011) suppose that the multiple
regression analysis able to generate the result of statistical significance of each
coefficient, nature of relationship and strength of relationship.
Based on the result of multiple regression analysis, R2=0.867 which indicates
that 86.7 % of the variance in the dependent variable (employee loyalty) is
explained by the 4 independent variables (reward and recognition, working
condition, relationship with supervisor, teamwork and cooperation). Besides
that, the F-value of 252.659 is significant which mean this model is good
descriptor for the relation between the residual and predictor variable (reward
and recognition, working condition, relationship with supervisor, teamwork
and cooperation). In other words, the independent variables (reward and
recognition, working condition, relationship with supervisor, teamwork and
cooperation) are significantly explaining the variance in back of house staff
loyalty.
The multiple regression equation is formed as following:
Employee loyalty = 0.464 + 0.207 (reward and recognition) + 0.233 (working
condition) + 0.238 (relationship with supervisor) + 0.152 (teamwork and
cooperation)
5.2 Discussion of Major Findings
The results of the study show the independent variable which are the
relationship with supervisor, recognitions and rewards, working condition and
teamwork and cooperation and dependant variable which is loyalty of back of
house staff are significantly and positively associated in hotel industry. Based
on the result from the hypothesis 1, it shows positively high correlation for the
relationship between supervisor and back of house staff loyalty which is 0.829
that fall under the range ± 0.71 to ± 0.90. Also in hypothesis 2, it shows highly
A study on the impacts toward the loyalty of the employee among the back of house staffs in hotel industry. 2012
Page 68 of 98
positive correlation between rewards and recognitions and back of house staff
loyalty which is 0.839 that fall under range ± 0.71 to ± 0.90. Besides that, in
hypothesis 3 also shows the highly positive correlation between working
condition and back of house staff loyalty which is 0.827 that fall under range
± 0.71 to ± 0.90. Meanwhile in hypothesis 4, it shows slightly low in
correlation compare to hypothesis 1, 2 and 3 which is 0.794. However it still
fall under the range ± 0.71 to ± 0.90 that shows the positive correlation
between the teamwork and back of house staff loyalty. From the result of the
hypothesis for the 4 independents variable above, it show that hypothesis 2
which rewards and recognitions is the effect that have the biggest impact to
the back of house staff’s loyalty in hotel industry. On the other hand,
hypothesis 4 which teamwork and cooperation shows the lowest impact to the
back of house staff’s loyalty in hotel industry. As a result, the entire four
independents variable has highly positive relationship with the dependent
variable. Hotel industry should focus more in rewards and recognitions of
their staff in back of house that has highest impact of their loyalty among
other independents variable.
5.3 Implications of the Study
5.3.1 Managerial Implications
As our research result shows that back of house staff loyalty relates positively with
variables such as high relationship with supervisor, recognitions and rewards,
working condition and teamwork and cooperation. Business organizations should
start realizing the need to be tackle on these determinants in order to stay competitive
and ahead of its rivals.
A good relationship between supervisor and employee is essential in order to have a
friendly working environment in one organization. In the US, one research strongly
suggests that support, particularly from one’s supervisor, serves a buffering role in the
A study on the impacts toward the loyalty of the employee among the back of house staffs in hotel industry. 2012
Page 69 of 98
job stressor – strain relationship (Cohen & Wills, 1985) (Viswesvaran, Sanchez, &
Fisher, 1999). Therefore, supervisor role is important in an organization not just to
monitor and control employee performance, but also to encourage and motivate
employee morale. (Eisenberger, Stinglhamber, Vandenberghe, Sucharski, & Rhoades,
2002).
In most corporate world today, channeled down organizational decision may create a
negative impact on the relationship between supervisor and employee which dilute
the productivity of organization. Hence, a positive supervisor-employee workplace
relationship has become the vital key in increase organizational success. This topic
should be given concern as it may aid in decreasing cost related to employee retention.
For this reason, management ought to apply perceived organizational support (POS)
where employee perceptions of the extent to which the organization values their
contributions and cares for their well being. In the meantime, employees have to
repay and fulfilled their obligations and perform their role in the organization.
Study shows employees engage in their working activities purposely for own sake
then they will feel intrinsic motivation in their behaviors as their activities will
essentially be enjoyable and satisfactory (Vansteenkiste, 2005). In this section,
organization were also suggested to design five important human resource
management practices including staffing, job design, performance and compensation
systems, managerial styles and training. (Ali & Ahmed, 2009). Meanwhile,
management has to acknowledge less motivated with work contents, difficulties of
operating procedures and neglect of certain aspects of recognition may cause reduce
in motivation to work. To overcome this issue, management are encourage to carry
out certain reward and recognition activities such as employee participation in
decision making process, proper recognition and appreciation, salary increments,
allowances, bonuses, fringe benefits and other compensations on regular and specific
periods. In addition, organization is suggested that whether tangible or intangible and
formal or informal recognition should include personal value. This is a psychological
A study on the impacts toward the loyalty of the employee among the back of house staffs in hotel industry. 2012
Page 70 of 98
act whereas individual employee will feel more appreciated and gratitude where their
contribution is acknowledge by the company.
Improving working conditions will result in a reduction of socioeconomic inequalities
in health in the working population (Schrijvers, Mheen, Stronks, & Mackenbach,
1998). This result in this research let us conscious regarding the general health in the
working population can be attributed to a differential distribution of hazardous
physical working conditions and low job control across occupational classes.
Government and union intervention are designed to protect employee rights and
improve working conditions. In the same time, firms and organization are ought to
fulfilled their corporate responsibility by provide a better working conditions. We
recommended that working condition should improve in two ways, such as physical
working conditions and psychological working conditions.
Management may improve the facilities by invest money on the work environment,
these recommendation may not be feasible for everyone, yet in long-terms the
excellent work environment will eventually increase the job satisfaction of the
employees. Meanwhile, the Occupational Safety and Health Act have set regulation
and requirements on both employers and employees. Both management and
employees would have to comply with the safety programs and put the responsibility
and accountability for safety squarely on shoulders of each staff. Management should
also be aware of the psychological working conditions of the employee. Laws and
regulation against harassment and discrimination on the basis of sex, race, color,
national origin, religion, age, disabilities and others should be implemented strictly in
the organization. In short, provide a supportive and edifying environment is crucial
for all employees, whereas it is the significant factor in increasing the employee
loyalty.
A study on the impacts toward the loyalty of the employee among the back of house staffs in hotel industry. 2012
Page 71 of 98
Setting up a work team is usually motivated by benefits such as increased
productivity, innovation and employee satisfaction. Research on software
development teams has found that team performance is linked with the effectiveness
of teamwork coordination (Hoegl & Gemuenden, 2001). At this part, there are several
functions that must be carrying out by the organization management.
Begin by becoming a supportive sponsor for the team, company management can
assist in forming a leadership teams. To achieve specific organizational goal will
require team to provide the leadership necessary to move a company towards the
organization’s goals. Team leader will be selected by the management in carrying out
needed actions. Committed leader will lead the team in defining and carrying out duty.
Meanwhile, mutual trust takes time to build, and management required to pay
attention to this factor as it will be the most important element in deciding the fate of
the team. The establishment of a platform of mutual trust will enables the team to
engage in open debate and participation in decision making. Hence, with
establishment of mutual trust it will enable employees to understand the norms of all
members of the team, and cooperation between team members will be facilitated by
the mutual trust. In the meantime, management should apply S.M.A.R.T. concept in
team to achieve objective. Teamwork and cooperation should follow a set of guidance
such as SMART in conducting an action. SMART consists of specific, measurable,
achievable, realistic and time bound that contain a set of goals which set by the
company management.
A study on the impacts toward the loyalty of the employee among the back of house staffs in hotel industry. 2012
Page 72 of 98
5.4 Limitations of the Study
There are several limitations occur during the completion of this study. Firstly, this
study faced the limitation of time, sample size and geographical restriction. There
were 200 questionnaires distributed in the urban areas of Perak within the period of 2
weeks time. It is not enough data for us to prove that whole Malaysia employee
loyalty in hotel industry have affected by the four factors that our group discussed.
Hence it will be very difficult for this study to be representative. A larger sample size
with a more fairly distributed area within the respondents will help to validate the
study.
Furthermore, there might be other variables that can be the factors to influence
Malaysian employee loyalty in hotel industry.
5.5 Recommendations for Future Research
There are several ideas to make this study better for the benefit of future research.
In the future research, it should involve wider geographical areas as well as larger
sample size of hotels in Malaysia. In addition, the questionnaires should be translated
into other languages such as Malay, Mandarin and Tamil because Malaysia consists
of different races.
The future study should compare the data with the almost same geographic area such
as hotels in Penang and Kuala Lumpur because people in fast city development have
different perception compare to the slow city development people such as Perlis. In
order to be more justified, the future study should collect the data from comparing the
same city development level.
A study on the impacts toward the loyalty of the employee among the back of house staffs in hotel industry. 2012
Page 73 of 98
Besides, future researchers can test other variables that might influence the employee
loyalty in hotel industry. Perhaps other variables in future research would be more
significance to influence the employee loyalty in hotel industry.
5.6 Conclusion
Based on the results showed, there is significant outcome in the overall relationship
with supervisor, recognitions and rewards, working condition and teamwork and
cooperation towards job satisfaction towards the loyalty of the back of house staff
loyalty in the hotel industry. The objective of the study is fulfilled with the results
accepted.

A study on the impacts toward the loyalty of the employee among the back of house staffs in hotel industry. 2012
Page 74 of 98
REFERENCES
Abdullah, R. B., Musa, M., Zahari, H., Rahman, R., & Khalid., K. (2011). The Study
of Employee Satisfaction and its Effects towards Loyalty in Hotel industry in
Klang Valley, Malaysia. International Journal of Business and Social Science,
2 , 147-155.
Ali, & Ahmed. (2009). The impact of reward and recognition programs on
employee’s motivation and satisfaction: an empirical study. International
Review of Business Research Papers, 5(4) , 270-279.
Allport, F. H. (1933). Institutional Behavior. Chapel Hill, NC: University of North
Carolina Press.
Baron. (1983). Behaviour in organisations. New York: Allyn & Bacon, Inc.
Bhanthumnavin, D. (2003). Perceived Social Support from Supervisor and Group
Members' Psychological and Situational Characteristics Preditors of
Subordinate Performance in Thai Work Units. Human Resource Development
Quarterly , 14, 79-97. Brown, & Peterson. (1993). Antecedents and Consequences of Salesperson Job
Satisfaction: A MetaAnalysis and Assessment of Causal Effects . Journal of
Marketing Research , 63-77.
Buckingham, & Coffman. (1999). First break all the rules: What the world's greatest
managers do differently. New York: Simon and Schuster .
Burns, A.C. & Bush, R.F. (2006). Marketing Research – Online Research
Application. New Jersey: Prentice Hall.
Butler, J. K., & Cantrell, R. S. (1984). "A Behavioral Decision Theory Approach to
Modeling Dyadic Trust in Superiors and Subordinates.".
A study on the impacts toward the loyalty of the employee among the back of house staffs in hotel industry. 2012
Page 75 of 98
Chang, C. C., Chiu, C. M., & Chen, C. A. (2010). The effect of TQM practices on
employee satisfaction and loyalty in government. Total Quality Management
& Business Excellence, 21:12 , 1299-1314. Christian, H., & Ruth, M. S. (2004). The link between sales people’s job satisfaction
and customer satisfaction in a business-to-business context: A dyadic analysis.
Journal of the Academy of Marketing Science, 32 , 144-158.
Clark. (2001). What really matters in a job? Hedonic measurement using quit data.
Labour Economics, vol.8,no.2 , 223-242.
Clark, Diener, Georgellis, & Lucas. (2008). Lags and leads in life satisfaction: A test
of the baseline hypothesis. The Economic Journal, 118 , 222–243.
Cohen, S., & Wills, T. A. (1985). Stress, social support, and the buffering hypothesis.
Psychological Bulletin, 98 , 310–357.
Diener, Suh, Lucas, Smith, Schwarz, & Strack. (1999). Subjective well-being: Three
decades of progress. Psychological Bulletin, 125 , 276–302.
Dow, S., Bishop, J. W., & Chen, X. (2003). An Examination of The Relationship of
Employee Involvement With Job Satisfaction, Employee Cooperation, And
Intention to Quit in U.S. Invested Enterprise In China. International Journal
of Organizational Analysis, 11 , 3-19.
Easterlin. (2001). Income and happiness: Toward a unified theory. The Economic
Journal, 111 , 465–484.
Eisenberger, Stinglhamber, Vandenberghe, Sucharski, & Rhoades. (2002). Perceived
supervisor support: Contributions to perceived organizational support and
employee retention. The Journal of Applied Psychology, 87 , 565–573.
Employee Turnover. (n.d.). Retrieved 7 29, 2011, from
http://www.sapsustainabilityreport.com/employee-turnover

A study on the impacts toward the loyalty of the employee among the back of house staffs in hotel industry. 2012
Page 76 of 98
employee turnover is expensive. (2004, 10 22). Retrieved 7 29, 2011, from factsheet:
http://www.super-solutions.com/pdfs/EmployeeTurnoverExpensive2004.pdf
Fairholm, G. W. (1994). Leadership and the Culture of Trust. Westport, CT: Praeger . Fischer, R. REWARDING EMPLOYEE LOYALTY: AN ORGANIZATIONAL.
International Journal of Organisational Behaviour , 8 (3), 486-503.
Garcı´a-Serrano. (2011). Does Size Matter? The Influence Of Firm Size On Working
Conditions, Job Satisfaction And Quit Intentions. Scottish Journal of Political
Economy, Scottish Economic Society, vol. 58(2) , 221-247, 05.
Garcı´a-Serrano. (2004). Temporary employment, working conditions and expected
exits from firms. Labour: Review of Labour Economics and Industrial
Relations, 18, 2 , 293–316.
Groot, & Brink, M. v. (2007). Optimism, pessimism and the compensating income
variation of cardiovascular disease: A two-tiered quality of life stochastic
frontier model. Social Science & Medicine, 65 , 1479–1489.
Hair, J.F.Jr, Babin, B., Money, A. H., & Samuel, P. (2003). Essential of business
research methods. United State of America: John Wiley & Sons.
Hair, J. F. (2011). Essentials of Business Research Methods (2nd ed). M. E Sharpe .
Hall, & Densten. (2002). Following successfully: Followership and technology
adoption. Prometheus, 20 , 87-105.
Hausknecht, J., Rodda, J. M., & Howard, M. J. (2008). Targeted Employee Retention:
Performance-Based. Retrieved 6 25, 2012, from digital common:
http://digitalcommons.ilr.cornell.edu/cgi/viewcontent.cgi?article=1485&conte
xt=cahrswp&seiredir=1#search=%22Targeted%20Employee%20Retention%3
A%20Performance%20Based%20JobRelated%20Differences%20Reported%
20Reasons%20Staying%22
A study on the impacts toward the loyalty of the employee among the back of house staffs in hotel industry. 2012
Page 77 of 98
Heskett, J., Sasser Jr, W., & L.A., S. (1997). The Service Profit Chain: How Leading
Companies Link Profit and Growth to Loyalty, Satisfaction and Value. New
York: Free Press. Hoegl, & Gemuenden. (2001). Teamwork quality and the success of innovative
projects: a theoretical concept and empirical evidence. Organization Science
12 (4) , 435-449.
Hoegl, M. (2005). Smaller teams-better teamwork: How to keep project teams small.
Business Horizons, vol. 48, issue 3 , 209-214.
Hoegl., M., & Perserpio., L. (2004). Team member proximity and teamwork in
innovative projects. Research Policy, 33 , 1153-1165.
Imberman, W. (1996). Gainsharing: A lemon or lemonade. Business Horizons, 39 (1) ,
36-40.
Ingraham, P. W. (1999). The Pain of Organizational Change: Managing Reinvention'
in H. G. Frederickson and J. M. Johnston (eds) Public Management Reform
and Innovation Research, Theory and Application, Tuscalosa, AL:. University
of Alabama Press .
Jarrar, Y. F., Aspinwall, E., & Zairi., M. (2000). A Reward, Recognition, and
Appraisal System for Future Competitiveness: A UK Survey of Best Practices.
The International Journal of Applied Human Resource Management, 1 , 3-18.
Kaye, & Jordan-Evans. (2003). How to retain high-performance employees.
Khan, A. A., Mahmood, B., Ayoub, M., & Hussain, S. (2011). An Empirical Study of
Retention Issues in Hotel Industry: A Case Study of Serena Hotel, Faisalabad,
Pakistan. European Journal of Economics, Finance and Administrative
Sciences (29).
Kreitner, & Kinicki. (2004). Organizational Behavior, 6th Edition. Boston. MA:
McGraw-Hill, Irwin .
A study on the impacts toward the loyalty of the employee among the back of house staffs in hotel industry. 2012
Page 78 of 98
Lee, S. S. (2008). Relationships among leadership empowerment, job satisfaction,
and employee loyalty in university dining student workers. Iowa State
University, Ames, Iowa. Levy-Garboua. (2007). Job satisfaction and quits. Labour Economics, 14 , 251–268.
Liao, S.-H., Hu, D.-C., & Chung, H.-Y. (2009). The relationship between
leadermember relations, job satisfaction and organizational commitment in
international tourist hotels in Taiwan. The International Journal of Human
Resource Management, Volume 20, Issue 8 , 1810-1826.
Liden, R. C. (2007). A Longitudinal Study on the Early Development of Leader-
Member Exchanges. Journal of Management , 33, 841-866.
Light, J. (2004). The relationships and effects of employee involvement, employee
empowerment and employee satisfaction. Job type in a large manufacturing
environment .
Lin, H.-Y. (2009). Understanding customers' loyalty intentions towards online
shopping: An integration of technology acceptance model and fairness theory.
Behaviour & Information Technology, Vol. 28, No. 4 , 347-360.
Locke, E. A. (1976). The nature and causes of job satisfaction. In M. Dunnette (Ed.),
Handbook of industrial and organizational psychology. Chicago: Rand
McNally.
Logan, G. M. (1984). "Loyalty and a Sense of Purpose.". California Management
Review 27 , 149-156.
Maholtra, N.K., Peterson, M. (2006). Basic Marketing Research: A Decision-making
Approach (2nd
ed.). New Jersey: Prentice Hall.
Maholtra, N.K., Peterson, M., & Uslay, C. (2006). Helping marketing research earn
seat at the table for decision making: An assessment and prescription for the
future. Journal of European Business Review, 18 (4), pp. 294 – 306
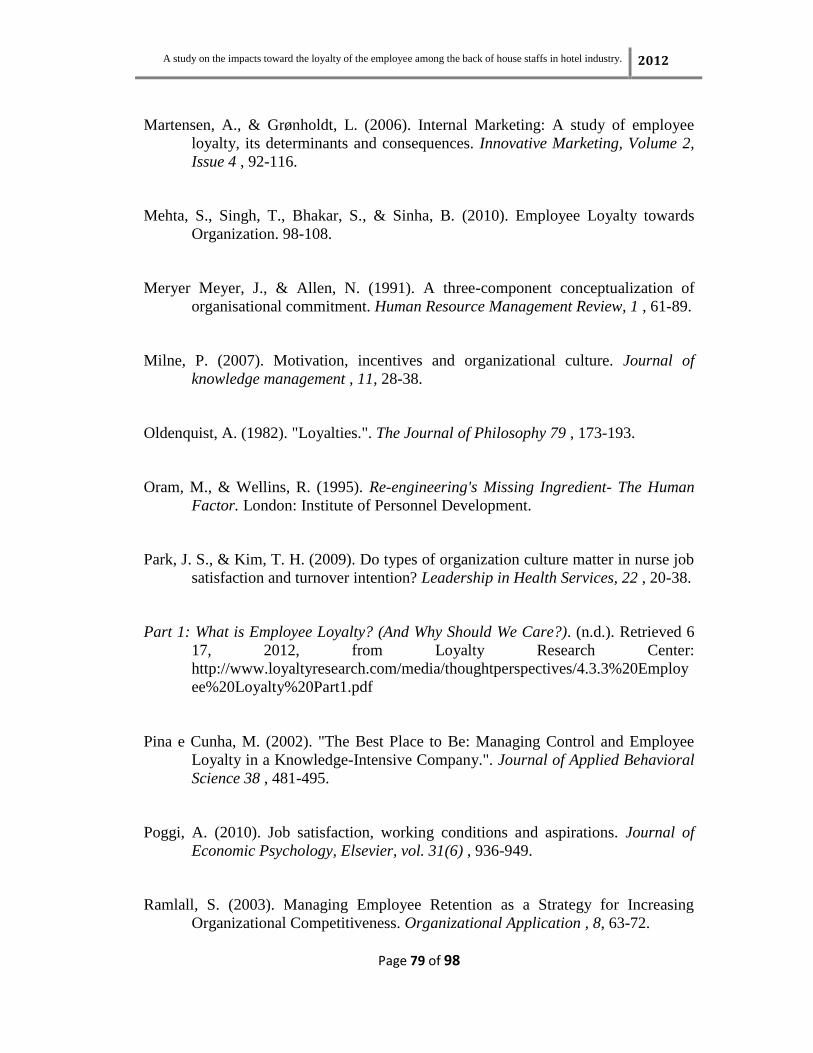
A study on the impacts toward the loyalty of the employee among the back of house staffs in hotel industry. 2012
Page 79 of 98
Martensen, A., & Grønholdt, L. (2006). Internal Marketing: A study of employee
loyalty, its determinants and consequences. Innovative Marketing, Volume 2,
Issue 4 , 92-116. Mehta, S., Singh, T., Bhakar, S., & Sinha, B. (2010). Employee Loyalty towards
Organization. 98-108.
Meryer Meyer, J., & Allen, N. (1991). A three-component conceptualization of
organisational commitment. Human Resource Management Review, 1 , 61-89.
Milne, P. (2007). Motivation, incentives and organizational culture. Journal of
knowledge management , 11, 28-38.
Oldenquist, A. (1982). "Loyalties.". The Journal of Philosophy 79 , 173-193.
Oram, M., & Wellins, R. (1995). Re-engineering's Missing Ingredient- The Human
Factor. London: Institute of Personnel Development.
Park, J. S., & Kim, T. H. (2009). Do types of organization culture matter in nurse job
satisfaction and turnover intention? Leadership in Health Services, 22 , 20-38.
Part 1: What is Employee Loyalty? (And Why Should We Care?). (n.d.). Retrieved 6
17, 2012, from Loyalty Research Center:
http://www.loyaltyresearch.com/media/thoughtperspectives/4.3.3%20Employ
ee%20Loyalty%20Part1.pdf
Pina e Cunha, M. (2002). "The Best Place to Be: Managing Control and Employee
Loyalty in a Knowledge-Intensive Company.". Journal of Applied Behavioral
Science 38 , 481-495.
Poggi, A. (2010). Job satisfaction, working conditions and aspirations. Journal of
Economic Psychology, Elsevier, vol. 31(6) , 936-949. Ramlall, S. (2003). Managing Employee Retention as a Strategy for Increasing
Organizational Competitiveness. Organizational Application , 8, 63-72.
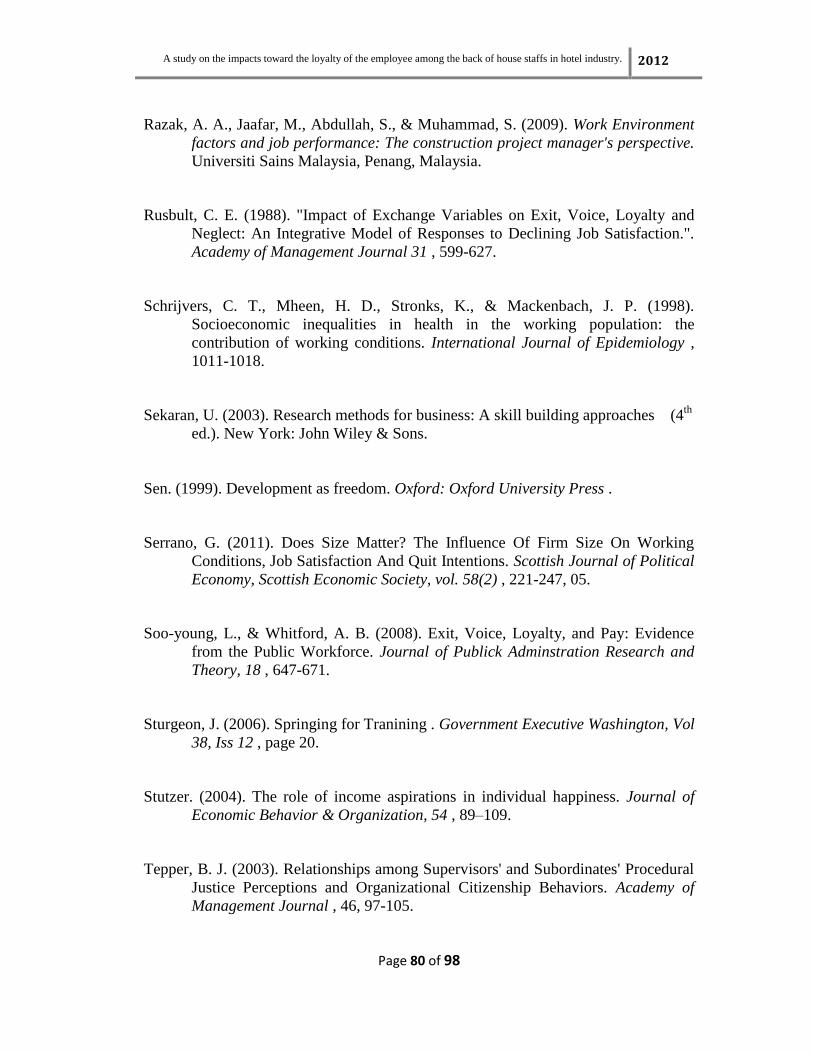
A study on the impacts toward the loyalty of the employee among the back of house staffs in hotel industry. 2012
Page 80 of 98
Razak, A. A., Jaafar, M., Abdullah, S., & Muhammad, S. (2009). Work Environment
factors and job performance: The construction project manager's perspective.
Universiti Sains Malaysia, Penang, Malaysia.
Rusbult, C. E. (1988). "Impact of Exchange Variables on Exit, Voice, Loyalty and
Neglect: An Integrative Model of Responses to Declining Job Satisfaction.".
Academy of Management Journal 31 , 599-627.
Schrijvers, C. T., Mheen, H. D., Stronks, K., & Mackenbach, J. P. (1998).
Socioeconomic inequalities in health in the working population: the
contribution of working conditions. International Journal of Epidemiology ,
1011-1018.
Sekaran, U. (2003). Research methods for business: A skill building approaches (4th
ed.). New York: John Wiley & Sons.
Sen. (1999). Development as freedom. Oxford: Oxford University Press .
Serrano, G. (2011). Does Size Matter? The Influence Of Firm Size On Working
Conditions, Job Satisfaction And Quit Intentions. Scottish Journal of Political
Economy, Scottish Economic Society, vol. 58(2) , 221-247, 05.
Soo-young, L., & Whitford, A. B. (2008). Exit, Voice, Loyalty, and Pay: Evidence
from the Public Workforce. Journal of Publick Adminstration Research and
Theory, 18 , 647-671.
Sturgeon, J. (2006). Springing for Tranining . Government Executive Washington, Vol
38, Iss 12 , page 20.
Stutzer. (2004). The role of income aspirations in individual happiness. Journal of
Economic Behavior & Organization, 54 , 89–109.
Tepper, B. J. (2003). Relationships among Supervisors' and Subordinates' Procedural
Justice Perceptions and Organizational Citizenship Behaviors. Academy of
Management Journal , 46, 97-105.

A study on the impacts toward the loyalty of the employee among the back of house staffs in hotel industry. 2012
Page 81 of 98
The Study of Employee Satisfaction and its Effects towards Loyalty in Hotel Industry
in Klang Valley, Malaysia. (2011). 1-2.
Tuckman, B. w. (1965). Forming, Storming, Norming, and Performing in groups.
Vandenberghe, C., & Bentein, K. (2009). A closer look at the relationship between
affective commitment to supervisors and organizations and turnover. Journal
of Occupational and Organizational Psychology, Volume:82, Issue:2 , 331-
348.
Vansteenkiste. (2005). Intrinsic versus extrinsic goal promotion and autonomy
support versus control . doctoral dissertation. Leuven: KU Leuven .
Viswesvaran, Sanchez, & Fisher. (1999). The role of social support in the process of
work stress: A meta-analysis. Journal of Vocational Behavior, 54 , 314-334.
Wang, D. W., & Ronen, D. S. (2011). Employee Loyalty and Telecommuting. World
Academy of Science, Engineering and Technology 77 , 687-689.
William J.Shaw, C., Rescue, S. F., & Solon, O. (2001). Implementing an employee
reward or recognition program with a unionized labor force. Retrieved 6 23,
2012, from USFA: http://www.usfa.fema.gov/pdf/efop/efo33159.pdf
Yun, S., Cox, J., Henry P.Sims, J., & Salam, S. (2007). The effects of leadership and
job satisfaction on team citizenship. International Journal of Leadership
Studies, 2 , 171-193.
Zand, D. E. (1972). Trust and Managerial Problem Solving. Administrative Science
Quarterly. The Leadership Triad Knowledge, Trust and Power, Oxford:.
Oxford University Press , 229-39. Zhenxiong Chen, A. s.-L. (2001). Loyalty to Supervisor Vs. Organisational
Commitment Relationships to Employee Performance in China. Journal of
Occupational and Organizational Psychology , 75, 339-356.
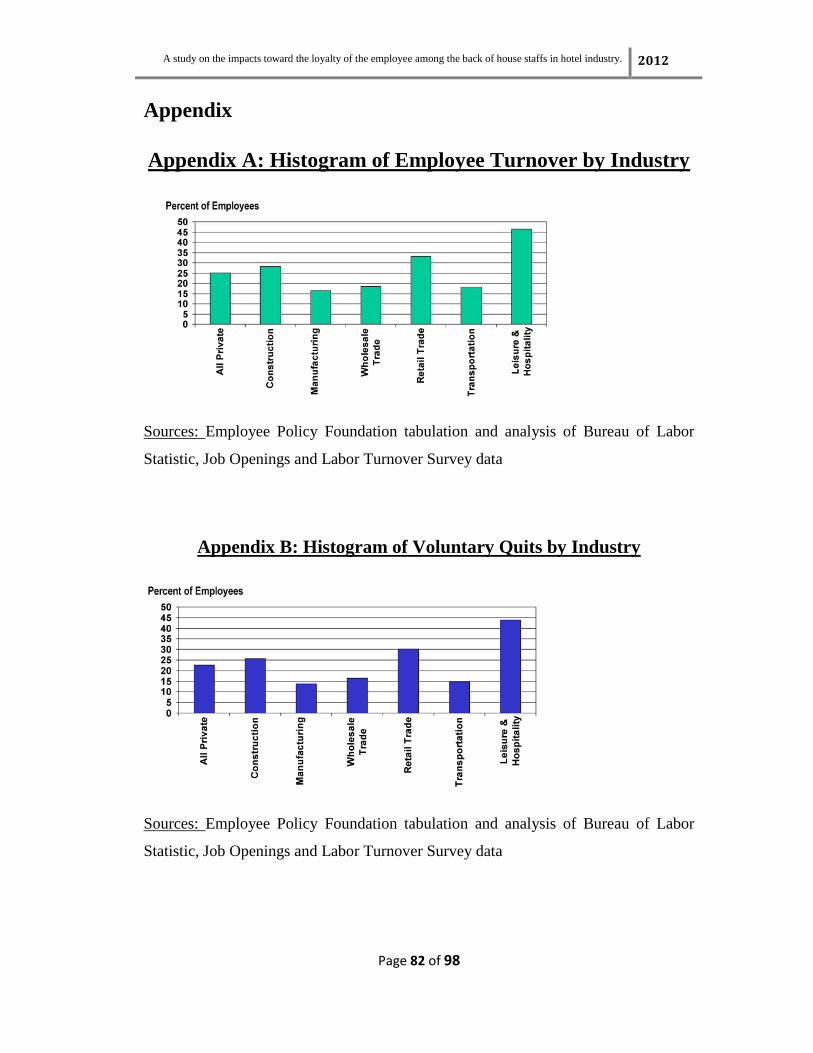
A study on the impacts toward the loyalty of the employee among the back of house staffs in hotel industry. 2012
Page 82 of 98
Appendix
Appendix A: Histogram of Employee Turnover by Industry
Sources: Employee Policy Foundation tabulation and analysis of Bureau of Labor
Statistic, Job Openings and Labor Turnover Survey data
Appendix B: Histogram of Voluntary Quits by Industry
Sources: Employee Policy Foundation tabulation and analysis of Bureau of Labor
Statistic, Job Openings and Labor Turnover Survey data
A study on the impacts toward the loyalty of the employee among the back of house staffs in hotel industry. 2012
Page 83 of 98
Appendix C: Histogram of Turnover Replacement Cost by
Industry
Sources: Employee Policy Foundation tabulation and analysis of Bureau of Labor
Statistic, Job Openings and Labor Turnover Survey data

A study on the impacts toward the loyalty of the employee among the back of house staffs in hotel industry. 2012
Page 84 of 98
Appendix D: Pilot Test - Reliability
Reward and Recognition Variables
RELIABILITY
/VARIABLES=Reward1 Reward2 Reward3 Reward4 Reward5
/SCALE('ALL VARIABLES') ALL
/MODEL=ALPHA
/STATISTICS=DESCRIPTIVE SCALE
/SUMMARY=TOTAL MEANS VARIANCE.
Reliability
[DataSet1] C:\Users\Gateway\Desktop\FYP\pilot test.sav
Scale: ALL VARIABLES
Case Processing Summary
N %
Cases Valid 30 100.0
Excludeda 0 .0
Total 30 100.0
a. Listwise deletion based on all variables in the
procedure.
Reliability Statistics
Cronbach's
Alpha
Cronbach's
Alpha Based on
Standardized
Items N of Items
.774 .769 5
Item Statistics
Mean Std. Deviation N
Received an adequate
recognition 2.6333 .85029 30
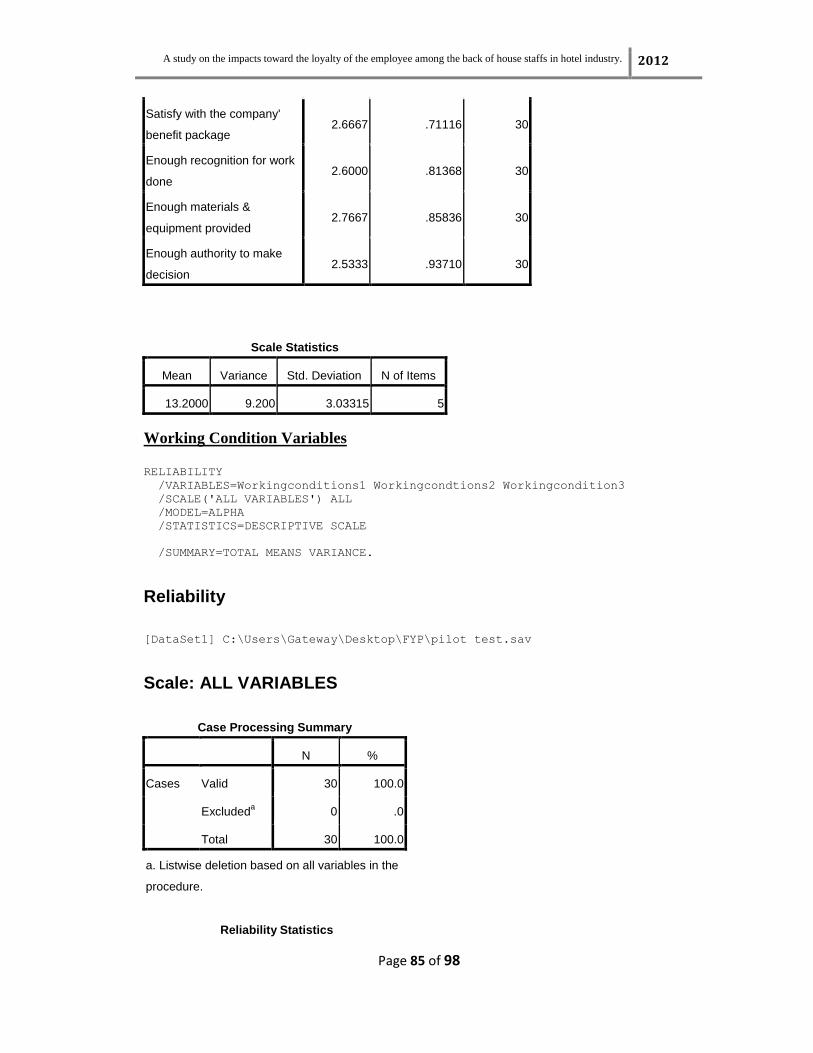
A study on the impacts toward the loyalty of the employee among the back of house staffs in hotel industry. 2012
Page 85 of 98
Satisfy with the company'
benefit package 2.6667 .71116 30
Enough recognition for work
done 2.6000 .81368 30
Enough materials &
equipment provided 2.7667 .85836 30
Enough authority to make
decision 2.5333 .93710 30
Scale Statistics
Mean Variance Std. Deviation N of Items
13.2000 9.200 3.03315 5
Working Condition Variables
RELIABILITY
/VARIABLES=Workingconditions1 Workingcondtions2 Workingcondition3
/SCALE('ALL VARIABLES') ALL
/MODEL=ALPHA
/STATISTICS=DESCRIPTIVE SCALE
/SUMMARY=TOTAL MEANS VARIANCE.
Reliability
[DataSet1] C:\Users\Gateway\Desktop\FYP\pilot test.sav
Scale: ALL VARIABLES
Case Processing Summary
N %
Cases Valid 30 100.0
Excludeda 0 .0
Total 30 100.0
a. Listwise deletion based on all variables in the
procedure.
Reliability Statistics
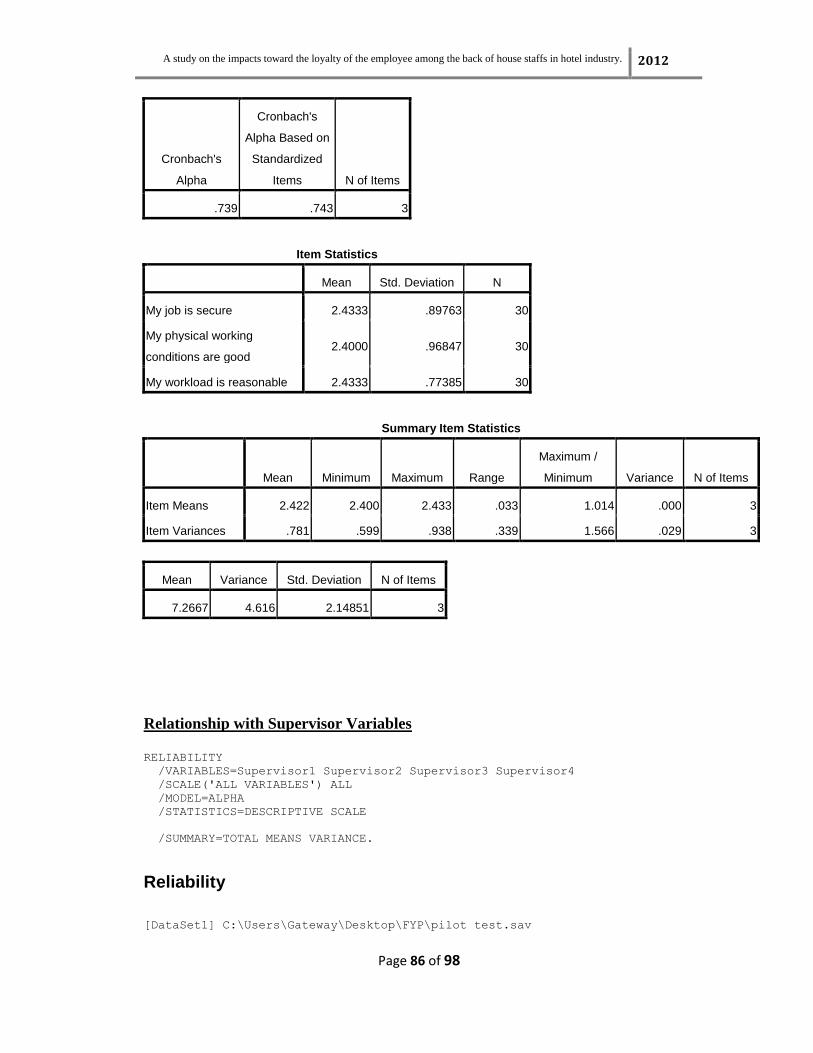
A study on the impacts toward the loyalty of the employee among the back of house staffs in hotel industry. 2012
Page 86 of 98
Cronbach's
Alpha
Cronbach's
Alpha Based on
Standardized
Items N of Items
.739 .743 3
Item Statistics
Mean Std. Deviation N
My job is secure 2.4333 .89763 30
My physical working
conditions are good 2.4000 .96847 30
My workload is reasonable 2.4333 .77385 30
Summary Item Statistics
Mean Minimum Maximum Range
Maximum /
Minimum Variance N of Items
Item Means 2.422 2.400 2.433 .033 1.014 .000 3
Item Variances .781 .599 .938 .339 1.566 .029 3
Mean Variance Std. Deviation N of Items
7.2667 4.616 2.14851 3
Relationship with Supervisor Variables
RELIABILITY
/VARIABLES=Supervisor1 Supervisor2 Supervisor3 Supervisor4
/SCALE('ALL VARIABLES') ALL
/MODEL=ALPHA
/STATISTICS=DESCRIPTIVE SCALE
/SUMMARY=TOTAL MEANS VARIANCE.
Reliability
[DataSet1] C:\Users\Gateway\Desktop\FYP\pilot test.sav

A study on the impacts toward the loyalty of the employee among the back of house staffs in hotel industry. 2012
Page 87 of 98
Scale: ALL VARIABLES
Case Processing Summary
N %
Cases Valid 30 100.0
Excludeda 0 .0
Total 30 100.0
a. Listwise deletion based on all variables in the
procedure.
Reliability Statistics
Cronbach's
Alpha
Cronbach's
Alpha Based on
Standardized
Items N of Items
.909 .909 4
Item Statistics
Mean Std. Deviation N
My supervisor is an effective
manager 3.1667 .69893 30
My supervisor asks for my
inpuy to help make decisions 2.4333 .72793 30
My supervisor handles work
related issues satisfactorily 2.5333 .77608 30
My supervisor treat me with
fairly 3.1333 .68145 30
Summary Item Statistics
Mean Minimum Maximum Range
Maximum /
Minimum Variance N of Items
Item Means 2.817 2.433 3.167 .733 1.301 .150 4
Item Variances .521 .464 .602 .138 1.297 .004 4
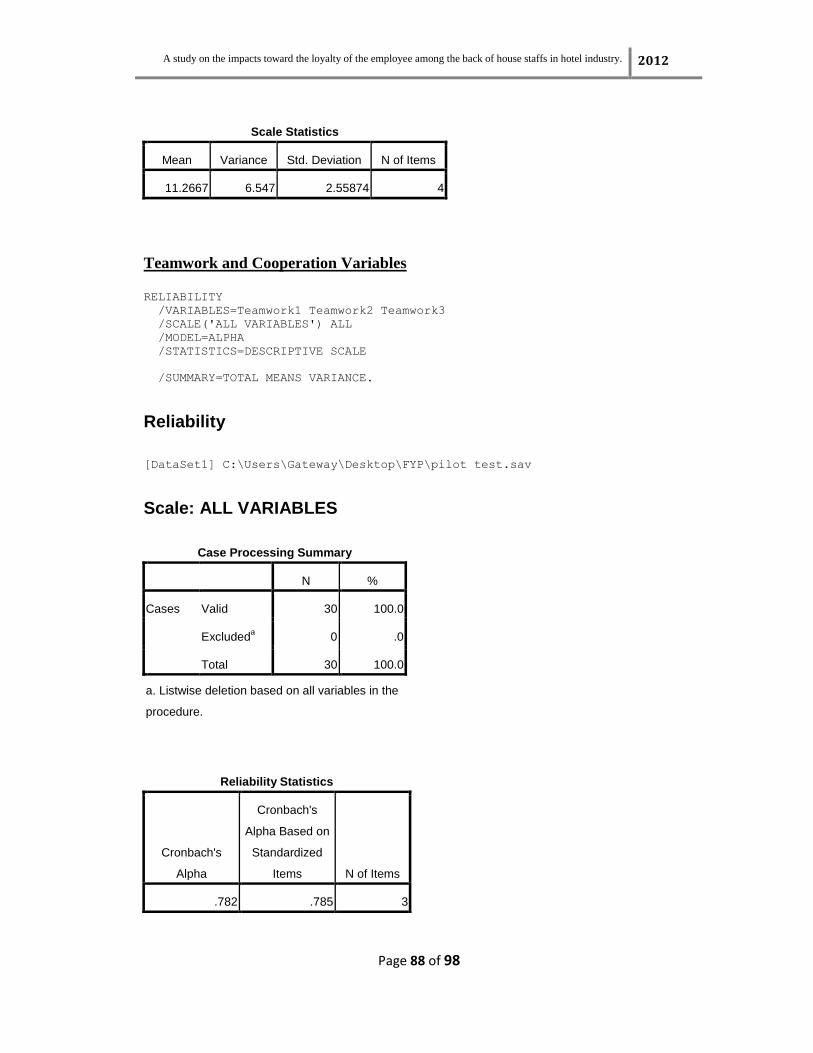
A study on the impacts toward the loyalty of the employee among the back of house staffs in hotel industry. 2012
Page 88 of 98
Scale Statistics
Mean Variance Std. Deviation N of Items
11.2667 6.547 2.55874 4
Teamwork and Cooperation Variables
RELIABILITY
/VARIABLES=Teamwork1 Teamwork2 Teamwork3
/SCALE('ALL VARIABLES') ALL
/MODEL=ALPHA
/STATISTICS=DESCRIPTIVE SCALE
/SUMMARY=TOTAL MEANS VARIANCE.
Reliability
[DataSet1] C:\Users\Gateway\Desktop\FYP\pilot test.sav
Scale: ALL VARIABLES
Case Processing Summary
N %
Cases Valid 30 100.0
Excludeda 0 .0
Total 30 100.0
a. Listwise deletion based on all variables in the
procedure.
Reliability Statistics
Cronbach's
Alpha
Cronbach's
Alpha Based on
Standardized
Items N of Items
.782 .785 3

A study on the impacts toward the loyalty of the employee among the back of house staffs in hotel industry. 2012
Page 89 of 98
Item Statistics
Mean Std. Deviation N
There is adequate
communication between
departments
3.0333 .76489 30
I am willing to share my data
regularly with my co-workers 2.7667 .77385 30
My co-workers are willing to
share, what they think,
important informant with
each other
2.7333 .86834 30
Summary Item Statistics
Mean Minimum Maximum Range
Maximum /
Minimum Variance N of Items
Item Means 2.844 2.733 3.033 .300 1.110 .027 3
Item Variances .646 .585 .754 .169 1.289 .009 3
Scale Statistics
Mean Variance Std. Deviation N of Items
8.5333 4.051 2.01260 3
Employees Loyalty Variables
RELIABILITY
/VARIABLES=Internaldimensiao1 Internaldimension2 Internaldimension3 Intern
aldimension4 Internaldimension5 Externaldimension1 Exter
naldimension2 Externaldimension3 Externaldimension4 Externaldimension5
/SCALE('ALL VARIABLES') ALL
/MODEL=ALPHA
/STATISTICS=DESCRIPTIVE SCALE
/SUMMARY=TOTAL MEANS VARIANCE.
Reliability
[DataSet1] C:\Users\Gateway\Desktop\FYP\pilot test.sav
Scale: ALL VARIABLES

A study on the impacts toward the loyalty of the employee among the back of house staffs in hotel industry. 2012
Page 90 of 98
Case Processing Summary
N %
Cases Valid 30 100.0
Excludeda 0 .0
Total 30 100.0
a. Listwise deletion based on all variables in the
procedure.
Reliability Statistics
Cronbach's
Alpha
Cronbach's
Alpha Based on
Standardized
Items N of Items
.884 .885 10
Item Statistics
Mean Std. Deviation N
The company treats me as
real partner 2.7000 .70221 30
The company cares for my
efforts to improve
performance
2.6000 .67466 30
I have the feeling of job
satisfaction working at my
company
2.6333 .96431 30
I have made the contribution
on achieving my company's
objective
2.5000 1.00858 30
The company quickly
responds to my feedback
quickly
2.4667 .81931 30
I will recommend my
company to my friends 2.8000 .84690 30

A study on the impacts toward the loyalty of the employee among the back of house staffs in hotel industry. 2012
Page 91 of 98
I believe that my company in
making long term
relationship
2.8000 .66436 30
My company retains
oustanding employees 2.7333 .86834 30
I will endure relationship with
organization 2.7667 .81720 30
My company provide
suffiicient opportunity of
grows
2.8667 .86037 30
Summary Item Statistics
Mean Minimum Maximum Range
Maximum /
Minimum Variance N of Items
Item Means 2.687 2.467 2.867 .400 1.162 .018 10
Item Variances .689 .441 1.017 .576 2.305 .037 10
Scale Statistics
Mean Variance Std. Deviation N of Items
26.8667 33.706 5.80567 10
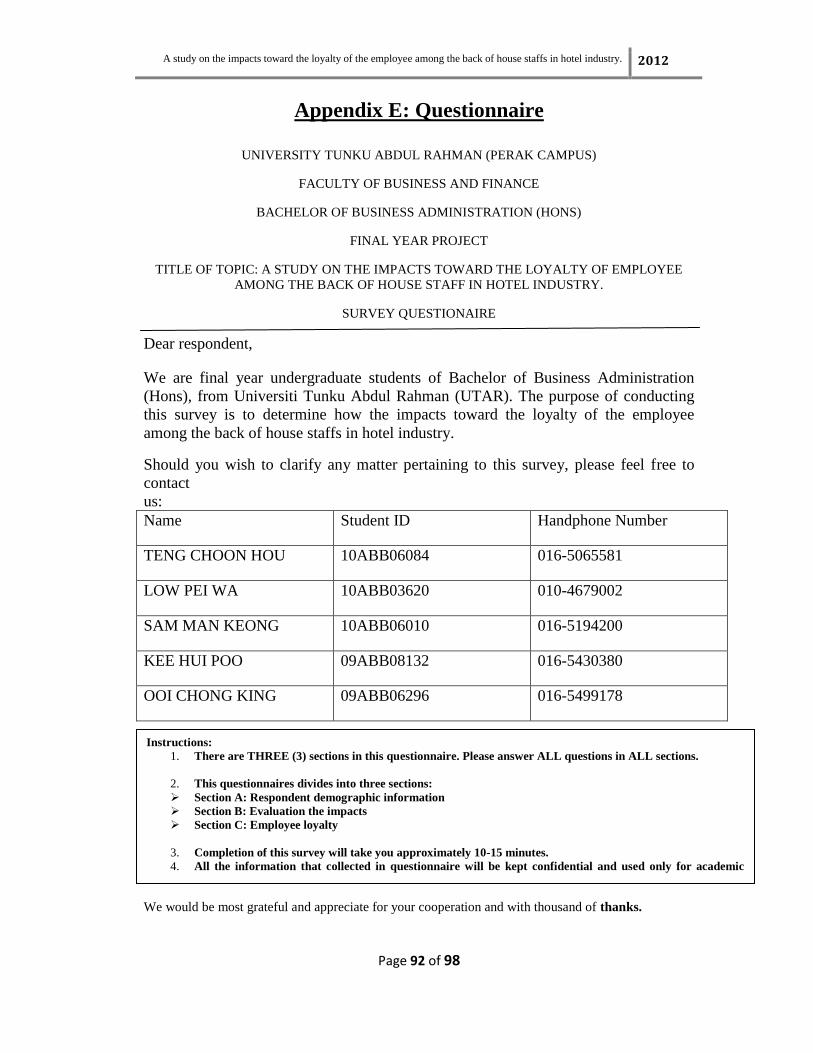
A study on the impacts toward the loyalty of the employee among the back of house staffs in hotel industry. 2012
Page 92 of 98
Appendix E: Questionnaire
UNIVERSITY TUNKU ABDUL RAHMAN (PERAK CAMPUS)
FACULTY OF BUSINESS AND FINANCE
BACHELOR OF BUSINESS ADMINISTRATION (HONS)
FINAL YEAR PROJECT
TITLE OF TOPIC: A STUDY ON THE IMPACTS TOWARD THE LOYALTY OF EMPLOYEE
AMONG THE BACK OF HOUSE STAFF IN HOTEL INDUSTRY.
SURVEY QUESTIONAIRE
Dear respondent,
We are final year undergraduate students of Bachelor of Business Administration
(Hons), from Universiti Tunku Abdul Rahman (UTAR). The purpose of conducting
this survey is to determine how the impacts toward the loyalty of the employee
among the back of house staffs in hotel industry.
Should you wish to clarify any matter pertaining to this survey, please feel free to
contact
us:
Name Student ID Handphone Number
TENG CHOON HOU 10ABB06084 016-5065581
LOW PEI WA 10ABB03620 010-4679002
SAM MAN KEONG 10ABB06010 016-5194200
KEE HUI POO 09ABB08132 016-5430380
OOI CHONG KING 09ABB06296 016-5499178
We would be most grateful and appreciate for your cooperation and with thousand of thanks.
Instructions:
1. There are THREE (3) sections in this questionnaire. Please answer ALL questions in ALL sections.
2. This questionnaires divides into three sections:
Section A: Respondent demographic information
Section B: Evaluation the impacts
Section C: Employee loyalty
3. Completion of this survey will take you approximately 10-15 minutes.
4. All the information that collected in questionnaire will be kept confidential and used only for academic
purposes.

A study on the impacts toward the loyalty of the employee among the back of house staffs in hotel industry. 2012
Page 93 of 98
SECTION A: RESPONDENT DEMOGRAPHIC INFORMATION
1. Gender:
Male
Female
2. Ethnic Group:
Chinese
Malay
Indian
Others(Please Specify)__________
3. Marital status:
Single
Married
4. Age group:
Below 25
Between 25 years old to 34 years old
Between 35 years old to 44 years old
Between 45 years old to 54 years old
Above 54 years old
INSTRUCTION: For this section, please choose the answer that most appropriate
and tick (√) according to the box applicable. Please tick ONLY ONE answer for
each question below and kindly complete every question.
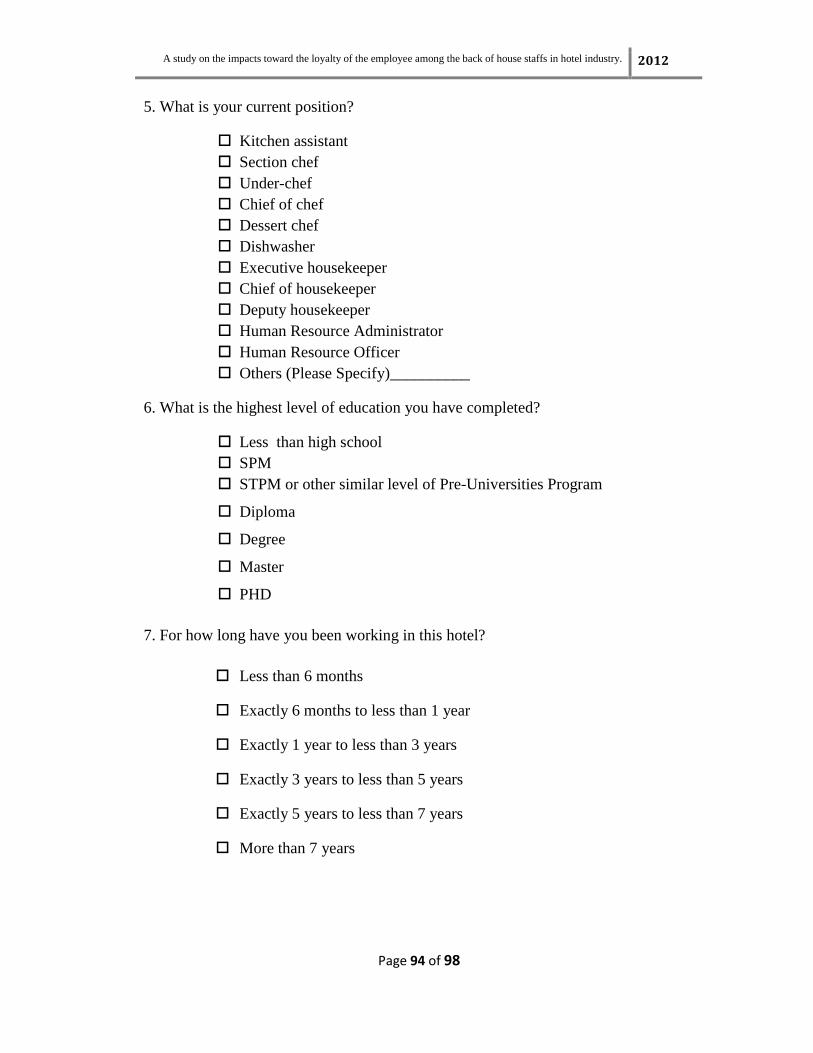
A study on the impacts toward the loyalty of the employee among the back of house staffs in hotel industry. 2012
Page 94 of 98
5. What is your current position?
Kitchen assistant
Section chef
Under-chef
Chief of chef
Dessert chef
Dishwasher
Executive housekeeper
Chief of housekeeper
Deputy housekeeper
Human Resource Administrator
Human Resource Officer
Others (Please Specify)__________
6. What is the highest level of education you have completed?
Less than high school
SPM
STPM or other similar level of Pre-Universities Program
Diploma
Degree
Master
PHD
7. For how long have you been working in this hotel?
Less than 6 months
Exactly 6 months to less than 1 year
Exactly 1 year to less than 3 years
Exactly 3 years to less than 5 years
Exactly 5 years to less than 7 years
More than 7 years
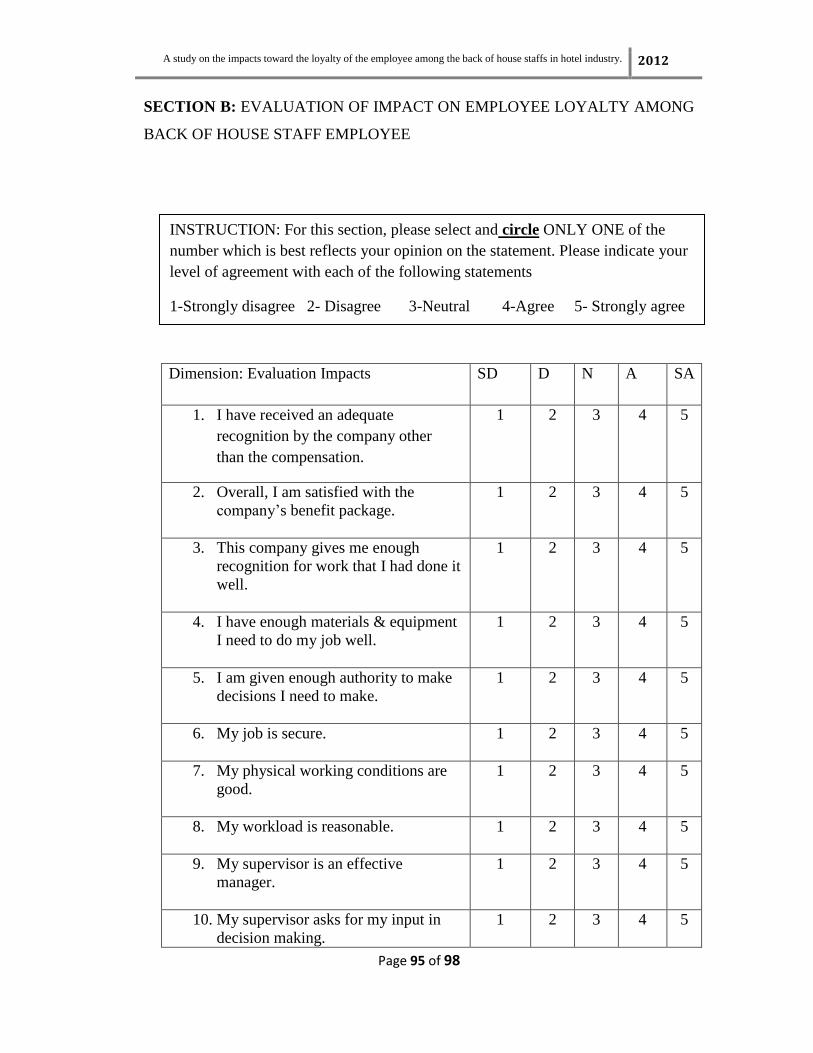
A study on the impacts toward the loyalty of the employee among the back of house staffs in hotel industry. 2012
Page 95 of 98
SECTION B: EVALUATION OF IMPACT ON EMPLOYEE LOYALTY AMONG
BACK OF HOUSE STAFF EMPLOYEE
Dimension: Evaluation Impacts SD D N A SA
1. I have received an adequate
recognition by the company other
than the compensation.
1 2 3 4 5
2. Overall, I am satisfied with the
company’s benefit package.
1 2 3 4 5
3. This company gives me enough
recognition for work that I had done it
well.
1 2 3 4 5
4. I have enough materials & equipment
I need to do my job well.
1 2 3 4 5
5. I am given enough authority to make
decisions I need to make.
1 2 3 4 5
6. My job is secure.
1 2 3 4 5
7. My physical working conditions are
good.
1 2 3 4 5
8. My workload is reasonable.
1 2 3 4 5
9. My supervisor is an effective
manager.
1 2 3 4 5
10. My supervisor asks for my input in
decision making.
1 2 3 4 5
INSTRUCTION: For this section, please select and circle ONLY ONE of the
number which is best reflects your opinion on the statement. Please indicate your
level of agreement with each of the following statements
1-Strongly disagree 2- Disagree 3-Neutral 4-Agree 5- Strongly agree
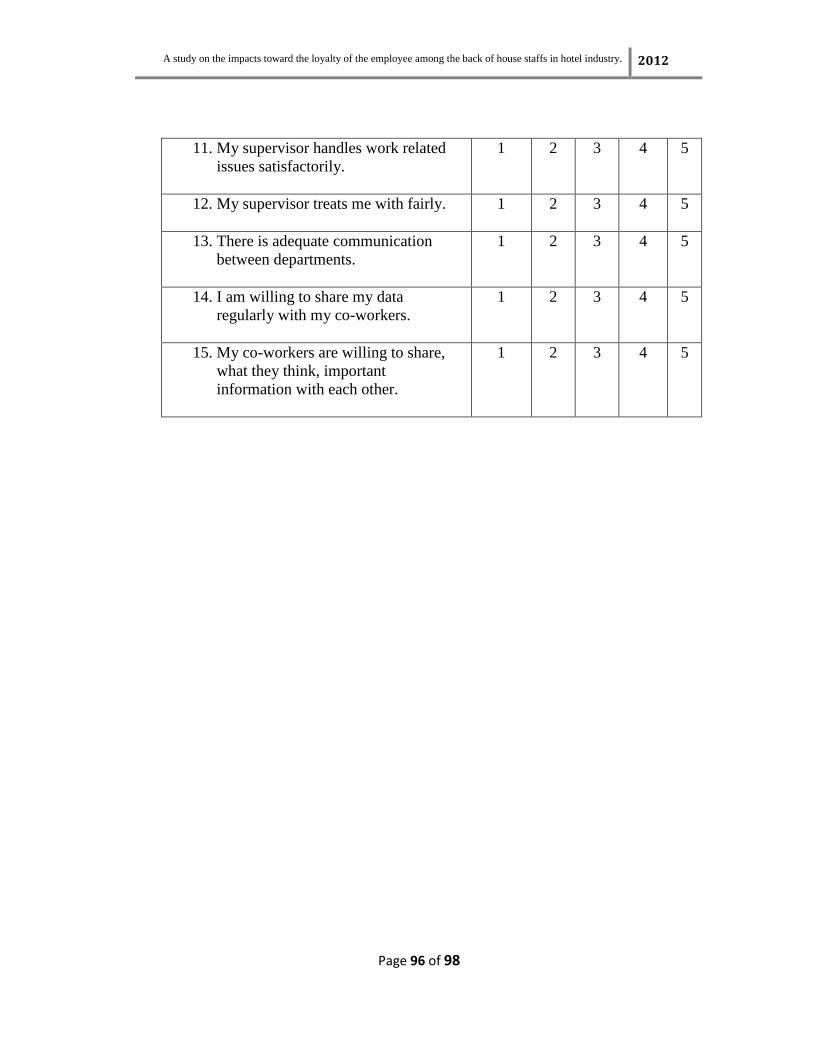
A study on the impacts toward the loyalty of the employee among the back of house staffs in hotel industry. 2012
Page 96 of 98
11. My supervisor handles work related
issues satisfactorily.
1 2 3 4 5
12. My supervisor treats me with fairly.
1 2 3 4 5
13. There is adequate communication
between departments.
1 2 3 4 5
14. I am willing to share my data
regularly with my co-workers.
1 2 3 4 5
15. My co-workers are willing to share,
what they think, important
information with each other.
1 2 3 4 5
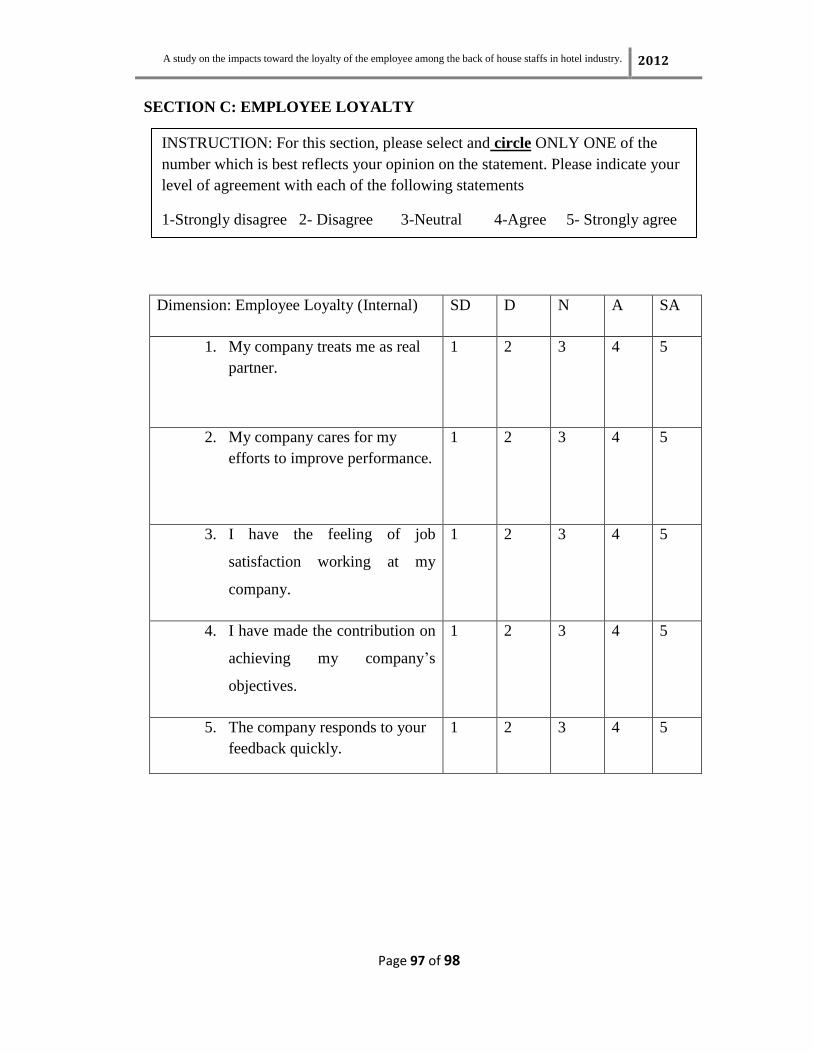
A study on the impacts toward the loyalty of the employee among the back of house staffs in hotel industry. 2012
Page 97 of 98
SECTION C: EMPLOYEE LOYALTY
Dimension: Employee Loyalty (Internal) SD D N A SA
1. My company treats me as real
partner.
1 2 3 4 5
2. My company cares for my
efforts to improve performance.
1 2 3 4 5
3. I have the feeling of job
satisfaction working at my
company.
1 2 3 4 5
4. I have made the contribution on
achieving my company’s
objectives.
1 2 3 4 5
5. The company responds to your
feedback quickly.
1 2 3 4 5
INSTRUCTION: For this section, please select and circle ONLY ONE of the
number which is best reflects your opinion on the statement. Please indicate your
level of agreement with each of the following statements
1-Strongly disagree 2- Disagree 3-Neutral 4-Agree 5- Strongly agree
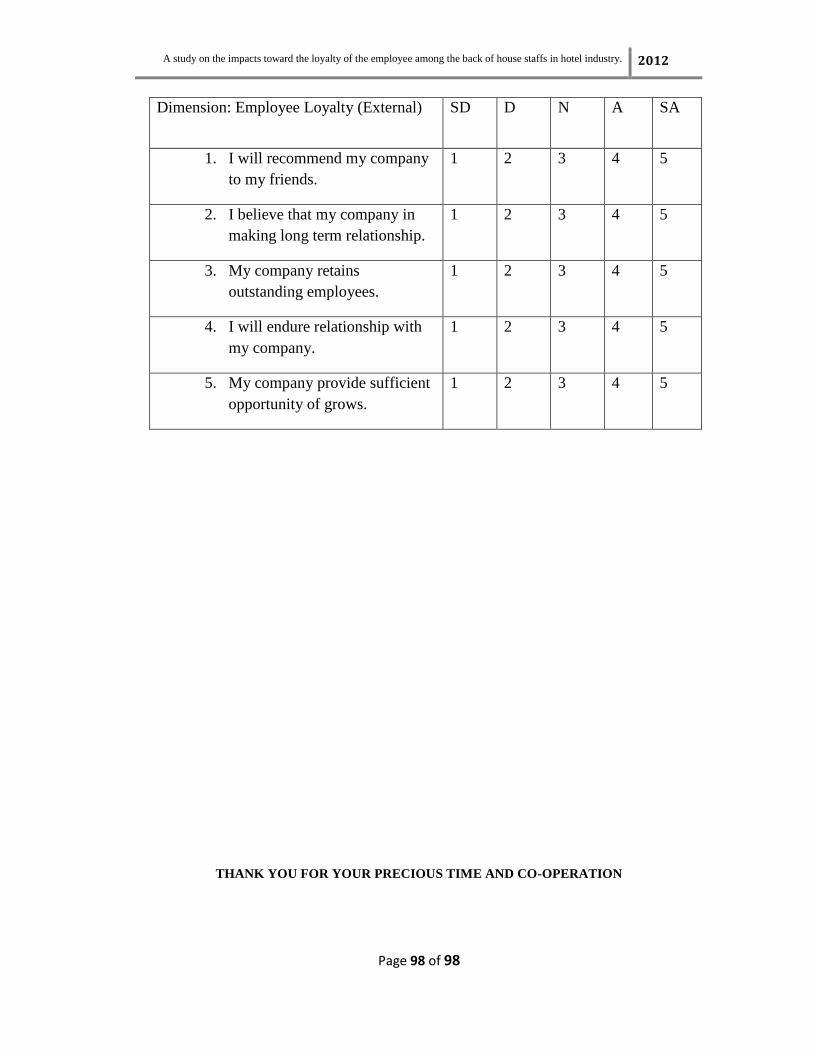
A study on the impacts toward the loyalty of the employee among the back of house staffs in hotel industry. 2012
Page 98 of 98
Dimension: Employee Loyalty (External) SD D N A SA
1. I will recommend my company
to my friends.
1 2 3 4 5
2. I believe that my company in
making long term relationship.
1 2 3 4 5
3. My company retains
outstanding employees.
1 2 3 4 5
4. I will endure relationship with
my company.
1 2 3 4 5
5. My company provide sufficient
opportunity of grows.
1 2 3 4 5
THANK YOU FOR YOUR PRECIOUS TIME AND CO-OPERATION
A study on the impacts toward the loyalty of the employee among the back of house staffs in hotel industry. 2012
Page 99 of 98