Analysis of properties of plastic coated aggregate for construction of flexible pavement
A Study on Plastic Cell Filled Concrete
Block Pavement for Low Volume Rural
Roads
A thesis submitted for the degree of Doctor of Philosophy
By
Yendrembam Arunkumar Singh
Reg. no. 07610405 (QIP)
Department of Civil Engineering
Indian Institute of Technology Guwahati
Guwahati – 781 039, India
© April 2011
Declaration
I hereby declare that the work embodied in this thesis entitled ‘A Study on Plastic Cell
Filled Concrete Block Pavement for Low Volume Rural Roads’ has been carried out
by me in the Department of Civil Engineering, Indian Institute of Technology
Guwahati, India, under the supervision of Drs. Teiborlang Lyngdoh Ryntathiang and
Konjengbam Darunkumar Singh.
In keeping with the scientific tradition, due acknowledgements have been made,
wherever the work described is based on the findings of other investigators.
Date:
Place
(Mr. Yendrembam Arunkumar Singh)
Reg. no. 07610405
Department of Civil Engineering
Indian Institute of Technology Guwahati
TH-1037_07610405
Certificate
This is to certify that the thesis entitled ‘A Study on Plastic Cell Filled Concrete Block
Pavement for Low Volume Rural Roads’ being submitted by Mr. Yendrembam
Arunkumar Singh to the Indian Institute of Technology Guwahati, India for the
award of the degree of Doctor of Philosophy is a record of bonafide research work
carried out by him under our supervision.
The thesis work, in our opinion is worthy of consideration for the award of degree of
Doctor of Philosophy in accordance with the regulations of the Institute.
(Dr. Teiborlang Lyngdoh Ryntathiang)
Assistant Professor
Department of Civil Engineering
Indian Institute of Technology Guwahati
(Dr. Konjengbam Darunkumar Singh)
Assistant Professor
Department of Civil Engineering
Indian Institute of Technology Guwahati
Date:
Place:
TH-1037_07610405

To my brother
(L) Yendrembam Sonachand Singh
TH-1037_07610405
i
Contents
Acknowledgements v
List of Figures viii
List of Tables xii
Nomenclature xiii
Publications based on the work in the thesis xv
Abstract xvi
1 Introduction 1-5
1.1 General 1
1.2 Objectives 3
1.3 Thesis organization 4
2 Review of literature 6-17
2.1 Introduction 6
2.2 Low volume rural roads – definition 7
2.3 Plastic cell concrete filled block pavement 7
2.3.1 Review of previous work carried out in South Africa 7
2.3.2 Review of previous work carried out in India 10
2.4 PCCBP as overlay construction 12
2.5 Stone dust as replacement of sand in concrete 12
2.6 Distresses in PCCBP 14
2.7 Summary of literature review 16
3 Structural behaviour of PCCBP 18-65
3.1 Introduction 18
3.2 Materials used for the construction of PCCBP 19
TH-1037_07610405
ii
3.2.1 Low density polyethylene (LDPE) plastic cell 19
3.2.2 Cement 19
3.2.3 Stone dust 19
3.2.4 Coarse aggregate 20
3.2.5 Soil 20
3.3 Laboratory investigations 20
3.4 Structural evaluation of PCCBP test sections 22
3.4.1 Test section 22
3.4.2 Excavation of the existing pavement 22
3.4.3 Preparation of the sub-grade soil 23
3.4.4 Water Bound Macadam (WBM) course 23
3.4.5 Laying and concreting of the plastic cells 24
3.4.5.1 PCCBP – New construction 24
3.4.5.2 PCCBP - Overlay section 24
3.4.6 Curing of the PCCBP test section 25
3.5 Traffic survey 26
3.6 Structural evaluation of PCCBP test section 27
3.6.1 Falling Weight Deflectometer (FWD) 28
3.6.2 Backcalculation of layer modulus using BACKGA 29
3.6.3 Deflection computation using KENLAYER 30
3.6.4 Deflection computation using ABAQUS 30
3.7 Results and discussions 31
3.7.1 Thickness effect of PCCBP test section 31
3.7.1.1 Surface deflections 31
3.7.1.2 Layer elastic modulus 32
3.7.1.3 Validation with FE and KENLAYER 33
3.7.1.4 Comparison with other similar studies 34
3.7.2 PCCBP as overlay construction 35
3.7.2.1 Surface deflections 35
3.7.2.2 Layer elastic modulus 35
3.7.3 Performance of PCCBP with load repetitions 36
3.7.3.1 Different thickness of PCCBP test section 36
3.7.3.2 PCCBP as overlay construction 37
TH-1037_07610405
iii
3.8 Conclusions 37
4 Distress study of PCCBP 66-90
4.1 Introduction 66
4.2 Terminology 67
4.3 Distress evaluation 68
4.3.1 New PCCBP test section 68
4.3.1.1 Distress type similar to interlocking concrete block 68
pavement distress manual (ICPI, 2007)
4.3.1.2 Distresses specific to PCCBP 71
4.3.2 Overlay PCCBP test section 74
4.4 Evaluation of PCI 75
4.4.1 Measuring technique 75
4.4.2 Different thickness of PCCBP 75
4.4.3 PCCBP overlay 76
4.5 Discussions 76
4.6 Conclusions 77
5 Economic evaluation 91-98
5.1 Introduction 91
5.2 Design of different types of pavement 92
5.2.1 Design parameters 92
5.2.2 Design of flexible pavement 92
5.2.3 Design of rigid pavement 92
5.2.4 Design of PCCBP 93
5.3 Cost comparison 94
5.3.1. Construction and maintenance cost 94
5.3.2 Cost estimation 95
5.4 Discussions 96
5.5 Conclusions 97
6 Summary and conclusions 99-100
7 Recommendations for future work 101
TH-1037_07610405
iv
References 102-109
Appendix 110-135
A) Detail Calculation of Vehicle Damage Factor for Evaluation of 110-111
Equivalent Single Axle Load (ESAL)
B) Calibration of geophone (sensors) using Measuring Amplifier 112
(Bruel & Kjaer, Type-2525)
C) Sample Input and Output annotated BACKGA Files 113-114
D) Annotated KENPAVE (KENLAYER) Input and Output file 115-117
E) Data Sheet for Distress Evaluation Survey 118-122
E1 150 mm thick PCCBP
E2 120 mm thick PCCBP
E3 100 mm thick PCCBP
E4 80 mm thick PCCBP
E5 50 mm thick PCCBP
F) Sample Calculation of Pavement Condition Index (PCI) 123-124
G) Annotated KENPAVE (KENLAYER) Input and Output files 125-127
(Vertical Sub-grade Strain)
H) Sample Calculation for Cost Escalation 128
I) Abstract of cost for Flexible, Rigid and PCCBP pavement 129-135
I1 Abstract of cost for Flexible Pavement
I2 Abstract of cost for Rigid Pavement
I3 Abstract of cost for Plastic Cell filled Concrete Block
Pavement (PCCBP)
TH-1037_07610405
v
Acknowledgements
The research work described herein was undertaken in the Department of Civil
Engineering, Indian Institute of Technology Guwahati, Assam, India. I took the
opportunity to express my heartiest thanks and gratitude to all those who support me to
complete this thesis.
I express my deepest sense of gratitude to my supervisors Dr. Konjengbam Darunkumar
Singh and Dr. Teiborlang Lyngdoh Ryntathiang for their personal commitment, constant
encouragement, thoughtful arrangement, valuable advice and interesting discussions
during my course of research work. My supervisors have taken lots of pain in carrying
out the research work and to bring this thesis in the present form.
I express my sincere thanks to Prof. Gautam Barua, Director, Indian Institute of
Technology Guwahati for giving permission and financial support for construction of test
pavement on IIT Guwahati main approach road. I am grateful to former Head of
Department Prof. Anjan Dutta and present Head of Department Prof. Sajal Kanti Deb for
their kind concern, helpfulness and financial assistance to carry out the experimental
works.
Thanks are also due, to Prof. Sudip Talukdar, Prof. Uday S. Dixit and Dr. Bulu Pradhan
my doctoral committee members, who has contributed with valuable remarks and ideas
from time to time to give a good shape to this thesis.
My regards and thanks to Prof. B.B. Pandey, Prof. K. Sudhakar Reddy and Dr. M.
Amaranatha Reddy, Indian Institute of Technology Kharagpur, India, for their kind
concern and extending invaluable helps whenever needed during my research work.
I express my thankfulness to Prof. A.T.Visser, University of Pretoria, South Africa, for
providing some of the literature through e-mail and HYSON-CELLS, M&S Technical
Consultants & Services (Pty) Ltd, South Africa for sending me free CD and valuable
literatures during my research work.
TH-1037_07610405

vi
I would like to express my sincere thanks to Pankaj Chaoudhury, proprietor, M/S Trisul
Enterprises, for timely supply of construction equipments, materials and workers for
construction of test pavement. I am also thank full to TOPCEM cement, Maghalaya, for
sponsoring cement for laboratory test as well as field construction of test pavement for
my research work.
The assistance and effort provided by Engineering Cell, Indian Institute of Technology
Guwahati, during the construction of test pavement and during data collection using
Falling Weight Deflectometer is gratefully acknowledged.
I would like to acknowledge the support extended by Dr. Th. Baleshwar Singh, Dr.
Rajan choudhary, Dr. Sujit Kumar Dash during my research work. A substantial part of
this thesis was based on experimental investigation. This would not have been possible
without the support of technical staff of the civil engineering department. I express my
special thanks to Mr. Kumar pallav, Scientific Officer, Mr. Arun Chandra Borsaikia,
Scientific Officer, Mrinal Sarma, Junior Technical Superintendent, Hari Ram Upadhyaya
and Nirpen Kalita, Junior Technician for their help and support in carrying out my
experimental work. I am also grateful to our department office staff like Gogoi,
Mazumder, Juri and Deepak. I would also like to thank our staff from mechanical
engineering section who help me in calibration of FWD and those who help me in
fabrication of loading frame for portable load pad calibration.
My thank goes to my friends and colleagues like Romeo, Albino, Marjit, Francice,
Sandeep Mndal, Zela, Lungshi, Marthang, Ashok, Bhim, Dependu pal, Satish Jha, Srenu,
Manoj, Aeta, Ramesh and Kartik for their invaluable help during my research work.
I am grateful to the Principal, Manipur Institute of Technology and Vice Chancellor,
Manipur University & Registrar, Manipur University, canchipur, Imphal, Manipur for
granting permission to pursue PhD at Indian Institute of Technology Guwahati under
Quality Improvement Programme.
With love I express my special appreciation to my wife Sangeeta for her enormous
patience maintaining the family during my research work. Thanks to my lovely Sere and
Barun who has taken lots of pain for my commitment towards research.
TH-1037_07610405

vii
Finally, I wish to convey my best regards to my parents and elder brother Samarendra
whose support and blessing helped me to reach so far!!!
Guwahati/Dated Yendrembam Arunkumar Singh
TH-1037_07610405
viii
List of Figures
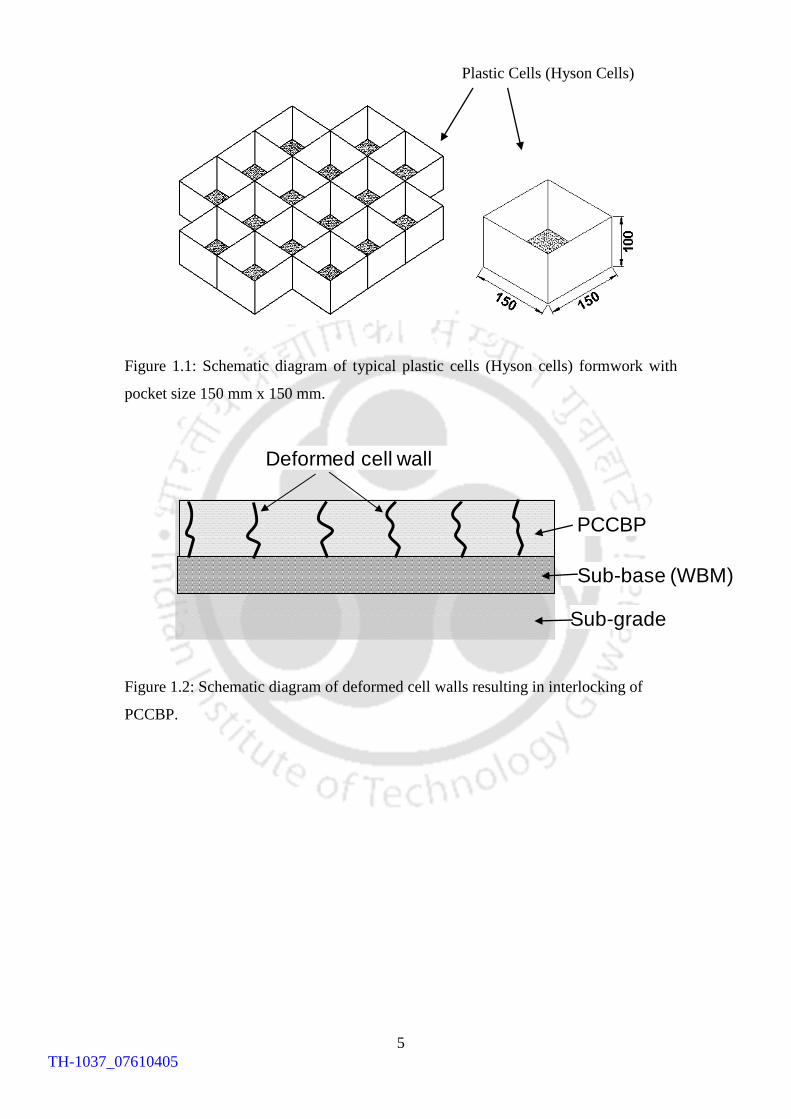
Figure 1.1: Schematic diagram of typical plastic cells (Hyson cells) formwork with
pocket size 150 mm x 150 mm.
Figure 1.2: Schematic diagram of deformed cell walls resulting in interlocking of
PCCBP.
Figure 3.1: a) Low Density Polyethyline (LDPE) pipe (0.49 mm thick and 101.6
mm in diameter), b) Sealing of plastic cell formwork using paddle
sealer, and c) Finished plastic cell formwork of pocket size 150 mm x
150mm.
Figure 3.2: Crusher run waste stone dust (approximately 20% of the total stone
crushed in the stone crusher).
Figure 3.3: Comparision between grouting and premix technique for construction of
PCCBP pavement.
Figure 3.4: Incomplete penetration of mortar in grouting method.
Figure 3.5: Variation of 7 days average cube compressive strength with cement:stone
dust ratio for premix concrete.
Figure 3.6: Schematic plan and sectional view of the test section showing different
thickness of PCCBP.
Figure 3.7: Excavation and removal of the top layers of the existing bituminous
pavement.
Figure 3.8: a) Laying and b) Compaction of the WBM course.
Figure 3.9: Layout for different sections of PCCBP.
Figure 3.10: a) Casting of the PCCBP and b) Laying of plastic cell formwork for next
PCCBP section.
Figure 3.11: A section of the road left behind while resurfacing the road stretch on
which the test pavement was constructed.
Figure 3.12: Application of adhesive prime coat Gellix over existing bituminous
pavement, after surface preparation.
Figure 3.13: Casting of the PCCBP overlay over adhesive prime coat (Gellix).
TH-1037_07610405
ix
Figure 3.14: Schematic diagram showing PCCBP and Bituminous overlays.
Figure 3.15: Completed PCCBP test road with markings for different test sections.
Figure 3.16: Core samples collected from test sections show good compaction and
thickness of each section is maintained properly.
Figure 3.17: A sample core showing interlocking LDPE (red line shows its location),
and layer (~10-15 mm) of concrete on top of plastic cells.
Figure 3.18: Completed PCCBP test sections opened to regular traffic.
Figure: 3.19: Axle load measurement using load pad.
Figure 3.20: Monthly number of ESAL (Equivalent Single Axle Load) passing on the
test pavement.
Figure 3.21: Cumulative ESAL with month (~11 months).
Figure 3.22: Custom fabricated FWD for the present study.
Figure 3.23: Schematic diagram showing surface deflection measurement using FWD
at different radial distances from load.
Figure 3.24: Schematic diagram showing a) top plan view of PCCBP, b) sectional
elevation of PCCBP, and c) idealized geometry for finite element
analysis.
Figure 3.25: Typical FE mesh (25,738 nodes, 22,805 elements, C3D8R).
Figure 3.26: Comparison of the present study with similar studies on PCCBP
(thickness equal to 100 mm) in India.
Figure 3.27: Surface deflection profiles for different thicknesses of PCCBP.
Figure 3.28: Variation of peak surface deflection with PCCBP thickness.
Figure 3.29: Variation of PCCBP layer elastic moduli with PCCBP thickness.
Figure 3.30: Variation of sub-base elastic moduli with PCCBP thickness.
Figure 3.31: Variation of sub-grade elastic moduli with PCCBP thickness.
Figure 3.32: Typical vertical displacement contour for PCCBP test pavement from
FE analysis.
Figure 3.33a: Comparison of experimental, FE and KENLAYER (KP) surface
deflection vairation with PCCBP thickness (50 mm, 80 mm and 100
mm).
Figure 3.33b: Comparison of experimental, FE and KENLAYER (KP) surface
deflection vairation with PCCBP thickness (12 mm and 150 mm).
TH-1037_07610405
x
Figure 3.34: Comparison of elastic layer modulus with those from literature (100 mm
thick PCCBP).
Figure 3.35: Surface profile variation for PCCBP and bituminous overlays.
Figure 3.36: Thre layer idealisation (by combining base and bituminous carpet into
sub-base layer) of overlay consruction.
Figure 3:37: Comparision of elastic layer modulus (for surface, sub-base and sub-
grade layers) for PCCBP and bituminous overlay constructions.
Figure 3.38: Variation of PCCBP layer elastic modulus with number of passes
(ESAL), for different thicknesses.
Figure 3.39: Variation of sub-base layer elastic modulus with number of passes
(ESAL), for different thicknesses.
Figure 3.40: Variation of sub-grade layer elastic modulus with number of passes
(ESAL), for different thicknesses.
Figure 3.41: Variation of surface layer elastic modulus for surface layer with number
of passes (ESAL), for PCCBP and bituminous overlay construction.
Figure 3.42: Variation of sub-base layer elastic modulus with number of passes
(ESAL), for PCCBP and bituminous overlay construction.
Figure 3.43: Variation of sub-grade layer elstic modulus with number of passes
ESAL), for PCCBP and bituminous overlay construction.
Figure 4.1: Flowchart for developing the PCI values (ICPI, 2007).
Figure 4.2: Zone of traffic flow (visual inspection).
Figure 4.3: Surface degradation of the test sections with traffic passes (ESAL).
Figure 4.4 Rutting in 50 mm PCCBP test section.
Figure 4.5 Surface profile contour of the test pavement after ~62000 ESAL passes.
Figure 4.6: Avereage rut depth of different test sections after ~ 62,000 ESAL
passes.
Figure 4.7: Damaged pavers observed in 120 mm thick PCCBP test section.
Figure 4.8: Measurement of depression (80 mm thick PCCBP) using a 3 meter long
straight edge alluminium bar.
Figure 4.9: Surface faulting (100 mm thick PCCBP).
Figure 4.10: Different stages of development of edge spalls of PCCBP blocks.
Figure 4.11: Edge spalling mechanism.
Figure 4.12: Scaling of 100 mm thick PCCBP surface.
TH-1037_07610405
xi
Figure 4.13: Exposed cells wall in the 80 mm thick PCCBP test section.
Figure 4.14: Cell opening in 100 mm thick PCCBP test section.
Figure 4.15: Surface condition of 50 mm thick PCCBP overlay lay over 445 mm
thick existing bituminous pavement.
Figure 4.16: Flow chart for calculation of PCI.
Figure 4.17: Deduct curve for rutting (ICPI, 2007).
Figure 4.18: Deduct curve for damage paver (ICPI, 2007).
Figure 4.19: Deduct curve for depressions (ICPI, 2007).
Figure 4.20: Deduct curve for faulting (ICPI, 2007).
Figure 4.21: Corrected deduct value curve (ICPI, 2007).
TH-1037_07610405
xii
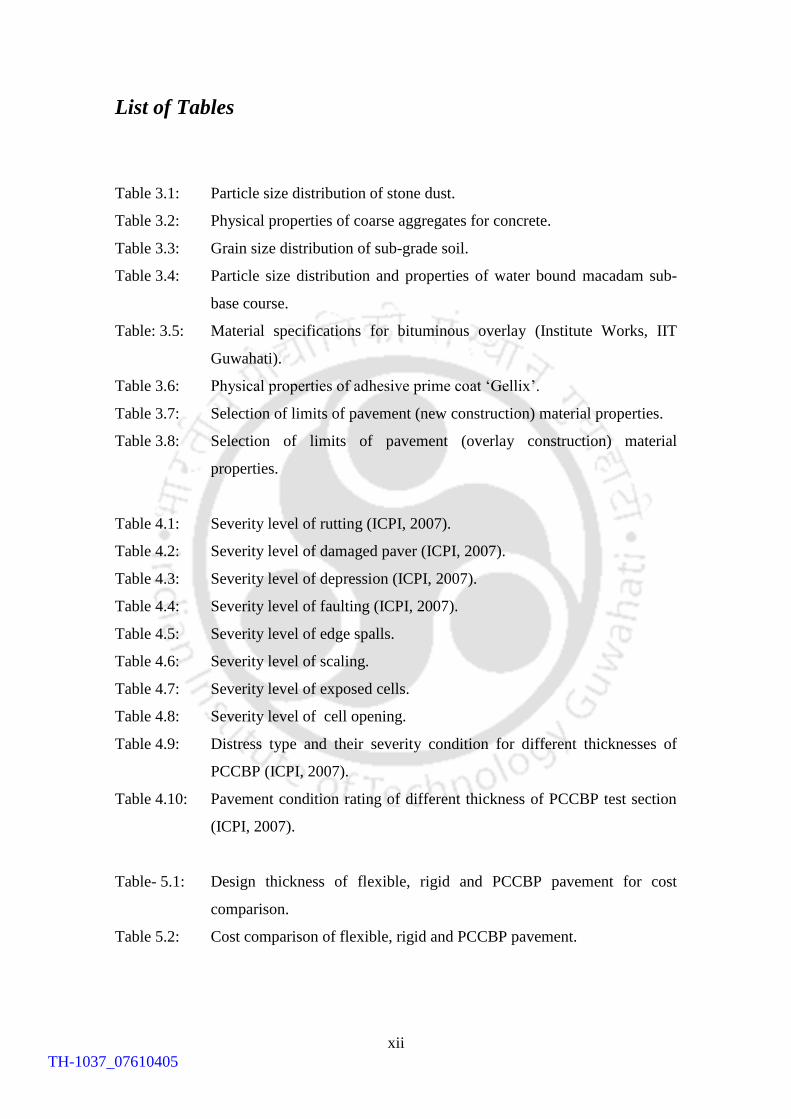
List of Tables
Table 3.1: Particle size distribution of stone dust.
Table 3.2: Physical properties of coarse aggregates for concrete.
Table 3.3: Grain size distribution of sub-grade soil.
Table 3.4: Particle size distribution and properties of water bound macadam sub-
base course.
Table: 3.5: Material specifications for bituminous overlay (Institute Works, IIT
Guwahati).
Table 3.6: Physical properties of adhesive prime coat ‘Gellix’.
Table 3.7: Selection of limits of pavement (new construction) material properties.
Table 3.8: Selection of limits of pavement (overlay construction) material
properties.
Table 4.1: Severity level of rutting (ICPI, 2007).
Table 4.2: Severity level of damaged paver (ICPI, 2007).
Table 4.3: Severity level of depression (ICPI, 2007).
Table 4.4: Severity level of faulting (ICPI, 2007).
Table 4.5: Severity level of edge spalls.
Table 4.6: Severity level of scaling.
Table 4.7: Severity level of exposed cells.
Table 4.8: Severity level of cell opening.
Table 4.9: Distress type and their severity condition for different thicknesses of
PCCBP (ICPI, 2007).
Table 4.10: Pavement condition rating of different thickness of PCCBP test section
(ICPI, 2007).
Table- 5.1: Design thickness of flexible, rigid and PCCBP pavement for cost
comparison.
Table 5.2: Cost comparison of flexible, rigid and PCCBP pavement.
TH-1037_07610405
xiii
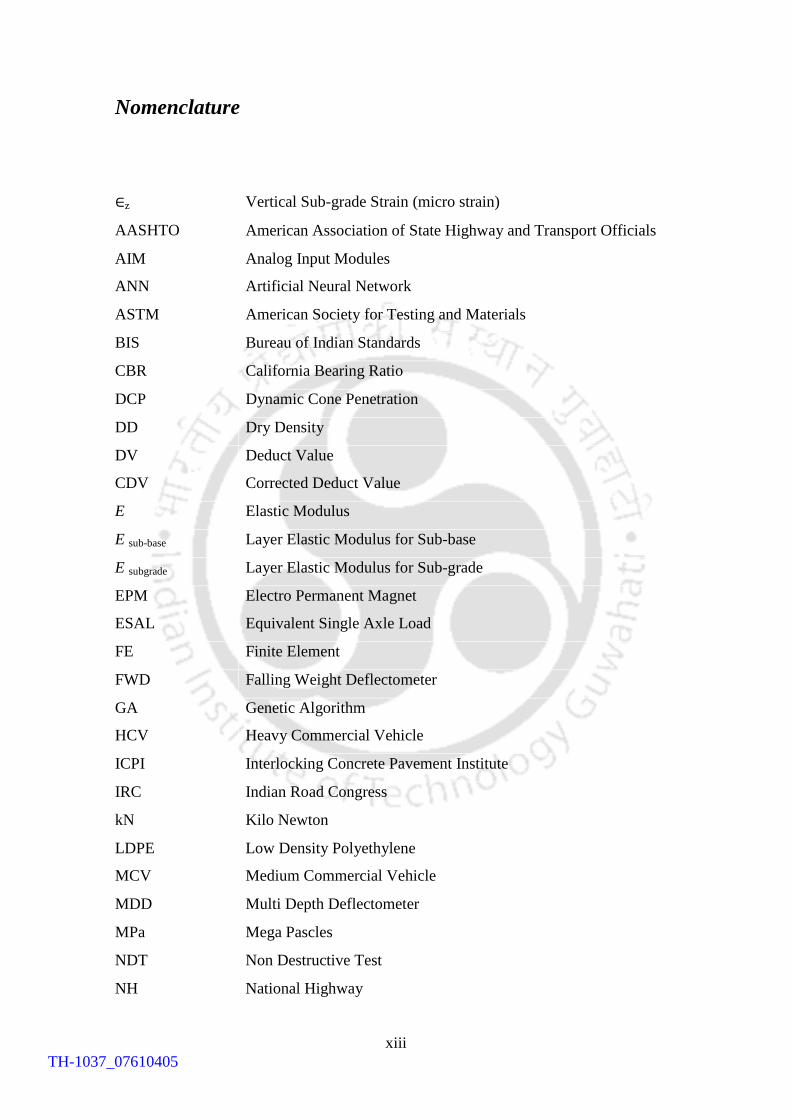
Nomenclature
∈z Vertical Sub-grade Strain (micro strain)
AASHTO American Association of State Highway and Transport Officials
AIM
ANN
Analog Input Modules
Artificial Neural Network
ASTM American Society for Testing and Materials
BIS Bureau of Indian Standards
CBR California Bearing Ratio
DCP Dynamic Cone Penetration
DD Dry Density
DV
CDV
Deduct Value
Corrected Deduct Value
E Elastic Modulus
E sub-base Layer Elastic Modulus for Sub-base
E subgrade Layer Elastic Modulus for Sub-grade
EPM
ESAL
Electro Permanent Magnet
Equivalent Single Axle Load
FE Finite Element
FWD Falling Weight Deflectometer
GA
HCV
Genetic Algorithm
Heavy Commercial Vehicle
ICPI Interlocking Concrete Pavement Institute
IRC Indian Road Congress
kN Kilo Newton
LDPE
MCV
Low Density Polyethylene
Medium Commercial Vehicle
MDD Multi Depth Deflectometer
MPa Mega Pascles
NDT Non Destructive Test
NH National Highway
TH-1037_07610405
xiv
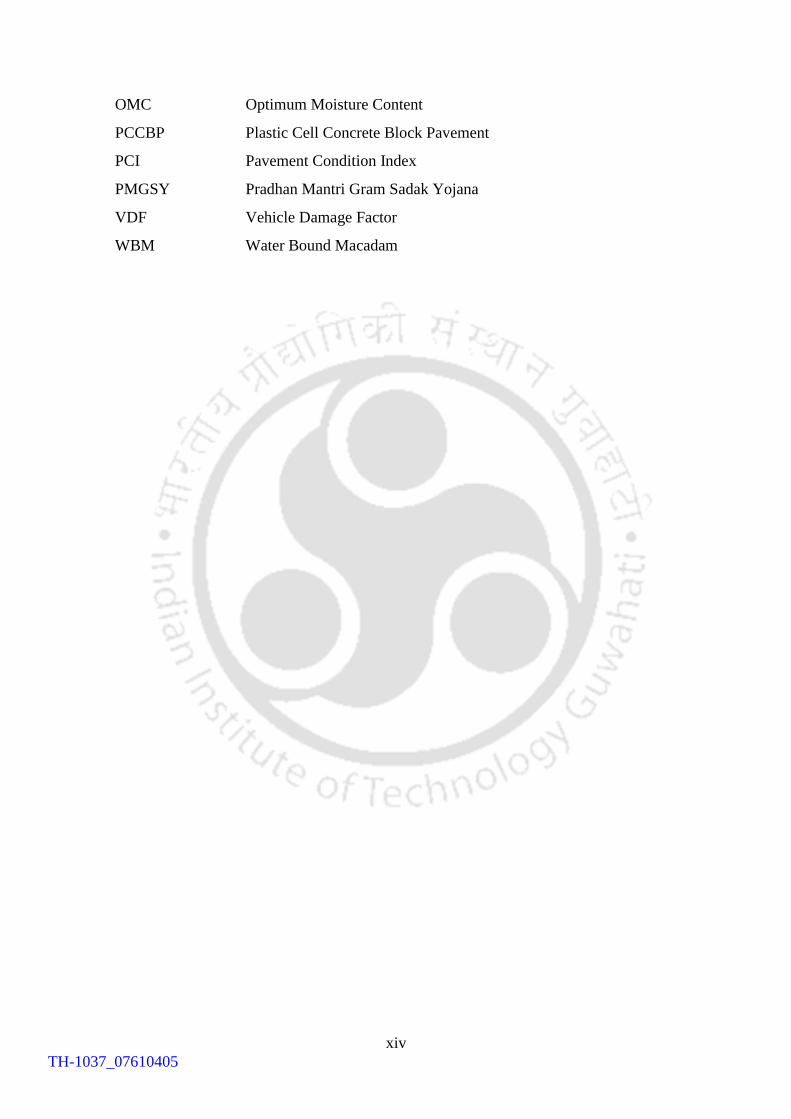
OMC Optimum Moisture Content
PCCBP Plastic Cell Concrete Block Pavement
PCI Pavement Condition Index
PMGSY Pradhan Mantri Gram Sadak Yojana
VDF Vehicle Damage Factor
WBM Water Bound Macadam
TH-1037_07610405
xv
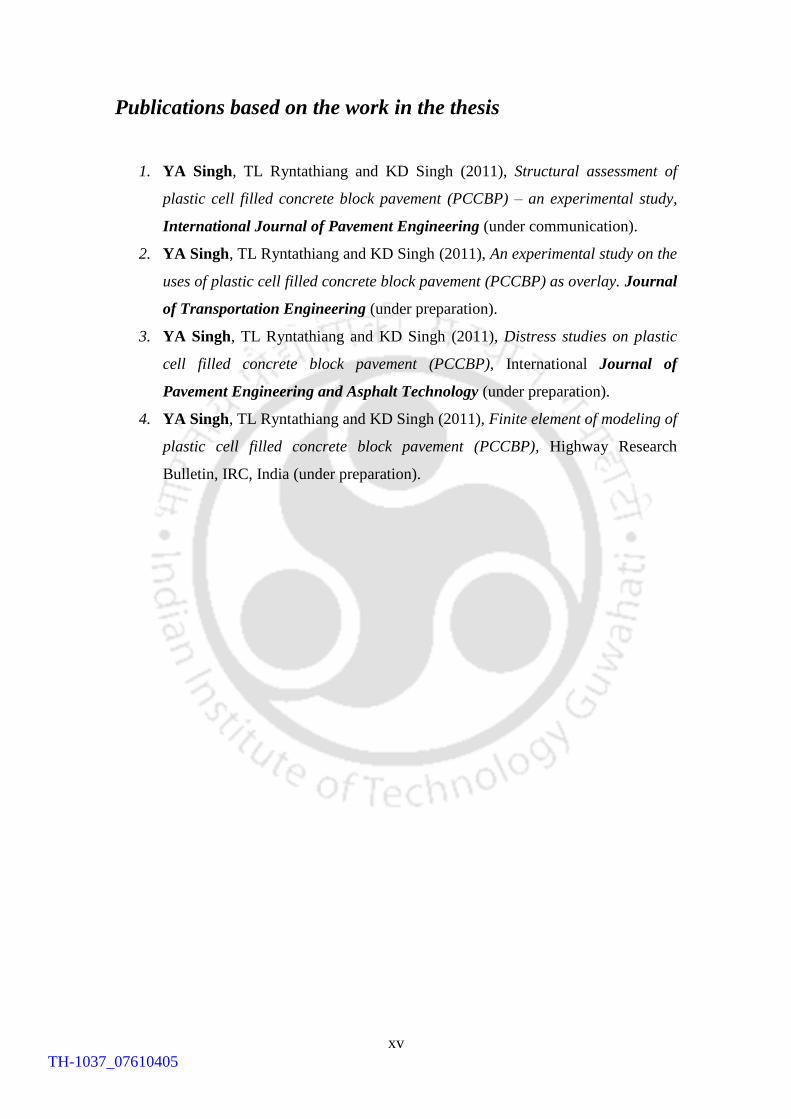
Publications based on the work in the thesis
1. YA Singh, TL Ryntathiang and KD Singh (2011), Structural assessment of
plastic cell filled concrete block pavement (PCCBP) – an experimental study,
International Journal of Pavement Engineering (under communication).
2. YA Singh, TL Ryntathiang and KD Singh (2011), An experimental study on the
uses of plastic cell filled concrete block pavement (PCCBP) as overlay. Journal
of Transportation Engineering (under preparation).
3. YA Singh, TL Ryntathiang and KD Singh (2011), Distress studies on plastic
cell filled concrete block pavement (PCCBP), International Journal of
Pavement Engineering and Asphalt Technology (under preparation).
4. YA Singh, TL Ryntathiang and KD Singh (2011), Finite element of modeling of
plastic cell filled concrete block pavement (PCCBP), Highway Research
Bulletin, IRC, India (under preparation).
TH-1037_07610405
xvi
INDIAN INSTITUTE OF TECHNOLOGY GUWAHATI DEPARTMENT OF CIVIL ENGINEERING
ABSTRACT
Doctor of Philosophy
A study on plastic cell filled concrete block pavement for low volume rural roads
By
Yendrembam Arunkumar Singh
A systematic full scale experimental study on the structural performance of Plastic Cell
filled Concrete Block Pavement (PCCBP) for various cell thicknesses subjected to live
traffic conditions is presented in this research work. Five test sections of different
thicknesses viz., 50 mm, 80 mm, 100 mm, 120 mm and 150 mm, of PCCBP over 100
mm thick water bound macadam (WBM) sub-base layer has been constructed at the
approach road towards Indian Institute of Technology Guwahati (IIT Guwahati), India,
from National Highway 31 (NH 31). In addition, to check the feasibility of PCCBP
overlay to strengthen the existing old bituminous pavement, 50 mm thick PCCBP
overlay test section was also constructed. Further, in order to optimize the cost of
pavement construction, an attempt has been made to use waste stone dust (byproduct
of aggregates crushing) in place of the traditional river sand. Custom fabricated Falling
Weight Deflectometer (FWD) was used to evaluate the PCCBP by measuring the
surface deflections at specified radial distance from the load center. In this work,
Genetic Algorithm (GA) based backcalculation program (Reddy et. al., 2002) was
used for backcalculating the layer moduli of the PCCBP test sections using pavement
surface deflection data. For the thicknesses tested, elastic layer modulus of PCCBP
(~1995 MPa for 50 mm thick) has been seen to increase linearly with increasing
thickness (~90% increase in elastic modulus was observed for 200% increase in
thickness).
To evaluate the structural performance of PCCBP, surface deflections data using FWD
were collected at regular intervals of 0 passes, 38,000 passes (~6 months) and 62,000
passes (~11 months). It has been observed that for the initial 38,000 ESAL passes the
degradation in layer modulus of PCCBP is of the range ~3-20%, however there appears
TH-1037_07610405
xvii
to be a stabilization after 38,000 ESAL passes with the degradation dropping to ~1-7%
(from 38,000 to 62,000 ESAL passes). It has also been seen that there is a significant
improvement (~230% increase) in elastic layer modulus when PCCBP is used as
overlay as compared to that of bituminous overlay.
Efforts have been made to assess pavement distresses of PCCBP test section using
distress guidelines developed by Interlocking Concrete Pavement Institute (ICPI, 2007)
based on Pavement Condition Index (PCI) for similar distress types observed. The
distress type and severity level of each test section was recorded and PCI value of each
section was calculated using the deduct curves given in the distress manual. From the
PCI value, the rating of the test section was found to be in the range from Fair to Very
Good condition even after a load repetition of 62,000 ESAL passes. Specific distresses
observed for PCCBP are also reported. From the feasibility study of PCCBP overlay, it
was observed that the performance is Excellent even after 62,000 ESAL passes.
Economic evaluation of PCCBP vis-a-vis conventional flexible and rigid pavements
was also carried out. In the absence of design guidelines for PCCBP, rutting criteria as
per IRC (2001) was adopted to design the PCCBP pavement. Conventional flexible and
rigid pavements were design as per IRC (2007) and IRC (2004). The construction and
maintenance cost were estimated based on Government of Assam schedule rate 2007-
08 (PWD, 2007) and guidelines for the estimation of the maintenance cost for
construction of the rural roads (IRC, 2002; PMGSY, 2010). Suitable cost escalation
factor to bring to the year 2010 market rate were considered based on monthly
wholesale price index (OEA, 2010). Economic evaluation (considering construction
cost and maintenance cost for 5 years) shows that cost of flexible and rigid pavements
are higher by ~43% and ~141% respectively as compared to that of PCCBP. Hence,
PCCBP with waste stone dust as replacement for the traditional river sand for both
concrete and WBM can be an economical option for rural roads.
TH-1037_07610405
1
CHAPTER 1
Introduction
1.1 General
Designing sustainable rural roads with reasonable riding quality and low life cycle
cost has always been one of the major challenges for pavement engineers and
researchers. The research effort in this direction has become far-reaching pertinent in
India as the share of low volume (< one million Equivalent Single Axle Loads
(ESAL) in a life cycle as per IRC, 2007 and AASHTO, 1993) rural road is about 80%
of the total road length (NHAI, 2011). Whilst conventional flexible pavement with a
thin cover of premix bituminous carpet is normally adopted for rural roads, frequent
maintenance are required (to maintain both functional and structural efficiencies) due
to damages caused by poor drainage conditions, overloaded vehicular traffic, iron
wheeled bullock carts etc. As a result such pavement incurs huge maintenance cost.
To offset such expensive maintenance cost, concrete pavements are increasingly used
in rural road connectivity in India because of their durability. However it not only
involves high initial cost but can also fail due to various reasons like day and night
variations in warping stresses, seasonal changes in the modulus of sub-grade reaction
etc. (Srinivas et. al., 2007). Although pre-cast concrete block pavement (Panda, B.C.
and Ghosh, A.K., 2002(a); Panda, B.C. and Ghosh, A.K., 2002(b) and Ryntathiang,
2005) provides more flexible response (depending upon the dilantancy of the jointing
sand) as compared to the normal concrete pavement mentioned above, there is a
tendency for block movements under braking or accelerating force of the vehicular
traffic and the interlocking caused by the jointing sand needs frequent maintenance
which may not be practical for rural roads.
As an alternative, for better structural performance and low maintenance, a new
pavement technology called Plastic Cell Filled Concrete Block Pavement (PCCBP)
TH-1037_07610405
2
was developed in South Africa (Visser, 1994, 1999; Visser and Hall, 1999, 2003). In
PCCBP, diamond shaped heat welded plastic cells (see Figure 1.1) is used to encase
concrete blocks. It may be noted that this type of plastic cell formwork has been
successfully used for canal lining, reinforced earth treatment etc. (Visser and Hall,
1999). The cells are tensioned and spread across the foundation layer and concrete is
filled and compacted into the cells. Upon compaction the cell walls get deformed
resulting in interlocking of adjacent individual concrete blocks (see Figure 1.2).
Flexibility is induced into cement bound (rigid) surface and Visser (1999) termed
these pavements as “Flexible Concrete Pavements”. Whereas, in the case of pre-cast
concrete block pavements, concrete pavers are set in bedding sand and the spaces
between the individual paving units is filled with clean quality joint sands, PCCBP are
cast-in-situ concrete blocks where there is interlocking between the individual blocks
with plastic between the blocks. The PCCBP has good load spreading capacity with
competitive lifecycle cost with conventional pavement types (Visser, 1994, 1999).
Although construction of PCCBP can be mechanized, significant amount of hand
labour may be utilized making it labour intensive with possibilities of generating
employment opportunities for the rural inhabitants.
In India, limited studies on PCCBP technology have been reported by Ryntathiang et.
al., (2005), Pandey (2006), Sahoo et. al., (2006), Roy et. al., (2009, 2010) and
Shivaprakash, (2011) on the cost effectiveness and feasibility for rural roads. Albeit
their studies were confined to selected PCCBP thicknesses e.g., 40 mm (Roy et. al.,
2009, 2010), 75 mm (Ryntathiang et. al., 2005) and 100 mm (Ryntathiang et. al.,
2005, Roy et. al., 2009, 2010, Shivaprakash, 2011), it was observed that PCCBP can
provide sufficiently high elastic modulus with low initial and maintenance cost. From
the review of literatures available, no attempt has been made to study the effect of
PCCBP thickness on the structural performance of pavement. It may also be
mentioned that as most reported studies on PCCBP were not performed for live traffic
conditions, their suitability for actual field conditions need to be observed. Lack of the
above information has hindered the development of design standards, at least in the
Indian road context.
The present work aims to conduct a systematic field study on the structural
performance of PCCBP for various cell thicknesses subjected to live traffic (low
TH-1037_07610405
3
volume) conditions. Five test sections of different thicknesses viz., 50 mm, 80 mm,
100 mm, 120 mm and 150 mm of PCCBP over a proposed 100 mm thick water bound
macadam (WBM) sub-base layer has been constructed at the approach road towards
Indian Institute of Technology Guwahati (IIT Guwahati), India from National
Highway 31 (NH31). A 50 mm thick PCCBP overlay is also constructed on the
existing old bituminous surface to explore the possibility of PCCBP as overlay and to
compare it with the bituminous overlay which was constructed (three) months ahead
by other agency. Further in order to optimize the cost of pavement construction, an
attempt is made to use stone dust (byproduct of aggregates crushing) in place of the
traditional river sand. It may be noted that with increasing infrastructure development
in road projects, housing sector and other major concrete structures etc. demand for
crushed stone aggregates (~approximately 20% of crushed stone goes as waste stone
dust) has increased resulting in more waste stone dust (Tripathy and Barasi, 2006).
The use of waste stone dust in the construction of rural roads is also expected to solve
the scarcity of construction materials like river sand in remote far flung rural areas,
and help in cost cutting where the cost of transporting sand is relatively expensive.
Thus efforts in this work are directed towards evaluating the structural performance of
PCCBP under live traffic condition by using linear elastic layer theory based moduli
backcalculation computer code BACKGA (Reddy et al., 2002) from the surface
deflection data obtained through a custom fabricated Falling Weight Deflectometer
(FWD). In additional, attempts have also been made to carry out distress studies of
PCCBP test sections based on pavement condition index (PCI) methodology.
Economic evaluation of PCCBP vis-a-vis conventional flexible and concrete
pavements was also carried in order to know the advantages of constructing rural
roads with PCCBP over the conventional flexible and rigid pavements.
1.2 Objectives
The main objectives of the present study are:
1. To evaluate structural behavior of different thicknesses of PCCBP (using waste
stone dust as fine aggregates) over 100 mm thick water bound macadam (WBM)
sub-base.
2. To explore the possibility of laying PCCBP as overlay on existing old
bituminous pavement.
TH-1037_07610405
4
3. To study the various distresses of PCCBP based on pavement condition index.
4. Economic assessment of PCCBP vis-a-vis conventional flexible and rigid
pavements.
1.3 Thesis organization
The thesis consists of seven chapters as mentioned below:
An introduction to PCCBP along with a brief description about various
chapters of the thesis is presented in Chapter 1. The key objectives of the
study are also enumerated in the same chapter.
In Chapter 2, a review of relevant work carried out by different researchers on
PCCBP, stone dust as a replacement of sand in concrete and distress studies on
PCCBP have been presented.
Field investigations on structural behavior of different thicknesses and overlay
(over existing old bituminous pavement) PCCBP constructions have been
discussed in Chapter 3. Variations in layer moduli of PCCBP with traffic
passes are also presented.
Chapter 4 describes the distress studies of the PCCBP test sections with traffic
passes.
Economic evaluation of PCCBP vis-a-vis conventional flexible and concrete
pavement is presented in Chapter 5.
Summary and conclusions of the present study are presented in Chapter 6.
Recommendations for possible future work are presented in Chapter 7.
TH-1037_07610405
5
Figure 1.1: Schematic diagram of typical plastic cells (Hyson cells) formwork with
pocket size 150 mm x 150 mm.
Figure 1.2: Schematic diagram of deformed cell walls resulting in interlocking of
PCCBP.
PCCBP
Sub-base (WBM)
Sub-grade
Deformed cell wall
Plastic Cells (Hyson Cells)
TH-1037_07610405

6
CHAPTER 2
Literature Review
2.1 Introduction
During the last few decades, road infrastructures have been given high priority by the
Government of India for faster socio-economic growth of the far flung rural
inhabitants. In order to speed up the development process, the Ministry of Rural
Development, Government of India, has launched a rural road development program
called Pradhan Mantri Gram Sadak Yojna (PMGSY) for connecting unconnected
rural inhabitants with all weather roads (PMGSY, 2010). Developing countries such
as India faces a challenging task for providing all-weather road connectivity to their
rural inhabitants. As mentioned in Chapter 1, with rural roads constituting bulk of the
total road length in India (NHAI, 2011), it has become important to explore
innovative cost-effective (without compromising performance) pavement technology
with a good load spreading capacity and long life. In this context, PCCBP which is a
flexible concrete block pavement using a locally developed welded plastic cell
(Hyson-cells) pioneered by Visser (1994) can be a promising alternative for low
volume rural roads where highly mechanized construction and strict quality control
may not be possible. The technology has not been used by any other investigators
throughout the world except some limited studies carried out in India (Roy et. al.,
2009, 2010, Sahoo et. al., 2006 and Ryntathiang, 2005). The following sections
provide an introduction on low volume roads followed by review of literatures
pertaining to PCCBP. Reviews of using stone dust as fine aggregates in concrete are
also discussed. In the absence of any prior systematic studies on distresses of PCCBP,
reviews on relevant distresses studies on pre-cast interlocking concrete block
pavements are addressed.
TH-1037_07610405
7
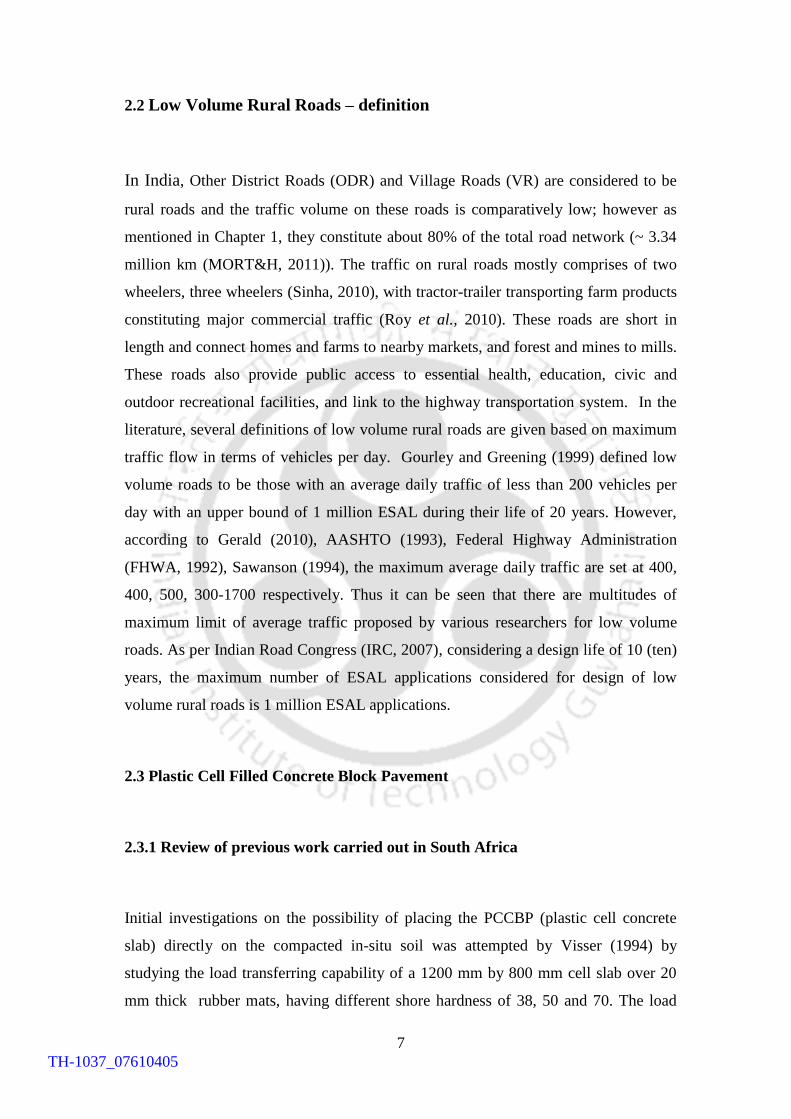
2.2 Low Volume Rural Roads – definition
In India, Other District Roads (ODR) and Village Roads (VR) are considered to be
rural roads and the traffic volume on these roads is comparatively low; however as
mentioned in Chapter 1, they constitute about 80% of the total road network (~ 3.34
million km (MORT&H, 2011)). The traffic on rural roads mostly comprises of two
wheelers, three wheelers (Sinha, 2010), with tractor-trailer transporting farm products
constituting major commercial traffic (Roy et al., 2010). These roads are short in
length and connect homes and farms to nearby markets, and forest and mines to mills.
These roads also provide public access to essential health, education, civic and
outdoor recreational facilities, and link to the highway transportation system. In the
literature, several definitions of low volume rural roads are given based on maximum
traffic flow in terms of vehicles per day. Gourley and Greening (1999) defined low
volume roads to be those with an average daily traffic of less than 200 vehicles per
day with an upper bound of 1 million ESAL during their life of 20 years. However,
according to Gerald (2010), AASHTO (1993), Federal Highway Administration
(FHWA, 1992), Sawanson (1994), the maximum average daily traffic are set at 400,
400, 500, 300-1700 respectively. Thus it can be seen that there are multitudes of
maximum limit of average traffic proposed by various researchers for low volume
roads. As per Indian Road Congress (IRC, 2007), considering a design life of 10 (ten)
years, the maximum number of ESAL applications considered for design of low
volume rural roads is 1 million ESAL applications.
2.3 Plastic Cell Filled Concrete Block Pavement
2.3.1 Review of previous work carried out in South Africa
Initial investigations on the possibility of placing the PCCBP (plastic cell concrete
slab) directly on the compacted in-situ soil was attempted by Visser (1994) by
studying the load transferring capability of a 1200 mm by 800 mm cell slab over 20
mm thick rubber mats, having different shore hardness of 38, 50 and 70. The load
TH-1037_07610405
8
transferring capability of different thicknesses of slab of 50, 75, 100 and 150 mm
were tested under an applied load of 40 kN load (legal dual wheel load) on a 300 mm
diameter load plate. The slabs were cast in the plastic cell formwork and tested after
three weeks. It was observed that the equivalent elastic modulus of cell slab, found
out using a linear elastic program code, ELSYM (Visser, 1994), showed decreasing
trend with decrease in slab thickness. The lowest value corresponding to the 50 mm
thick slab was 100 MPa. The stiffness of the slab with greater resilience rubber mat
was found to be higher than that with lesser resilience. Further, good load spreading
capability (slab action) through interlocking between blocks was also reported.
Visser and Hall (1999) carried out experimental tests to develop a design catalogue
for PCCBP for low volume roads. Based on the success of laboratory tests, three field
trial sections were constructed using grouting method on a road carrying 300 laden
five axle trucks daily. In the grouting method, plastic cell formworks were spread and
tensioned over the foundation layer and cells were filled with coarse aggregates and
mortar was vibrated into the voids between coarse aggregates (e.g., using a plate
vibrator). The sections were constructed on compacted granite unpaved road having
wearing course thickness of 250 mm and in situ California Bearing Ratio (CBR) of
150%. Based on the performance of the field test with 150 mm thick PCCBP using
cement: sand ratio of 1:1, it was concluded that for heavy traffic the concrete
compressive strength of 15 MPa was adequate for opening to normal traffic and for
light traffic the road can be open within 24 hours. Tests were also conducted by
placing 150 mm thick PCCBP on compacted Kalahari sand using single size 50 mm
round river pebbles grouted with a similar 1:1 cement : sand and observed that the test
pavement served well even after 4 years compared to conventional concrete pavement
which deteriorates after 2 years of service. Further field trial with 50 mm thick
PCCBP with a similar mix was found that it performed well, and hence suggested that
50 mm thick PCCBP could be used for lightly traffic access roads. The economic
evaluation showed that PCCBP is highly competitive with flexible pavement and
more economical than block pavement. Design guide and catalogue for low volume
streets based on type of street, traffic loading, material considerations, environment,
etc. was also proposed.
TH-1037_07610405
9
Visser (1999) evaluated the performance of PCCBP under ultra heavy traffic
condition up to 100 tonnes axle loads, by constructing test sections with Reddy mix
concrete of compressive strength of 49 MPa (28th
day). The test sections were
subjected to traffic by trucks and reach stackers. Structural responses of different
layers of test panels were monitored using multi depth deflectometers (MDD). It was
concluded that although 100 mm thick PCCBP layer can be structurally adequate for
ultra heavy loading condition, 150 mm layer would be preferred. The PCCBP blocks
were left unaffected when tested using turning wheel of reachstacker and point loads
of stacked containers, thereby showing the three dimensional interlocking behavior.
Laser level survey showed limited permanent deformations (~ 3 – 6 mm) for PCCBP
with stronger underlying layers of mine sand and 53 mm crushed stone suggesting
that PCCBP can be an option even for ultra heavy traffic.
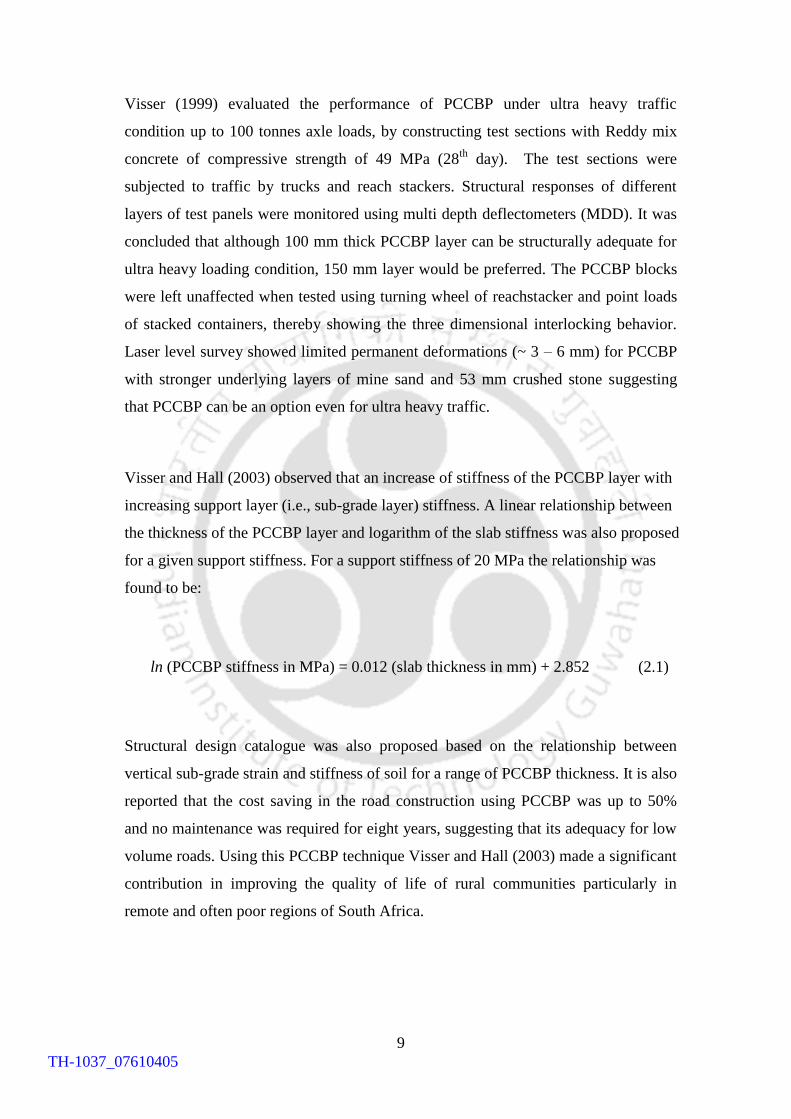
Visser and Hall (2003) observed that an increase of stiffness of the PCCBP layer with
increasing support layer (i.e., sub-grade layer) stiffness. A linear relationship between
the thickness of the PCCBP layer and logarithm of the slab stiffness was also proposed
for a given support stiffness. For a support stiffness of 20 MPa the relationship was
found to be:
ln (PCCBP stiffness in MPa) = 0.012 (slab thickness in mm) + 2.852 (2.1)
Structural design catalogue was also proposed based on the relationship between
vertical sub-grade strain and stiffness of soil for a range of PCCBP thickness. It is also
reported that the cost saving in the road construction using PCCBP was up to 50%
and no maintenance was required for eight years, suggesting that its adequacy for low
volume roads. Using this PCCBP technique Visser and Hall (2003) made a significant
contribution in improving the quality of life of rural communities particularly in
remote and often poor regions of South Africa.
TH-1037_07610405
10
2.3.2 Review of previous work carried out in India
In India, the first attempt on the study of PCCBP was made by Ryntathiang (2005) by
investigating its structural performance in the laboratory. Ryntathiang (2005) adopted
grouting technique for casting 75 mm thick PCCBP and premix technique for casting
100 mm thick PCCBP. It was observed that sufficient compressive strength for
resisting the damaging action of low volume traffic could be obtained after seven days
of casting, using a mix of 1:1.5 cement:sand (by volume). The mix made up of
premixed cement, sand and coarse aggregates was found to have higher seven days
compressive cube strength than grouting cement sand mortar into the voids of coarse
aggregates. Core sample from the test pavements showed that premixed concrete had
less voids than the grouted concrete blocks. It was also observed that PCCBP of
thickness 100 mm had better interlocked faces than the 75 mm blocks. Accelerated
test on blocks have shown rutting as low as 3 mm after 11,000 repetitions of standard
80 kN for 75 mm thick blocks. The moduli for 75 mm and 100 mm PCCBP layer
were obtained as 2995 MPa and 2542 MPa respectively. Economic evaluation of
PCCBP vis-à-vis conventional flexible and pre-cast concrete block pavement shows
that conventional flexible pavement is 1.22 times the cost of pre-cast concrete block
pavement and 1.62 times PCCBP.
Sahoo et. al., (2006) constructed 250 meter long PCCBP pavement over 150 mm
compacted thickness of moorum sub-base to test its feasibility on field for low
volume roads. The premixed cement concrete mix used for filling the pockets of
plastic cell was mixed in the proportion 1:1.5:3 (cement: fine aggregate: coarse
aggregate) by volume. The result obtained from the investigation showed that the
elastic modulus of cell filled concrete layer were in the range 2486 to 6850 MPa and
that of foundation layer (sub-base and sub-grade) were in the range 123 to 161 MPa
which are sufficiently high for low volume roads.
Roy et. al., (2009) constructed four test sections each of size 2.5 m x 2.5 m to study
the behavior of roller compacted cell filled concrete pavement over moorum and
laterite boulders as sub-base layers. The different test sections consisted of 1) 100 mm
TH-1037_07610405
11
thick PCCBP layer filled with roller compacted concrete laid over 150 mm thick
moorum sub-base, 2) 100 mm thick PCCBP layer filled with roller compacted
concrete laid over 150 mm thick laterite boulder sub-base, 3) 150 mm thick PCCBP
layer filled with 110 mm thick soil-cement and 40 mm thick with cement concrete
laid over 100 mm thick moorum sub-base, 4) 150 mm thick PCCBP layer filled with
110 mm thick sand-cement and 40 mm thick with cement concrete laid over 100 mm
thick moorum sub-base. The layer moduli of cell pavement were found to be
sufficiently high (~1215-4969 MPa), suggesting that soil-cement and sand-cement
with a topping of thin roller compacted concrete can serve as strong pavement.
Roy et al., (2010) investigated the structural performance of PCCBP placed over 1)
soil-cement, and 2) sand-cement laid over a) moorum and b) soil-cement; using thin
recycled plastic as cell walls and roller compacted concrete. It was found that moduli
values of the surface layer was in the range ~ 1524 – 6014 MPa, the highest being
associated with 100 mm thick PCCBP over 100 mm thick soil cement (10% cement
by weight of dry soil) base course. The pavements were tested on simulated village
traffic (~1500 passes of loaded truck equivalent to 3 years of village traffic) and found
that no distress signs and negligible rutting (~1.91 mm), suggesting that such
construction could be a cost effective proposition for locations with scarcity of
aggregates. Based on the long term performance considering FWD test results and
live traffic condition, of the field tests (100 mm thick cell filled pavement laid over
100 mm compacted moorum) for five years under heavy rainfall condition, it was
found that the PCCBP showed excellent performance.
To economize the cost of construction Shivaprakash (2011) adopted a dual-layer
concreting method by placing a lower strength (concrete compressive strength = 10
MPa) below a higher strength concrete (concrete compressive strength = 30 MPa) into
the same PCCBP cell of 100 mm thickness; for a pilot project of a village road of
length = 40 km.
TH-1037_07610405
12
2.4 PCCBP as Overlay Construction
Plessis and Visser (2001) investigated the behavior of PCCBP overlay placed on the
deteriorated Portland cement concrete container terminal pavement. An experimental
section of 500 m2 at City Deep container terminal consisting of 300 mm thick
concrete pavement (heavy duty pavement) was selected for overlaying with PCCBP
of thicknesses 150 mm and 200 mm. The selected section had been in service for
about 20 years and shows severe cracking. It was observed that both the thicknesses
showed significant reduction in deflection and strain (with 200 mm thick showing
lower values of deflection and stain) as compared to the section without overlay under
similar load condition. The author concluded that the hypothesis that cell filled
concrete overlay leads to improve behavior of the pavement is accepted. A significant
improvement of the overlaid pavements life to 38 and 158 million reach stacker
repetitions were observed in the 150 mm and 200 mm overlay section respectively.
2.5 Stone dust as replacement of sand in concrete
In order to optimize cost of construction and to solve the scarcity of river sand in the
remote villages, an effort has been made to replace river sand with waste stone dust in
concrete production. Different researchers (Sahu et. al., (2003), river sand with stone
dust; Reddy and Reddy (2007), river sand with rock flour; Safiuddin et. al., (2007),
natural sand with quarry waste fines etc.) reported possibilities of replacement of sand
in concrete. A review of previous works on the replacement of sand in concrete and
its effect of fresh and harden properties of concrete is presented in this section.
Sahu et. al., (2003) carried out suitability of partial and fully replacement of natural
sand in concrete with crusher stone dust. Based on two types of fine aggregates i.e.,
20% and 40% replacement of river sand with stone dust, it was observed that there is
a significant increase in compressive strength, modulus of rupture and split tensile
strength. However, it was reported that addition of stone dust decreased the
workability of concrete mix significantly.
Reddy and Reddy (2007) carried out laboratory investigations on rock flour as
replacement of sand and ceramic scrap as replacement of coarse aggregates in
TH-1037_07610405
13
concrete. It was observed that rock flour can be effectively used as full replacement of
river sand in concrete resulting in increase of compressive strength, split tensile
strength and modulus of rupture.
Safiuddin et. al., (2007) tested fresh and harden state of concrete by 20% replacement
of natural river sand with quarry waste fine aggregates. The test result showed that
quarry waste fine aggregates enhanced the slump and slump flow of the concrete. The
use of quarry waste fine aggregates marginally improved the dynamic modulus of
elasticity of concrete due to reduced difference between moduli of aggregates and
hydrated cement paste. However, a decrease in the compressive strength of concrete
by 7% to 9% was observed.
Ilangovana et. al., (2008) conducted test on concrete cubes for full replacement of
natural sand with quarry rock dust in concrete. Durability study was carried out to
investigate the drying and shrinkage studies, deterioration, and water absorption for
both conventional concrete and quarry rock dust concrete as per codal provisions. It
was observed that physical and chemical properties of quarry rock dust satisfies code
provisions of fine aggregates and gives equal or better (an increase of 10 to 15
percent) compressive and flexural strength of concrete. The overall workability and
permeability value of quarry rock dust concrete was found to be less compared to
conventional concrete.
Manasseh, J., (2010) carried out laboratory test on fresh and harden concrete to
replace river sand with crushed granite fines (CGF) for use in concrete pavement. The
compressive and tensile strength values of 40.70 N/mm2 and 2.30 N/ mm
2
respectively were obtained, with the partial replacement of river sand with 20% CGF,
as against values of 35.00 N/mm2 and 1.75 N/ mm
2, obtained using river sand as fine
aggregates in concrete production.
TH-1037_07610405
14
2.6 Distresses in PCCBP
To obtain a composite indicator of pavement deterioration caused by loading,
construction shortcomings, environmental causes, etc., Pavement Condition Index
(PCI) methodology is generally adopted (e.g., ASTM, 2009, 2010, Hein and Burak,
2007, 2009, ICPI, 2007). ASTM (2009) defines PCI as a numerical rating that ranges
from 0 – 100 with 0 being the worst possible condition and 100 being the best
possible condition of pavement. Based on the specific distress types, in the past,
several pavement management tools were developed by Shackel (1998), Geller
(1996), Rada (1993), Netherlands (1993) etc., however the PCI assessment for asphalt
(flexible) and concrete pavement evaluation published by US Army Construction
Engineering Research Laboratory in the 1970s for US Air Force (Shahin, 1994)
became one of the most popular and widely used guidelines. These procedures were
adopted by American Public Works Association, Federal Aviation Administration,
and with modification for collecting data by ASTM (2009).
The pavement condition evaluation guidelines for flexible and rigid pavements
proposed by US Army Corps of Engineers (MicroPaver distress guide) were adapted
by Interlocking Concrete Institute (ICPI, 2007, Hein and Burak, 2009) for
interlocking concrete pavements. The guidelines include 1) preparation of detailed
survey for types of distresses with photographs, 2) determination of the influence of
each of the distresses on the pavement performance through consultation with
industry and design engineers, 3) computation of „deduct‟ values based on influence
functions for each distress type and severity, and 4) calculation of overall pavement
condition index (PCI) by summing all the „deduct‟ values. Shackel (1998) developed
pavement management system for interlocking concrete block pavement in Australia
by considering five primary distress types: rutting, horizontal creep, spalling,
cracking and slippage and suggested that other distress like joint width, staining etc
may insufficiently affect the performance of the pavement. In the Australian
methodology, the individual distresses are categorized and quantified, multiplied by
their individual weight and extent and then summed to determine an overall „deduct
value‟. This deduct value is then subtracted from 100 to determined the overall PCI.
ICPI (2000) adapted a distress measuring system proposed by Stephanos and Rada
(1992), and identified several interlocking concrete block pavement distresses such as
TH-1037_07610405
15
1) loss of sand in joints, 2) inconsistent joint widths, 3) corner or edge Spalling, 4)
cracked blocks, 5) joint seal damage, 6) disintegration, 7) depression, 8) settlement or
faulting. Each distress is identified by type with severity rating ranging from low to
high. ICPI (2000) further adapted the work done by Stephanos to develop an overall
pavement condition index for interlocking concrete pavements. For each distress,
deduct values were assigned to three levels of severities based on the type of distress
and its expected impact on the overall pavement condition. The density level of
distress was based rather five levels of distress density viz., 1) few – up to 5 % of the
surface, 2) intermittent – up to 15 % of the surface, 3) frequent – up to 35 % of the
surface, 4) extensive - up to 65 % of the surface, and 5) throughout – 100 % of the
surface. Higher values of the deduct value will have greater impact of that the
particular distress, severity and extent on the overall condition of the pavement.
Further advancement was made by Hein and Burak (2007, 2009) and ICPI (2007) in
developing a pavement distress guide for interlocking concrete pavement based on
exhaustive literature review, consultation with industry experts, and analysis of
several pavements sites throughout North America, by classifying eleven types of
distresses, its extent and severity level were identified viz., 1) damaged pavers, 2)
depressions, 3) edge restraint, 4) excessive joint width, 4) faulting, 5) heave, 6)
horizontal creep, 7) joint sand loss, 5) missing pavers, 6) patching, and 7) rutting.
Surface polishing and permanent deformation up to 100 mm (resulting from poorly
compacted underlying soil) was reported for a PCCBP thickness of 150 mm (75,000
laden trucks passes) by Visser (1994). After 15 months of trafficking by ultra heavy
wheel loads (~ 100 tonnes axle loads), 150 mm thick PCCBP showed no deterioration
except for initial slight spalling (Visser, 1999). The weakest section of the test section
having mine sand as the underlying material showed 13 mm permanent deformation,
without significant visual changes observed later on. Based on visual distress
inspections on PCCBP by Vissar and Hall (1999) some evidences of edge spalling
were found, although that none of the cells had cracked through blocks. In some
locations where thin leveling layer was placed on top of the already placed concrete
layer, scaling of concrete surface was observed. The roughness of the pavement
surface was reported to perfectly adequate for low volume roads. In some portion of
the road section disintegration of block was observed which was due to the improper
penetration of the concrete grouting. Visible cracks on the block edges with minor
TH-1037_07610405
16
spalling were also reported on 150 mm thick PCCBP overlay over deteriorated
(severe block cracking and crocodile cracking were present) concrete pavement of
300 mm thickness, when subjected to ultra heavy wheel loads in container ports
(Plessis and Visser, 2001). For simulated village traffic (1500 passes of loaded truck
equivalent to 3 years of village traffic) on 100 mm thick PCCBP over underlying soil-
cement, moorum, sand-cement bases it was found that no observable distresses were
observed by Roy et al., 2010. On the other hand, edge cracking along cell wall
locations was seen on 100 mm thick PCCBP over 100 mm thick compacted moorum
after four years of service traffic with 4/5 loaded trucks per day. Appearance of
surface cracks was observed within few days of road opening of a main village road
using dual concrete layer (mentioned previously) 100 mm thick PCCBP by
Shivaprakash (2011), indicating the vertical yielding of pavement due to heavy loaded
truck traffic. However, to the best of author‟s knowledge, no systematic study and
hence standard guidelines for evaluation of distresses on PCCBP have been reported
in the literature.
2.7 Summary of literature review
An assessment of the reviewed literature indicates that limited researches on PCCBP,
use of stone dust as replacement of sand in concrete and distress studies on PCCBP
have been conducted. The popularity of PCCBP is confined mainly to South Africa and
no investigators throughout the world have used this technology except few attempts
carried out in India to gain further understanding. The summary of the previous
investigations related to present work are summarized below:
1. PCCBP is suited for low volume roads.
2. The life cycle cost of PCCBP is comparatively lesser than conventional flexible
and rigid pavement constructions.
3. Interlocking between concrete blocks results in good load spreading capacity of
the pavement.
4. Concrete compressive strength of 15 MPa was adequate for opening to normal
traffic and for light traffic the road can be open within 24 hours.
TH-1037_07610405
17
5. Very limited information is available on the variation of elastic modulus of the
blocks with block thickness.
6. Limited tests suggest that PCCBP can be used as overlays over concrete
pavements.
7. Replacement of natural sand with waste stone dust in concrete showed mixed
compressive strength results i.e., it may or may not increase as compared to that
of normal concrete with natural sand only.
8. No standards have been developed as yet for evaluation of pavement condition
index for different types of distresses that PCCBP may have.
TH-1037_07610405
18
CHAPTER 3
Structural Behaviour of PCCBP
3.1 Introduction
In this chapter, a systematic experimental study of the structural performance of
PCCBP for various cell thicknesses subjected to live traffic conditions is presented.
Five test sections of different thicknesses viz., 50 mm, 80 mm, 100 mm, 120 mm and
150 mm, of PCCBP over 100 mm thick water bound macadam (WBM) sub-base layer
has been constructed at the approach road towards Indian Institute of Technology
Guwahati, India (IIT Guwahati) from National Highway 31 (NH31). Further, to
explore the feasibility of using PCCBP as overlay layer for strengthening old
bituminous surfaced rural roads, 50 mm thick PCCBP overlay section has also been
constructed adjacent to the PCCBP test section. For optimizing the cost of pavement
construction, an attempt is made to use waste stone dust (byproduct of aggregates
crushing) in place of the traditional river sand. It may be noted that with increasing
infrastructure development in road projects, housing sector and other major concrete
structures etc. demand for crushed stone aggregates (~approximately 20% of crushed
stone goes as waste stone dust) has increased resulting in more waste stone dust
(Tripathy and Barasi, 2006). The use of waste stone dust in the construction of rural
roads is also expected to solve the scarcity of river sand in remote rural areas, and
help in cost cutting where the cost of transporting sand is relatively expensive. To
evaluate the structural performance of PCCBP, elastic layer moduli of different layers
of the test pavement have been calculated using a linear elastic layer theory based
moduli backcalculation computer code BACKGA (Reddy et al., 2002) from the
surface deflection data obtained through Falling Weight Deflectometer (FWD).
Variation of layer moduli are also presented for varying traffic passes. To validate the
results obtained through BACKGA, finite element analysis have been carried out
using ABAQUS (2009). A comparison between the deflection profiles obtained
TH-1037_07610405
19
through Falling Weight Deflectometer (i.e. experimental) and FE modeling using
ABAQUS was also carried out using another elastic layer based software
KENLAYER (Huang, 2010) using the layer moduli obtained through BACKGA as
inputs.
3.2 Materials used for the construction of PCCBP
3.2.1 Low Density Polyethylene (LDPE) Plastic Cell
The plastic cell formwork used in the present study is made of Low Density
Polyethylene (LDPE) sheet of thickness 0.49 mm. Flexible translucent water delivery
LDPE pipe having diameter of ~101.6 mm (Figure 3.1a) which is available in the
local market of Guwahati, Assam, India was used for preparation of cell formwork.
The pipes were cut into required strips (50 mm, 80 mm, 100 mm, 120 mm and 150
mm) and heat bonded using paddle sealing machine (Figure 3.1b) which on stretching
forms diamond shaped pockets of size 150 mm x 150 mm (Figure 3.1c).
3.2.2 Cement
Fly ash based portland pozzolana cement (PPC) conforming to IS 1489 (1991), was
used for casting concrete blocks. The cement (TOPCEM cement) for the whole work
was procured in a single consignment and stored properly. The standard consistency
and specific gravity of the PPC cement was found to be 31% and 3.15. The initial and
the final setting time were found out to be 102 and 372 minutes respectively.
3.2.3 Stone dust
Stone dust (Figure 3.2) collected from a stone crusher factory located nearby IIT
Guwahati, Assam, India was used as fine aggregates for casting concrete blocks. The
particle size distribution of stone dust obtained from the sieve analysis is shown in
Table 3.1, and it is found to be closely conforming to Zone II of IS 383 (1970). Water
absorption and specific gravity of the stone dust as per IS 2386 (1963a) was obtained
to be 0.73% and 2.63 respectively. Fineness modulus of the stone dust was found to
be 2.3 which lie within the specified limit of 3.37-2.10 for Zone II of IS 383 (1970).
TH-1037_07610405
20
3.2.4 Coarse Aggregate
The crusher run coarse aggregates were obtained from the same stone crusher factory
from where the stone dust was collected. These coarse aggregates were crushed from
hilly stone boulders brought from Dewdwar quarry, Baicharali, Guwahati, Assam,
India. The physical properties of the coarse aggregates for concrete as per IS 2386
(1963a, 1963b) were given in Table 3.2. Single size stone aggregates of 22.4 mm (i.e.
passing 26.5 mm sieve and retained on 13.2 mm sieve) as per specification of
MORTH (2001) were selected for casting the concrete in the study.
3.2.5 Soil
The soil used for backfilling the sub-grade for the test pavement was brought in from
a nearby hill slope excavation. The grain size distribution of sub-grade soil as per IS
2720 (1985a) is given in Table 3.3. The specific gravity was obtained as per IS 2720
(1980) and found to be ~2.63. From Table 3.3 it can be seen that percentage of fine
fraction passing 75 micron sieve is ~41%, and the soil can be classified as coarse
grain soil as per ASTM 2487 (2006). The liquid limit was found to be 35% with no
significant plastic limit (IS 2720, 1985b). The laboratory soaked and un-soaked
California Bearing Ratio (CBR) values of the soil used for backfilled were found out
to be 5% and 7% respectively (IS 2720, 1987).
3.3. Laboratory investigations
Laboratory investigations were carried out to determine an appropriate construction
technique which would be labour intensive, cost effective and appropriate for
execution by semi-skill villagers so as to generate employment for the economically
challenged rural inhabitants. Two different types (Figure 3.3) of construction
techniques were tested (Visser, 1994):
1. Premix technique: It is a type of construction where the plastic cell formwork
are spread and tensioned over a prepared foundation layer and the concrete is
placed into the cells and compacted (Ryntathiang et. al., 2005; Pandey, 2006;
Roy et. al., 2009,2010 and Shivaprakash, 2011).
TH-1037_07610405
21
2. Grouting technique: Here, plastic cell formworks are spread and tensioned
over the foundation layer as done in the previous case and cells are filled with
coarse aggregates and mortar (slurry) is vibrated into the voids between coarse
aggregates (e.g., using a plate vibrator) (Visser, 1994, 1999; Visser and Hall
1999, 2003).
In order to check the suitability of the above mentioned techniques, laboratory
concrete cube (150 mm x 150 mm x 150 mm) compressive strength tests for both
premix and grouting techniques were carried out using nominal single size 22.4 mm
coarse aggregates (for better grouting of mortar into voids between aggregates) and
different cement:stone dust (c:sd) mix proportions viz., 1:1.0, 1:1.25, 1:1.5, 1:1.75 and
1:2.0. For the initial study on grouting technique coarse aggregates were first filled
into the cube mould, then cement mortar with three different water cement ratios
(w/c) of 0.4, 0.5, and 0.6 were placed and vibrated into the voids between coarse
aggregates using table vibrator. It has been observed that for the grouting technique,
mortar with w/c ratio = 0.4 was too dry to grout into the voids in between the coarse
aggregates whilst a w/c ratio of 0.6 produced a high workability. An intermediate w/c
ratio of 0.5 exhibited moderate workability resulting in better compaction of the
concrete. To check the feasibility of grouting technique in the field, a small trial test
pit of size 2 m x 2 m was prepared and plastic cells of each pocket size 150 mm x 150
mm x 120 mm was laid and stretched on a prepared 100 mm thick WBM sub-base
course. Crushed nominal single size stone aggregates 22.4 mm were filled into the
pockets of plastic cells and mortar having c:sd ratio = 1:1.25 was vibrated using a
plate vibrator into the voids between the coarse aggregates. It has been seen that core
samples (Figure 3.4) taken out after curing the concrete for 7 days showed incomplete
penetration of mortar for ~30% of thickness. Although it might have been possible to
get better compaction using needle vibrator, it is expected that its implementation in
the field with large number of plastic cells may be prohibitive. Visser, 1994, 1999;
Visser and Hall 1999, 2003 reported grouting technique using cement sand slurry (and
hence „very high‟ slump), however it is important to note that increasing water/cement
ratio will lead to reduction in the compressive strength as well as segregation of
concrete. Thus for the present field study, premix technique has been adopted with a
moderate w/c ratio of 0.50. The variation of 7 days average cube compressive strength as
per IS 516 (1959) of premix concrete (three samples were considered for each c:sd
TH-1037_07610405

22
ratio) with c:sd ratios is presented in Figure 3.5. From Figure 3.5, it can be seen that
c:sd ratio = 1:1.25 gives the highest compressive strength (~ 18 MPa). As this 7-days
cube strength is more than 15 MPa which is required for opening to the heavy traffic
(Visser and Hall, 1999), c/sd ratio of 1:1.25 is adopted for casting PCCBP in the field.
3.4 Structural evaluation of PCCBP test sections
3.4.1 Test section
A full scale field study on the structural assessment of different thicknesses of PCCBP
(50 mm, 80 mm, 100 mm, 120 mm and 150 mm) over 100 mm WBM sub-base course
was carried out at IIT Guwahati main approach road from the National Highway,
NH31. A section of the existing bituminous pavement, measuring 15 m in length and
7 m in width was selected for construction of five different thicknesses of PCCBP test
sections. A schematic plan and sectional view of the test sections is shown in Figure
3.6. Based on the preliminary survey it has been observed that the traffic passing on
the selected road stretch consists mainly of heavy trucks carrying construction
materials, dumpers, buses and light moving vehicles like cars etc. The road can be
considered as a low volume road as the average daily traffic was estimated to be about
250-300 vehicles/day.
3.4.2 Excavation of the existing pavement
Taking due care the problems of rain during construction work and the effect of the
rain water on the strength of the sub-grade layer, the excavation of the existing
bituminous pavement for the construction of PCCBP test section was done during
October 2009 using an earth excavator. The upper layers of the existing pavement
were removed and a trench measuring 15 m in length and 7 m in width and
approximately 450 mm depth was excavated (Figure 3.7) till sub-grade soil layer.
After excavation the loose materials were properly removed and the natural soil was
properly leveled. It was observed that the existing pavement consists of 20 mm
premix carpet, 75 mm thick bituminous macadam over 350 mm thick sub-base course
(200 mm thick WBM course and 150 mm granular sub-base). The dry density and
field moisture content of the sub-grade soil in place by core cutter method as per IS
TH-1037_07610405
23
2720 (1975) was found to be 1730 kg/m3 and 13.80% respectively. The laboratory
soaked CBR value obtained for the sub-grade soil collected from the excavated site
was found to be 6% (IS 2720, 1987).
3.4.3 Preparation of the sub-grade soil
The trench was backfilled with selected soil collected from nearby hill slope whose
properties are given in Section 3.2.5. Laboratory compaction test was conducted to
determine optimum moisture content (OMC) and maximum dry density (MDD) of the
soil as per IS-2720, 1987). Compaction was done at the optimum moisture content
(~12%) using a 100 KN three wheeled roller in three layers of 100 mm each,
maintaining cross and longitudinal slopes. After compaction the surface was leveled
manually to bring the surface to the required profile for each thickness (Figure 3.6).
The field density and the moisture content of the compacted sub-grade soil was
determined by core cutter method (IS 2720, 1975) and were found to be 1880 Kg/m3
and ~12 % respectively. The percentage field compaction was found to be ~98% of
the standard laboratory compaction value.
3.4.4 Water Bound Macadam (WBM) Course
In the present study 100 mm thick WBM sub-base course was provided above the
prepared sub-grade soil layer. Crushed stone aggregates and screenings conforming to
Grading 1 and Grading A respectively as prescribed by MORTH (2001) were used for
WBM course. The particle size distribution and properties of water bound macadam
sub-base course are given in Table 3.4. The materials were manually placed and
spread uniformly over the prepared sub-grade soil. Laying and compaction (Figures
3.8a and 3.8b) was done as per MORTH (2001). Rolling with copiously sprinkling of
water and sweeping with brooms for WBM was continued until the slurry that is
formed will, after filling the voids between aggregates form a wave ahead of the
moving roller indicating that the voids are fully filled and the layer is properly
compacted (CPWD, 1996).
TH-1037_07610405
24
3.4.5 Laying and concreting of the plastic cells
3.4.5.1 PCCBP – new construction
After preparation of the WBM course, plastic cell formwork 5.5 m x 2.7 m for each
test sections were laid, maintaining the cross fall (~ 2.5%) and longitudinal (~ 0.05%)
slopes such that the new and the old pavement surfaces are in the same level. A gap of
750 mm on the edges and 300 mm (to provide space for tensioning plastic cells)
between adjacent sections of PCCBP (Figure 3.9 and 3.10a) were left. A reusable
wooden frame (Figure 3.10a) with hook arrangements was used for tensioning the
plastic cell formwork. It also acts as side restrain for casting concrete. This wooden
frame was to be removed after casting one section and for reusing it for another
section (Figure 3.10b). The plastic cell formwork, after tensioning forms diamond
shaped (150 mm X 150 mm) pocket size (Figure 3.10a).
From the laboratory test results, premix concrete with cement:stone dust:coarse
aggregates ratio of ~1:1.25:2.0 by volume having 28-days cube compressive strength
of ~32 MPa was selected for casting PCCBP. Mixing of the concrete was done by a
diesel operated mixer machine and amount of water was maintained at w/c ratio = 0.5.
The test section was constructed sequentially from the higher thickness (150 mm) and
proceeded towards the lower thickness giving a gap of 300 mm in between two
adjacent sections as shown in Figure 3.9. After casting the next section, the previous
gap was filled with concrete and leveled. The remaining gaps between the edges of
the road were also filled with concrete and level. Compaction was done using a plate
vibrator and a locally fabricated wooden beam straight edge rammer. The finished
surface was leveled properly; care was taken to make the new construction (test
section) in the level with the existing bituminous pavement.
3.4.5.2 PCCBP - overlay construction
PCCBP overlay test section measuring 2.7 m in length was also constructed leaving a
gap of 350 mm from the 50 mm thick PCCBP test section. It may be mentioned that
the bituminous road section on which the overlay is to be laid was left while the road
stretch was resurfaced by other agency 3 (three) months ahead of construction of the
new PCCBP test pavement (Figure 3.11). The material specifications adopted for the
bituminous overlay construction is given in Table 3.5.
TH-1037_07610405
25
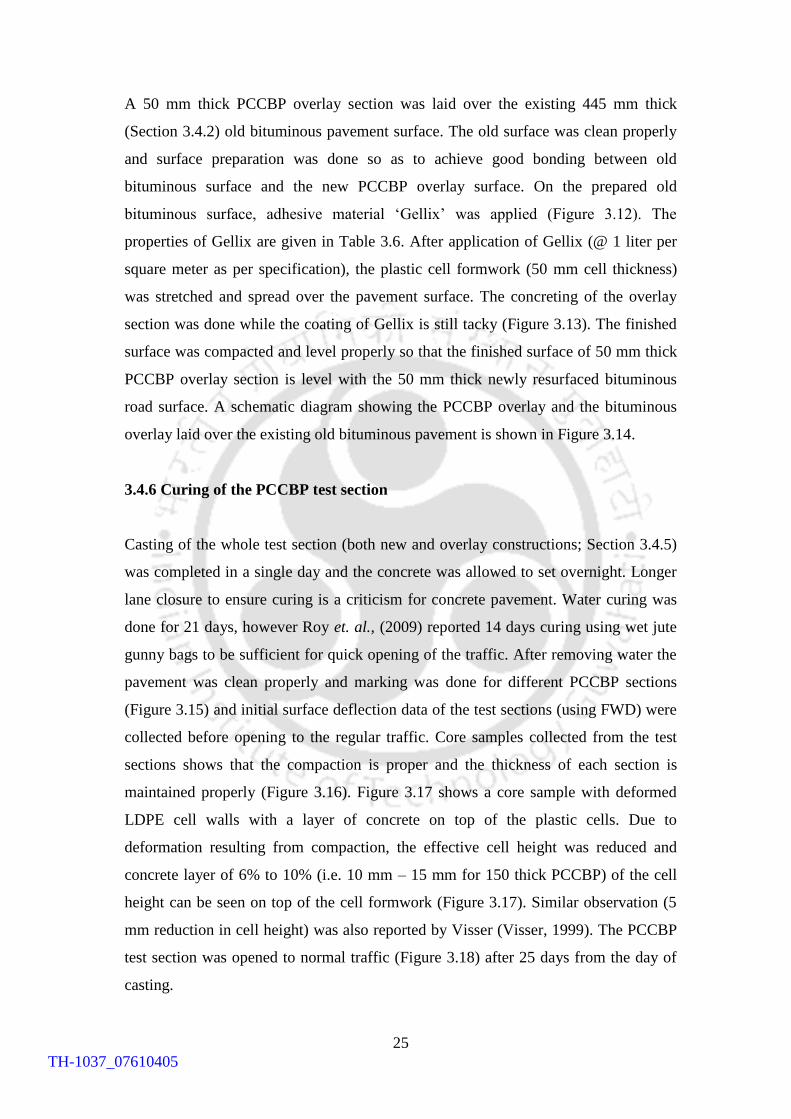
A 50 mm thick PCCBP overlay section was laid over the existing 445 mm thick
(Section 3.4.2) old bituminous pavement surface. The old surface was clean properly
and surface preparation was done so as to achieve good bonding between old
bituminous surface and the new PCCBP overlay surface. On the prepared old
bituminous surface, adhesive material „Gellix‟ was applied (Figure 3.12). The
properties of Gellix are given in Table 3.6. After application of Gellix (@ 1 liter per
square meter as per specification), the plastic cell formwork (50 mm cell thickness)
was stretched and spread over the pavement surface. The concreting of the overlay
section was done while the coating of Gellix is still tacky (Figure 3.13). The finished
surface was compacted and level properly so that the finished surface of 50 mm thick
PCCBP overlay section is level with the 50 mm thick newly resurfaced bituminous
road surface. A schematic diagram showing the PCCBP overlay and the bituminous
overlay laid over the existing old bituminous pavement is shown in Figure 3.14.
3.4.6 Curing of the PCCBP test section
Casting of the whole test section (both new and overlay constructions; Section 3.4.5)
was completed in a single day and the concrete was allowed to set overnight. Longer
lane closure to ensure curing is a criticism for concrete pavement. Water curing was
done for 21 days, however Roy et. al., (2009) reported 14 days curing using wet jute
gunny bags to be sufficient for quick opening of the traffic. After removing water the
pavement was clean properly and marking was done for different PCCBP sections
(Figure 3.15) and initial surface deflection data of the test sections (using FWD) were
collected before opening to the regular traffic. Core samples collected from the test
sections shows that the compaction is proper and the thickness of each section is
maintained properly (Figure 3.16). Figure 3.17 shows a core sample with deformed
LDPE cell walls with a layer of concrete on top of the plastic cells. Due to
deformation resulting from compaction, the effective cell height was reduced and
concrete layer of 6% to 10% (i.e. 10 mm – 15 mm for 150 thick PCCBP) of the cell
height can be seen on top of the cell formwork (Figure 3.17). Similar observation (5
mm reduction in cell height) was also reported by Visser (Visser, 1999). The PCCBP
test section was opened to normal traffic (Figure 3.18) after 25 days from the day of
casting.
TH-1037_07610405
26
Traffic survey
In order to evaluate the performance of the test sections with traffic passes, daily
traffic volume data was collected from the IIT Guwahati security check gate (all
vehicles passing the test pavement also passes the security check gate). Axle load
survey was carried out using a portable load pad (calibrated and checked in the
laboratory) which can measure up to a maximum of 10 tones wheel load (Figure
3.19). The wheel load recorded by the portable load pad was then double to evaluate
the axle load of the vehicles. Following the recommendation of IRC (2007) the axle
load survey for the present study was carried out considering only the motorized
commercial vehicle with gross laden weight of 3 tonnes and above (i.e. HCV and
MCV). The registration number, type of vehicles and goods carried by the vehicle
were also recorded during the axle load survey. The load pad was placed on hard
surface closed to the edge of the road with enough care being taken to ensure that the
level of two wheels on either side of the axle are kept at the same level for uniform
distribution of the load on both the wheels. The vehicles were stop at a suitable
distance before negotiating the load pad. Proper instructions were given to the driver
to ensure that the vehicles move slowly and the wheel is placed centrally over the load
pad. The stable reading (wheel load in Tonne) shown by the digital display unit of the
load pad was recorded. The universal „fourth power damage formula‟ (AASHTO,
1962) which relates axles repetitions, N1 (with W1 axle weight) and N2 (with W2 axle
weight) for the same extent of damage, is used to convert the number of repetitions of
vehicles of various axle loads into Equivalent Single Axle Load (ESAL) repetitions of
80 kN (Equation 3.1).
4
1 2
2 1
N W
N W (3.1)
From axle load survey, the axle load and the corresponding traffic volume was
obtained. An equivalent axle load factor called Vehicle Damage Factor (VDF) has
been calculated from the axle load distribution data, which when multiplied by the
monthly volume of commercial vehicle repetitions, would convert into monthly
ESAL repetitions. VDF is the weighted average of the damages caused by the
individual axle load group with respect to the corresponding volume of traffic of each
TH-1037_07610405
27
group and has been calculated using Equation 3.2 (using standard axle load of 8.16
tonnes as the basis for India).
4 4 4
31 21 2 3
1 2 3
...
/S S S
WW WV V V
W W WVDF Axle
V V V (3.2)
where, W1, W2, W3 . . . are the median values of the various axle load groups, V1, V2,
V3 are the respective traffic volumes, and Ws is standard axle load (Chakraborty and
Das, 2003). In the present study, VDF was calculated from the axle load survey data
for the commercial vehicles passing the test section and is found to be 2.51
(considering standard truck of two axle). The detail calculation of VDF is presented in
Appendix A.
Figure 3.20 presents variation of monthly ESAL repetitions on the test pavement for
data collected from 25th
December 2009 to 24th
November 2010 (i.e., ~ 11 months
period). The initial high ESAL values up to the month of April is attributable to
several earth filling and constructional activities in and around IIT Guwahati campus,
which get reduced during the rainy season i.e., May till July. Figure 3.21 shows the
cumulative ESAL with month for the data presented in Figure 3.20. It can be seen that
at the end of about 11 months (i.e. up to 24th
November 2010) the total ESAL
repetitions has reached 62,000 approximately. It may be mentioned that in Indian
rural roads, tractor-trailers ferrying farming products during harvesting periods, and
people and materials during local festivals / marriages constitute major commercial
traffic. Assessing in an accelerated manner, a traffic volume of 20 vehicles per day,
and rear axle load of a loaded tractor-trailer as ~ 60 kN (Roy et al., 2010), the yearly
average ESAL repetitions is about 2300. So, the cumulative ESAL repetitions of
62,000 are equivalent to ~ 25 years of service (accelerated performance) for a typical
rural road in India.
3.6 Structural evaluation of PCCBP test section
A custom fabricated Falling Weight Deflectometer (FWD), a non-destructive test
(NDT) equipment which simulates the short duration loading of the fast moving
wheel was used to record the surface deflection data of the test pavement (Figure
TH-1037_07610405
28
3.22). BACKGA (Reddy et. al., 2002), a Genetic Algorithm (GA) based back
calculation software was used to calculate the pavement layer elastic moduli from the
recorded surface deflection data.
3.6.1 Falling Weight Deflectometer (FWD)
FWD produces an impulse load by dropping a free fall mass over a loading plate with
spring system which transmits the load on to the pavement. The instantaneous surface
deflection of the pavement is measured at various radial distances from the center of
the load by using a number of geophones as shown schematically in Figure 3.22.
The FWD used in the present study is mounted on a trailer for better mobility. The
power supply for the equipment is through a DC generator mounted along with the
equipment. Provisions are also made for direct AC power supply so that the
equipment can also be operated electrically depending on the availability of power
supply on the site. The equipment consists of a loading platform with load plate (300
mm in diameter) for dropping load and a geophone beam with geophones to measure
the pavement surface deflection. The load platform along with the geophone beam
can be lowered and kept in contact with the pavement using two hydraulic cylinders.
Electro Permanent Magnet (EPM) operated with an input current of 0.6 Ampere and
maximum lifting capacity of 500 kg, is provided with the equipment for lifting and
dropping the falling mass. The height of fall can be adjusted and impulse load in the
range of 20 kN to 100 kN can be applied on the pavement. The load applied is
measured with a load cell provided under the load plate and the pavement surface
deflections are measured with the geophone. Analog Input Modules (AIM) was used
to acquire data from the load cell and geophones (NI, 2009). The AIM, data
acquisition and voltage output from geophones are controlled and accessed through
LabVIEW software (LabVIEW, 2009).
The load cell and geophone readings are calibrated and processed to determine the
magnitude of load in kilo-Newton and deflection in millimeter. The calibration data
along with the calibration factor for geophone is given in Appendix B. For
evaluation of PCCBP test section, the FWD was positioned in the interior of the
test pavement in such a way that the load plate along with geophone beam aligns
along the longitudinal direction of the road (Figure 3.23). Care was taken to ensure
that each geophone knobs touches the pavement surface properly. For each test
section the load was dropped 3-4 times and surface deflection data were collected
TH-1037_07610405
29
on either side of the load plate at radial distances of -500 mm, -300 mm, 0 (zero),
300 mm, 600 mm, 900 mm and 1200 mm. The surface deflections were then
normalized to a load of 40 kN (IRC, 2007) and average of three deflection readings
were taken for structural evaluation of the pavement.
3.6.2 Backcalculation of layer modulus using BACKGA
Backcalculation is an analytical procedure in which the surface deflection data
collected through FWD test are used to predict the elastic moduli of different layers of
pavement. The back calculation procedure involves theoretical calculations of the
deflections produced under a known applied load using an assumed set of layer
moduli. The theoretical deflections are then compared with those measured during the
field test. In case of differences between the theoretical and the measured deflection,
the assumed pavement layer moduli are adjusted and the process is repeated until the
differences between the theoretical and measured values fall within acceptable limits.
In this work, GA based BACKGA program developed by Reddy et. al., (2002) was
used for backcalculating the layer moduli of the PCCBP. In BACKGA a systematic
search of the solution space defined by the ranges of moduli selected by the user is
conducted. Detail explanation of the BACKGA technique is available in Reddy et al.,
(2002) and Rakesh et al., (2006). The objective function of the BACKGA was to
minimize the differences between the measured and the computed surface deflection
of the pavement. Layer thickness, surface deflection, locations at which the
deflections were measured, loading details and Poisson‟s ratios of the pavement were
used as main inputs to the BACKGA program. The various parameters input to
BACKGA followed those considered by Pandey and Reddy, (2005), Rakesh et. al.,
(2006), Sahoo et. al., (2006), Roy et. al., (2009, 2010), Ryntathiang et al., (2005),
Reddy et. al., (2000, 2002) viz., 1) Size of population = 60, 2) Number of generations
= 60, 3) Cross over probability = 0.74, and 4) Mutation probability = 0.10. An optimal
set of layer moduli is selected (defining upper and lower bounds) as input to the
program in such a way that the measured deflections match closely with those
computed from the selected layer moduli. In the present study the range of moduli and
the material properties considered for the BACKGA analysis are shown in Table 3.7.
The upper and lower limits of layer modulus are chosen based on heuristic approach
TH-1037_07610405
30
considering possible practical values. It has been observed by Reddy et al., (2002)
that slight variation in the values of Poisson‟s ratio (within a practical range) do not
significantly affect the critical stresses and strains, hence as a first approximation a
Poisson‟s ratio value of 0.35 (Sahoo et al., 2006 adopted 0.30 as Poisson‟s ratio) was
considered based on an average of the values of both concrete (~ 0.20) and LDPE (~
0.43). Sample input and output annotated files using BACKGA program are given as
Appendix C. For each set of layer moduli selected within the search space, surface
deflection at radial distances of 0, 300, 600, 900, 1200 mm (measured from the center
of the load plate) are computed using linear elastic layer theory. The computed
deflections are compared with the measured deflections and the fitness of the moduli
set under given range is evaluated (Rakesh et. al., 2006). The elastic layer moduli
computed through BACKGA program using the surface deflection data obtained by
FWD are used for structural evaluation of pavement. The validation of the layer
elastic modulus obtained through BACKGA program was done using two different
layer elastic analyses based computer program code KENLAYER (Huang, 2010) and
Finite Element (FE) analysis based ABAQUS software (ABAQUS, 2009) as
discussed in Sections 3.6.3 and 3.6.4.
3.6.3 Deflection computation using KENLAYER
The KENLAYER (Huang, 2010) is elastic multi layer system based software for
flexible pavement analysis with a circular loading area. It can be used to determine
surface deflections based on input parameters such as Young‟s modulus, Poisson‟s
ratio and layer thickness etc., assigned to different elastic layers. In the present study,
the layer modulus (presented later in Section 3.7) obtained through BACKGA using
pavement surface deflections (FWD) as input, was validated using KENLAYER by
comparing the KENLAYER surface deflections with that of experimental deflections
obtained through FWD. A detail discussion is given in Section 3.7. (Flow chart of
KENLAYER is presented in Appendix D)
3.6.4 Deflection computation using ABAQUS
Validations of the BACKGA results (layer moduli) have been performed using finite
element (FE) software ABAQUS (2009) (linear-elastic-static analyses). Figure 3.24
TH-1037_07610405
31
shows the schematic diagram of a typical PCCBP geometry adopted for the finite
element study. PCCBP model of plan size 2400 mm x 2400 mm has been chosen
such that the distance of the edge from the center of load is 1200 mm (Figure 3.24c).
Similar to the experimental construction, the inputs to ABAQUS (2009) are taken as
50 mm, 80 mm, 100 mm, 120 mm and 150 mm for PCCBP layer thickness with a
fixed sub-base (WBM) layer of 100 mm. However, the thickness of the sub-grade
layer has been taken as 5000 mm following the work of Huurman (1997) and is
considered to be sufficient for the analyses of interest. The layer moduli obtained
through BACKGA have been used as inputs of the FE analyses. The Poisson‟s ratios
considered for PCCBP, sub-base and sub-grade layers in the analysis are given in
Table 3.7. Due to symmetry of the PCCBP pavement with respect to the center of
loading plate, only one quarter domain has been modeled (Figure 3.24c). Roller
boundary conditions are applied on all the four sides allowing only vertical
displacements, and the bottom part is restrained. The load has been applied as
pressure of 0.565 N/mm2 on top of a steel loading plate (quarter plate is considered in
the present case) having radius 150 mm (Young‟s modulus = 2 x 10⁵ N/mm
2 and
Poisson‟s ratio = 0.3). The contact of the loading plate with the top of PCCBP has
been modelled as rigid body contact. Figure 3.25 shows a typical finite element mesh
using C3D8R (Eight nodded Continuum 3D solid elements with reduced integration,
ABAQUS, 2009). The typical model consists of 25,738 nodes and 22,805 elements.
Comparison of the FE surface deflection results with that of experimental values
(FWD) are discussed in the Section 3.7.
3.7 Results and discussions
3.7.1 Thickness effect of PCCBP test pavement
3.7.1.1 Surface deflections
A comparison of surface deflections of PCCBP (100 mm thickness) with those
obtained from the literature on similar studies viz., Roy et. al., (2009) and Ryntathiang
et. al., (2005) is presented in Figure 3.26. It can be seen that the present study showed
higher peak deflection as compared to that obtained by Roy et. al., (2009) and almost
agrees with Ryntathiang et. al., (2005). The lower value of deflection of Roy et. al.,
may have resulted from: 1) higher grade of concrete with compressive strength of
TH-1037_07610405
32
38.5 MPa (i.e. an increase of 18% from the present study) and 2) higher sub-grade
soaked CBR value (~ 8%) as against the lower soaked CBR value (~5%) of the sub-
grade used in the present work. In the case of Ryntathiang et al., (2005) while the
concrete used has lower compressive strength (~25 MPa), the testing was done in
laboratory using sand (conforming to Zone II of IS 383 (1970) and with a higher
soaked CBR of (~8%) in a brick wall confined pit of size 3 m x 2 m, which may have
resulted in higher deflection.
Figure 3.27 shows a plot of the surface deflection profiles for various PCCBP
thicknesses viz., 50 mm, 80 mm, 100 mm, 120 mm and 150 mm. It can be seen that
with increase in thickness of the PCCBP, there is decrease in overall deflection (i.e.
size of deflection bowl). The deflection bowl is seen to be significant up to an
approximate radial distance of twice the load plate diameter (~600 mm) from the
center of the load. The peak deflections are identified from Figure 3.27 and plotted in
Figure 3.28. It can be observed that the decrease in peak deflection with increasing
PCCBP thickness is nearly linear (R2 = 0.97), with 200% increase in thickness from
50 mm thick PCCBP, there is a decrease of ~48% (0.8481 mm for 50 mm thick
PCCBP) in deflection.
3.7.1.2 Layer elastic modulus
The variation of PCCBP layer elastic moduli with increase in their thickness is shown
in Figure 3.29. A nearly linear (R2 = 0.97), variation in elastic moduli has been
observed, with an increase of ~90% in elastic modulus from 1958 MPa (for 50 mm
PCCBP thickness) when the thickness is increased from 50 mm to 150 mm (i.e. 200%
increase in thickness). The present results agree with the laboratory observation made
by Visser (1994) where a linear (R2 = 0.987) increase of moduli (from 40 MPa to 100
MPa) for 200 % increase in thickness (from 50 mm to 150 mm) was reported.
However, the present observation is in contrast to the non-linear relationship (ln
(PCCBP layer modulus) = 0.012 x (PCCBP thickness in mm) + 2.852; for support
stiffness of 20 MPa) proposed by Visser (2003), where there is a „rapid‟ increase of
layer modulus with increasing thickness. However, the above relationship is linear if
we consider semi-log scale for the same. The variations in sub-base and sub-grade
elastic moduli with PCCBP thickness are shown in Figures 3.30 and 3.31
respectively. It can be seen that there is no significant variation of sub-base elastic
TH-1037_07610405
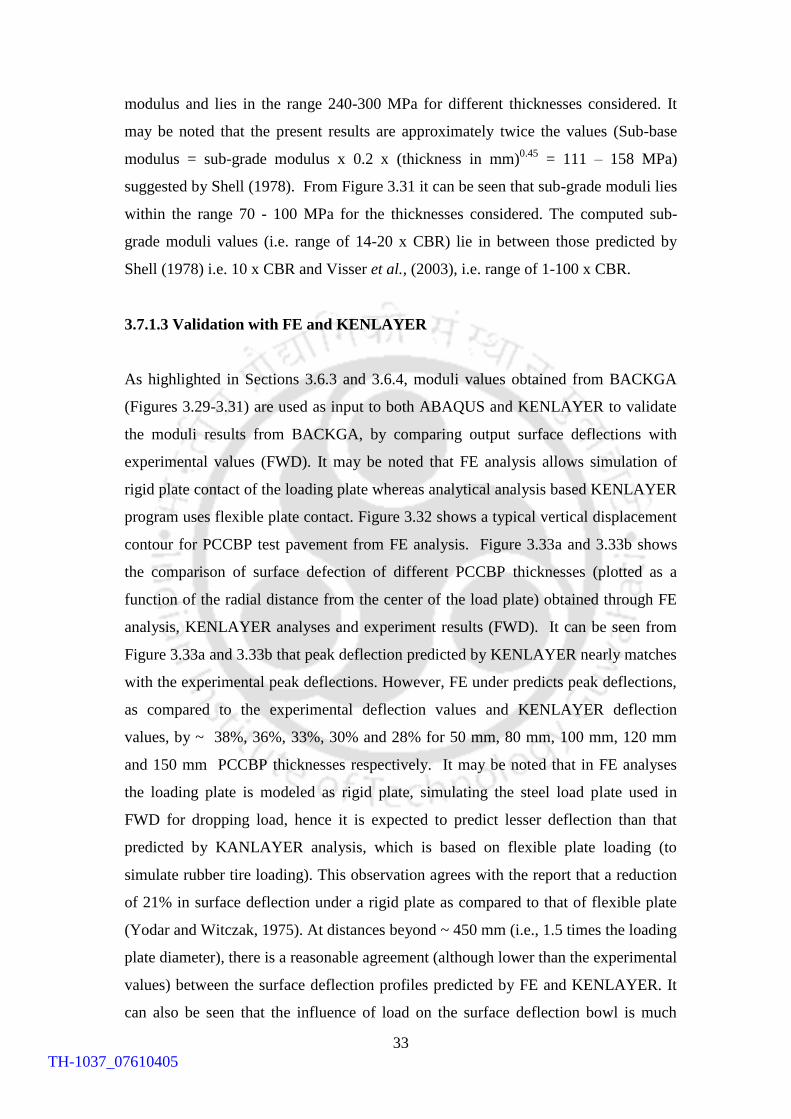
33
modulus and lies in the range 240-300 MPa for different thicknesses considered. It
may be noted that the present results are approximately twice the values (Sub-base
modulus = sub-grade modulus x 0.2 x (thickness in mm)0.45
= 111 – 158 MPa)
suggested by Shell (1978). From Figure 3.31 it can be seen that sub-grade moduli lies
within the range 70 - 100 MPa for the thicknesses considered. The computed sub-
grade moduli values (i.e. range of 14-20 x CBR) lie in between those predicted by
Shell (1978) i.e. 10 x CBR and Visser et al., (2003), i.e. range of 1-100 x CBR.
3.7.1.3 Validation with FE and KENLAYER
As highlighted in Sections 3.6.3 and 3.6.4, moduli values obtained from BACKGA
(Figures 3.29-3.31) are used as input to both ABAQUS and KENLAYER to validate
the moduli results from BACKGA, by comparing output surface deflections with
experimental values (FWD). It may be noted that FE analysis allows simulation of
rigid plate contact of the loading plate whereas analytical analysis based KENLAYER
program uses flexible plate contact. Figure 3.32 shows a typical vertical displacement
contour for PCCBP test pavement from FE analysis. Figure 3.33a and 3.33b shows
the comparison of surface defection of different PCCBP thicknesses (plotted as a
function of the radial distance from the center of the load plate) obtained through FE
analysis, KENLAYER analyses and experiment results (FWD). It can be seen from
Figure 3.33a and 3.33b that peak deflection predicted by KENLAYER nearly matches
with the experimental peak deflections. However, FE under predicts peak deflections,
as compared to the experimental deflection values and KENLAYER deflection
values, by ~ 38%, 36%, 33%, 30% and 28% for 50 mm, 80 mm, 100 mm, 120 mm
and 150 mm PCCBP thicknesses respectively. It may be noted that in FE analyses
the loading plate is modeled as rigid plate, simulating the steel load plate used in
FWD for dropping load, hence it is expected to predict lesser deflection than that
predicted by KANLAYER analysis, which is based on flexible plate loading (to
simulate rubber tire loading). This observation agrees with the report that a reduction
of 21% in surface deflection under a rigid plate as compared to that of flexible plate
(Yodar and Witczak, 1975). At distances beyond ~ 450 mm (i.e., 1.5 times the loading
plate diameter), there is a reasonable agreement (although lower than the experimental
values) between the surface deflection profiles predicted by FE and KENLAYER. It
can also be seen that the influence of load on the surface deflection bowl is much
TH-1037_07610405
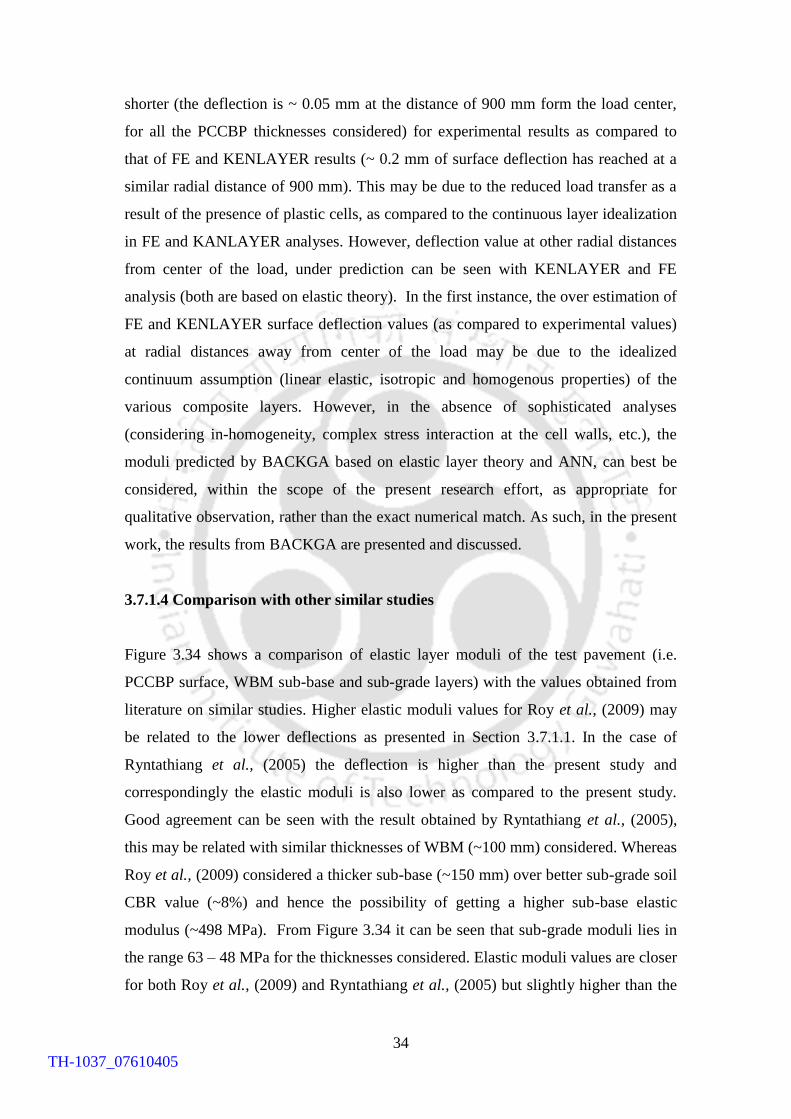
34
shorter (the deflection is ~ 0.05 mm at the distance of 900 mm form the load center,
for all the PCCBP thicknesses considered) for experimental results as compared to
that of FE and KENLAYER results (~ 0.2 mm of surface deflection has reached at a
similar radial distance of 900 mm). This may be due to the reduced load transfer as a
result of the presence of plastic cells, as compared to the continuous layer idealization
in FE and KANLAYER analyses. However, deflection value at other radial distances
from center of the load, under prediction can be seen with KENLAYER and FE
analysis (both are based on elastic theory). In the first instance, the over estimation of
FE and KENLAYER surface deflection values (as compared to experimental values)
at radial distances away from center of the load may be due to the idealized
continuum assumption (linear elastic, isotropic and homogenous properties) of the
various composite layers. However, in the absence of sophisticated analyses
(considering in-homogeneity, complex stress interaction at the cell walls, etc.), the
moduli predicted by BACKGA based on elastic layer theory and ANN, can best be
considered, within the scope of the present research effort, as appropriate for
qualitative observation, rather than the exact numerical match. As such, in the present
work, the results from BACKGA are presented and discussed.
3.7.1.4 Comparison with other similar studies
Figure 3.34 shows a comparison of elastic layer moduli of the test pavement (i.e.
PCCBP surface, WBM sub-base and sub-grade layers) with the values obtained from
literature on similar studies. Higher elastic moduli values for Roy et al., (2009) may
be related to the lower deflections as presented in Section 3.7.1.1. In the case of
Ryntathiang et al., (2005) the deflection is higher than the present study and
correspondingly the elastic moduli is also lower as compared to the present study.
Good agreement can be seen with the result obtained by Ryntathiang et al., (2005),
this may be related with similar thicknesses of WBM (~100 mm) considered. Whereas
Roy et al., (2009) considered a thicker sub-base (~150 mm) over better sub-grade soil
CBR value (~8%) and hence the possibility of getting a higher sub-base elastic
modulus (~498 MPa). From Figure 3.34 it can be seen that sub-grade moduli lies in
the range 63 – 48 MPa for the thicknesses considered. Elastic moduli values are closer
for both Roy et al., (2009) and Ryntathiang et al., (2005) but slightly higher than the
TH-1037_07610405
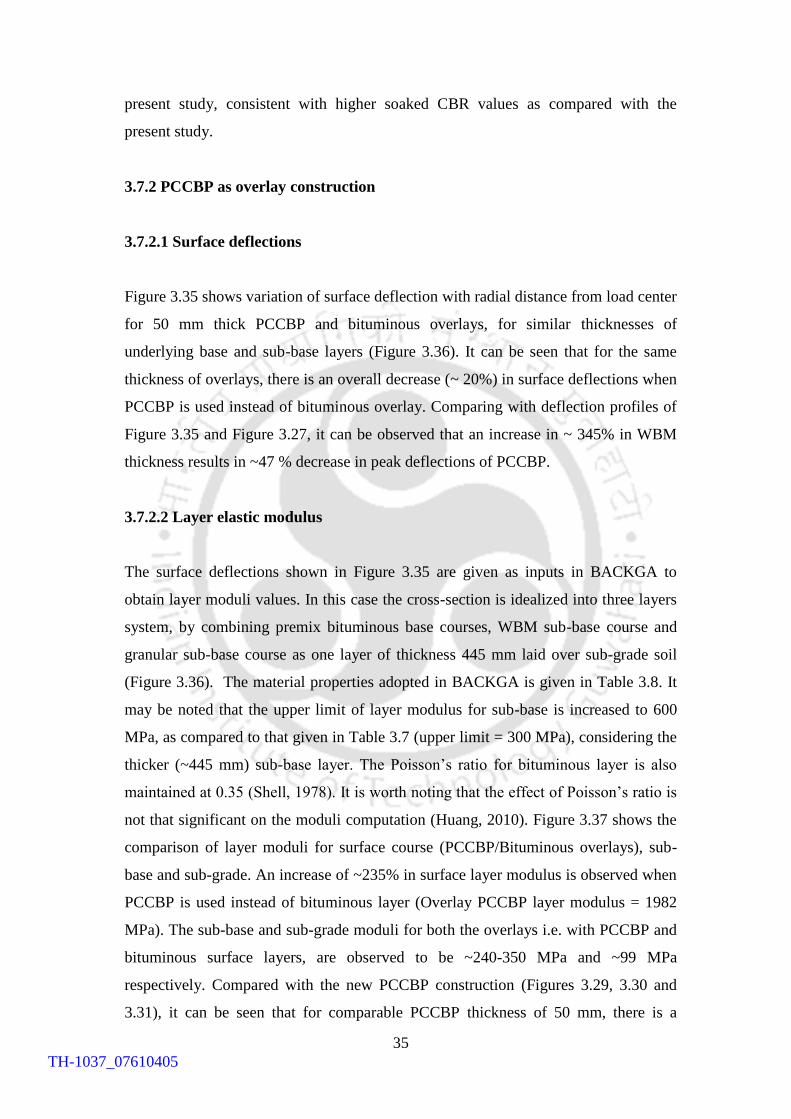
35
present study, consistent with higher soaked CBR values as compared with the
present study.
3.7.2 PCCBP as overlay construction
3.7.2.1 Surface deflections
Figure 3.35 shows variation of surface deflection with radial distance from load center
for 50 mm thick PCCBP and bituminous overlays, for similar thicknesses of
underlying base and sub-base layers (Figure 3.36). It can be seen that for the same
thickness of overlays, there is an overall decrease (~ 20%) in surface deflections when
PCCBP is used instead of bituminous overlay. Comparing with deflection profiles of
Figure 3.35 and Figure 3.27, it can be observed that an increase in ~ 345% in WBM
thickness results in ~47 % decrease in peak deflections of PCCBP.
3.7.2.2 Layer elastic modulus
The surface deflections shown in Figure 3.35 are given as inputs in BACKGA to
obtain layer moduli values. In this case the cross-section is idealized into three layers
system, by combining premix bituminous base courses, WBM sub-base course and
granular sub-base course as one layer of thickness 445 mm laid over sub-grade soil
(Figure 3.36). The material properties adopted in BACKGA is given in Table 3.8. It
may be noted that the upper limit of layer modulus for sub-base is increased to 600
MPa, as compared to that given in Table 3.7 (upper limit = 300 MPa), considering the
thicker (~445 mm) sub-base layer. The Poisson‟s ratio for bituminous layer is also
maintained at 0.35 (Shell, 1978). It is worth noting that the effect of Poisson‟s ratio is
not that significant on the moduli computation (Huang, 2010). Figure 3.37 shows the
comparison of layer moduli for surface course (PCCBP/Bituminous overlays), sub-
base and sub-grade. An increase of ~235% in surface layer modulus is observed when
PCCBP is used instead of bituminous layer (Overlay PCCBP layer modulus = 1982
MPa). The sub-base and sub-grade moduli for both the overlays i.e. with PCCBP and
bituminous surface layers, are observed to be ~240-350 MPa and ~99 MPa
respectively. Compared with the new PCCBP construction (Figures 3.29, 3.30 and
3.31), it can be seen that for comparable PCCBP thickness of 50 mm, there is a
TH-1037_07610405
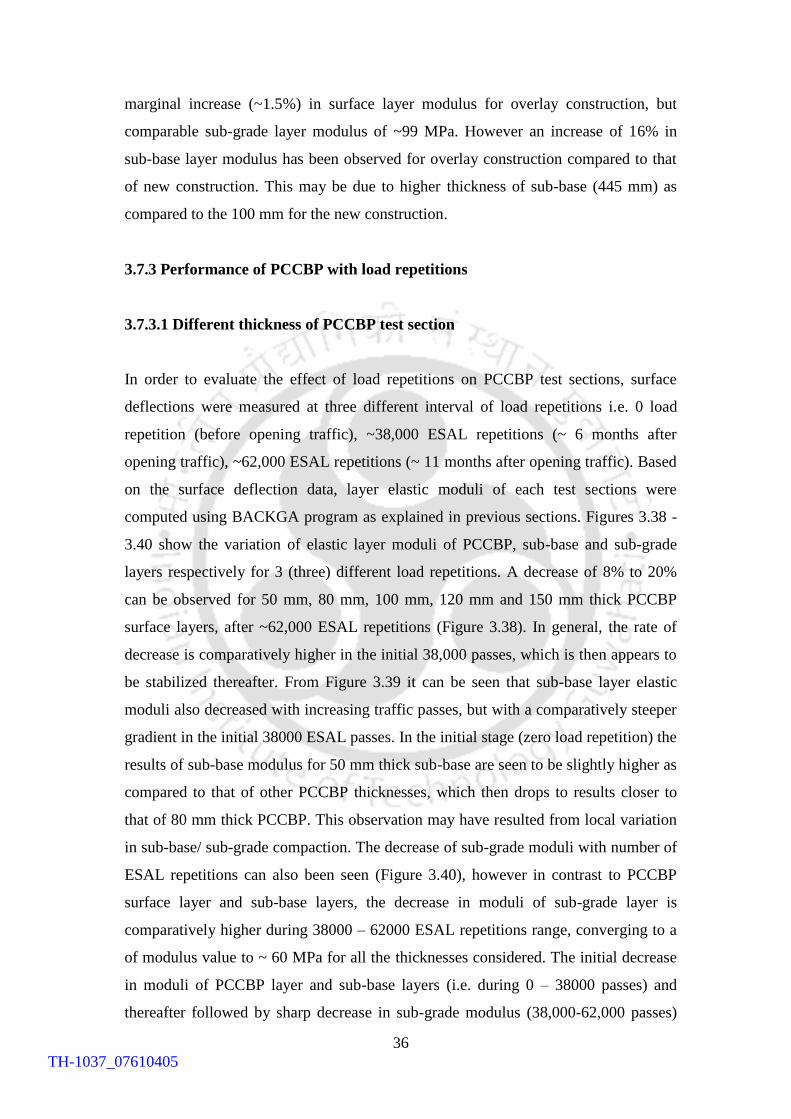
36
marginal increase (~1.5%) in surface layer modulus for overlay construction, but
comparable sub-grade layer modulus of ~99 MPa. However an increase of 16% in
sub-base layer modulus has been observed for overlay construction compared to that
of new construction. This may be due to higher thickness of sub-base (445 mm) as
compared to the 100 mm for the new construction.
3.7.3 Performance of PCCBP with load repetitions
3.7.3.1 Different thickness of PCCBP test section
In order to evaluate the effect of load repetitions on PCCBP test sections, surface
deflections were measured at three different interval of load repetitions i.e. 0 load
repetition (before opening traffic), ~38,000 ESAL repetitions (~ 6 months after
opening traffic), ~62,000 ESAL repetitions (~ 11 months after opening traffic). Based
on the surface deflection data, layer elastic moduli of each test sections were
computed using BACKGA program as explained in previous sections. Figures 3.38 -
3.40 show the variation of elastic layer moduli of PCCBP, sub-base and sub-grade
layers respectively for 3 (three) different load repetitions. A decrease of 8% to 20%
can be observed for 50 mm, 80 mm, 100 mm, 120 mm and 150 mm thick PCCBP
surface layers, after ~62,000 ESAL repetitions (Figure 3.38). In general, the rate of
decrease is comparatively higher in the initial 38,000 passes, which is then appears to
be stabilized thereafter. From Figure 3.39 it can be seen that sub-base layer elastic
moduli also decreased with increasing traffic passes, but with a comparatively steeper
gradient in the initial 38000 ESAL passes. In the initial stage (zero load repetition) the
results of sub-base modulus for 50 mm thick sub-base are seen to be slightly higher as
compared to that of other PCCBP thicknesses, which then drops to results closer to
that of 80 mm thick PCCBP. This observation may have resulted from local variation
in sub-base/ sub-grade compaction. The decrease of sub-grade moduli with number of
ESAL repetitions can also been seen (Figure 3.40), however in contrast to PCCBP
surface layer and sub-base layers, the decrease in moduli of sub-grade layer is
comparatively higher during 38000 – 62000 ESAL repetitions range, converging to a
of modulus value to ~ 60 MPa for all the thicknesses considered. The initial decrease
in moduli of PCCBP layer and sub-base layers (i.e. during 0 – 38000 passes) and
thereafter followed by sharp decrease in sub-grade modulus (38,000-62,000 passes)
TH-1037_07610405
37
may be related to the decrease in stiffness of the PCCBP layer due to distressing (see
Chapter 4).Due to distress in the PCCBP layer, the sub-grade modulus of all the
pavement section might have converged to modulus value ~60 MPa.
3.7.3.2 PCCBP as overlay construction
Figures 3.41-3.43 show the effect of load repetitions on the moduli for PCCBP and
bituminous overlay constructions. It can be observed from Figure 3.41 that the
decrease of moduli for PCCBP and bituminous overlays are 0.9% and 3%
respectively after 62,000 ESAL repetitions. This may be due to thicker, well
compacted and consolidated underlying base/sub-base courses of the existing old
pavement. From Figures 3.42 and 3.43 it can be observed that there is no significant
variation in layer moduli of both sub-base and sub-grade layers with increase in
passes of traffic. Again, the reason may be well compacted and consolidated
underlying layers of the existing pavement.
3.8 Conclusions
A study has been made to investigate experimentally into the structural assessment of
different thicknesses (50 mm, 80 mm, 100 mm, 120 mm and 150 mm) of Plastic Cell
filled Concrete Block Pavement (PCCBP) over 100mm thick sub-base layer of Water
Bound Macadam (WBM) course, using „waste‟ stone dust in place of the traditional
river sand as fine aggregates in concrete. To explore the possibility of PCCBP as
overlay construction, 50 mm thick PCCBP overlay layer was also constructed. Layer
elastic moduli of different layers of PCCBP have been calculated using a
backcalculation computer program code BACKGA (Reddy et al., 2002) from the
surface deflection data obtained through a custom fabricated Falling Weight
Deflectometer (FWD). Based on the investigation the following main conclusions are
summarized:
1. An increase in the size of surface deflection bowl was observed for decreasing
PCCBP thickness. The deflection bowl has been observed to be significant up
to an approximate radial distance of twice the load plate diameter from the
center of the load (~600 mm).
TH-1037_07610405
38
2. Peak surface deflections decreased with increasing PCCBP thickness linearly,
with 200% increase in thickness from 50 mm thick PCCBP, a decrease of
~48% (0.84 mm for 50 mm PCCBP) in deflection was observed.
3. A thin PCCBP of 50 mm over thin sub-base of 100 mm can result in
sufficiently high elastic moduli (> 1900 MPa) of PCCBP to be used for rural
roads.
4. Elastic modulus of PCCBP increases with increasing thickness, approximately
in a linear manner for the thicknesses tested, 90% increase in elastic modulus
was observed for 200% increase in thickness.
5. The elastic modulus for the 100 mm sub-base (WBM) was found to be in the
range of 300 - 240 MPa and no significant variation in moduli could be
observed for the thicknesses tested.
6. Sub-grade elastic modulus was seen to be within the range 100 – 70 MPa with
marginal variation with thickness
7. It has been observed that for the initial 38,000 ESAL passes the degradation in
layer modulus of PCCBP is of the range ~3-20%., however there appears to be
a stabilization after 38,000 passes with the degradation dropping to ~1-7%
(from 38,000 to 62,000 ESAL passes). The lowest thickness of PCCBP (50
mm) has shown a high elastic modulus (~1800 MPa) even after a wheel load
repetition of 62, 000 passes.
8. PCCBP overlay showed significant improvement (~230% increase) in elastic
layer modulus when compared to that of bituminous overlay suggesting that
PCCBP can be a good alternative for strengthening the existing bituminous
pavements.
9. Maximum utilisation of labour (hence labour intensive) during plastic cell
formwork making and construction process makes PCCBP a suitable
candidate for employment generation in the rural areas.
TH-1037_07610405
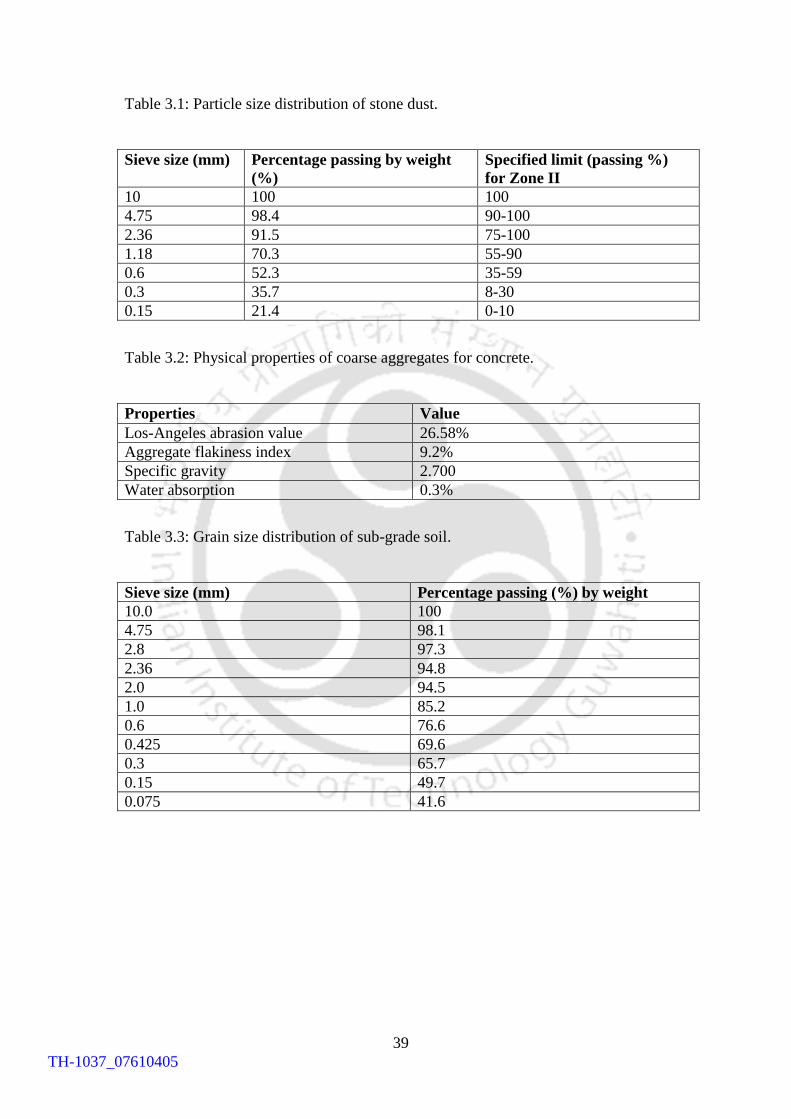
39
Table 3.1: Particle size distribution of stone dust.
Sieve size (mm) Percentage passing by weight
(%)
Specified limit (passing %)
for Zone II
10 100 100
4.75 98.4 90-100
2.36 91.5 75-100
1.18 70.3 55-90
0.6 52.3 35-59
0.3 35.7 8-30
0.15 21.4 0-10
Table 3.2: Physical properties of coarse aggregates for concrete.
Properties Value
Los-Angeles abrasion value 26.58%
Aggregate flakiness index 9.2%
Specific gravity 2.700
Water absorption 0.3%
Table 3.3: Grain size distribution of sub-grade soil.
Sieve size (mm) Percentage passing (%) by weight
10.0 100
4.75 98.1
2.8 97.3
2.36 94.8
2.0 94.5
1.0 85.2
0.6 76.6
0.425 69.6
0.3 65.7
0.15 49.7
0.075 41.6
TH-1037_07610405
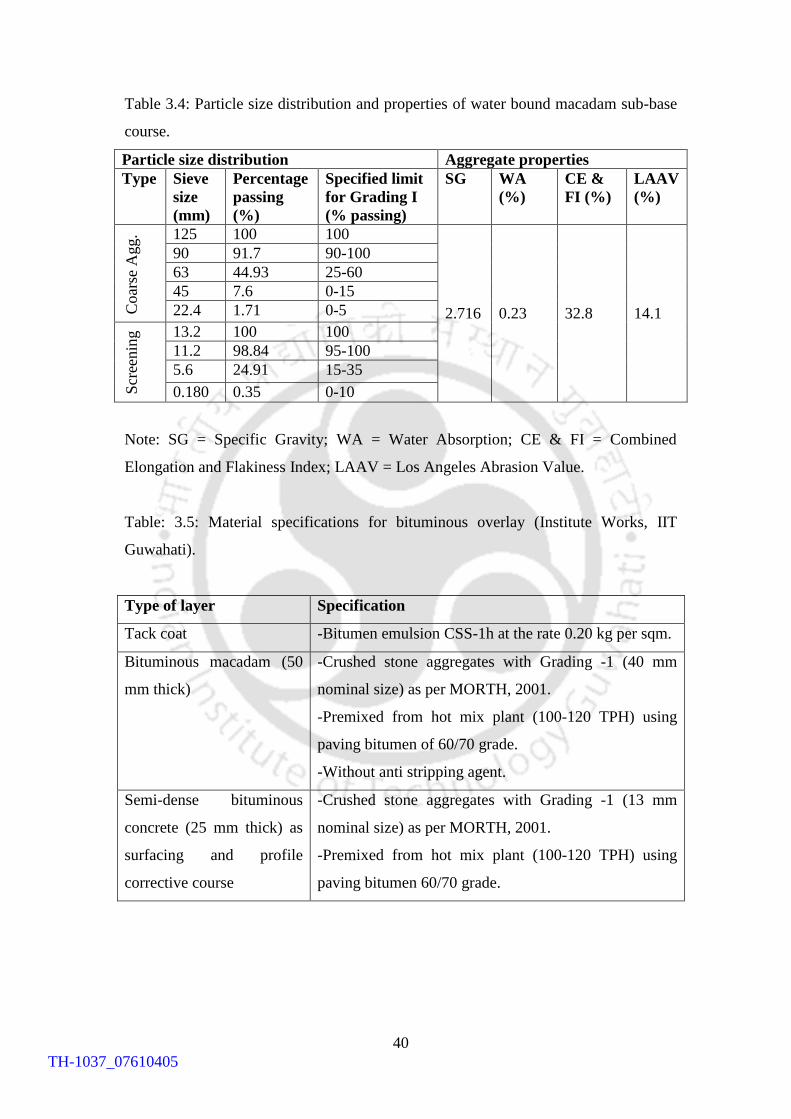
40
Table 3.4: Particle size distribution and properties of water bound macadam sub-base
course.
Particle size distribution Aggregate properties
Type Sieve
size
(mm)
Percentage
passing
(%)
Specified limit
for Grading I
(% passing)
SG WA
(%)
CE &
FI (%)
LAAV
(%)
Coar
se A
gg. 125 100 100
2.716 0.23 32.8 14.1
90 91.7 90-100
63 44.93 25-60
45 7.6 0-15
22.4 1.71 0-5
Scr
eenin
g 13.2 100 100
11.2 98.84 95-100
5.6 24.91 15-35
0.180 0.35 0-10
Note: SG = Specific Gravity; WA = Water Absorption; CE & FI = Combined
Elongation and Flakiness Index; LAAV = Los Angeles Abrasion Value.
Table: 3.5: Material specifications for bituminous overlay (Institute Works, IIT
Guwahati).
Type of layer Specification
Tack coat -Bitumen emulsion CSS-1h at the rate 0.20 kg per sqm.
Bituminous macadam (50
mm thick)
-Crushed stone aggregates with Grading -1 (40 mm
nominal size) as per MORTH, 2001.
-Premixed from hot mix plant (100-120 TPH) using
paving bitumen of 60/70 grade.
-Without anti stripping agent.
Semi-dense bituminous
concrete (25 mm thick) as
surfacing and profile
corrective course
-Crushed stone aggregates with Grading -1 (13 mm
nominal size) as per MORTH, 2001.
-Premixed from hot mix plant (100-120 TPH) using
paving bitumen 60/70 grade.
TH-1037_07610405
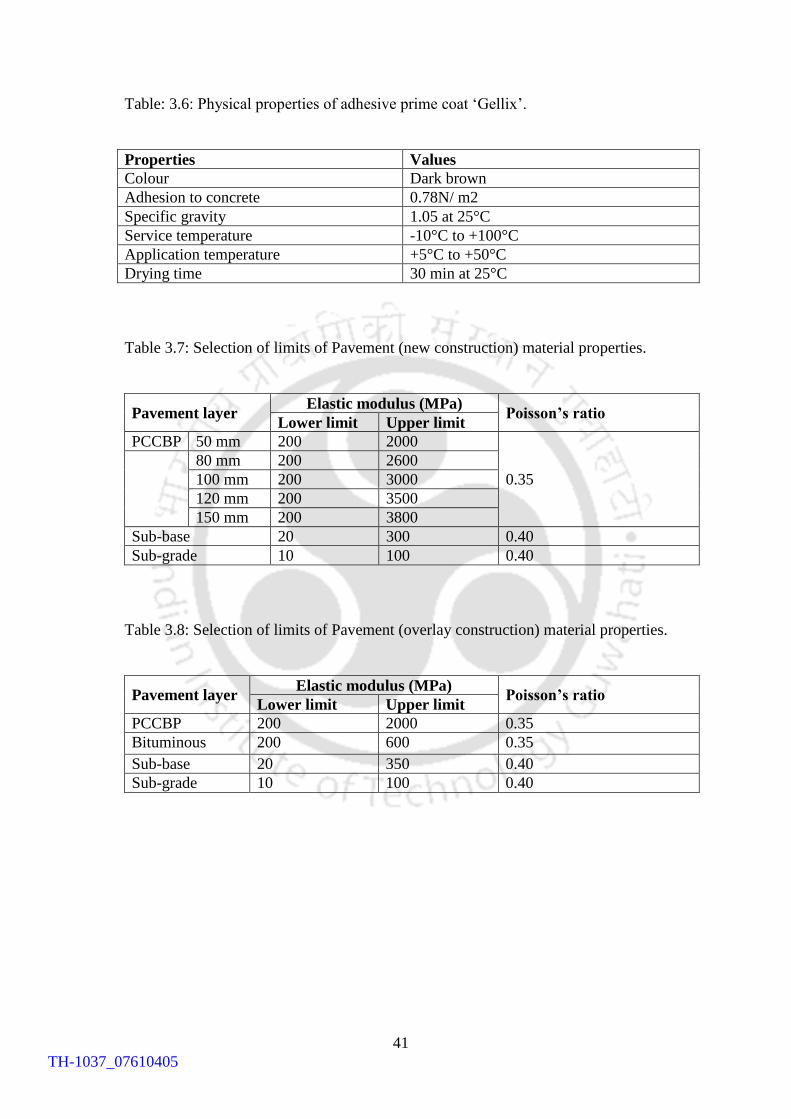
41
Table: 3.6: Physical properties of adhesive prime coat „Gellix‟.
Properties Values
Colour Dark brown
Adhesion to concrete 0.78N/ m2
Specific gravity 1.05 at 25°C
Service temperature -10°C to +100°C
Application temperature +5°C to +50°C
Drying time 30 min at 25°C
Table 3.7: Selection of limits of Pavement (new construction) material properties.
Pavement layer Elastic modulus (MPa)
Poisson’s ratio Lower limit Upper limit
PCCBP 50 mm 200 2000
0.35
80 mm 200 2600
100 mm 200 3000
120 mm 200 3500
150 mm 200 3800
Sub-base 20 300 0.40
Sub-grade 10 100 0.40
Table 3.8: Selection of limits of Pavement (overlay construction) material properties.
Pavement layer Elastic modulus (MPa)
Poisson’s ratio Lower limit Upper limit
PCCBP 200 2000 0.35
Bituminous 200 600 0.35
Sub-base 20 350 0.40
Sub-grade 10 100 0.40
TH-1037_07610405
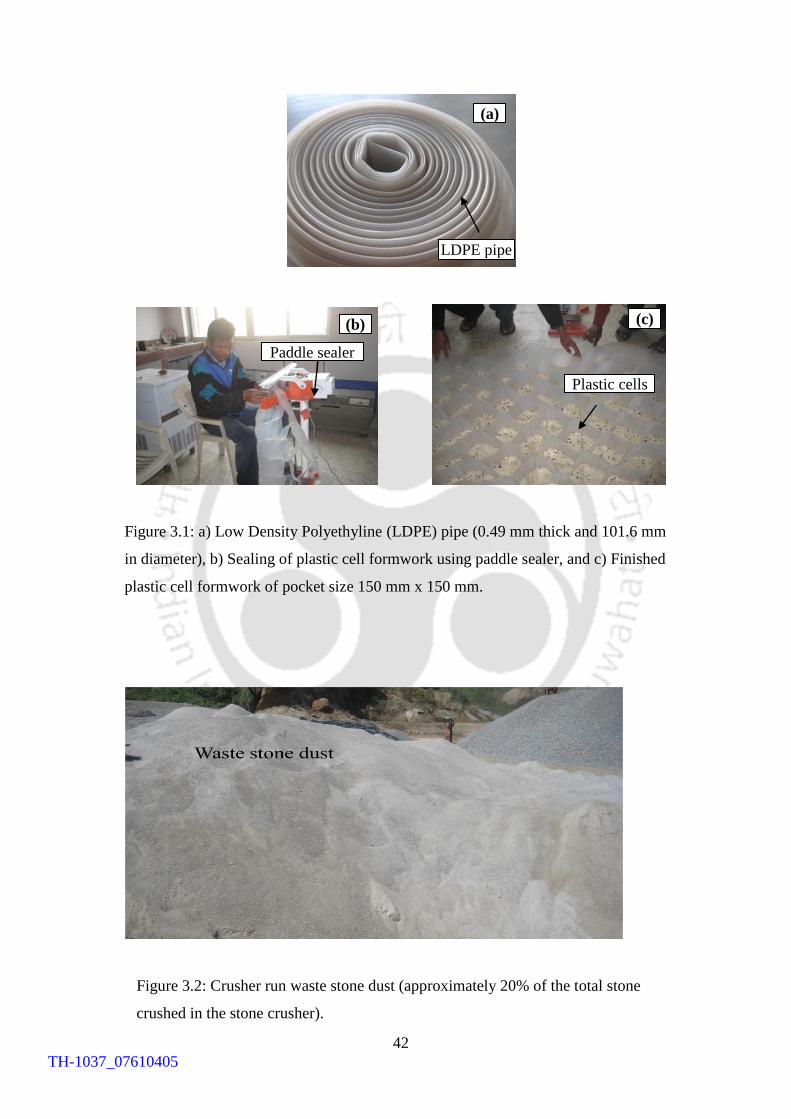
42
Figure 3.1: a) Low Density Polyethyline (LDPE) pipe (0.49 mm thick and 101.6 mm
in diameter), b) Sealing of plastic cell formwork using paddle sealer, and c) Finished
plastic cell formwork of pocket size 150 mm x 150 mm.
Figure 3.2: Crusher run waste stone dust (approximately 20% of the total stone
crushed in the stone crusher).
(a)
(b) (c)
LDPE pipe
Paddle sealer
Plastic cells
TH-1037_07610405
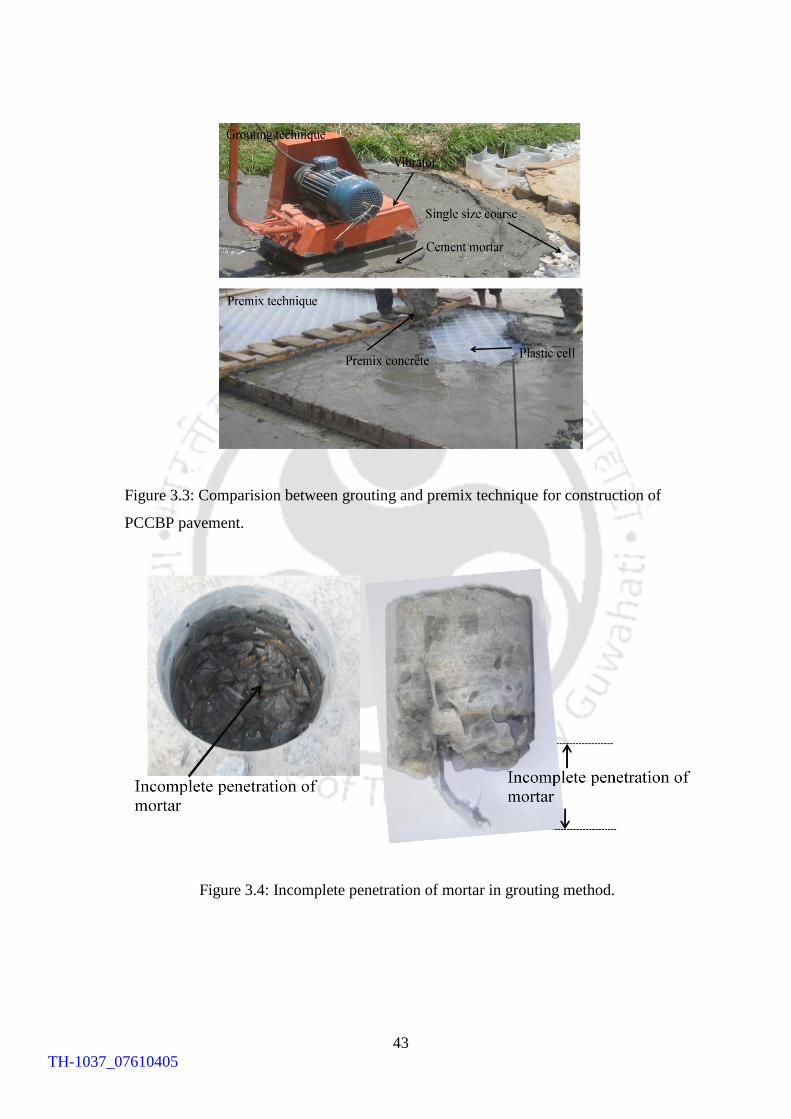
43
Figure 3.3: Comparision between grouting and premix technique for construction of
PCCBP pavement.
Figure 3.4: Incomplete penetration of mortar in grouting method.
TH-1037_07610405
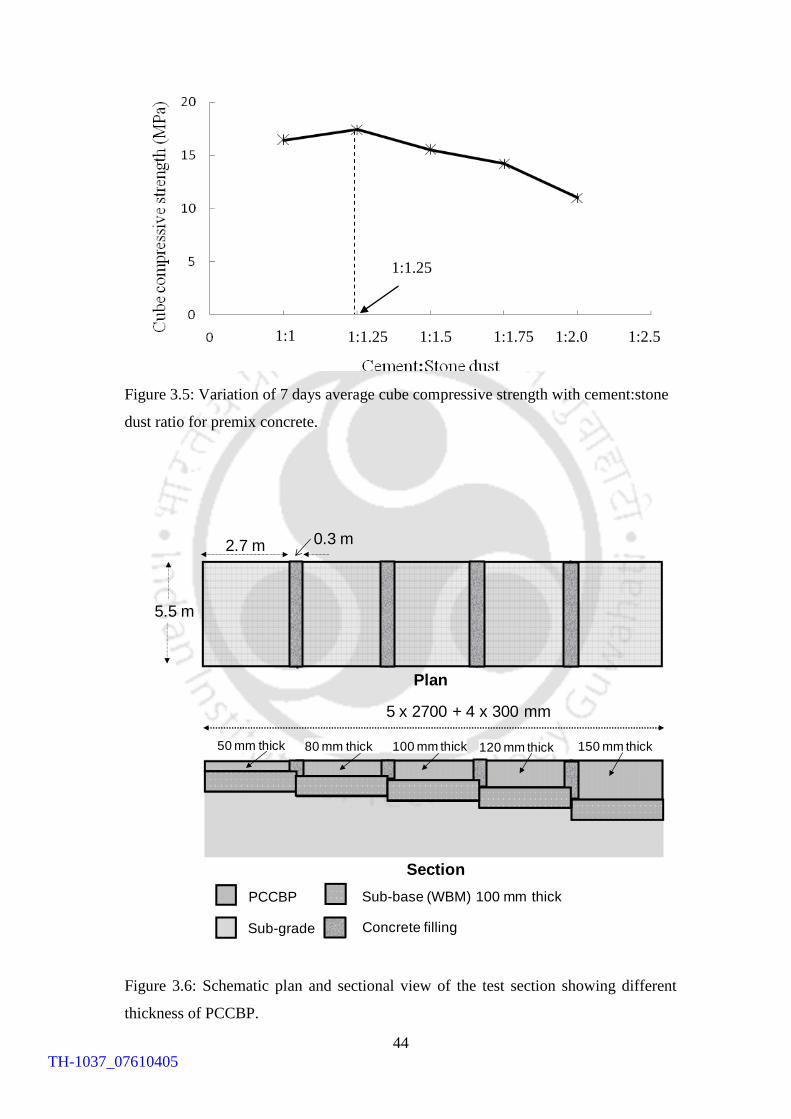
44
Figure 3.5: Variation of 7 days average cube compressive strength with cement:stone
dust ratio for premix concrete.
Figure 3.6: Schematic plan and sectional view of the test section showing different
thickness of PCCBP.
Plan
5 x 2700 + 4 x 300 mm
50 mm thick 80 mm thick 100 mm thick 120 mm thick 150 mm thick
PCCBP Sub-base (WBM) 100 mm thick
Sub-grade
Section
5.5 m
2.7 m 0.3 m
Concrete filling
1:1.25
1:1 1:1.25 1:1.5 1:2.0 1:1.75 1:2.5
TH-1037_07610405
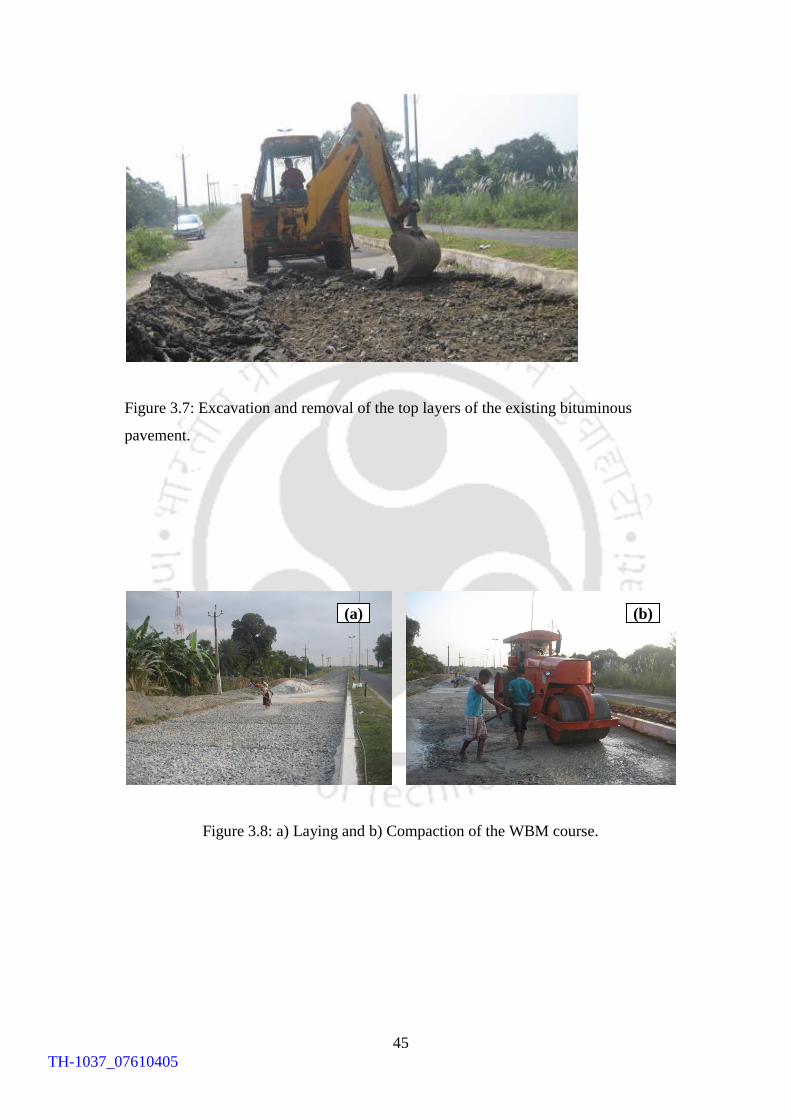
45
Figure 3.7: Excavation and removal of the top layers of the existing bituminous
pavement.
Figure 3.8: a) Laying and b) Compaction of the WBM course.
(a) (b)
TH-1037_07610405
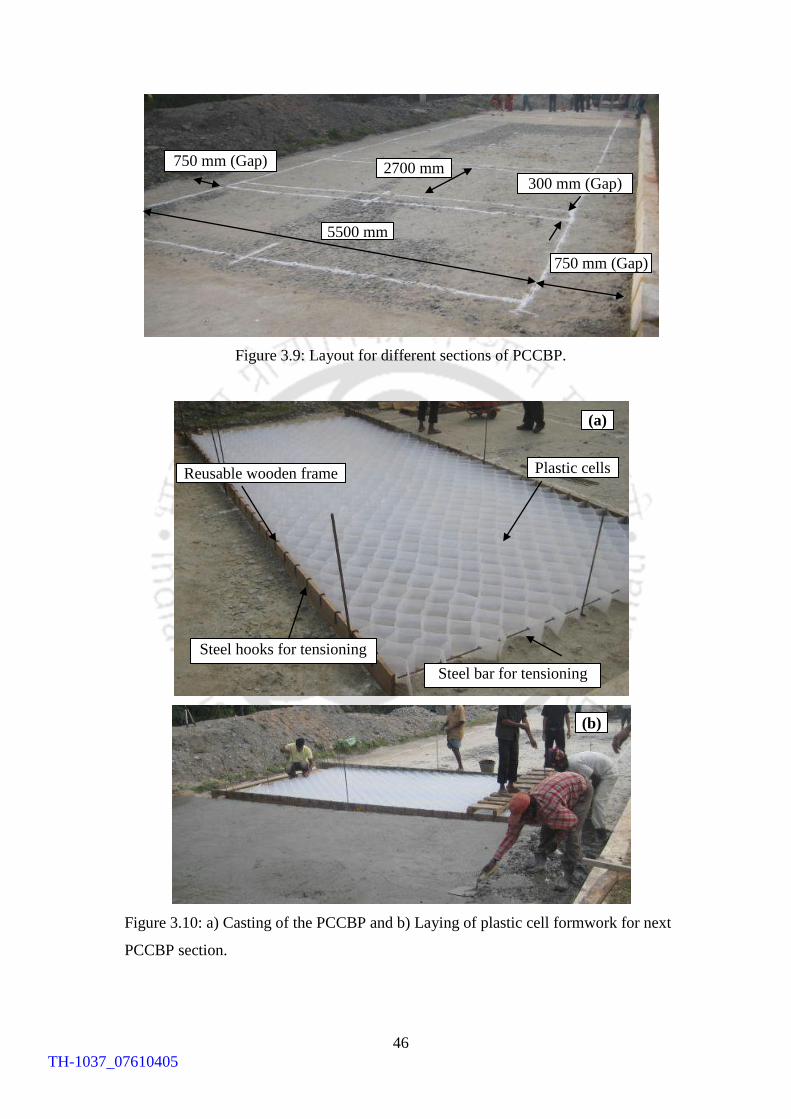
46
Figure 3.9: Layout for different sections of PCCBP.
Figure 3.10: a) Casting of the PCCBP and b) Laying of plastic cell formwork for next
PCCBP section.
750 mm (Gap)
750 mm (Gap) 2700 mm
300 mm (Gap)
5500 mm
(b)
(a)
Plastic cells Reusable wooden frame
Steel hooks for tensioning
Steel bar for tensioning
TH-1037_07610405
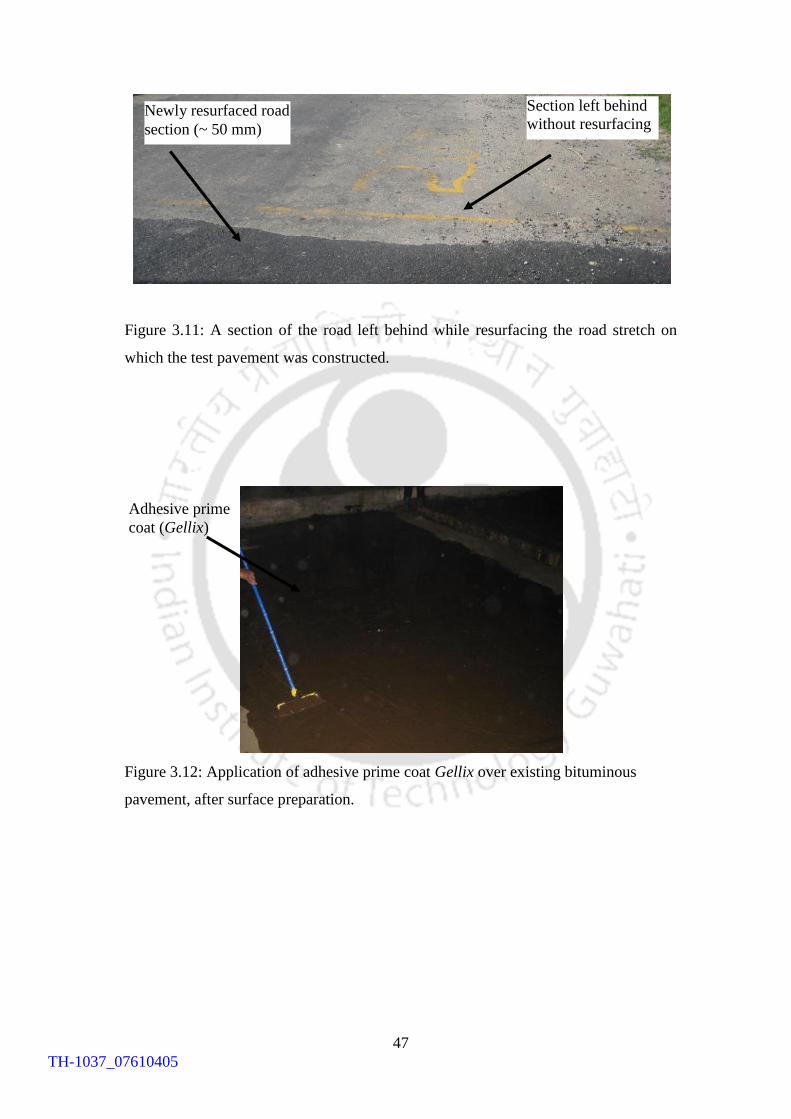
47
Figure 3.11: A section of the road left behind while resurfacing the road stretch on
which the test pavement was constructed.
Figure 3.12: Application of adhesive prime coat Gellix over existing bituminous
pavement, after surface preparation.
Section left behind
without resurfacing
pavement
Newly resurfaced road
section (~ 50 mm)
Adhesive prime
coat (Gellix)
TH-1037_07610405
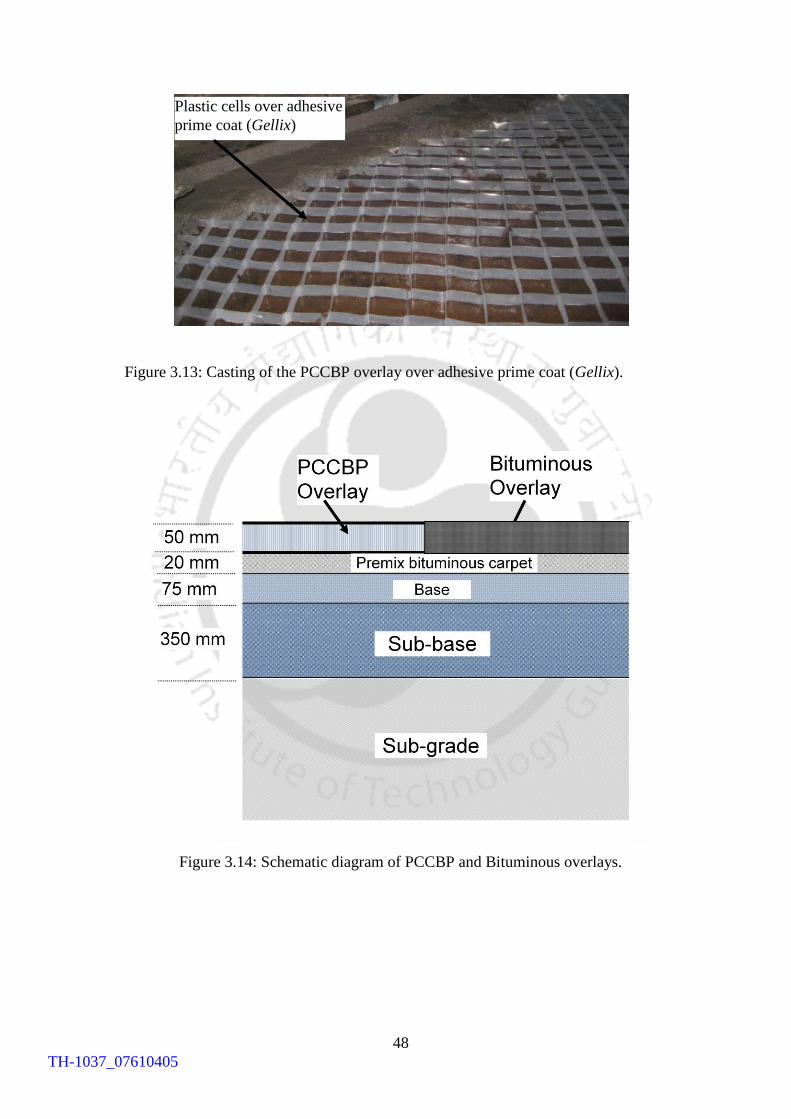
48
Figure 3.13: Casting of the PCCBP overlay over adhesive prime coat (Gellix).
Figure 3.14: Schematic diagram of PCCBP and Bituminous overlays.
Plastic cells over adhesive
prime coat (Gellix)
TH-1037_07610405
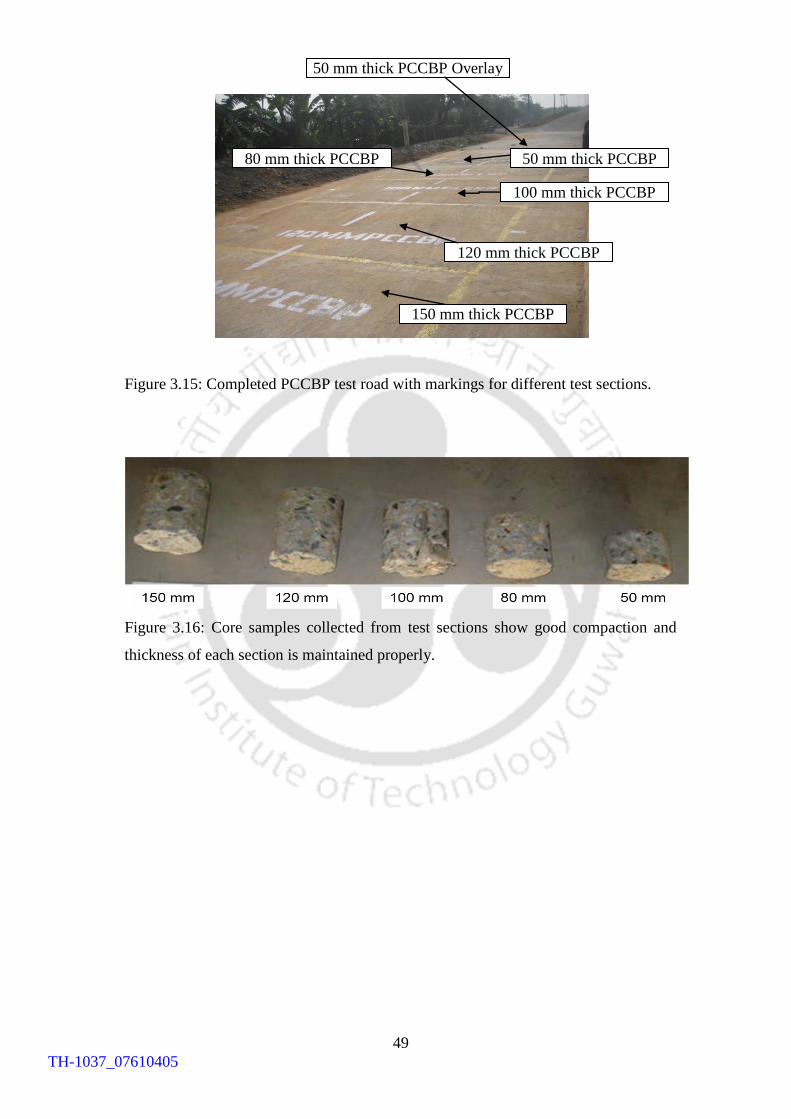
49
Figure 3.15: Completed PCCBP test road with markings for different test sections.
Figure 3.16: Core samples collected from test sections show good compaction and
thickness of each section is maintained properly.
150 mm thick PCCBP
120 mm thick PCCBP
100 mm thick PCCBP
80 mm thick PCCBP 50 mm thick PCCBP
50 mm thick PCCBP Overlay
TH-1037_07610405
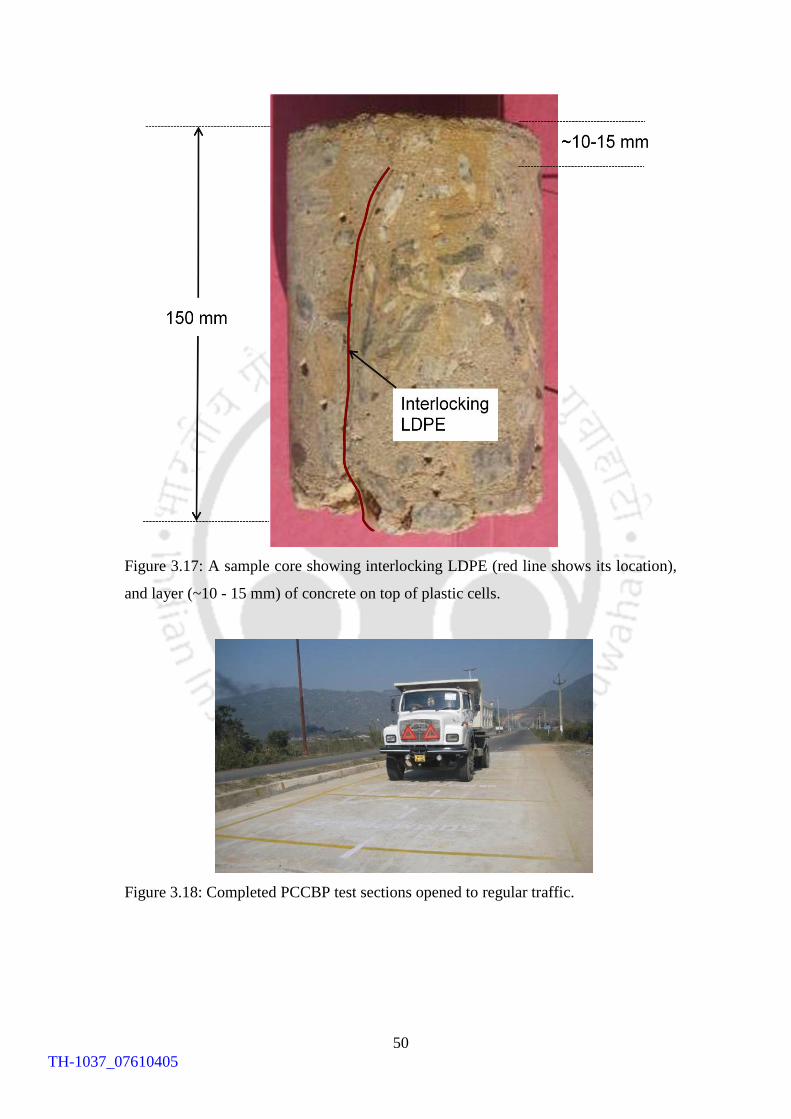
50
Figure 3.17: A sample core showing interlocking LDPE (red line shows its location),
and layer (~10 - 15 mm) of concrete on top of plastic cells.
Figure 3.18: Completed PCCBP test sections opened to regular traffic.
TH-1037_07610405
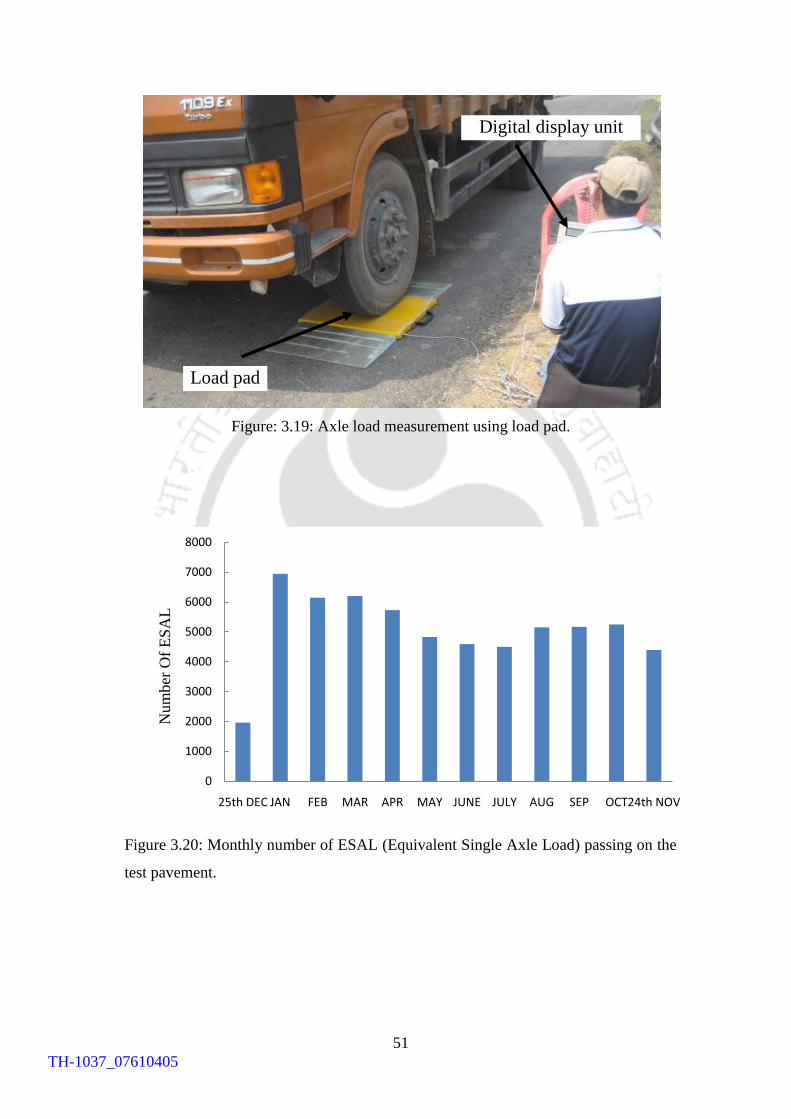
51
Figure: 3.19: Axle load measurement using load pad.
Figure 3.20: Monthly number of ESAL (Equivalent Single Axle Load) passing on the
test pavement.
0
1000
2000
3000
4000
5000
6000
7000
8000
25th DEC JAN FEB MAR APR MAY JUNE JULY AUG SEP OCT24th NOV
Num
ber
Of
ES
AL
Load pad
Digital display unit
TH-1037_07610405
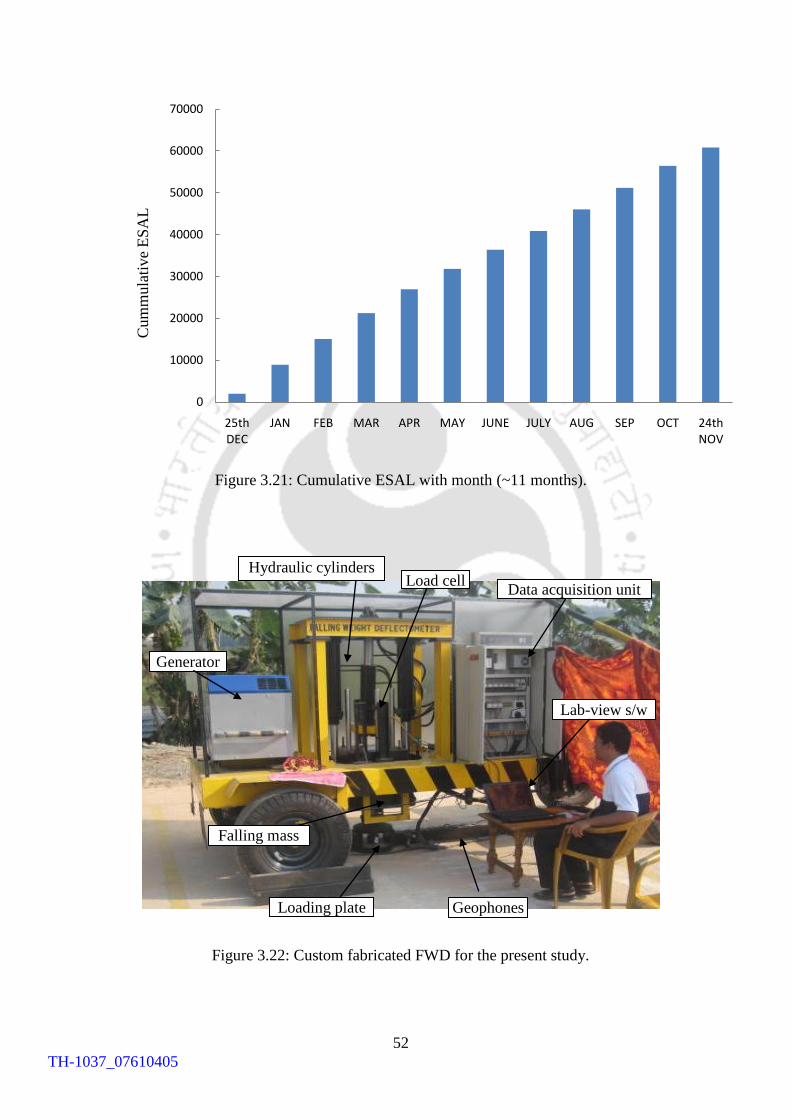
52
Figure 3.21: Cumulative ESAL with month (~11 months).
Figure 3.22: Custom fabricated FWD for the present study.
0
10000
20000
30000
40000
50000
60000
70000
25th DEC
JAN FEB MAR APR MAY JUNE JULY AUG SEP OCT 24th NOV
Cum
mula
tive
ES
AL
Lab-view s/w
Geophones Loading plate
Hydraulic cylinders Load cell
Generator
Data acquisition unit
Falling mass
TH-1037_07610405
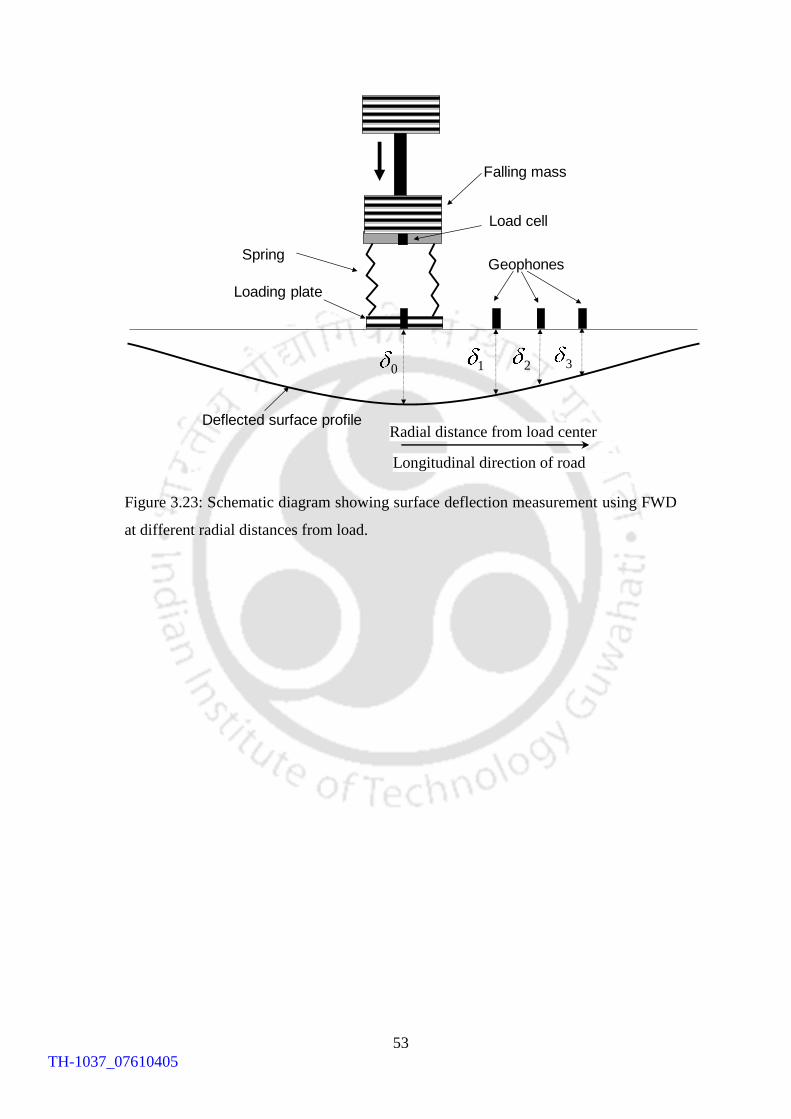
53
Figure 3.23: Schematic diagram showing surface deflection measurement using FWD
at different radial distances from load.
0 321
Falling mass
Spring
Loading plate
Geophones
Deflected surface profile
Load cell
Radial distance from load center
Longitudinal direction of road
TH-1037_07610405
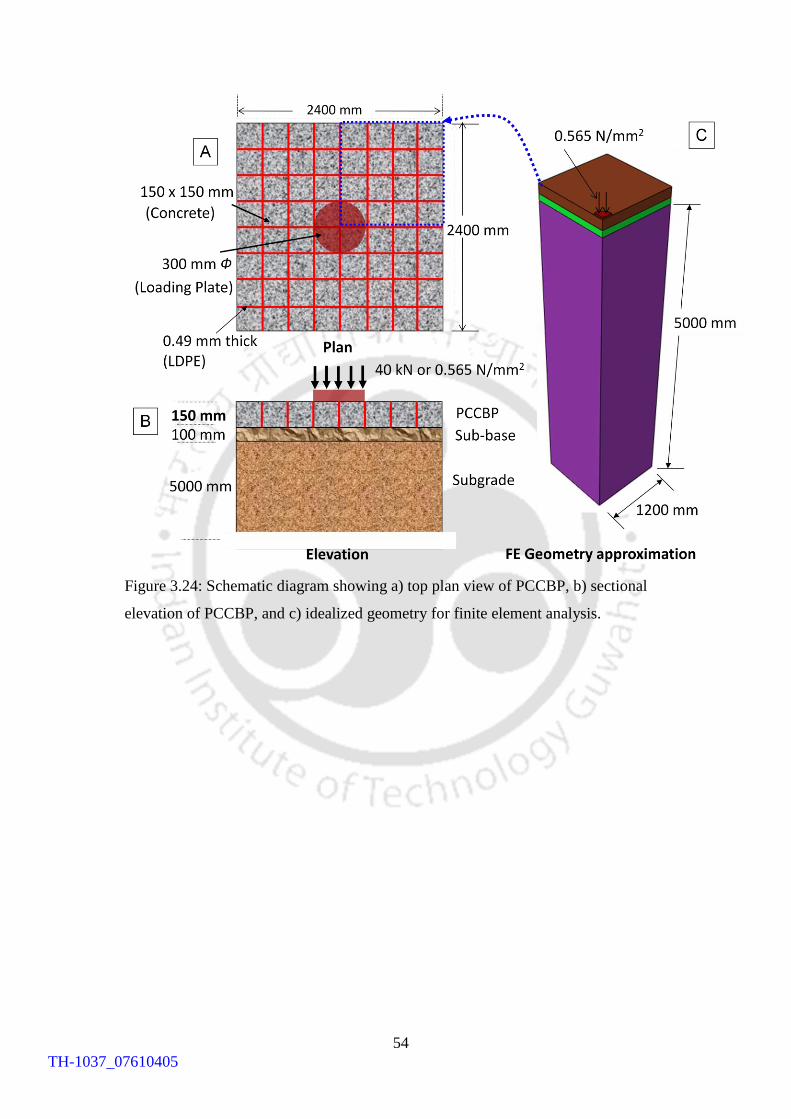
54
Figure 3.24: Schematic diagram showing a) top plan view of PCCBP, b) sectional
elevation of PCCBP, and c) idealized geometry for finite element analysis.
TH-1037_07610405
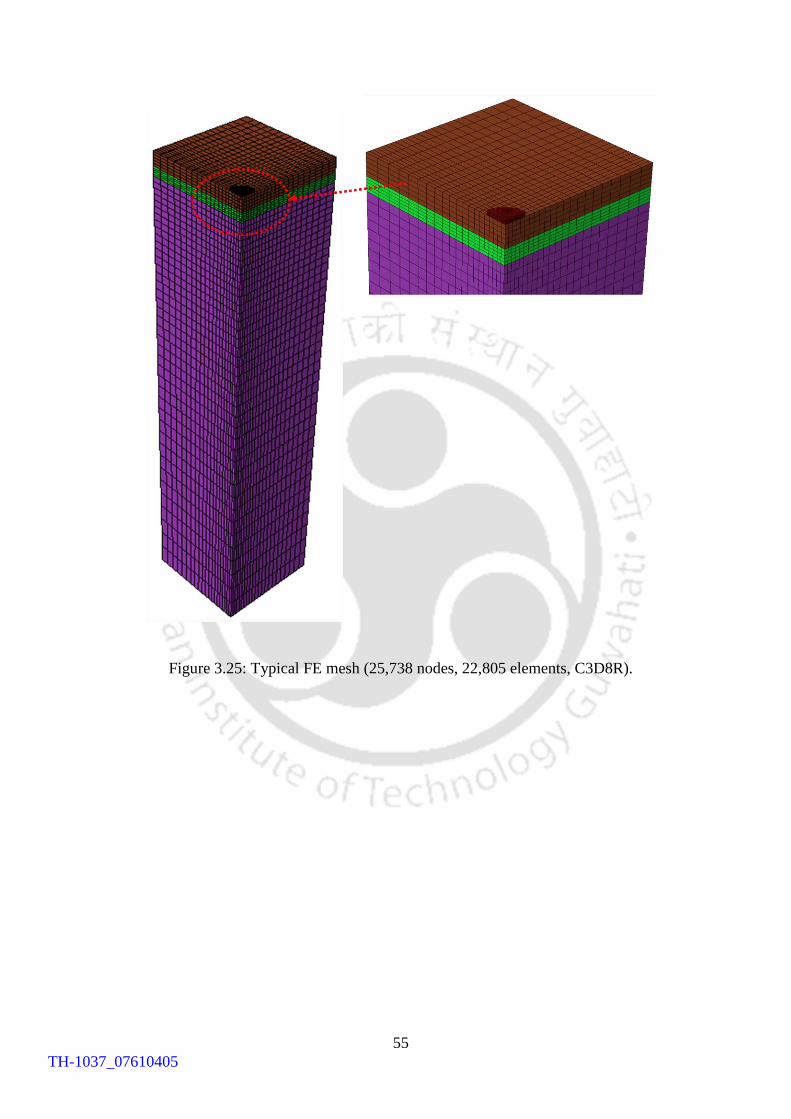
55
Figure 3.25: Typical FE mesh (25,738 nodes, 22,805 elements, C3D8R).
TH-1037_07610405
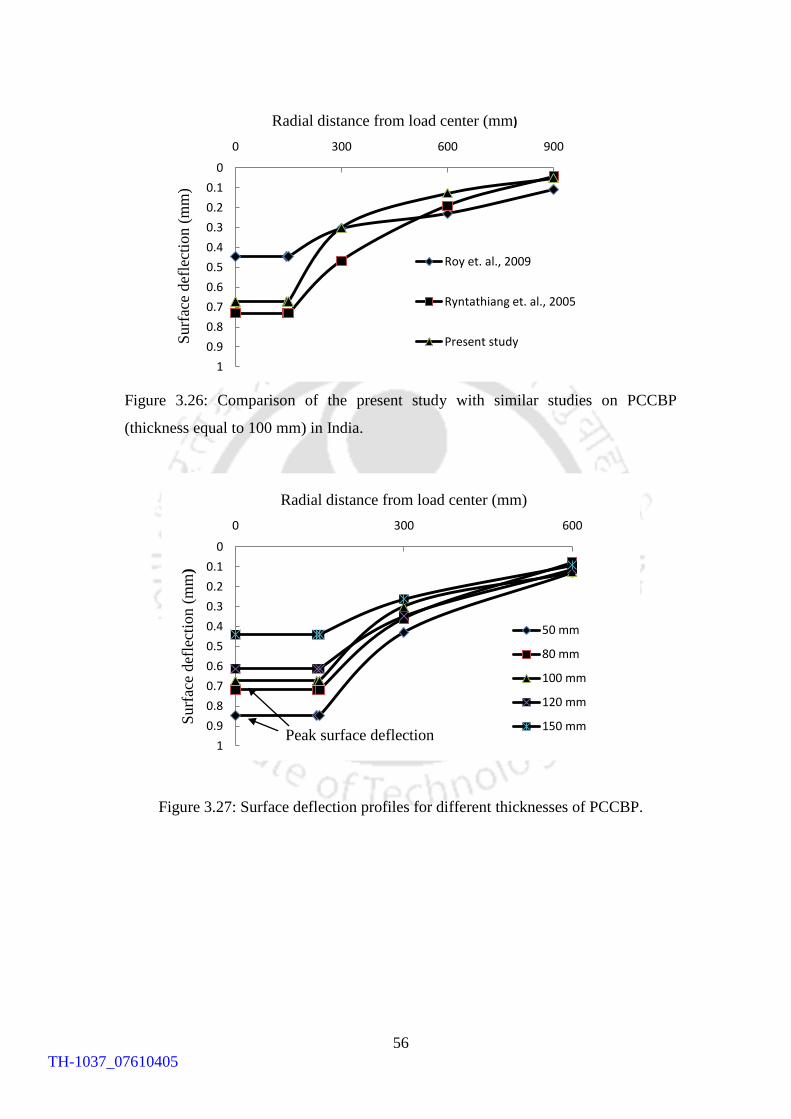
56
Figure 3.26: Comparison of the present study with similar studies on PCCBP
(thickness equal to 100 mm) in India.
Figure 3.27: Surface deflection profiles for different thicknesses of PCCBP.
0
0.1
0.2
0.3
0.4
0.5
0.6
0.7
0.8
0.9
1
0 300 600 900
Surf
ace
def
lect
ion (
mm
)
Radial distance from load center (mm)
Roy et. al., 2009
Ryntathiang et. al., 2005
Present study
0
0.1
0.2
0.3
0.4
0.5
0.6
0.7
0.8
0.9
1
0 300 600
Surf
ace
def
lect
ion (
mm
)
Radial distance from load center (mm)
50 mm
80 mm
100 mm
120 mm
150 mmPeak surface deflection
TH-1037_07610405
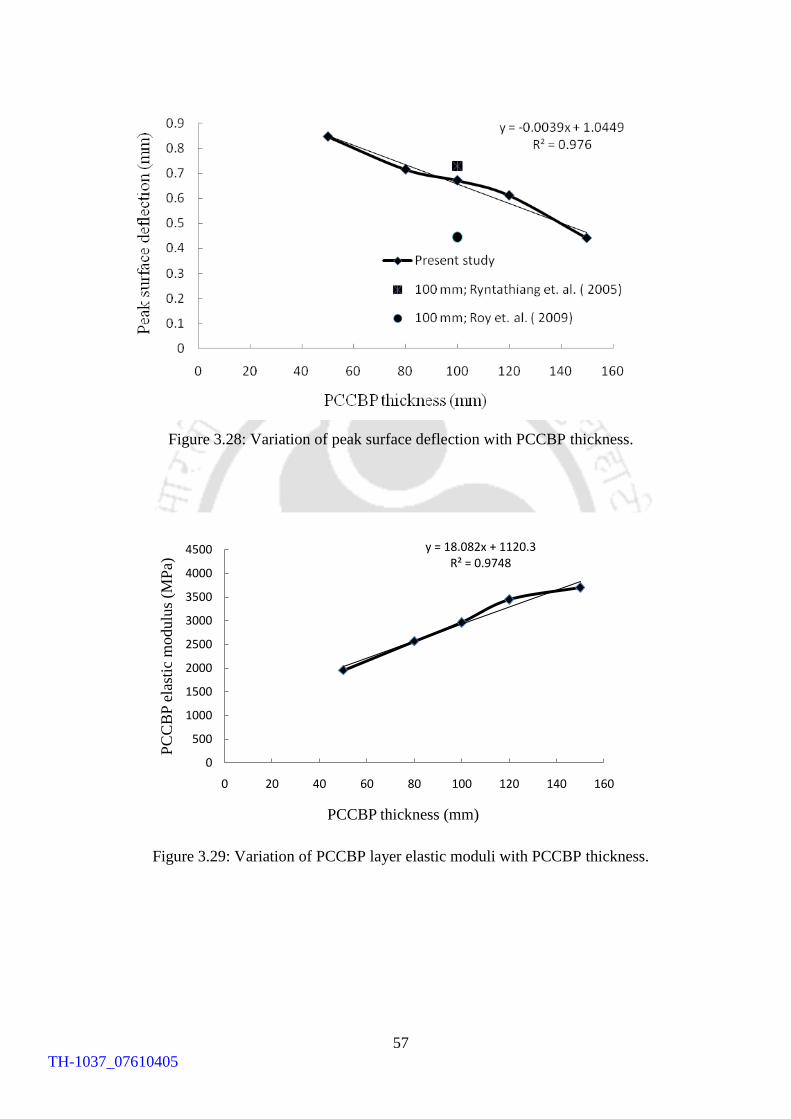
57
Figure 3.28: Variation of peak surface deflection with PCCBP thickness.
Figure 3.29: Variation of PCCBP layer elastic moduli with PCCBP thickness.
y = 18.082x + 1120.3R² = 0.9748
0
500
1000
1500
2000
2500
3000
3500
4000
4500
0 20 40 60 80 100 120 140 160
PC
CB
P e
last
ic m
odulu
s (M
Pa)
PCCBP thickness (mm)
TH-1037_07610405
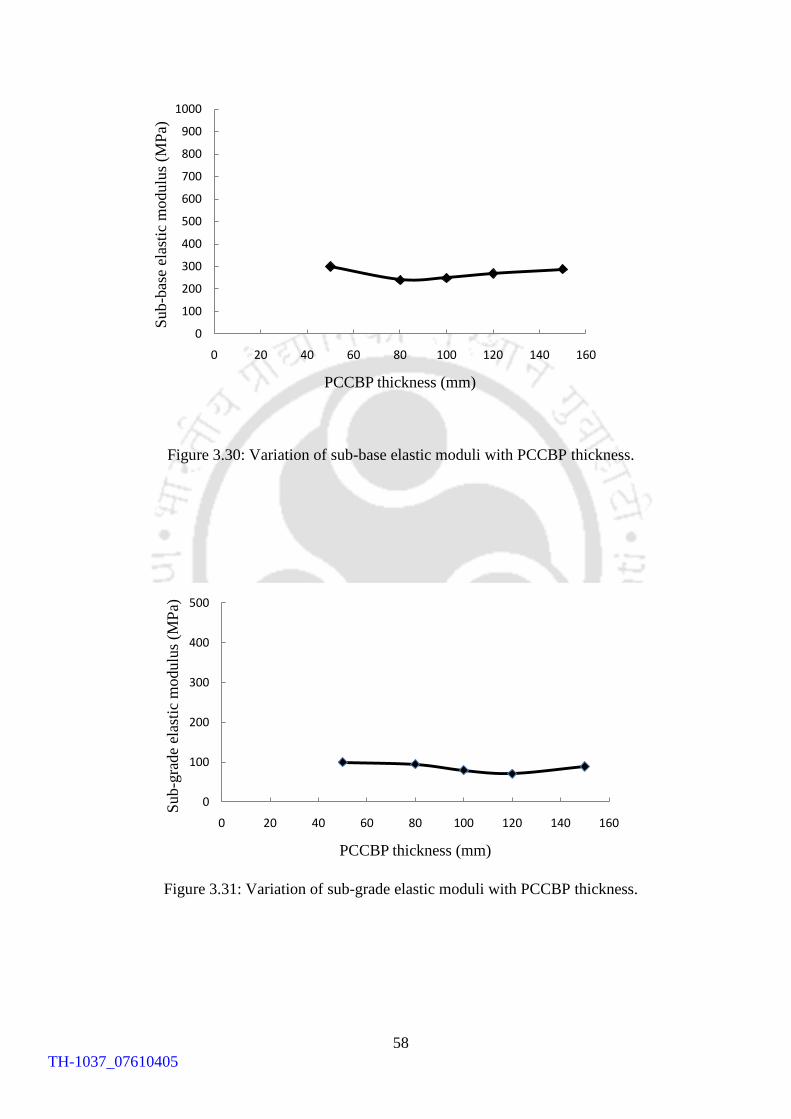
58
Figure 3.30: Variation of sub-base elastic moduli with PCCBP thickness.
Figure 3.31: Variation of sub-grade elastic moduli with PCCBP thickness.
0
100
200
300
400
500
600
700
800
900
1000
0 20 40 60 80 100 120 140 160
Sub
-bas
e el
asti
c m
odulu
s (M
Pa)
PCCBP thickness (mm)
0
100
200
300
400
500
0 20 40 60 80 100 120 140 160
Sub
-gra
de
elas
tic
modulu
s (M
Pa)
PCCBP thickness (mm)
TH-1037_07610405
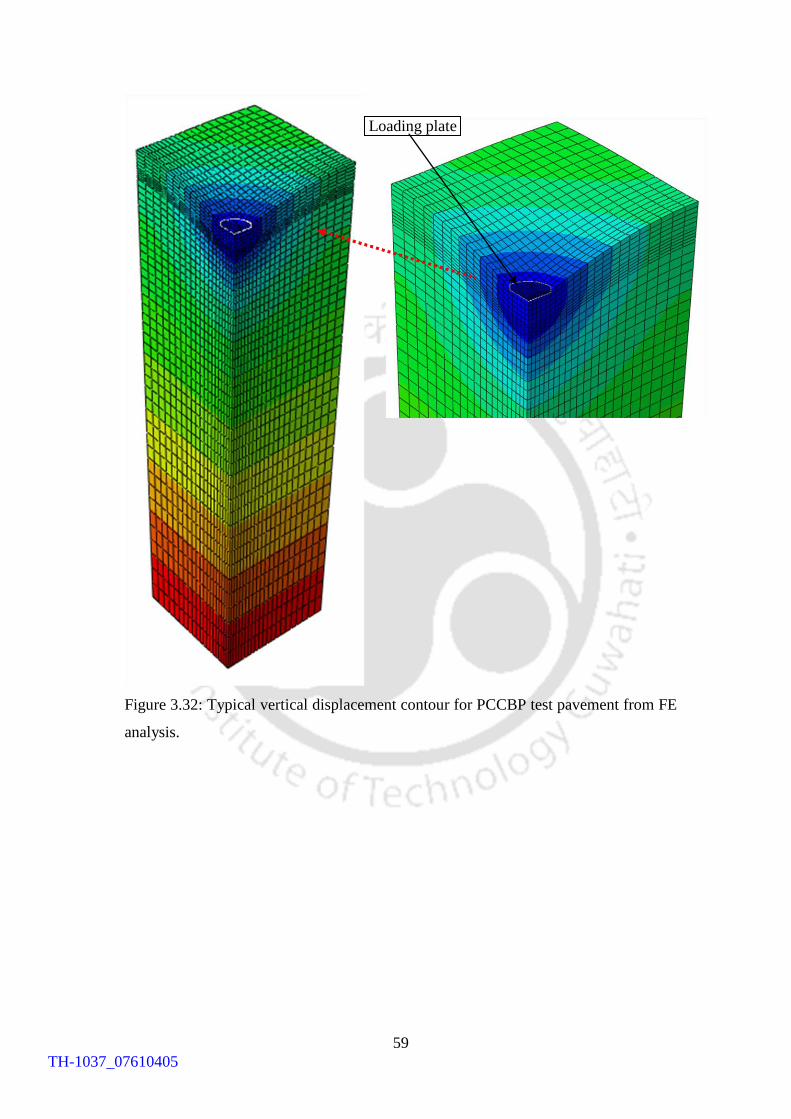
59
Figure 3.32: Typical vertical displacement contour for PCCBP test pavement from FE
analysis.
Loading plate
TH-1037_07610405
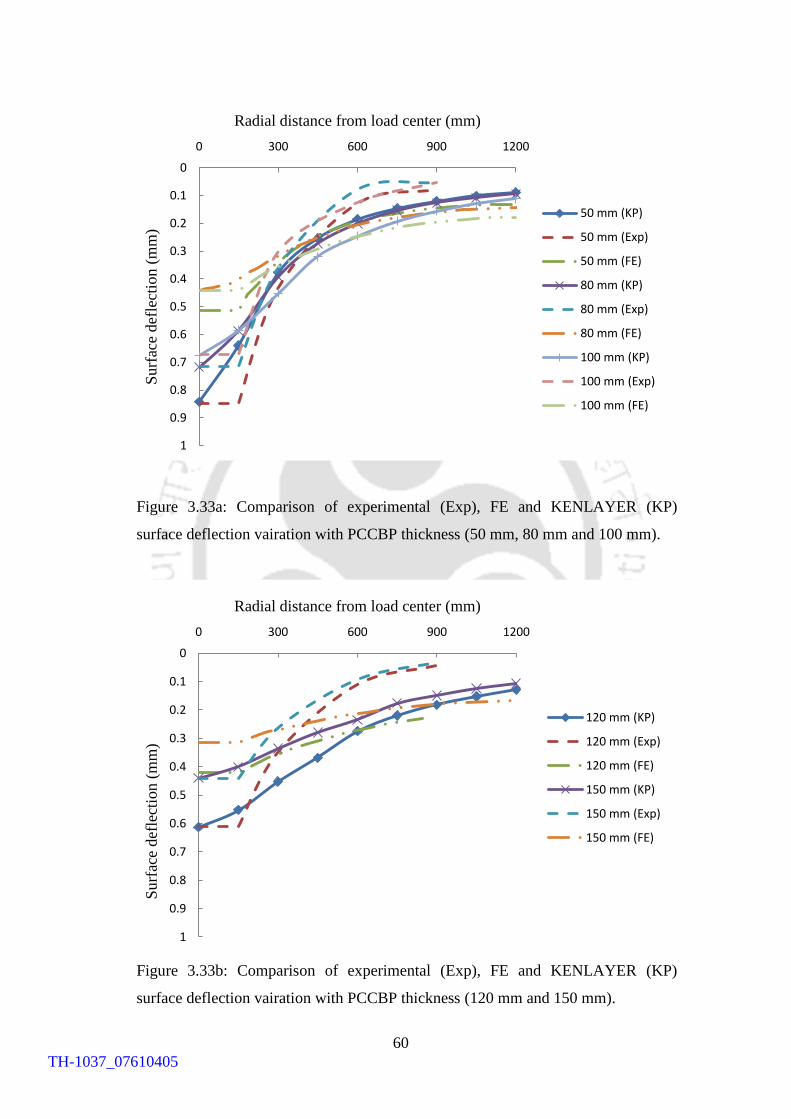
60
Figure 3.33a: Comparison of experimental (Exp), FE and KENLAYER (KP)
surface deflection vairation with PCCBP thickness (50 mm, 80 mm and 100 mm).
Figure 3.33b: Comparison of experimental (Exp), FE and KENLAYER (KP)
surface deflection vairation with PCCBP thickness (120 mm and 150 mm).
0
0.1
0.2
0.3
0.4
0.5
0.6
0.7
0.8
0.9
1
0 300 600 900 1200S
urf
ace
def
lect
ion (
mm
)
Radial distance from load center (mm)
50 mm (KP)
50 mm (Exp)
50 mm (FE)
80 mm (KP)
80 mm (Exp)
80 mm (FE)
100 mm (KP)
100 mm (Exp)
100 mm (FE)
0
0.1
0.2
0.3
0.4
0.5
0.6
0.7
0.8
0.9
1
0 300 600 900 1200
Surf
ace
def
lect
ion (
mm
)
Radial distance from load center (mm)
120 mm (KP)
120 mm (Exp)
120 mm (FE)
150 mm (KP)
150 mm (Exp)
150 mm (FE)
TH-1037_07610405
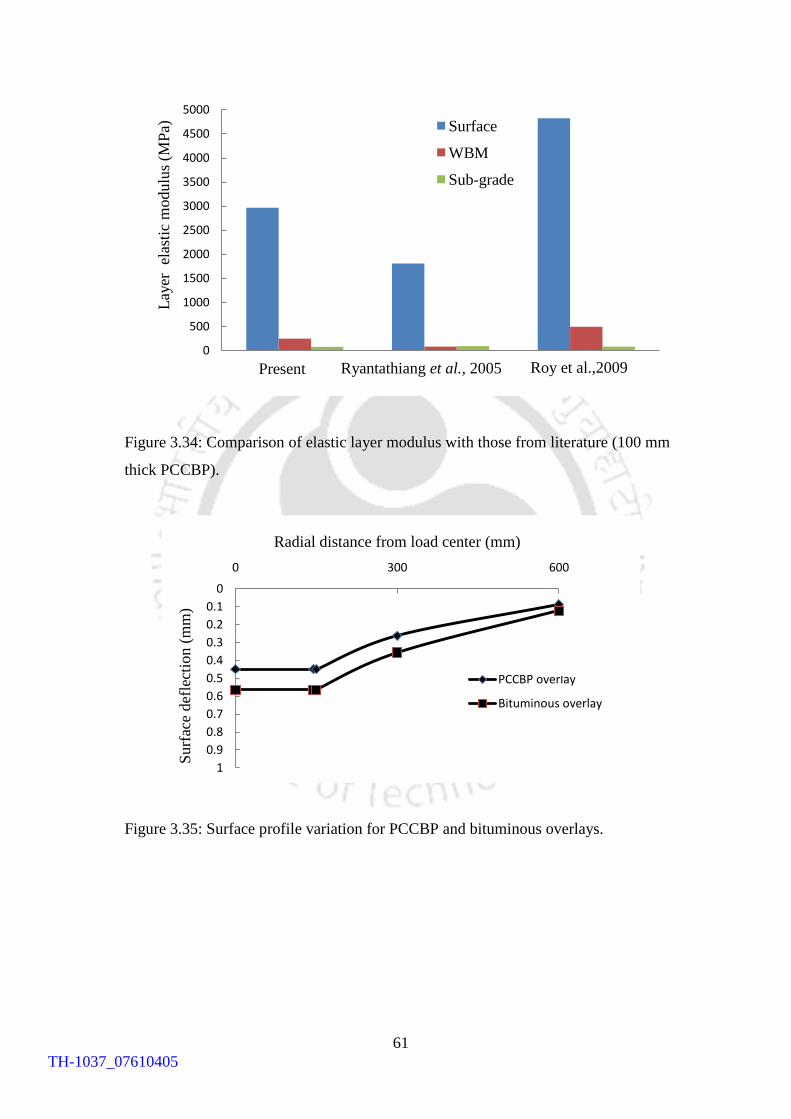
61
Figure 3.34: Comparison of elastic layer modulus with those from literature (100 mm
thick PCCBP).
Figure 3.35: Surface profile variation for PCCBP and bituminous overlays.
0
500
1000
1500
2000
2500
3000
3500
4000
4500
5000
Present Lyn Roy
Lay
er
elas
tic
mo
du
lus
(MP
a) Surface
WBM
Sub-grade
Present Roy et al.,2009
0
0.1
0.2
0.3
0.4
0.5
0.6
0.7
0.8
0.9
1
0 300 600
Surf
ace
def
lect
ion (
mm
)
Radial distance from load center (mm)
PCCBP overlay
Bituminous overlay
Ryantathiang et al., 2005
TH-1037_07610405
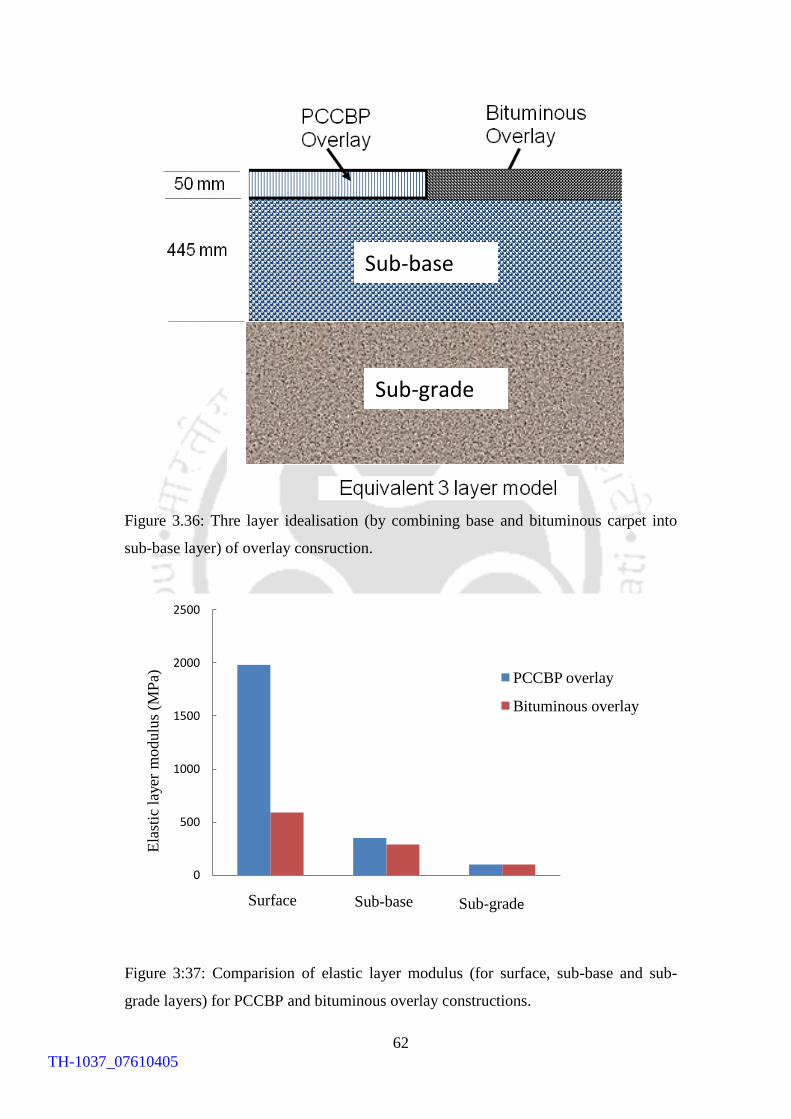
62
Figure 3.36: Thre layer idealisation (by combining base and bituminous carpet into
sub-base layer) of overlay consruction.
Figure 3:37: Comparision of elastic layer modulus (for surface, sub-base and sub-
grade layers) for PCCBP and bituminous overlay constructions.
0
500
1000
1500
2000
2500
PCCBP WBM Subgrade
Ela
stic
lay
er m
odulu
s (M
Pa) PCCBP overlay
Bituminous overlay
Surface Sub-base Sub-grade
Sub-grade
Sub-base
TH-1037_07610405
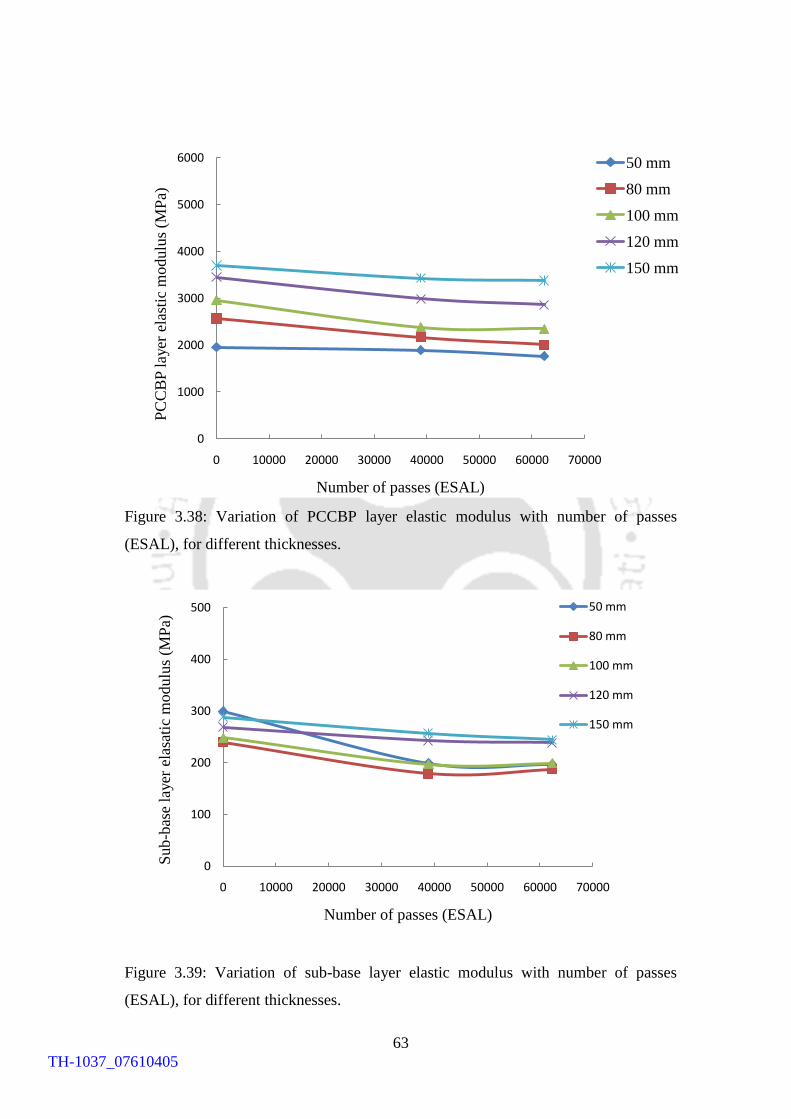
63
Figure 3.38: Variation of PCCBP layer elastic modulus with number of passes
(ESAL), for different thicknesses.
Figure 3.39: Variation of sub-base layer elastic modulus with number of passes
(ESAL), for different thicknesses.
0
1000
2000
3000
4000
5000
6000
0 10000 20000 30000 40000 50000 60000 70000
PC
CB
P l
ayer
ela
stic
modulu
s (M
Pa)
Number of passes (ESAL)
50 mm
80 mm
100 mm
120 mm
150 mm
0
100
200
300
400
500
0 10000 20000 30000 40000 50000 60000 70000
Sub
-bas
e la
yer
ela
sati
c m
odulu
s (M
Pa)
Number of passes (ESAL)
50 mm
80 mm
100 mm
120 mm
150 mm
TH-1037_07610405
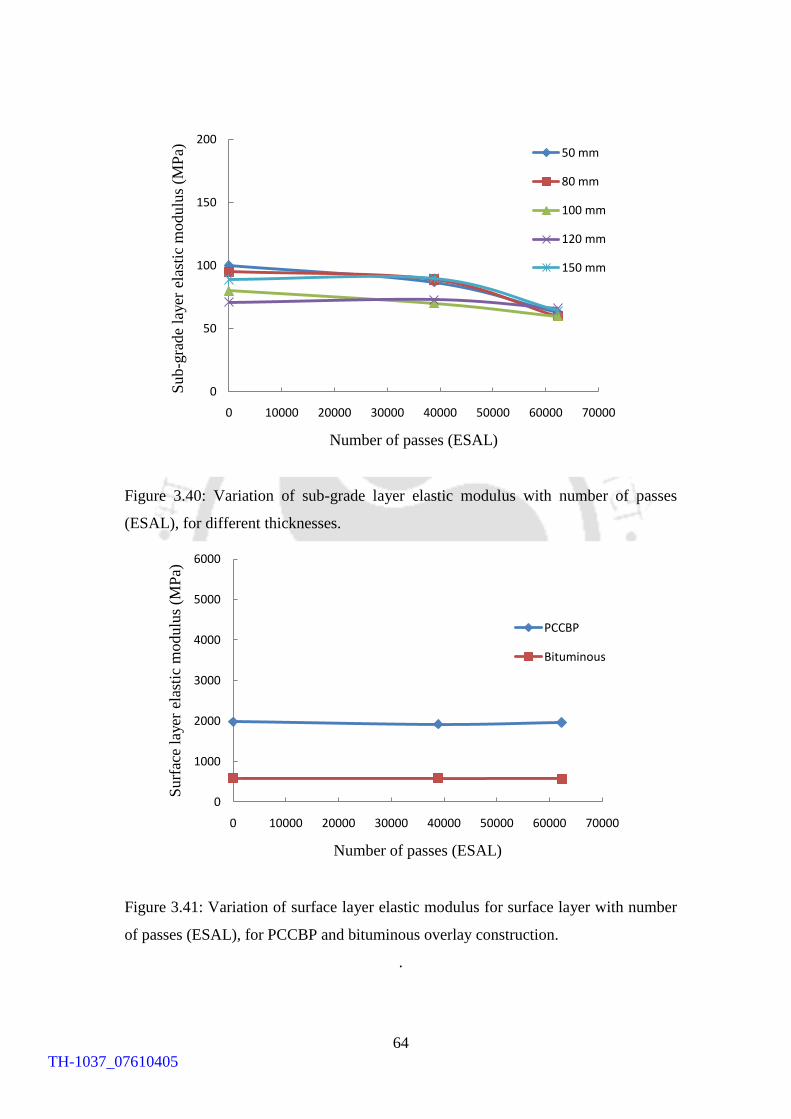
64
Figure 3.40: Variation of sub-grade layer elastic modulus with number of passes
(ESAL), for different thicknesses.
Figure 3.41: Variation of surface layer elastic modulus for surface layer with number
of passes (ESAL), for PCCBP and bituminous overlay construction.
.
0
50
100
150
200
0 10000 20000 30000 40000 50000 60000 70000
Sub
-gra
de
layer
ela
stic
modulu
s (M
Pa)
Number of passes (ESAL)
50 mm
80 mm
100 mm
120 mm
150 mm
0
1000
2000
3000
4000
5000
6000
0 10000 20000 30000 40000 50000 60000 70000
Surf
ace
layer
ela
stic
modulu
s (M
Pa)
Number of passes (ESAL)
PCCBP
Bituminous
TH-1037_07610405
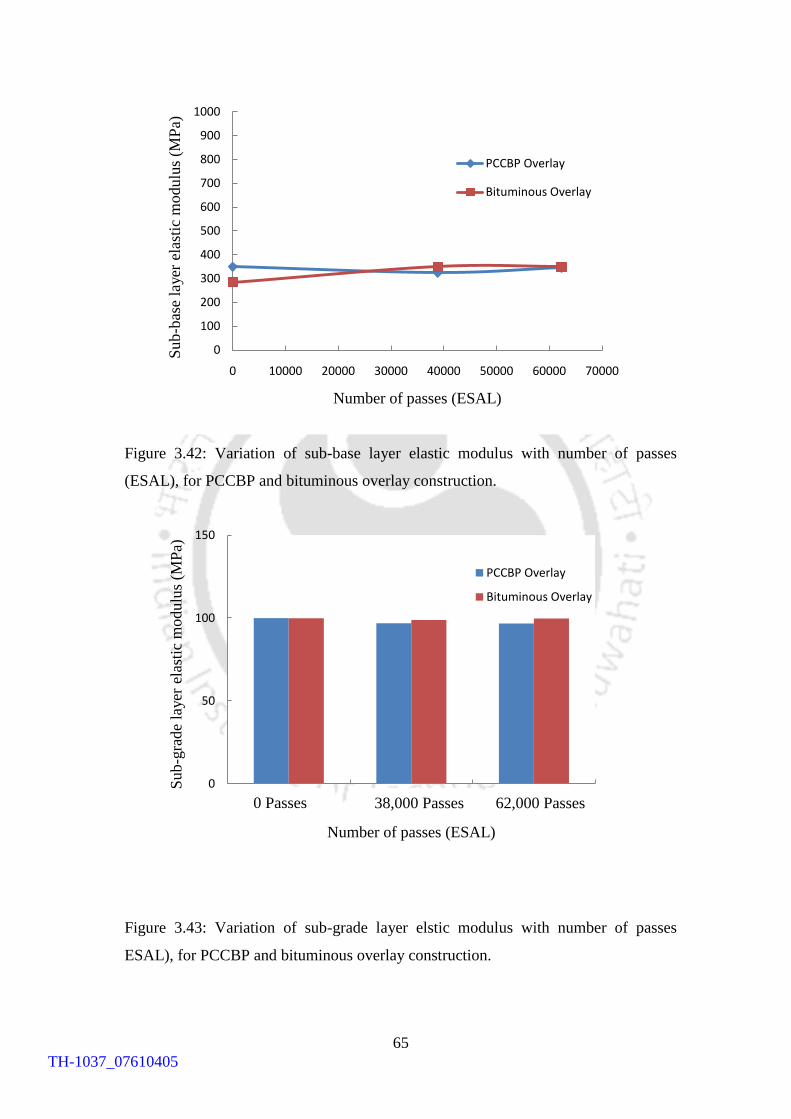
65
Figure 3.42: Variation of sub-base layer elastic modulus with number of passes
(ESAL), for PCCBP and bituminous overlay construction.
Figure 3.43: Variation of sub-grade layer elstic modulus with number of passes
ESAL), for PCCBP and bituminous overlay construction.
0
100
200
300
400
500
600
700
800
900
1000
0 10000 20000 30000 40000 50000 60000 70000
Sub
-bas
e la
yer
ela
stic
modulu
s (M
Pa)
Number of passes (ESAL)
PCCBP Overlay
Bituminous Overlay
0
50
100
150
0
Sub
-gra
de
layer
ela
stic
modulu
s (M
Pa)
Number of passes (ESAL)
PCCBP Overlay
Bituminous Overlay
0 Passes 38,000 Passes 62,000 Passes
TH-1037_07610405
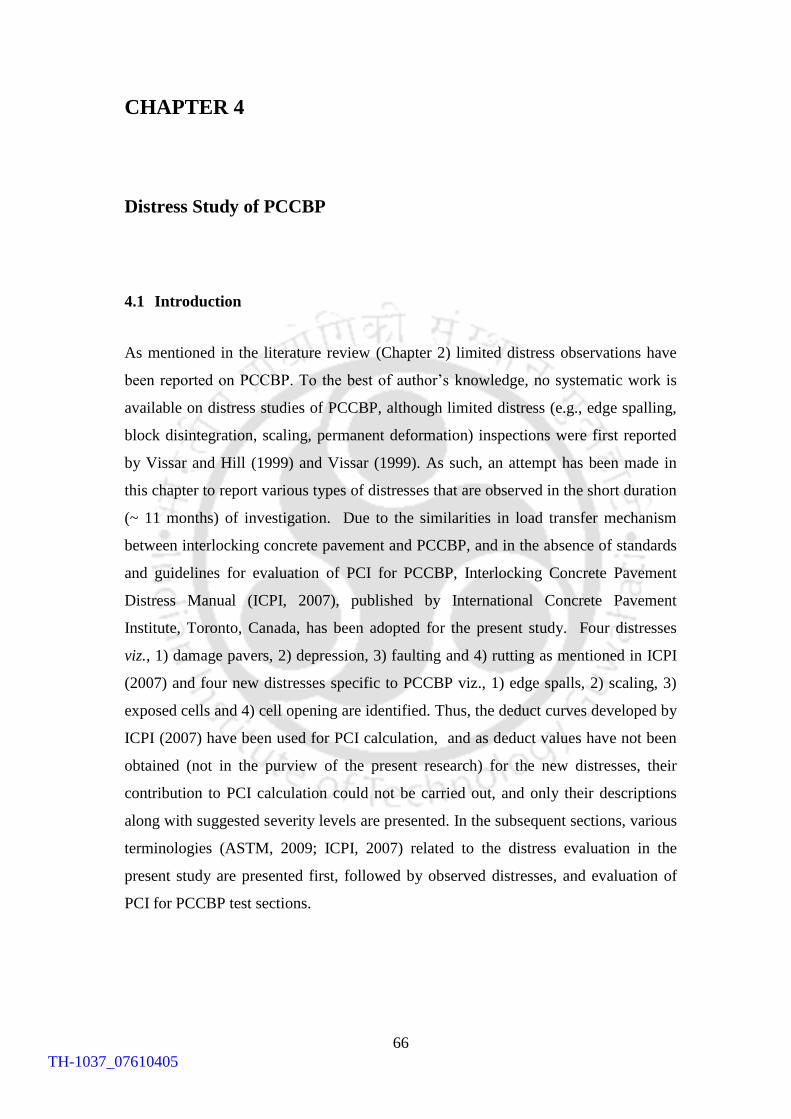
66
CHAPTER 4
Distress Study of PCCBP
4.1 Introduction
As mentioned in the literature review (Chapter 2) limited distress observations have
been reported on PCCBP. To the best of author‟s knowledge, no systematic work is
available on distress studies of PCCBP, although limited distress (e.g., edge spalling,
block disintegration, scaling, permanent deformation) inspections were first reported
by Vissar and Hill (1999) and Vissar (1999). As such, an attempt has been made in
this chapter to report various types of distresses that are observed in the short duration
(~ 11 months) of investigation. Due to the similarities in load transfer mechanism
between interlocking concrete pavement and PCCBP, and in the absence of standards
and guidelines for evaluation of PCI for PCCBP, Interlocking Concrete Pavement
Distress Manual (ICPI, 2007), published by International Concrete Pavement
Institute, Toronto, Canada, has been adopted for the present study. Four distresses
viz., 1) damage pavers, 2) depression, 3) faulting and 4) rutting as mentioned in ICPI
(2007) and four new distresses specific to PCCBP viz., 1) edge spalls, 2) scaling, 3)
exposed cells and 4) cell opening are identified. Thus, the deduct curves developed by
ICPI (2007) have been used for PCI calculation, and as deduct values have not been
obtained (not in the purview of the present research) for the new distresses, their
contribution to PCI calculation could not be carried out, and only their descriptions
along with suggested severity levels are presented. In the subsequent sections, various
terminologies (ASTM, 2009; ICPI, 2007) related to the distress evaluation in the
present study are presented first, followed by observed distresses, and evaluation of
PCI for PCCBP test sections.
TH-1037_07610405
67
4.2 Terminology
1) Pavement distress:
External indicators of pavement deterioration caused by loading, environmental
factors, construction deficiencies, or a combination thereof. Typical distresses are
depressions, rutting and edge spalls of the test section.
2) Pavement Condition Index (PCI):
It is a numerical rating of the pavement condition that ranges from 0 to 100 with 0
being the worst possible condition and 100 being the best possible condition. It may
be noted that PCI does not measure structural capacity nor does it provides direct
measurement of skid resistance or roughness. The basic flowchart for developing the
PCI values for a section of pavement is shown in Figure 4.1
3) Pavement Condition Rating (PCR):
It is a description of pavement condition as a function of the PCI value that varies
from failed to excellent as shown in Figure 4.1.
4) Random Sample:
A sample unit of the pavement section selected for inspection by random sampling
techniques.
5) Apparatus used:
Data Sheets that record at a minimum the following information: date, location,
section, sample unit size, block number and size, distress types, severity levels,
quantities, and names of surveyors (Appendix E).
Tape, 100 feet long (30 m) that reads up to 1 inch.
Straightedge or string line, 10 feet (~3 m), aluminum square hollow section (50
mm x 50 mm) and 3 meter in length and string line for length of distress area
which are more than 3 meter.
TH-1037_07610405
68
Scale, 12 in. (300 mm) that reads to 1⁄16 in. (1 mm) or better. Additional 12
inches. (300 mm) ruler or straightedge.
Layout plan, for PCCBP test sections.
4.3 Distress Evaluation
Separate distresses observations have been presented for the two types of PCCBP
constructions viz., 1) new PCCBP test sections and 2) overlay construction over
bituminous surface.
4.3.1 New PCCBP test section
The type and severity of PCCBP distress was assessed by direct visual inspection and
physical measurement of rutting and depressions of test sections (2.7 m x 5.0 m)
having different thicknesses (50 mm, 80 mm, 100 mm, 120 mm and 150 mm laid over
100 mm thick WBM course). The performance study was carried out for a short
duration (~ 11 months). A preliminary visual observation shows a zone of major
traffic flow (wheel path) ~2500 mm closer to the inner portion of the test section (total
road width is 7 meter) as shown in Figure 4.2. Visual evaluations as well as field
measurements were carried out at 0 (zero), 23000, 50000 and 62,000 ESAL passes
(Figure 4.3). Figure 4.3 shows the gradual surface degradation through edge spalls
and exposure of plastic cells (more discussion on Section 4.4) of different test sections
with number of load repetitions (ESAL).
4.3.1.1 Distress types similar to Interlocking concrete block pavement distress
manual (ICPI, 2007)
The typical distress types identified in the present study which are similar to
interlocking concrete block pavement are:
1. Rutting
2. Damage pavers
3. Depression
4. Faulting
TH-1037_07610405
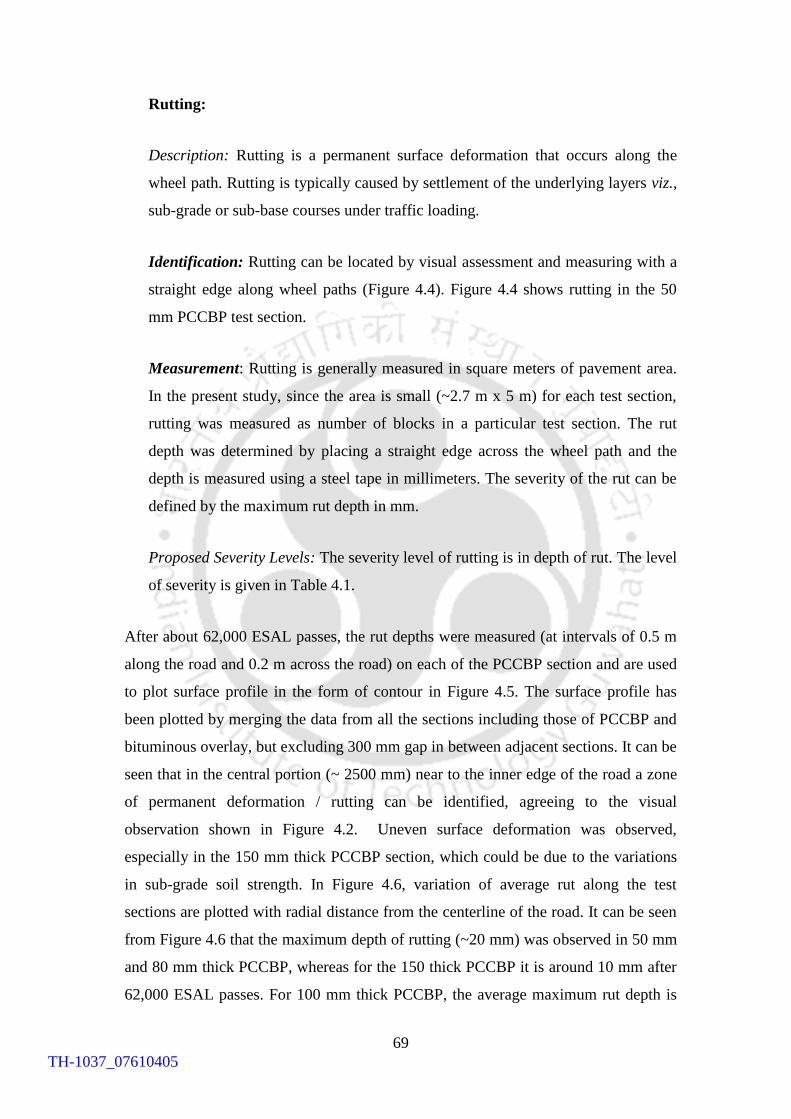
69
Rutting:
Description: Rutting is a permanent surface deformation that occurs along the
wheel path. Rutting is typically caused by settlement of the underlying layers viz.,
sub-grade or sub-base courses under traffic loading.
Identification: Rutting can be located by visual assessment and measuring with a
straight edge along wheel paths (Figure 4.4). Figure 4.4 shows rutting in the 50
mm PCCBP test section.
Measurement: Rutting is generally measured in square meters of pavement area.
In the present study, since the area is small (~2.7 m x 5 m) for each test section,
rutting was measured as number of blocks in a particular test section. The rut
depth was determined by placing a straight edge across the wheel path and the
depth is measured using a steel tape in millimeters. The severity of the rut can be
defined by the maximum rut depth in mm.
Proposed Severity Levels: The severity level of rutting is in depth of rut. The level
of severity is given in Table 4.1.
After about 62,000 ESAL passes, the rut depths were measured (at intervals of 0.5 m
along the road and 0.2 m across the road) on each of the PCCBP section and are used
to plot surface profile in the form of contour in Figure 4.5. The surface profile has
been plotted by merging the data from all the sections including those of PCCBP and
bituminous overlay, but excluding 300 mm gap in between adjacent sections. It can be
seen that in the central portion (~ 2500 mm) near to the inner edge of the road a zone
of permanent deformation / rutting can be identified, agreeing to the visual
observation shown in Figure 4.2. Uneven surface deformation was observed,
especially in the 150 mm thick PCCBP section, which could be due to the variations
in sub-grade soil strength. In Figure 4.6, variation of average rut along the test
sections are plotted with radial distance from the centerline of the road. It can be seen
from Figure 4.6 that the maximum depth of rutting (~20 mm) was observed in 50 mm
and 80 mm thick PCCBP, whereas for the 150 thick PCCBP it is around 10 mm after
62,000 ESAL passes. For 100 mm thick PCCBP, the average maximum rut depth is
TH-1037_07610405
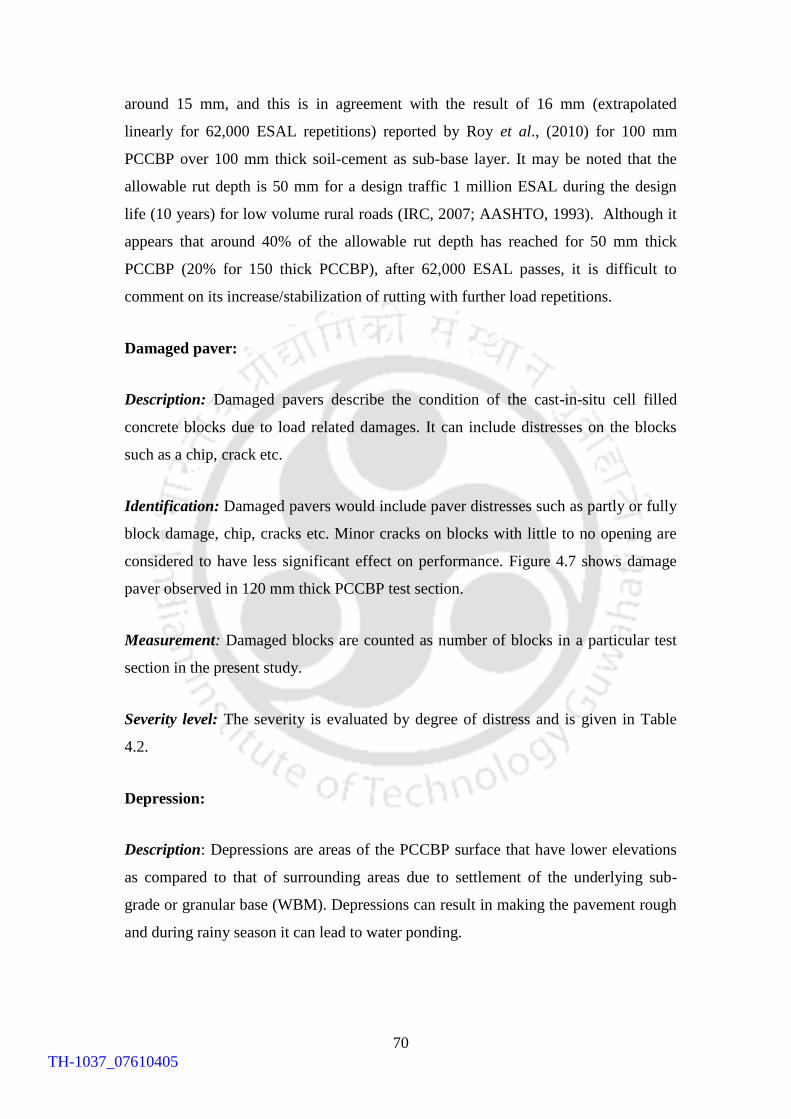
70
around 15 mm, and this is in agreement with the result of 16 mm (extrapolated
linearly for 62,000 ESAL repetitions) reported by Roy et al., (2010) for 100 mm
PCCBP over 100 mm thick soil-cement as sub-base layer. It may be noted that the
allowable rut depth is 50 mm for a design traffic 1 million ESAL during the design
life (10 years) for low volume rural roads (IRC, 2007; AASHTO, 1993). Although it
appears that around 40% of the allowable rut depth has reached for 50 mm thick
PCCBP (20% for 150 thick PCCBP), after 62,000 ESAL passes, it is difficult to
comment on its increase/stabilization of rutting with further load repetitions.
Damaged paver:
Description: Damaged pavers describe the condition of the cast-in-situ cell filled
concrete blocks due to load related damages. It can include distresses on the blocks
such as a chip, crack etc.
Identification: Damaged pavers would include paver distresses such as partly or fully
block damage, chip, cracks etc. Minor cracks on blocks with little to no opening are
considered to have less significant effect on performance. Figure 4.7 shows damage
paver observed in 120 mm thick PCCBP test section.
Measurement: Damaged blocks are counted as number of blocks in a particular test
section in the present study.
Severity level: The severity is evaluated by degree of distress and is given in Table
4.2.
Depression:
Description: Depressions are areas of the PCCBP surface that have lower elevations
as compared to that of surrounding areas due to settlement of the underlying sub-
grade or granular base (WBM). Depressions can result in making the pavement rough
and during rainy season it can lead to water ponding.
TH-1037_07610405
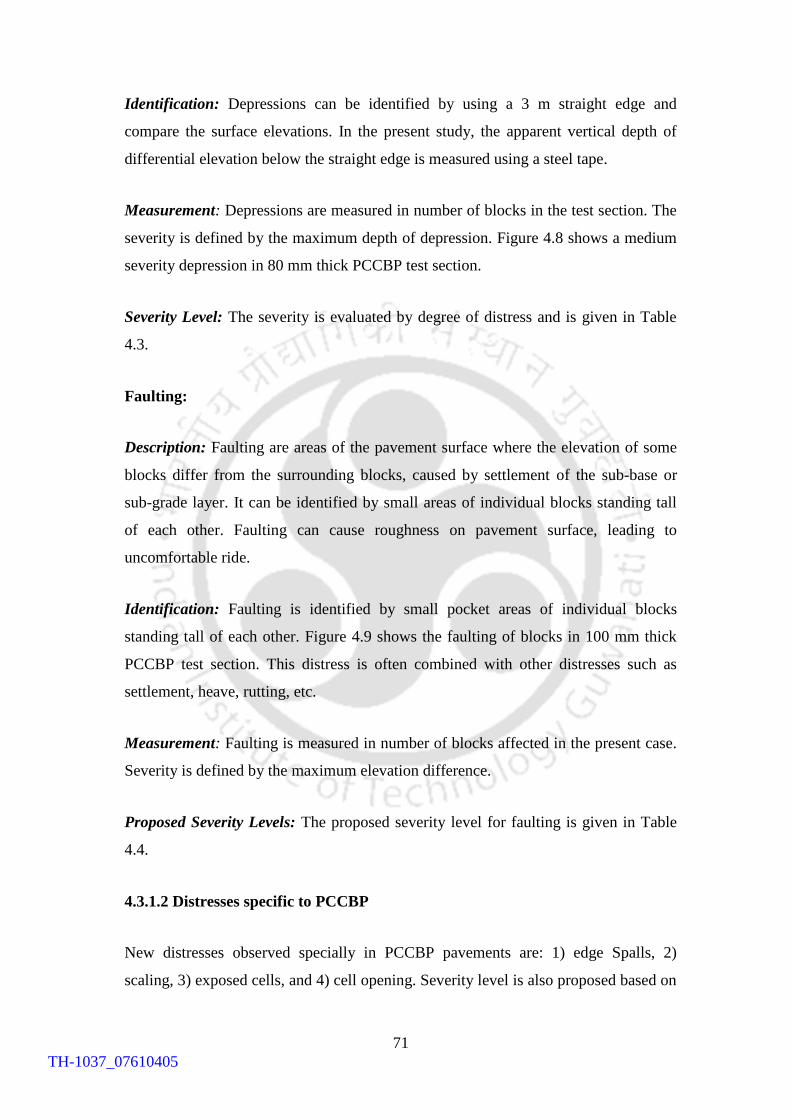
71
Identification: Depressions can be identified by using a 3 m straight edge and
compare the surface elevations. In the present study, the apparent vertical depth of
differential elevation below the straight edge is measured using a steel tape.
Measurement: Depressions are measured in number of blocks in the test section. The
severity is defined by the maximum depth of depression. Figure 4.8 shows a medium
severity depression in 80 mm thick PCCBP test section.
Severity Level: The severity is evaluated by degree of distress and is given in Table
4.3.
Faulting:
Description: Faulting are areas of the pavement surface where the elevation of some
blocks differ from the surrounding blocks, caused by settlement of the sub-base or
sub-grade layer. It can be identified by small areas of individual blocks standing tall
of each other. Faulting can cause roughness on pavement surface, leading to
uncomfortable ride.
Identification: Faulting is identified by small pocket areas of individual blocks
standing tall of each other. Figure 4.9 shows the faulting of blocks in 100 mm thick
PCCBP test section. This distress is often combined with other distresses such as
settlement, heave, rutting, etc.
Measurement: Faulting is measured in number of blocks affected in the present case.
Severity is defined by the maximum elevation difference.
Proposed Severity Levels: The proposed severity level for faulting is given in Table
4.4.
4.3.1.2 Distresses specific to PCCBP
New distresses observed specially in PCCBP pavements are: 1) edge Spalls, 2)
scaling, 3) exposed cells, and 4) cell opening. Severity level is also proposed based on
TH-1037_07610405
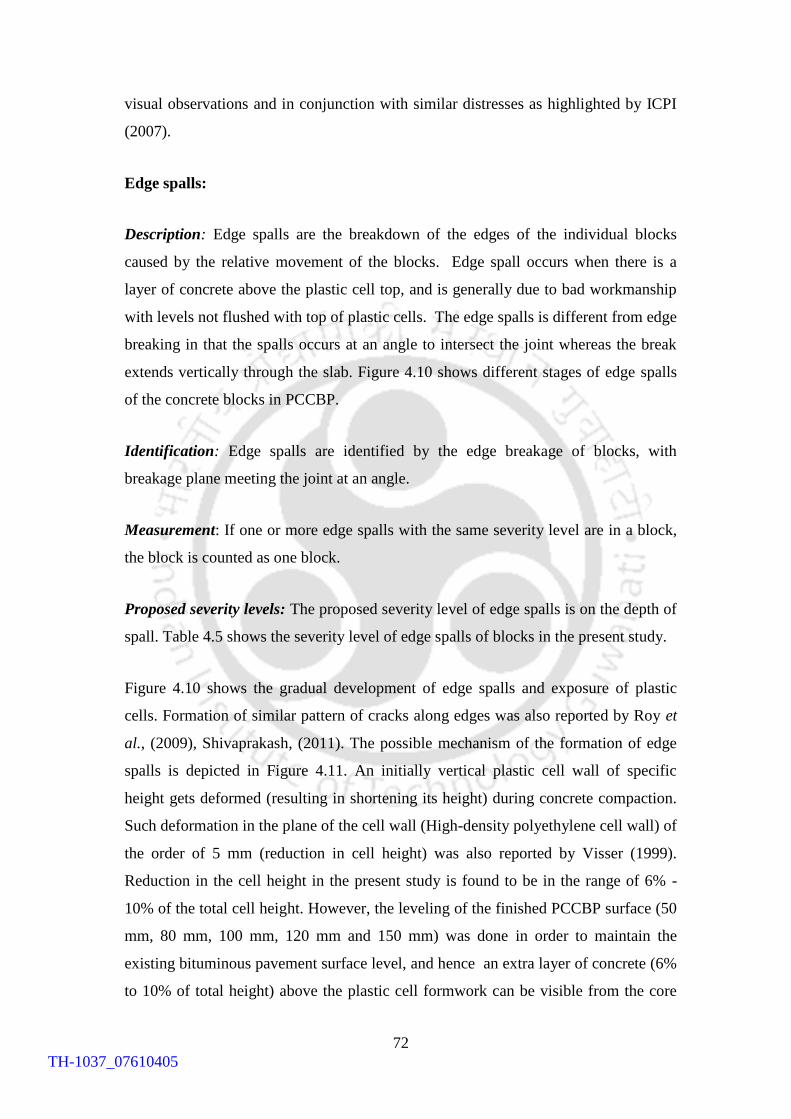
72
visual observations and in conjunction with similar distresses as highlighted by ICPI
(2007).
Edge spalls:
Description: Edge spalls are the breakdown of the edges of the individual blocks
caused by the relative movement of the blocks. Edge spall occurs when there is a
layer of concrete above the plastic cell top, and is generally due to bad workmanship
with levels not flushed with top of plastic cells. The edge spalls is different from edge
breaking in that the spalls occurs at an angle to intersect the joint whereas the break
extends vertically through the slab. Figure 4.10 shows different stages of edge spalls
of the concrete blocks in PCCBP.
Identification: Edge spalls are identified by the edge breakage of blocks, with
breakage plane meeting the joint at an angle.
Measurement: If one or more edge spalls with the same severity level are in a block,
the block is counted as one block.
Proposed severity levels: The proposed severity level of edge spalls is on the depth of
spall. Table 4.5 shows the severity level of edge spalls of blocks in the present study.
Figure 4.10 shows the gradual development of edge spalls and exposure of plastic
cells. Formation of similar pattern of cracks along edges was also reported by Roy et
al., (2009), Shivaprakash, (2011). The possible mechanism of the formation of edge
spalls is depicted in Figure 4.11. An initially vertical plastic cell wall of specific
height gets deformed (resulting in shortening its height) during concrete compaction.
Such deformation in the plane of the cell wall (High-density polyethylene cell wall) of
the order of 5 mm (reduction in cell height) was also reported by Visser (1999).
Reduction in the cell height in the present study is found to be in the range of 6% -
10% of the total cell height. However, the leveling of the finished PCCBP surface (50
mm, 80 mm, 100 mm, 120 mm and 150 mm) was done in order to maintain the
existing bituminous pavement surface level, and hence an extra layer of concrete (6%
to 10% of total height) above the plastic cell formwork can be visible from the core
TH-1037_07610405
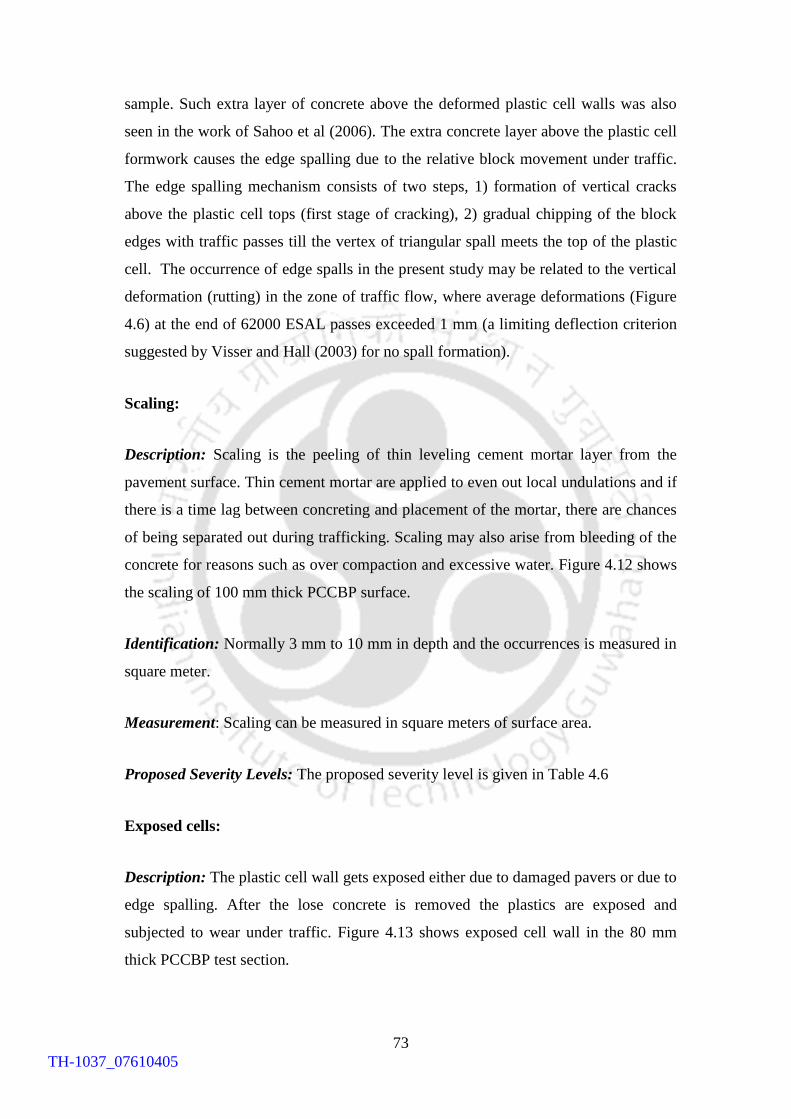
73
sample. Such extra layer of concrete above the deformed plastic cell walls was also
seen in the work of Sahoo et al (2006). The extra concrete layer above the plastic cell
formwork causes the edge spalling due to the relative block movement under traffic.
The edge spalling mechanism consists of two steps, 1) formation of vertical cracks
above the plastic cell tops (first stage of cracking), 2) gradual chipping of the block
edges with traffic passes till the vertex of triangular spall meets the top of the plastic
cell. The occurrence of edge spalls in the present study may be related to the vertical
deformation (rutting) in the zone of traffic flow, where average deformations (Figure
4.6) at the end of 62000 ESAL passes exceeded 1 mm (a limiting deflection criterion
suggested by Visser and Hall (2003) for no spall formation).
Scaling:
Description: Scaling is the peeling of thin leveling cement mortar layer from the
pavement surface. Thin cement mortar are applied to even out local undulations and if
there is a time lag between concreting and placement of the mortar, there are chances
of being separated out during trafficking. Scaling may also arise from bleeding of the
concrete for reasons such as over compaction and excessive water. Figure 4.12 shows
the scaling of 100 mm thick PCCBP surface.
Identification: Normally 3 mm to 10 mm in depth and the occurrences is measured in
square meter.
Measurement: Scaling can be measured in square meters of surface area.
Proposed Severity Levels: The proposed severity level is given in Table 4.6
Exposed cells:
Description: The plastic cell wall gets exposed either due to damaged pavers or due to
edge spalling. After the lose concrete is removed the plastics are exposed and
subjected to wear under traffic. Figure 4.13 shows exposed cell wall in the 80 mm
thick PCCBP test section.
TH-1037_07610405
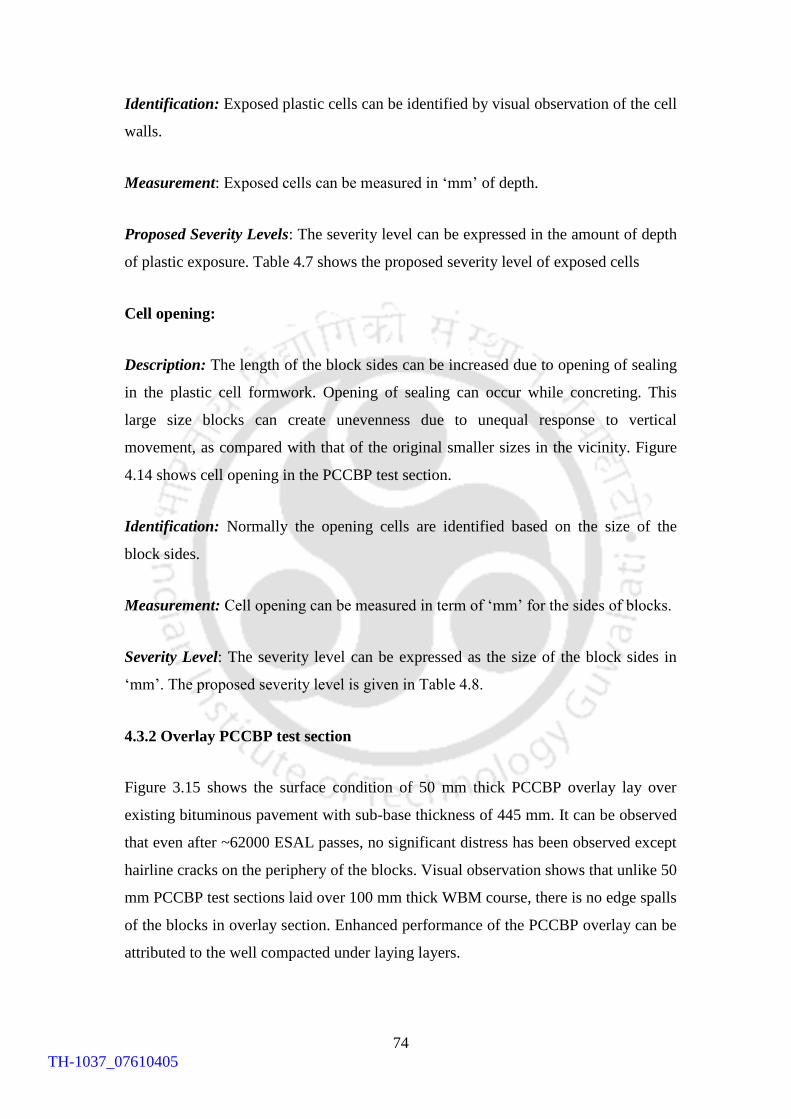
74
Identification: Exposed plastic cells can be identified by visual observation of the cell
walls.
Measurement: Exposed cells can be measured in „mm‟ of depth.
Proposed Severity Levels: The severity level can be expressed in the amount of depth
of plastic exposure. Table 4.7 shows the proposed severity level of exposed cells
Cell opening:
Description: The length of the block sides can be increased due to opening of sealing
in the plastic cell formwork. Opening of sealing can occur while concreting. This
large size blocks can create unevenness due to unequal response to vertical
movement, as compared with that of the original smaller sizes in the vicinity. Figure
4.14 shows cell opening in the PCCBP test section.
Identification: Normally the opening cells are identified based on the size of the
block sides.
Measurement: Cell opening can be measured in term of „mm‟ for the sides of blocks.
Severity Level: The severity level can be expressed as the size of the block sides in
„mm‟. The proposed severity level is given in Table 4.8.
4.3.2 Overlay PCCBP test section
Figure 3.15 shows the surface condition of 50 mm thick PCCBP overlay lay over
existing bituminous pavement with sub-base thickness of 445 mm. It can be observed
that even after ~62000 ESAL passes, no significant distress has been observed except
hairline cracks on the periphery of the blocks. Visual observation shows that unlike 50
mm PCCBP test sections laid over 100 mm thick WBM course, there is no edge spalls
of the blocks in overlay section. Enhanced performance of the PCCBP overlay can be
attributed to the well compacted under laying layers.
TH-1037_07610405
75
4.4 Evaluation of PCI
4.4.1 Measuring Techniques
The measuring technique adopted in the present study follows the guidelines laid
down by ICPI (2007) for distress measurement of interlocking concrete block
pavement. Linear measurements were done using a measuring tape (30 meter).
However, as the size of the test pavement is small, instead of measuring the distress
areas, affected number of blocks is counted. Hollow square aluminum pipe of 50 mm
x 50 mm (~ 2´´ x 2´´) and 3 meter (10 feet) long was used as straightedge. Vertical
measurements under a straightedge were done using a steel tape that can read up to 1
mm (1/16 inch). Depressions and ruts were measured to where the straight edge meets
the pavement surface. For each test section, the quantities of different distress and
their severities level were recorded based on visual justification. Where multiple
severities exist within the outer boundary of a distress, outline of each severity is
identified and running subtotal of each of the severities were noted.
4.4.2 Different thickness of PCCBP
The evaluation of distress in the present study was carried out based on the PCI
methodology. Flow chart showing the calculation of PCI for PCCBP test section is
given in Figure 4.16. The area to be surveyed (different test sections) was marked
properly and the survey was carried out using pavement condition survey data sheet
prepared by ICPI (Appendix E) following the measurement technique mentioned in
Section 4.4.1. Table 4.9 shows different types of distress and their severity levels
which were observed in different PCCBP test sections. The total severity of each
distress type is recorded in number of affected blocks and the percentage density has
been calculated as a fraction of total number of blocks in the sample unit. The deduct
value is then calculated from the deduct curves (Figure 4.17 to Figure 4.20) for each
type of distress (ICPI, 2007). For calculation of the maximum corrected deduct value
(CDV), the iterative method described by ICPI (2007) was followed. The value of q,
which is the number of deducts greater than 2 was calculated. Using the value of q
and total deduct value the CDV has been calculated from the corrected deduct value
curve given in Figure 4.21. The PCI for each test section was calculated by
TH-1037_07610405
76
subtracting the maximum corrected deduct value (CDV) from 100: 100 – Maximum
CDV = PCI. A sample PCI calculation sheets is given in Appendix F. The overall
condition rating of the section is evaluated from the PCI rating chart given in Figure
4.1. Table 4.10 shows the PCI value and overall rating of each test section.
4.4.3 PCCBP overlay
Visual observation shows that there are no distinct distresses observed in the PCCBP
overlay test section. However, PCI value was calculated in the similar manner and is
presented in Table 4.10.
4.5 Discussions
Studies on various types of distress carried out as per ICPI distress guide lines (ICPI,
2007) based on the deduct value and PCI values showed that different thicknesses of
PCCBP test section can be rated as Fair to Very Good (Table 4.10). Comparing the
PCI rating with variation in layer elastic modulus of PCCBP (Figure 3.38), it has been
observed that 50 mm, 80 mm and 100 mm thick PCCBP is rated “Fair” even though
there is no significant reduction in elastic modulus value. The reason may be edge
spalls due to extra layer of concrete (6%-10% of cell height) above the cell formwork
resulted from deformation of cell wall (Figure 4.11). In addition the PCCBP test
sections showed some specific distress types of low severity like cell opening,
exposed cells, edge spalls etc. which are not common to interlocking concrete block
pavements. The deduct curves are yet to be developed for these new distress types
(not in the purview of the present research), and are not considered in the PCI
calculation. In an earlier study, Visser (1999) reported an initial slight spalling
(because of high deflection), but observed later that the spalling did not deteriorated
further after fifteen months. It may be noted that Visser (2003) also mentioned about
edge spalls and scaling but no detail study was reported. Performance evaluation need
to be carried out for a longer duration and deduct curves need to be developed for
better understanding of PCCBP.
TH-1037_07610405
77
4.6 Conclusions
The main conclusions drawn from the present study are:
1. Based on the distress study of the PCCBP test sections, four distresses viz., 1)
damage pavers, 2) depression, 3) faulting and 4) rutting as mentioned in ICPI
(2007) and four new distresses specific to PCCBP viz., 1) edge spall, 2)
scaling, 3) exposed cells, and cell opening are identified.
2. Distress evaluation of PCCBP test sections (after 62,000 ESAL passes) based
on ICPI distress manual showed that 50 mm thick PCCBP can be rated as Fair
and highest thickness 150 mm PCCBP thickness can be rated as Very Good
based on pavement condition index rating chart.
3. PCCBP as overlay construction on the existing bituminous pavement shows
no significant distresses even after 62,000 ESAL load repetitions and can be
rated Excellent based on PCI rating (ICPI, 2007).
TH-1037_07610405
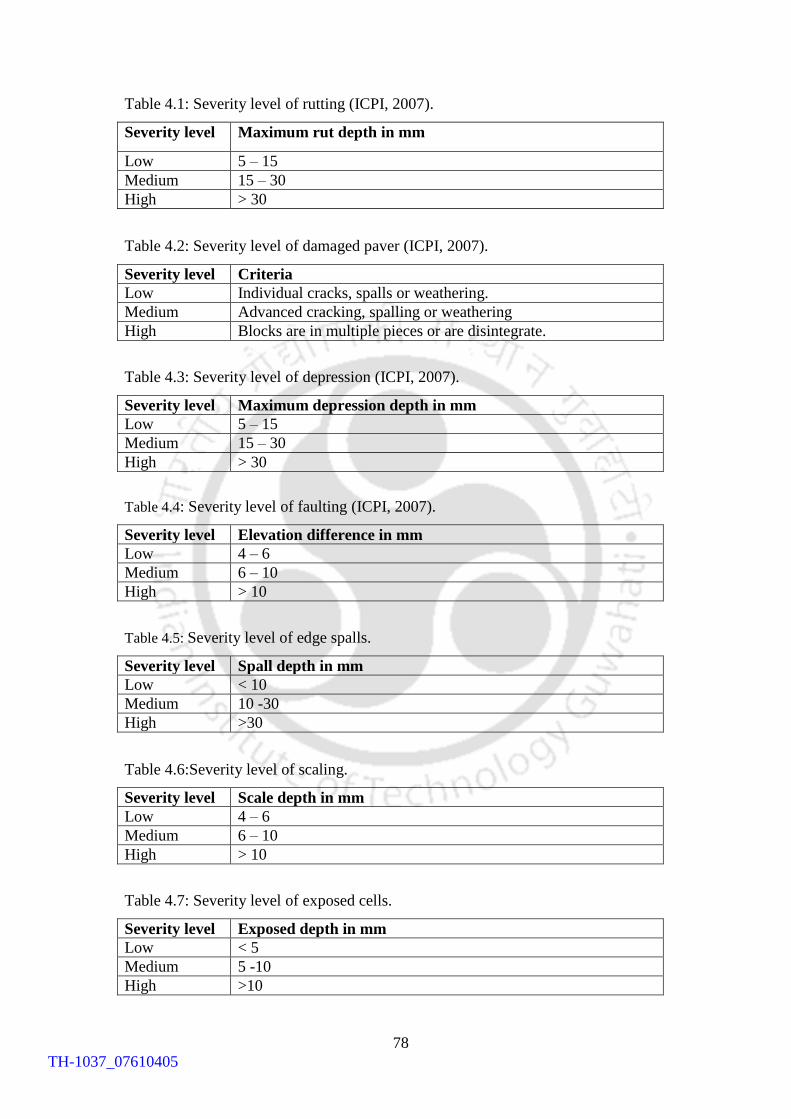
78
Table 4.1: Severity level of rutting (ICPI, 2007).
Severity level Maximum rut depth in mm
Low 5 – 15
Medium 15 – 30
High > 30
Table 4.2: Severity level of damaged paver (ICPI, 2007).
Severity level Criteria
Low Individual cracks, spalls or weathering.
Medium Advanced cracking, spalling or weathering
High Blocks are in multiple pieces or are disintegrate.
Table 4.3: Severity level of depression (ICPI, 2007).
Severity level Maximum depression depth in mm
Low 5 – 15
Medium 15 – 30
High > 30
Table 4.4: Severity level of faulting (ICPI, 2007).
Severity level Elevation difference in mm
Low 4 – 6
Medium 6 – 10
High > 10
Table 4.5: Severity level of edge spalls.
Severity level Spall depth in mm
Low < 10
Medium 10 -30
High >30
Table 4.6:Severity level of scaling.
Severity level Scale depth in mm
Low 4 – 6
Medium 6 – 10
High > 10
Table 4.7: Severity level of exposed cells.
Severity level Exposed depth in mm
Low < 5
Medium 5 -10
High >10
TH-1037_07610405
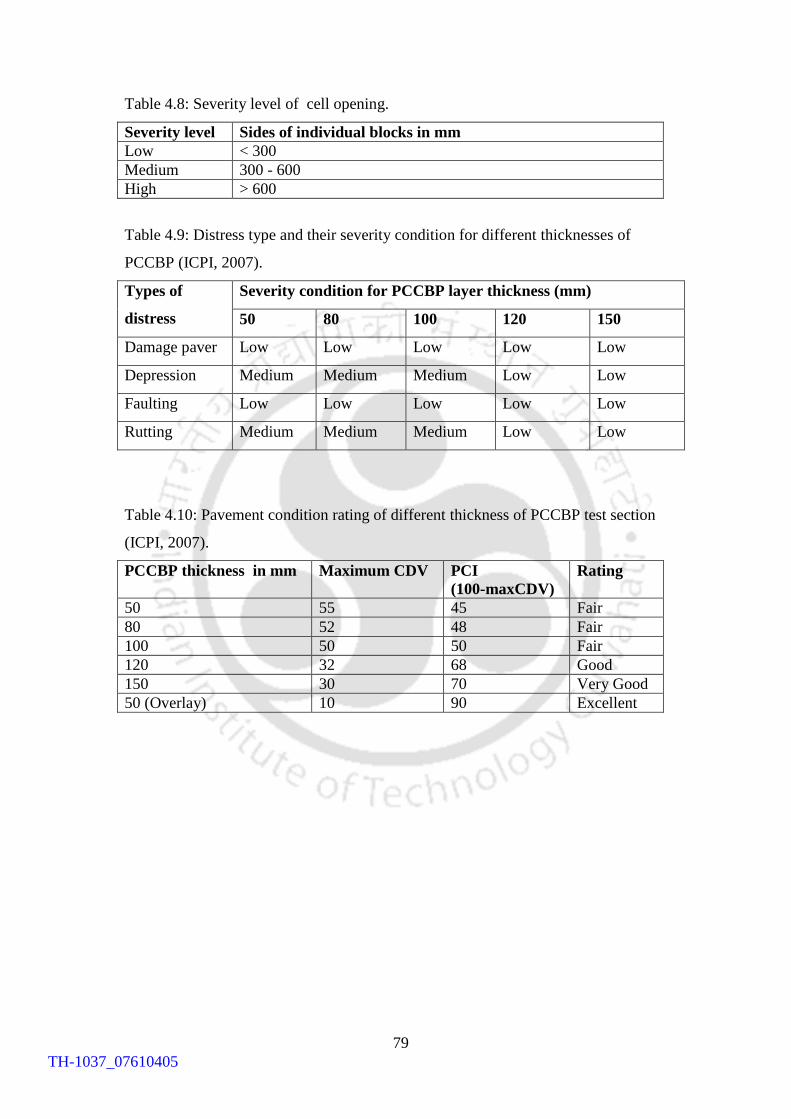
79
Table 4.8: Severity level of cell opening.
Severity level Sides of individual blocks in mm
Low < 300
Medium 300 - 600
High > 600
Table 4.9: Distress type and their severity condition for different thicknesses of
PCCBP (ICPI, 2007).
Types of
distress
Severity condition for PCCBP layer thickness (mm)
50 80 100 120 150
Damage paver Low Low Low Low Low
Depression Medium Medium Medium Low Low
Faulting Low Low Low Low Low
Rutting Medium Medium Medium Low Low
Table 4.10: Pavement condition rating of different thickness of PCCBP test section
(ICPI, 2007).
PCCBP thickness in mm Maximum CDV PCI
(100-maxCDV)
Rating
50 55 45 Fair
80 52 48 Fair
100 50 50 Fair
120 32 68 Good
150 30 70 Very Good
50 (Overlay) 10 90 Excellent
TH-1037_07610405
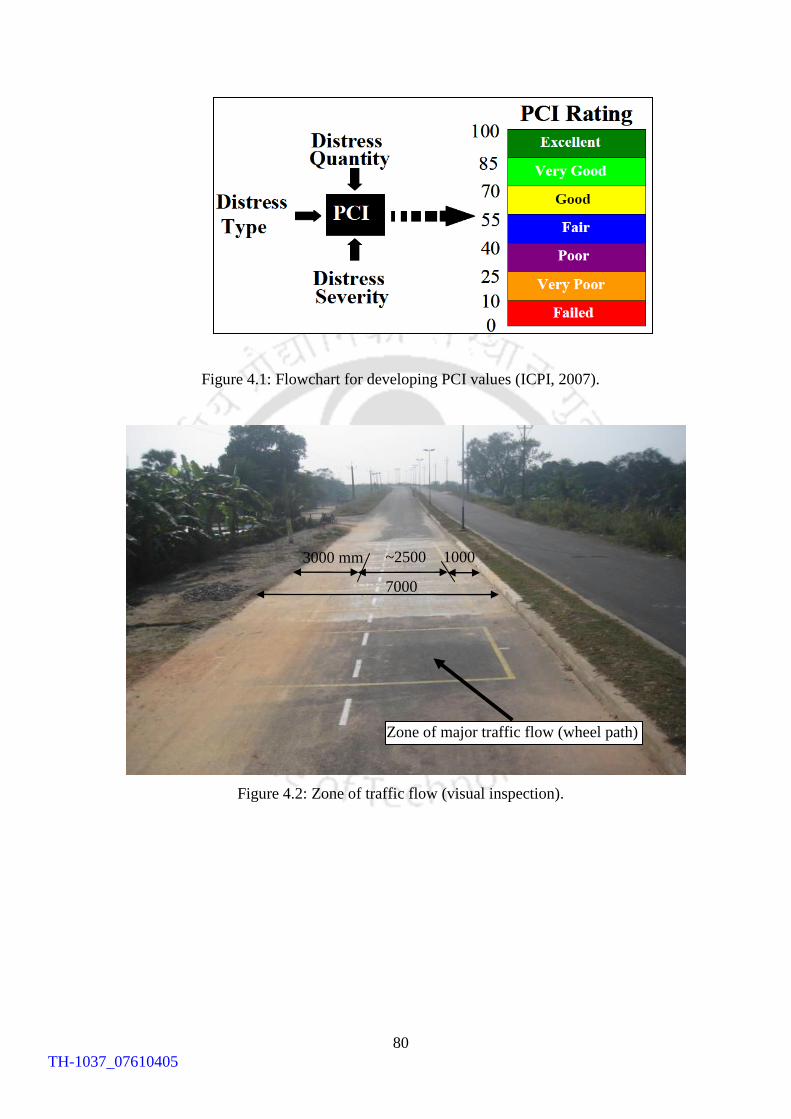
80
Figure 4.1: Flowchart for developing PCI values (ICPI, 2007).
Figure 4.2: Zone of traffic flow (visual inspection).
1000
mm
~2500
mm 3000 mm
7000
mm
Zone of major traffic flow (wheel path)
TH-1037_07610405
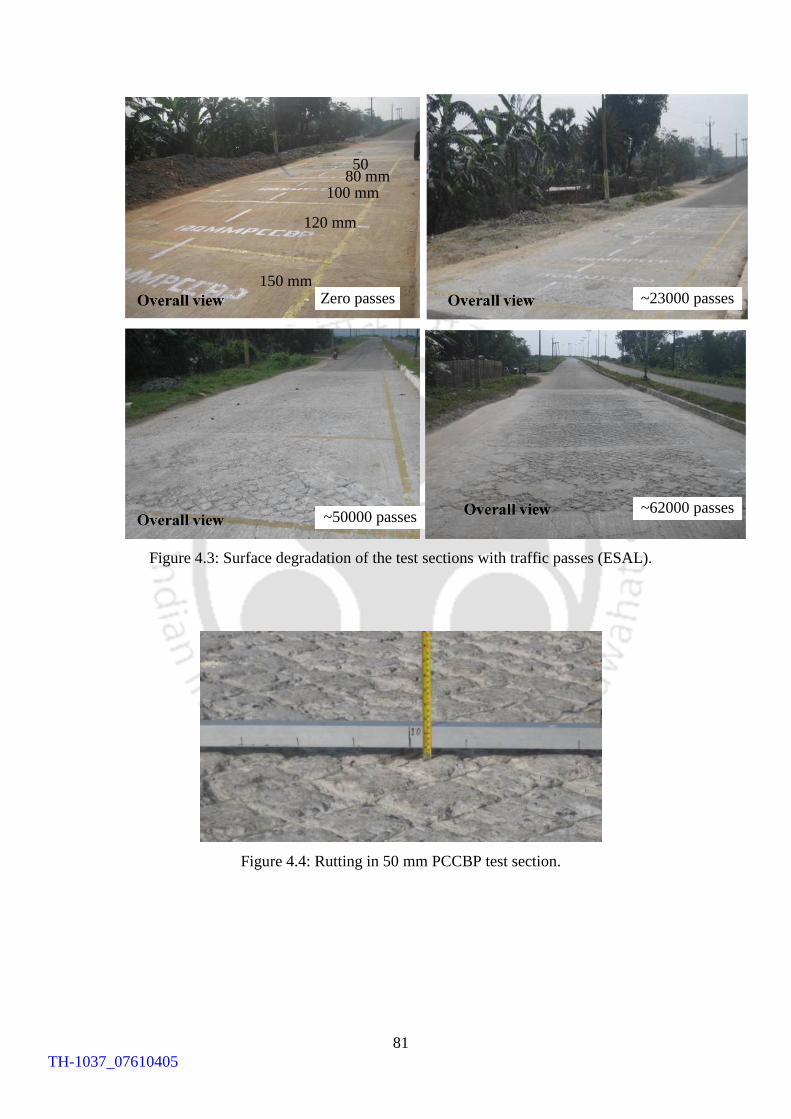
81
Figure 4.3: Surface degradation of the test sections with traffic passes (ESAL).
Figure 4.4: Rutting in 50 mm PCCBP test section.
150 mm
120 mm
100 mm 80 mm 50
mm
Zero passes ~23000 passes
~50000 passes ~62000 passes
TH-1037_07610405
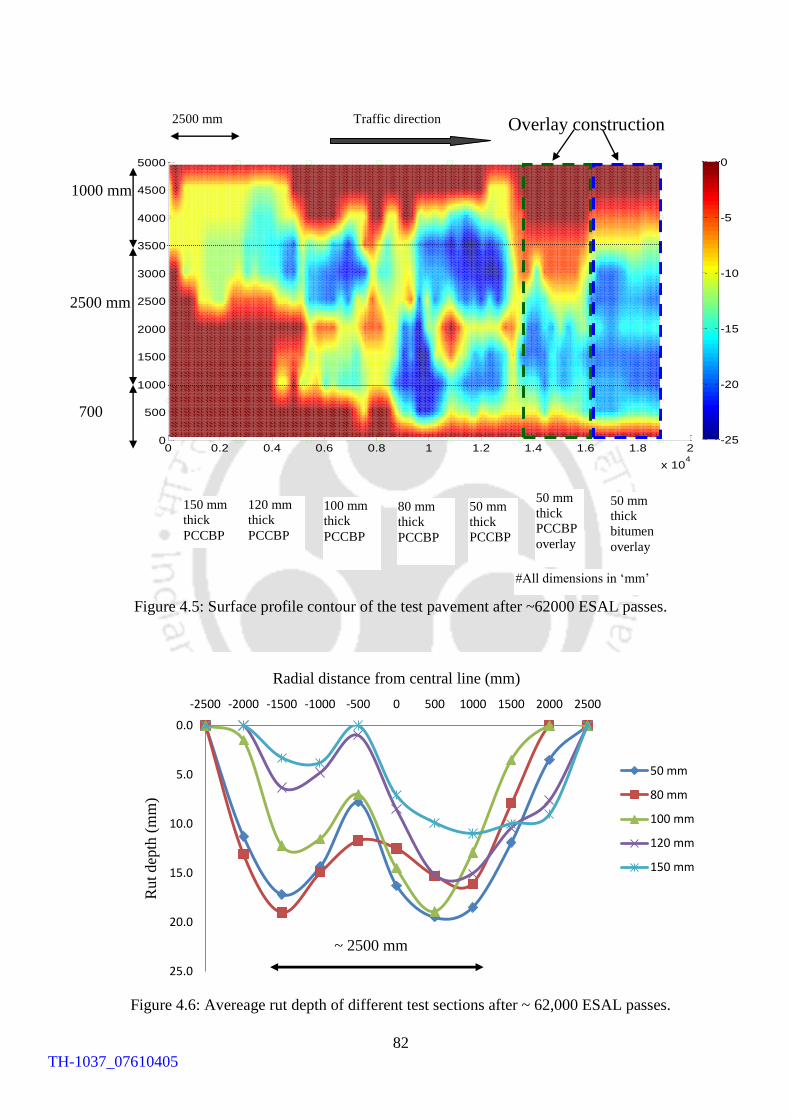
82
Figure 4.5: Surface profile contour of the test pavement after ~62000 ESAL passes.
Figure 4.6: Avereage rut depth of different test sections after ~ 62,000 ESAL passes.
0 0.2 0.4 0.6 0.8 1 1.2 1.4 1.6 1.8 2
x 104
0
500
1000
1500
2000
2500
3000
3500
4000
4500
5000
-25
-20
-15
-10
-5
0
0.0
5.0
10.0
15.0
20.0
25.0
-2500 -2000 -1500 -1000 -500 0 500 1000 1500 2000 2500
Rut
dep
th (
mm
)
Radial distance from central line (mm)
50 mm
80 mm
100 mm
120 mm
150 mm
Traffic direction 2500 mm
50 mm
thick
PCCBP
overlay
50 mm
thick
bitumen
overlay
50 mm
thick
PCCBP
80 mm
thick
PCCBP
100 mm
thick
PCCBP
120 mm
thick
PCCBP
150 mm
thick
PCCBP
2500 mm
700
mm
#All dimensions in „mm‟
Overlay construction
1000 mm
~ 2500 mm
TH-1037_07610405
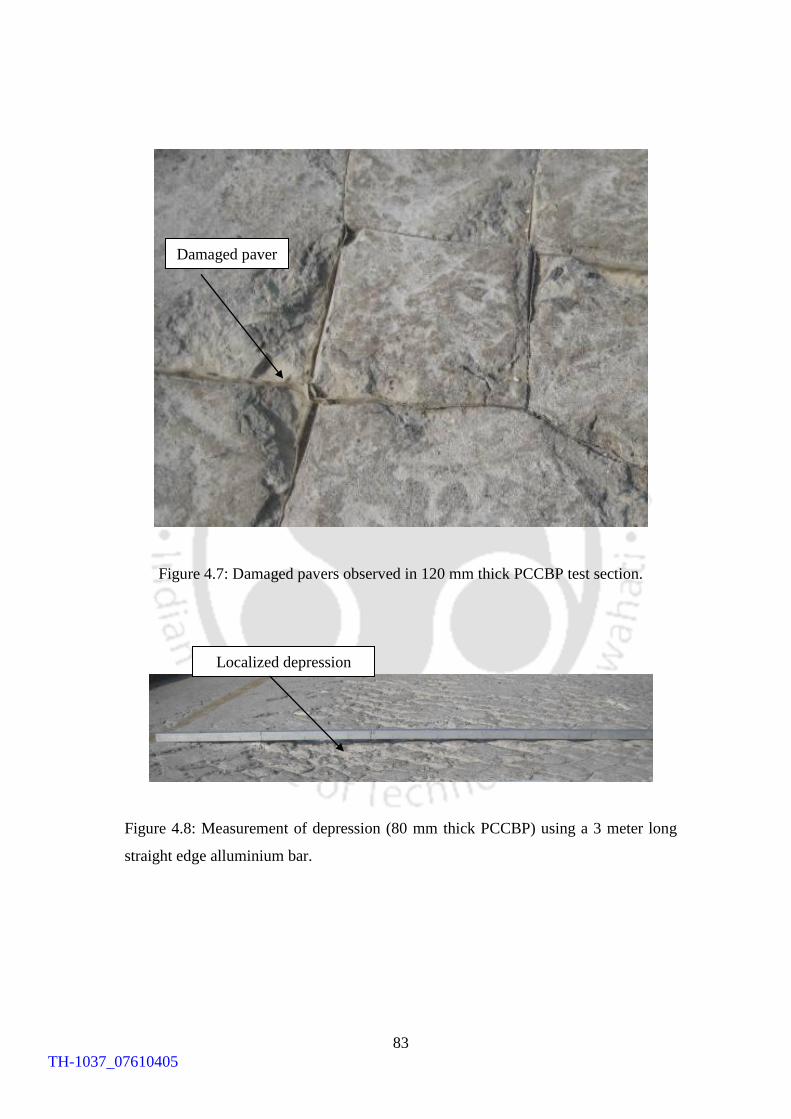
83
Figure 4.7: Damaged pavers observed in 120 mm thick PCCBP test section.
Figure 4.8: Measurement of depression (80 mm thick PCCBP) using a 3 meter long
straight edge alluminium bar.
Damaged paver
Localized depression
TH-1037_07610405
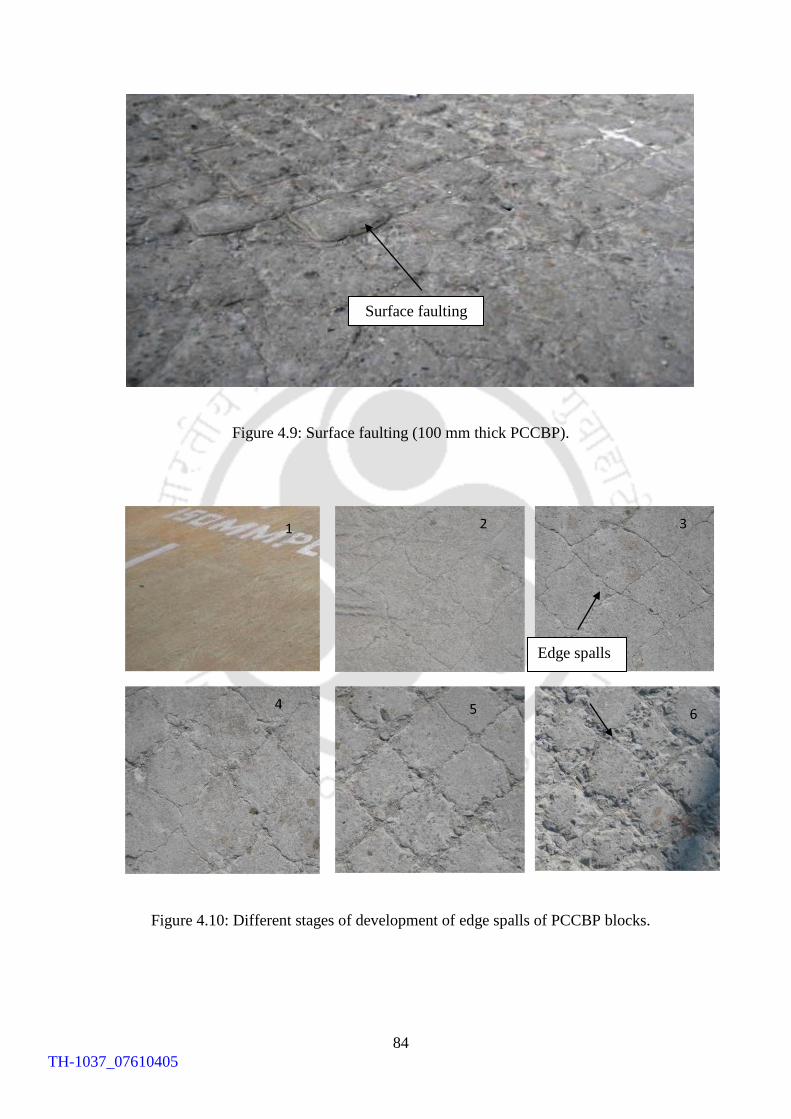
84
Figure 4.9: Surface faulting (100 mm thick PCCBP).
Figure 4.10: Different stages of development of edge spalls of PCCBP blocks.
Edge spalls
Surface faulting
TH-1037_07610405
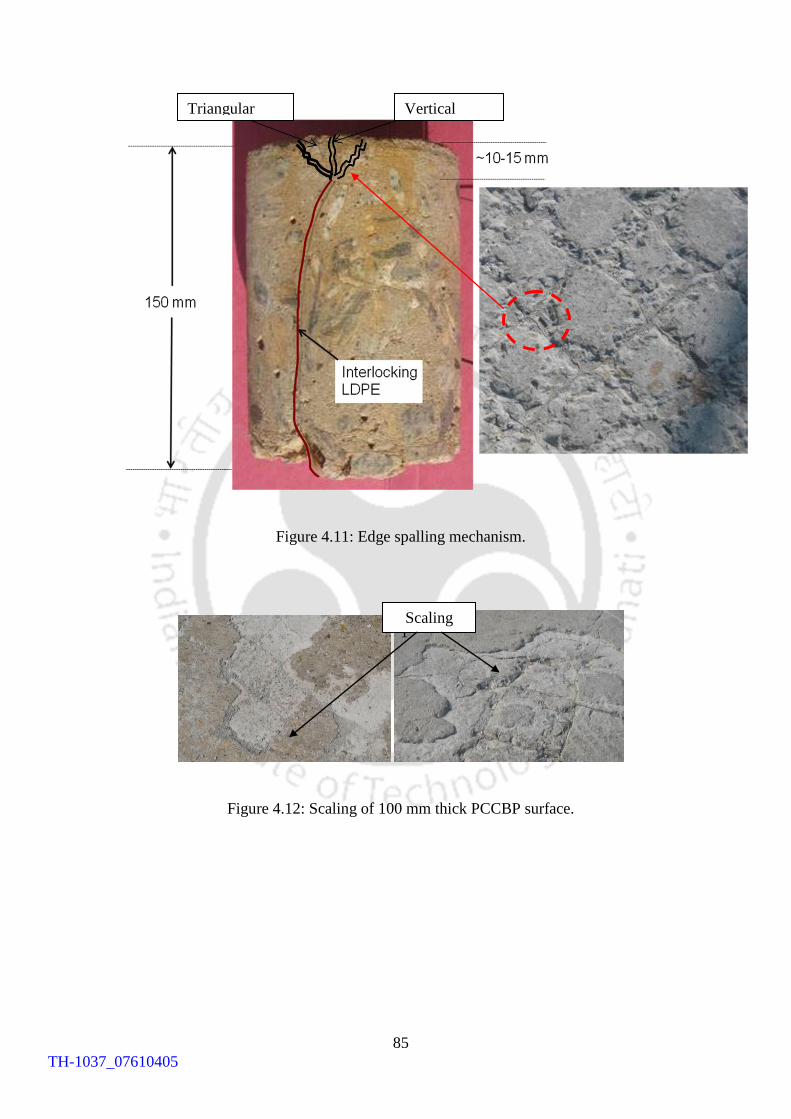
85
Figure 4.11: Edge spalling mechanism.
Figure 4.12: Scaling of 100 mm thick PCCBP surface.
1 Scaling
Vertical
crack
Triangular
spall
TH-1037_07610405
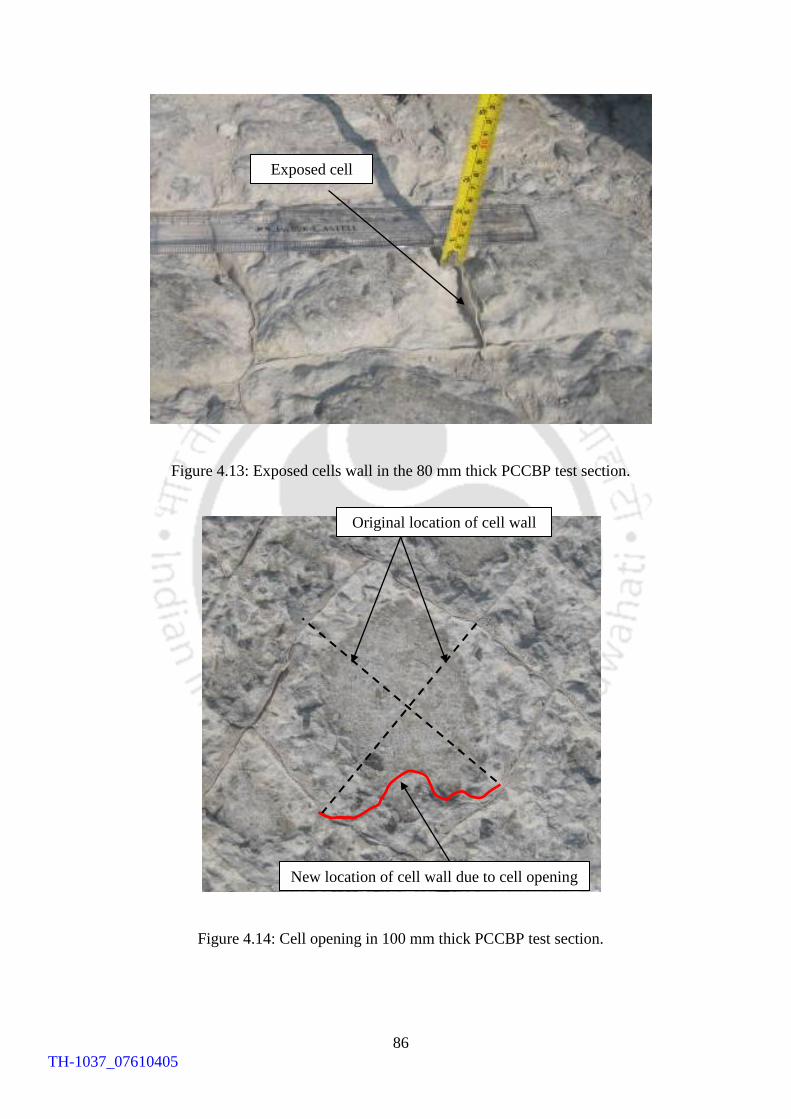
86
Figure 4.13: Exposed cells wall in the 80 mm thick PCCBP test section.
Figure 4.14: Cell opening in 100 mm thick PCCBP test section.
Exposed cell
Original location of cell wall
New location of cell wall due to cell opening
TH-1037_07610405
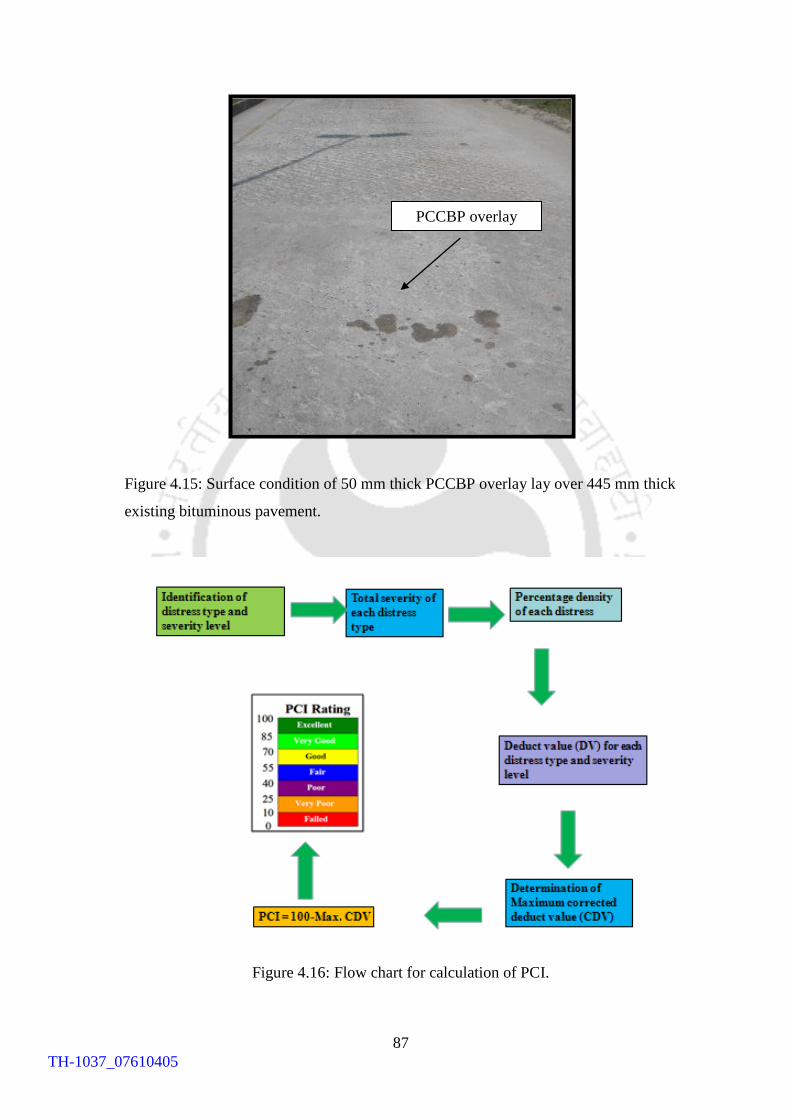
87
Figure 4.15: Surface condition of 50 mm thick PCCBP overlay lay over 445 mm thick
existing bituminous pavement.
Figure 4.16: Flow chart for calculation of PCI.
PCCBP overlay
TH-1037_07610405
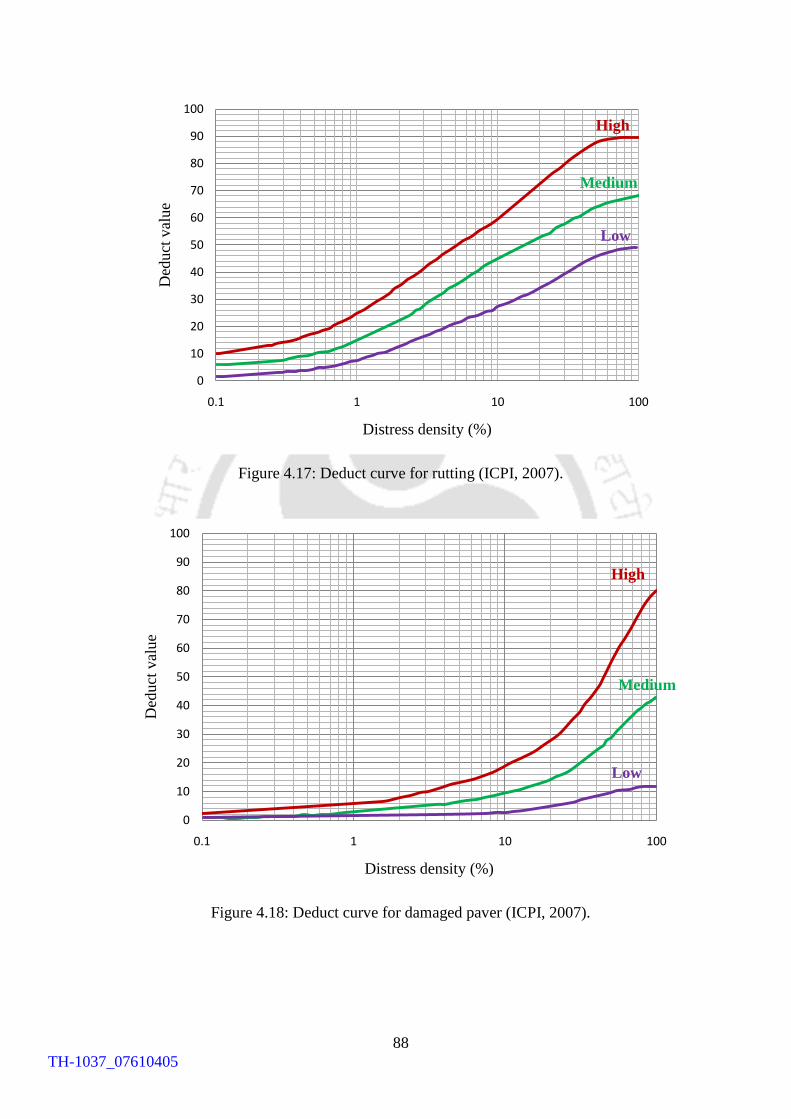
88
Figure 4.17: Deduct curve for rutting (ICPI, 2007).
Figure 4.18: Deduct curve for damaged paver (ICPI, 2007).
0
10
20
30
40
50
60
70
80
90
100
0.1 1 10 100
Ded
uct
val
ue
Distress density (%)
High
Medium
Low
0
10
20
30
40
50
60
70
80
90
100
0.1 1 10 100
Ded
uct
val
ue
Distress density (%)
High
Medium
Low
TH-1037_07610405
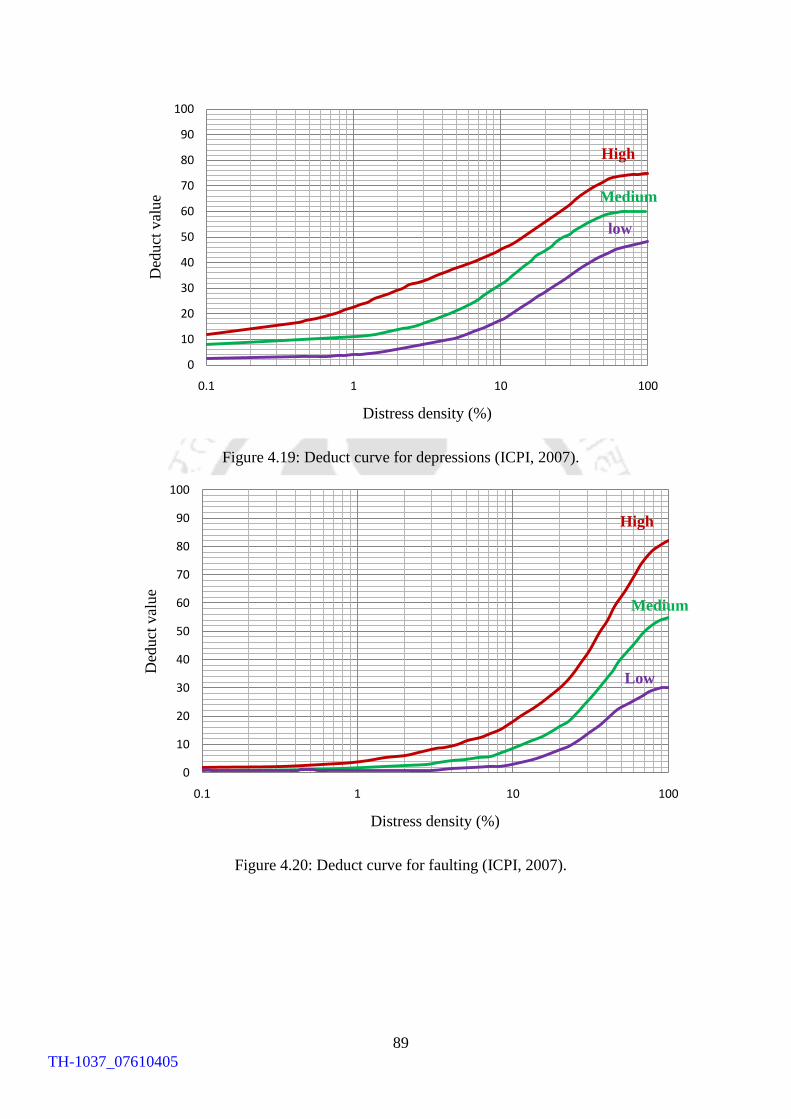
89
Figure 4.19: Deduct curve for depressions (ICPI, 2007).
Figure 4.20: Deduct curve for faulting (ICPI, 2007).
0
10
20
30
40
50
60
70
80
90
100
0.1 1 10 100
Ded
uct
val
ue
Distress density (%)
High
Medium
low
0
10
20
30
40
50
60
70
80
90
100
0.1 1 10 100
Ded
uct
val
ue
Distress density (%)
Low
Medium
High
TH-1037_07610405
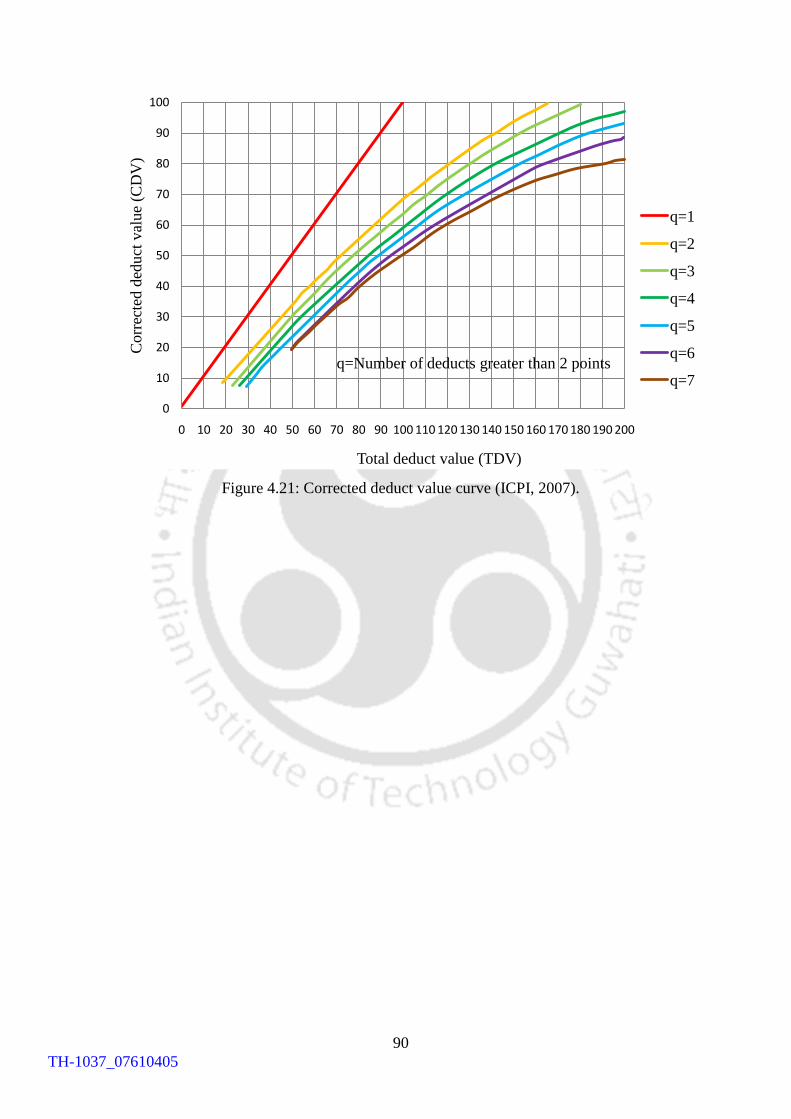
90
Figure 4.21: Corrected deduct value curve (ICPI, 2007).
0
10
20
30
40
50
60
70
80
90
100
0 10 20 30 40 50 60 70 80 90 100 110 120 130 140 150 160 170 180 190 200
Corr
ecte
d d
educt
val
ue
(CD
V)
Total deduct value (TDV)
q=1
q=2
q=3
q=4
q=5
q=6
q=7q=Number of deducts greater than 2 points
TH-1037_07610405
91
CHAPTER 5
Economic Evaluation
5.1 Introduction
As reported earlier, in India, the proportion of low volume rural roads is about 80% of
the total road length (NHAI, 2011). As such pavement engineers and researchers are
concerned for designing sustainable rural roads with reasonable riding quality and
with an emphasis on „low life cycle cost‟. It may be noted that conventional flexible
pavement with a thin cover of premix bituminous carpet is generally constructed for
rural roads, however, frequent maintenance are required (to maintain both functional
and structural efficiencies) due to damages caused by poor drainage conditions,
overloaded vehicular traffic, iron wheeled bullock carts etc. As a result such pavement
incurs huge maintenance cost, thereby increasing the life cycle cost. To lessen such
expensive maintenance cost, concrete pavements are getting popular in rural road
because of their durability. On the other hand concrete (rigid) pavements require high
initial cost and can also fail due to various reasons like day and night variations in
warping stresses, seasonal changes in the modulus of sub-grade reaction etc. (Srinivas
et. al., 2007). As an alternative for better structural performance and low maintenance
Plastic Cell Filled Concrete Block Pavement (PCCBP) developed in South Africa
(Visser, 1994, 1999; Visser and Hall, 1999, 2003) has been investigated. As discussed
in Chapter 3, in the present study of PCCBP, an attempt has been made to use waste
stone dust in place of the traditional river sand, in order to optimize the cost of
pavement construction. In this chapter, economic evaluation (considering construction
and maintenance cost for 5 years only) of PCCBP over traditional flexible and rigid
pavements is presented.
TH-1037_07610405
92
5.2 Design of Different Types of Pavement
5.2.1 Design parameters
In order to assess the economic advantage of PCCBP (using stone dust as 100% sand
replacement in concrete) over conventional flexible and rigid (concrete) pavements
cost comparison have been carried out considering both construction and maintenance
costs for a period of 5 years. To demonstrate the cost analysis, similar design
parameters adopted elsewhere (e.g., Roy et al., 2009, 2010, Ryntathiang, 2005) are
considered:
1. Lane width = 3.75 m (single lane carriageway)
2. Sub-grade CBR = 5%
3. Design traffic = 300,000 standard axle load repetitions
5.2.2 Design of flexible pavement
The flexible pavement has been design as per IRC (2007) for the design parameters
mentioned in Section 5.2.1. From the pavement design chart, Figure 4 of IRC (2007),
the thicknesses of the pavement layers have been obtained as 150 mm thick granular
sub-base course (CBR > 20%), 175 mm thick WBM course and 20 mm thick
bituminous premix carpet as surfacing.
5.2.3 Design of rigid pavement
The rigid pavement has been design for a wheel load of 51 kN (legal limit for axle
load is 102 kN) as per IRC (2004) for the design parameters mentioned in Section
5.2.1. The effective modulus (k) of sub-grade reactions (20% increased for providing
150 mm sub-base course) for 5% CBR value for sub-grade is 50.4 X10⁻³
N/mm2/mm
as per IRC (2004).
Flexural strength of concrete:
Adopt a 28 day compressive strength of 30 MPa (fc)
Flexural strength, ft = 0.7 fc = 3.834 MPa
Therefore, the 90 day flexural strength = 1.20 x 3.834 = 4.6 MPa.
TH-1037_07610405
93
Design thickness check
Edge load stress
As per IRC (2004), the design thickness of pavement slab is 220 mm, and the
corresponding edge stress is 2.35 MPa (for k = 50.4 X10⁻³
N/mm2/mm).
Temperature stress
The radius of relative stiffness (l) for 220 mm thick slab as per IRC (2004) = 857.36
mm.
Assuming a contraction joint spacing of 3.75 m and width of slab as 3.75 m, the edge
temperature stress was calculated to be 1.35 MPa (see Table 4 of IRC, 2004 for
Assam state).
Total stress
The total stress = edge stress + temperature stress = 3.7 MPa, which is less than 4.6
MPa (flexural strength of the concrete). Hence, the slab thickness is safe and can be
adopted.
5.2.4 Design of PCCBP
As mentioned earlier, the interlocking of the individual blocks in PCCBP allows a
limited rotation and the pavement acts as a flexible concrete pavement (Visser, 1994).
Also considering the observation that PCCBP has considerably high modulus (see
Chapter 3), it is unlikely to suffer significant permanent deformation. Hence, only
WBM (sub-base) and sub-grade are anticipated to undergo rutting i.e., rutting may be
the mode of failure in this type of pavement as observed by Ryntathiang et. al., (2005)
and Roy et. al., (2010). Rutting along the wheel path may be caused by permanent
deformation in the sub-grade and/or sub-base of the pavement. Surface rutting in the
flexible pavement is generally controlled by limiting the vertical sub-grade strain.
Indian Road Congress (IRC, 2001), Shell and Asphalt Institute (SHELL, 1978) have
limiting sub-grade strain criteria for controlling rutting in flexible pavements. While
rutting in the asphalt layer is controlled by selection of a binder, the rutting in granular
as well as in the sub-grade is controlled by limiting the vertical sub-grade strain. In
the present study a reliability level of 50% (AASHTO, 1993) is adopted for design of
PCCBP. Reddy and Pandey (1992) proposed the following vertical sub-grade strain
criterion for 50% reliability considering 20 mm as the limiting value of rutting.
TH-1037_07610405
94
N=3.0599 x 10⁻⁸
[1/∈z]4.5337
(5.1)
Where, N = Number of cumulative standard axles to produce rutting of 20 mm
∈z = Vertical sub-grade strain (micro strain)
The elastic modulus of the sub-grade soil (Esub-grade) and sub-base layer (Esub-base) can
be obtained from:
Esub-grade = 10 x CBR for CBR ≤ 5
= 17.6 x (CBR) 0.64
for CBR > 5 and
(5.2)
Esub-base= Esub-grade x 0.2 x h 0.45
(5.3)
For the present study, design analysis has been carried out for 100 mm thick PCCBP
laid over a sub-base layer of 100 mm thick WBM course. The elastic layer modulus of
2300 MPa for PCCBP layer obtained through BACKGA has been used. The layer
modulus of sub-grade and sub-base has been calculated as, Esub-grade = 50 MPa (i.e. 10
x 5 for CBR 5%) and E sub-base= 50 x 0.2 x (100)0.45
= 79.43 MPa. Using computer
program code KENLAYER (Huang, 2010), the vertical sub-grade strain is calculated
to be 1.832 x 10⁻³
MPa (see Appendix G), which is lesser than allowable strain value
of 2.3 x 10⁻³
mm (from Equation 5.1).
The design thicknesses of the different types of pavements for the cost comparison are
shown in Table 5.1.
5.3 Cost comparison
5.3.1 Construction and maintenance cost
The construction and maintenance cost have been estimated based on Public Works
Department, Government of Assam schedule rates 2007-08 (PWD, 2007) and the
guidelines for the estimation of the maintenance cost for construction of the rural
roads (IRC, 2002; PMGSY, 2010). Suitable cost escalation factor to bring to the year
TH-1037_07610405
95
2010 market rate was considered based on monthly wholesale price index (OEA,
2010). The sample calculation for cost escalation factor is enclosed as Appendix H.
In the absence of guidelines on maintenance cost for PCCBP and considering the
good performance of cell filled concrete pavement 100 mm thick over 100 mm
compacted moorum sub-base course constructed for village road which withstood 5
(five) heavy monsoons without any maintenance (Roy et. al., 2009), it is considered
to be the same as that taken for concrete pavement. The cost calculation for economic
evaluation of PCCBP vis-a-vis conventional flexible and rigid pavement is given
below. The detail cost analysis is enclosed as Appendix I.
5.3.2 Cost estimation
i) Flexible pavement
1. Construction of 150 mm thick granular sub-base course = Rs 169/m2
2. Providing and laying 175 mm WBM course = Rs 237/m2
3. Construction of 20 mm thick premix carpet (Grade A seal coat) = Rs 201/m2
4. Add cost escalation factor to bring to present (year 2010) rate = Rs 89/ m2
Therefore, the total cost of construction for flexible pavement = Rs 696/ m2
The routine maintenance cost for 5years = Rs 46/ m2
Renewal cost of flexible pavement after 5 years = Rs 236/ m2
ii) Rigid pavement
1. Construction of 150 mm WBM base course = Rs 203/m2
2. Construction of 220 mm thick plain cement concrete slab =Rs 1193/m2
3. Add cost escalation factor to bring to the present (year 2010) rate=Rs 205/m2
Therefore, the total cost of construction for rigid pavement = Rs 1601/m2
The routine maintenance cost for 5years = Rs 16/m2
Renewal / major repair cost of rigid pavement after 5 years = Rs 26/ m2
iii) Plastic cell filled concrete block pavement (PCCBP)
1. Cost of construction for 100 mm thick WBM course = Rs 135/ m2
2. Cost of plastic cell formwork (prepared from plastic pipe) = Rs 120/ m2
TH-1037_07610405
96
3. Cost of construction for 100 mm thick cement concrete (using stone dust)
= Rs 384/ m2
Therefore, the total cost of construction for PCCBP pavement = Rs 639/ m2
The routine maintenance cost for 5years = Rs 16/ m2
Renewal / major repair cost of PCCBP pavement after 5 years = Rs 26/ m2
5.4 Discussions
The cost comparison of PCCBP vis-à-vis conventional flexible and concrete
pavement considering both construction and maintenance costs is shown in Table 5.2.
It can be observed from Table 5.2 that initial construction cost for both flexible and
rigid pavements are higher than that of PCCBP by ~9% and ~150% respectively and
the total cost (including maintenance cost for 5 years) of flexible and rigid pavements
are higher by ~43% and ~141% respectively as compared to that of PCCBP. The
present results are in agreement with study conducted by Roy et al., (2009, 2010), in
Kharagpur (using river sand as fine aggregates), where the total cost (for 5 years) of
flexible and rigid pavements are reported to be higher by ~54% and ~131%
respectively as compared to that of PCCBP. The economical competitiveness of
PCCBP over conventional pavements viz., flexible (Visser, 1994; Visser and Hall,
1999, 2003; Sahoo et al., 2006), rigid (Roy et al., 2009, 2010) and block (Visser,
1994; Visser and Hall, 1999; Ryntathiang, 2005) pavements have also been reported
in the literature. Further considering negligible or no maintenance requirement of
PCCBP tested for 4, 5 and 8 years by Visser and Hall (1999), Roy et al., (2009) and
Visser and Hall (2003) respectively, cost saving in using PCCBP is likely to be
increased. Hence PCCBP with waste stone dust as replacement for the traditional sand
for both concrete and WBM can be an economical option for rural roads. Any
distresses that are accrued after 15 years of service may be rectified to bring back to
the normal riding quality using an overlay of 50 mm PCCBP (Roy et. al., 2009).
TH-1037_07610405
97
5.5 Conclusions
1. As compared to PCCBP, the initial construction costs for conventional flexible
and rigid pavement are seen to be higher by 9% and 150% respectively.
2. The total cost including construction and maintenance cost for 5 years of flexible
and rigid pavements are higher by 43% and 141% respectively as compared to
that of PCCBP.
3. Cent percent replacement of river sand in concrete by stone dust proved to be cost
cutting without significant change in the strength of the concrete. Hence, PCCBP
can be a suitable alternative to the conventional flexible and concrete pavement
for the construction of rural roads which is labour intensive and cost effective
TH-1037_07610405
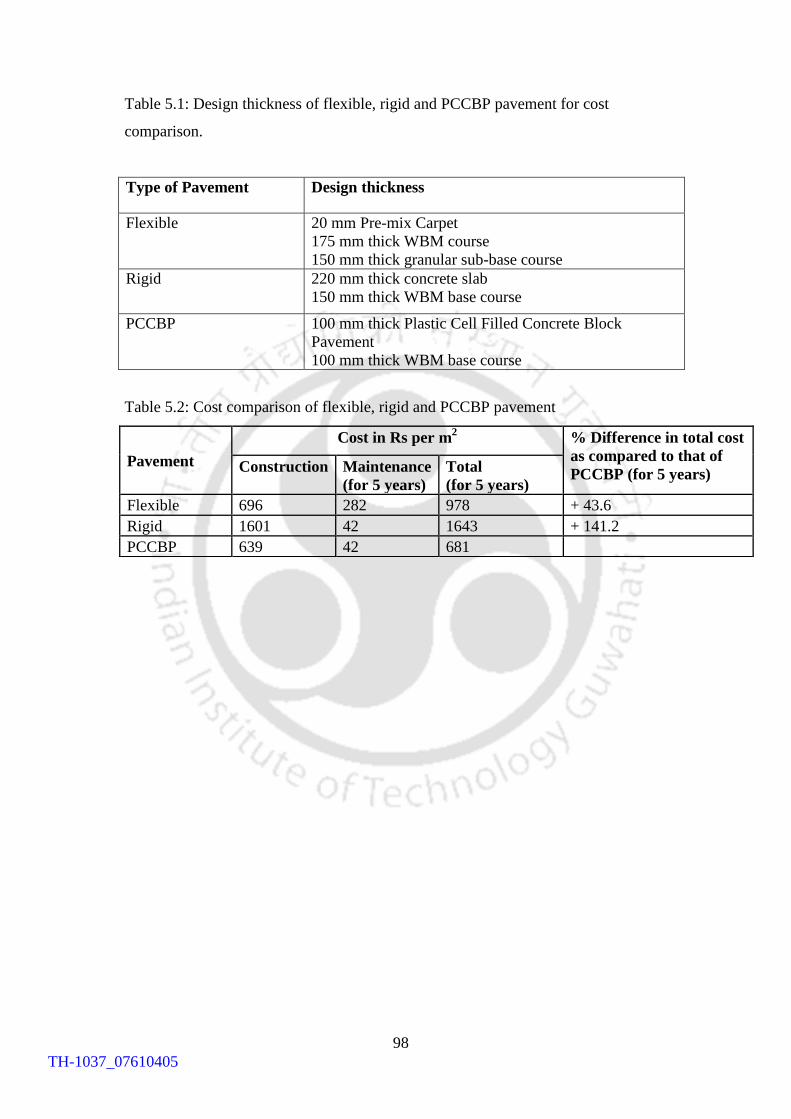
98
Table 5.1: Design thickness of flexible, rigid and PCCBP pavement for cost
comparison.
Type of Pavement Design thickness
Flexible 20 mm Pre-mix Carpet
175 mm thick WBM course
150 mm thick granular sub-base course
Rigid 220 mm thick concrete slab
150 mm thick WBM base course
PCCBP 100 mm thick Plastic Cell Filled Concrete Block
Pavement
100 mm thick WBM base course
Table 5.2: Cost comparison of flexible, rigid and PCCBP pavement
Pavement
Cost in Rs per m2 % Difference in total cost
as compared to that of
PCCBP (for 5 years) Construction Maintenance
(for 5 years)
Total
(for 5 years)
Flexible 696 282 978 + 43.6
Rigid 1601 42 1643 + 141.2
PCCBP 639 42 681
TH-1037_07610405
99
CHAPTER 6
Summary and Conclusions
In this work full scale field experimental investigation have been made to assess the
structural behaviour of different thicknesses (50 mm, 80 mm, 100 mm, 120 mm and
150 mm) of Plastic Cell Filled Concrete Block Pavement (PCCBP) over 100 mm sub-
base layer of Water Bound Macadam (WBM) course, using „waste‟ stone dust
(produced as by-product of aggregates crushing) in place of the traditional river sand
as fine aggregates in concrete. The feasibility study of PCCBP as overlay construction
to strengthen the existing bituminous pavement was also carried out. Layer elastic
moduli of different layers of PCCBP have been calculated using a genetic algorithm
based moduli backcalculation computer code BACKGA (Reddy et al., 2002) from the
surface deflection data obtained through a custom fabricated Falling Weight
Deflectometer (FWD, a non destructive test equipment which simulates the moving
vehicular wheel load on the pavement). The layer elastic moduli obtained through
BACKGA have been validated using two different elastic layer analyses approaches
through KENLAYER and ABAQUS. Further, effort has been made to evaluate
various types of PCCBP distresses based on pavement condition index (PCI)
methodology. Economic evaluation of PCCBP is also presented comparing the
construction and maintenance cost (for 5 years) vis-à-vis conventional flexible and
rigid (concrete) pavement. Main conclusions based on the present investigation are
summarized below:
1. An increase in the size of surface deflection bowl was observed for decreasing
PCCBP thickness. The deflection bowl has been observed to be significant up
to an approximate radial distance of twice the load plate diameter from the
center of the load (~600 mm).
TH-1037_07610405
100
2. Peak surface deflections decreased with increasing PCCBP thickness linearly,
with 200% increase in thickness from 50 mm thick PCCBP, a decrease of
~48% (0.8481 mm for 50 mm PCCBP) in deflection was observed.
3. A thin PCCBP of about 50 mm over thin sub-base can result in sufficiently
high elastic moduli (> 1900 MPa) of PCCBP to be used for rural roads.
4. Elastic modulus of PCCBP increases with increasing thickness, approximately
in a linear manner for the thicknesses tested, 90% increase in elastic modulus
was observed for 200% increase in thickness.
5. It has been observed that for the initial 38,000 ESAL passes the degradation in
layer modulus of PCCBP is of the range ~3-20%., however there appears to be
a stabilization after 38,000 passes with the degradation dropping to ~1-7%
(from 38,000 to 62,000 ESAL passes). The lowest thickness of PCCBP (50
mm) has shown a high elastic modulus (~1800 MPa) even after a wheel load
repetition of 62, 000 passes.
6. PCCBP overlay showed significant improvement (~230% increase) in elastic
layer modulus when compared to that of bituminous overlay suggesting that
PCCBP can be a good alternative for strengthening the existing bituminous
pavements.
7. Distress evaluation of PCCBP test sections (after 62,000 ESAL passes) based
on ICPI distress manual showed that 50 mm thick PCCBP can be rated as
„fair‟ and highest thickness 150 mm PCCBP thickness can be rated as „very
good‟ based on pavement condition index rating chart. Specific distresses
observed for PCCBP are also reported.
8. The construction and maintenance cost (for 5 years) of flexible and rigid
pavements are computed to be higher by ~43% and ~141% respectively as
compared to that of PCCBP. Hence PCCBP with waste stone dust as
replacement for the traditional sand for both concrete and WBM can be an
economical option for rural roads. Hence PCCBP with waste stone dust as
replacement for the traditional sand for both concrete and WBM can be an
economical option for rural roads.
TH-1037_07610405
101
CHAPTER 7
Recommendations for future work
Although considerable understanding have been obtained in the present work for the
structural behavior of different thicknesses of PCCBP using stone dust as fine
aggregate in concrete, significant amount of work may be identified as future scope of
work on Plastic cell filled concrete block pavement.
1) Studies may be carried out on the effect of varying thicknesses of WBM (sub-
base) course.
2) The effect of soil strength (in terms of CBR) on the elastic layer moduli of
PCCBP may be investigated.
3) Possibilities of using different sub-base materials such as lime treated, cement
treated and bituminous emulsion treated sub-bases need to be examined.
4) Investigation can also be done for different thicknesses of plastic. Use of waste
plastics can also checked for using as cell formwork.
5) Development of deduct curves is important for evaluation of distresses based
on pavement condition index.
6) Studies need to be carried out to check the feasibility of PCCBP for higher
traffic.
7) Multi depth deflectometer can be installed so that live/regular monitoring the
PCCBP test pavement can be carried out.
TH-1037_07610405
102
References
1. AASHTO, 1962. Road Test, Highway Research Board, Report No. 9, 61-E,
Washington D.C.
2. AASHTO, 1993. Guide for design of pavement structures, AASHTO,
Washington, D.C., II-12.
3. ABAQUS, 2009. Dassault Systems Similua Corp., Providence, RI, USA.
4. ASTM 2487, 2006. Standard Practice for Classification of Soils for Engineering
Purposes (Unified Soil Classification System), ASTM-D 2487, American Society
for Testing and Materials, ASTM-D, United States.
5. ASTM 6433, 2009. Standard Practice for Roads and Parking Lots Pavement
Condition Index Surveys, ASTM-D 6433, American Society for Testing and
Materials, ASTM-D, United States.
6. ASTM 5340, 2010. Standard Test Method for Airport Pavement Condition Index
Surveys, ASTM-D 5340, American Society for Testing and Materials, ASTM-D,
United States.
7. Chakroborty, P. and Das A., 2003. Principles of Transportation Engineering,
Prentice Hall of India Private Limited, New Delhi-110001.
8. CPWD, 1996. Construction Specification for Government Contractors for
Roadwork, Hoticulture and Land Scaping, Central Public Works Department,
New Delhi, Volume-5.
9. FHWA, 1992. Local Low Volume Roads and Streets, FHWA-SA-93-006, Federal
Highway Administration, U.S. Department of Transportation, Washington D.C.
10. Geller, R., 1996. Concrete Block Paving Condition Survey and Rating
Procedures, Pave Israel, Tel Aviv, Israel, 405-412.
11. Gerald, T. C., 2010. Opportunities for Low-Volume Roads (Online),
http:/onlinepubs.trb.org/onlinepubs/millennium/00068.pdf. accessed on 17th
December, 2010.
TH-1037_07610405
103
12. Gourley, C.S. and Greening P.A.K., 1999. Performance of Low Volume Sealed
Roads; Results and Recommendations from studies in South Africa, Project
Report No. PR/OSC/167/99, Transportation Research Laboratory, Crowthrone,
U.K.
13. Hall, K.D. and Bettis, J.W., 2000. Development of Comprehensive Low-Volume
Pavement Design Procedures, Final Report, MBTC 1070, Mack-Blackwell Rural
Transportation Center, University of Arkansas, Akansas, USA.
14. Hein, D.K. and Burak, R., 2007. Development of a Pavement Condition Rating
Procedure for Interlocking Concrete Pavements, Cost-Effective Assessment/
Rehabilitation of the Condition of Materials, Transportation Association of
Canada, Saskatoon, Saskatchewan, Canada.
15. Hein, D.K. and Burak, R., 2009. Development of Pavement Condition Index
Procedure for Interlocking Concrete Pavements, 9th
International Conference on
Concrete Block Paving, Buenos Aires, Argentina, 18-21, October, 1-11.
16. Huang, Y.H, 2010. Pavement Analysis and Design, Dorling Kindersley (India)
Pvt. Ltd., licensees of Pearson Education of South Asia,Noida-201309 (U,P), New
Delhi.
17. Huurman, M. (1997). “Permanent Deformation in Concrete Block Pavement.”
PhD thesis, Delft University of Technology, Netherlands.
18. ICPI, 2000. Life-Cycle Cost Analysis – Interlocking Concrete Pavements,
Interlocking Concrete Pavement Institute, John Emery Geotechnical Engineering
Limited, Washington, D.C.
19. ICPI, 2007. Interlocking Concrete Pavement Distress Manual, Interlocking
Concrete Pavement Institute, 13921 Park Center Road, Suite 270, Herndon,
Canada.
20. Ilangovana, R., Mahendrana, N., Nagamanib, K., 2008. Strength and Durability
Properties of Concrete Containing Quarry Rock Dust as Fine Aggregates, ARPN
Journal of Engineering and Applied Sciences, 3 (5), October, 20-26.
21. IRC, 2001. Guidelines for the Design of Flexible Pavements. Indian Road
Congress, New Delhi, IRC-37, New Delhi, India.
TH-1037_07610405
104
22. IRC, 2002. Rural Roads Manual, Indian Road Congress Special Publication, IRC-
SP: 20, New Delhi, India.
23. IRC, 2004. Guidelines for the Design and Construction of Cement Concrete
Pavements, Indian Road Congress Special Publication, IRC-SP: 62, New Delhi,
India.
24. IRC, 2007. Guidelines for the Design of Flexible Pavements for Low Volume
Roads, Indian Road Congress Special Publication, IRC-SP: 72, New Delhi, India.
25. IS 1489, 1991. Specifications for Portland Pozzolana Cement (Fly ash Based),
Part-1, Bureau of Indian Standards, New Delhi.
26. IS 2386, 1963a. Method of Test for Aggregates for Concrete for Determination of
specific gravity, Void, Absorption and Bulking, Part-III, Bureau of Indian
Standards, New Delhi.
27. IS 2386, 1963b. Method of Test for Aggregates for Concrete, Mechanical
properties, Part-4, Bureau of Indian Standards, New Delhi.
28. IS 2720, 1975. Methods of Test for Soil, Determination dry density of soils in
place by core cutter method, Part-XXIX, Bureau of Indian Standards, New Delhi.
29. IS 2720, 1980. Methods of Test for Soil for Determination of Specific Gravity,
Part-III, Sec-2, Bureau of Indian Standards, New Delhi.
30. IS 2720, 1985a. Methods of Test for Soil for Grain Size Analysis, Part-4, Bureau
of Indian Standards, New Delhi.
31. IS 2720, 1985b. Methods of Test for Soil for Determination of Liquid Limit and
Plastic Limit, Part-5, Bureau of Indian Standards, New Delhi.
32. IS 2720, 1987. Methods of Test for Soil, Laboratory determination of CBR, Part-
16, Bureau of Indian Standards, New Delhi.
33. IS 383, 1970, Indian Standard Specification for coarse and Fine aggregates from
Natural Sources for Concrete (Second Revision), Bureau of Indian Standards,
New Delhi.
34. IS 516, 1959. Methods of Test for Strength of Concrete, Bureau of Indian
Standards, New Delhi.
TH-1037_07610405
105
35. LabVIEW, 2009. NI LabVIEW Software, National Instrument corporation
headquarters, Austin, Texas- 78759-3504, http://www.ni.com/labview.
36. Manasseh, J., 2010. Use of Crushed Granite Fine as Replacement to River Sand
in Concrete Production, Leonardo Electronic Journal of Practices and
Technologies, July-December,17, 85-96.
37. MORTH, 2001. Specifications for Roads and Bridge Works, Ministry of
Shipping, Roads Transport and Highways (MORTH), Indian Road Congress,
New Delhi.
38. MORT & H, 2011. Road Network of India- An Overview, Ministry of Roads
Transport and Highways (MORTH), Government of India, New Delhi,
http://morth.nic.in/writereaddata/sublinkimages/overview_NH3244795788.htm,
access on 8th
April‟2011.
39. NHAI, 2011. Indian Road Network, National Highway Authority of India,
Ministry of Road Transport and Highways, Government of India,
http://www.nhai.org/roadnetwork.htm, accessed on 21st August.
40. NI, 2009. National Instrument Corporation, Austin, Texas- 78759-3504,
http://www.ni.com, accessed on 2nd
September.
41. OEA, 2010. Office of the Economic Advisory, Government of India,
http://eaindustry.nic.in, accessed on 5th
December.
42. Panda, B.C. and Ghosh, A.K., 2002(a). Structural Behaviour of Concrete Block
Pavements I: Sand in Bed and Joints, Journal of Transportation Engineering,
March/ April, 128 (2), 123-129.
43. Panda, B.C. and Ghosh, A.K., 2002(b). Structural Behaviour of Concrete Block
Pavements II: Sand in Bed and Joints, Journal of Transportation Engineering,
March/ April, 128 (2), 130-135.
44. Pandey, B.B., 2006. Low Cost Concrete Roads for Villages, Grameen sampark,
National Rural Roads Development agency, Ministry of Rural Development,
Government of India, II (1&2), 14-15.
45. Pandey, B.B. and Reddy K.S., 2005. Final Report on Structural Evaluation of
Pavements in Eastern India Using Falling Weight Deflectometer, Research
Scheme (R-81), Transportation Engineering section, Civil Engineering
TH-1037_07610405
106
Department, Indian Institute of Technology Kharagpur, India, Submitted to
Ministry of Road Transport and Highways (MORT&H), Government of India,
New Delhi. January.
46. Plessis, B.M.DU. and Visser A.T., 2001. Rehabilitation of Heavy Duty Concrete
Pavements with HYSON-CELLS Overlay, 20th
South African Transport
Conference, “Meeting the Transport Challenges in Southern Africa”, South
Africa, 16-20 July, 2001.
47. PMGSY, 2010. Pradhan Mantri Gram Sadak Yojna (online),
http://www.harrida.gov.in/Maintenance%20Analysis.pdf, (Accessed on 10th
June,
2010).
48. PWD, 2007. Schedule of Rates for Road, Bridge and Culvert Works for all
Divisions under PWD (Public Works Department), Assam for the year 2007-2008,
Government of Assam, India.
49. Rakesh, N., Jain, A.K., Reddy, M.A. and Reddy, K. S., 2006. Artificial Neural
Networking- Genetic Algorithm Based Model for Backcalculation of Pavement
Layer Moduli, International Journal of Pavement Engineering, 7 (3), September,
221-230.
50. Rada, G.R., Stephanos, P.J. and Tayabji, S.D., 1993. Performance of Interlocking
Pavements in North America, National Research Council, Washington, D.C.
51. Reddy, K.S. and Pandey, B.B., 1992. Performance based Design Criteria for
Flexible Pavement, Indian Road Congress, New Delhi, 53 (2), 383-397.
52. Reddy, M.A., Kumar R.S., Reddy K.S. and Pandey, B.B., 2000. Development of
Falling Weight Deflectometer for Structural Evaluation of Pavements in India,
Proceedings of International seminar on Sustainable Development in Road
Transportation , India, I.175-I.184.
53. Reddy, M.A., Reddy, K.S. and Pandey, B.B., 2002. Evaluation of Pavement Layer
Moduli Using Genetic Algorithms, International Journal on Pavement Engineering
and Asphalt Technology, October, 6-19.
54. Reddy, M. V., Reddy, C. N. V. S., 2007. An Experimental Study on Use of Rock
Flour and Insulator Ceramic Scrap in Concrete, Institute of Engineers (India), 8,
August, 47-50.
TH-1037_07610405
107
55. Roy, S., Reddy, K.S., Pandey, B.B., 2009. Flexible-Rigid Pavement Materials- A
Sustainable Solution for Village Roads, Journal of the Indian Roads Congress,
New Delhi, 70 (3), 261-273.
56. Roy, S., Reddy, K.S., Pandey, B.B., 2010. An Investigation on the Cell Filled
Pavement, International Journal of Pavement Engineering, June, 1-9.
57. Ryntathiang, T.L., 2005. An Investigation on Precast and Cast In-situ Concrete
Block Pavements for Low Volume Roads, unpublished PhD Thesis, Department of
Civil Engineering, Indian Institute of Technology, Kharagpur-721302, India.
58. Ryntathiang, T.L., Mazumdar, M. and Pandey, B.B., 2005. Structural Behaviour
of Concrete Block Pavements, Journal of Transportation Engineering, 131(9),
662-668.
59. Safiuddin, Md., Raman, S. N., Zain, M. F. M., 2007. Utilization of Quarry Waste
Fine Aggregate in Concrete Mixtures, Journal of Applied Sciences Research, 3
(3), 202-208.
60. Sahoo, U.C., 2009. Performance Evaluation of Low Volume Roads, unpublished
PhD Thesis, Department of Civil Engineering, Indian Institute of Technology,
Kharagpur-721302, India.
61. Sahoo, U.C., Reddy, K.S. and Pandey, B.B., 2006. Structural Evaluation of
Concrete Filled Cell Pavement, International Journal of Pavement Engineering
and Asphalt Technology, U.K., 7 (1), pp. 27-37.
62. Sahu, A. K., Sunil, K., Sachan, A. K., 2003. Crushed Stone Waste as Fine
Aggregate for Concrete, The Indian Concrete Journal, January, 845-848.
63. SHELL, 1978. Shell Pavement Design Manual – Asphalts Pavement and Overlay
for Road Traffic, SHELL, International Petroleum Company Ltd, London.
64. Sinha, V.K., 2010. Extensive Construction of Concrete Roads: The Need of the
Hour, Indian Highways, Indian Road Congress, New Delhi, May, 38 (5), 31-37.
65. Shackel, B., Pearson, A. and Vella, A., 1998. Progress Towards a Maintenance
Management System for Concrete Block Pavement in Australia, 3rd
International
Workshop on Concrete Block Paving, Columbia, May10-13, 37-1-37-4.
TH-1037_07610405
108
66. Shahin, M.Y., 1994. Pavement Management for Airports Roads and Parking Lots,
First Edition, Chapman &Hall.
67. Shivaprakash, H. M., 2011. Cell-Filled Flexible-Rigid or Cast-in-situ Block
Pavement for Rural Roads, The Indian Concrete Journal, March, 85 (3), 54-58.
68. Srinivas, T., Suresh, K. and Pandey, B.B., 2007. Wheel Load and Temperature
Stresses in Concrete Pavement, Highway Research Bulletin, Indian Road
Congress, New Delhi, (76), 11-24.
69. Stephanos, P.J. and Rada, G.D., 1992. Guidelines for Defining Visual Distress in
Interlocking Concrete Pavements, PCS/ LAW Engineering, Washington, D.C.
70. Sudip, A., Burak, R. and Susan, T., 2009. Evaluation of Interlocking Concrete
Pavement Crosswalks Through an Innovative Field Experiment, 9th
International
Conference on Concrete Block Paving, Buenos Aires, Argentina, 18-21, October,
1-10.
71. Swanson, A.H., 1994. Survey of Low Volume Urban and Rural Roads, Institution
of Transportation Engineering, 64(3), 20-22.
72. Tripathy, D.K., and Barasi, S.V., 2006. Partial Cement Replacement Using
Crusher Stone Dust, Journals of Institute of Engineers (I), (87), 44-46.
73. Visser, A.T. and Hall, S., 1999. Flexible Portland Cement Concrete Pavement for
Low-Volume Roads, Transportation Research Record, 1652, Washington D. C.,
121-127.
74. Visser, A.T. and Hall, S., 2003. Innovative and Cost Effective Solutions for Roads
in Rural Areas and Difficult Terrain, Transportation Research Record, Journal of
Transportation Research Board, (1819 A), 169-173.
75. Visser, A.T., 1994. A Cast In-situ Block Pavement for Labour-Enhanced
Construction, Concrete Beton, Journal of the Concrete Society of South Africa,
(71), 1-8.
76. Visser, A.T., 1999. The Response of Flexible Portland Cement Concrete
Pavements Under Ultra Heavy Loading, Concrete Beton, Journal of the Concrete
Society of South Africa, (94), 11-18.
TH-1037_07610405
109
77. Yoder, E.J. and Witczak, M.W., 1975. Principles of Pavement Design, Wiley-
Interscience Publication, New York, United States of America.
TH-1037_07610405
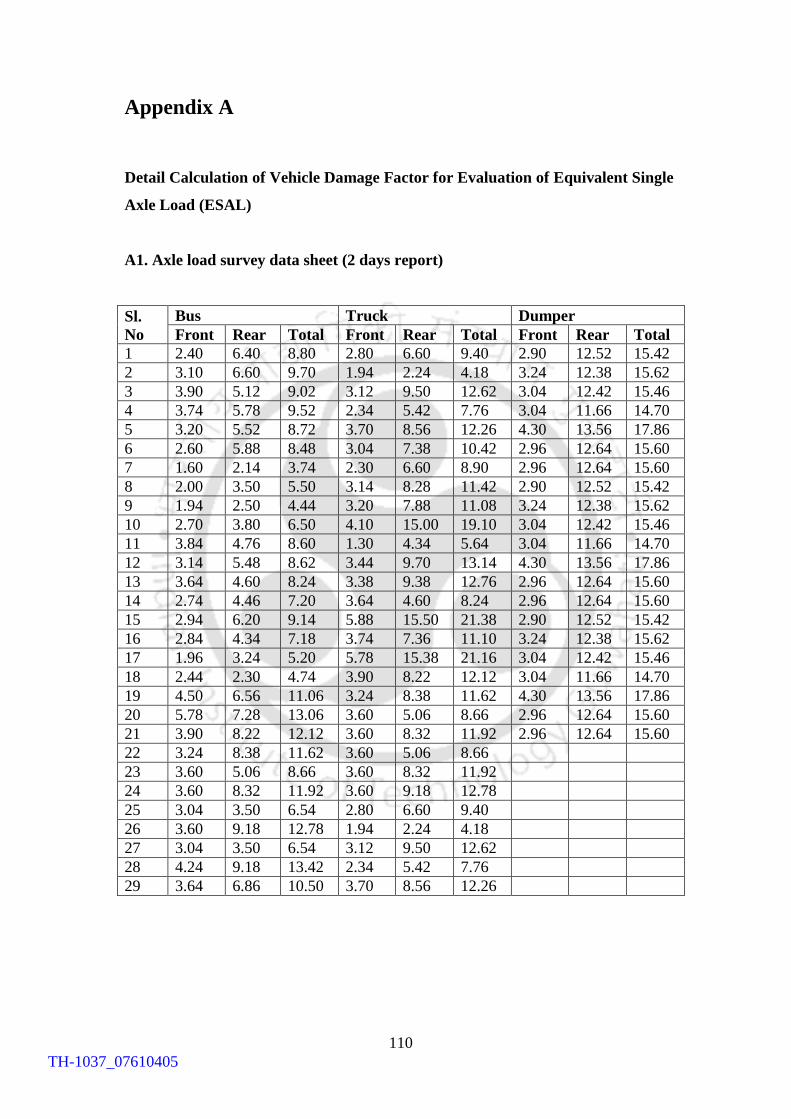
110
Appendix A
Detail Calculation of Vehicle Damage Factor for Evaluation of Equivalent Single
Axle Load (ESAL)
A1. Axle load survey data sheet (2 days report)
Sl.
No
Bus Truck Dumper
Front Rear Total Front Rear Total Front Rear Total
1 2.40 6.40 8.80 2.80 6.60 9.40 2.90 12.52 15.42
2 3.10 6.60 9.70 1.94 2.24 4.18 3.24 12.38 15.62
3 3.90 5.12 9.02 3.12 9.50 12.62 3.04 12.42 15.46
4 3.74 5.78 9.52 2.34 5.42 7.76 3.04 11.66 14.70
5 3.20 5.52 8.72 3.70 8.56 12.26 4.30 13.56 17.86
6 2.60 5.88 8.48 3.04 7.38 10.42 2.96 12.64 15.60
7 1.60 2.14 3.74 2.30 6.60 8.90 2.96 12.64 15.60
8 2.00 3.50 5.50 3.14 8.28 11.42 2.90 12.52 15.42
9 1.94 2.50 4.44 3.20 7.88 11.08 3.24 12.38 15.62
10 2.70 3.80 6.50 4.10 15.00 19.10 3.04 12.42 15.46
11 3.84 4.76 8.60 1.30 4.34 5.64 3.04 11.66 14.70
12 3.14 5.48 8.62 3.44 9.70 13.14 4.30 13.56 17.86
13 3.64 4.60 8.24 3.38 9.38 12.76 2.96 12.64 15.60
14 2.74 4.46 7.20 3.64 4.60 8.24 2.96 12.64 15.60
15 2.94 6.20 9.14 5.88 15.50 21.38 2.90 12.52 15.42
16 2.84 4.34 7.18 3.74 7.36 11.10 3.24 12.38 15.62
17 1.96 3.24 5.20 5.78 15.38 21.16 3.04 12.42 15.46
18 2.44 2.30 4.74 3.90 8.22 12.12 3.04 11.66 14.70
19 4.50 6.56 11.06 3.24 8.38 11.62 4.30 13.56 17.86
20 5.78 7.28 13.06 3.60 5.06 8.66 2.96 12.64 15.60
21 3.90 8.22 12.12 3.60 8.32 11.92 2.96 12.64 15.60
22 3.24 8.38 11.62 3.60 5.06 8.66
23 3.60 5.06 8.66 3.60 8.32 11.92
24 3.60 8.32 11.92 3.60 9.18 12.78
25 3.04 3.50 6.54 2.80 6.60 9.40
26 3.60 9.18 12.78 1.94 2.24 4.18
27 3.04 3.50 6.54 3.12 9.50 12.62
28 4.24 9.18 13.42 2.34 5.42 7.76
29 3.64 6.86 10.50 3.70 8.56 12.26
TH-1037_07610405
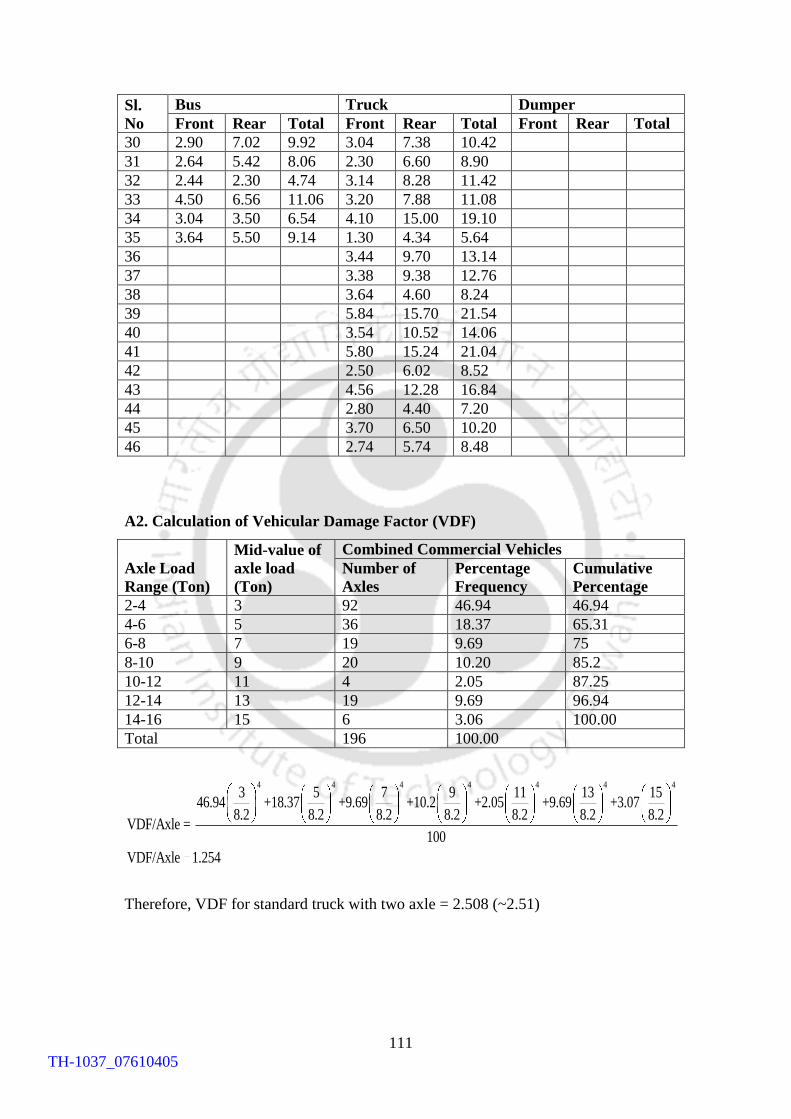
111
Sl.
No
Bus Truck Dumper
Front Rear Total Front Rear Total Front Rear Total
30 2.90 7.02 9.92 3.04 7.38 10.42
31 2.64 5.42 8.06 2.30 6.60 8.90
32 2.44 2.30 4.74 3.14 8.28 11.42
33 4.50 6.56 11.06 3.20 7.88 11.08
34 3.04 3.50 6.54 4.10 15.00 19.10
35 3.64 5.50 9.14 1.30 4.34 5.64
36 3.44 9.70 13.14
37 3.38 9.38 12.76
38 3.64 4.60 8.24
39 5.84 15.70 21.54
40 3.54 10.52 14.06
41 5.80 15.24 21.04
42 2.50 6.02 8.52
43 4.56 12.28 16.84
44 2.80 4.40 7.20
45 3.70 6.50 10.20
46 2.74 5.74 8.48
A2. Calculation of Vehicular Damage Factor (VDF)
Axle Load
Range (Ton)
Mid-value of
axle load
(Ton)
Combined Commercial Vehicles
Number of
Axles
Percentage
Frequency
Cumulative
Percentage
2-4 3 92 46.94 46.94
4-6 5 36 18.37 65.31
6-8 7 19 9.69 75
8-10 9 20 10.20 85.2
10-12 11 4 2.05 87.25
12-14 13 19 9.69 96.94
14-16 15 6 3.06 100.00
Total 196 100.00
4 4 4 4 4 4 43 5 7 9 11 13 15
46.94 +18.37 +9.69 +10.2 +2.05 +9.69 +3.078.2 8.2 8.2 8.2 8.2 8.2 8.2
VDF/Axle = 100
VDF/Axle 1.254
Therefore, VDF for standard truck with two axle = 2.508 (~2.51)
TH-1037_07610405
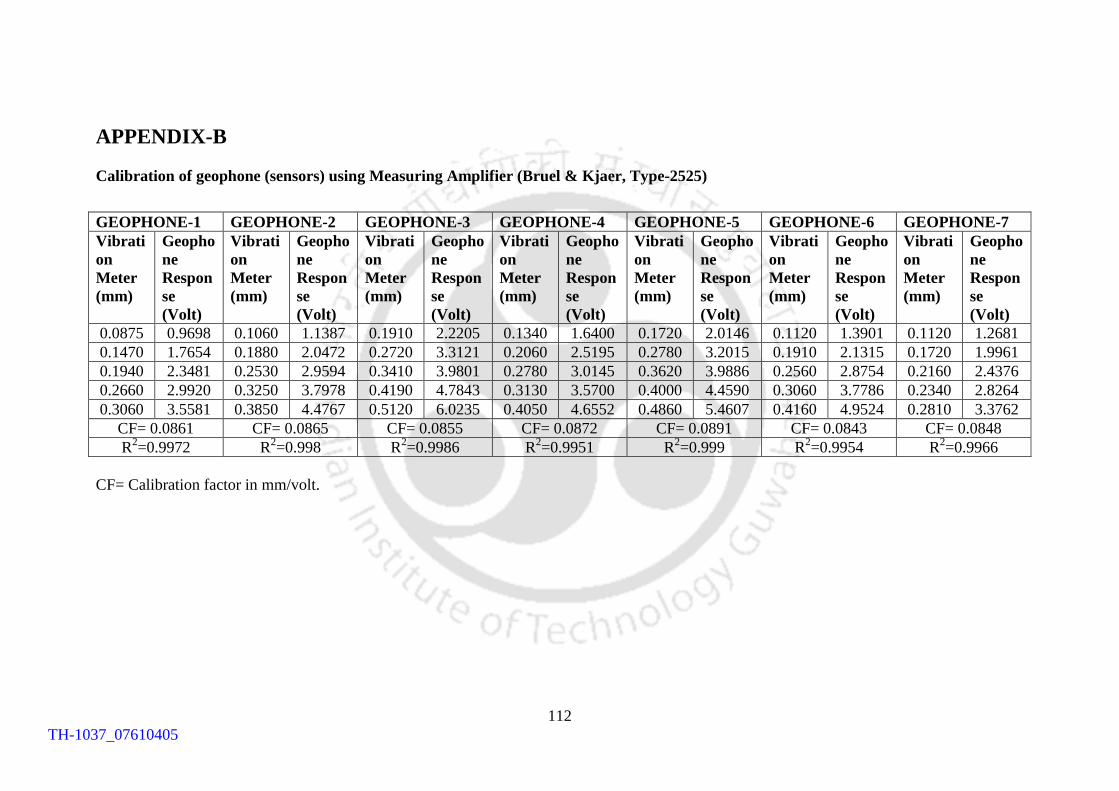
112
APPENDIX-B
Calibration of geophone (sensors) using Measuring Amplifier (Bruel & Kjaer, Type-2525)
CF= Calibration factor in mm/volt.
GEOPHONE-1 GEOPHONE-2 GEOPHONE-3 GEOPHONE-4 GEOPHONE-5 GEOPHONE-6 GEOPHONE-7
Vibrati
on
Meter
(mm)
Geopho
ne
Respon
se
(Volt)
Vibrati
on
Meter
(mm)
Geopho
ne
Respon
se
(Volt)
Vibrati
on
Meter
(mm)
Geopho
ne
Respon
se
(Volt)
Vibrati
on
Meter
(mm)
Geopho
ne
Respon
se
(Volt)
Vibrati
on
Meter
(mm)
Geopho
ne
Respon
se
(Volt)
Vibrati
on
Meter
(mm)
Geopho
ne
Respon
se
(Volt)
Vibrati
on
Meter
(mm)
Geopho
ne
Respon
se
(Volt)
0.0875 0.9698 0.1060 1.1387 0.1910 2.2205 0.1340 1.6400 0.1720 2.0146 0.1120 1.3901 0.1120 1.2681
0.1470 1.7654 0.1880 2.0472 0.2720 3.3121 0.2060 2.5195 0.2780 3.2015 0.1910 2.1315 0.1720 1.9961
0.1940 2.3481 0.2530 2.9594 0.3410 3.9801 0.2780 3.0145 0.3620 3.9886 0.2560 2.8754 0.2160 2.4376
0.2660 2.9920 0.3250 3.7978 0.4190 4.7843 0.3130 3.5700 0.4000 4.4590 0.3060 3.7786 0.2340 2.8264
0.3060 3.5581 0.3850 4.4767 0.5120 6.0235 0.4050 4.6552 0.4860 5.4607 0.4160 4.9524 0.2810 3.3762
CF= 0.0861 CF= 0.0865 CF= 0.0855 CF= 0.0872 CF= 0.0891 CF= 0.0843 CF= 0.0848
R2=0.9972 R
2=0.998 R
2=0.9986 R
2=0.9951 R
2=0.999 R
2=0.9954 R
2=0.9966
TH-1037_07610405
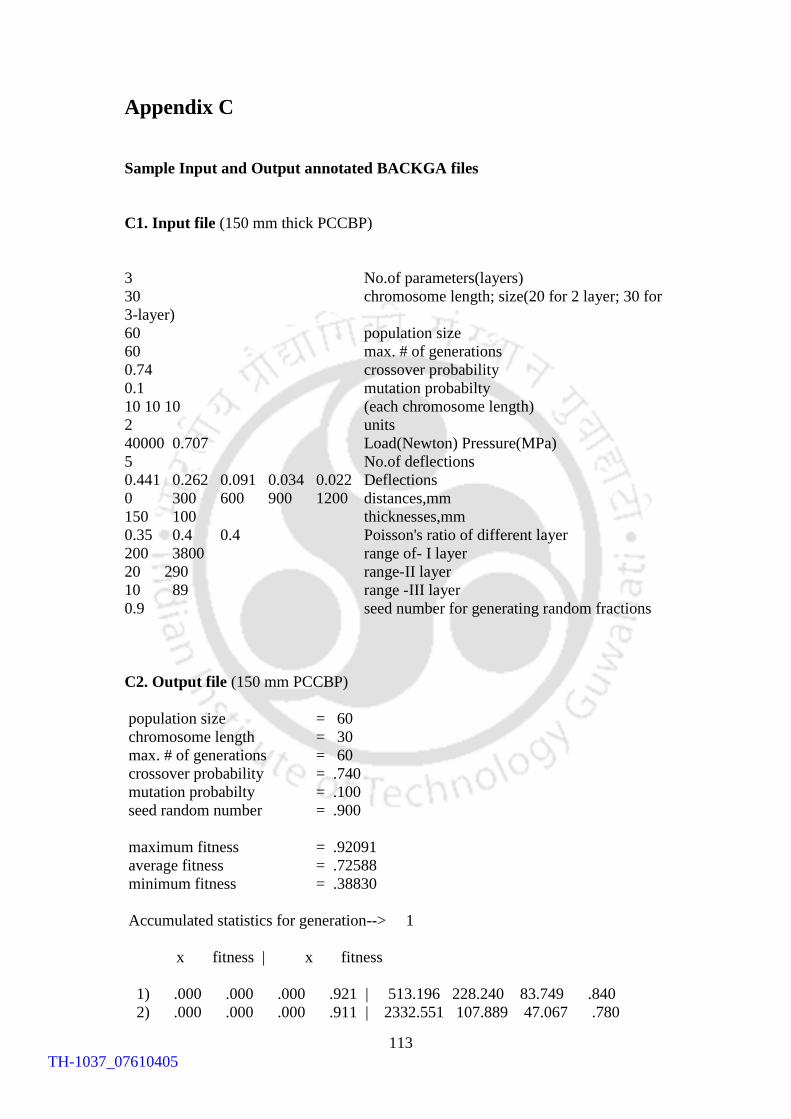
113
Appendix C
Sample Input and Output annotated BACKGA files
C1. Input file (150 mm thick PCCBP)
3 No.of parameters(layers)
30 chromosome length; size(20 for 2 layer; 30 for
3-layer)
60 population size
60 max. # of generations
0.74 crossover probability
0.1 mutation probabilty
10 10 10 (each chromosome length)
2 units
40000 0.707 Load(Newton) Pressure(MPa)
5 No.of deflections
0.441 0.262 0.091 0.034 0.022 Deflections
0 300 600 900 1200 distances,mm
150 100 thicknesses,mm
0.35 0.4 0.4 Poisson's ratio of different layer
200 3800 range of- I layer
20 290 range-II layer
10 89 range -III layer
0.9 seed number for generating random fractions
C2. Output file (150 mm PCCBP)
population size = 60
chromosome length = 30
max. # of generations = 60
crossover probability = .740
mutation probabilty = .100
seed random number = .900
maximum fitness = .92091
average fitness = .72588
minimum fitness = .38830
Accumulated statistics for generation--> 1
x fitness | x fitness
1) .000 .000 .000 .921 | 513.196 228.240 83.749 .840
2) .000 .000 .000 .911 | 2332.551 107.889 47.067 .780
TH-1037_07610405
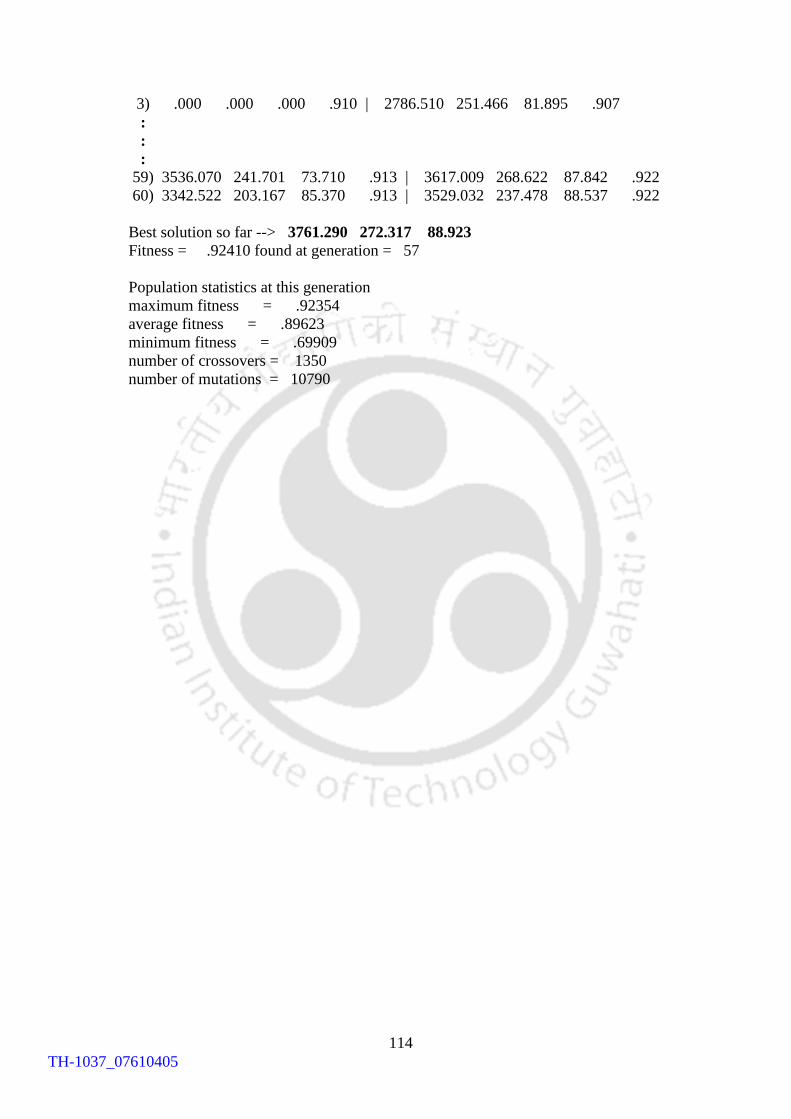
114
3) .000 .000 .000 .910 | 2786.510 251.466 81.895 .907
:
:
:
59) 3536.070 241.701 73.710 .913 | 3617.009 268.622 87.842 .922
60) 3342.522 203.167 85.370 .913 | 3529.032 237.478 88.537 .922
Best solution so far --> 3761.290 272.317 88.923
Fitness = .92410 found at generation = 57
Population statistics at this generation
maximum fitness = .92354
average fitness = .89623
minimum fitness = .69909
number of crossovers = 1350
number of mutations = 10790
TH-1037_07610405
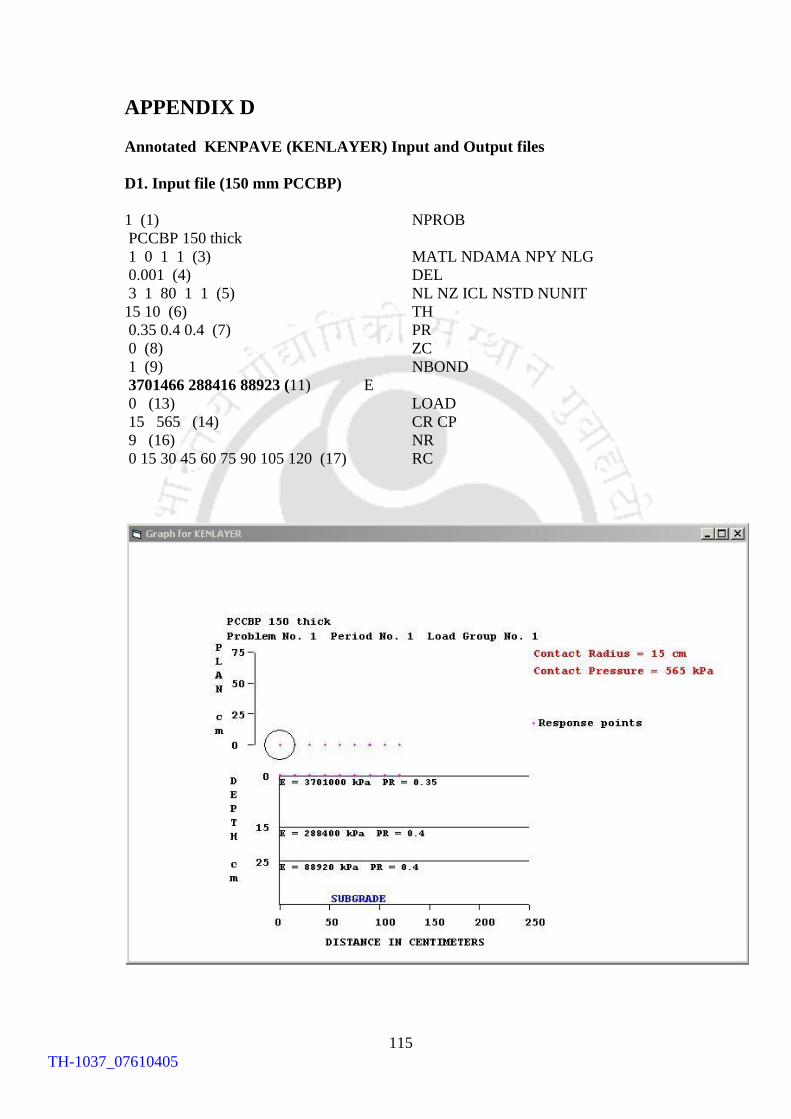
115
APPENDIX D
Annotated KENPAVE (KENLAYER) Input and Output files
D1. Input file (150 mm PCCBP)
1 (1) NPROB
PCCBP 150 thick
1 0 1 1 (3) MATL NDAMA NPY NLG
0.001 (4) DEL
3 1 80 1 1 (5) NL NZ ICL NSTD NUNIT
15 10 (6) TH
0.35 0.4 0.4 (7) PR
0 (8) ZC
1 (9) NBOND
3701466 288416 88923 (11) E
0 (13) LOAD
15 565 (14) CR CP
9 (16) NR
0 15 30 45 60 75 90 105 120 (17) RC
TH-1037_07610405
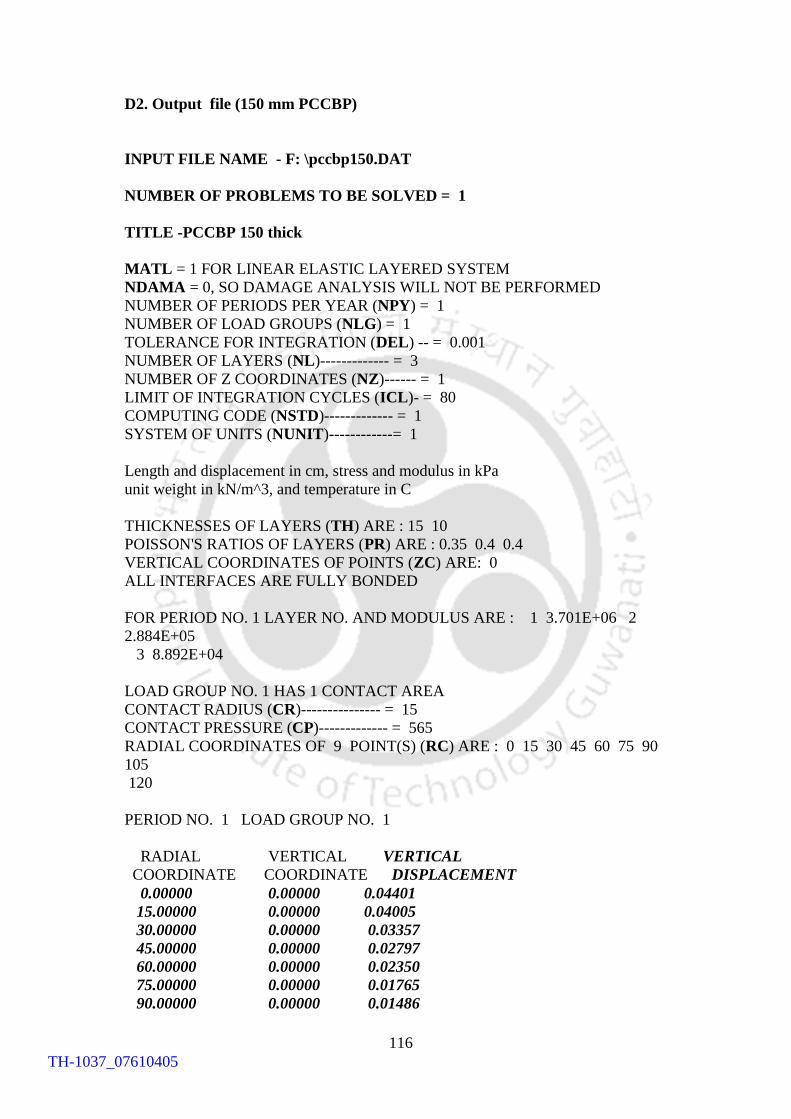
116
D2. Output file (150 mm PCCBP)
INPUT FILE NAME - F: \pccbp150.DAT
NUMBER OF PROBLEMS TO BE SOLVED = 1
TITLE -PCCBP 150 thick
MATL = 1 FOR LINEAR ELASTIC LAYERED SYSTEM
NDAMA = 0, SO DAMAGE ANALYSIS WILL NOT BE PERFORMED
NUMBER OF PERIODS PER YEAR (NPY) = 1
NUMBER OF LOAD GROUPS (NLG) = 1
TOLERANCE FOR INTEGRATION (DEL) -- = 0.001
NUMBER OF LAYERS (NL)------------- = 3
NUMBER OF Z COORDINATES (NZ)------ = 1
LIMIT OF INTEGRATION CYCLES (ICL)- = 80
COMPUTING CODE (NSTD)------------- = 1
SYSTEM OF UNITS (NUNIT)------------= 1
Length and displacement in cm, stress and modulus in kPa
unit weight in kN/m^3, and temperature in C
THICKNESSES OF LAYERS (TH) ARE : 15 10
POISSON'S RATIOS OF LAYERS (PR) ARE : 0.35 0.4 0.4
VERTICAL COORDINATES OF POINTS (ZC) ARE: 0
ALL INTERFACES ARE FULLY BONDED
FOR PERIOD NO. 1 LAYER NO. AND MODULUS ARE : 1 3.701E+06 2
2.884E+05
3 8.892E+04
LOAD GROUP NO. 1 HAS 1 CONTACT AREA
CONTACT RADIUS (CR)--------------- = 15
CONTACT PRESSURE (CP)------------- = 565
RADIAL COORDINATES OF 9 POINT(S) (RC) ARE : 0 15 30 45 60 75 90
105
120
PERIOD NO. 1 LOAD GROUP NO. 1
RADIAL VERTICAL VERTICAL
COORDINATE COORDINATE DISPLACEMENT
0.00000 0.00000 0.04401
15.00000 0.00000 0.04005
30.00000 0.00000 0.03357
45.00000 0.00000 0.02797
60.00000 0.00000 0.02350
75.00000 0.00000 0.01765
90.00000 0.00000 0.01486
TH-1037_07610405

117
105.00000 0.00000 0.01242
120.00000 0.00000 0.01065
TH-1037_07610405
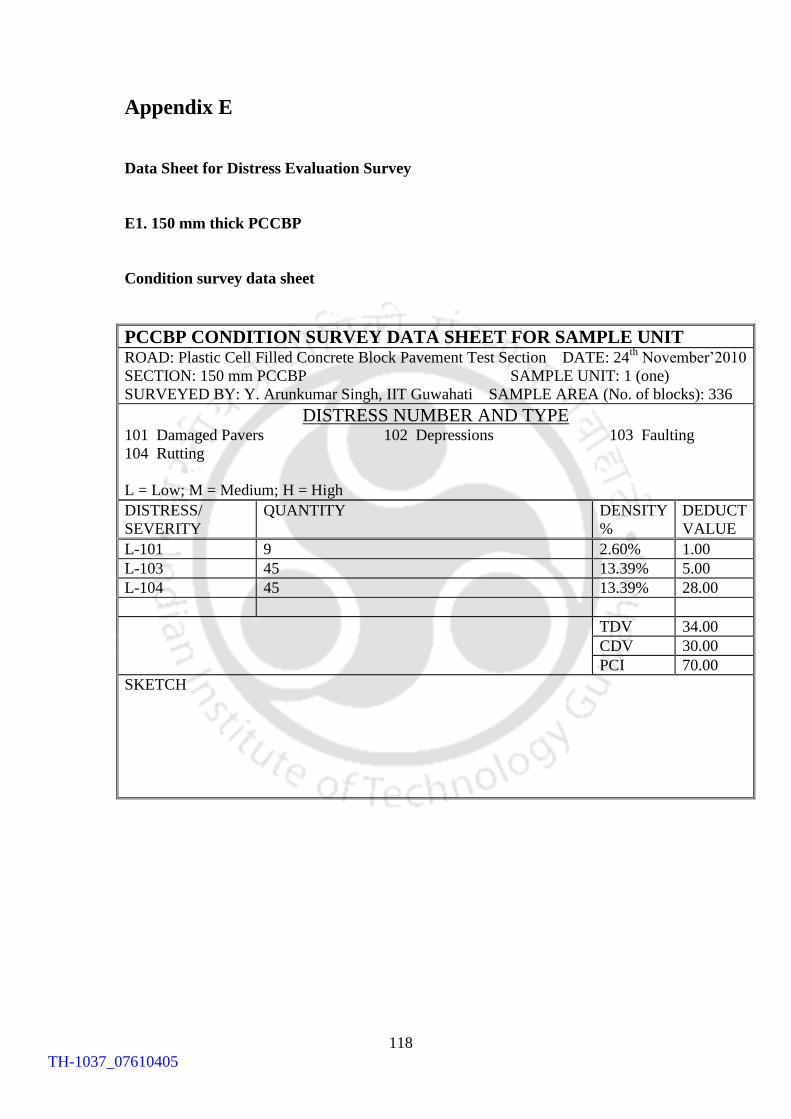
118
Appendix E
Data Sheet for Distress Evaluation Survey
E1. 150 mm thick PCCBP
Condition survey data sheet
PCCBP CONDITION SURVEY DATA SHEET FOR SAMPLE UNIT ROAD: Plastic Cell Filled Concrete Block Pavement Test Section DATE: 24
th November‟2010
SECTION: 150 mm PCCBP SAMPLE UNIT: 1 (one)
SURVEYED BY: Y. Arunkumar Singh, IIT Guwahati SAMPLE AREA (No. of blocks): 336
DISTRESS NUMBER AND TYPE 101 Damaged Pavers 102 Depressions 103 Faulting
104 Rutting
L = Low; M = Medium; H = High
DISTRESS/
SEVERITY
QUANTITY
DENSITY
%
DEDUCT
VALUE
L-101 9 2.60% 1.00
L-103 45 13.39% 5.00
L-104 45 13.39% 28.00
TDV 34.00
CDV 30.00
PCI 70.00
SKETCH
TH-1037_07610405
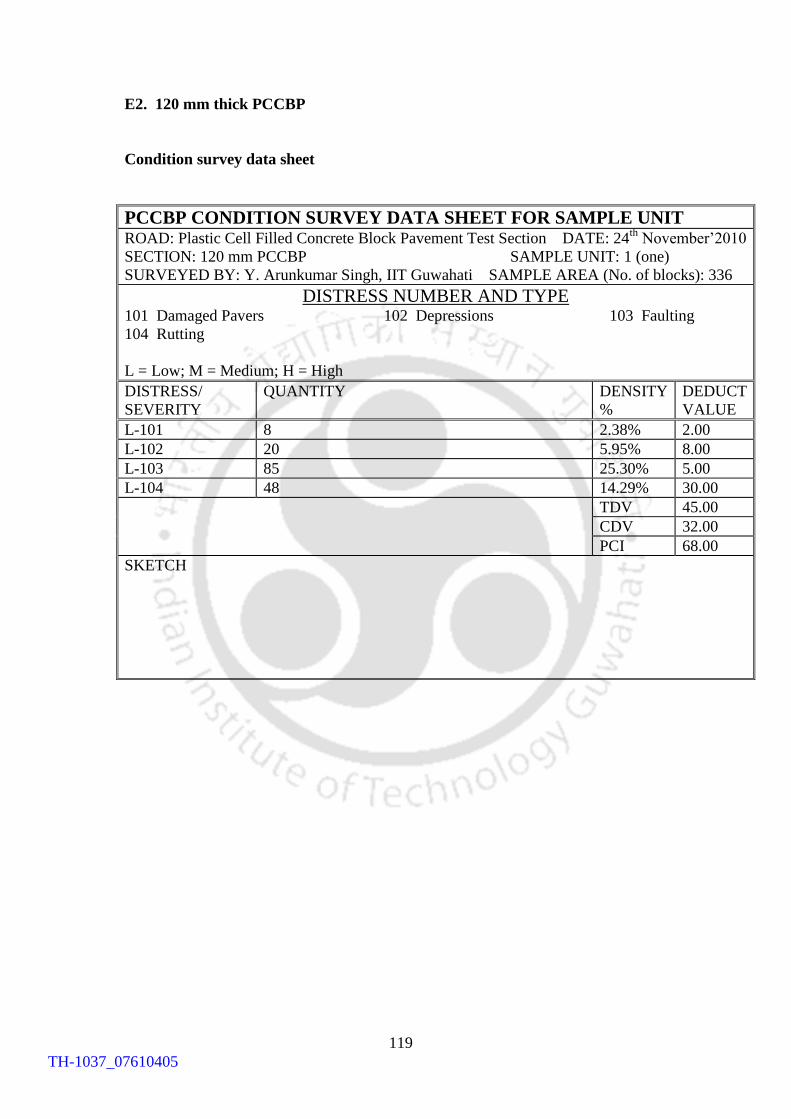
119
E2. 120 mm thick PCCBP
Condition survey data sheet
PCCBP CONDITION SURVEY DATA SHEET FOR SAMPLE UNIT ROAD: Plastic Cell Filled Concrete Block Pavement Test Section DATE: 24
th November‟2010
SECTION: 120 mm PCCBP SAMPLE UNIT: 1 (one)
SURVEYED BY: Y. Arunkumar Singh, IIT Guwahati SAMPLE AREA (No. of blocks): 336
DISTRESS NUMBER AND TYPE 101 Damaged Pavers 102 Depressions 103 Faulting
104 Rutting
L = Low; M = Medium; H = High
DISTRESS/
SEVERITY
QUANTITY
DENSITY
%
DEDUCT
VALUE
L-101 8 2.38% 2.00
L-102 20 5.95% 8.00
L-103 85 25.30% 5.00
L-104 48 14.29% 30.00
TDV 45.00
CDV 32.00
PCI 68.00
SKETCH
TH-1037_07610405
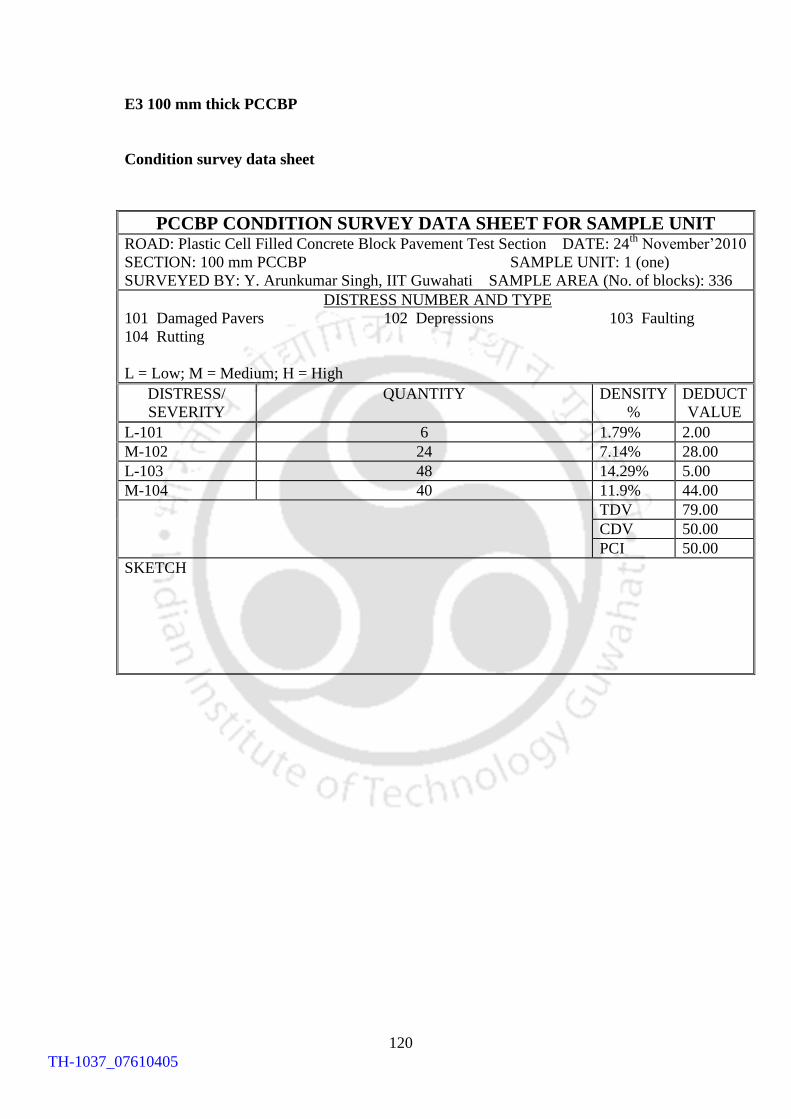
120
E3 100 mm thick PCCBP
Condition survey data sheet
PCCBP CONDITION SURVEY DATA SHEET FOR SAMPLE UNIT ROAD: Plastic Cell Filled Concrete Block Pavement Test Section DATE: 24
th November‟2010
SECTION: 100 mm PCCBP SAMPLE UNIT: 1 (one)
SURVEYED BY: Y. Arunkumar Singh, IIT Guwahati SAMPLE AREA (No. of blocks): 336
DISTRESS NUMBER AND TYPE
101 Damaged Pavers 102 Depressions 103 Faulting
104 Rutting
L = Low; M = Medium; H = High
DISTRESS/
SEVERITY
QUANTITY
DENSITY
%
DEDUCT
VALUE
L-101 6 1.79% 2.00
M-102 24 7.14% 28.00
L-103 48 14.29% 5.00
M-104 40 11.9% 44.00
TDV 79.00
CDV 50.00
PCI 50.00
SKETCH
TH-1037_07610405

121
E4. 80 mm thick PCCBP
Condition survey data sheet
PCCBP CONDITION SURVEY DATA SHEET FOR SAMPLE UNIT ROAD: Plastic Cell Filled Concrete Block Pavement Test Section DATE: 24
th November‟2010
SECTION: 80 mm PCCBP SAMPLE UNIT: 1 (one)
SURVEYED BY: Y. Arunkumar Singh, IIT Guwahati SAMPLE AREA (No. of blocks): 336
DISTRESS NUMBER AND TYPE 101 Damaged Pavers 102 Depressions 103 Faulting
104 Rutting
L = Low; M = Medium; H = High
DISTRESS/
SEVERITY
QUANTITY
DENSITY
%
DEDUCT
VALUE
L-101 12 3.57% 2.00
M-102 28 8.33% 28.00
L-103 82 24.40% 5.00
M-104 55 16.37% 48.00
TDV 83.00
CDV 52.00
PCI 48.00
SKETCH
TH-1037_07610405
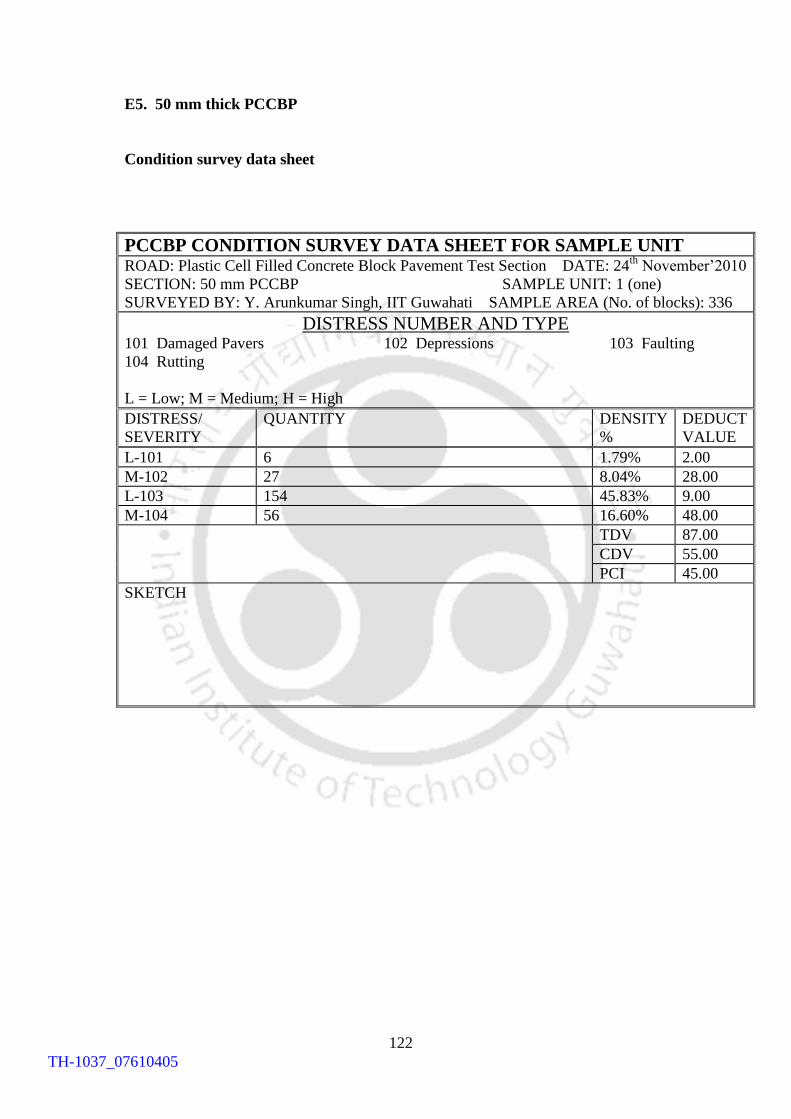
122
E5. 50 mm thick PCCBP
Condition survey data sheet
PCCBP CONDITION SURVEY DATA SHEET FOR SAMPLE UNIT ROAD: Plastic Cell Filled Concrete Block Pavement Test Section DATE: 24
th November‟2010
SECTION: 50 mm PCCBP SAMPLE UNIT: 1 (one)
SURVEYED BY: Y. Arunkumar Singh, IIT Guwahati SAMPLE AREA (No. of blocks): 336
DISTRESS NUMBER AND TYPE 101 Damaged Pavers 102 Depressions 103 Faulting
104 Rutting
L = Low; M = Medium; H = High
DISTRESS/
SEVERITY
QUANTITY
DENSITY
%
DEDUCT
VALUE
L-101 6 1.79% 2.00
M-102 27 8.04% 28.00
L-103 154 45.83% 9.00
M-104 56 16.60% 48.00
TDV 87.00
CDV 55.00
PCI 45.00
SKETCH
TH-1037_07610405
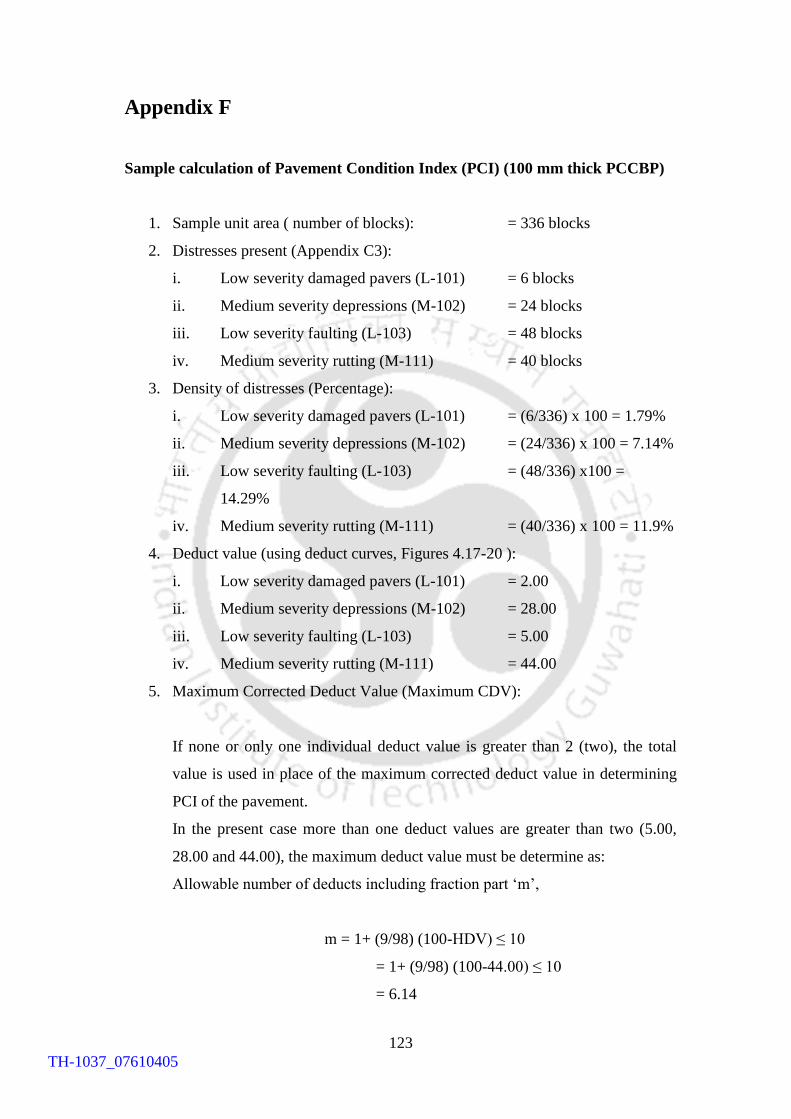
123
Appendix F
Sample calculation of Pavement Condition Index (PCI) (100 mm thick PCCBP)
1. Sample unit area ( number of blocks): = 336 blocks
2. Distresses present (Appendix C3):
i. Low severity damaged pavers (L-101) = 6 blocks
ii. Medium severity depressions (M-102) = 24 blocks
iii. Low severity faulting (L-103) = 48 blocks
iv. Medium severity rutting (M-111) = 40 blocks
3. Density of distresses (Percentage):
i. Low severity damaged pavers (L-101) = (6/336) x 100 = 1.79%
ii. Medium severity depressions (M-102) = (24/336) x 100 = 7.14%
iii. Low severity faulting (L-103) = (48/336) x100 =
14.29%
iv. Medium severity rutting (M-111) = (40/336) x 100 = 11.9%
4. Deduct value (using deduct curves, Figures 4.17-20 ):
i. Low severity damaged pavers (L-101) = 2.00
ii. Medium severity depressions (M-102) = 28.00
iii. Low severity faulting (L-103) = 5.00
iv. Medium severity rutting (M-111) = 44.00
5. Maximum Corrected Deduct Value (Maximum CDV):
If none or only one individual deduct value is greater than 2 (two), the total
value is used in place of the maximum corrected deduct value in determining
PCI of the pavement.
In the present case more than one deduct values are greater than two (5.00,
28.00 and 44.00), the maximum deduct value must be determine as:
Allowable number of deducts including fraction part „m‟,
m = 1+ (9/98) (100-HDV) ≤ 10
= 1+ (9/98) (100-44.00) ≤ 10
= 6.14
TH-1037_07610405
124
Here, less than 6.14 number of deduct values (i.e., 4 numbers) are available,
all the deduct values (2.00, 28.00, 5.00 and 44.00) are used for calculation of
the maximum corrected deduct value.
Total deduct value, TDV = 2.00 + 5.00 +28.00 + 44.00 = 79.00
Again the number of deduct values greater than 2 (two), q = 3
The Maximum CDV is calculated using CDV curve (ICPI-2007) for TDV =
79.00 and q = 3.
From Figure 4.21, the Maximum CDV = 50.
Therefore, the PCI of the 100 mm thick PCCBP test section is calculated as:
PCI = 100 – Maximum CDV = 100 – 50 = 50
Using PCI rating chart (Figure 4.16), the test section is rated as „Fair‟.
TH-1037_07610405
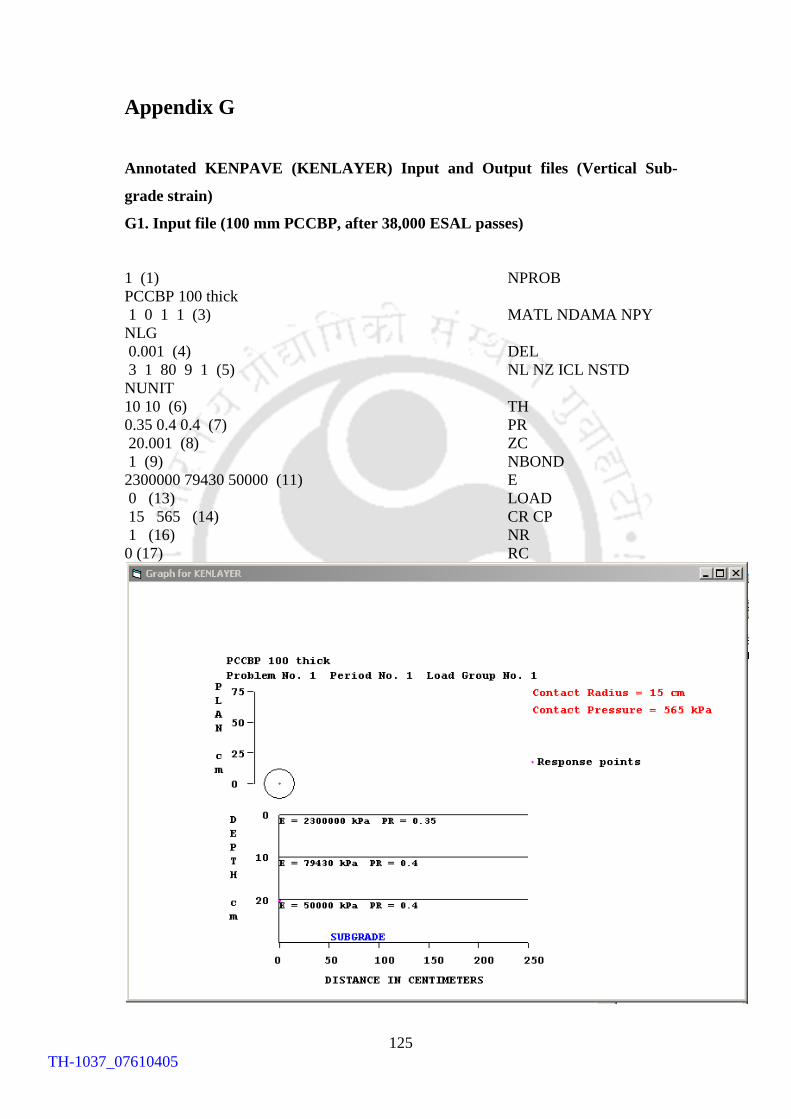
125
Appendix G
Annotated KENPAVE (KENLAYER) Input and Output files (Vertical Sub-
grade strain)
G1. Input file (100 mm PCCBP, after 38,000 ESAL passes)
1 (1) NPROB
PCCBP 100 thick
1 0 1 1 (3) MATL NDAMA NPY
NLG
0.001 (4) DEL
3 1 80 9 1 (5) NL NZ ICL NSTD
NUNIT
10 10 (6) TH
0.35 0.4 0.4 (7) PR
20.001 (8) ZC
1 (9) NBOND
2300000 79430 50000 (11) E
0 (13) LOAD
15 565 (14) CR CP
1 (16) NR
0 (17) RC
TH-1037_07610405
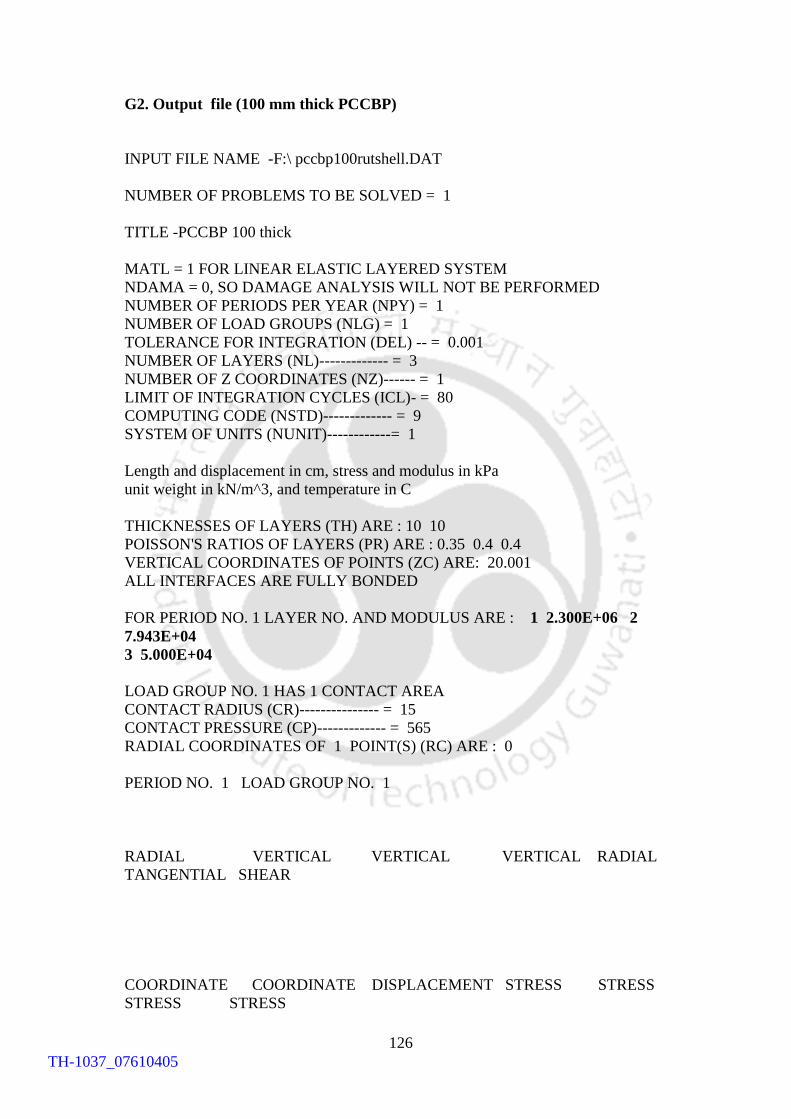
126
G2. Output file (100 mm thick PCCBP)
INPUT FILE NAME -F:\ pccbp100rutshell.DAT
NUMBER OF PROBLEMS TO BE SOLVED = 1
TITLE -PCCBP 100 thick
MATL = 1 FOR LINEAR ELASTIC LAYERED SYSTEM
NDAMA = 0, SO DAMAGE ANALYSIS WILL NOT BE PERFORMED
NUMBER OF PERIODS PER YEAR (NPY) = 1
NUMBER OF LOAD GROUPS (NLG) = 1
TOLERANCE FOR INTEGRATION (DEL) -- = 0.001
NUMBER OF LAYERS (NL)------------- = 3
NUMBER OF Z COORDINATES (NZ)------ = 1
LIMIT OF INTEGRATION CYCLES (ICL)- = 80
COMPUTING CODE (NSTD)------------- = 9
SYSTEM OF UNITS (NUNIT)------------= 1
Length and displacement in cm, stress and modulus in kPa
unit weight in kN/m^3, and temperature in C
THICKNESSES OF LAYERS (TH) ARE : 10 10
POISSON'S RATIOS OF LAYERS (PR) ARE : 0.35 0.4 0.4
VERTICAL COORDINATES OF POINTS (ZC) ARE: 20.001
ALL INTERFACES ARE FULLY BONDED
FOR PERIOD NO. 1 LAYER NO. AND MODULUS ARE : 1 2.300E+06 2
7.943E+04
3 5.000E+04
LOAD GROUP NO. 1 HAS 1 CONTACT AREA
CONTACT RADIUS (CR)--------------- = 15
CONTACT PRESSURE (CP)------------- = 565
RADIAL COORDINATES OF 1 POINT(S) (RC) ARE : 0
PERIOD NO. 1 LOAD GROUP NO. 1
RADIAL VERTICAL VERTICAL VERTICAL RADIAL
TANGENTIAL SHEAR
COORDINATE COORDINATE DISPLACEMENT STRESS STRESS
STRESS STRESS
TH-1037_07610405
127
(STRAIN) (STRAIN)
(STRAIN) (STRAIN)
0.00000 20.00100 0.09422 100.444 11.051
11.051 0.000 (STRAIN)
1.832E-03 -6.709E-04 -6.709E-04 .000E+00
TH-1037_07610405
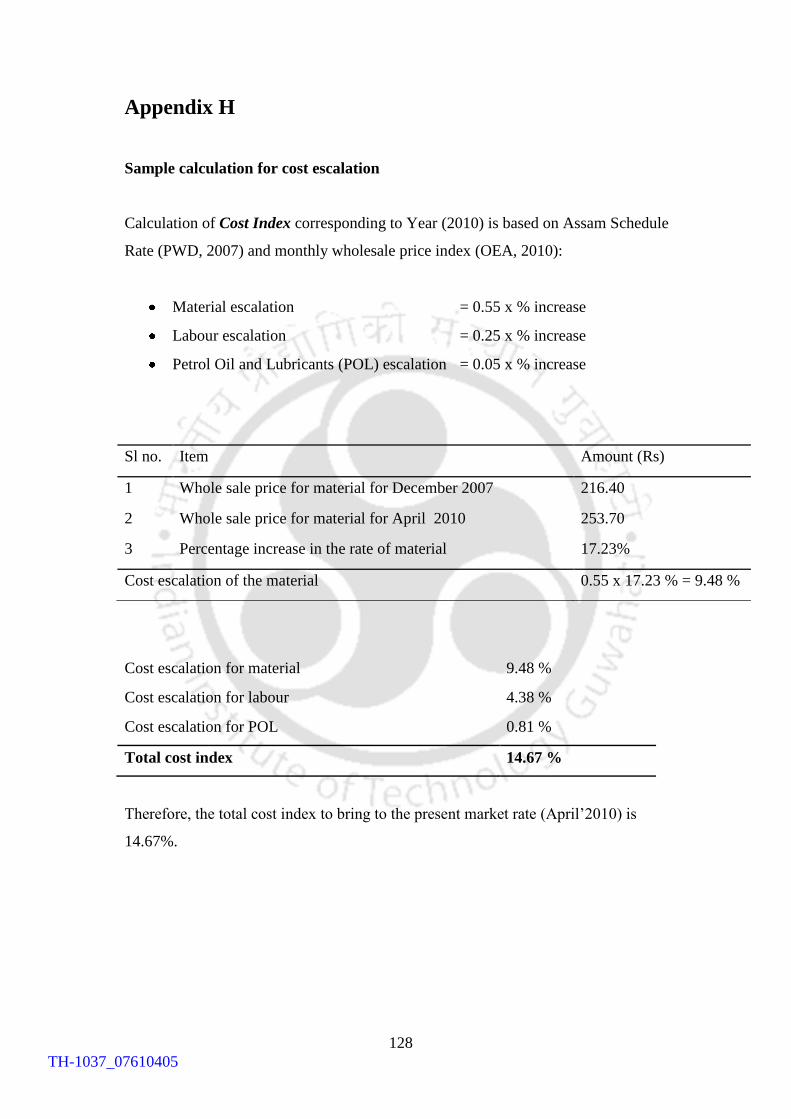
128
Appendix H
Sample calculation for cost escalation
Calculation of Cost Index corresponding to Year (2010) is based on Assam Schedule
Rate (PWD, 2007) and monthly wholesale price index (OEA, 2010):
Material escalation = 0.55 x % increase
Labour escalation = 0.25 x % increase
Petrol Oil and Lubricants (POL) escalation = 0.05 x % increase
Cost escalation for material 9.48 %
Cost escalation for labour 4.38 %
Cost escalation for POL 0.81 %
Total cost index 14.67 %
Therefore, the total cost index to bring to the present market rate (April‟2010) is
14.67%.
Sl no. Item Amount (Rs)
1 Whole sale price for material for December 2007 216.40
2 Whole sale price for material for April 2010 253.70
3 Percentage increase in the rate of material 17.23%
Cost escalation of the material 0.55 x 17.23 % = 9.48 %
TH-1037_07610405
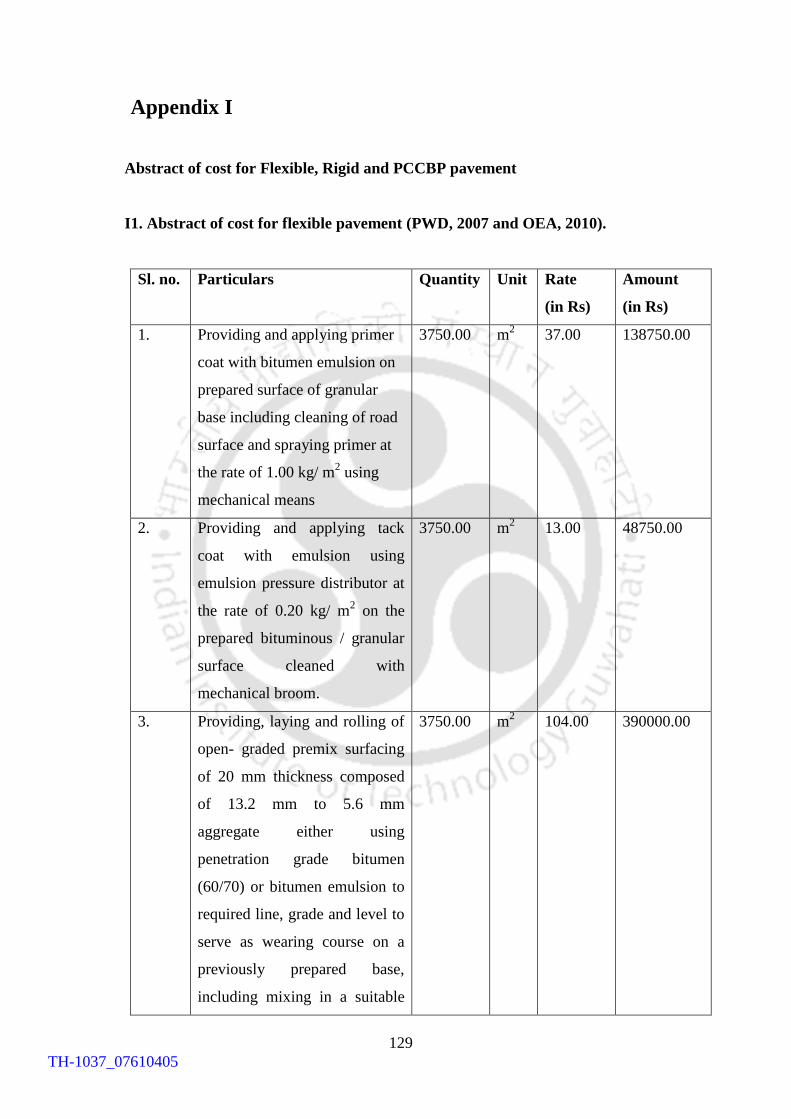
129
Appendix I
Abstract of cost for Flexible, Rigid and PCCBP pavement
I1. Abstract of cost for flexible pavement (PWD, 2007 and OEA, 2010).
Sl. no. Particulars Quantity Unit Rate
(in Rs)
Amount
(in Rs)
1. Providing and applying primer
coat with bitumen emulsion on
prepared surface of granular
base including cleaning of road
surface and spraying primer at
the rate of 1.00 kg/ m2 using
mechanical means
3750.00 m2 37.00 138750.00
2. Providing and applying tack
coat with emulsion using
emulsion pressure distributor at
the rate of 0.20 kg/ m2 on the
prepared bituminous / granular
surface cleaned with
mechanical broom.
3750.00 m2 13.00 48750.00
3. Providing, laying and rolling of
open- graded premix surfacing
of 20 mm thickness composed
of 13.2 mm to 5.6 mm
aggregate either using
penetration grade bitumen
(60/70) or bitumen emulsion to
required line, grade and level to
serve as wearing course on a
previously prepared base,
including mixing in a suitable
3750.00 m2 104.00 390000.00
TH-1037_07610405
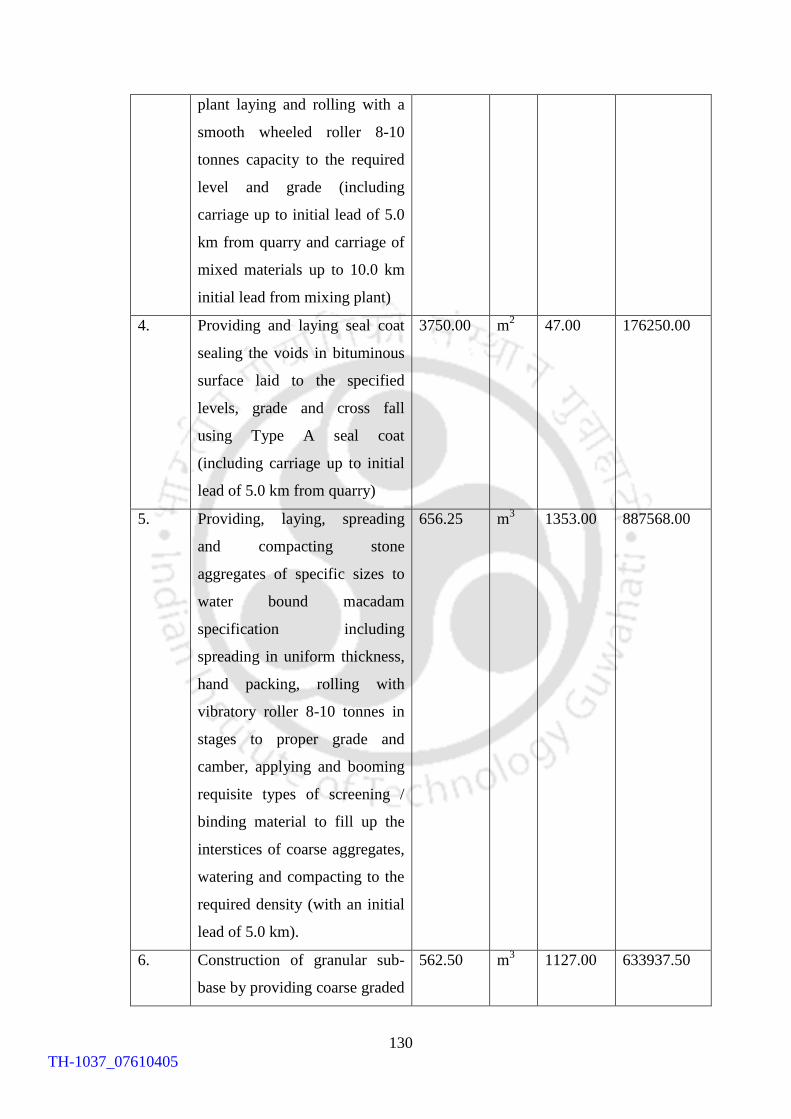
130
plant laying and rolling with a
smooth wheeled roller 8-10
tonnes capacity to the required
level and grade (including
carriage up to initial lead of 5.0
km from quarry and carriage of
mixed materials up to 10.0 km
initial lead from mixing plant)
4. Providing and laying seal coat
sealing the voids in bituminous
surface laid to the specified
levels, grade and cross fall
using Type A seal coat
(including carriage up to initial
lead of 5.0 km from quarry)
3750.00 m2 47.00 176250.00
5. Providing, laying, spreading
and compacting stone
aggregates of specific sizes to
water bound macadam
specification including
spreading in uniform thickness,
hand packing, rolling with
vibratory roller 8-10 tonnes in
stages to proper grade and
camber, applying and booming
requisite types of screening /
binding material to fill up the
interstices of coarse aggregates,
watering and compacting to the
required density (with an initial
lead of 5.0 km).
656.25 m3 1353.00 887568.00
6. Construction of granular sub-
base by providing coarse graded
562.50 m3 1127.00 633937.50
TH-1037_07610405
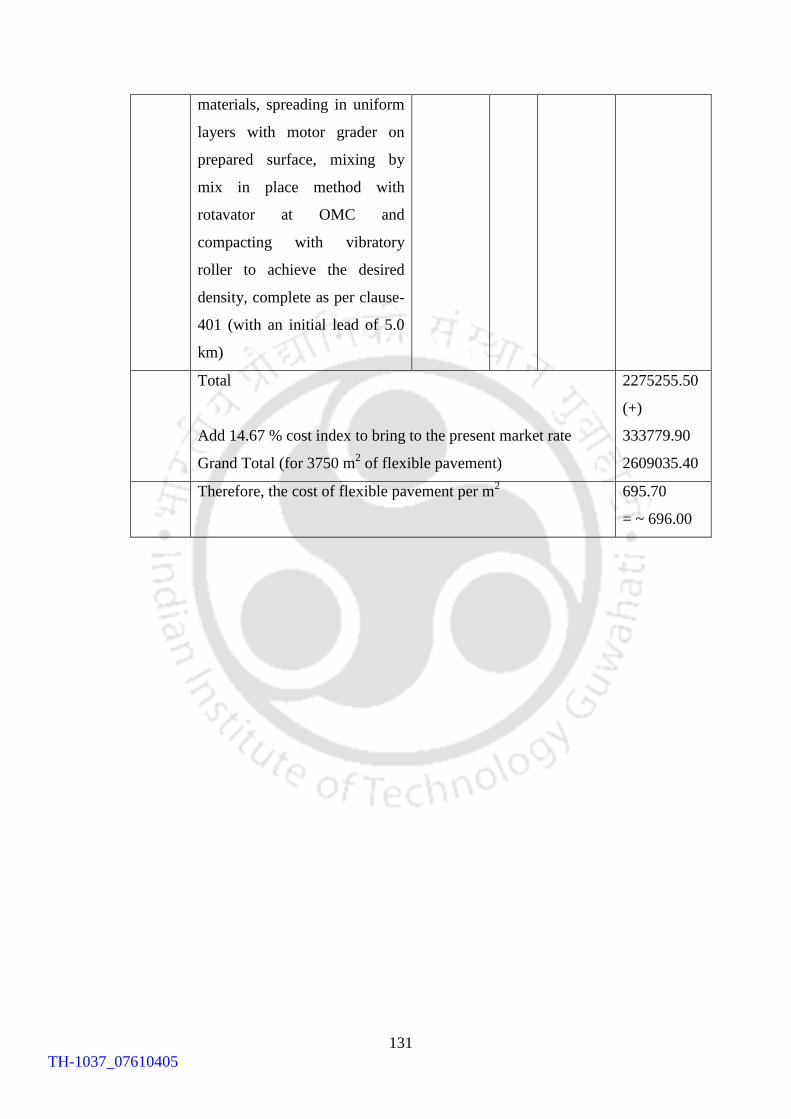
131
materials, spreading in uniform
layers with motor grader on
prepared surface, mixing by
mix in place method with
rotavator at OMC and
compacting with vibratory
roller to achieve the desired
density, complete as per clause-
401 (with an initial lead of 5.0
km)
Total
Add 14.67 % cost index to bring to the present market rate
Grand Total (for 3750 m2 of flexible pavement)
2275255.50
(+)
333779.90
2609035.40
Therefore, the cost of flexible pavement per m2
695.70
= ~ 696.00
TH-1037_07610405
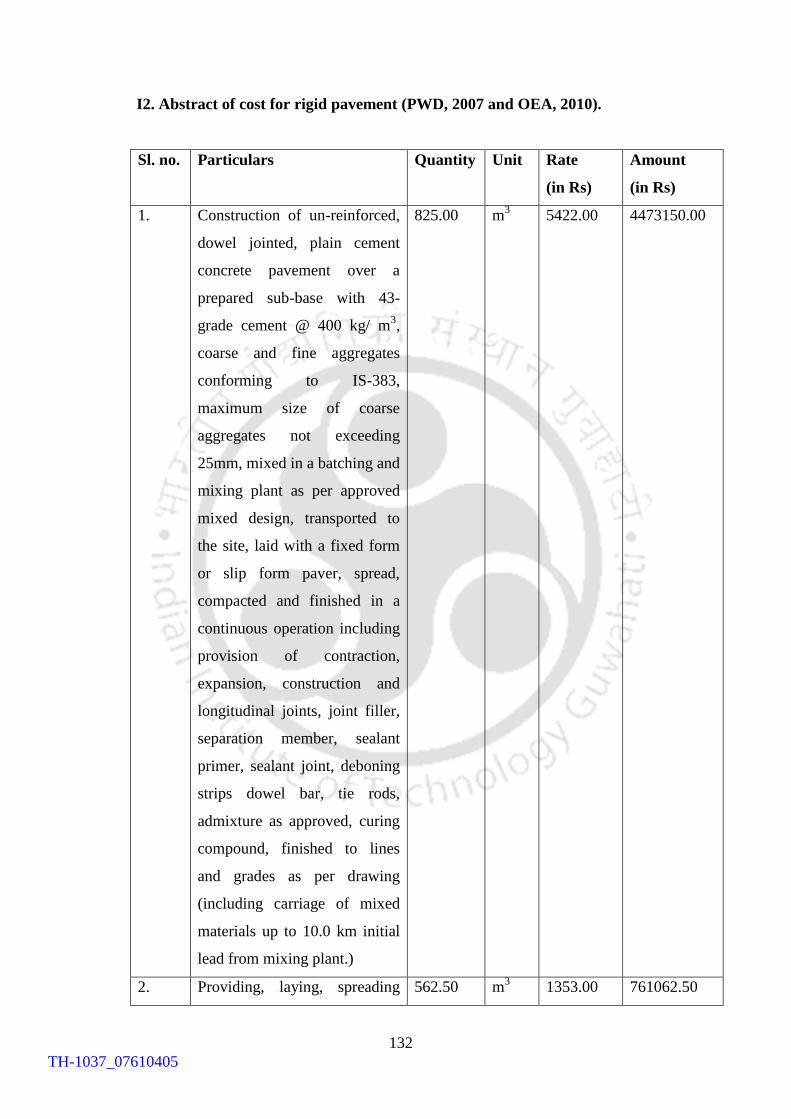
132
I2. Abstract of cost for rigid pavement (PWD, 2007 and OEA, 2010).
Sl. no. Particulars Quantity Unit Rate
(in Rs)
Amount
(in Rs)
1. Construction of un-reinforced,
dowel jointed, plain cement
concrete pavement over a
prepared sub-base with 43-
grade cement @ 400 kg/ m3,
coarse and fine aggregates
conforming to IS-383,
maximum size of coarse
aggregates not exceeding
25mm, mixed in a batching and
mixing plant as per approved
mixed design, transported to
the site, laid with a fixed form
or slip form paver, spread,
compacted and finished in a
continuous operation including
provision of contraction,
expansion, construction and
longitudinal joints, joint filler,
separation member, sealant
primer, sealant joint, deboning
strips dowel bar, tie rods,
admixture as approved, curing
compound, finished to lines
and grades as per drawing
(including carriage of mixed
materials up to 10.0 km initial
lead from mixing plant.)
825.00 m3 5422.00 4473150.00
2. Providing, laying, spreading 562.50 m3 1353.00 761062.50
TH-1037_07610405
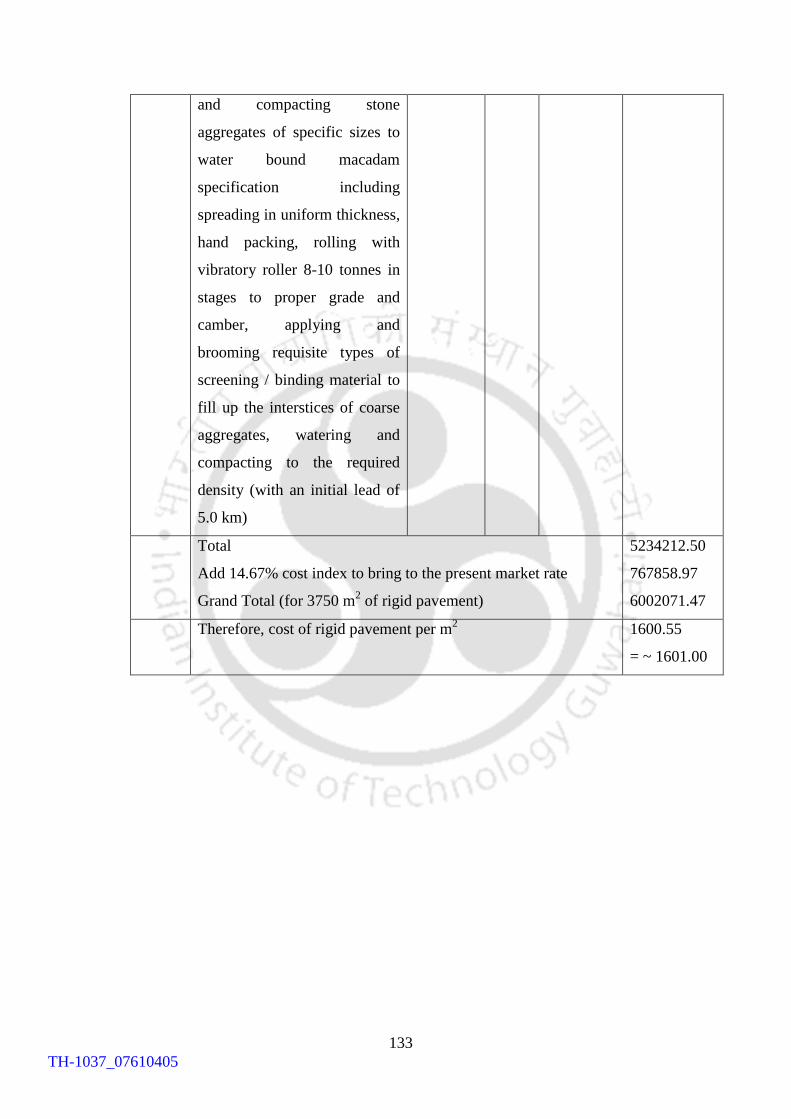
133
and compacting stone
aggregates of specific sizes to
water bound macadam
specification including
spreading in uniform thickness,
hand packing, rolling with
vibratory roller 8-10 tonnes in
stages to proper grade and
camber, applying and
brooming requisite types of
screening / binding material to
fill up the interstices of coarse
aggregates, watering and
compacting to the required
density (with an initial lead of
5.0 km)
Total
Add 14.67% cost index to bring to the present market rate
Grand Total (for 3750 m2 of rigid pavement)
5234212.50
767858.97
6002071.47
Therefore, cost of rigid pavement per m2
1600.55
= ~ 1601.00
TH-1037_07610405
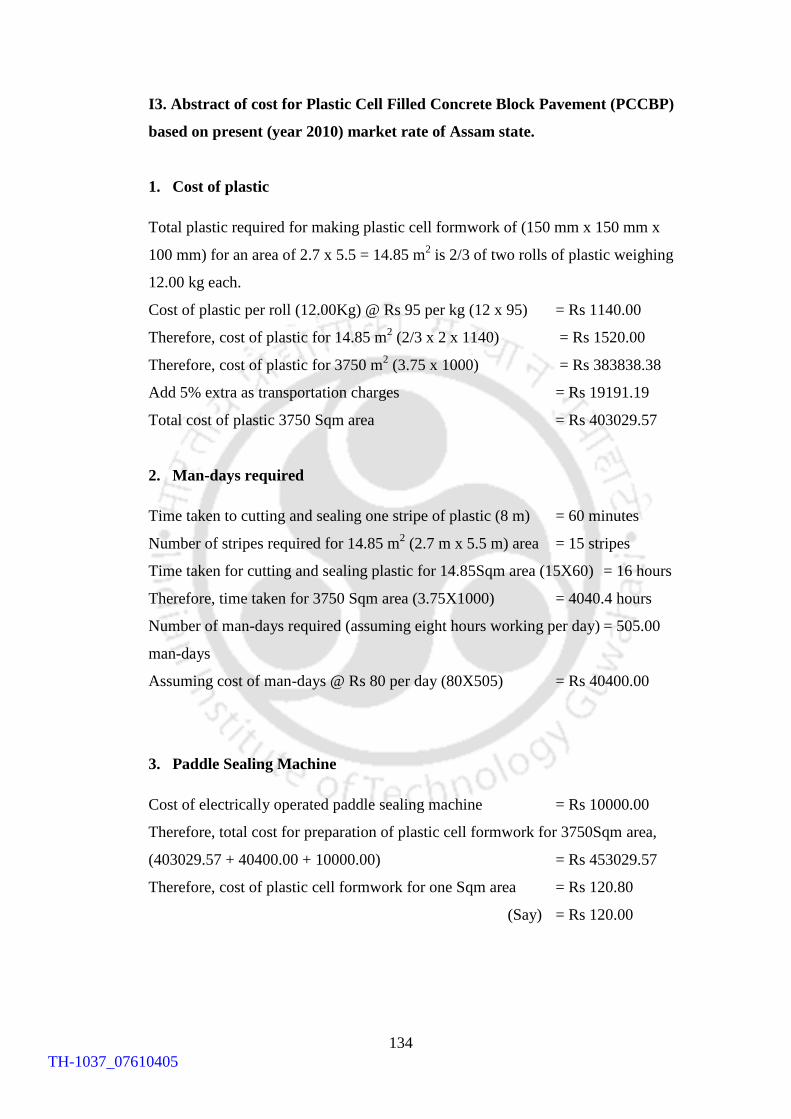
134
I3. Abstract of cost for Plastic Cell Filled Concrete Block Pavement (PCCBP)
based on present (year 2010) market rate of Assam state.
1. Cost of plastic
Total plastic required for making plastic cell formwork of (150 mm x 150 mm x
100 mm) for an area of 2.7 x 5.5 = 14.85 m2 is 2/3 of two rolls of plastic weighing
12.00 kg each.
Cost of plastic per roll (12.00Kg) @ Rs 95 per kg (12 x 95) = Rs 1140.00
Therefore, cost of plastic for 14.85 m2 (2/3 x 2 x 1140) = Rs 1520.00
Therefore, cost of plastic for 3750 m2 (3.75 x 1000) = Rs 383838.38
Add 5% extra as transportation charges = Rs 19191.19
Total cost of plastic 3750 Sqm area = Rs 403029.57
2. Man-days required
Time taken to cutting and sealing one stripe of plastic (8 m) = 60 minutes
Number of stripes required for 14.85 m2 (2.7 m x 5.5 m) area = 15 stripes
Time taken for cutting and sealing plastic for 14.85Sqm area (15X60) = 16 hours
Therefore, time taken for 3750 Sqm area (3.75X1000) = 4040.4 hours
Number of man-days required (assuming eight hours working per day) = 505.00
man-days
Assuming cost of man-days @ Rs 80 per day (80X505) = Rs 40400.00
3. Paddle Sealing Machine
Cost of electrically operated paddle sealing machine = Rs 10000.00
Therefore, total cost for preparation of plastic cell formwork for 3750Sqm area,
(403029.57 + 40400.00 + 10000.00) = Rs 453029.57
Therefore, cost of plastic cell formwork for one Sqm area = Rs 120.80
(Say) = Rs 120.00
TH-1037_07610405
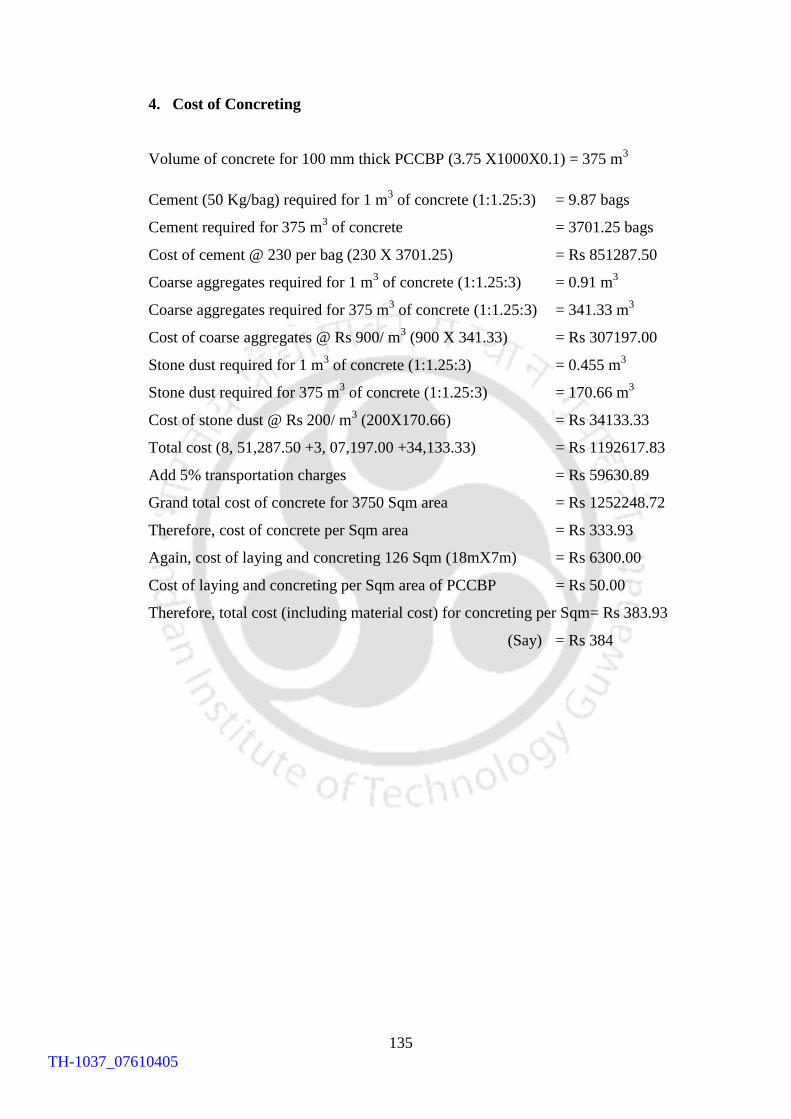
135
4. Cost of Concreting
Volume of concrete for 100 mm thick PCCBP (3.75 X1000X0.1) = 375 m3
Cement (50 Kg/bag) required for 1 m3 of concrete (1:1.25:3) = 9.87 bags
Cement required for 375 m3 of concrete = 3701.25 bags
Cost of cement @ 230 per bag (230 X 3701.25) = Rs 851287.50
Coarse aggregates required for 1 m3 of concrete (1:1.25:3) = 0.91 m
3
Coarse aggregates required for 375 m3 of concrete (1:1.25:3) = 341.33 m
3
Cost of coarse aggregates @ Rs 900/ m3 (900 X 341.33) = Rs 307197.00
Stone dust required for 1 m3 of concrete (1:1.25:3) = 0.455 m
3
Stone dust required for 375 m3 of concrete (1:1.25:3) = 170.66 m
3
Cost of stone dust @ Rs 200/ m3 (200X170.66) = Rs 34133.33
Total cost (8, 51,287.50 +3, 07,197.00 +34,133.33) = Rs 1192617.83
Add 5% transportation charges = Rs 59630.89
Grand total cost of concrete for 3750 Sqm area = Rs 1252248.72
Therefore, cost of concrete per Sqm area = Rs 333.93
Again, cost of laying and concreting 126 Sqm (18mX7m) = Rs 6300.00
Cost of laying and concreting per Sqm area of PCCBP = Rs 50.00
Therefore, total cost (including material cost) for concreting per Sqm= Rs 383.93
(Say) = Rs 384
TH-1037_07610405