A STUDY OF THE THERMAL AGEING OF CARBOXYLATED NITRILE...
159
i A STUDY OF THE THERMAL AGEING OF CARBOXYLATED NITRILE RUBBER LATEX THIN FILMS FOO YIAN TYAN MASTER OF SCIENCE FACULTY OF SCIENCE UNIVERISTI TUNKU ABDUL RAHMAN AUGUST 2013
Transcript of A STUDY OF THE THERMAL AGEING OF CARBOXYLATED NITRILE...

i
A STUDY OF THE THERMAL AGEING OF CARBOXYLATED NITRILE
RUBBER LATEX THIN FILMS
FOO YIAN TYAN
MASTER OF SCIENCE
FACULTY OF SCIENCE
UNIVERISTI TUNKU ABDUL RAHMAN
AUGUST 2013

ii
A STUDY OF THE THERMAL AGEING OF CARBOXYLATED NITRILE
RUBBER LATEX THIN FILMS
By
FOO YIAN TYAN
A dissertation submitted to the Department of Chemical Science,
Faculty of Science,
Universiti Tunku Abdul Rahman,
in partial fulfilment of the requirements for the degree of
Master of Science
August 2013
ii
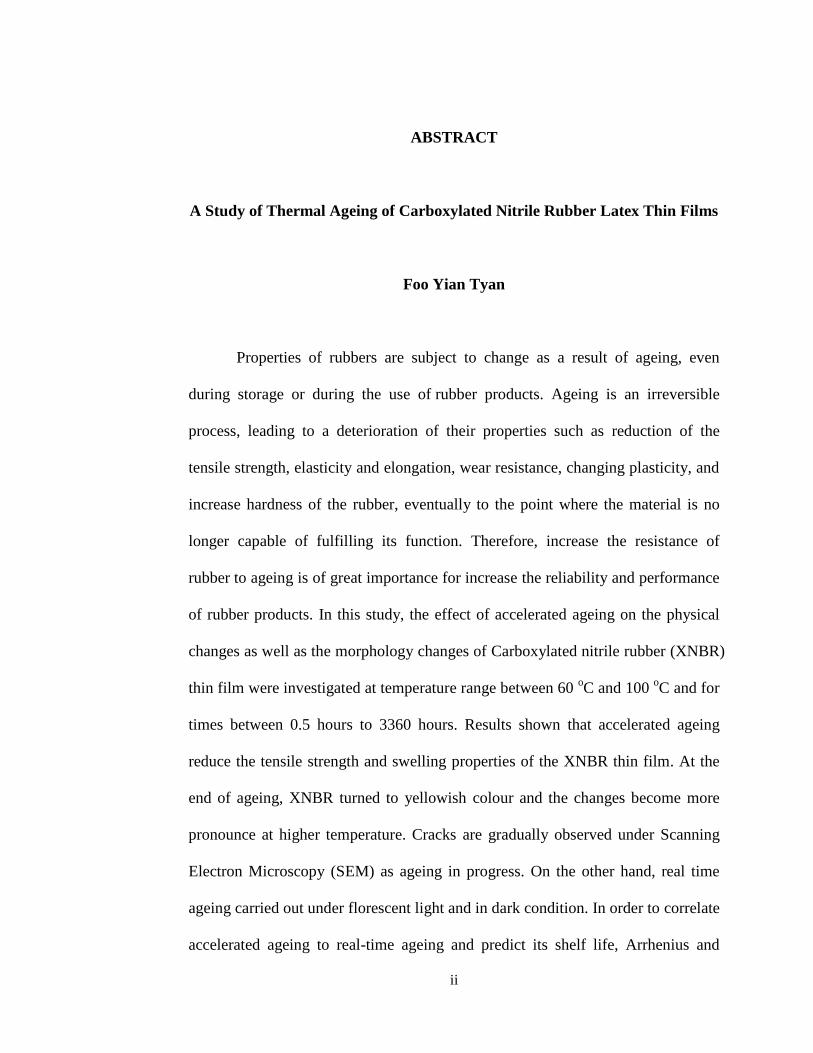
ABSTRACT
A Study of Thermal Ageing of Carboxylated Nitrile Rubber Latex Thin Films
Foo Yian Tyan
Properties of rubbers are subject to change as a result of ageing, even
during storage or during the use of rubber products. Ageing is an irreversible
process, leading to a deterioration of their properties such as reduction of the
tensile strength, elasticity and elongation, wear resistance, changing plasticity, and
increase hardness of the rubber, eventually to the point where the material is no
longer capable of fulfilling its function. Therefore, increase the resistance of
rubber to ageing is of great importance for increase the reliability and performance
of rubber products. In this study, the effect of accelerated ageing on the physical
changes as well as the morphology changes of Carboxylated nitrile rubber (XNBR)
thin film were investigated at temperature range between 60 oC and 100
oC and for
times between 0.5 hours to 3360 hours. Results shown that accelerated ageing
reduce the tensile strength and swelling properties of the XNBR thin film. At the
end of ageing, XNBR turned to yellowish colour and the changes become more
pronounce at higher temperature. Cracks are gradually observed under Scanning
Electron Microscopy (SEM) as ageing in progress. On the other hand, real time
ageing carried out under florescent light and in dark condition. In order to correlate
accelerated ageing to real-time ageing and predict its shelf life, Arrhenius and

iii
Time-Temperature approaches were applied. Both approaches gave a similar
reading where the time estimated for the physical properties to fall to 75% retained
force at break is 27 years at 25 oC for both approaches and the activation energy
calculated were 81.91 kJ/mol and 81.94 kJ/mol respectively. To develop a better
understanding of the chemical changes in XNBR ageing, characterization of the
XNBR thin film with and without antioxidant after accelerated ageing using
Fourier Transform Infrared Spectroscopy (FTIR) had been carried out. FTIR study
shown that thermal oxidation of XNBR mostly generates hydroxyl and carbonyl
related species.

iv
ACKNOWLEDGEMENTS
I would like to take this opportunity to sincere gratitude to Dr. Mohammod
Aminuzzaman and Dr. Chee Swee Yong for serving as the supervisor and co-
supervisor throughout this research project, and for their observations regarding
my work and for also providing me valuable suggestions with the insights and
guidance to recognize my mistakes. I would also like to thank them for giving me
adequate freedom and flexibility throughout the experimental and thesis works
which have contributed to the success of this research.
I would also like to express my appreciation to the Synthomer Sdn. Bhd.
for the project funding and offering scholarship for my study. I would like to
express my gratitude to Mr. Tong Heam Keat and Ms. Masuzi for their supportive
and warm help for this project and for sharing valuable knowledge and
cooperation.
I thank to laboratory assistants, Mr. Nickolas Ooi, and other laboratory
assistants for their supportive and warm help for this project.
Finally, and most of all, I would like to thank my parents and all my
friends for their eternal support, love, and encouragement.

v
FACLUTY OF SCIENCE
UNIVERSITI TUNKE ABDUL RAHMAN
Date: __________________
SUBMISSION OF THESIS
It is hereby certified that FOO YIAN TYAN (ID No: 11ADM01677) has
completed this thesis/dissertation entitled “A STUDY OF THERMAL AGEING
OF CARBOXYLATED NITRILE RUBBER LATEX THIN FILMS” under
supervision of Assistant Prof. Dr. Mohammod Aminuzzaman (Supervisor) from
the Department Chemical Science, Faculty of Science, and Assistant Prof. Dr.
Chee Swee Yong (Co-Supervisor) from the Department Chemical Science, Faculty
of Science.
I understand that the University will upload softcopy of my thesis/dissertation in
pdf format into UTAR Institutional Repository, which may be made accessible to
UTAR community and public.
Yours truly,
_________________
(FOO YIAN TYAN)

vi
APPROVAL SHEET
This dissertation/thesis entitled “A STUDY OF THERMAL AGEING OF
CARBOXYLATED NITRILE RUBBER LATEX THIN FILMS” was
prepared by FOO YIAN TYAN and submitted as partial fulfillment of the
requirements for the degree of Master of Science at Universiti Tunku Abdul
Rahman.
Approved by:
________________________
(Assistant Prof. Dr. Mohammod Aminuzzaman) Date:………………
Supervisor
Department of Chemical Science
Faculty of Science
Universiti Tunku Abdul Rahman
________________________
(Assistant Prof. Dr. Chee Swee Yong) Date:………………
Co-Supervisor
Department of Chemical Science
Faculty of Science
Universiti Tunku Abdul Rahman

vii
DECLARATION
I _________________________________hereby declare that the
thesis/dissertation is based on my original work except for quotations and citations
which have been duly acknowledged. I also declare that it has not been previously
or concurrently submitted for any other degree at UTAR or other institutions.
_________________________
(FOO YIAN TYAN)
Date:

viii
LIST OF TABLES
Table
Page
2.1 Types of degradation agents.
24
3.1 Accelerated ageing temperature and time.
59
4.1 Time required to reach the threshold of 75% retained force.
88
4.2 Time required to reach the threshold of 70%, 75% and 80%
retained force at break.
90
4.3 Arrhenius shift factor (αT) for a reference temperature at 60 oC.
94
4.4 Arrhenius shift factor (αT) for a reference temperature at 25 oC.
96
4.5 Lifetime and activation energies prediction according to
various approach and assumption.
98
4.6 FTIR peaks assignment of XNBR latex thin film.
101
ix
LIST OF FIGURES
Figure
Page
1.1 Vulcanized rubber in stretch and relax mode (Gupta 2010b).
3
1.2 Structure of NBR.
7
1.3 Structure of HNBR.
8
1.4 Structure of XNBR.
10
2.1. Effects of physical ageing on polymeric materials. Top:
relaxation of oriented macromolecules. Bottom: post-
crystallization (Ehrenstein 2001).
20
2.2. Effects of chemical ageing (heat and/or oxygen) on polymeric
materials (Ehrenstein 2001).
21
2.3. Random thermal degradation mechanism of poly(ethylene
terephthalate).
40
2.4. Mechanism for polymer oxidation (RH = polymer
hydrocarbon).
43
2.5. Estimating the time to reach a specified threshold. X: Time in
days; Y: Initial force at break in %. 1 : 75% threshold; 2: Time
to reach threshold in 60 oC.
49
2.6. Arrhenius plot for force at break assuming a threshold of 75%.
Y: ln t(75%) in years; X: 1/T in K-1
. 1: Extrapolation to 25 oC; y
= 17071x – 47.71; R2 = 0.9987.
51
2.7. Time-temperature superposition plot. Y: Retained force at
break in %. X: Time at 25 oC in years.
53
2.8. Examples of common antioxidants: a: 2,6-t-butyl 4-methyl
phenol (butylated hdroxy toluene); b: diphenyl-p-phenylene
diamine.
56
3.1. Photograph of XNBR glove sample.
58
3.2. Photograph of tensile strength measurement. 60

x
3.3. Photographs of the measurement of the diameter of the disc in
solvent swell test.
61
3.4. Chromaticity coordinates of L*, a* and b*.
63
3.5. Photograph of the thin film sample coated with platinum.
63
3.6. Photograph of XNBR Latex Thin Film.
65
4.1. Changes in the relative tensile strength of XNBR thin film as a
function of ageing time at various temperatures.
72
4.2. Changes in the relative elongation at maximum of XNBR thin
film as a function of ageing time at various temperatures.
73
4.3. Changes in the relative linear swell of XNBR thin film as a
function of ageing time at various temperatures.
75
4.4. Changes in the relative total colour change (∆E) of XNBR thin
film as a function of ageing time at various temperatures.
77
4.5. SEM images for unaged sample (a), aged at 60 oC for 1344 (b)
and 3360 hours (c), aged at 70 oC for 1680 (d) and 3024 hours
(e), aged at 80 oC for 1008 (f) and 1680 hours (g), aged at 90
oC for 336 (h) and 504 hours (i) and aged at 100
oC for 96 (j)
and 168 hours (k).
79
4.6. Changes in the relative tensile strength of XNBR thin film as a
function of ageing time for real time ageing.
81
4.7. Changes in the relative elongation at maximum of XNBR thin
film as a function of ageing time for real time ageing.
81
4.8. Changes in the relative linear swell of XNBR thin film as a
function of ageing time for real time ageing.
82
4.9. Changes in relative total colour change (∆E) of XNBR thin
film as a function of ageing time for real time ageing.
83

xi
4.10. SEM images for real time ageing under fluorescent light for 1
month (a), 3 months (b), 9 months (c) and 15 months (d) and in
dark condition for 1 month (e), 3 months (f), 9 months (g) and
15 months (h).
84
4.11. Variation of relative force at break of XNBR thin film with
ageing time at various ageing temperatures.
87
4.12. Arrhenius plot of retained force at break at 75% for XNBR thin
film.
89
4.13. Arrhenius plot of retained force at break at 70%, 75% and 80%
for XNBR thin film.
91
4.14. Arrhenius plot using empirical shift factor concept. 94
4.15. Mastercurve for relative force at break against ageing time for
XNBR thin film at reference temperature of 60 oC.
95
4.16. Mastercurve for relative force at break against ageing time for
XNBR thin film at reference temperature of 25 oC.
97
4.17. Changes of IR spectra of XNBR thin film with antioxidant aged
at 70 oC (a) combined spectra and (b) split spectra.
102
4.18. Changes of IR spectra of XNBR thin film without antioxidant
aged at 70 oC (a) combined spectra and (b) split spectra.
103
4.19. Changes of IR spectra of XNBR thin film with antioxidant aged
at 90 oC (a) combined spectra and (b) split spectra.
104
4.20. Changes of IR spectra of XNBR thin film without antioxidant
aged at 90 oC (a) combined spectra and (b) split spectra.
105
4.21. Structure of grafted butadiene.
115
4.22. Demonstrated reaction mechanism of intermediate product and
final by-product conversion pathway of XNBR under thermal-
oxidation.
117

xii
LIST OF ABBREVIATIONS
αT shift factors
(ΔE) total colour changes
A material constant
a* chromaticity coordinates for green-red shift
Al2O3 aluminium (III) oxide
b* chromaticity coordinates for blue-yellow shift
C constant
Co cobalt
Cr chromium
Ea activation energy
EPDM ethylene propylene terpolymer rubber
Fe ferrum
FTIR fourier transform infrared
HNBR hydrogenated nitrile rubber
IIR isobutylene isoprene copolymer
Kcal/mol kilocalorie per mole
kJ/mol kilojoule per mole
k(T) reaction rate constant
kV kilovolt
L* chromaticity coordinates for white-black shift
mm milimeter
Mo nolybdenum
NBR nitrile butadiene rubber
nPbO.PbSO4.H2O poly-basic lead sulfates
Ni nickel
NR natural nubber
PA polyamide
PE polyethylene
PES polyester
PMMA poly(methylmethacrylate)
PO polyolefins (po)
PS polystyrene
Pt platinum
PU polyurethane
PVC polyvinyl chloride
PαMS poly(α-methylstyrene
R universal gas constant

xiii
RSn(SnR‟)3 organo-tin mercaptide
SBR styrene butadiene rubber
SEM scanning electron microscopy
SiO2 silicon dioxide
(Tg) glass transition temperature
TiO2 titanium dioxide
T absolute temperature in kelvin.
tTaged ageing time at reference temperature, taged
tTref ageing time at reference temperature, tref
t(x%) time for the property to fall to x% of the initial
value
UV ultraviolet
XNBR carboxylated nitrile rubber

xiv
TABLE OF CONTENTS
Page
ABSTRACT ii
ACKNOWLEDGEMENTS iv
PERMISSION SHEET v
APPROVAL SHEET vi
DECLARATION vii
LIST OF TABLES viii
LIST OF FIGURES ix
LIST OF ABBREVIATIONS
xii
CHAPTER
1. INTRODUCTION 1
1.1. Concept of elastomer 1
1.2. Uniqueness of rubber 1
1.3. Synthetic rubber 3
1.3.1. Origin 3
1.3.2. Manufacture of synthetic rubber 4
1.3.3. Applications 5
1.3.4. NBR 6
1.3.5. HNBR 8
1.3.6. XNBR 9
1.4. Natural rubber latex and synthetic rubber latex in glove
manufacture
11
1.5. Scope 12
1.6. Objective of study
15

xv
2. LITERATURE REVIEW 16
2.1. Polymer, latex, Elastomer 16
2.2. Degradation and ageing of polymer 18
2.3. Factors affecting polymer degradation 22
2.3.1. Natural degradation agent 23
2.3.1.1. Temperature 25
2.3.1.2. Ultraviolet light 25
2.3.1.3. Ionizing radiation 26
2.3.1.4. Moisture 26
2.3.1.5. Fluids 27
2.3.1.6. Mechanical stress and electrical stress 27
2.3.1.7. Microbiological attack 28
2.3.2. Nature of polymer 29
2.3.2.1. Chemical composition 29
2.3.2.2. Polymer structure 30
2.3.2.3. Molecular weight 30
2.3.2.4. Incorporation of functional groups 31
2.3.2.5. Additives 31
2.3.2.6. Chemical bonding 32
2.3.2.7. Methods of synthesis 32
2.3.2.8. Effect of substituents 33
2.4. Types of polymer degradation 34
2.5. Thermal and thermal oxidative degradation 38
2.6. Lifetime prediction 45
2.6.1. Basic methodology 46
2.6.2. Arrhenius model for lifetime prediction 47
2.6.3. Time-temperature superposition model for lifetime
prediction
51
2.7. Protection and prevention degradation 54
2.7.1. Chemical and thermal stabilizers 55
2.7.2. Ultraviolet radiation stabilizers 57
xvi
3. METHODOLOGY 58
3.1. Materials 58
3.2. Method for accelerated ageing and testing 59
3.2.1. Accelerate treatment 59
3.2.2. Tensile test 60
3.2.3. Solvent swell test 61
3.2.4. Colour test 62
3.2.5. Scanning electron microscopy (SEM) 63
3.3. Method for real time ageing 64
3.4. Mechanism study 64
3.4.1. Thin film casting 64
3.4.2. Accelerated ageing of thin film 65
3.4.3. Fourier transform infrared (FTIR) characterization 65
3.5. Lifetime prediction
66
4. RESULTS AND DISCUSSION 67
4.1. Accelerated ageing and real time ageing 67
4.1.1. Accelerated ageing 68
4.1.1.1. Tensile test 68
4.1.1.2. Solvent swell test 74
4.1.1.3. Colour measurement 76
4.1.1.4. Scanning Electron Microscopy (SEM) 78
4.1.2. Real time ageing 80
4.1.2.1. Tensile test 80
4.1.2.2. Solvent swell test 82
4.1.2.3. Colour measurement 83
4.1.2.4. Scanning Electron Microscopy (SEM) 84
4.2. Lifetime prediction 85
4.2.1. Application of the Arrhenius equation predict shelf life 85
4.2.2. Application of the time-temperature superposition method
to predict shelf life
91

xvii
4.2.3. Comparison of lifetime and activation energies according to
different shelf life prediction approach
98
4.3. Degradation mechanism study of XNBR
99
5. CONCLUSION
118
REFERENCES
121
APPENDIXES 134

1
CHAPTER 1
INTRODUCTION
1.1 Concept of elastomer
“Elastomer”, is usually used as general term for the group of polymers with
some common characteristics, such as high elasticity, viscoelasticity and glass
transition temperature (Tg) far below room temperature. The term is derived from
elastic polymer. According to White and De (2001), the term „elastomer‟ describes
a material that exhibits quick and forcible recovery of most of its original
dimensions after extension or compression and can be vulcanized. In general,
rubber might be called elastomer since high elasticity is its most outstanding
feature. Nevertheless, elastomer cannot be regarded as the same as that of rubber
in the narrow sense, because the former refers to all the polymeric materials with
high elasticity including rubber. However, by usage, it is generally admitted in a
broad sense that the term “rubber” refers to elastomer (Zhang 2004).
1.2 Uniqueness of rubber
Of all the polymeric materials, rubbers are unique. In most applications for
rubber products there are no alternative materials. Rubber is both elastic and
viscous. It is soft with high extensible and highly elastic, which consist of
relatively long polymeric chains with high molecular mass molecules that joined

2
into a three-dimensional network structure (Loadman 1998; Gent 2001).
Vulcanization forms chemical bonds between adjacent elastomer chains and
subsequently imparts dimensional stability, strength, and resilience (White and De
2001; Gupta 2010b). An unvulcanized rubber lacks structural integrity and will
“flow” over a period of time.
According to Schaefer (2002), rubber has a low modulus of elasticity and
is capable of sustaining a deformation of as much as 1000 per cent. As a result of
an externally imposed stress, the long chains may alter their configurations, an
adjustment which takes place relatively rapid because of the high chain mobility.
The requirement of having the chains linked into a network structure is associated
with solid like features, where the chains are prevented from flowing relative to
each other under external stresses. Once the external force was removed, it rapidly
recovers its original dimensions, with essentially no residual or non-recoverable
strain (Erman and Mark 2005). Fig. 1.1 shows the vulcanized rubber that behaves
like a spring which does not undergo a permanent change when stretched, but
spring back to original shape and size after the stress is removed. Rubber is
resilient and yet exhibits internal damping. As a result of these unique mechanical
properties, rubber can be processed into a variety of shapes and can be adhered to
metal inserts or mounting plates. It can be compounded to give widely varying
properties and this has permitted the development of a huge family of materials
with a wide range of properties. Rubber will not corrode and normally requires no
lubrication (Schaefer 2002).

3
Figure 1.1: Vulcanized rubber in stretch and relax mode (Gupta 2010b).
1.3 Synthetic rubber
1.3.1 Origin
In 1927, Reimer and Tiemaun published their work on amino acids and in a
short period this opened an entirely new vista for process industries
(Chandrasekaran 2009). Polymer technology became a new study and research
work in these avenues yielded a wide range of new materials. Chemists were
actively searching for rubbery materials which could be manufactured artificially.
Kuzma noted that the Russians, in 1910, prepared such a rubber, known
chemically as polybutadiene. In the 1930s, the Germans began the commercial
production of a synthetic rubber called Buna-S (styrene butadiene rubber), later
known as SBR, which is the major material in the rubber industry today (Ciesielski
2001).
The development of polychlorobutadiene, a wholly new synthetic rubber,
was announced by DuPont in 1931; it was given the name Duprene, later changed

4
to Neoprene (Morawets 2002; Morris 2005). Since 1934 in Germany, an oil
resistant rubber called Buna-N was marketed by I.G. Farbenindusties and later as
Perbunan. Its generic name is known as nitrile rubber (NBR, nitrile butadiene
rubber) (White, 1995). Later in the 1940s, Butyl rubber (IIR, isobutylene isoprene
copolymer) was developed, as well as Hypalon (CSM, chlorosulphonated
polyethylene) and Viton (FKM, fluoroelastomer) by DuPont (now DuPont Dow
Elastomers) in the 1950s and ethylene propylene terpolymer rubber (EPDM) in the
1960s (Ciesielski 2001).
The rubber that started it all, NR, has survived the onslaught of the
synthetic rubbers exceptionally well and today still represents nearly one-third of
all rubber in the world marketplace (Ciesielski 2001). The new awareness of our
environment gives NR the added advantage of being seen as a renewable resource,
because most synthetic elastomers are derived from petroleum oil based starting
materials.
1.3.2 Manufacture of synthetic rubber
From the 20th century, scientists have been trying to synthesize the
materials whose properties could match the NR. This has led to the production of a
wide variety of synthetic elastomers. In order to produce polymer it is, of course,
necessary to find ways in which small molecules, known as monomers may join
together in large numbers. This process is known as polymerization (Deanin and
Mead 2007); there are a number of techniques in which polymerization can be
5
realized, but these can all be classed under the following two main types: chain
reaction polymerization and step reaction polymerization (Sperling 2006; Deanin
and Mead 2007; Gupta 2010b; McMurry 2011). The simplest examples of chain
reaction polymerization are the formation of polyethylene (PE) from ethylene and
polyvinyl chloride (PVC) (from the corresponding monomer, the vinyl chloride
(Odian 2004; McMurry 2011). Polyamide (PA), polyesters (PES), polyurethanes
(PU), epoxy polymers and many others are examples of polymer obtained through
step reaction processes (Odian 2004; McMurry 2011).
The versatility of polymerization resides not only in the different types of
reactants (monomers) which can be polymerized, but also in the variations allowed
by copolymerization, stereospecific polymerization, ring opening polymerization,
etc. It is well known that the main technologies for polymer formation may be
carried out with monomer alone (bulk or mass), in an organic solvent (solution), as
an emulsion in water (emulsion), as droplets, with each droplets comprising an
individual bulk polymerization suspended in water ( suspension) and in a gas
phase fluidized bed. All these techniques are commercially used (Feldman and
Barbalata 1996; Deanin and Mead 2007; Slobodian 2010).
1.3.3 Applications
Most synthetic rubber is produced from two materials, styrene and
butadiene. Both are currently obtained from petroleum (Brydson 1999 and
Woodard and Curran 2006). Synthetic rubbers are usually developed with specific
6
properties for special applications. There are several synthetic polymers now in
use. These include polybutadienes, SBR, acrylonitrile butadiene (nitrile rubber, a
copolymer), polyisoprene, polychloroprene (neoprene), ethylene-propylene
copolymer, silicone rubber, PU, polyfluorocarbon, IIR.
Tires account up to 70% of all natural and synthetic rubber used (Dunn
2002). Commonly used synthetic rubber for tyre manufacture is styrene-butadiene
rubber and butadiene rubber (cloth members of the Buna family) (Chaiear and
Saejiw 2010a). Butyl rubber is commonly used for inner tubes because it is gas
impermeable. Due to oil resistance of nitrile rubber, it is widely used in sealing
applications, roll coverings, conveyor belts, shoe soles, hose liners and plant
linings. Other products containing rubber include footwear, industrial conveyor
belts, car fan belts, hoses, flooring, and cables. Products such as gloves or
contraceptives are made directly from rubber latex (Simpson 2002).
1.3.4 NBR
Nitrile Butadiene Rubber (NBR) is commonly called “Nitrile”, this rubber
is a copolymer of butadiene and acrylonitrile (see Fig. 1.2) (Feldman and
Barbalata 1996; Dunn 2002). They are produced by emulsion polymerization in
batch or continuous process. The copolymer can be largely linear to highly branch
depending on the conditions of polymerization. Chemically unsaturated NBR
undergoes vulcanization reaction with sulphur and other vulcanizing agent. NBR
under the common trade name Buna N is well known for its excellent resistances

7
to oils and solvent owing to its swelling property when immersed in mineral oils.
NBR containing 10 to 45% of acrylonitrile (White and Kim 2008). Its chemical
resistance to oils is proportional to the acrylonitrile content. The presence of
acrylonitrile provides resistance to oil (petroleum hydrocarbon, mineral oils,
greases, vegetable oils, animal fats) and fuel, while the butadiene provides
abrasion resistance and low temperature flexibility. However, it is not resistant to
strong oxidizing chemicals such as nitric acid, and it exhibits fair resistance to
ozone and UV irradiation which severely embrittles it at low temperature (Hunt
and Vaughan 1996; Cardarelli 2008; and Scheirs 2009).
NBR is currently the major competitor to NR in the manufacture of
disposal latex gloves and are also used as textile and non-woven reinforcement,
including the manufacture of synthetic leather (Dunn 2002). Common applications
of NBR take advantage of the chemical resistance of the rubber. Seals, O-rings,
gaskets, oil field parts, and diaphragms are the principal uses of NBR (Cardarelli
2008). Other applications include blending with phenolic and epoxy resin
emulsion for adhesive and coating applications, caulks and sealants, additives for
coal tar and asphalt (White and De 2001).
Figure 1.2: Structure of NBR.

8
1.3.5 HNBR
Hydrogenated nitrile rubber (HNBR) is chemically modified of NBR by
hydrogenation so that little of the unsaturation remains (Fig. 1.3). This results in a
product with much improved resistance to oxidation and weathering, but with little
or no sacrifice of other useful properties (White and De 2001; Scheirs 2009; Gatos
and Karger-Kocsis 2011). HNBR is produced by a catalytic solution
hydrogenation of the butadiene unsaturation in the polymer. Owing to the largely
saturated backbone of the rubber it has significantly better high heat, weather,
abrasion and ageing resistance, with good mechanical strength as compared to
NBR (Ciesielski 2001). As in NBR, HNBR with different acrylonitrile contents is
also available.
Figure 1.3: Structure of HNBR.
Applications for HNBR take advantage of its outstanding oil resistance and
thermal stability. HNBR has many uses in the oil-field, including down hole
packers and blow-out preventers. For the same reasons, it has found uses in
various automotive seals, O-rings, timing belts, and gaskets. Resistance to gasoline

9
and ageing make HNBR ideal for fuel-line hose, fuel-pump and fuel-injection
components, diaphragms, as well as emission-control system (Deanin and Mead
2007). Highly unsaturated (20% unsaturated) HNBR gives good dynamic
properties. They are used in rolls, belts, and oils field‟s parts (White and Kim
2008).
1.3.6 XNBR
Carboxylated nitrile rubber (XNBR) is chemically modified of NBR which
contains one, or more, acrylic type of acid as a terpolymer. The resultant chain is
similar to nitrile except for the presence of carboxyl groups (-COOH-) which
occur about every 100 to 200 carbon atoms (Fig. 1.4) (White and De 2001;
Simpson 2002; Gatos and Karger-Kocsis 2011). This acid group is normally
encountered commercially in the form of a dispersion of the polymer in water,
made by emulsion polymerization (White and De 2001).
The incorporation of carboxyl functional groups alters the polarity and
colloidal stability of the dispersion, compatibility with other materials and polymer
physical properties (Pinprayoon, Groves and Saunders, 2008). These acid groups
provide extra “pseudo” cross-links during the vulcanisation process which are
responsible for the improvement in physical properties as compared to a non-
carboxylated nitrile rubber. There is enhancement in mechanical and chemical
stability for latex along with improvement in wetting characteristic and adhesion
to fibrous filler. Generally, the rubber shows enhance chemical resistance and

10
improved adhesion to other matrices. Carboxylated nitriles are, however, less
flexible at low temperatures and less resilient than non-carboxylated compounds.
Also, the “pseudo” crosslinks (being ionic in nature) are thermally sensitive. As
temperatures increase, the ionic bonds lose strength.
Figure 1.4: Structure of XNBR.
XNBR has better abrasion resistance than regular NBR (Gatos and Karger-
Kocsis 2011). The superior resistance of XNBR to oil and solvent along with
abrasion makes it suitable for industrial glove dipping (Alex 2009). Their
applications in latex form include its use as a binder for paper and as a part of the
coating material in coated paper as well as in the manufacturing of foam, carpet
and adhesives (Pinprayoon, Groves and Saunders 2008). Other applications are
automotive seals, industrial footwears, mechanical goods, textile spinning cots,
packing, flat drive belting, hoses, industrial wheels, oil well specialties, and roll
covers (White and Kim 2008).

11
1.4 Natural rubber latex and synthetic rubber latex in glove manufacture
Latex materials have been the subject of recent extensive research and
development. As a result, their application areas have been expanding. NR latex
products have good physical and chemical properties. The vast majority of latex
gloves used by health care professionals, emergency medical technicians, police
officers, and fire personnel, are made from NR latexes. The gloves are
manufactured by a rubber dipping process whereby a form or mould (i.e., a model
of a hand, sometimes with a forearm) is dipped into a bath containing NR latex
and withdrawn, leaving a thin latex polymer coating on the form. The assembly is
then dried at elevated temperatures to form the gloves, which is finally removed
from the form or mould (Anderson and Daniels 2003).
NR latex has been the dominant material used to prepare disposable gloves
for health care practitioners. It has an excellent barrier properties, high tensile, tear
strength and elastic properties, it is soft and is comfortable to wear for extended
periods of time and cost less than gloves prepared from synthetic rubber. However,
the very significant downside to the use of NR latex has been the increased degree
of allergic hypersensitivity in the population exposed to the NR gloves (e.g., health
care professional, emergency response personnel, patients exposed to the gloves
during medical and dental procedures), with estimate of allergic hypersensitivity in
the order of 10% of this target population. The main routes of exposure to the
proteins are direct skin contact and inhalation. Allergic reactions to the NR gloves
can range from contact dermatitis, developing immediately on contact to the

12
gloves or several hours after exposure, to immunoglobulin E (IgE)- mediated
(Type I) allergic reactions which can range from itching, rashes and congestion to
life-threatening anaphylactic reactions (Chaiear 2001; Skypala and Venter 2009;
Chaiear and Saejiw 2010b). To avoid allergy problems, medical field has, thus,
begun to steer clear of the use of NR products in surgery and has instead leaned
toward the use of synthetic rubbers. Natural latex free gloves comprised entirely of
synthetic materials (e.g., vinyl nitrile, synthetic polyisoprene, SBR or carboxyl-
group-containing ionomer-based elastomer such as carboxylated nitrile rubber
(XNBR) gloves) are used by individuals having known allergies to natural latex
rubber (Anderson and Daniels 2003; Ain and Azura 2010).
1.5 Scope
The incidence of latex protein sensitivity in NR glove give rise to various
synthetic alternatives, such as vinyl, nitrile, chloroprene (neoprene). Although
NBR is more superior to vinyl gloves, due to nitrile glove is highly susceptible to
ozone attack (Hunt and Vaughan 1996; Cardarelli 2008; Scheirs 2009), XNBR
take over NBR as the main raw material in the manufacture of nitrile glove.
Numerous studies have been published mainly focus on improving the
mechanical properties of XNBR. Ain and Azura (2010) studied on the effect of
types of filler and filler loading on the properties of XNBR latex films, while
Mahaliang et al., (2005) investigated the effect of Zn-ion coated nanosilica filler
on the cure behaviour, thermal stability and dynamic modulus and surface

13
morphology of XNBR. Chronska and Przepiorkowska (2008), used buffing dust as
filler for XNBR, while Biswas et al., (2004), Pal et al., (2011) and Mishra,
Raychowdhury and Das (2000), investigated different XNBR blends. However,
little is known about the ageing of XNBR.
Storage of rubber, whether during storage or use of rubber products, is an
inevitable process of ageing, leading to a deterioration of their properties. As a
result of ageing, it reduced the tensile strength, elasticity and elongation, wear
resistance, hysteresis and increased hardness, changing plasticity, viscosity and
solubility of uncured rubber. In addition, as a result of ageing significantly reduced
the duration of the exploitation of rubber products. Therefore, increasing the
resistance of rubber to ageing is of great importance for increasing the reliability
and performance of rubber products.
Due to the long time required to perform such tests at lower temperatures,
high temperatures were typically utilized to bring the ageing time scale into a
practical regime. The major objective of the current study was to utilize shorter
high temperature ageing to obtain the shelf life of the samples at lower
temperatures by using Arrhenius extrapolations to room temperature to.
Most of the lifetime assessments of rubbers are made by considering some
measure of their performance, such as tensile strength or force at break, and
specifying some lower limit for the property which is taken as the end point
corresponding to when the material is no longer usable. The primary focus of this

14
study involves the reduction of tensile strength for the XNBR as a function of
ageing time under different ageing temperatures. Although other physical
parameters are important for proper parachute deployment and function, such as
permeability and elasticity, tensile strength is arguably the most important and the
easiest to monitor.
In the present study, the thin film samples are accelerated aged at elevated
temperature range between 60 oC and 100
oC and for times between 0.5 hours to
3360 hours. The aged samples will be characterized mainly by measuring its
tensile properties, linear swelling percentage, and changes in colour as well as its
morphology changes with Scanning Electron Microscopy (SEM) and will be
compared with unaged samples. Other techniques such as Fourier Transform
Infrared (FTIR) will be used to analyse the casted thin film to develop a better
understanding of the mechanism. In order to relate accelerated ageing to real-time
ageing and predict its shelf life, Arrhenius equation will be used. Through
extrapolation from accelerated ageing studies using Arrhenius equation, we can
predict the shelf life of the samples as well as the activation energy of the samples.
15
1.6 Objectives of study
The objectives of this study are as follows:
i. To study the effect of accelerated ageing on the properties changes of
XNBR thin film, such as tensile strength, elongation at maximum, linear
swell as well as morphological changes.
ii. To determine the relationship between accelerated ageing and real time
ageing and further to predict their shelf life as well as the activation energy
using Arrhenius equation.
iii. To study the chemistry of the ageing process in XNBR via FTIR analysis.
16
CHAPTER 2
LITERATURE REVIEW
2.1 Polymer, latex, elastomer
A polymer is a large molecule (macromolecule) composed of repeating
structural units (monomers) typically connected by covalent chemical bonds.
Polymerization is the process of covalently bonding the low molecular weight
monomers into a high molecular weight polymer (Fuller 1999; Odian 2004;
Speight 2010). During the polymerization process, some chemical groups may be
lost from each monomer. The distinct piece of each monomer that is incorporated
into the polymer is known as a repeat unit or monomer residue (Gupta 2010b).
Polymer particles (usually a few hundred nanometers in diameter)
dispersed in water-based liquid or viscous state is called latex in the rubber
industry and emulsion in the polymer industry (Stein et al., 1994; Wicks et al.,
2007). Latex is a colloidal dispersion comprised about 50% by weight of the
dispersion. Depending on the particular application, there will also be a complex
mixture of pigments, surfactants, plasticizing aids and rheological modifiers. The
whole dispersion is colloidally stable, meaning that it can sit on a shelf for years
and remain dispersed, without sedimentation of particles making „sludge‟ at the
bottom (Routh and Keddie 2010).
17
Latexes may be natural or synthetic. Natural form of latex that is derived
from tree (Hevea brasiliensis), it is essentially cis-isoprene emulsified by protein.
Industrially and in the laboratory, latex is most often made by a reaction called
„emulsion polymerization‟. Latex may be synthesized from a range of monomers,
the typical ones being acrylates (methyl methacrylate, butyl acrylate, ethylhexyl
acrylate), styrene, vinyl acetate and butadiene (Routh and Keddie 2010).
When the rubber particles in the latex are crosslinked, elastomer is
produced. The process of crosslinking the linear chain polymers rubber is known
as vulcanization. Vulcanization is a chemical process for converting rubber
latex or related polymers into more durable materials via the addition of sulphur or
other equivalent "curatives." These additives modify the polymer by
forming crosslinking (bridges) between individual polymer chains. Vulcanization
makes the rubber become more useful by reduces its stickiness at the same time
increases the rubber's strength and durability and makes the rubber to retain its
elasticity at a much wider range of temperatures (Coran 2005). Of course, the most
common use of rubber is in automotive tires. But pencil erasers, shoes, gloves,
dental dams and condoms are also made by rubber. In many products, rubber is
added as a protective coating for waterproofing and roofing.

18
2.2 Degradation and ageing of polymer
Ageing as explained by Robert, Hastie and Morris (1993), Ehrenstein
(2001), and Jones et al., (2009) is a process that occurs in polymeric materials
during a specified period of time, and that usually result in changes in physical
and/ or chemical structure and the values of the properties of the material. Colin,
Teyssedre and Fois (2011) defined that ageing as a slow and irreversible variation
as a function of time (in use conditions) of a material‟s structure, morphology or
composition leading to a detrimental change in its use properties. In polymer
science and engineering, ageing is a term used when the properties of the polymer
are changed over a period of time. The changes may be observed in engineering
properties such as strength and toughness; in physical characteristics such as
density; or in chemical characteristics such as reactivity towards aggressive
chemicals (White 2006).
Changes in polymer properties due to chemical, physical or biological
reactions resulting in bond scission in the backbone of macromolecules which in
turn leads to the decrease in molecular weight of the polymer and subsequent
chemical transformations are categorized as polymer degradation. Degradation
occurs at any stage in the lifetime of a polymer. Polymer degradation results
changes in polymeric material properties such as mechanical, optical or electrical
characteristic in cracking, erosion, discolouration and phase separation. The
changes may be undesirable, such as changes during use, or desirable, as in

19
biodegradation or deliberately lowering the molecular weight of a polymer
(Pielichowski “ageing and Njuguna 2005; Speight 2010).
The long-term stability of polymeric materials is a matter of considerable
importance, both to material scientists and to engineers. Two types of ageing occur
that lead to changes in the properties of polymer: chemical and physical
(Ehrenstein 2001; Cowie, McEwen and McIntyre 2003). Physical ageing processes
are characterized by the thermo reversibility of the change in the material
properties (Robert, Hastie and Morris 1993). During the physical ageing of a
polymeric material the chemical structure remains unchanged, but the local
packing of the chains is altered as a consequence of alteration of physical
properties and lead to change in density, brittleness, tensile strength, glass
transition temperature (Tg) and the material dimensions over extended period of
time (Colin, Teyssedre and Fois 2011; Cowie and Arrighi 2011). Typical physical
ageing effects are changes in morphology, such as post-crystallization,
disorientation, and relaxation of internal stress as shown in Figure 2.1.
Physical ageing can also occur through evaporation or migration of volatile
components or, conversely, through water absorption and swelling. It is important
to distinguish between physical and chemical ageing, as both matter affect the
long-term properties of a polymeric material. Unlike physical ageing, chemical
ageing is non-reversible and leads to a modification of the polymer chain through
processes such as chain scission, oxidation, dehalogenation, loss of pendant groups,

20
hydrolysis, and crosslinking, all of which are chemical reactions (Robert, Hastie
and Morris 1993; Bonten and Berlich 2001; Cowie, McEwen and McIntyre 2003).
Figure 2.1: Effects of physical ageing on polymeric materials. Top: relaxation
of oriented macromolecules. Bottom: post-crystallization
(Ehrenstein 2001).
Chemical ageing, such as the effect of heat alone or the presence of oxygen,
but also the action of chemical reagents or radiation, especially ultraviolet-rays
(UV), can change the chemical structure of the polymer (Ehrenstein, 2001). The
effect of heat with and without oxygen is illustrated in Figure 2.2.
The illustration in Figure 2.2 a depicts the situation where applying heat to
the material causes further curing of an incompletely cured thermoset thereby
changing the material properties, usually with improved results. However, all
plastics will exhibit chain scission accompanied by some crosslinking when they
are heated too long at high temperature as shown in Figure 2.2 b. The intermediate

21
effect of thermal-induced chain scission is a deterioration of the material
properties.
Figure 2.2: Effects of chemical ageing (heat and/or oxygen) on polymeric
materials (Ehrenstein 2001).
Oxygen increases chain scission and becomes part of the macromolecules
in the form of thermally unstable hydroperoxides as shown in Figure 2.2 c. UV
light, ozone, and some reagents can aid and accelerate the oxidation of plastics and
cause chain degradation. UV-rays, even without elevated temperatures, can cause
embrittlement of impact-resistant polystyrene (PS) after several weeks in the sun.
In condensation polymers, water and heat can cause a hydrolysis reaction
(Ehrenstein 2001). According to Cowie, McEwen and McIntyre (2003), polymer
degradation reactions can be divided into two classes,
Main chain reactions leading to chain scission at random place and/or
depolymerization;
(a)
(b)
(c)
22
Substituent reaction at the side chains such as elimination of substituents.
The extent of ageing and the nature of the degradation process depend
essentially on the chemical composition of the plastic, the thickness the sample
being tested, and the environmental conditions. The most important, immediately
noticeable, and industrially important effects of ageing are changes in the
mechanical, electrical, and thermal properties, as well as changes in colour
(yellowing), surface structure (cracks,voids), resistance to chemical, etc. The
extent of ageing and its effects depend, apart from the inherent stability of various
plastics, also on the additives present such as stabilizers, fillers, and plasticizers
(Ehrenstein 2001).
2.3 Factors affecting polymer degradation
Degradation is defined as “A process which leads to a deterioration of any
physical property of a polymer” by Singh and Sharma (2008). It is well accepted
fact that polymeric materials are susceptible to attack by a wide variety of
naturally occurring and man-made agents. In general, the degradation process
affects the thermal stability, mechanical properties, crystallinity and lamellar
thickness distribution and begins in the amorphous/crystalline interface (Ramis
2004).

23
2.3.1 Natural degradation agent
All polymeric materials are affected by outdoor weather. The outdoor
weathering factors responsible for the degradation or loss of properties of the
polymeric materials are listed in Table 2.1. It must be noted that ageing in the
broad sense is often the consequence of several factors in combination (Brown
2002). A material is typically exposed to more than one factor during the time of
outdoor usage, however, multiple outdoor weathering factors may accelerate the
degradation process many times, often affect the polymer performance more
severely than the effect of any single factor (Campo 2008).
Polymer degradation in broader terms includes biodegradation, oxidation,
mechanical, photo, thermal and catalytic degradation. According to their chemical
structure, polymers are vulnerable to harmful effects from the environment. This
includes attack by chemical deteriogens – oxygen, its active forms, humidity,
harmful anthropogenic emissions and atmospheric pollutants such as nitrogen
oxides, sulphur dioxide and ozone – and physical stresses such as heat, mechanical
forces, radiation and ablation (Pielichowski and Njuguna 2005).
The results of exposing polymeric materials to these conditions can lead to
discolouration, loss of mechanical strength, embrittlement, and loss of electrical
insulation and resistance properties. The degree to which a particular material
degrades depends on its susceptibility to each of the above factors (ASM
International 2003).

24
Table 2.1: Types of degradation agents.
Degradation agent Type of ageing or effect
Temperature Thermo-oxidation, additive migration,
crosslinking, crosslink loss (reversion)
Light Photo-oxidation
Ionizing radiation Radio-oxidation, crosslinking
Humidity Hydrolysis
Fluids (gases, liquids,
vapours)
Chemical degradation, swelling, additive
extraction. Cracking
Bio-organisms Decomposition, mechanical attack
Mechanical stress Fatigue, creep, stress relaxation, set,
abrasion, adhesive failure
Electrical stress Local rupture
Two degradation agents may have a synergistic effect in that their effect, in
combination, is greater or less than the sum of their individual effects. This is
clearly very important when multiple agents are present. Simple examples are:
perspiration in contact with elasticated garments weakening threads through
swelling, which leads to more rapid ageing on cleaning; or light ageing of a
stretched product causing surface relaxation, which leads to apparently improved
ozone resistance (Brown, Forrest and Soulagent 2000; Brown 2001).
The rate of degradation by environmental agents is generally increased in
the presence of stress. The degradation agent may be applied continuously or
intermittently to give cyclic exposure. The exposure cycles may include two or
more agents applied alternatively. The effects of cyclic exposure may not be the

25
same equivalent dose of continuous exposure (Brown, Forrest and Soulagent 2000;
Brown 2001).
2.3.1.1 Temperature
Heat is also very commonly used in testing combination with other agents,
notably light, liquids and gases. Low temperature (subambient) is not really a
degradation agent but produces temporary physical effects on properties, such as
stiffening, brittleness and recovery from strain, which may be critical in term of
service performance (Brown, Forrest and Soulagent 2000; Brown 2001). Exposure
to elevated temperature can result in loss of mechanical properties (embrittlement,
loss of impact strength, flexibility, and elongation) and loss of electrical properties.
Discolouration, cracking, chalking, loss of gloss, and flaking can also occur (ASM
International 2003).
2.3.1.2 Ultraviolet light
Light includes radiation beyond the visible range, particularly in the UV
region. The UV rays of solar light reaching the earth have a wavelength of 290 -
400 nm, which corresponds to the bond energy of standard organic compounds (99
- 72 Kcal/mol). Shorter wavelengths tend to have a greater effect on the surface of
the material because their total energy can be absorbed within a few micrometres
of the surface. Longer wavelengths tend to penetrate more deeply into a polymeric

26
material but have a moderate degradative effect because they are not easily
absorbed (ASM International 2003).
Increasing of temperature accelerates the rate of any chemical reaction and,
while most photochemical reactions are not very temperature sensitive, any
subsequent chain reactions usually are temperature dependent (Brown, Forrest and
Soulagent 2000; Brown 2001).
2.3.1.3 Ionizing radiation
Ionizing radiation covers X-rays, gamma rays and various subatomic
particles. The intensity of ionizing radiation at the earth‟s surface is not high
enough to significantly affect properties of rubbers and hence radiation exposure is
only a consideration in connection with applications in nuclear plant and possibly
where radiation is used to induce crosslinking or for sterilization. It is normally
only important in specialist applications (Brown, Forrest and Soulagent 2000;
Brown 2001).
2.3.1.4 Moisture
Moisture is absorbed when a polymeric material is exposed to water or
humidity. Outdoor exposure to moisture can include rain, snow, humidity, and
condensation. Water will cause the polymer to swell and act as a plasticizing agent
with polymer material, consequently lowering its performance (Naranjo et al.,

27
2008). The chemical effect, known as hydrolysis, may be the major factor in the
degradation of condensation polymers such as PES (Yoshioka and Grause 2008),
PA (Jacques et al., 2002) and polycarbonates (Osswald and Menges 2003). Water
can also attack the bonds between the polymer and an additive, such as pigment,
resulting in chalking. Rain can wash away any additives, such as flame retardants,
that may have bloomed or migrated to the surface as a result of sunlight or another
outdoor exposure factor (ASM International 2003). There may be a synergistic
effect with other agents. For example, a material resistant to UV alone or to
moisture alone may fail when exposed to UV and moisture in combination (Brown,
Forrest and Soulagent 2000; Brown 2001).
2.3.1.5 Fluids
Fluids encompass a whole range of chemicals, both gases and liquids,
which can come into contact with the material in various ways. Fluids may be
absorbed and cause swelling of the rubber, or may extract soluble constituents of
the compound, or be a source of pro-oxidant materials (from water, cleaning fluids,
etc.), or may have chemical effects. Ozone causes cracking of many rubbers when
under strain (Brown, Forrest and Soulagent 2000; Brown 2001).
2.3.1.6 Mechanical stress and electrical stress
Fatigue failure resulting from repeated cyclic deformation is possible in
many applications and can result in crack propagation or heat build-up. For seals

28
and similar products the set and stress relaxation which develops with prolonged
deformation are critical factors to performance (Brown, Forrest and Soulagent
2000; Brown 2001).
Alternatively, under prolonged stress, creep will occur. In some
applications, abrasion is clearly only an important factor in the failure of particular
products but then it can be the limit to useful life, as for example in shoe soles and
rubber flooring. In specialist areas, the product will be subject to electrical stress.
Apart from the direct electrical stress, heating due to the current or dielectric
heating will result in thermal ageing (Brown, Forrest and Soulagent 2000; Brown
2001).
2.3.1.7 Microbiological attack
Polymeric materials are generally not vulnerable to microbial attack under
normal conditions. However, low molecular weight chemical additives such as
plasticizers, lubricants, stabilizers, pigments and antioxidants my migrated to the
surface of the polymer material and encourage the growth of microorganisms
(Campo 2008). The growth of fungi and bacteria on polymeric material will result
in discolouration, surface attack and loss of optical transmission (ASM
International 2003). Growth rate of the microorganism strongly depends on
surrounding factors such as heat, light, and humidity. Preservative additives, also
known as fungicides or biocides, are added to polymeric materials to prevent the

29
growth of microorganisms. These additives are highly toxic to lower organism but
do not affect higher organisms (ASM International 2003; Campo 2008).
2.3.2 Nature of polymer
During its lifetime a rubber can be subjected to different types of
degradation from different exposure conditions. The mechanisms which produce
degradation depend not only on the degradation agents present but also on the
nature of the polymer and additives (Brown, Forrest and Soulagent 2000; Brown
2001).
2.3.2.1. Chemical composition
Chemical composition of the polymers plays a very important role in their
degradation. The long carbon chains found in thermoplastic polyolefins (PO)
makes these polymers non-susceptible to microbial degradation. However, with
the incorporation of the heterogroups such as oxygen in the polymer chain makes
polymers susceptible for biodegradation and thermal degradation (Singh and
Sharma 2008). Presence of unsaturation in the natural rubber make it more
susceptible oxidative degradation as compared to PE while linear saturated POs
are resistant to oxidative degradation (Singh and Sharma 2008). As compared to
crystalline areas of a polymer, amorphous regions were more labile to thermal
oxidation due to the high permeability of oxygen molecule in the amorphous
30
regions. A polymer with unreactive methyl and phenyl groups or with no hydrogen
at all shows resistance to oxidation (Singh and Sharma 2008).
2.3.2.2 Polymer structure
Natural macromolecules, such as protein, cellulose, and starch are
generally degraded in biological systems by hydrolysis followed by oxidation.
Thus, synthetic biodegradable polymers contain hydrolyzable linkages along the
polymer chain; for example, amide enamine, ester, urea, and urethane linkages are
susceptible to biodegradation by microorganisms and hydrolytic enzymes
(Chandra and Rustgi 1998). The biodegradabilities of synthetic polymers are
greatly affected by the hydrophilic–hydrophobic character of synthetic polymers
because most of the enzyme-catalyzed reactions occur in aqueous media. A
polymer containing both hydrophobic and hydrophilic segments seems to have a
higher biodegradability than those polymers containing either hydrophobic or
hydrophilic structures only (Chandra and Rustgi 1998).
2.3.2.3 Molecular weight
Plastics remain relatively immune to microbial attack as long as their
molecular weight remains high. It has been reported that some microorganisms
utilize PO with low molecular weight faster as compared to high molecular weight
PO (Yamada-Onodera et al., 2001). Many plastics, such as PE, Polypropylene and
PS do not support microbial growth. However, as reported by Chandra and Rustgi

31
(1998) and Singh and Sharma (2008), low molecular weight hydrocarbons, such as
linear PO with molecular weight lower than 620 support microbial growth thus can
be degraded by microbes.
2.3.2.4 Incorporation of functional groups.
Incorporation of some functional group such as carbonyl groups in PO
makes these polymers susceptible to photodegradation. Rate of photodegradation
increases as the number of chromophores increases due to more sites are available
to absorb more photons for the photodegrdation initiation reaction. According to
Singh and Sharma (2008), photochemical degradation occurs when the carbonyl
chromophore absorbs near-UV radiation and form radicals by the Norrish Type I,
II and hydrogen-abstraction processes. Incorporation of metal-metal bond in
polymer backbone induces photodegradability as the metal-metal bond cleaves
homolytically on irradiation.
2.3.2.5 Additives
Non-polymeric impurities (such as residues of polymerization catalysts,
transformation products of additives), fillers or pigments affect the polymer
resistance to degradation. Polymer such as PVC and PS originally are not affected
by sunlight, however, when presence of small amount of impurities or structural
defects, which absorb light and initiate the degradation (Johanson 2009). Thermal
oxidative processes of PO was accelerated by transition metal traces which
32
inducing hydroperoxide decomposition. For example, TiO2 delustrant has made
the PA susceptible for heat- and light induced oxidation (Singh and Sharma 2008).
2.3.2.6. Chemical bonding
Linkage affects the degree of degradation in plastic. In thermoplastic, weak
points were created during addition polymerization such as head-to-head addition
of monomer units and tail-to-tail addition of monomer units which make the
plastic susceptible for degradation. Thermal degradation of
poly(methylmethacrylate) (PMMA) is further enhances by its head-to-head linkage
of the polymer. Branching in polymer chain increases thermal degradation. Rate of
photodegradation will be decreases if radical-radical combination reaction was
favoured by crosslink formation the locking the polymer structure and preventing
lamellar unfolding because these actions prevent separation of photo-produced
radicals (Singh and Sharma 2008).
2.3.2.7 Methods of synthesis
Methods of synthesis show the noteworthy effect on the stability of the
polymers. Anionic polymerized PS showed more photo-stability than free radically
formed polymer due to the presence of peroxide residue in the latter, which is
labile for photodegradation (Pospisil et al., 2006). As compared to copolymerized
PP, Ziegler-Natta catalyst and bulk polymerization of PP is more susceptible
towards photodegradation (Singh and Sharma 2008).

33
2.3.2.8 Effect of substituents
Substituents affect the degradation processes in many polymers containing
labile α-hydrogen in the repeating units and modify the reaction course profoundly
even if the main chain scission reactions prevail. Chain-end scission reactions are
predominant for ethylene and 1-substituted ethylene by producing either little or
up to 50% monomer as volatiles. Ghosh (1990) found that 1,1-disubstituted
ethylene with chlorine as substituents did not favour chain end degradation route,
whereas repeated units apparently favoured 100% monomer yield. Thermal
stability of a polymer decrease with increases the number of substituents on
polymer backbone. For the same reason, PP and polyisobutylene are less thermal
stable as compared to PE. The effect of substituent groups on the stability of the
backbone C-C bond is apparent from the comparison of the bond dissociation
energies for C-C bond (in kJ/mol), CH3-CH3 = 368, CH3CH2CH3 = 356,
(CH3)3CCH3 = 335 and C6H5CH2CH3 = 293 (Singh and Sharma 2008).
Contrary to this, presence of aromatic groups in a polymeric backbone will
increase the thermal stability of the polymer. Presence of electronegative groups
such as fluorine in teflon will also increases the thermal stability of the polymer
due to high dissociation energy (452 kJ/mol) of C-F bond (Singh and Sharma
2008).

34
2.4 Types of polymer degradation
Polymer degradation is generally indicates the irreversible change of
chemical or physical properties which is caused by the chemical and/or physical
action of agents. Degradation includes the deterioration of macromolecules caused
by bond scissions in the polymer backbone, intermolecular crosslinking with
formation of new chemical bonds between adjacent molecules and chemical
reactions at the side chains (Brown 2001; Ha-Anh and Vu-Khanh 2005). There can
also be changes to ingredients such as extraction of plasticisers or attack of fillers
by acids. Depending upon the nature of the causing agents stated above, polymer
degradation has been classified as photo-oxidative degradation, thermal
degradation, ozone-induced degradation, mechanochemical degradation, catalytic
degradation and biodegradation.
Photo-oxidative degradation is the process of decomposition of the
material by the action of light. When the light is irradiated on a polymer, some of
the atoms within the polymer become exited by absorb the energy of the photons.
The absorbed photon energy can be sufficient for atoms to spontaneously
dissociate from the position of the polymer resulting in degradation phenomena
such as chain scission (ASM International 2003). Photodegradation changes the
physical and optical properties of the polymer. The most damaging effects are the
visual effect (yellowing), the chalking effect, the loss of physical and mechanical
properties of the polymers, the changes in molecular weight and the molecular
weight distribution (Ghaffar, Scott and Scott 1976; Nishimura and Osawa 1981;

35
Nagai et al., 1999; Martin, Chin and Nguyen 2003; Abadal et al., 2006; Marek et
al., 2006; Rosu, Rosu and Cascaval 2009).
Under normal conditions, photochemical and thermal degradations are
similar and are classified as oxidative degradation. The main difference between
the two is the sequence of initiation steps leading to auto-oxidation cycle. Other
difference includes that photochemical reactions occur only on the surface of the
polymer, whereas thermal reactions occur throughout the bulk of the polymer
(Singh and Sharma 2008). The basic categories of thermal degradation process are
side group elimination, random chain scission, and depolymerization where the
polymer reverts to its original monomers (Pielichowski and Njuguna 2005;
Johanson 2009; Batchelor, Loh and Chandrasekaran 2010). Thermal degradation
also occurs in an auto-catalytic process, at lower temperatures, when oxygen is
present in the environment (ASM International 2003). This oxidative degradation
of polymers is catalysed by heavy metals, such as copper, which undergo a
reduction-oxidation reaction in the presence of oxygen (ASM International 2003).
Complex reactions occurring in thermal degradation of polymers depend on
various factors like reaction medium, heating rate, reactor geometry and pressure.
High viscosity polymers make the process become complicated by impeding heat
and mass transfer (Singh and Sharma 2008).
Atmospheric ozone usually causes the degradation of polymers under
conditions that may be considered as normal; when other oxidative ageing
processes are very slow and the polymer retains its properties for a rather longer

36
time (Cataldo 1998a; Cataldo 1998b; Cataldo, Ricci and Crescenzi 2000). The
presence of ozone in the air, even in very small concentration, markedly
accelerates the degradation of polymeric materials (Kefeli, Razumovskii and
Zaikov 1971). Ozone reaction is electrophilic and therefore attacks where the
electron density in a polymer chain is high (e.g. at double bond site). The rate of
degradation depends slightly on temperature and is decreased in the presence of
electron-withdrawing substituents at the double bonds. It is also dependent on the
olefin configuration, the trans-isomers being more reactive by about 10 fold than
the cis-isomers (Brown 2001; Rakovsky and Zaikov 2004). In saturated polymers,
this process is accompanied by the intensive formation of oxygen containing
compounds, by the changing in molecular weight and by the impairment of the
mechanical and electrical properties of the specimens (Andrady 1998).
Mechanochemical degradation of polymers involves the degradation of
polymer by strong ultrasonic irradiations and under mechanical stress (Li, Guo and
Li, 2006). Breakdown of molecular chains by mechanical force or under shear is
often aided by oxidation which is known as mechanochemical degradation. This
type of degradation is common in machining process such as mastication, grinding
and ball milling (Mitchell 2003). Example of mechanochemical degradation is
rubber mastication which leads to chain breakage and development of plasticity
under shear. Mastication of rubber in the atmosphere of nitrogen at ordinary
temperature does not change the plasticity and molecular weight appreciably, but
with the presence of oxygen, degradation occurs immediately and rapidly. Under
mechanical shear, the rubber molecules break into radicals and react with oxygen

37
in the atmosphere leading to permanent chain breakage. In nitrogen, however, the
primary radicals formed under shear immediately recombine to give no effective
chain breakage (Gosh 2001).
Catalytic transformation of waste polymers into hydrocarbons with higher
commercial value is a field of great interest. POs can be catalytically or thermally
degraded into gases and oils. The most common catalysts used are acidic solids,
mainly alumina, amorphous silica-alumina and zeolites. Catalytic activity and
product selectivity are strongly affected by their textural and acid properties
(Aguado and Serrano 1999). For polymer degradation, different types of catalysts
have been reported in the literature which include Pt-Co and Pt-Mo supported over
SiO2 (Gimouhopoulos et al., 2000), transition metal catalysts (Cr, Ni, Mo, Co, Fe)
on the support (Al2O3, SiO2) (Williams and Bagri 2003), zirconium hydride (Singh
and Sharma 2008), zeolite catalysts (Jong-Ryeol et al., 2004) and non-zeolite
catalysts (Lin and Yen 2006).
Biodegradation is a natural process by which organic compounds in the
environment are converted to simpler compounds, mineralized and redistributed
through element cycles (carbon, nitrogen and sulphur). Biodegradation can only
occur within the biosphere as microorganisms play a central role in the
biodegradation process. Biodegradable polymer involves cleavage of
hydrolytically or enzymatically sensitive bonds in the polymer leading to polymer
erosion (Wei et al., 2011). Mineralization of organic compounds yields methane
and carbon dioxide under anaerobic conditions, and carbon dioxide and water

38
under aerobic conditions. Abiotic hydrolysis, photo-oxidation and physical
disintegration of polymers may enhance biodegradation of polymers by reducing
molecular weight to increases their surface area for microbial colonization
(Palmisano and Pettigrew 1992).
2.5 Thermal and thermal oxidative degradation
There are different types of bonds that can be branched in a polymer. The
bonds that tend to break first are the ones that form the weakest links in the chain.
Depending upon the presence of oxygen, temperature and the structure of the
polymer, degradation reactions will occur. Saturated hydrocarbons for example are
much more stable than PE in the absence of oxygen as are chloroalkanes when
compared with PVC (Allen and Edge 1992). In thermal degradation, degradation
of polymers can follow three major pathways: side group elimination, random
scission and depolymerization.
Side group elimination takes place generally in two steps. The first step is
the elimination of side groups attached to a back bone of the polymer. When the
side group is removed, the remaining unstable polyene macromolecule then
undergoes further reaction, including the formation of aromatic molecules,
scission into smaller fragments, or the formation of char (Pielichowski and
Njuguna 2005). Examples are the elimination of hydrogen chloride from PVC to
leave a polyene structure (Flynn 2002; Pielichowski and Njuguna 2005; Batchelor
Loh and Chandrasekaran 2010) and the elimination of isobutylene from poly(t-

39
butyl methacrylate) to leave polyacrylic acid (Flynn 2002). Thermal
dehydrochlorination of PVC begins with internal allylic chloride and tertiary
chloride structural defects formed during polymerization. During thermal
degradation, ordinary monomer units are converted into internal allylic chloride
defects by a mechanism that may include the abstraction of hydrogen by triplet
cation diradicals derived from polyene intermediates. Cyclization reactions seem
likely to contribute to the termination of polyene growth (Starnes 2002).
Random scission involves the formation of free radical at some point on
the polymer backbone, producing small repeating series of oligomers usually
differing in chain length by the number of carbons (Pielichowski and Njuguna
2005). This is a reverse process of polycondensation where lower molecular
weight fragments were produced but practically no monomer is liberated (Feldman
1990). The molecular weight falls rapidly from the start, only after the process has
continued for a long time are there many molecules small enough to be volatile
(Flynn 2002). For random degradation to occur, the polymer chain does not
require necessarily to carry any active site (Singh and Sharma 2008). PES
undergoes hydrolytic degradation resulting in chain scission. PE also undergoes
random degradation through migration of a hydrogen atom from one carbon to
another thus degraded into two fragments (Singh and Sharma 2008). Other
polymers that typically degraded by the random chain scission process are
generally vinyl polymers such as PS, poly(acrylonitrile), etc. The yield of
monomer of such polymers is usually low, and the pyrolyzed fragments are
ordinarily larger than corresponding monomer unit (Feldman 1990). For example,

40
poly(ethylene terephthalate) follows random thermal degradation route (Figure
2.3); the initial step resulting in scissions leads to carboxyl and vinyl groups.
Figure 2.3: Random thermal degradation mechanism of poly(ethylene
terephthalate)
Thermal degradation of the polymers follows either random degradation route
(Equation 2.1) or chain end degradation (also known as unzipping route)
(Equations 2.2 and 2.3) as shown below:
Mn Mx + My Eq. 2.1
M*n M*n-1 + M Eq. 2.2

41
M*n-1 M*n-2 + M Eq. 2.3
The chain end degradation also known as depolymerization reaction, starts
from the end of the chain and successively releases the monomer units (Feldman
1990). Depolymerizaton reaction is the opposite of the propagation step in addition
polymerization occurs through free radical mechanism. In this type of degradation,
molecular weight of the polymer decreases slowly and large quantity of the
monomer is liberated simultaneously (Singh and Sharma 2008). The
depolymerization reaction in thermal degradation need not be initiated at terminal
end of the macromolecule, instead, imperfections in the chain structure (initiator
fragment or a peroxide or ether link) form a weak link from where
depolymerization starts (Rawe 2000). A large number of addition polymers
depolymerize at elevated temperature, for example, PS, PMMA and polyaldehyde
are prone to converted almost quantitatively back to the monomer while PE
suffers random chain scission and decomposed into longer olefinic fragments and
actually producing little monomer (Daraboina and Madras 2008; Singh and
Sharma 2008; Batchelor, Loh and Chandrasekaran 2010).
In general, chain end degradation occurs when the backbone bonds are
weaker than the bonds of the side groups and only with polymer molecules,
carrying active chain ends with a free radical, cation, anion, etc. Chain end
degradation most frequently occurs when the polymer backbone contains a tertiary
carbon atom, such as, PMMA, poly(α-methylstyrene) (PαMS), PS, PP,
polytetrafluoroethylene and poly α-methylacrylonitrile (PMCN) (Feldman 1990).

42
For example, PαMS synthesized through anionic mechanism upon heating from -
70 oC to +60
oC undergoes degradation from the chain end carrying the active
carbanion in such a manner that at 60 oC, the entire polymer gets converted into
the monomer (Singh and Sharma 2008). The major degradation products for
fluorinated polyacrylate are monomer, dimer, trimer, saturated diester and
corresponding methacrylate along with remarkable amounts of alcohol (Budrugeac
2000; Zuev et al., 2006).
Unlike thermal degradation, where polymer scission can occur randomly
and/or at the chain end, oxidative degradation is characterized by random scission
in the polymer backbone ((Pielichowski and Njuguna 2005). According to
Johanson (2009), thermal oxidation, like photo-oxidation, is caused by
autoxidation, the difference merely being that the radical formation from
hydroperoxide is now activated by heat. At temperatures from ambient to over 100
oC, these hydroperoxide groups will be slowly generated in the presence of oxygen
at labile groups and linkages on the polymer chain. For example, tertiary carbon
atoms are more susceptible to autooxidation than secondary, which are, in turn,
more easily attacked than CH3 groups. Unsaturated linkages and ether groups are
easily attacked and aldehydes are more susceptible than ketones. The present of
residual metals and other catalysts in the polymeric material also may initiate the
hydroperoxide group formation (Flynn 2002). The typical chemical equations for
polymer oxidation involving free radical chain mechanism are shown in Figure 2.4.

43
Figure 2.4: Mechanism for polymer oxidation (RH = polymer hydrocarbon).
The initial step in thermal degradation is the cleavage of the weakest bonds
present in the polymer. The critical bond is the aliphatic CH, which permits a
number of the facile radical reactions that lead to cross linking or chain
degradation (ASM Internaional 2003). Hydroperoxide builds up as the reaction
proceeds and later, thermal decomposition of hydroperoxide groups becomes the
main source of the free radical formation by branching reaction (Flynn 2002).
Presence of the metal ion (transition metal based pigment) may also catalyses the

44
decomposition of hydroperoxide group in the polymer into radicals by the
following rections (Scheirs 2000):
Eq. 2.4
Eq. 2.5
Eq. 2.6
Termination achieved by combining free radicals into inert product.
Peroxyl radicals eventually terminate by reaction with other radicals to give
dialkyl peroxides, carbonyl species or alcohols (Singh and Sharma 2008). The
most important side reaction that could decrease the mechanical properties of
polymeric product is the chain cleavage reaction cause by β-scission reaction of
alkoxy radicals (Equation 2.7) (Gijsman 2011).
Eq. 2.7
Thermal degradation above 200 oC leads to chain scission and largely
depends on impurities like head-to-head units, unsaturation sites, and other
defectives (Ramis et al., 2004). POs are known to be sensitive to thermal
oxidation, due to the impurities generated during their manufacture at high
temperatures (Khabbaz, Albertsson and Karlsson 1999). Compounds formed by

45
thermo-oxidative degradation of PES are formaldehyde, acetaldehyde, formic acid,
acetic acid, carbon dioxide and water in large quantities while hydroxyaldehydes,
hydroxyacids, aldehyde acids are also identified in small quantities (Singh and
Sharma 2008).
Drago, Vera and Davorka (1995) have studied thermally stimulated
oxidative degradation of high impact PS with nitric acid. Mechanism of oxidation
and nitration depends upon temperature and leads to the molecular and chemical
heterogeneity and also lowering in mechanical properties of the polymer. PS
thermally gets degraded into organic compounds such as quinine, phenol,
diphenylamine and naphthalene at the experimental temperature of 350 - 450 oC
(Karaduman et al., 2001; Faravelli et al., 2003; Kiran, Ekinci and Srape 2004;
Bortoluzzi et al., 2006).
2.6 Lifetime prediction
Predictions of the long-term behaviour of polymers are based on
methodologies that have already been tested by Laboratory for Research and
Control of Rubber and Plastics (LRCCP) for various industrial sectors: civil
engineering (Channel Tunnel), construction, aeronautics and spatial, offshore,
fluid transport, nuclear and marine (Huy and Evrard 1998). Most assessments of
lifetime of rubbers are made by considering some measure of performance, such as
tensile strength, and specifying some lower limit for the property which is taken as

46
the end point corresponding to when the material is no longer usable (Brown,
Forrest and Soulagent 2000; Brown 2001).
Ageing is a difficult problem to study in practice, because it usually
proceeds slowly in service conditions of materials and lifetime reaches typically
several tens of years. Therefore, it is not advisable to test and qualify materials for
a given application on a natural ageing basis as it is usually time consuming.
Therefore accelerated laboratory test are highly valuable and frequently used to
study polymer durability (Manceau, Rivaton and Gardette 2012). Simulation and
modelling of long-term behaviour are only possible on the basis of accelerated
artificial ageing tests under the most representative conditions of the real
environment (Huy and Evrard 1998). Accelerated ageing test is then performed in
laboratories by increasing the level of the degradation agent such as temperature or
the intensity of radiation to speed up the normal ageing processes of items. It is
used to help determining the long term effects of expected levels of stress within a
shorter time and estimate the useful lifespan of a product when actual lifespan data
is unavailable (Brown 2001).
2.6.1 Basic methodology
The principle of the method consists in accelerating the physico-chemical
change of the material by raising the temperature to simulate its long-term state,
and then measuring the relevant properties in this thermo-activated state. This
method thus assumes that, where the other parameters do not change, the same

47
state of the material is attained after both a long period of exposure to the working
temperature and a shorter period of exposure to a higher temperature.
Experimental procedures based on known kinetic models (particularly Williams-
Landell-Ferry model and Arrhenius model) make it possible to characterize this
equivalence between time and temperature, in other words, to establish the law of
change of the material‟s properties in relation to these parameters. The resulting
property values can then be estimated far in excess of the experimentally
accessible time scale. The method remains applicable so long as the rise in
temperature does not change the mechanisms involved and it is also valid when
considering properties over very short periods of time. The choice of temperatures,
the interval between each temperature and the temperature range under
consideration are determined step by step, comparing the fitting of the results to
the model (Huy and Evrard 1998).
2.6.2 Arrhenius model for lifetime prediction
The Arrhenius model has been used for many years to predict polymer
lifetimes in various application equations (Huy and Evrard 1998; Lundquist et al.,
2000; Gillen, Celina and Bernstein 2003; Gillen, Bernstein and Celina 2005a;
Roland 2009; Choudhury, Bhowmick and Soddemann 2010; Kahlen, Wallner and
Lang 2010; Woo and Park 2011). Most degradation processes are temperature
activated, and they were best represented by the classic Arrhenius reaction rate.
Arrhenius approach has been utilized to analyse shorter-term high temperature
accelerated ageing exposures and then to extrapolate these results to make long-

48
term predictions at the much lower ambient temperature of interest (Lundquist et
al., 2001; Gillen, Bernstein and Celian 2005a). The shelf life of a rubber product is
predicted based on the Arrhenius principle of chemical reaction rates. Chemical
processes generally accelerate exponentially as the temperature is increased and in
many cases change in rate with temperature can be described by the well-known
Arrhenius relationship (Potter 2006). The Arrhenius equation has the basic form:
( )
Eq. 2.8
where k(T) is reaction rate constant for the process, A is the material constant, Ea
is the activation energy, R is the universal gas constant and T is the absolute
temperature in Kelvin.
In order to apply the Arrhenius equation to the ageing of rubber products, it
is assumed that the time required for a specific physical property, such as force at
break, to deteriorate to a specified threshold value, is directly proportional to the
extent of chemical reaction that has occurred. In turn it can be shown that the time
for the chemical reaction to reach a specified extent is inversely proportional to the
rate constant, k(T). The Arrhenius equation can be rearranged as follow:
( )
Eq. 2.9

49
or taking natural logarithm of both sides and rearranging Eq. 2.8 becomes;
( )
Eq. 2.10
Where t(x%) is the time for the property to fall to x% of the initial value and C is a
constant.
In the example shown in Figure 2.5, the property parameter has been
plotted against ageing time at five different temperatures, and the reaction rate
taken as the time for the property to reach a predetermined threshold value or end
of life criterion. . According to British Standards Institution 2009, median of force
at break and threshold value of 75% of the original value was chosen. Figure 2.5
illustrates how this done assuming a threshold value of 75% retained force at break.
Figure 2.5: Estimating the time to reach a specified threshold. X: Time in
days; Y: Initial force at break in %. 1: 75% threshold; 2: Time to
reach threshold in 60 oC.

50
Basically the time required to a specific property to fall to a defined
threshold value are determined in a series of different temperatures and the natural
logarithms of these times are plotted against the reciprocals of the absolute
temperatures. If the Arrhenius relationship is followed then, a straight line graph
will be obtained (Lundquist et al., 2001; Potter 2006; British Standards Institution
2009). A linear extrapolation of the straight line allows prediction of the life at
lower temperature. The slope of the line provides the activation energy of the
property change. Typical activation energies for many chemical reactions average
83 kJ/mol although the actual values found in practice way vary widely. Mott and
Roland (2001) found the activation energies of ageing of natural rubber in air and
seawater are 90 ± 4 and 63 ± 3 kJ/mol, respectively. The best fit to the Arrhenius
plot can be found by the least squares method and extrapolated to find the time to
the threshold value at a temperature of interest. The application of such a model is
shown in Figure 2.6.
One of the most critical aspects of this type of analysis is the ability to
draw a straight line through the various data point. However, the relation describes
a simple chemical reaction whereas in practice the reactions are likely to be
complex. It is assumed that the reactions at the service temperature are the same as
those at the testing temperatures, that the activation energy is independent of
temperature and that the chemical changes relate directly to the physical properties
measured (Huy and Evrard 1998; Brown 2001). Beside the straight line, a
discontinuation in the linear also gives us a lot of information. Once the
discontinuation is realized, this can be translated into a change of mechanism

51
within the chemical kinetics phenomena. If there is a discontinuation, there may be
two or more events or mechanism occurring (Harvey 2005).
Figure 2.6: Arrhenius plot for force at break assuming a threshold of 75%. Y:
ln t(75%) in years; X: 1/T in K-1
. 1: Extrapolation to 25 oC; y =
17071x – 47.71; R2 = 0.9987.
Note: The time estimated for the physical properties to fall to 75% from Figure 2.6
is 39 years at 25 oC. The activation energy is calculated as 141.9 kJ/mol.
2.6.3 Time-temperature superposition model for lifetime prediction
An alternative method of presenting accelerated ageing data is to use the
time-temperature superposition plot described by Wise, Gillen and Clough (1995);
Gillen, Celina and Keenan (2000), Gillen, Bernstein and Derzen (2005b); British
Standards Institution (2009); Kahlen, Wallner and Lang (2010) and others. This
method is based on the Arrhenius equation and is widely used in the scientific

52
literature to present accelerated ageing data on polymeric materials. Time-
temperature model is based on the application of the time temperature equivalency.
As compare to the Arrhenius model, this model does not need a prior require the
definition of a failure criterion. This approach defines the extension or reduction of
lifetimes at temperatures other than the reference temperature, as multiplying
factors to the lifetime at a given temperature, may be based on any type of failure
criterion.
An important prerequisite for the applicability of this approach is the
fulfilment of the self-similarity criterion (Gillen et al., 1996; Gillen, Celina and
Keenan 2000; Ha-Annh and Vu-Khanh 2005; Kahlen, Wallner and Lang 2010). A
superposition of data generated for various ageing temperatures is obtained by
shifting the various ageing curves horizontally along the time axes, so that one
single mastercurve is obtained. In this procedure the time values at each
temperature are transformed to equivalent times at a common reference
temperature by multiplying them by the Arrhenius shift factor, αT, which is derived
from the Arrhenius equation:
(
)
Eq. 2.11
where tTref and tTaged are the respective ageing time at reference temperature, Tref
and ageing temperature Taged in Kelvin, respectively, Ea is the activation energy, R
the universal gas constant and T the absolute temperature in Kelvin.

53
The physical properties obtained at the various ageing temperatures are
plotted against the respective transformed times on a common graph. The
activation energy for the specific material under consideration may be estimated as
described in 2.6.2 or obtained from the scientific literature (British Standards
Institution 2009; Roland 2009). If the ageing properties transform according to the
Arrhenius equation and the correct value is used for the activation energy then a
single master curve is obtained. The properties of the polymer material after any
period of ageing at the reference temperature can be readily read off the resulting
curve. An example of a time-temperature superposition plot (based in data given in
Figure 2.5) is given in Figure 2.7.
Figure 2.7: Time-temperature superposition plot. Y: Retained force at break
in %. X: Time at 25 oC in years.
Note: If 25% of decline in force at break can be tolerated before the polymeric
material is at risk of failing the specified requirement then the shelf life will be 38
years.

54
2.7 Protection and prevention of degradation
Many plastics available can be differentiate from each other by molecular
parameters such as (co-) monomer composition, molecular weight, molecular
weight distribution, chain branching and end groups, added fillers (e.g., glass,
nano-clay, talcum), pigments, and other inherent properties improving additives.
All these factors during polymerization and processing are well controlled to
produce materials with desired properties. However, once these plastics are
exposed to shear stress, heat, light, air, water, radiation, or mechanical loading,
chemical reactions can be initiated that lead to changes in molecular weight and
chemical composition. In practice this might result in an undesired change
(degradation) in appearance (e.g., gloss, texture, and colour) and mechanical
properties (e.g., tensile, flexural, or impact strength) (Gijsman 2011).
To protect the polymer against degradation, blends of stabilizers will be
used at various stages throughout the polymer life cycle. Stabilizer comes in three
varieties based on the type of degradation they prevent: chemical stabilizers
(typically antioxidants), thermal stabilizers, and UV radiation stabilizers (Peacock
and Calhoun 2006). According to Peacock and Calhoun (2006), the first two act by
removing the reactive species during the initiation step. They are radical
scavengers that react with radicals to either create a less reactive species or to
create a termination reaction, thereby eliminating the radical species. UV radiation
stabilizers interact with the photons which may cause degradation of the polymer.
They either block the photons from reaching the polymer or absorb the high

55
energy radiation and emit a lower frequency of light, which does not have the
energy necessary to initiate bond cleavage.
2.7.1 Chemical and thermal stabilizers
Chemical and thermal stabilizers both deactivate the by-products of
degradation processes, preventing them from causing further damage to the
polymer. Their chemical structure and mobility define their effectiveness in any
given polymeric system. The most common type of chemical and thermal
stabilizers is antioxidants.
Primary antioxidants are radical scavengers such as hindered phenols
antioxidants and aromatic amines (Rauwendaal 2002; Peacock and Calhoun 2006;
Gupta 2010a; Gijsman 2011; Palmer, 2011). They act by interrupting in the
oxidative degradation cycle by scavenging radicals. Primary antioxidants function
by donating their reactive hydrogen to the peroxy free radicals so that the
propagation of subsequent free radicals does not occur (Palmer, 2011). Their main
use is as processing or long-term heat stabilizer. Secondary antioxidants are used
in conjunction with primary antioxidants to provide added stability to the polymer.
They act against oxidative degradation by decomposing hydroperoxide to form
nonreactive product (Peacock and Calhoun 2006; Palmer, 2011). Important classes
of secondary antioxidants are phosphites and thioethers (Rauwendaal 2002;
Gijsman 2011). Against degradation during processing, mainly phosphites are
used, while as long-term heat stabilizer thioethers as well as phosphites are used.
However, the effectiveness of the antioxidants depends on which types of polymer

56
are used (Gijsman 2011). The level of antioxidant used in a polymer system
depends on the expected lifetime of the final part, the environment in which the
part will be used, and the susceptibility of the polymer to oxidation. Figure 2.8
shows two common antioxidants used in PO.
Figure 2.8: Examples of common antioxidants: a: 2,6-t-butyl 4-methyl phenol
(butylated hdroxy toluene); b: diphenyl-p-phenylene diamine.
Certain polymers are particularly unstable during processing and use. The
most notorious of these is PVC. The highly reactive chlorine atom easily forms
radicals under high shear and heat conditions and can then migrate through the
polymer, abstracting a proton and forming hydrogen chloride. The process is
autocatalytic, so it is essential to eliminate the radicals before the evolution of
hydrogen chloride that damages the processing equipment and degrades the resin
further. Different types of stabilizers are used to accomplish this, but all act to
remove the radicals. Examples of the thermal stabilizers used in PVC include
members of the organo-tin mercaptide family which have a general structure of
(RSn(SnR‟)3) where R and R‟ represent organic functional groups (Wirth and
Andreas 1977; Bilgic 1998). Lead oxides, and poly-basic lead sulfates
(nPbO.PbSO4.H2O) are also used as thermal stabilizers (Bilgic 1998; Peacock and

57
Calhoun 2006). In addition, some bases have been incorporated in PVC
formulations to react with the hydrogen chloride produced (Peacock and Calhoun
2006).
2.7.2 Ultraviolet radiation stabilizers
UV radiation stabilizers are chemicals which reduce or inhibit degradation
of polymers resulting from UV radiation. It can either block the light from
reaching most of the polymer or can absorb the light and then release it as heat. An
example of an UV radiation blocker is carbon black (Bilgic, 1998; Shah 2002;
Peacock and Calhoun 2006; Gugumus 2009). This material blocks the UV
radiation light from penetrating far into the polymer by physically blocking the
radiation (Peacock and Calhoun 2006). Carbon black stabilizers are often used in
conjunction with UV radiation absorbers. An example of an UV radiation absorber
is benzotriazole (Bilgic 1998; Peacock and Calhoun 2006). This molecule act as
screen absorbs UV radiation light in the range of 250 to 400 nm and then reemits
the energy at a longer frequency and lower energy before they cause damage to the
polymer. Blocking stabilizers are typically pigments that can absorb UV radiation
to a certain extent and provide some degree of protection (Shah 2002; ASM
International 2003). The presence of pigments prevents the light from penetrating
far into the polymeric part so that degradation will only occur near the surface. UV
radiation stabilizers that absorb the radiation contain strong chromophores, which
dissipate the energy they absorb to the surroundings as heat (Peacock and Calhoun
2006).

58
CHAPTER 3
MATERIALS AND METHODS
3.1 Materials
Non-sterile nitrile medical examination gloves made by polymerizing
butadiene, acrylonitrile and methyl acrylate acid are provided by Synthomer Sdn.
Bhd. XNBR glove samples are in medium size and blue in colour as shown in
Figure 3.1. XNBR latex (coded as 6322) with and without antioxidant are also
provided by Synthomer Sdn. Bhd. Analytical grade cyclohexanone used in
swelling test was from Merck, Germany.
Figure 3.1: Photograph of XNBR glove sample.

59
3.2 Method for accelerated ageing and testing
3.2.1 Accelerated treatment
Glove samples with thickness range about 0.085 mm to 0.100 mm were
first cut into dumbbell (die C), circle (25 mm in diameter) and square shape (150
mm x 80 mm) before being subjected for accelerated ageing. Accelerated ageing
was carried out in air circulated oven at various temperatures between 60oC and
100oC and for duration of between 0.5 and 4000 hours as tabulated in Table 3.1.
After accelerated ageing, samples were conditioned in desiccator for at least 16
hours to allow them to reach an equilibrium state before testing. Following the
ageing treatment, tensile properties, swelling in cyclohexanone, colour and surface
morphology of the samples were tested after ageing and compared to results
obtained from the unaged thin film.
Table 3.1: Accelerated ageing temperature and time.
Ageing
Temperature (oC)
Ageing Time (day)
60 0, 7, 14, 21, 42, 56, 70, 105, 140.
70 0, 2, 7, 14, 28, 42, 70, 98, 126.
80 0, 0.16667, 0.33333, 2, 7, 14, 28, 42, 56, 70.
90 0, 0.02083, 0.08333, 0.16667, 0.33333, 1, 7, 14, 21.
100 0, 0.02083, 0.04167, 0.08333, 0.16667, 0.33333, 1, 2, 4, 7.

60
3.2.2 Tensile test
Tensile properties of 13 samples for each batch of glove sample were
determined using a Tinius Olsen H10KS tensiometer (Tinius Olsen Limited.,
United Kingdom) equipped with an extensometer at room temperature (25 ± 2 oC).
The distance between upper and lower clamps was set at 60.00 ± 5 mm with a
crosshead speed was 500 mm/min. Dumbbell specimens were prepared using a
type C die according to ASTM Standard D 412 for tensile properties of elastomers.
The thickness of each specimen was taken as an average value of three different
positions on the narrow section of the specimen by electronic micrometer, which
was 6 mm wide. Two lines 25 mm apart were marked on the narrow section.
When the specimen was stretched, the change in the separation of the two lines
was recorded by the extensometer (Figure 3.2). The tensile properties of the
samples such as tensile strength, force at break and elongation at break were
calculated from 13 measured quantities.
Figure 3.2: Photograph of tensile strength measurement.

61
3.2.3 Solvent swell test
Two disc films with a diameter of 25 mm were prepared for solvent swell
test. 20 ml of cyclohexanone was poured into a petri dish using measuring a
cylinder. The sample disc film was ensured to be properly soaked into
cyclohexanone in petri dish for 30 minutes. The diameter of the films was
measured at 5 min, 10 min, 15 min and 30 min respectively by putting the petri
dish above a graph paper (Figure 3.3). The results were taken as the average of 2
disc films in percentage of linear swell of dipped films which was calculated using
the equation below:
( ) ( )
Eq. 3.1
*x = diameter of dipped film after a certain period of time
Before Swelling After Swelling
Figure 3.3: Photographs of the measurement of the diameter of the disc in
solvent swell test.

62
3.2.4 Colour test
The colour changes of the samples were measured using Colour Reader
Konica Minolta CR-10 (Konica Minolta Sensing Americans, America). The
device was calibrated against white standard tile. Colour changes of the samples
during accelerated ageing was measured using the L*, a*, b* coordinates of the
CIEL*a*b* (Commission International de l‟e′ clairage) 1967 colour space as
shown in Fig. 3.4 (Rosu, Rosu and Cascaval 2009). The total colour changes (ΔE)
as a function of the accelerated ageing treatment were calculated with Equation 3.2,
using the corresponding untreated material as reference:
√(
) (
) (
) Eq. 3.2
where subscript 1 denotes the values before ageing and subscript 2 denotes the
values after ageing, L* represents the grey value, which varies between 0 (black)
and 100 (white), positive values of (a*2 - a*1 ) describe a red shift, negative
values of (a*2 - a*1 ) describe a green shift, positive values of (b*2 - b*1 )
describe a yellow shift and negative values of (b*2 - b*1 ) describe a blue shift.
Each colour difference reported is the average of two samples, with an average of
three measurements of each sample.

63
Figure 3.4: Chromaticity coordinates of L*, a* and b*.
3.2.5 Scanning electron microscopy (SEM)
The surface morphology of the specimens was observed by SEM (JSM-
6701F, JEOL Limited, Japan) at a tension of 2 kV in secondary electron mode,
magnification at X2500. SEM scanning was carried out for unaged and aged
samples. The specimens were sputter coated with platinum to minimize charge
accumulation and beam damage (Figure 3.5).
Figure 3.5: Photograph of the thin film sample coated with platinum.

64
3.3 Method for real time ageing
Real time ageing was carried out by storing the fresh gloves in laboratory
at about 26 oC in commercial packaging and humidity about 65%, both in ambient
light (or under fluorescent lamp, 36 watt) with a distance of 2 meter above and in
dark condition (inside a drawer). Both of the samples in ambient light and in dark
condition were tested after 1 month, 2 months, 3 months, 6 months, 9 months, 12
months and 15 months for the four tests stated in Part 3.2.2 to 3.2.5 (Tensile test,
solvent swell test, colour test and SEM scanning).
3.4 Mechanism study
3.4.1 Thin film casting
Thin films were casted using XNBR Latex 6322 diluting in a beaker using distilled
water in a ratio of 5:1. Diluted latex was properly dropped on the surface of a glass
sheet using a dropper. Bubbles were removed and excess latex was drained back to
the beaker. Cast thin film was then dried in an oven at 60 oC for 30 minutes. After
dried, the casted thin film was immersed in distilled water for 5 minutes in order to
ease peeling. Thin film was placed on a card holder followed by drying in an oven
for another 10 minutes (Figure 3.6). Thickness for cast film was measured by
electronic micrometer which is around 0.020um.

65
Figure 3.6: Photograph of XNBR Latex Thin Film.
3.4.2 Accelerated ageing of thin film
Accelerated ageing treatment was carried out at 70 oC for 12 weeks and 90
oC for 4 weeks in an air circulated oven. After accelerated ageing, samples were
conditioned in desiccator for at least 16 hours to bring them into an equilibrium
state before FTIR characterization.
3.4.3 Fourier transform infrared (FTIR) characterization
Chemical changes were detected by FTIR Spectrometer Spectrum RX 1
(Perkin Elmer Incorporated, America) during the ageing of the samples. FTIR
characterization was carried out for the cast film samples aged at temperatures 70
oC and 90
oC at a week intervals. For comparison, FTIR characterization was also
performed for unaged cast film samples, which corresponded to the original state
of the polymer cast films.

66
3.5 Lifetime prediction
For lifetime prediction, two models applied in this study, the first was
based on BS EN 455:4 (2009), which aims at the determination of the time
required to reach a specified threshold for a specific physical property of polymers
in general. This model is based on a direct application of the force at break
criterion to the Arrhenius relationship. The advantage of this approach is that it is
rather simple and straight forward and easy to apply to the experimental data
directly. In comparison to British Standards, the second model does not need a
prior definition of a failure criterion. Time-temperature superposition method
proposed by Wise, Gillen and Clough (1995) and Gillen, Celina and Keenan (2000)
is based on the superposition of ageing curves at different temperatures to a master
curve by a horizontal shifting procedure by applying application of the time
temperature equivalency. The shift factors obtained are then analysed in term of
Arrhenius relationship.

67
CHAPTER 4
RESULTS AND DISCUSSION
4.1 Accelerated ageing and real time ageing
In general, short term effects are physical and reversible when the
temperature is returned to ambient, whilst the long term effects at elevated
temperature are mostly chemical and not reversible. The long term chemical
effects are usually referred to as the results of ageing.
Thermal ageing of rubber is taken to mean the effect of elevated
temperatures for prolonged periods but heat ageing treatments are carried out for
two distinct purposes. First, it can be intended to measure changes in the rubber at
the (elevated) service temperature or, secondly, it can be used as an accelerated
test to estimate the degree of change which would take place over much longer
times at normal ambient temperature.
In order to investigate the effect of thermal ageing on the physico-
mechanical properties of XNBR thin film, accelerated ageing were carried out in
air circulated oven at various temperatures between 60 oC and 100
oC and for
duration between 0.5 and 4000 hours. Real time ageing was carried out under two
conditions; under the fluorescent light and in dark condition for fifteen months at
room temperature (26 oC). Changes in tensile strength, linear swell, colour and

68
surface morphology after the ageing treatment were compared with the unaged
thin film.
4.1.1 Accelerated ageing
4.1.1.1 Tensile test
During thermal ageing, main chain scission, crosslink formation and
crosslink breakage can take place. If crosslinking dominates during ageing, the
elastomer hardens and embrittles resulting in increases in tensile stress at a given
elongation, increases in hardness, and decreases in ultimate elongation. This is the
general behaviour of butadiene-based material such as polybutadiene, styrene-
butadiene rubber, and acrylonitrile-butadiene rubber (Tung 2007).
It is also noticed that the rubber became rigid after high temperature ageing
and losing all elasticity which can be associated with both crosslinking reactions
and lubricant loss (Delor-Jestin et al., 2000). The tensile strength and elongation at
break are related to the crosslinking density of the rubber vulcanisates. These
changes are directly associated with changes in the original crosslink structure,
such as main chain scission and crosslink modifications (Yahya, Azura and
Ahmad 2011).
The dependence of the tensile strength and elongation at break on thermal
ageing is shown in terms of relative tensile strength values and relative elongation
at break values (defined as the ratio of tensile strength values or elongation at

69
break values in aged and the unaged reference state in %) in Figure 4.1 and 4.2.
Each data point typically represents the average result of thirteen identically aged
samples. Thickness of the samples range from 0.085 mm to 0.100 mm.
For all the temperatures tested in Figure 4.1, the relative tensile strength
demonstrates a trend which increases at the beginning to a maximum peak at a
given ageing time before it decreases with prolonged ageing time. A more steady
decrease is observed after the maximum for the lower temperatures. The test at
100 oC show more dramatic decrease after the maximum peak for tensile strength
as compared to other temperatures. As the temperature increases from 60 oC to 100
oC, the time to obtain the maximum is also decreases during the accelerated ageing.
For instance, at 60 oC and 100
oC, the characteristic times to reach the maximum
are around 70 days and 2 days respectively. The drop for tensile strength is more
pronounced at higher ageing temperatures.
The relative elongation at maximum property for XNBR thin film samples
after thermal ageing at temperature between 60 oC and 100
oC for different
duration of time is shown graphically in Figure 4.2. The elongation at maximum
data have a relatively large standard deviation makes it difficult to define clear
trends. This large standard deviation might cause by the impurities or defects on
the manufacturing of the film. However, it is clear that thermal ageing caused
gradually decreases of the elongation for all temperatures from the beginning of
until the end of the experiment, which means that ageing steadily takes away its

70
rubber-liker property. Higher the thermal ageing temperature will decrease the
elongation at maximum in faster speed.
Instead of look into the singe data point, a broad view of the data will be
preferred. During the earlier stages of thermal ageing, crosslink scissions and the
formation of new crosslinks into the stable networks affected these properties.
Fluctuations of some of the points probably are cause by the balancing between
the crosslink scission and the crosslink formation in the polymer. In fact, both
crosslink scission and crosslink formation occur simultaneously, and these
reactions occur all the time in the ageing treatment. The thermal ageing of XNBR
results in an increase in the tensile strength and decrease in the elongation at break
indicating that crosslinking dominates during the early stage of ageing.
Additional network chains due to crosslinking increase the molecular
weight and create branched molecules. It is more difficult for these branched
molecules to disentangle and so, strength is enhanced (Ratnam, Chantara and
Mohd 2006; Tung 2007). However, the initial increase of the relative tensile
strength values might be also due to the incomplete crosslink in the cured rubber
system.
The tensile strength increases rapidly to give a maximum peak for all
temperatures, probably from an optimized balance between the strength
enhancement from additional crosslink formation during the ageing treatment and
the capability of the crosslinked network to dissipating strain energy. On further

71
ageing after the characteristic time, crosslink scission become dominant as
compare to crosslink formation which results in main chain degradation. Thus,
caused a drastic reduction of both tensile strength and elongation properties at the
ending stage of the ageing treatment (Ha-Anh and Vu-Khanh, 2005; Choudhury,
Bhowmick and Soddemann 2010).

72
Figure 4.1: Changes in the relative tensile strength of XNBR thin film as a
function of ageing time at various temperatures.
60
70
80
90
100
110
120
0 20 40 60 80 100 120 140 160
Rel
ati
ve
ten
sile
str
ength
(%
)
Ageing Time (Days)
60 degree Celsius
70 degree Celsius
80 degree Celsius
90 degree Celsius
100 degree Celsius

73
Figure 4.2: Changes in the relative elongation at maximum of XNBR thin film
as a function of ageing time at various temperatures.
80
85
90
95
100
105
0 20 40 60 80 100 120 140 160
Rel
ati
ve
Elo
ngati
on
at
maxim
um
(%
)
Ageing time (days)
60 degree Celsius
70 degree Celsius
80 degree Celsius
90 degree Celsius
100 degree Celsius

74
4.1.1.2 Solvent swell test
Figure 4.3 shows the relative linear swell (defined as the ratio of linear
swelling percentage values in aged and the unaged reference state in %) of the
XNBR thin film over various ageing periods at different temperature.
The results show that before ageing treatment, the relative linear swell is
80% for all the temperature range. Upon accelerated ageing, the linear swell shows
decreasing pattern for all temperatures but the changes are more pronounced as the
temperature was increased from 60 oC to 100
oC. The relative linear swell decrease
more rapidly as the temperature increased. The relative linear swell starts to
decrease to 78% and 74% after ageing for 168 hours at 60 oC and 4 hours at 100
oC. The linear swell is related to the crosslink density of the elastomers. The early
stage of decreases can be explained by the formation of crosslink is dominant over
main chain scission and crosslink breakage. Increase of crosslinking in the rubber,
resulted in an increase in the network elasticity contribution. As explained by Ha-
Anh and Vu-Khanh (2005), higher crosslink density results in closer molecular
chains and thus an increase in intermolecular forces. These crosslinks restricted the
extensibility of the elastomer chains induced by swelling and made it more
difficult for the solvent to diffuse between the gaps of the elastomer molecules.
This decreased swelling of the sample and, thus, countered any tendency for
dissolution. Therefore, the linear swell decreased with increasing network.
However, the relative linear swell reached a constant value at around 60% of
swelling. The decreases to a constant value may be caused by chain scission of the

75
backbone resulted by prolonged ageing. Loss of lubricant and embrittlement of
the sample may be also one of the factors causing the decrease on its swelling
property.
Figure 4.3: Changes in the relative linear swell of XNBR thin film as a
function of ageing time at various temperatures.
55
60
65
70
75
80
85
0 20 40 60 80 100 120 140 160
Rea
tive
lin
ear
swel
l (%
)
Ageing time (days)
60 degree Celsius
70 degree Celsius
80 degree Celsius
90 degree Celsius
100 degree Celsius

76
4.1.1.3 Colour measurement
Aged samples suffer an intense and irreversible colour change during the
thermal ageing treatment basically due to the formation of chromophores. The
observed colour change is strongly dependent on temperature. At lower
temperature, a noticeable yellowing is observed only after 3000 hours of ageing at
60 oC; however, at 100
oC the samples appear clearly more yellow after 24 hours of
ageing and brown materials are observed at the end of ageing (7 days at 100 oC).
Figure 4.4 shows the total colour differences (∆E) of the samples measured before
and after thermal ageing at different temperatures for various duration of time. The
total colour differences (∆E) values in Figure 4.4 confirmed that both the final
colour and discolouration rate are depending on temperature. Higher temperature
accelerates the chemical reaction in ageing, speed up the formation of
chromophores and yellowing is observed much earlier as compared to lower
temperature.

77
Figure 4.4: Changes in the relative total colour change (∆E) of XNBR thin
film as a function of ageing time at various temperatures.
0
5
10
15
20
25
30
35
40
0 20 40 60 80 100 120 140 160
Rel
ati
ve
tota
l co
lou
r ch
an
ge
(∆E
)
Ageing time (days)
60 degree Celsius
70 degree Celsius
80 degree Celsius
90 degree Celsius
100 degree Celsius

78
4.1.1.4 Scanning Electron Microscopy (SEM)
The surface morphology of the XNBR thin films were investigated using
SEM. The SEM image for unaged sample presented in Figure 4.5a shows a
homogeneous morphology without cracking. The SEM images of samples exposed
to accelerated ageing at 60 oC (56 and 140 days), 70
oC (70 and 126 days), 80
oC
(42 and 70 days), 90 oC (14 and 21 days) and 100
oC (4 and 7 days) are shown in
Figure 4.5b – 4.5g respectively. The first microcrack detected on the film surface
were 56, 70, 42, 14 and 4 hours for the samples aged at 60 oC, 70
oC, 80
oC, 90
oC
and 100 oC respectively. The number of microcraks increased upon prolonged
ageing period and at higher ageing temperature.

79
Figure 4.5: SEM images for unaged sample (a), aged at 60 oC for 56 (b) and
140 days (c), aged at 70 oC for 70 (d) and 126 days (e), aged at 80
oC for 42 (f) and 70 days (g), aged at 90
oC for 14 (h) and 21 days (i)
and aged at 100 oC for 4 (j) and 7 days (k).
(a) (b) (c)
(d) (e) (f)
(g) (h) (i)
(j) (k)
80
4.1.2 Real time ageing
4.1.2.1Tensile Test
Effect of real time ageing on tensile strength and elongation at maximum
were shown in Figures 4.6 and 4.7. During the ageing, crosslink formation and
crosslink scission were taken place simultaneously. The fluctuation at the early
stage of the ageing is due to the stability enhancement between the crosslink
formation and crosslink scission until a maximum was reached. In broad view,
both tensile strength and elongation at maximum are decreases when increases
ageing time. As compared to accelerated ageing, the decrease of these properties
upon real time ageing is much slower, however, their trends are similar. The
lowest value for tensile strength and elongation at maximum is not more than 80%
of retained strength and elongation after fifteen months of ageing. In generally, the
effect of real time ageing under florescent light is more pronounce than in dark
condition. In fact, UV is one of the potential degradation agents.

81
Figure 4.6: Changes in the relative tensile strength of XNBR thin film as a
function of ageing time for real time ageing.
Figure 4.7: Changes in the relative elongation at maximum of XNBR thin film
as a function of ageing time for real time ageing.
60
70
80
90
100
110
120
0 2 4 6 8 10 12 14 16
Rel
ati
ve
ten
sile
str
en
gth
(%
)
Ageing time (months)
light
dark
80
85
90
95
100
105
110
0 2 4 6 8 10 12 14 16
Rel
ati
ve
elo
ng
ati
on
at
ma
xim
un
(%
)
Ageing time (months)
light
dark
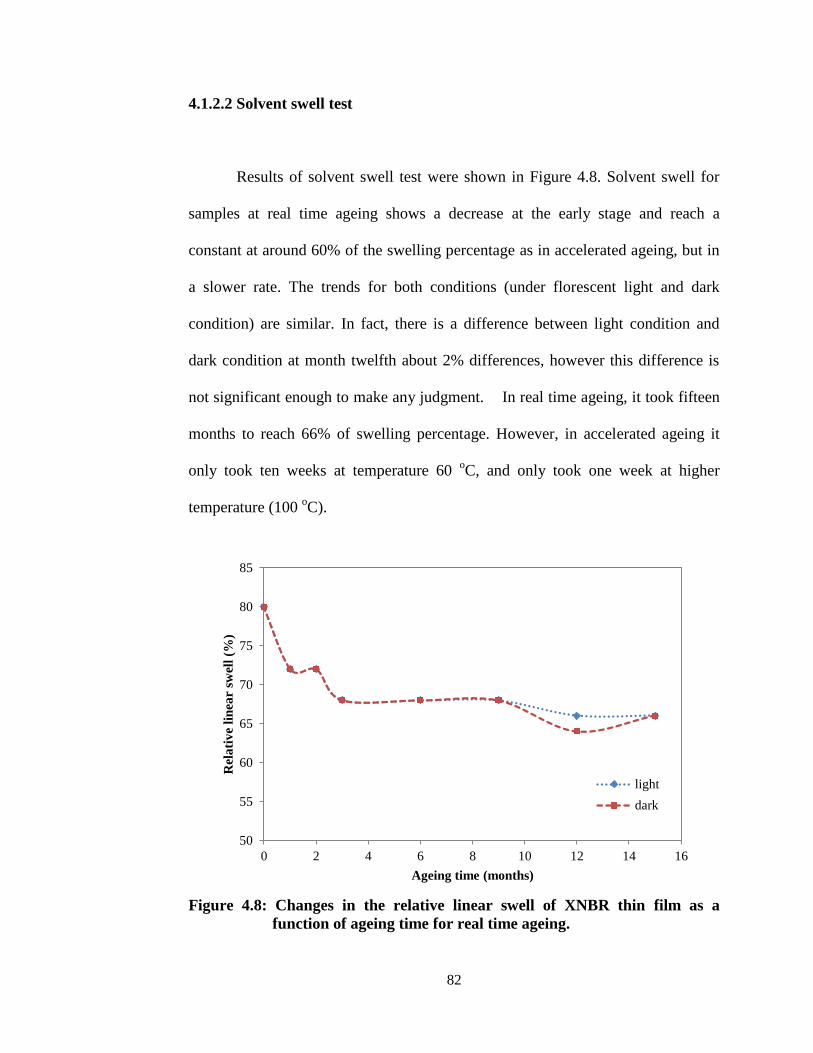
82
4.1.2.2 Solvent swell test
Results of solvent swell test were shown in Figure 4.8. Solvent swell for
samples at real time ageing shows a decrease at the early stage and reach a
constant at around 60% of the swelling percentage as in accelerated ageing, but in
a slower rate. The trends for both conditions (under florescent light and dark
condition) are similar. In fact, there is a difference between light condition and
dark condition at month twelfth about 2% differences, however this difference is
not significant enough to make any judgment. In real time ageing, it took fifteen
months to reach 66% of swelling percentage. However, in accelerated ageing it
only took ten weeks at temperature 60 oC, and only took one week at higher
temperature (100 oC).
Figure 4.8: Changes in the relative linear swell of XNBR thin film as a
function of ageing time for real time ageing.
50
55
60
65
70
75
80
85
0 2 4 6 8 10 12 14 16
Rel
ati
ve
lin
ear
swel
l (%
)
Ageing time (months)
light
dark

83
4.1.2.3 Colour measurement
After fifteen months of real time ageing, no yellowing was observed and
the samples retained its original colour which is blue. As shown in Figure. 4.9, the
total colour change (∆E) is inconsistent and the highest value for total colour
change (∆E) is 1.3 for real time ageing under fluorescent light. This value is much
lower than that found in accelerating ageing, and the changes of the colour cannot
be observed by visible eyes. This low intensity of the total colour change (∆E)
value is most probably caused by the background noise and it is not significant
enough to conclude that there is colour change on the samples cause by real time
ageing.
Figure 4.9: Changes in relative total colour change (∆E) of XNBR thin film as
a function of ageing time for real time ageing.
0
0.2
0.4
0.6
0.8
1
1.2
1.4
0 2 4 6 8 10 12 14 16
Rel
ati
ve
tota
l C
olo
ur
cha
ng
e (∆
E)
Ageing time (months)
light
dark

84
4.1.2.4 Scanning Electron Microscopy (SEM)
For morphology study, the first crack was observed at the ninth month of
ageing under fluorescent light while for samples in the dark condition, no crack
was observed after fifteen month of ageing treatment (Figure 4.10).
Figure 4.10: SEM images for real time ageing under fluorescent light for 1
month (a), 3 months (b), 9 months (c) and 15 months (d) and in
dark condition for 1 month (e), 3 months (f), 9 months (g) and 15
months (h).
(b) (c)
(d) (e) (f)
(g) (h)
(a)

85
4.2 Lifetime prediction
4.2.1 Application of the Arrhenius equation to predicting shelf life
Generally, the useful life of a rubber component is governed by its
susceptibility to failure by either mechanical or chemical deterioration. In a
laboratory study chemical degradation can be accelerated by ageing the compound
at temperatures higher than the intended service temperatures. Such accelerated
testing has a long history in the rubber industry (Morrell, Patel and Skinner 2003,
Woo and Park 2011). The short time, high temperature degradation behaviour is
extrapolated to yield predictions of the property deterioration expected for long
time, lower temperature exposure, with quantitative predictions of lifetimes
obtained through the use of the Arrhenius relation (Roland 2009).
The shelf life of a rubber product is predicted based on the Arrhenius
principle of chemical reaction rates. Chemical processes generally accelerate
exponentially as the temperature is increased and in many case the change in rate
with temperature can be described by the well-known Arrhenius relationship. A
typical Arrhenius approach has been utilized to analyse shorter-term high
temperature accelerated ageing exposures and then to extrapolate these results to
make long-term predictions at the much lower ambient temperature of interest.
This approach is based on the assumption that the degradation involves an
activated chemical process whose rate is proportional to exp(-Ea/RT) where Ea is

86
the activation energy, R is the universal gas constant and T is the absolute
temperature in Kelvin.
( ) Eq. 4.1
Once an Ea value is obtained empirically from the accelerated experimental
results at high temperatures, it can be used to make extrapolated predictions at
lower temperatures with the assumption that Ea remains constant over the
extrapolated temperature range (Gillen, Bernstein and Celian 2005a). If the overall
degradation mechanism remains unchanged throughout the experimental
temperature range, the logarithm of the time to a given amount of degradation
(property change) should be linearly related to the inverse absolute temperature,
yielding Arrhenius behaviour (Gillen et al., 1996; Kahlen, Wallner and Lang 2010).
Implicit in this approach, it is assumed that the reactions at the service
temperature are the same as those at the testing temperatures, that the activation
energy is independent of temperature and that the chemical changes relate directly
to the physical properties measured (Wise, Celina and Clough 1995; Huy and
Evrard 1998; Brown 2001). The widely recognized inherent weakness of the
Arrhenius approach is the quality of the latter assumption which is not known in
prior, and may depend on many factors, for example, competition either between
multiple oxidation mechanisms within a material or between oxygen reaction and
diffusion could lead to temperature dependent activation energies (Wise, Gillen
and Clough 1995).

87
In order to predict the service lifetime, accelerated ageing was carried out
with air-circulated oven at the temperature ranging from 60 oC to 100
oC for a
period ranging from 30 minutes to 140 days. Figure 4.11 shows in terms of relative
median of retained force at break (defined as the ratio of median of retained force
at break in aged and the unaged reference state in %) for five different
temperatures.
Figure 4.11: Variation of relative force at break of XNBR thin film with
ageing time at various ageing temperatures.
50
60
70
80
90
100
110
120
0 50 100 150 200 250 300
Rel
ati
ve
forc
e at
bre
ak
(%
)
Ageing time (days)
60 degree Celsius
70 degree Celsius
80 degree Celsius
90 degree Celsius
100 degree Celsius

88
According to British Standards Institution (2009), to construct an
Arrhenius plot, a specific physical property and a predetermined threshold is
requested. A median of force at break and threshold value of 75% retained force at
break of the original value was chosen. From Figure 4.11, the time required for
each temperature to reach the threshold of 75% retained force was tabulated in
Table 4.1 below:
Table 4.1: Time required to reach the threshold of 75% retained force.
Temperature (oC) 1/T (K
-1) Time (days)
60 0.00300 230.80877
70 0.00292 153.06729
80 0.00283 63.36035
90 0.00275 27.44257
100 0.00268 10.38562
For data analysis and extrapolation, British Standards Institution 2009
recommends applying the method of least squares to the experimental data. The
graphical application of the above relationship to the existing experimental data
generated for XNBR thin film after accelerated ageing in air-circulated oven along
with extrapolations to lower temperatures for the criterion of force at break is
shown in Figure 4.12. Also indicated in the figures is the quality of the linear fit in
terms of regression coefficients which is equal to 0.9754.

89
Figure 4.12: Arrhenius plot of retained force at break at 75% for XNBR thin
film.
Using Equation 2.10 in Chapter 2, the activation energy and the time for
the property to reach the specific threshold at 25 oC can be easily calculated. From
Figure 4.12, the time estimated for the physical properties to fall to 75% is 25
years at 25 oC. From the slope of the straight line, activation energy of 81.43
kJ/mol is obtained using Equation 2.10 in Chapter 2. Typical activation energies
for many chemical reactions are an average of 83 kJ/mol although the actual
values found in practice vary widely (British Standards Institution 2009). Mott and
Roland (2001) found the activation energies of ageing of natural rubber in air and
seawater are 90 ± 4 and 63 ± 3 kJ/mol, respectively.
y = 9794.1x - 23.735
R² = 0.9754
0
2
4
6
8
10
12
0.0026 0.0027 0.0028 0.0029 0.003 0.0031 0.0032 0.0033 0.0034 0.0035
ln t
(75
%) (
days)
1/T ( K-1)
25oC

90
Huy and Evrard (1998) stated that ageing is a complex mechanism
resulting from a combination of several elementary processes that may have
different activation energies. Choosing the 70%, 75% and 80% of the retained
forece at break of XNBR thin film as failure criteria, the corresponding time to
reach these limits are presented in Table 4.2. The linear and parallel plots of the
natural logarithm of time for physical properties to fall to 70%, 75% and 80% with
various ageing temperatures of XNBR thin film is shown in Fig. 4.13 which
suggests that the effective activation energy may remain unchanged throughout the
experimental temperature range and the change in force at break during ageing is
controlled by Arrhenius behaviour. In another word, it has constant activation
energy in the range of experimental test. Average slope of these straight lines gave
global activation energy of 81.33 kJ/mol.
Table 4.2: Time required to reach the threshold of 70%, 75% and 80%
retained force at break.
Temperature (oC) 1/T (K
-1)
Time
(days) at
70%
Time
(days) at
75%
Time
(days) at
80%
60 0.00300 241.35721 230.80877 219.46707
70 0.00292 169.90428 153.06729 134.48708
80 0.00283 67.05799 63.36035 59.33429
90 0.00275 29.20718 27.44257 25.51224
100 0.00268 10.80226 10.38562 9.94060

91
Figure 4.13: Arrhenius plot of retained force at break at 70%, 75% and 80%
for XNBR thin film.
4.2.2 Application of the time-temperature superposition method to predict
shelf life
Time-temperature superposition approach according to Wise, Gillen and
Clough 1995; Gillen, Celina and Keenan 2000, Gillen, Bernstein and Derzon
2005b; British Standards Institution 2009; Kahlen, Wallner and Lang 2010 and
others is based on the application of the time temperature equivalency principle.
In comparison to the Arrhenius model this model does not require to define a
failure criterion in advance. This approach defines the extension or reduction of
lifetimes at temperatures other than the reference temperature, as multiplicative
0
1
2
3
4
5
6
7
0.0027 0.0027 0.0028 0.0028 0.0029 0.0029 0.0030 0.0030 0.0031
ln t
(d
ays)
1/T (K-1)
Retained force at break at 80%
Retained force at break at 75%
Retained force at break at 70%

92
factors to the lifetime at a given temperature, which may be based on any type of
failure criterion.
An important prerequisite for the applicability of this approach is the
fulfilment of the self-similarity criterion (i.e., the shape of the characteristic ageing
curves is similar for different temperatures) (Wise, Gillen and Clough 1995,
Kahlen, Wallner and Lang 2010). The data in Figure 4.11 are plotted againts the
ageing time since this allows us to visually determine how the shapes of the curves
compare as a function of temperature. When raising the ageing temperature in
order to accelerate degradation, the fundamental underlying assumption is that all
reactions are accelerated equally. This constant acceleration (independent of the
level of degradation) assumption implies that the degradation curves at differing
ageing temperatures will have the same shape when plotted versus the ageing time.
As shown in Figure 4.11, the prerequisite of self-similar ageing curve and
assumption are reasonably fulfilled for the investigated XNBR thin film in
accelerated ageing.
Using time-temperature supposition approach, the raw data in Figure 4.11
will be shifted to a selected reference tempearure, Tref, to obtain an mastercurve as
in Figure 4.15 with a reference temperature at 60 oC. This is accomplished by
multiplying the times appropriate to experiments at temperature T by a shift factor
of αT. The shift factors, αT, are chosen empirically to give the best superposition of
the data. If the data adhere to an Arrhenius relation, the set of shift factors αT, will
be related to the Arrhenius energy, Ea, by the following expression:

93
(
)
Eq. 4.2
where tTref and tTaged are the respective ageing time at reference temperature, Tref
and ageing temperature Taged in Kelvin, respectively, Ea is the activation energy, R
the universal gas constant and T the absolute temperature in Kelvin.
In this study, the lowest temperature was always chosen for which data in a
given set are available which is 60 oC. Note that although the quality of the
superposition is independent of the Tref, the use of a Tref below the lowest
temperature for which data is available requires an assumption regarding the
temperature dependence of shift factor (αT) below the lowest experimental
temperature.
An Arrhenius plot of the natural logarithmic values of the empirically
determined shift factors (αT) for the accelerated ageing is plotted as a function of
reciprocal temperature in Figure 4.14. As shown in Figure 4.14, these data give a
straight line and display excellent Arrhenius behaviour which gives an activation
energy of 81.43 kJ/mol and a lifetime of 25 years at 25 oC. Again, the data
reasonably fit the relationship of Equation 4.2, with regression coefficients value
equal to 0.9754 for the least square linear fit of the experimental data.

94
Figure 4.14: Arrhenius plot using empirical shift factor concept.
Table 4.3: Arrhenius shift factor (αT) for a reference temperature at 60 oC.
Temperature (oC) Arrhenius shift factor, αT
60 1.0000
70 1.5079
80 3.6428
90 8.4106
100 22.2239
y = -9794.1x + 29.177
R² = 0.9754
-0.5
0
0.5
1
1.5
2
2.5
3
3.5
0.00265 0.0027 0.00275 0.0028 0.00285 0.0029 0.00295 0.003 0.00305
ln α
T
1/T ( K-1)

95
Figure 4.15: Mastercurve for relative force at break against ageing time for
XNBR thin film at reference temperature of 60 oC.
The best time-temperature superposition of the ageing curve of force at
break data in Figure 4.11 to a mastercurve for XNBR thin film at reference
temperature of 60 oC is depicted in Figure 4.15; whereas the shift factors are
shown in Table 4.3. The superposition is excellent as expected given the
similarities in curve shapes observed for the five ageing temperatures (Fig. 4.15).
An alternative way to get a mastercurve is by applying Equation 4.2 using
the activation energy estimated earlier in Arrhenius approach or in early part in
Time-temperature superposition approach or from the scientific literature. Since
both approaches are giving the same activation energy value, the shift factor were
0
20
40
60
80
100
120
0 50 100 150 200 250 300
Rel
ati
ve
reta
ined
fo
rce
at
bre
ak
(%
)
Time (days)
60 degree Celsius
70 degree Celsius
80 degree Celsius
90 degree Celsius
100 degree Celsius

96
calculated by using 81.43 kJ/mol as the activation energy and 25 oC as the
reference temperature as tabulated in Table 4.4. Figure 4.16 is the mastercurve
with 25 oC as the reference temperature. The properties of the thin film sample
after any period of ageing at the reference temperature can be readily read off in
the resulting mastercurve. From Figure 4.16, the estimation for the physical
properties to fall to 75% retained force at break is 24 years at 25 oC.
Table 4.4: Arrhenius shift factor (αT) for a reference temperature at 25 oC.
Temperature (oC) Arrhenius shift factor, αT
60 31.6317
70 74.58058
80 167.46624
90 359.64442
100 741.34555

97
Figure 4.16: Mastercurve for relative force at break against ageing time for
XNBR thin film at reference temperature of 25 oC.
0
20
40
60
80
100
120
0 5 10 15 20 25 30 35
Ret
ain
ed f
orc
e a
t b
rea
k i
n (
%)
Time at 25oC (years)
60 degree Celsius
70 degree Celsius
80 degree Celsius
90 degree Celsius
100 degree Celsius

98
4.2.3 Comparison of lifetime and activation energies according to different
shelf life prediction approach
A comparison of the activation energies derived from applying the various
approaches described above is summerised in Table 4.5. For both approaches, the
calculated lifetime and activation energies are rather similar when using Arrhenius
plot, while when using the application of activation energy to construct the
mastercurve, the lifetime is slightly lower. According to British Standards
Institution 2009, typical activation energies for many chemical reactions are an
average 83 of kJ/mol although the actual values found in practice vary widely.
Table 4.5: Lifetime and activation energies prediction according to various
approach and assumption.
Arrhenius
approach
Time-
Temperature
superposition
approach
Time-
Temperature
superposition
approach (using
the activation
energy obtained)
Lifetime (year) 25 years 25 years 24 years
Activation Energy
(kJ/mol)
81.43 81.43 -

99
4.3 Degradation mechanism study of XNBR
Synthetic polymers are degraded in processes which involve breaking of
main valence bonds in the backbone of the chains or in side groups. Ranby (1989)
explained then formation of free radicals is because splitting of electron pairs into
two unpaired electrons in most cases the most favourable basic reaction
considering the energy required for breaking a chemical bond. Degradation of
polymers is a general phenomenon which can also be initiated in several other
ways, e.g. by photo, thermal, mechanical, chemical or biological (enzymatic)
effects. Degradation and oxidation of the polymers have several serious effects on
the physical properties such as on the molecular weight (molar mass) and the
molecular weight distribution, on the mechanical properties (tensile strength,
modulus, impact strength, creep, etc.) and on elasticity, softening point and surface
hardness. Various types of stabilizers are therefore added to many polymeric
materials to slow down the rate of degradation and prolong the useful lifetime of
the rubber product (Ranby 1989).
To study the mechanism of ageing, thin films were cast using XNBR latex
with and without antioxidant and subjected to thermal ageing at 70 oC and 90
oC.
Accelerated ageing of the thin film at both temperatures give a similar spectrum.
At the end of the ageing, the films without antioxidant turned yellowish, while the
films contained antioxidant remained colourless, and it occured to both
temperatures (70 oC and 90
oC). We used conventional techniques, FTIR
100
spectroscopy, to identify the chemical changes of these XNBR thin films through
thermal ageing.
Thermal ageing leads to significant changes in the FTIR absorption spectra.
The major by-product resulting from oxidation is carbonyl and hydroxyl species.
For thin film contain antioxidant (Figure 4.17 and 4.19), the only changes is on the
intensity of carbonyl region (1800 -1600 cm -1
), no significant increase in the
hydroxyl region (3600 – 3200 cm-1
) or decrease in the nitrile group (2237 cm-1
) as
well as in butadiene group (970 cm-1
). In the case of XNBR without antioxidant
(Figure 4.18 and 4.20), hydroxylated (3400 cm-1
) as well as carbonylated (1720
cm-1
) species are observed. Figure 4.17 – 4.20 shows FTIR spectra of XNBR thin
films with and without antioxidant for different exposure times through thermal
ageing at 70 oC and 90
oC. Table 4.6 shows the assignment of some characteristic
peaks of XNBR thin film. FTIR spectra for thin film without antioxidant aged at
90 oC have a similar pattern as those aged at 70
oC. However, the rate of the
degradation is higher at 90 oC compared to 70
oC.

101
Table 4.6: FTIR peaks assignment of XNBR latex thin film.
Stretching (cm-1
) Assignments
3528 hydroxyl group (OH) stretching region
3074 =CH stretch
2925 Asymmetric stretching of the methylene group (CH2)
2849 Symmetric stretching of the methylene group (CH2)
2237 Stretching of nitrile triple bonds (C≡N)
1730 Carboxyl group ( for free COOH group)
1698 Hydrogen bonded carbonyl
1639 C=C stretching
1541,1534 Carbonyl stretching vibration of zinc carboxylate salt
1448 In-plane deformation of the methylene group (C-H)
1380,1350,1307, C-C stretching vibration
1230~1000 C-O stretching
970 Out-of-plane vibration of the hydrogen atom of the 1,4-trans
component
918 Out-of-plane vibration of the methylene hydrogen atom of
the vinyl group
690 C-H bond (disubstituted) (CH)n>4
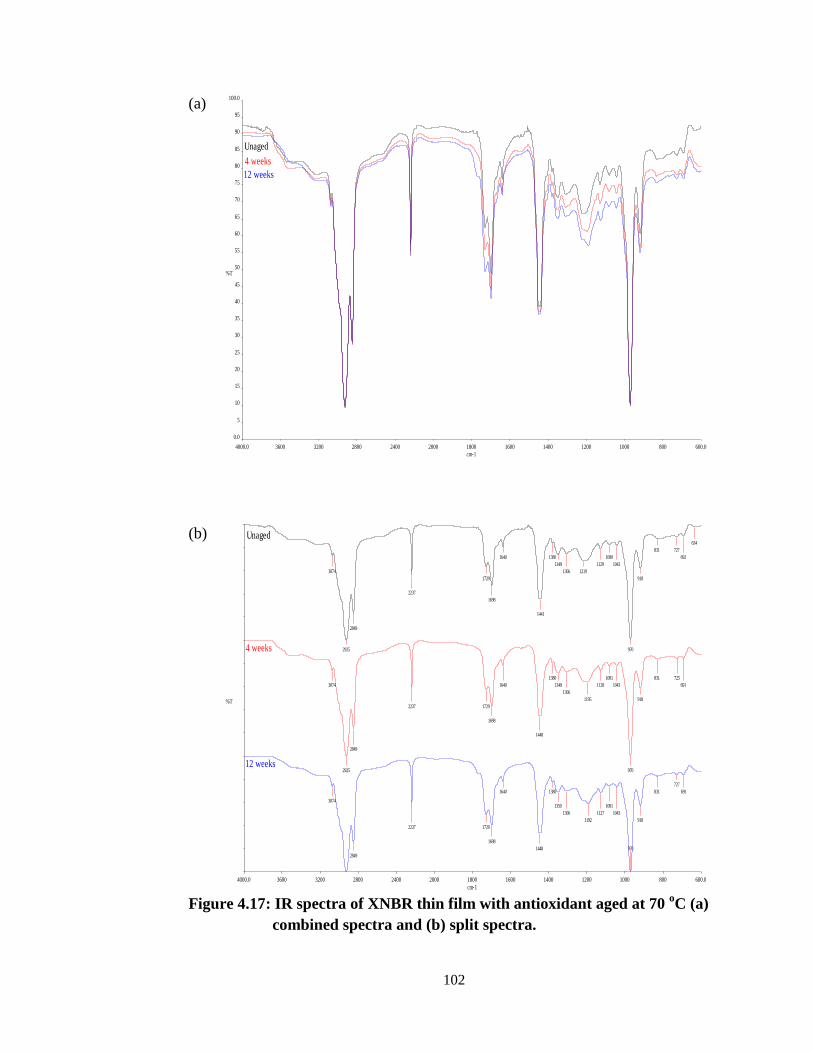
102
(a)
(b)
Figure 4.17: IR spectra of XNBR thin film with antioxidant aged at 70
oC (a)
combined spectra and (b) split spectra.
4000.0 3600 3200 2800 2400 2000 1800 1600 1400 1200 1000 800 600.0
0.0
5
10
15
20
25
30
35
40
45
50
55
60
65
70
75
80
85
90
95
100.0
cm-1
%T
Unaged
4 weeks
12 weeks
4000.0 3600 3200 2800 2400 2000 1800 1600 1400 1200 1000 800 600.0
cm-1
%T
Unaged
4 weeks
12 weeks
3074
2925
2849
2237
1729
1698
1640
1441
1380
1349
1306 1219
1129
1080
1042
970
918
831 727
692
634
3074
2925
2849
2237 1729
1698
1640
1448
1380
1349
1306
1195
1128
1081
1043
970
918
831 725
691
3074
2849
2237 1729
1698
1640
1448
1380
1350
1306
1192
1127
1081
1043
970
918
831
727
691

103
(a)
(b)
Figure 4.18: IR spectra of XNBR thin film without antioxidant aged at 70
oC
(a) combined spectra and (b) split spectra.
4000.0 3600 3200 2800 2400 2000 1800 1600 1400 1200 1000 800 600.0
0.0
5
10
15
20
25
30
35
40
45
50
55
60
65
70
75
80
85
90
95
100.0
cm-1
%T
Unaged
4 weeks
12 weeks
4000.0 3600 3200 2800 2400 2000 1800 1600 1400 1200 1000 800 600.0
cm-1
%T
12 weeks
4 weeks
Unaged
3074
2925
2849
2237
1730
1698
1640
1529
1441
1349
1305 1220
1128 1079
1040
970
918
800
3485 3074
2926
2850
2237
1725
1700
1640
1442
1380
1350
1305
1192
1126 1040
970
919
761
3481
3074
2852
2237
1769
1725
1640
1448
1351
1186
1122 1045
970
920
762

104
(a)
(b)
Figure 4.19: IR spectra of XNBR thin film with antioxidant aged at 90
oC (a)
combined spectra and (b) split spectra.
4000.0 3600 3200 2800 2400 2000 1800 1600 1400 1200 1000 800 600.0
0.0
5
10
15
20
25
30
35
40
45
50
55
60
65
70
75
80
85
90
95
100.0
cm-1
%T
Unaged
1 week
4 weeks
4000.0 3600 3200 2800 2400 2000 1800 1600 1400 1200 1000 800 600.0
cm-1
%T
Unaged
1 week
4 weeks
3074
2925
2849
2237
1731
1698
1640
1448
1350
1307 1220
1128
1081
1043
969
918
833 725
691
3074
2925
2849
2237 1730
1698
1640
1441
1380
1350
1307 1201
1128
1081
1043
969
918
832 725
692
3074
2849
2237
1727
1699
1640
1442
1380
1350
1306
1193
1125
1081
1043
970
918
724
691

105
(a)
(b)
Figure 4.20: IR spectra of XNBR thin film without antioxidant aged at 90
oC
(a) combined spectra and (b) split spectra.
4000.0 3600 3200 2800 2400 2000 1800 1600 1400 1200 1000 800 600.0
0.0
5
10
15
20
25
30
35
40
45
50
55
60
65
70
75
80
85
90
95
100.0
cm-1
%T
Unaged
1 week
4 weeks
4000.0 3600 3200 2800 2400 2000 1800 1600 1400 1200 1000 800 600.0
cm-1
%T
Unaged
1 week
4 weeks
3074
2925
2849
2237
1731
1698
1640
1448
1350
1306 1220
1129
1080
1043
969
918
724
691
3478
3074
2926
2849
2237
1767
1726
1699
1640
1442
1380
1350
1306
1192
1126
1080
1042
970
919
725
692
3478
3074
2853
2237
1768
1725
1641
1449
1379
1351
1182
1122 1044
971
920
762 691

106
Broad absorption bands corresponding to oxidation products, such as
carbonyl functional groups (C=O) in the region 1660 - 1800 cm-1
, and hydroxyl
functional groups (O-H) in the region 3200 - 3400 cm-1
, increase progressively
with increasing ageing time. These bands were observed in both thin film without
antioxidant aged at 70 oC and 90
oC.
In the region of hydroxyl stretching vibrations (3600 - 3200 cm-1
) shown in
Figure 4.18, a broad absorption bands at 3485 cm-1
appeared in the earliest stage
of thermal-oxidation (t < 4 weeks). The intensity of the band continuously
increased and shifted to 3481 cm-1
. According to Adam, Lacoste and Lemaire
(1989a, 1990) and Delor-Jestin et al. (2000), this band can be ascribed to
associated hydroperoxides and alcohols. Shift of the band may be caused by
hydrogen bonding which occurs between the alcoholic group and acrylonitrile
units (Adam, Lacoste and Lemaire 1990).
The region of carbonyl stretching vibrations (1800-1600 cm-1
), illustrated
in Figure 4.18, showed two absorption bands at 1698 cm-1
and 1730 cm-1
in the
initial stage of the thermal-oxidation. As thermal oxidation proceeds, the intensity
of this latter band increases and the bands at 1730 cm-1
was shifted to 1725 cm-1
whilst the band at 1690 cm-1
shifted to 1700 cm-1
and became constant after 4
weeks of ageing and difficult to be observe in the FTIR spectrum. Furthermore, a
shoulder peak was detected at1769 cm-1
. The bands at 1698 and 1730 cm-1
are
corresponding to the C=O stretching of saturated, unsaturated acids and ketones
according to Delor-Jestin et al., (2000), while the band at 1769 cm-1
usually

107
interpreted as the formation of unsaturated anhydride, γ-lactone and perester
according to Piton and Raviton (1996a) and Piton and Raviton (1996b).
In the complex regions of 1500 – 1300 cm-1
and 1300 – 1000 cm-1
an
important increase of absorbance is observed correspond to –CH2 deformation and
C-O stretching vibrations. Several peaks are noted in the spectrum at 1349, 1305,
1220, 1128, 1079, and 1040 cm-1
. Especially significant increases at peaks 1220
cm-1
shifted to 1186 cm-1
as after 12 weeks of ageing. This band was assigned to
lactone structure according to Piton and Raviton (1996a) and Piton and Raviton
(1996b).
In the region of the deformation vibrations (1000 cm-1
- 600 cm-1
), shown
in Figure 4.17, the out-of-plane vibrations of the C-H bond linked to unsaturation
can be observed (1-4 trans unsaturation at 970 cm-1
, 1-2 vinyl at 918 cm-1
), this
band is characteristic of the structure of the butadiene part. While in the region of
2925 cm-1
and 2850 cm-1
corresponding to the aliphatic CH2 asymmetrical and
symmetrical stretching in the polymer backbone. These bands show decreases,
indicating chemical changes in these regions, probably attributed to crosslinking or
saturations in reactions. The susceptibility of these bands to attack is attributed to
their proximity to inherently reactive double bonds and the aliphatic chain.
The nitrile band at 2237 cm-1
shows no significant change and the decrease
of the double bonds during oxidation was detected (970 cm-1
); these results
confirm the preferential attack on butadiene units.
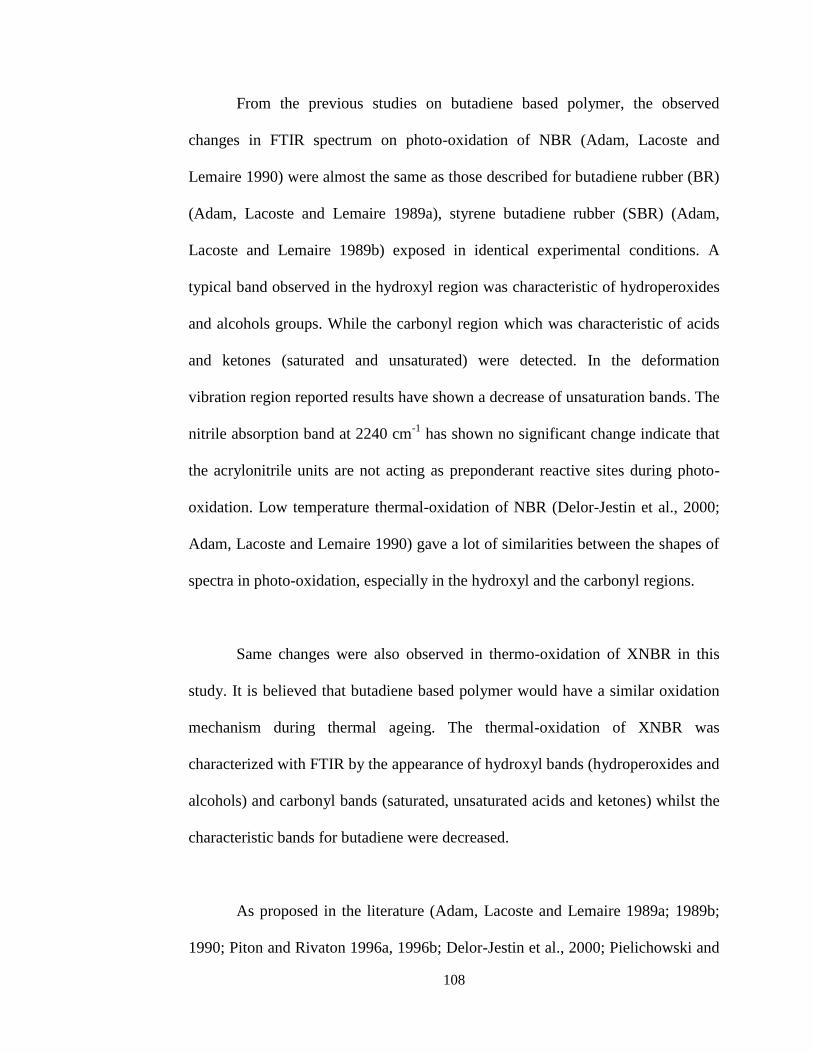
108
From the previous studies on butadiene based polymer, the observed
changes in FTIR spectrum on photo-oxidation of NBR (Adam, Lacoste and
Lemaire 1990) were almost the same as those described for butadiene rubber (BR)
(Adam, Lacoste and Lemaire 1989a), styrene butadiene rubber (SBR) (Adam,
Lacoste and Lemaire 1989b) exposed in identical experimental conditions. A
typical band observed in the hydroxyl region was characteristic of hydroperoxides
and alcohols groups. While the carbonyl region which was characteristic of acids
and ketones (saturated and unsaturated) were detected. In the deformation
vibration region reported results have shown a decrease of unsaturation bands. The
nitrile absorption band at 2240 cm-1
has shown no significant change indicate that
the acrylonitrile units are not acting as preponderant reactive sites during photo-
oxidation. Low temperature thermal-oxidation of NBR (Delor-Jestin et al., 2000;
Adam, Lacoste and Lemaire 1990) gave a lot of similarities between the shapes of
spectra in photo-oxidation, especially in the hydroxyl and the carbonyl regions.
Same changes were also observed in thermo-oxidation of XNBR in this
study. It is believed that butadiene based polymer would have a similar oxidation
mechanism during thermal ageing. The thermal-oxidation of XNBR was
characterized with FTIR by the appearance of hydroxyl bands (hydroperoxides and
alcohols) and carbonyl bands (saturated, unsaturated acids and ketones) whilst the
characteristic bands for butadiene were decreased.
As proposed in the literature (Adam, Lacoste and Lemaire 1989a; 1989b;
1990; Piton and Rivaton 1996a, 1996b; Delor-Jestin et al., 2000; Pielichowski and
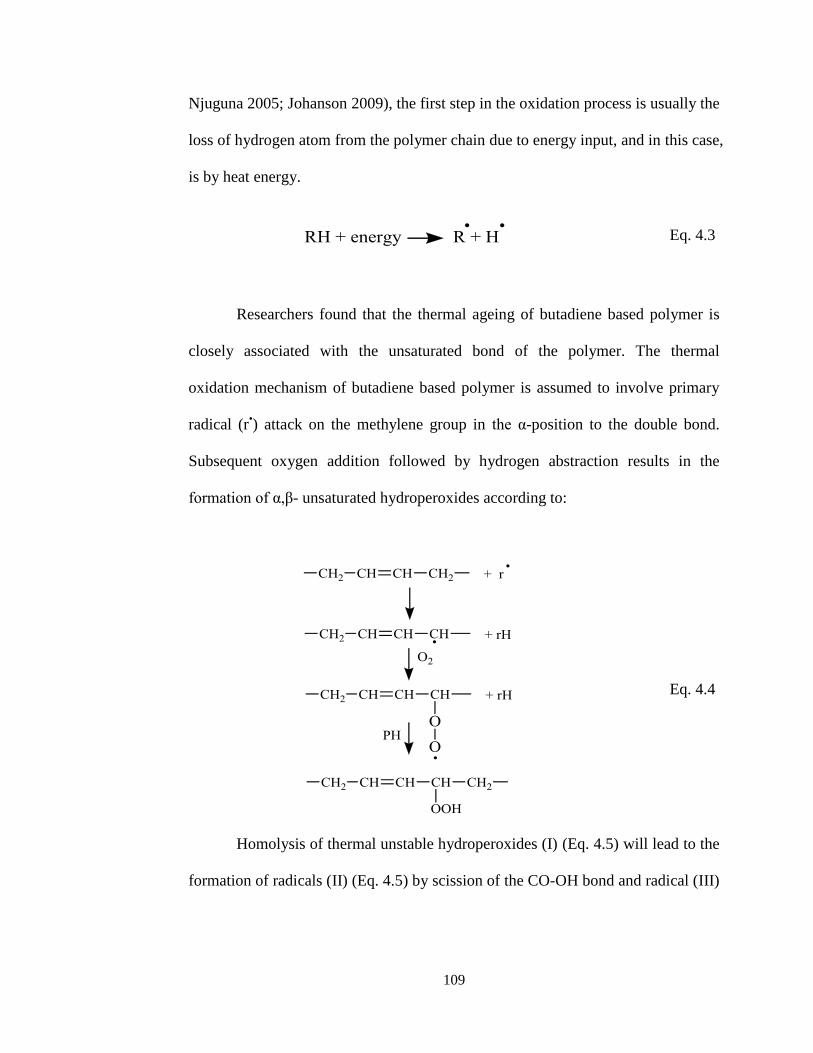
109
Njuguna 2005; Johanson 2009), the first step in the oxidation process is usually the
loss of hydrogen atom from the polymer chain due to energy input, and in this case,
is by heat energy.
Eq. 4.3
Researchers found that the thermal ageing of butadiene based polymer is
closely associated with the unsaturated bond of the polymer. The thermal
oxidation mechanism of butadiene based polymer is assumed to involve primary
radical (r•) attack on the methylene group in the α-position to the double bond.
Subsequent oxygen addition followed by hydrogen abstraction results in the
formation of α,β- unsaturated hydroperoxides according to:
Eq. 4.4
Homolysis of thermal unstable hydroperoxides (I) (Eq. 4.5) will lead to the
formation of radicals (II) (Eq. 4.5) by scission of the CO-OH bond and radical (III)

110
(Eq. 4.5) by radical attack of the secondary hydrogen of the hydroperoxide
according to the Equation 4.5 below:
Eq. 4.5
Radicals (II) (Eq. 4.5) and (III) (Eq. 4.5) so formed are the precursor for various
saturated and unsaturated products under thermal oxidation. The alkoxy radical (II)
(Eq. 4.5) may react in different pathways:
1. The alkoxy radical (II) (Eq. 4.5) attack on the neighbouring unsaturation in
the polymer chain to produce crosslink via ether bonds. Hydroperoxides
formed on carbon atoms in the α-position to the ether bonds are known to
be converted into formates, esters and hemiacetals (Piton and Rivaton
1996a). The absorption at 1230 – 1000 cm-1
can be ascribed to the C-O
deformation of ether linkage or unsaturated alcohol formed below:
Eq. 4.6

111
2. Hydrogen abstraction by alkoxy radicals (II) (Eq. 4.5) lead to the
formation of α,β-unsaturated alcohols give rise to the absorption in
hydroxyl region (3600 – 3200 cm-1
).
Eq. 4.7
3. α,β-unsaturated ketones, detected in carbonyl region (1800 – 1600 cm-1
)
are may obtained from the cage reaction of the alkoxy radicals (II) (Eq.
4.5). The increase of the yellowing observed during the thermal oxidation
has been attributed to the cis/trans isomerization of the α,β-unsaturated
ketones (Piton and Rivaton 1996a).
Eq. 4.8
Radical attack of ketonics groups by RO• and OH
• produced α,β-
unsaturated ester and acid.
Eq. 4.9

112
4. Decomposition of the alkoxyl radical (II) (Eq. 4.5) through β-scission
reaction produced unsaturated aldehydic products. However, the
characteristic absorption for aldehydic structure (~2730 cm-1
) was not
detected in this study. This may due to the rapid oxidation of the aldehydic
product to saturated acids.
Eq. 4.10
β-scission of the tertiary radical (III) (Eq. 4.5) leads to the formation of carboxylic
structure.
Eq. 4.11
Subsequent reactions of the α,β-unsaturated products are reported below:
1. Saturation reaction of α,β-unsaturated products may occur via crosslinking
resulting the formation of the saturated alcohols, ketones, aldehydes and
acids.

113
Eq. 4.12
2. Oxidation of aldehyde into acidic groups.
Eq. 4.13
3. Norrish type I reaction of the ketone leads to the formation of two easily
oxidised radicals.
Eq. 4.14

114
Unsaturated anhydride, γ-lactone, and perester can be formed as shown in
mechanisms below:
1. α,β-unsaturated anhydrides could be obtained through the dehydration of
two α,β-unsaturated carboxylic acid units.
Eq. 4.15
2. γ-lactone are formed by cyclization of two hydroperoxide groups in α-
position to the double bond.
Eq. 4.16
3. Perester could be formed in one or two reactions
Eq. 4.17
Eq. 4.18

115
Grafted butadiene (Figure 4.21) containing tertiary allylic carbon atoms
(A), are preferentially oxidized in the first stages as compared to secondary allylic
carbons atoms (B).
Figure 4.21: Structure of grafted butadiene.
Tertiary hydroperoxides are formed according to:
Eq. 4.19
Thermal homolysis of tertiary hydroperoxides leads to the formation of
macroradicals. Breakage of grafted butadiene and formation of α,β-unsaturated
ketones through β-scission of alkoxy macroradicals may occur.

116
Eq. 4.20
The disappearance of bands typical of 1-4 trans and 1-2 vinyl unsaturation
of butadiene part was also reported (Adam, Lacoste and Lemaire 1989a; Adam,
Lacoste and Lemaire 1989b; Adam, Lacoste and Lemaire 1990; Piton and Rivaton
1996a, Piton and Rivaton 1996b; Delor-Jestin et al., 2000). This may due to the
fact that in butadiene based polymer there is electron withdrawal from the α-
methylene carbon by the double bond which makes it more susceptible to be attack
by O2 with the generation of hydroperoxide radicals. Figure 4.21 demonstrated
reaction mechanism of intermediate product and final by-product conversion
pathway of XNBR under thermal-oxidation.
Eq. 4.21

117
Figure 4.22: Demonstrated reaction mechanism of intermediate product and
final by-product conversion pathway of XNBR under thermal-
oxidation.

118
CHAPTER 5
CONCLUSION
Rubber ageing is an inevitable process leading to the deterioration of their
properties such as reduction of the tensile strength, elasticity and elongation, wear
resistance, changing in plasticity, and increases in hardness of the rubber,
ultimately leading to the point where the material is no longer capable of fulfilling
its function. Therefore, increasing the resistance of rubber to ageing is of great
importance to increase the reliability and performance of rubber products. Various
physio-mechanical tests have been carried out in this study to investigate the effect
of thermal ageing on carboxylated nitrile rubber (XNBR) thin film at different
temperatures using accelerated ageing. Accelerated ageing was carried out in air
circulated oven at a temperature ranging from 60 oC to 100
oC and for a period
ranging from 0.5 hours to 3360 hours. Real time ageing had also been carried out
under fluorescent light (36 W) and in dark condition at room temperature (26 oC)
with the humidity of about 65%. Results showed that thermal ageing of XNBR
consists of two stages: the crosslink formation during the early stage of accelerated
ageing resulting the increases in the tensile strength to a maximum due to
incomplete crosslink during curing, and the latter was the breaking of the crosslink
after a certain period of time causing the decrease in tensile properties. The
formation of crosslinks also restricts the extensibility of XNBR and results in the
decrease in swelling. At the end of the ageing treatment, XNBR turned to
yellowish in colour and the changes became more pronounce at higher temperature.

119
Cracks were also observed under SEM as ageing was in progress. However, as
compared to accelerated ageing, the effect of real time ageing on physic-
mechanical properties of XNBR was in a slower rate. For lifetime prediction,
tensile test were carried out on unaged and aged film specimens at ambient
temperature, and the change in force at break values was chosen as characteristic
indicator for ageing. A continuous decrease in force at break was observed,
allowing for a reasonable application of various lifetime approaches. Arrhenius
approach and Time-Temperature approach were applied to determine the
activation energy and the lifetime of XNBR. In Arrhenius approach, the force at
break value of the unaged specimen was used as a reference to measure the time
required to reach a certain threshold. Whilst in Time-Temperature approach, a
master curve was obtained by horizontally transform the ageing curve at a
reference temperature along the time axes by multiplying a shift factor.
Experimentally determined Arrhenius plot were extrapolated to lower temperature
according to BS EN 455:4 (2009) by applying a least square linear fit method. As
expected, both approaches gave a rather similar value where the time estimated for
the physical properties to fall to 75% retained force at break is 25 years at 25oC
and the activation energy calculated were 81.91 kJ/mol and 81.94 kJ/mol
respectively. In order to understand the ageing mechanism of XNBR,
characterization of XNBR thin film with and without antioxidant after accelerated
ageing by FTIR were carried out. From the FTIR study, thermal ageing of XNBR
showed a lot of similarity with the photo-oxidation of butadiene based polymer.
Changes were mostly concentrated on hydroxyl (3600 cm-1
– 3200 cm-1
) and

120
carbonyl (1800 cm-1
– 1600 cm-1
) regions, and the reduction of butadiene
characteristic peak (970 cm-1
) was observed.
Further investigation for a better understanding of the correlation between
the film thicknesses with the changes in physico-mechanical properties of XNBR
is necessary. Surface morphology changes due to crack formation during the
ageing and the extent of surface damage due to cracking could be studied further.
It is also important to find out the effect of different type and amount of
antioxidant on thermal ageing in order to understand the role of antioxidant in
protecting the XNBR film during the ageing process.
Photo degradation is also one of the interesting topic that can be discuss, as
both photo degradation and thermal degradation were grouped under auto-
oxidation, however the initiation step for the degradation is different for both
processes. Photo degradation was initiated by the energy absorption by photon,
while thermal degradation is by heat energy. It is worth to study the similarity and
differences between the both degradation mechanisms which can further help in
prevention of these degradations.

121
References
Abadal, M., Cermak, R., Raab, M., Verney, V., Commereuc, S. and Fraisse, F.,
2006. Study on photodegradation of injection moulded (beta)-polypropylene.
Polymer degradation and stability, 91(3), pp. 459 – 463.
Adam, C., Lacoste, J. and Lemaire, J., 1989a. Photo-oxidation of elastomeric
materials: Part 1-Photo-oxidation of polybutadienes. Polymer Degradation and
Stability, 24, pp. 185 – 200.
Adam, C., Lacoste, J. and Lemaire, J., 1989b. Photo-oxidation of elastomeric
materials: Part II-Photo-oxidation of styrene-butadiene copolymer. Polymer
Degradation and Stability, 26, pp. 269 – 284.
Adam, C., Lacoste, J. and Lemaire, J., 1990. Photo-oxidation of elastomeric
materials: Part 3-Photo-oxidation of acrylonitrile-butadiene copolymer. Polymer
Degradation and Stability, 27, pp. 85 – 97.
Aguado, J. and Serrano, D.P., 1999. Catalytic cracking and reforming. In:
Feedstock Recycling of Plastic Wastes. Cambridge: The Royal Society of
Chemistry, pp. 129 – 150.
Ain, Z.N. and Azura, A.R., 2010. Effect of different types of filler and filler
loadings on the properties of carboxylated acrylonitrile- butadiene rubber latex.
Journal of Applied Polymer Science, 119, pp. 2815 – 2823.
Alex, R., 2009. Nanofillers in rubber-rubber blends. In: Thomas, S. and Stephen, R.
(eds.). Rubber nanocomposites: Preparation, properties and applications.
Chichester, West Sussex: John Wiley & Sons Inc., pp. 224.
Allen, N.S. and Edge, M., 1992. Photodegradation and photooxidation of
polymers. In: Fundamentals of polymer degradation and stabilization. Essex:
Elsevier Science Publishers Ltd, pp. 75 – 101.
Anderson, C.D. and Daniels, E.S., 2003. Industrial application. In: Emulsion
polymerization and latex applications. Shawbury, Shrewsbury and Shropshire:
iSmithers Rapra Technology, pp. 27.
Andrady, A.L., Hamid, S.H., Hu, X. and Torikai, A., 1998. Effects of increased
solar ultraviolet radiation on materials. Journal of Photochemistry and
Photobiology B: Biology, 46, pp. 96 – 103.
ASM International, 2003. Chcaracterization of weathering and radiation
susceptibility. In: Characterization and failure analysis of plastics. United states:
ASM International, pp. 153.

122
Batchelor, A., Loh, N.L. and Chandrasekaran, M., 2010. Mechanism of materials
degradation. In: Materials degradation and its control by surface engineering. 3rd
ed. London: Imperial College Press, pp. 165.
Bilgic, T., 1998. Processing of PVC. In: Cheremisinoff, N.P. (ed.). In: Advanced
polymer processing operation. United States: Noyes Publications, pp. 39 – 65.
Biswas, T., Das, A., Debnath, S.C., Naska, N., Das, A.R. and Basu, D.K., 2004.
SBR-XNBR blends: a novel approach towards compatibilization. European
Polymer Journal, 40, pp. 847 – 854.
Bonten C. and Berlich R., 2001. Aging mechanisms. In: Aging and chemical
resistance. München, Germany: Carl Hanser Verlag, pp. 10 – 33.
Bortoluzzi, J.H., Pinheiro, E.A., Carasek, E. and Soldi, V., 2006. Solid phase
microextraction to concentrate volatile products from thermal degradation of
polymers. Polymer Degradation and Stability, 89(1), pp. 33 – 37.
Brown, R.P., 2001. Practical guide to the assessment of the useful life of rubbers.
Shrewsbury, GBR : iSmithers Rapra, pp. 1 – 170.
Brown, R.P., 2002. The reasons for failure. In: Rubber product failure.
Shrewsbury, GBR : iSmithers Rapra, pp. 118.
Brown, R.R., Forrest, M.J. and Soulagnet, G., 2000. Long-term and accelerated
ageing tests on rubbers, Rapra Review Reports. Volume 10. Number 2.
Shrewsbury, GBR: iSmithers Rapra Publishing, pp. 3.
Brydson, J., 1999. The historical development of plastics materials. In: Plastics
materials. 7th ed. Woburn: Butterworth-Heinemann, pp. 10.
British Standards Institution , 2009. BS EN 455:4, Medical gloves for single use:
Requirement and testing for shelf life determination. London: BSI.
Budrugeac, P., 2000. The evaluation of the non-isothermal kinetic parameters of
the thermal and thermo-oxidative degradation of polymers and polymeric
materials: its use and abuse. Polymer Degradation and Stability, 71(1), pp. 185 –
187.
Campo, E.A., 2008. Microbial, weather, and chemical resistance of polymeric
materials. In: Selection of polymeric materials: How to select design properties
from different standards. United States: William Andrew Inc, pp. 205 – 209.
Cardarelli, F., 2008. Polymers and elastomers. In: Materials handbook: A concise
desktop reference. 2nd ed. Verlag London: Springer, pp. 716 – 717.
Cataldo, F., 1998a. Ozone interaction with conjugated polymers - I. Polyacetylene.
Polymer Degradation and Stability, 60, pp. 223 – 231.

123
Cataldo, F., 1998b. Ozone interaction with conjugated polymers - II.
Polyphenylacetylene. Polymer Degradation and Stability, 60, pp. 233 – 237.
Cataldo, F., Ricci, G. and Crescenzi, V., 2000. Ozonization of atactic and tactic
polymers having vinyl, methylvinyl, and dimethylvinyl pendant groups. Polymer
Degradation and Stability, 67, pp. 421 – 426.
Chaiear, N., 2001. Skin irritation and dermatitis. In: Health and safety in the
rubber industry. Shrewsbury, GBR: Smithers Rapra, pp. 19.
Chaiear, N. and Saejiw, N., 2010. Rubber in the context of growing trees. In:
Update on health and safety in the rubber industries. Shrewsbury, Shropshire,
GBR: Smithers Rapra, pp. 9.
Chaiear, N. and Saejiw, N., 2010. Health effects related to working in rubber
industries. In: Update on health and safety in the rubber industries. Shrewsbury,
Shropshire, GBR: Smithers Rapra, pp. 59 – 61.
Chandra, R. and Rustgi, R., 1998. Biodegradable polymer. Progress in Polymer
Science, 23(7), pp. 1273 – 1335.
Chandrasekaran, V.C., 2009. Rubber- an overview. In: Tank Linings for Chemical
Process Industries. Shrewsbury, Shropshire, GBR: Smithers Rapra, pp. 5 – 10.
Choudhury, A., Bhowmick, A.K. and Soddemann, M., 2010. Effect of organo-
modified clay on accelerated aging resistance of hydrogenated nitrile rubber
nanocomposites and their life time prediction. Polymer Degradation and Stability,
95(12), pp. 2555 – 2562.
Chronska, K. and Przepiorkowska, A., 2008. Buffing dust as a filler of
carboxylated butadiene-acrylonitrile rubber and butadiene-acrylonitrile rubber.
Journal of Hazardous Matrials, 151, pp. 348 – 355.
Ciesielski, A., 2001. Types of rubber and their essential properties. In:
Introduction to Rubber Technology. Shrewsbury, GBR: Smithers Rapra, pp. 6 – 22.
Colin, X., Teyssedre, G. and Fois M., 2011. Ageing and degradation of multiphase
polymer systems. In: Boudenne A., Ibos L., Candau Y. and Thomas S. (eds.).
Handbook of multiphase polymer systems. Volume 2. Weinheim, Germany: John
Wiley & Sons Inc., pp. 797 – 842.
Coran, A.Y, 2005. Vulcanization. In: James, E.M., Burak, E. and Frederick, R.E.
(eds.). The science and technology of rubber, 3rd ed. London: Elsevier Academic
Press, pp. 323.
Cowie, J.M.G. and Arrighi, V., 2011. Physical ageing. In: Utracki L.A. and
Jamieson A.M. (eds.). Polymer physics: From suspensions to nanocomposites and
beyond. Weinheim, Germany :John Wiley & Sons Inc., pp. 8 – 26.

124
Cowie, J.M.G., McEwen, I.J. and McIntyre, R., 2003. Aging and degradation of
polymer blends. In: Utracki, L.A. (ed.). Polymer blends handbook. Volume 2.
Dordrecht, Netherlands: Kluwer Academic Publishers, pp. 977 – 1022.
Daraboina, N. and Madras, G., 2008. Thermal and photolytic degradation of
poly(methyl methacrylate), poly(butyl methacrylate), and their copolymers.
Industrial and Engineering Chemistry Research, 47(18), pp. 6828 – 6834.
Deanin, R.D. and Mead, J.L., 2007. Synthetic resins and plastics. In: Kent J.A.
(ed.). Kent and Riegel's handbook of industrial chemistry and biotechnology. 11th
ed, Volume 1. New York: Springer, pp. 159, 630 – 709.
Delor-Jestin, F., Barrois-Oudin, N., Cardinet, C., Lacoste, J. and Lemaire, J., 2000.
Thermal ageing of acrylonitrile-butadiene copolymer. Polymer Degradation and
Stability, 70, pp. 1 – 4.
Drago, H., Vera, K. and Davorka, P., 1995. Thermally stimulated oxidative
degradation of high impact polystyrene with nitric acid. Polymer Engineering and
Science, 35(8), pp. 1140 – 1151.
Dunn, D., 2002. Synthetic latex: technology and market projections. In: Latex
2002. Shawbury, Shrewbury, Shropshire: iSmithers Rapra Publishing, pp. 23 – 25.
Ehrenstein G.W., 2001. Aging and stabilization. In: Polymeric materials: structure,
properties, applications. München, Germany: Carl Hanser Verlag, pp. 229.
Erman, B. and Mark, J.E., 2005. The molecular basis of rubberlike elasticity. In:
James, E.M., Burak, E. and Frederick, R.E. (eds.). The science and technology of
rubber. 3rd ed. London: Elsevier Academic Press, pp. 29.
Faravelli, T., Bozzano, G., Colombo, M., Ranzi, E. and Dente, M., 2003. Kinetic
modeling of the thermal degradation of polyethylene and polystyrene mixtures.
Journal of Analytical and Applied Pyrolysis, 70(2), pp. 761 – 77.
Feldman, D., 1990. Polymer degradation. In: Polymer building materials. Essex:
Elsevier Science Publishers Ltd, pp. 496 – 522.
Feldman, D. and Barbalata, A., 1996. Diene polymers. In: Synthetic Polymers:
Technology, properties, applications. London: Chapman & Hall, pp. 153.
Flynn, J.H., 2002. Polymer degradation. In: Gallagher, P.K. (ed.). Handbook of
thermal analysis and calorimetry: Applications to polymers and plastics. Volume
3. The Netherlands: Elsevier Science, pp. 587 – 652.
Fuller, T., 1999. Introduction Concepts and Definations. In: Rudin, A., (ed.). The
elements of polymer science and engineering: an introductory text and reference
for engineers and chemists, 2nd ed. New York: Johns Wiley & Sons Inc, pp. 1 –
40.

125
Gatos, K.G. and Karger-Kocsis, J., 2011. Bubber-clay nanocomposites based on
nitrile rubber. In: Galimberti, M. (ed.). Rubber-Clay nanocomposites: Science,
technology, and applications. West Sussex: John Wiley & Sons Ltd., pp. 409.
Gent, A.N., 2001. Compounding. In: Engineering with rubber: How to design
rubber components. 2nd ed. United Kingdom: Carl Hanser Verlag, pp. 22.
Ghaffar, A., Scott, G.A. and Scott, G., 1976. The chemical and physical changes
occurring during UV degradation of high impact polystyrene. European Polymer
Journal, 11(3), pp. 271 – 275.
Ghosh, P., 1990. In: Polymer science and technology of plastics and rubbers. New
Delhi: Tata McGraw-Hill Publishing Company Ltd., pp. 175 – 181.
Gijsman, P., 2011. Polymer stabilization. In: Kutz, M. (ed.). In: Applied plastics
engineering handbook: Processing and materials. New York: William Andrew
Publishing, pp. 375 – 399.
Gillen, K.T., Celina, M. and Keenan, M.R., 2000. Methods for predicting more
confident lifetimes of seals in air environments. Rubber Chemistry and
Technology, 73, pp. 265 – 296.
Gillen, K.T., Celina, M. and Bernstein, R., 2003. Validation of improved methods
for predicting long-term elastomeric seal lifetimes from compression stress-
relaxation and oxygen consumption techniques. Polymer Degradation and
Stability, 82, pp. 25 – 35.
Gillen, K.T., Bernstein, R. and Celina, M., 2005a. Non-Arrhenius behavior for
oxidative degradation of chlorosulfonated polyethylene materials. Polymer
Degradation and Stability, 87, pp. 335 – 346.
Gillen, K.T., Bernstein, R. and Derzon, D.K., 2005b. Evidence of non-Arrhenius
behavior from laboratory aging and 24-year field aging of polychloroprene rubber
materials. Polymer Degradation and Stability, 87(1), pp. 57 – 67.
Gillen, K.T., Clough, R.L., Celina, M., Wise, J. and Malone, G.M., 1996. DOE-
sponsored cable aging research at Sandia National Laboratories. In: Proceedings
of the U.S. Nuclear Regulatory Commission 23rd Water Reactor Safety
Information Meeting, NUREG/CP-0149, 3, p. 133 – 148.
Gimouhopoulos, K., Doulia, D., Vlyssides A. and Georgiou D., 2000.
Optimization studies of waste plasticselignite catalytic coliquefaction. Waste
Management Research, 18, pp. 352 – 357.
Gosh, P., 2001. Polymer characteristics and polymer characterization. In: Polymer
science and technology: Plastics, rubbers, blends and composites. 2nd ed. New
Delhi: Tata McGraw-Hill Publishing Company Ltd., pp. 203 – 256.

126
Gugumus, F., 2009. Light stabilizers. In: Zweifel, H., Maier, R.D. and Schiller, M.
(eds.). Plastics additives handbook. 5th ed. München, Germany: Carl Hanser
Verlag, pp. 141 – 425.
Gupta, A.L., 2010. Introduction; Polymer additive. In: Polymer chemistry. Pragati
Bhawan: Pragati Publications, pp. 1 – 10; 235 – 250.
Gupta, A.L., 2010. Basic. In: Polymer Chemistry. Pragati Bhawan: Pragati
Publications, pp. 18 – 83.
Ha-Anh, T. and Vu-Khanh, T., 2005. Effect of thermal ageing on fracture
performance of polycholoprene. Journal of Materials Science, 40, pp. 5243 – 5248.
Harvey, J.A., 2005. Lifetime predictions of plastics. In: Kutz, M. (ed.). Handbook
of environmental degradation of materials. New York: William Andrew
Publishing, pp. 65 – 77.
Hunt, T. and Vaughan, N., 1996. Hydraulic hose. In: Hydraulic handbook. 9th ed.
Oxford : Elsevier Advanced Technology, pp. 286.
Huy, M.L. and Evrard, G., 1998. Methodologies for lifetime predictions of rubber
using Arrhenius and WLF models. Die Angewandte Makromolekulare Chemie,
216/262, pp. 135 – 142.
Jacques, B., Werth, M., Merdas, I., Thominette, F. and Verdu, J., 2002. Hydrolytic
ageing of polyamide 11.1. Hydrolysis kinetics in water. Polymer, 43(24), pp. 6439
– 6447.
Johanson, D., 2009. Properties determining the chemical stanility and breakdown
of polymers. In: Krevelen, D.W. and Nijenhuis, K.T. (eds.). Properties of polymer:
Their correlation with chemical structure; their numerical estimation and
prediction from additive group contribution. 4th ed. Nethelands: Elsevier, pp. 747
– 786.
Jones R.G, Kahovec J., Stepto R., Wilks E.S., Hess M., Kitayama T. and
Metanomski W.V, 2009. Compendium of polymer terminology and nomenclature:
IUPAC recommendations 2008. 2nd ed. Cambridge: Royal Society of Chemistry,
pp. 252.
Jong-Ryeol, K., Jong-Ho, V., Dae-Won, P. and Mi-Hye, L., 2004. Catalytic
degradation of mixed plastics using natural clinoptilolite catalyst. Reaction
Kinetics and Catalysis Letters, 81(1), pp. 73 – 81.
Kahlen, S., Wallner, G.M. and Lang, R.W., 2010. Aging behaviour and lifetime
modelling for polycarbonate. Solar Energy, 84, pp. 755 – 762.

127
Karaduman, A., Simsek, E.H., Cicek, B. and Bilgesu, A.Y., 2001. Flash pyrolysis
of polystyrene waste in a free-fall reactor under vacuum. Journal of Analytical and
Applied Pyrolysis, 60(2), pp. 179 – 186.
Kefeli, A.A., Razumovskii, S.D. and Zaikov, G.Y., 1971. Interaction of
polyethylene with ozone. Polymer Science USSR, 13(4), pp. 904 – 911.
Khabbaz, F., Albertsson, A.C. and Karlsson, S., 1999. Chemical and
morphological changes of environmentally degradable polyethylene films exposed
to thermo-oxidation. Polymer Degradation and Stability, 63, pp. 127 – 38.
Kiran, C.N., Ekinci, E. and Srape, C.E., 2004. Pyrolysis of virgin and waste
polypropylene and its mixtures with waste polyethylene and polystyrene. Waste
Management, 24(2), pp. 173 – 81.
Li, J., Guo, S. and Li, X., 2006. Degradation kinetics of polystyrene and EPDM
melts under ultrasonic irradiation. Polymer Degradation and Stability, 89(1), pp. 6
– 14.
Lin, Y.H. and Yen, H.Y., 2006. Fluidised bed pyrolysis of polypropylene over
cracking catalysts for producing hydrocarbons. Polymer Degradation and Stability,
89(1), pp. 101 – 108.
Loadman, J., 2005. The battles of the giants-Thomas Hancock. In: Tears of the
tree: The story of rubber : A modern marvel. Oxford, GBR: Oxford University
Press, pp. 45 – 80.
Loadman, M.J.R., 1998. Introduction. In: Analysis of rubber and rubber-like
polymers. 4th ed. Netherlands: Kluwer Academic Piblishers, pp. 1 – 14.
Lundquist, L., Leterrier, Y., Sunderland, P. and Manson, J.A.E., 2000. The
polymer life cycle. In: Life cycle engineering of plastic: technology, economy and
the environment. Oxford: Elsevier Science Ltd, pp. 13 – 20.
Mahaling, R.N., Jana, G.K., Das, C.K., Jeong, H. and Ha, C.S., 2005.
Carboxylated nitrile elastomer/filler nanocomposite: effect of silica nanofiller in
thermal, dynamic mechanical behaviour, and interfacial adhesion.
Macromolecular Research, 13, pp. 306 – 313.
Manceau, M., Rivaton, A. and Gardette, J-L., 2012. Photochemical stability of
materials for OPV. In: Krebs, F.C. (ed.). Stability and degradation of organic and
polymer solar cells. New Jersey: John Wiley & Sons Inc., pp. 71 – 108.
Marek, A., Kapralkova, L., Schimdt, P., Pfleger, J., Humlicek, J. and Pospisil, J.,
2006. Polymer spatial resolution of degradation in stabilized polystyrene and
polypropylene plaques exposed to accelerated photo-degradation or heat aging.
Polymer Degradation and Stability, 91(3), pp. 444 – 458.

128
Martin, J.W., Chin, J.W. and Nguyen, T., 2003. Reciprocity law experiments in
polymeric photodegradation: a critical review. Progress in Organic
Coatings, 47(3-4), pp. 292 – 311.
McMurry, J., 2011. Synthetic Polymer. In: Organic chemistry. 8th ed. Stamford,
Connecticut: Cengage Learning, pp. 1242 – 1250.
Mishra, J.K., Raychowdhury, S. and Das, C.K., 2000. Effect of interchain
crosslinking on the shrinability of the blends consisting of grafted low-density
polyethyelene and carboxylated nitrile rubber. Materials Letters, 46, pp. 212 – 218.
Mitchell, B.S., 2003. Kinetics process in materials. In: An introduction to
materials engineeering and science for chemical and materials engineers. New
Jersey: John Wiley & Sons Inc, pp. 215 – 279.
Morawets, H., 2002. The beginings of a synthetic rubber industry. In: Polymers:
The origins and growth of a science. New York: Courier Dover Publications, pp.
67.
Morrell, P.R., Patel, M. and Skinner, A.R., 2003. Accelerated thermal ageing
studies on nitrile rubber O-ring. Polymr Testing, 22, pp. 651 – 656.
Morris, P.J.T., 2005. Polymer pioneers: A popular history of the science and
technology of large molecules. Philadelphia, United States: Chemical Heritage
Foundation, pp. 59.
Mott, P.H. and Roland, C.M., 2001. Aging of natural rubber in air and seawater.
Rubber Chemistry and Technology, 74, pp. 79 – 88.
Nagai, Y., Ogawa, T., Nishimoto, Y. and Ohishi, F., 1999. Analysis of weathering
of a thermoplastic polyester elastomer II. Factors affecting weathering of a
polyetherepolyester elastomer. Polymer Degradation and Stability, 65, pp. 217 –
224.
Naranjo, A., Noriega, M.D.P., Osswald, T., Roldan-Alzate, A. and Sierra, J.D.
2008. Environmental effects and aging. In: Plastic testing and characterization:
industrial application. München, Germany: Carl Hanser Verlag, pp. 287.
Nishimura, O. and Osawa, Z., 1981. Photodegradation of polyoxymethylene.
Polymer Photochemistry, 1, pp. 191 – 204.
Odian, G.G., 2004. Introduction. In: Principles of Polymerization. 4th ed. New
Jersey: John Wiley & Sons Inc., pp. 1 – 38.
Osswald, T.A. and Menges, G., 2003. Introduction to processing. In: Materials
science of polymer for engineerings. 2nd ed. München, Germany: Carl Hanser
Verlag, pp. 229.
129
Pal, K., Pal, S.K., Das, C.K. and Kim, J.K., 2011. Effect of fillers on
morphological properties and wear characteristic of XNBR/NR blands. Journal of
Applied Polymer Science, 120, pp. 710 – 718.
Pallardy, S.G., 2008. Lipids terpenes and related substances. In: Physiology of
woody plants. 3rd ed. London: Academic Press, pp. 229.
Palmer, J.D., 2011. Durability of Nonstructural Adhesive. In: Silva, L.F.M.,
Öchsner, A. and Adams, R.D. (eds.). Handbook of adhesion technology, Volume 2.
New York: Springer-Verlag Berlin Heidelberg, pp. 903 – 920.
Palmisano, A.C. and Pettigrew, C.A., 1992. Biodegradability of plastics.
Bioscience, 42(9), pp. 680 – 685.
Peacock, A.J. and Calhoun, A.R., 2006. Polymer degradation and stability. In:
Polymer chemistry: properties and applications. München, Germany: Carl Hanser
Verlag, pp. 171 – 183.
Peter, A.C. and Norman, H., 1999. Introduction. In: The rubber formulary.
Illustrated. United States: Noyes Publications, pp. 1 – 5.
Pielichowski, K. and Njuguna, J., 2005. Intoduction and mechanisms in thermal
degradation of polymer. In: Thermal degradation of polymeric materials.
Shrewsbury, GBR: Smithers Rapra, pp. 1 – 2; 31 – 36.
Pinprayon, O., Groves, R. and Saunders, B.R., 2008. A study of
poly(butadiene/methacrylic acid) dispersions: Form pH-responsive behaviour to
the effects of added Ca2+
. Journal of colloid and Interface Science, 321, pp. 315 –
322.
Piton, M. and Rivaton , A., 1996a. Photooxidation of ABS at long wavelength
(λ>300 nm). Polymer Degradation and Stability, 55, pp. 147 – 157.
Piton, M. and Rivaton , A., 1996b. Photooxidation of polybutadiene at long
wavelength (λ>300 nm). Polymer Degradation and Stability, 53, pp. 343 – 359.
Pospisil, J., Filar, J., Billingham, N.C., Marek, A., Horek, Z. and Nespurek, S.,
2006. Factor affecting accelerated testing of polymer photostability. Polymer
Degradation and Stability, 91(3), pp. 417 – 422.
Potter, B., 2006. Estimating shelf life of medical products made from natural &
synthetic rubber latex. In: Latex 2006. Germany: Rapra Technology Ltd., pp. 93 –
103.
Quirk, R.P. and Pickel, D.L.G., 2005. Polymerization: elastomer synthesis. In:
James, E.M., Burak, E. and Frederick, R.E. (eds.), The science and technology of
rubber. 3rd ed. London: Elsevier Academic Press, pp. 29.

130
Ranby, B., 1989. Photodegradation and photo-oxidation of synthetic polymers.
Journal of Analytical and Applied Pyrolysis, 15, pp. 237 – 247.
Rakovsky, S.K. and Zaikov, G.E., 2004. Ozone degradation and stabilization of
conventional rubbers. In: Monakov, Y.B. and Zaikov, G.E. (eds.). Focus on
polymer research. New York: Nova Science Publishers, pp. 43 – 122.
Ramis, X., Cadenato, A., Salla, J.M., Morancho, J.M., Valles, A., Contat, L. and
Ribes, A., 2004. Thermal degradation of polypropylene/starch-based materialswith
enhanced biodegradability. Polymer Degradation and Stability, 86, pp. 483 – 491.
Ratnam, Chantara Thevy, and Mohd Saiful Ahmad, (2006) Stress-strain,
morphological and rheological properties of radiation-crosslinked PVC/ENR
blend. Malaysian Polymer Journal, 1 (1). pp. 1-10.
Rauwendaal, C. 2002. Troubleshooting extruders. In: Polymer extrusion. 4th ed.
Munchen: Carl Hanser Verlag, pp. 634 – 705.
Rawe, A., 2000. Degradation of polymer. In: Principle of polymer chemistry. 2nd
ed. New York: Kluwer Academic/Plenum Publishers, pp. 581 – 616.
Robert, L., Hastie, Jr. and Morris, D.H., 1993. The effects of physical aging on the
creep response of a thermoplastic composite. In: Harris, C.H. and Gates, T.S.
(eds.). High temperature and environmental effects on polymeric composites,
Volume 1. Virginia: American society for testing and materials International, pp.
163 – 186.
Roland, C.M., 2009. Vagaries of elastomer service life predictions. Plastic,
Rubber and Composites, 38(8), pp. 349 – 354.
Rosu, D., Rosu, L. and Cascaval, C.N., 2009. IR-change and yellowing of
polyurethane as a result of UV irradiation. Polymer Degradation and Stability, 94,
pp. 591 – 596.
Routh A.F. and Keddie J., 2010. An introduction to latex and the principle of
colloidal stability. In: Fundamentals of latex film formation: Processes and
properties. New York: Springer, pp. 1 – 26.
Schaefer, R.J., 2002. Machanical properties of rubbber. In: Harris C.M. and
Piersol A.G. (eds.).Harris' shock and vibration handbook: Mechanical properties
of rubber. 5th ed. New York: McGraw-Hill, pp. 1108.
Scheirs, J., 2000. Problems related to additives in polymers. In: Composition and
failure analysis of polymers: a practical approch. New York: Johns Wiley & Sons
Inc, pp. 482 – 517.

131
Scheirs, J., 2009. Specialty geomembranes and liners. In: A guide to polymeric
geomembranes: A practical approach. West Sussex: John Wiley & Sons Ltd., pp.
173 – 175.
Shah, V., 2002. Plastic testing. In: Kutz, M. (ed.). In: Handbook of materials
selection. New York: Johns Wiley & Sons Inc., pp. 545 – 590.
Simpson, R., 2002. Rubber. In: Rubber basics. Shrewsbury, GBR: Smithers Rapra,
pp. 77.
Singh, B. and and Sharma, N., 2008. Mechanistic implications of plastic
degradation. Polymer Degradation and Stability, 93, pp. 561 – 584.
Skypala, I. and Venter, C., 2009. Management of allergic disease. In: Food
hypersensitivity : Diagnosing and managing food allergies and intolerance.
Hoboken, NJ, USA: Wiley-Blackwell, pp. 326.
Slobodian, P., 2010. Synthesis of vinyl polymer/carbon nanotube nanocomposites
prepared by suspension polymerization and their properties. In: Mittal, V. (ed.).
Polymer nanotube nanocomposites: Synthesis, properties, and applications. New
Jersey: John Wiley & Sons Inc., pp. 225.
Speight, J.G., 2010. Monomers, polymers, and plastics. In: Handbook of industrial
hydrocarbon processes. Burlington: Gulf Professional Publishing, pp. 499 – 538.
Sperling, L.H., 2006. Introduction to polymer science. In: Introduction to physical
polymer science. 4th ed. New Jersey:John Wiley & Sons Inc., pp. 10 – 14.
Starnes, W.H., 2002. Structural and mechanistic aspects of the thermal degradation
of poly(vinyl chloride). Progress in Polymer Science, 27(10), pp. 2133 – 2170.
Stein, R.S., Krogh,L.C., Soga, D.Y., Brinker, C.J., Dill, K.A., Grubbs, R.H.,
Karmer, E.J., Krause, S., Mark, J.E., McCall, D.W., McGrath,J.E., Paul, D.R.,
Petrie,S.E., Tirrell, D.A. and Willson,C.G., 1994. Manufacturing: materials and
processing. In: Polymer science and engineering: the shifting research frontiers.
Washington: National Academies, pp. 65 – 115.
Tung Ha- Anh, 2007. Influence of thermo-oxidative aging on the mechanical
behaviours of polychloroprene. Thesis of Doctorate Degree, University
Sherbrooke (Quebec), Canada.
Wei, X.W., Guo, G., Gong, C.Y., Guo, M.L. and Qian, Z.Y., 2011. Biodegradable
polymer: research and application. In: Sharma, S. K. and Mudhoo, A. (eds.). A
handbook of applied biopolymer technology: Synthesis, degradation and
application. Cambridge: Royal Society of Chemistry, pp. 365 – 387.

132
White, J.L., 1995. Natural and Synthetic Rubber. In: Rubber processing:
Technology- materials- principles. United Kingdom: Carl Hanser Verlag, pp. 3 –
12.
White, J.R., 2006. Polymer ageing: Physics, chemistry or engeneering? Time to
reflect. Comptes Rendus Chimie, 9(11), pp. 1396 – 1408.
White, J.L. and Kim, K.J., 2008. Multicomponent compounds. In: Thermoplastic
and rubber compounds: Technology and physical chemistry. München,
Germany :Hanser Verlag, pp. 222.
White, J.R. and De, S.K., 2001. Natural Rubber. In: Rubber technologist’s
handbook. Illustrated. Shawbury, Shrewsbury and Shropshire: iSmithers Rapra
Technology, pp. 1 – 39.
Wicks, Z.W., Jones, F.N., Pappas, S.P. and Wicks, D.A., 2007. Latexes. In:
Organic coatings: science and technology, 3rd ed. Weinheim, Germany: John
Wiley & Sons Inc., pp. 176.
Williams, P.T. and Bagri, R., 2003. Hydrocarbon gases and oils from the recycling
of polystyrene waste by catalytic pyrolysis. International Journal of Energy
Research, 28(1), pp. 31 – 44.
Wirth, H.O. and Andreas, H., 1977. The stabilization of pvc against heat and light.
Pure and Applied Chemistry, 49, pp. 62 – 648.
Wise, J., Gillen, K.T. and Clough, R.L., 1995. An ultrasensitive technique for
testing the Arrhenius extrapolation assumption for thermally aged elastomers.
Polymer Degradation and Stability, 49, pp. 403 – 418.
Woo, C.S. and Park, H.S., 2011. Useful lifetime prediction of rubber component.
Engineering Failure Analysis, 18(7), pp. 1645 – 1651.
Wolf, H. and Wol, R., 2009. Genesis. In: Rubber: A story of glory and greed.
Shrewsbury, Shropshire, GBR: Smithers Rapra, pp. 9.
Woodard and Curran Inc., 2006. Wastes from industries (case studies). In:
Industrial waste treatment handbook. 2nd ed. Burlington: Butterworth-
Heinemann, pp. 460.
Yamada-Onodera, K., Mukumoto, H., Katsuyaya, Y., Saiganji, A. and Tani, Y.,
2001. Degradation of polyethylene by a fungus, Penicillium simplicissimum YK.
Polymer Degradation and Stability, 72, pp. 323 – 327.
Yahya, Y. S. R., Azura, A. R. and Ahmad, Z. (2011). Effect of curing system on
thermal degradation behaviour of natural rubber (SMR CV 60). Journal of
Physical Science, 22, 1-14.

133
Yoshioka, T. and Grause, G., 2008. Hydrolysis of polyesters and polycarbonates.
In: Moeller, H.W. (ed.). Progress in polymer degradation and stability research.
New York: Nova Science Publishers Inc, pp. 1 – 32.
Zhang, S.W., 2004. Introduction. In: Tribology of elastomers. Volume 47.
Amsterdam: Elsevier, pp. 1 – 5.
Zuev, V.V., Bertini, F. and Audisio, G., 2006. Investigation on the thermal
degradation of acrylic polymers with fluorinated side-chains. Polymer
Degradation and Stability, 91(3), pp. 512 – 516.

134
Appendix A
Accelerated ageing
Table: Mechanical properties of sample under accelerated ageing at 60 o
C.
Agein
g
Time
Tensil
e
Max
Force
Elong
at
Max
Stress
at
Break
Force
at
Break
Elong
ation Thick
Widt
h
Day MPa N % MPa N % mm mm
0 31.75 16.64 399.3 31.74 16.64 399.4 0.087 6
7 31.50 16.41 395.1 31.48 16.41 395.2 0.087 6
14 31.93 16.65 379.2 31.83 16.60 379.6 0.087 6
21 32.87 16.93 379.2 32.85 16.92 379.3 0.086 6
42 34.79 18.30 372.0 34.76 18.28 372.1 0.088 6
56 34.58 17.92 370.4 34.56 17.91 370.6 0.086 6
70 35.62 18.38 362.4 35.58 18.35 362.6 0.086 6
105 33.37 17.79 353.8 33.34 17.77 353.9 0.089 6
140 31.86 17.13 342.8 31.86 17.13 342.8 0.090 6
Table: Mechanical properties of sample under accelerated ageing at 70 o
C.
Agein
g
Time
Tensil
e
Max
Force
Elong
at
Max
Stress
at
Break
Force
at
Break
Elong
ation Thick
Widt
h
Day MPa N % MPa N % mm mm
0 28.57 15.72 351.4 28.56 15.72 351.4 0.092 6
2 25.77 15.51 353.9 25.77 15.51 353.9 0.100 6
7 25.44 14.88 350.5 25.44 14.88 350.5 0.098 6
14 27.27 15.67 343.5 27.27 15.67 343.5 0.096 6
28 27.86 16.16 329.0 27.86 16.16 329.0 0.097 6
42 25.50 15.36 328.0 25.50 15.36 328.0 0.100 6
70 23.82 14.19 323.6 23.78 14.16 323.7 0.099 6
98 22.93 13.33 328.6 22.93 13.33 328.6 0.097 6
126 22.87 13.08 324.5 22.86 13.07 324.6 0.095 6

135
Table: Mechanical properties of sample under accelerated ageing at 80 o
C.
Agein
g
Time
Tensil
e
Max
Force
Elong
at
Max
Stress
at
Break
Force
at
Break
Elong
ation Thick
Widt
h
Day MPa N % MPa N % mm mm
0 30.28 16.22 375.1 30.27 16.22 375.1 0.089 6
0.167 30.45 16.39 364.0 30.44 16.38 364 0.090 6
0.333 30.17 15.99 363.3 30.14 15.98 363.4 0.089 6
2 30.73 15.95 357.8 30.72 15.95 357.9 0.086 6
7 31.19 16.63 353.7 31.16 16.61 353.9 0.089 6
14 33.26 17.78 356.2 33.17 17.73 356.7 0.089 6
28 31.97 17.01 353.7 31.96 17.01 353.7 0.089 6
42 26.74 15.59 355.0 26.74 15.58 355.0 0.097 6
56 21.64 11.74 348.6 21.63 11.73 348.7 0.090 6
70 19.80 11.40 342.7 19.77 11.38 342.8 0.096 6
Table: Mechanical properties of sample under accelerated ageing at 90 o
C.
Agein
g
Time
Tensil
e
Max
Force
Elong
at
Max
Stress
at
Break
Force
at
Break
Elong
ation Thick
Widt
h
Day MPa N % MPa N % mm mm
0 26.40 15.16 347.7 26.38 15.15 347.8 0.096 6
0.021 25.91 14.85 351.2 25.91 14.84 351.3 0.096 6
0.083 29.47 16.34 354.0 29.46 16.33 354.1 0.093 6
0.167 27.32 15.49 348.4 27.31 15.48 348.5 0.095 6
0.333 25.82 15.13 342.4 25.82 15.13 342.4 0.098 6
1 23.97 14.45 340.7 23.96 14.44 340.7 0.101 6
7 24.78 14.76 332.2 24.77 14.76 332.2 0.099 6
14 26.29 15.40 327.5 26.28 15.39 327.6 0.098 6
21 22.27 13.30 323.2 22.27 13.30 323.2 0.100 6

136
Table: Mechanical properties of sample under accelerated ageing at 100 o
C.
Agein
g
Time
Tensil
e
Max
Force
Elong
at
Max
Stress
at
Break
Force
at
Break
Elong
ation Thick
Widt
h
Day MPa N % MPa N % mm mm
0 34.16 17.90 363.8 34.14 17.89 363.9 0.087 6
0.021 34.60 18.14 363.1 34.58 18.12 363.1 0.087 6
0.042 35.06 18.06 356.9 35.06 18.06 357.0 0.086 6
0.083 35.43 18.48 358.6 35.10 18.31 358.7 0.087 6
0.167 33.47 17.16 349.2 33.43 17.14 349.3 0.086 6
0.333 35.67 18.29 348.0 35.64 18.27 348.2 0.086 6
1 37.13 19.31 349.2 37.13 19.31 349.2 0.087 6
2 38.11 19.88 344.5 38.09 19.87 344.6 0.087 6
4 37.88 20.32 342.6 37.47 20.11 342.7 0.089 6
7 36.13 19.09 339.8 35.94 18.99 340.0 0.088 6

137
Table: Linear swell properties of sample under accelerated ageing at various
temperatures.
Diameter (cm)
Temperature (oC)
Ageing
Time (days)
60 70 80 90 100
0 45.00 45.00 45.00 45.00 45.00
0.021 - - - 43.50 43.50
0.042 - - - - 44.00
0.083 - - - 43.00 42.50
0.167 - - 44.00 42.50 42.00
0.333 - - 44.00 42.50 42.00
1 - - - 42.00 40.50
2 - 43.50 43.00 - 40.50
4 - - - - 40.50
7 44.50 43.00 42.50 41.00 40.00
14 42.00 42.00 42.00 40.50 -
21 42.00 - - 41.00 -
28 - 42.00 41.50 - -
42 42.00 41.00 42.00 - -
56 41.00 - 41.00 - -
70 40.00 40.00 40.50 - -
98 - 40.00 - - -
105 40.50 - - - -
126 - - - - -
140 40.0 - - - -
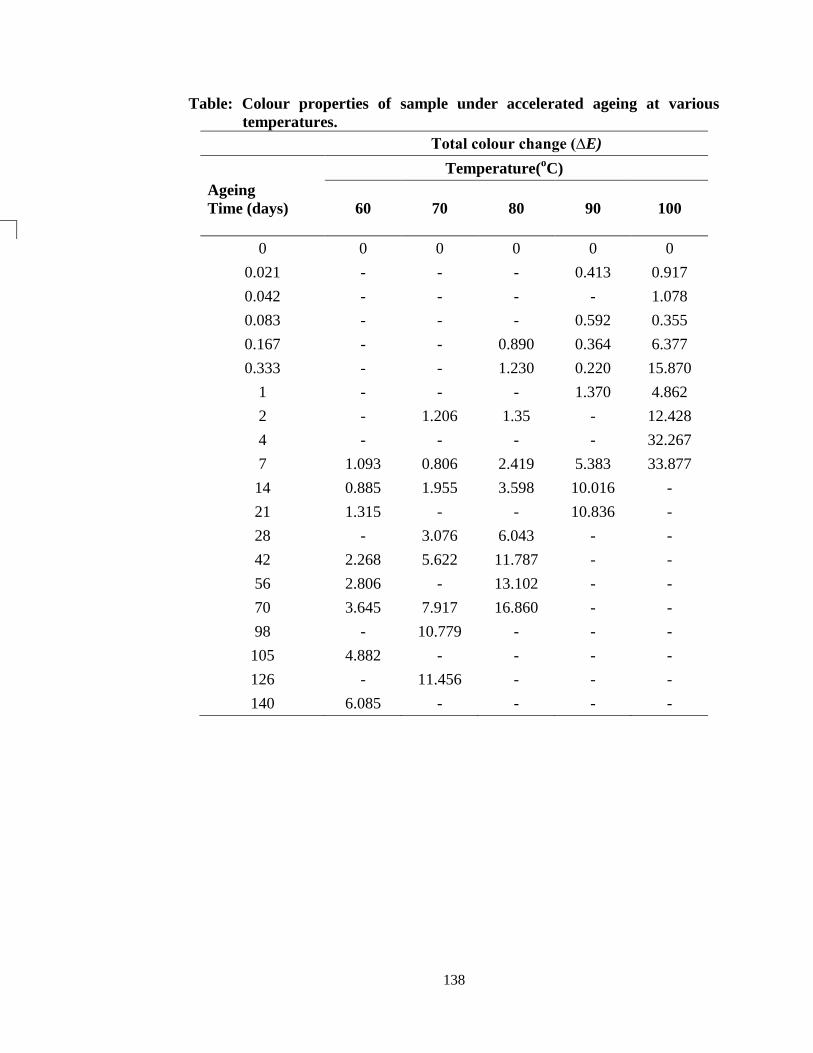
138
Table: Colour properties of sample under accelerated ageing at various
temperatures.
Total colour change (∆E)
Temperature(oC)
Ageing
Time (days)
60 70 80 90 100
0 0 0 0 0 0
0.021 - - - 0.413 0.917
0.042 - - - - 1.078
0.083 - - - 0.592 0.355
0.167 - - 0.890 0.364 6.377
0.333 - - 1.230 0.220 15.870
1 - - - 1.370 4.862
2 - 1.206 1.35 - 12.428
4 - - - - 32.267
7 1.093 0.806 2.419 5.383 33.877
14 0.885 1.955 3.598 10.016 -
21 1.315 - - 10.836 -
28 - 3.076 6.043 - -
42 2.268 5.622 11.787 - -
56 2.806 - 13.102 - -
70 3.645 7.917 16.860 - -
98 - 10.779 - - -
105 4.882 - - - -
126 - 11.456 - - -
140 6.085 - - - -
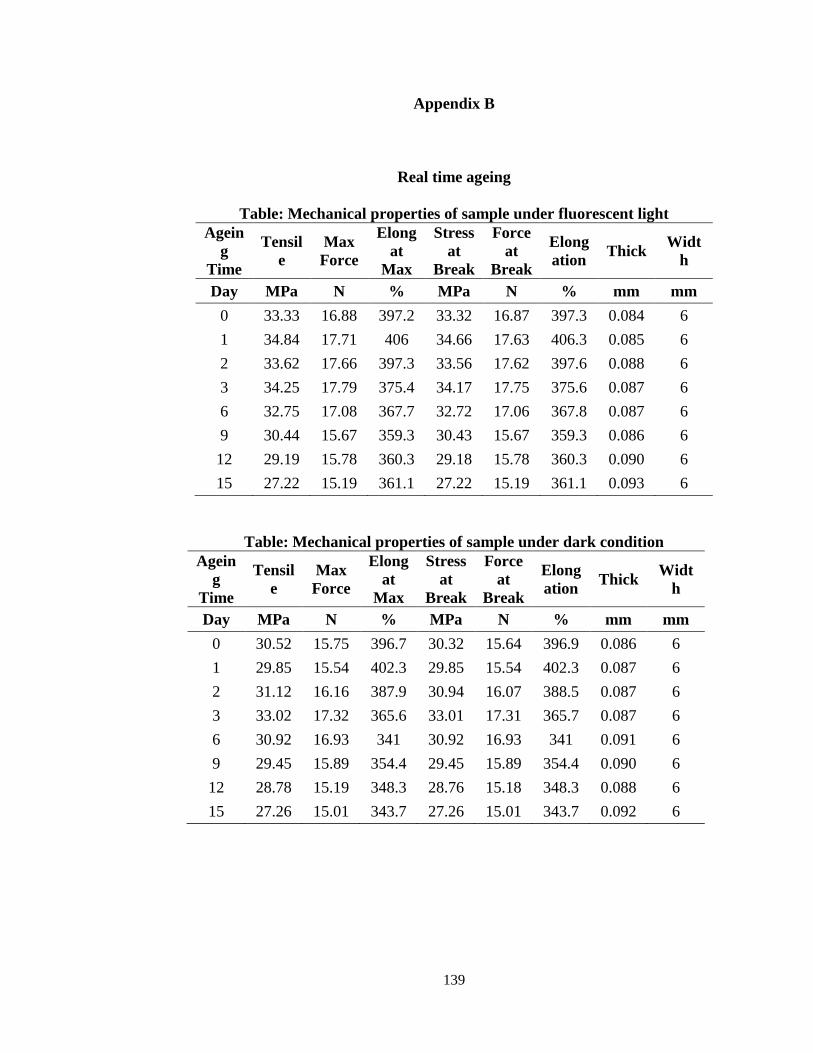
139
Appendix B
Real time ageing
Table: Mechanical properties of sample under fluorescent light
Agein
g
Time
Tensil
e
Max
Force
Elong
at
Max
Stress
at
Break
Force
at
Break
Elong
ation Thick
Widt
h
Day MPa N % MPa N % mm mm
0 33.33 16.88 397.2 33.32 16.87 397.3 0.084 6
1 34.84 17.71 406 34.66 17.63 406.3 0.085 6
2 33.62 17.66 397.3 33.56 17.62 397.6 0.088 6
3 34.25 17.79 375.4 34.17 17.75 375.6 0.087 6
6 32.75 17.08 367.7 32.72 17.06 367.8 0.087 6
9 30.44 15.67 359.3 30.43 15.67 359.3 0.086 6
12 29.19 15.78 360.3 29.18 15.78 360.3 0.090 6
15 27.22 15.19 361.1 27.22 15.19 361.1 0.093 6
Table: Mechanical properties of sample under dark condition
Agein
g
Time
Tensil
e
Max
Force
Elong
at
Max
Stress
at
Break
Force
at
Break
Elong
ation Thick
Widt
h
Day MPa N % MPa N % mm mm
0 30.52 15.75 396.7 30.32 15.64 396.9 0.086 6
1 29.85 15.54 402.3 29.85 15.54 402.3 0.087 6
2 31.12 16.16 387.9 30.94 16.07 388.5 0.087 6
3 33.02 17.32 365.6 33.01 17.31 365.7 0.087 6
6 30.92 16.93 341 30.92 16.93 341 0.091 6
9 29.45 15.89 354.4 29.45 15.89 354.4 0.090 6
12 28.78 15.19 348.3 28.76 15.18 348.3 0.088 6
15 27.26 15.01 343.7 27.26 15.01 343.7 0.092 6

140
Table: Linear swell properties of sample under real time ageing.
Diameter (cm)
Ageing
Time
(months)
Under
fluorescent
light
Under dark
condition
0 45.00 45.00
1 43.00 43.00
2 43.00 43.00
3 42.00 42.00
6 42.00 42.00
9 42.00 42.00
12 41.50 41.00
15 41.50 41.50
Table: Colour properties of sample under real time ageing.
Diameter (cm)
Ageing
Time
(months)
Under
fluorescent
light
Under dark
condition
0 0 0
1 0.772 0.639
2 0.986 0.547
3 0.865 0.398
6 1.282 0.622
9 0.779 0.925
12 1.032 0.696
15 0.406 0.628

141
Appendix C
Lifetime prediction
Table: Retained force at break of the samples after accelerated ageing at
various temperature.
Retained force at break (N)
Temperature (oC)
Ageing
Time (days) 60 70 80 90 100
0 16.52 15.66 15.98 14.88 17.92
0.021 - - - 14.75 18.04
0.042 - - - - 17.94
0.083 - - - 16.14 17.80
0.167 - - 16.54 15.44 17.28
0.333 - - 15.80 15.24 18.36
1 - - - 14.49 19.48
2 - 15.64 15.68 - 19.74
4 - - - - 20.08
7 16.18 14.96 16.76 15.06 18.72
14 16.66 15.74 17.76 15.14 -
21 17.16 - - 13.25 -
28 - 16.18 16.84 - -
42 17.96 15.36 15.44 - -
56 17.64 - 11.56 - -
70 18.54 14.25 11.55 - -
98 - 13.32 - - -
105 17.92 - - - -
126 - 13.2 - - -
140 17.14 - - - -