A Study of the Effects of the Kumon Method Upon the Mathematical ...
50
- DOCUMENT RESUME :11 ED 331 700 SE 051 520 AUTHOR Medina, Suzanne L. TITLE A Study of the Effects of the Kumon Met1Ild Upon the t,t Mathematical Development of a Group of Inner-City Junior High School Students. PUB DATE 10 Dec 89 NOTE 49p.; The small type in appendix D has been enlarged to improve readability. .42 PUB TYPE Reports - Research/Technical (143) EDRS PRICE MF01/PCO2 Plus Postage. DESCRIPTORS Grade 7; Grade 8; *Hixpanic Americans; Junior High Schools; *Junior High School Students; Learning Activities; *Mathematics Achievement; Mathematics Education; Mathematics Instruction; *Secondary School Mathematics; Standardized Tests; Teaching Methods; *Urban Education IDENTIFIERS *Kumon Mathematical Method ABSTRACT In this research, 103 Hispanic junior high school students were instructed using the Kumon Mathematical Method. Instruction took place 1 hour per day, 5 days a week in a public school setting. Instruction extended over an eight month period. Student subjects were pretested and posttested on the Mathematics batteries of the California Achievement Test (CAT). The amount of progress in mathematics was determined by computing gain scores for each section of the examination. Data included in this report includes: (1) CAT math concepts scores; (2) CAT computation and applications scores; (3) CAT total math scores; (4) school attendance; (5) Kumon Examination scores; (6) Kumon time scores; (7) number of packets completed; (8) Kumon level advancement; (9) class period; (10) academic track; and (11) grade level. Correlational relationships between variables are also discussed. Reported were significant gains in math computation, math concepts, and math applications scores at the seventh grade level; grade 8 students maintained their percentile rankings for the duration of the study; subjects significantly increased their speed on the Kumon exam; and CAT math gain scores were greater for the seventh graders than for the eighth graders. CAT gain scores were correlated with post Kumon exam scores. CAT gain scores were not correlated with Kumon exam time scores, number of Kumon packets completed, or Kumon advancement. (Author/CW) *********************************************************************** Reproductions supplied by EDRS are the best that can be made from the original document. ***********************************************************************
Transcript of A Study of the Effects of the Kumon Method Upon the Mathematical ...
-
DOCUMENT RESUME:11
ED 331 700 SE 051 520
AUTHOR Medina, Suzanne L.TITLE A Study of the Effects of the Kumon Met1Ild Upon the t,t
Mathematical Development of a Group of Inner-CityJunior High School Students.
PUB DATE 10 Dec 89NOTE 49p.; The small type in appendix D has been enlarged
to improve readability. .42
PUB TYPE Reports - Research/Technical (143)
EDRS PRICE MF01/PCO2 Plus Postage.DESCRIPTORS Grade 7; Grade 8; *Hixpanic Americans; Junior High
Schools; *Junior High School Students; LearningActivities; *Mathematics Achievement; MathematicsEducation; Mathematics Instruction; *Secondary SchoolMathematics; Standardized Tests; Teaching Methods;*Urban Education
IDENTIFIERS *Kumon Mathematical Method
ABSTRACTIn this research, 103 Hispanic junior high school
students were instructed using the Kumon Mathematical Method.Instruction took place 1 hour per day, 5 days a week in a publicschool setting. Instruction extended over an eight month period.Student subjects were pretested and posttested on the Mathematicsbatteries of the California Achievement Test (CAT). The amount ofprogress in mathematics was determined by computing gain scores foreach section of the examination. Data included in this reportincludes: (1) CAT math concepts scores; (2) CAT computation andapplications scores; (3) CAT total math scores; (4) schoolattendance; (5) Kumon Examination scores; (6) Kumon time scores; (7)number of packets completed; (8) Kumon level advancement; (9) classperiod; (10) academic track; and (11) grade level. Correlationalrelationships between variables are also discussed. Reported weresignificant gains in math computation, math concepts, and mathapplications scores at the seventh grade level; grade 8 studentsmaintained their percentile rankings for the duration of the study;subjects significantly increased their speed on the Kumon exam; andCAT math gain scores were greater for the seventh graders than forthe eighth graders. CAT gain scores were correlated with post Kumonexam scores. CAT gain scores were not correlated with Kumon exam timescores, number of Kumon packets completed, or Kumon advancement.(Author/CW)
***********************************************************************Reproductions supplied by EDRS are the best that can be made
from the original document.***********************************************************************

1A STUDY OF THE KFFECTS OF THE KUMON METHOD
UPON THIt MATHEMATICAL DEVELOPMENT OF
A GROUP OF INNER-CITY JUNIOR HIGH SCHOOL STUDENTS
Suzanne L. Medina
December 10, 1989
1 'PERMISSION TO REPRODUCE THISMATERIAL HAS BEEN GRANTED BY
I ..
. r
TO THE I. Duc,A1 IoNAL RE SOuRC.F.SINFoRmATION cINTEP I Ric,0ici
)a1 -.13
i REST COPY AVAILABLE
4)I f")
2
,

ABSTRACT
One-hundred three Hispanic junior high school students were instructed usingthe Iumon Mathematical Method. Instruction took place one hour per day, fivedays a week in a public school setting. Instruction extended over an eightmonth period beginning October 1988 and ending in early June of 1989.
Student subjects were pretested and post tested on the Math betteries of theC.A.T. (California Achievement Test). The amount of mathematical progressmade over the eight months was determined by computing gain scores for each ofthe sections of the CAT examination. These data are presented in the report asare the data on a number of other variables: 1) CAT Math Concepts pre andpost scores, 2) CAT Math Computation and Application pre and post scores, 3)Total Math pre and post scores, 4) Attendance, 5) Kumon Exam pre and postscores, 6) Union Time pre and post scores, 7) Number of Packets Completed, 8)Kumon Level Advancement, 9) Period, 10) Ttack, and 11) Grade. Also included inthe report is a description of the correlational relationships between CATGain scores and the other variables.
Seventh grade pre and post CAT Math Computation scores were statisticallysignificant (.001). Seventh grade Meth Concepts and Application scores werealso significat. (.01). Eighth graders maintained their percentile ranks overthe course of the eight months. Subjects significantly increased their speedon the Kumon Exam. CAT Math Gain scores were greater for seventh graders thanthey were for eighth graders.
CAT Gain scores were correlated with post tumon Exam scores, yet CAT Gainscores were not correlated with Kumon Exam Time scores, number of Kumonpackets completed or amount of Kumon advancement.

ORGANILATION OF THIS REPORT
This report was organized into nine major sections:
INTRODUCTIONSUBJECTSDESIGNPROCEDURESRESULTSSUMMARY OF FINDINGSOBSERVATIONSAPPENDICESREFERENCES
I INTRODUCTION
The focus of the study is established in this section. Following this is abrief discussion of the series of events which preceded this study.
II SUBJECTS
This section describes the student subjects including tneir schoolenvironment, tracking system and school calendar. It delineates the manner inwhich students were selected for this study, then presents a breakdown ofstudent participants by grade, track and period. Finally, based on CATpretest scores, it describes the students' linguistic abilities as compared tothe national norm population.
III DESIGN
The overall structure of the study is discussed in this section, as are eachof the variables which make up this study.
IV PROCEDURE
In this section of the report, the instructional and testing procedures usedduring the course of this study are described.
V RESULTS
The RESULTS are divideddata on the mean scoresdeals specifically withand the other variables
into two parts. The first part describes and presentsbelonging to each variable, while the second sectioncorrelational relationships between CAT Gain scoresin the study.

,y.ek - S a.nl.nt.a..asJt4 4 ,....,..-ac]J.11,1,41itti- tl vala.u.L. -74.1,1.11e.1.15-.C.....zda..4.-Lai-LILL:::,izlatinta.-
VI SUMMARY OF FINDINGS
Here, the reader is provided with a summary of the data reported previously inthe RESULTS section of this report. This more comprehensible rendition of thedata May be directly consulted without previously reading the RESULTS sectionin order to learn of the most significant findings in the study. If greaterdetail is desired, the reader may wish to consult the tables in the RESULTSsection.
VII OBSERVATIONS
This section contains a number of remarks and observations which may or maynot have been supported by the data.
VIII APPENDICES
Included in this section is the correlation matrix of all variables as well asthree frequency distributions : 1) CAT Math Computation Gain Scores, 2) CATlatal Math Gain Scores, and 3) CAT Math Concepts and Application Gain Scores.
IX REFERENCES
This section provides bibliographic information of the texts mentioned in thisreport.

TABLE OF CONTENTS
I INTRODUCTION 1
II SUBJECTS 2
School Setting 2
Tracking and the School Calendar 2
Selection of Students 2
Distribution of Subjects 3
Linguistic Characteristics of Subjects 4
III DESIGN 5
Variable Definition and Measurement 5
CAT Math Scores 5
Attendance 5
Limon Exams 6
Kumon Packets Completed 6
Kumon Level Advancement 6
Other Variables 6
IV PROCEDURES 7
The Kumon Method of Mathematical Instruction 7
Testing Schedule 7
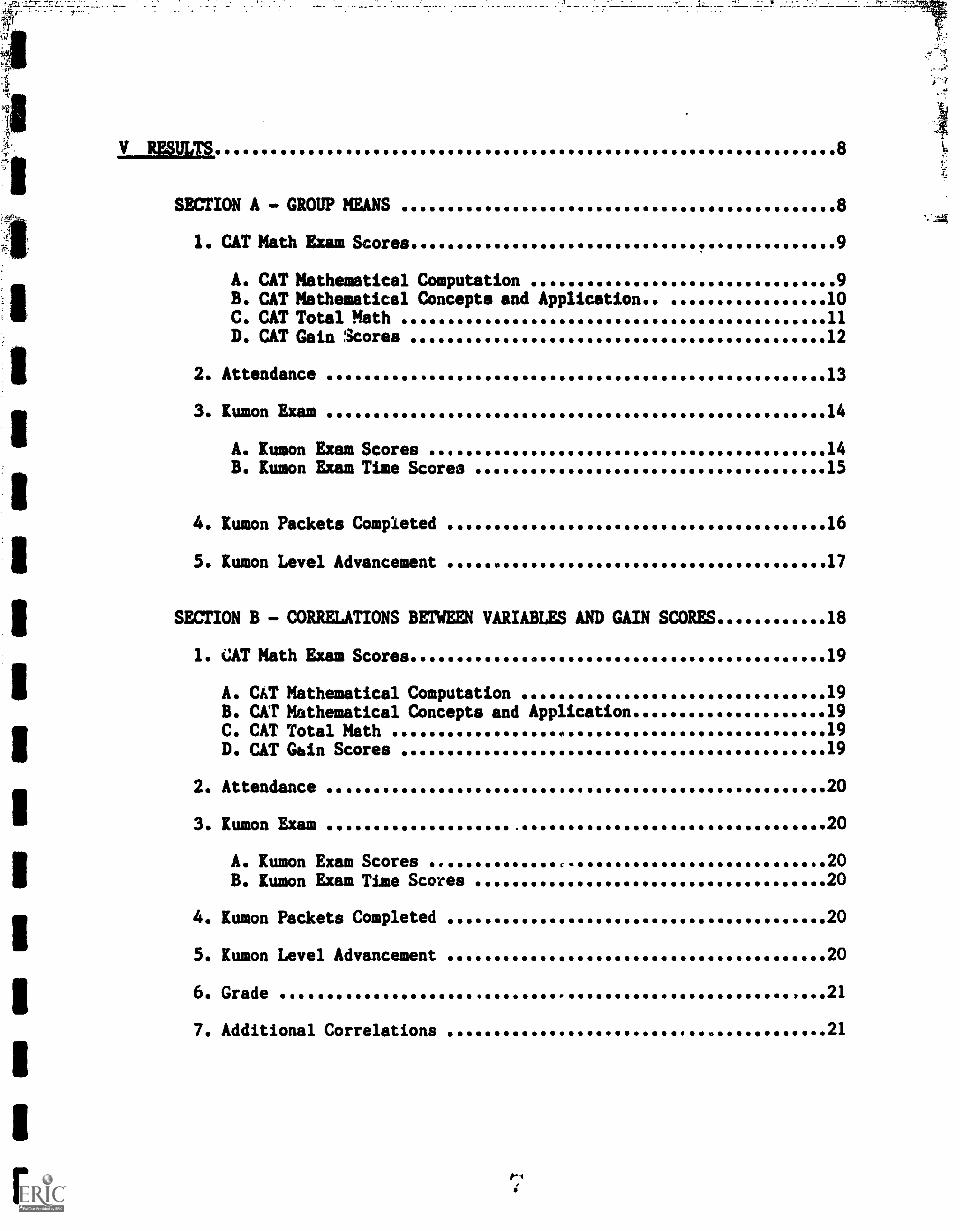
V RESULTS 8
SECTION A GROUP MEANS
1. CAT Math EX11111 Scores
8
9
A. CAT Mathematical Computation 9B. CAT' Mathematical Concepts and Application 10C. CAT Total Math 11
D. CAT Gain Scores 12
2. Attendance 13
3. Kumon Exam 14
A. Kumon Exam Scores 14B. Kumon Exam Time Scorea 15
4. Kumon Packets Completed 16
5. Kumon Level Advancement 17
SECTION B CORRELATIONS BETWEEN VARIABLES AND GAIN SCORES 18
1. CAT Math Exam Scores 19
A. CAT Mathematical Computation 19B. CAT Mathematical Concepts and Application 19
C. CAT Total Math 19D. CAT Gain Scores 19
2. Attendance 20
3. Kumon Exam 20
A. Kumon Exam Scores 20B. Kumon Exam Time Scores 20
4. Kumon Packets Completed 20
5. Kumon Level Advancement 20
6. Grade 21
7. Additional Correlations 21

VI SUMMARY OF FINDINGS 22.,-
f
1. CAT Math Scores 22
A. CAT Mathematical Computation 22B. CAT Mathematical Concepts and Application 23C. CAT Total Math 24D. CAr, ;lain Scores 25
2. Attendance 26
3. Kumon Exam 27
A. Kumon Exam Scores 27B. Kumon Exam Time Scores 28
4. Kumon Packets Completed 29
5. Kumon Level Advancement 30
6. Grade 30
VII OBSERVATIONS 31
Kumon Program Modifications 32Interpretation of Results 32
VIII APPENDICES 33
APPENDIX A - Frequency Distribution; CAT Math Computation Gain Scores.34
APPENDIX B - Frequency Distribution: CAT Math Concepts and ApplicationGain Scores 35
APPENDIX C - Frequency Distribution: CAT Total Math Gain Scores 36
APPENDIX D - Correlation Matrix of All Variables 37
IX REFERENCES 38

LIST OP TABLES
Table 1 - Distribution of Subjects by Grade Level and Period
Table 2 - Seventh and Eighth Grade CAT Vocabulary, Reading Comprehension andTotal Reading Scale Score Means, Percentiles, and Grade Equivalents
Table 3 - Seventh and Eighth Grade Pretest and Post Test CAT Meth ComputationScale Score Means, Percentiles, and Grade Equivalents
Table 4 - Seventh and Eighth Grade Pretest and Post Test CAT Math Conceptsand Application Scale Score Means, Percentiles, and CorrespondingGrade
Table 5 - Seventh and Eighth Grade Pretest and Post Test CAT Tbtal Math ScaleScore Means, Percentiles, and Grade Equivalents
Table 6 - Seventh and Eighth Grade CAT Gain Scale Score Means for MathComputation, Math Concepts and Application, and Total Math
Table 7 - Seventh and Eighth Grade Total and Quarterly Attendance Means
Table 8 - Seventh and Ei

- Tir,st
1
1
1
3
1
: -;;;-....
A STUDY OF THE EFFECTS OF THE KUMON METHODUPON THE MATHEMATICAL DEVELOPMENT OF
A GROUP OF INNER-CITY JUNIOR HIGH SCHOOL STUDENTS
INTRODUCTION
1
The present study was designed to investigate*the relationship betweenKumon mathematics instruction and mathematical progress as measured by the CAT(California Achievement Test). Pre and post test score means were comparedfor all three sections of the CAT exam and the Kumon Exam. Attendance meanswere also computed over the three quarters as were the number of packetscompleted. Average Kumon level advancement for the eight month period vas alsodetermined. Furthermore, this study investigated the correlationalrelationships between the amount of mathematical improvement as measured byCAT gain scores and a number of variables: 1) CAT Math Scores, 2) Attendance,3) Kumon Exam (Exam Scores and Time scores), 4) Kumon Packets Completed, 5)Kumon Level Advancement, 6) Other variables (Grade, Track, and Period).
This current study evolved as a result of a pilot study which wasconducted in 1988 at Macey Intermediate School in Montebello. In this previousstudy, a total of 63 junior high school seventh and eighth grade studentscomprised Kumon and Traditional mathematical instructional groups. Severalfactors made it difficult to formulate any conclusions regarding theeffectiveness of one method over the other. First, due to a high attritionrate, the number of subjects participating in the study were insufficient.Furthermore, the number of students comprising the Kumon groups was so small(i.e. ten) that it made it difficult to perform a matched pairs statisticalanalysis. An additional difficulty presented by this study study was therelatively short duration of time over which the study extended.Consequently, it was determined that a more substantive analysis was in order,one which involved a larger number and better balance of subjects over alonger period of time. The principal of Macey Intermediate School thentransferred to Bell Gardens Intermediate school where, after a series ofnegotiations, the Kumon mathematical program was installed beginning Septemberof 1988. During the Spring of 1988 a number of meetings were held to discussthe findings of the pilot and it was decided that a larger study was possible.
Li
A-4
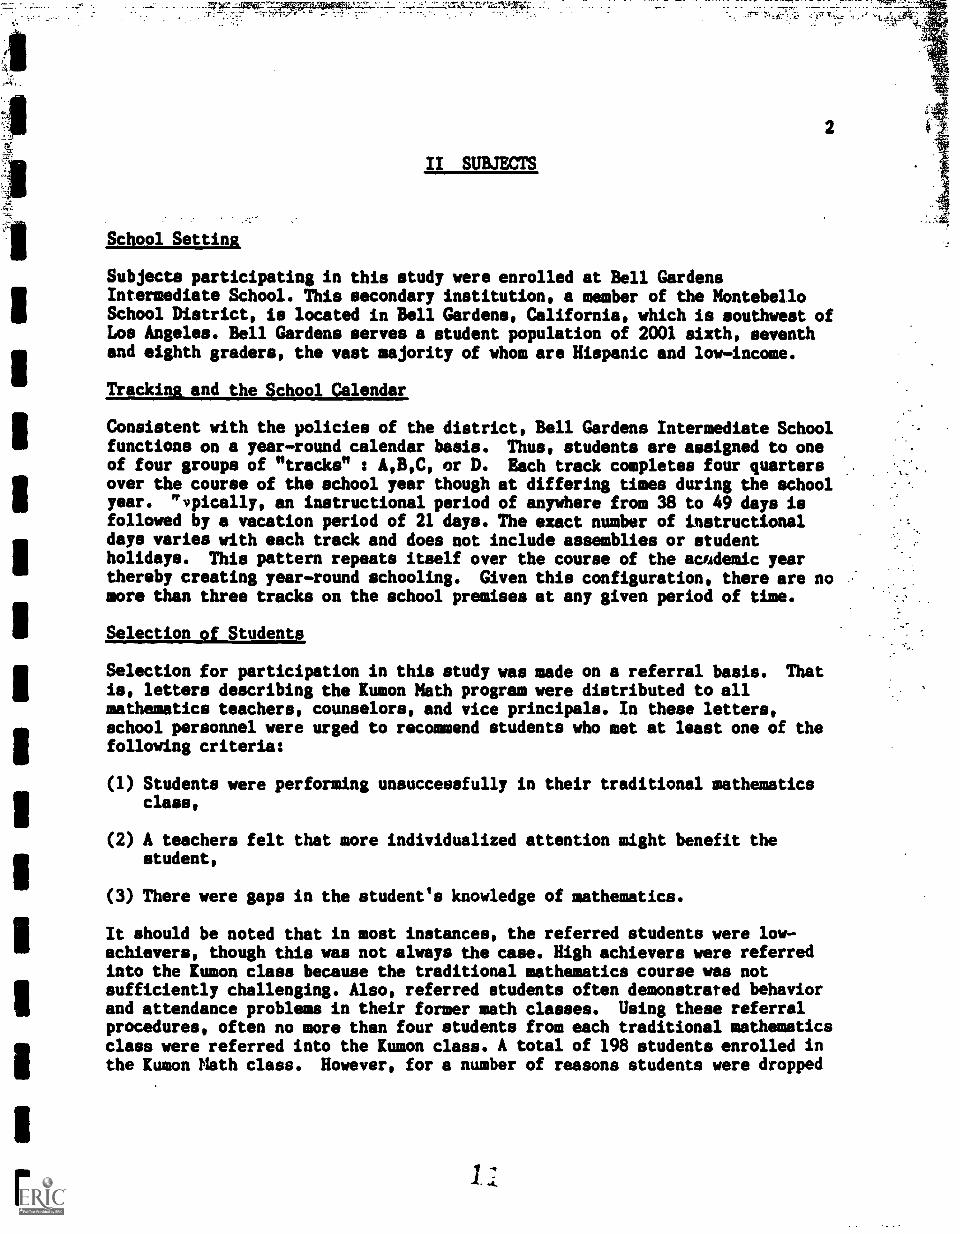
II SUBJEMS
School Setting
Subjects participating in this study were enrolled at Bell GardensIntermediate School. This secondary institution, a member of the MontebelloSchool District, is located in Bell Gardens, California, which is southwest ofLos Angeles. Bell Gardens serves a student population of 2001 sixth, seventhand eighth graders, the vast majority of whom are Hispanic and low-income.
Tracking,and the School Calendar
Consistent with the policies of the district, Bell Gardens Intermediate Schoolfunctions on a year-round calendar basis. Thus, students are assigned to oneof four groups of "tracks" : A,B,C, or D. Each track completes four quarters .
over the course of the school year though at differing times during the schoolyear. 'Typically, an instructional period of anywhere from 38 to 49 days isfollowed by a vacation period of 21 days. The exact number of instructionaldays varies with each track and does not include assemblies or studentholidays. This pattern repeats itself over the course of the academic yearthereby creating year-round schooling. Given this configuration, there are no :
more than three tracks on the school premises at any given period of time.
Selection of Students
Selection for participation in this study was made on a referral basis. Thatis, letters describing the Kumon Math program were distributed to allmathematics teachers, counselors, and vice principals. In these letters,school personnel were urged to recommend students who met at least one of thefollowing criteria:
(1) Students were performing unsuccessfully in their traditional mathematicsclass,
(2) A teachers felt that more individualized attention might benefit thestudent,
(3) There were gaps in the student's knowledge of mathematics.
It should be noted that in most instances, the referred students were low-ed:levers, though this was not always the case. High achievers were referredinto the Kumon class because the traditional mathematics course was notsufficiently challenging. Also, referred students often demonstrated behaviorand attendance problems in their former math classes. Using these referralprocedures, often no more than four students from each traditional mathematicsclass were referred into the Kumon class. A total of 198 students enrolled inthe Kumon Math class. However, for a number of reasons students were dropped
,,--_
cl,
.. from the study, Ihirty.7five left the progFem because theyswere transferred to
--, , other schOole. Another 59 wers.,,dropped because thOrelterCno,Mtvietests on
I,
. 11:11t:iteUtietnth:::agn1 ItigientrtgV:!:,:tt;41
"typts.. . nVi-E, *40. .
3
. .
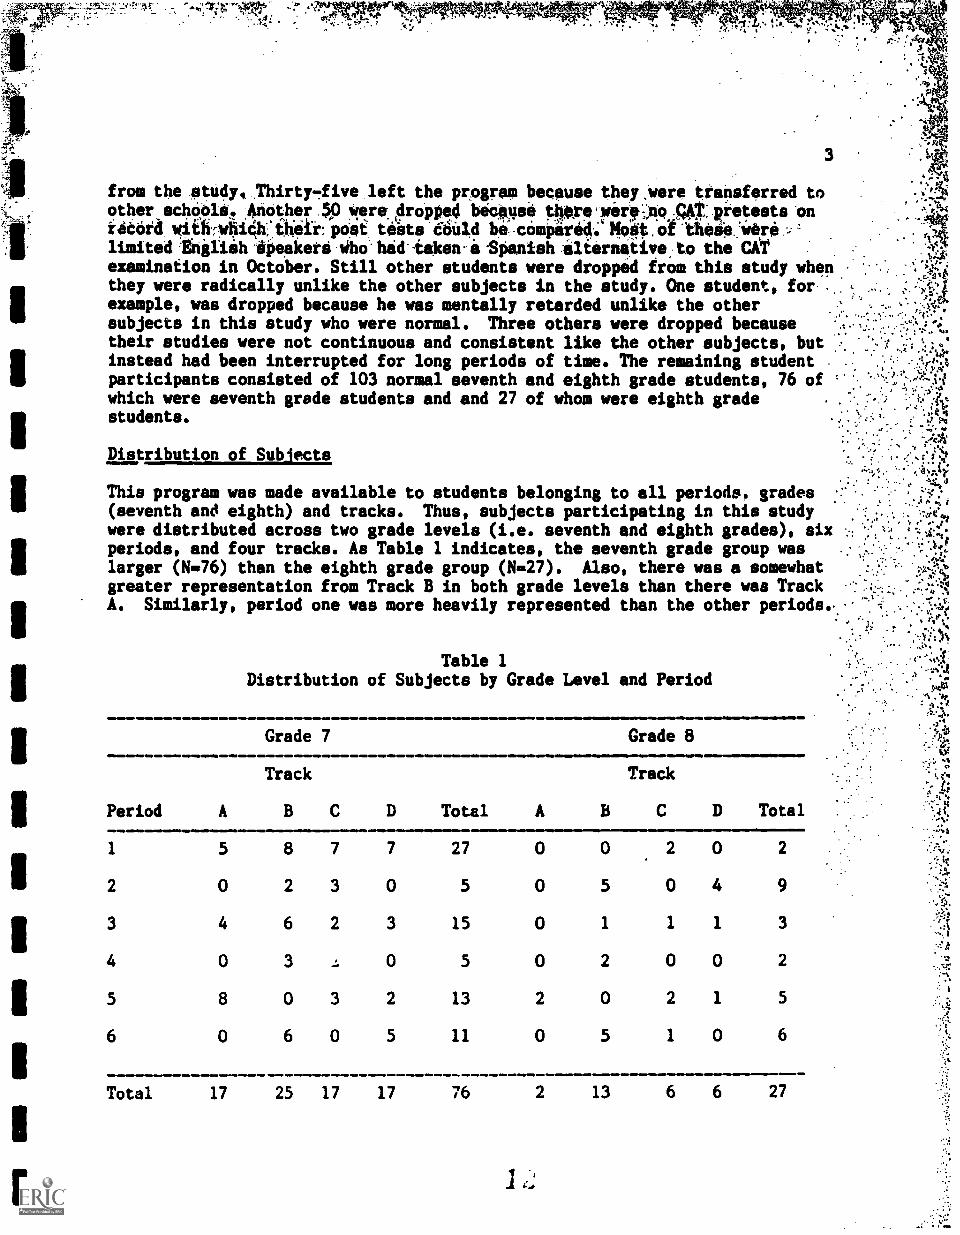
examination in October. Still other students were dropped from this study whenthey were radically unlike the other subjects in the study. One student, forexample, was dropped because he was mentally retarded unlike the othersubjects in this study who were normal. Three others were dropped becausetheir studies were not continuous and consistent like the other subjects, butinstead had been interrupted for long periods of time. The remaining student .
participants consisted of 103 normal seventh and eighth grade students, 76 ofwhich were seventh grade students and and 27 of whom were eighth grade
11,...,:c%
, ,ttstudents.
Distribution of SubJects - {. f :;`t
: .. 44.0This program was made available to students belonging to all periods. grades(seventh and eighth) and tracks. Thus, subjects participating in this studywere distributed across two grade levels (i.e. seventh and eighth grades), six
:
periods, and four tracks. As Table 1 indicates, the seventh grade group waslarger (N=76) than the eighth grade group (N=27). Also, there was a somewhatgreater representation from Track B in both grade levels than there was TrackA. Similarly, period one was more heavily represented than the other periods,
:
.Table 1Distribution of Subjects by Grade Level and Period11M1=
4.4
Grade 7 Grade 8,
;PeriodABCDTrack
Total A B
Track
C Total
1 5 8 7 7 27 0 0 2 0 2
2 0 2 3 0 5 0 5 0 4 9
3 4 6 2 3 15 0 1 1 1 3
A
4 0 3 . 0 5 0 2 0 0 2
5 8 0 3 2 13 2 0 2 1 5t
6 0 6 0 5 11 0 5 1 0 64111Total 17 25 17 17 76 2 13 6 6 27
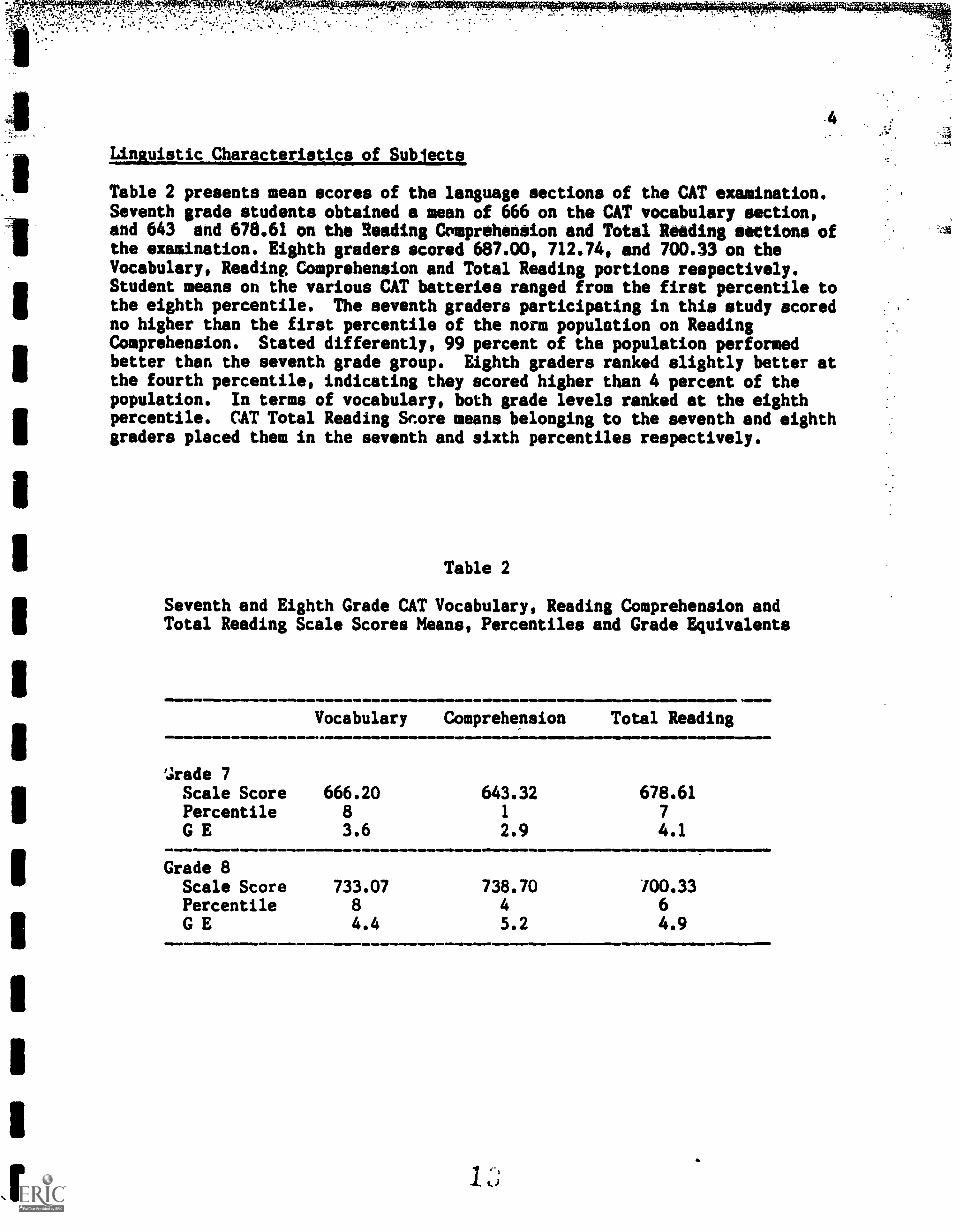
Linguistic Characteristics of Sublects
Table 2 presents mean scores of the language sections of the CAT examination.Seventh grade students obtained a mean of 666 on the CAT vocabulary section,and 643 and 678.61 on the Reading CPmprehenSion and Total Reeding elections ofthe examination. Eighth graders scored 687.00, 712.74, and 700.33 on theVocabulary, Reading Comprehension and Total Reading portions respectively.Student means on the various CAT batteries ranged from the first percentile tothe eighth percentile. The seventh graders participating in this study scoredno higher than the first percentile of the norm population on ReadingComprehension. Stated differently, 99 percent of the population performedbetter than the seventh grade group. Eighth graders ranked slightly better atthe fourth percentile, indicating they scored higher than 4 percent of thepopulation. In terms of vocabulary, both grade levels ranked at the eighthpercentile. CAT Total Reading Snore means belonging to the seventh and eighthgraders placed them in the seventh and sixth percentiles respectively.
Table 2
Seventh and Eighth Grade CAT Vocabulary, Reading Comprehension andTotal Reading Scale Scores Means, Percentiles and Grade Equivalents
MIMM ImMllmMININIPMOINe-VMbwram.mbwlmmM.NIImNMOMMalIe 111.10
Vocabulary Comprehension Total Reading*MID
'Jrade 7
011=0MMINIIMI
Scale Score 666.20 643.32 678.61Percentile 8 1 7G E 3.6 2.9 4.1OMmb
Grade 8Scale Score 733.07 738.70 100.33Percentile 8 4 6G E 4.4 5.2 4.9.4. .1.1111.111101.0111.MMIIINII.MANID momm....

5
III DESIGN
Themathematical abilities of these students were, in most instances,particularly low, therefore, they constituted a subset of the total schoolpopulation. Given the special characteristics of this group, it would not havebeen appropriate to compare this group with another. Instead, the effects ofthe Kumon instruction on all students in this group was measured by computingtheir CAT Gain scores on the three mathematical sections of the exam.
Data were obtained on the variables related to the objectives of this study.This involved the maintenance of records for each student including his trackidentification, grade, period, quarterly attendance in the program, number ofKumon packets completed per quarter, number of Kumon levels progressed, preand post scores on three math sections of the CAT examination, and pre andpat Kumon exam scores.
Variable Definition and Measurement
CAT Math Scores
The major measure of math proficiency consisted of a standardized examination,the CAT ( California Achievement Test). Tito mathematical batteries from theCAT exam were used for the purposes of this study: Mathematical Computationand Mathematical Concepts and Application, which consists primarily of wordproblems and applications. Two verbal batteries of the CAT examination wereused as well for the pre testing only: the Vocabulary and ReadingComprehension sections. Furthermore, mathematics battery scores wereaveraged, generating a Total Math score. Similarly, Total Reading scores were.representative of both verbal scores. Scale scores were used since theseprovided interval level data.
Attendance
Records regarding the number of days which students participated in theprogram were also matntained for each quarter. Because attendance wasdetermined on the babis of first period attendance records, the numbersprovided here must be considered as approximations. To make thesecalculations, the number of absent days from first period roll call weresubtracted from the number of days possible given the quarter, the student'strack, and date of entry into the Kumon program. Therefore, the total numberof days in the program during any given quarter varied depending upon a numberof factors: the number of quarter absences, track membership, and date ofentry into the Kumon program since students were allowed to enter the programat any point in the semester. It should be noted that each track differedslightly in the number of days during which instruction was conducted. Duringthe second quarter, for example, Track A consisted of 42 days, Track B, 43days. Track C. 45 days and Track D, 42 days.

6
Kumon Exams
The Kumon diagnostic exam (P-2), tested elementary mathematical notions ofaddition and subtraction. Furthermore, the Kumon test was timed: The amountof time which it took the student to complete the exam was recorded inminutes. Consequently, a score of the number of problems correct was recordedas well as the time in minutes. This exam was administered before and afterKumon instruction.
Kumon Packets Completed
The number of Kumon packets completed by each student was recorded as well.This consisted of the number of packets which had been turned in each quarter.Since students were allowed to work on packets at home, this count includedpackets completed during the school periods as well as those completed athome. The total number of Kumon packets completed were recorded as well as thenumber completed per quarter.
Kumon Level Advancement
In order to determine the number of Kumon levels which students had completedfor the duration of this study, records were kept of students' Kumon entry andexit levels. Entry and exit levels were then compared to determine the totalamount of Kumon progress made over the course of the eight month period. Byassigning a value for each Kumon level (e.g., 3Aw100, 2An200,etc.) and a valueof .05 for each booklet completed, it was possible to generate interval leveldata, and consequently compare and compute differences between entry and exitlevele. Thus, if a student had entered at level 2A and exited at level C-20,he had completed 4.1 levels. In this way it was possible to determine thetotal number of levels which had been completed for each student subject.
Other Variables
Other variables included in this study consisted of the following:
1) Grade level (7th and 8th)2) Track (A, B, C and D)3) Period (1, 2, 3, 4, 5, 6)

7
IV PROCEDURES
The following section describes the instructional method and testing procedureused with the 103 subjects.
The Kumon Method of Mathematical Instruction
Students participating in the Kumon classes received instruction five days perweek for 50 minutes each day. Kumon instruction was delivered by a maleAmerican public school teacher who had received in-service training i. theKumon method. Format and methods used did not differ from one period to theother. Instructional consistency was maintained across tracks.
Given the nature of the student clientele and the public school setting,certain adjustments were required. Diagnostic testing, competency testing,and student record keeping were maintained in compliance with the KumonMethod. However, if a student could pass the level exam, he was allowed toadvance to the next level, even if he had not completed all of the levelpackets. In most instances, students completed all level packets beforetesting out to the next level.
Instruction began on October 6, 1988 and ended on May 30 for those in TracksA, B, and D and June 12 for those in Track C.
Testing Schedule
All students enrolled at the school, including the participants in this study,were tested in the middle of October of 1988 on the verbal and mathematicalbatteries of the CAT. After administration of these tests and prior toreceiving test results, Kumon participants were identified using the selectionprocedure already described. Form E of levels 16 and 17 respectively wereadmigistered to seventh and eighth graders during the pre and post testingsessions. The post tests of the CAT took place over a three day period duringthe last two weeks of the fourth quarter. During the first testing day,*students received a practice test while the other two mathematics batterieswere given on the following two days.
Upon entry into the Limon program, the P-2 Kumon diagnostic test wasadministered. Students were placed in the appropriate Kumon level on the basisof these test results. At the conclusion of their Kumon studies, that is,during the last two weeks of the fourth quarter, students were again testedusing the P-2 examination. Those students who were absent during the initialadministration of the CAT or Kumon Post tests, were allowed to make up thesetests upon their return to school during the two week testing period.
1 Ci
8
V RESULTS
In this section of the report, the data will be presented for each of thevariables. The first section reports group means for each of the yariablesand other corresponding measures (i.e., percentile, grade equivalent). Thesecond concentrates upon correlational relationships among the variables, mostimportantly, the correlations between CAT Gain scores and other variables.
SECTION A GROUP MEANS
In the following section, sample means will be reported for each of thepreviously mentioned variables. A few comments are in order prior to theirinterpretation. First, in this section, the data will be broken down by gradelevel. Secondly, levels of significance are specified using asterisks. One tothree asterisks symbolize the .05, .01, and .001. levels of significancerespectively. These simply refer to the extent or degree to which a statisticcan be attribitted to chance.
(When a statistic is significant at the .01 level in a pre and post testsituation, it means that it is highly unlikely that the observed differencesbetween scores can be attributed to chance. Conversely, it is highly likelythat thlt differences can be attributed to the treatment being used. In thiscase the instructional method is the treatment.)
Although there were a number of measures which were available for interpretingCAT scores, it was decided to report scale scores, percentile and gradeequivalents since these were more appropriate giVen our objectives. Scalescores were recorded because they provided interval level data. Percentileranks showed the relative placement of this sample group with respect to thenational norm group.
Grade equivalent scores were also included in this study. Grade equivalentscore refers to the grade equivalent which corresponds to a given scale score.For example, a group scale score of 706 is the mean belonging to a norm groupwhich had completed mathematical instruction up to the seventh month of thefourth grade, or 4.7 grade equivalent.
Although grade equivalents have been provided here, caution must be taken intheir interpretation. They represerc the mean of the norm population which isa composite of scores belonging to students from a variety of ethnicbackgrounds. According to the CAT aorms manual, there may be a difference ofapproximately 20 scale scores across ethnic groups. Therefore, the gradeequivalents in the following tables represent this central point in thatspread.
"
9
1. CAT Math Exam Scores
A. CAT Mathematical Computation
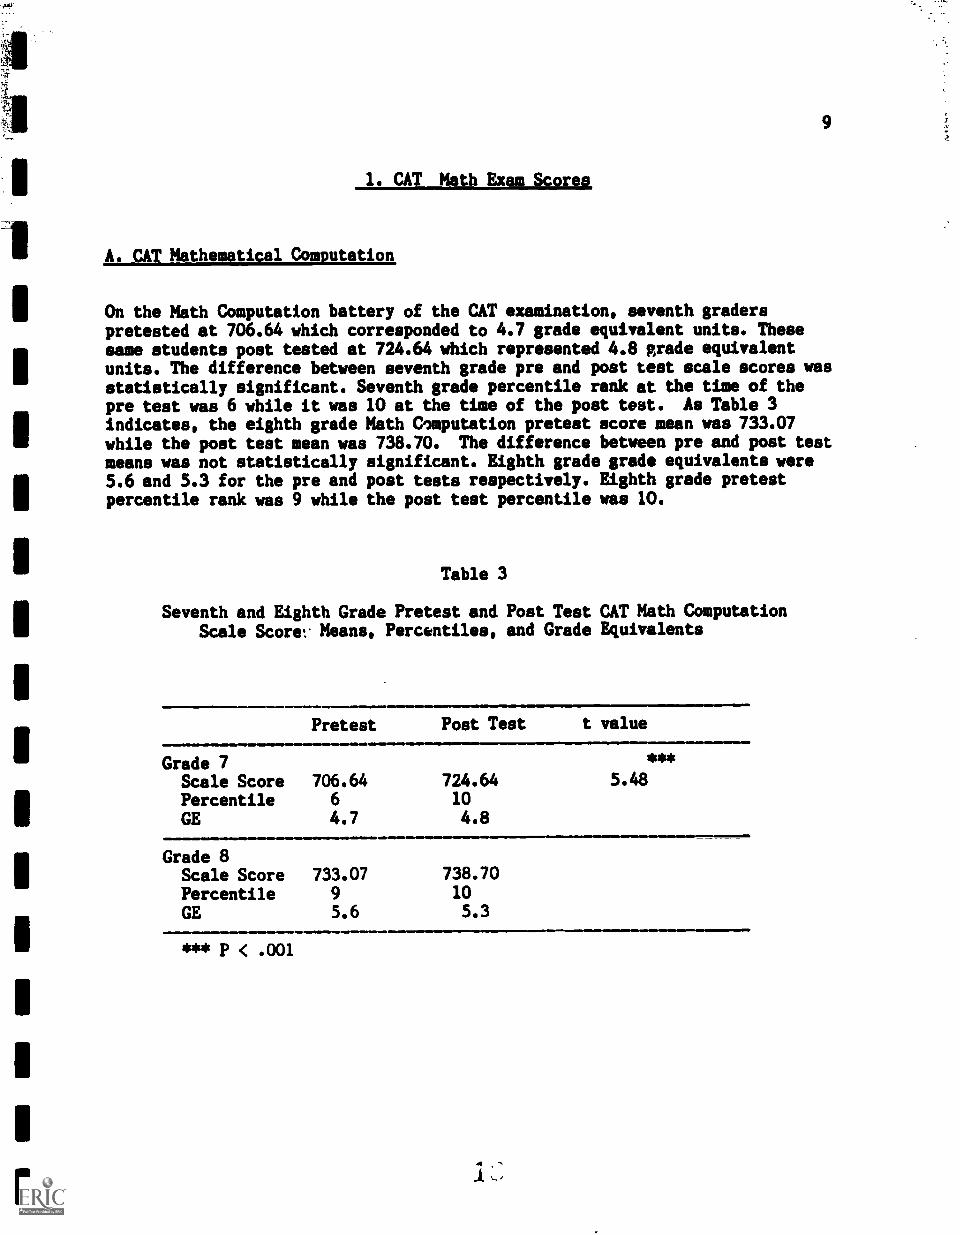
On the Math Computation battery of the CAT examination, seventh graderspretested at 706.64 which corresponded to 4.7 grade equivalent units. Thesesame students post tested at 724.64 which represented 4.8 grade equivalentunits. The difference between seventh grade pre and post test scale scores wasstatistically significant. Seventh grade percentile rank at the time of thepre test was 6 while it was 10 at the time of the post test. As Table 3indicates, the eighth grade Math C/mputation pretest score mean was 733.07while the post test mean was 738.70. The difference between pre and post testmeans was not statistically significant. Eighth grade grade equivalents were5.6 and 5.3 for the pre and post tests respectively. Eighth grade pretestpercentile rank was 9 while the post test percentile was 10.
Table 3
Seventh and Eighth Grade Pretest and Post Test CAT Math ComputationScale Scorey Means, Percentiles, and Grade Equivalents
WmewiroM.Pretest Post Test t value
Grade 7Scale ScorePercentileGE
706.6464.7
724.64104.8
***
5.48
................1.0.4=.=1.1111111111.11Grade 8
Scale Score 733.07 738.70Percentile 9 10
GE 5.6 5.3
*** P < .001
1 2,
B. CAT Mathematical Concepts and Application
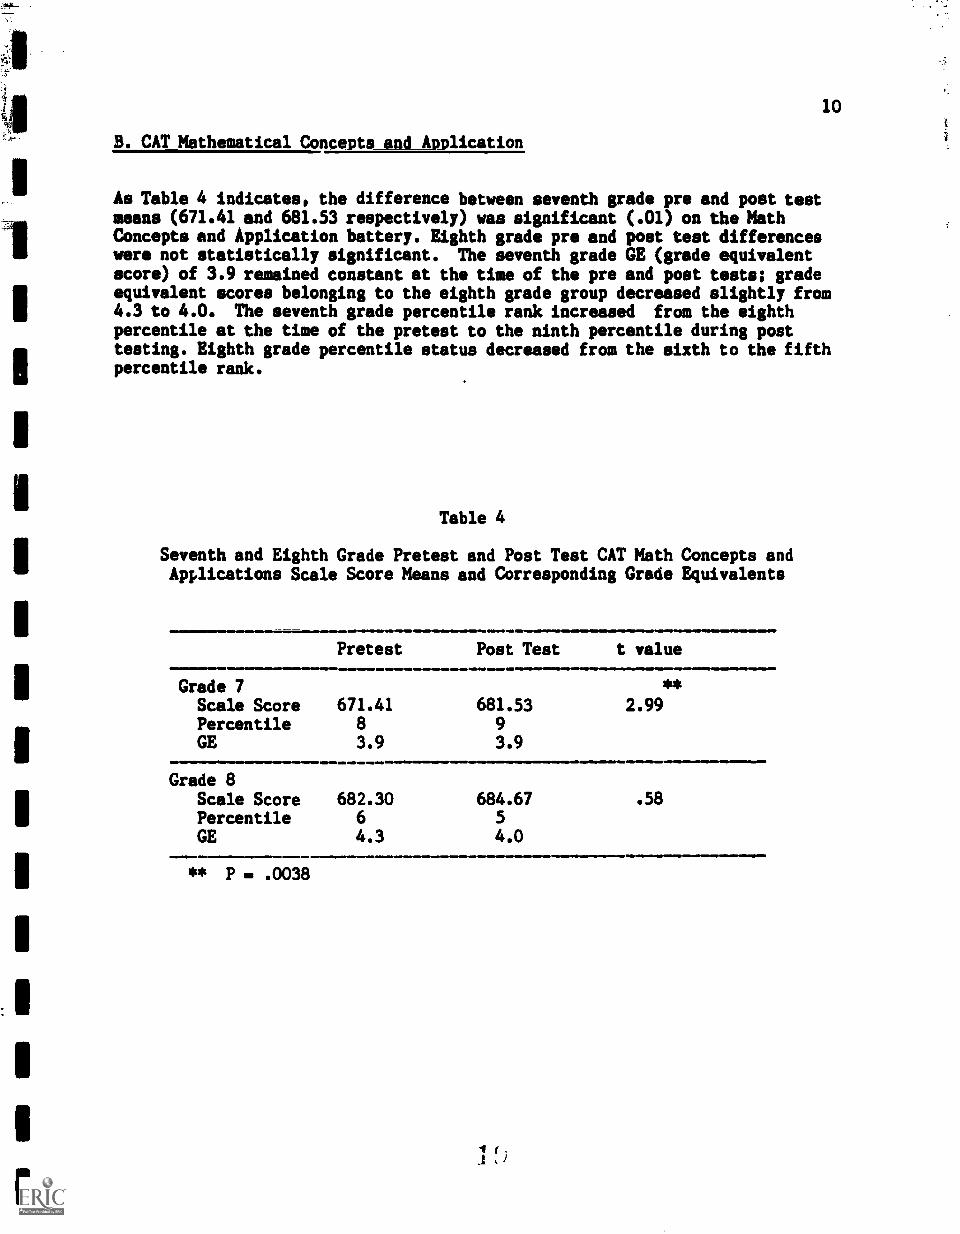
As Table 4 indicates, the difference between seventh grade pre and post testmeans (671.41 and 681.53 respectively) was significant (.01) on the MathConcepts and Application battery. Eighth grade pre and post test differenceswere not statistically significant. The seventh grade GE (grade equivalentscore) of 3.9 remained constant at the time of the pre and post tests; gradeequivalent scores belonging to the eighth grade group decreased slightly from4.3 to 4.0. The seventh grade percentile rank increased from the eighthpercentile at the time of the pretest to the ninth percentile during posttesting. Eighth grade percentile status decreased from the sixth to the fifthpercentile rank.
Table 4
Seventh and Eighth Grade Pretest and Post Test CAT Math Concepts andApplications Scale Score Means and Corresponding Grade Equivalents
....,411.11MPretest Post Test t valuewom..mm.momwommommempemmomoml
Grade 7Scale ScorePercentileGE
671.4183.9
681.5393.9
**
2.99
Grade 8Scale ScorePercentileGE
IIIMIIIIMINIDMMINIINEW111111.
682.30 684.67 .586 54.3 4.0
** P .0038
011.=11p1M.Olmil.100.111.111.11111M.11.0.

11
C. CAT Total Math
Seventh graders averaged 689.26 on the pretest of the CAT Tbtal Math exam and703.36 on the post test. This difference in means was statisticallysignificant (.001) for seventh graders. Grade equivalent scores correspondingto seventh grade pre and post tests were 4.5 and 4.4 respectively. Thedifference between the eighth grade Total Math pretest mean (708.04) and thepost test mean (711.96) was not statistically significant. The eighth gradepercentile rank was 6 for both pre and post tests. The eighth grade pretestgrade equivalent score was 5.1, while the post test grade equivalent was 4.8.
Table 5
Seventh and Eighth Grade Pretest and Post Test CAT Total MathScale Score Means, Percentiles, and Grade Equivalents
IIIMMIIIIKI.M.M.1.14.11141.110=8/111.1.0111M01111MONMIIIMMIMOVII= =11111MMIMIVIIMM=11,
Pretest Post Test t value.mNmmmwmmmwmmmodmmwmrmmwwmsmw4mmmmmmmmnirmrrmmmmmw.m.MGrade 7 ***
Scale Score 689.26 703.36 6.03Percentile 6 8GE 4.5 4.4
4111011.110111. 1114/01111111.1.11=1110MIPMMIDINIIMENIMMIMMENIMMOMMEMMINM111=1111M
Grade 8Scale Score 708.04 711.96Percentile 6 6GE 5.1 4.8....M.m11..0010-*** P < .001
1.06

12
D. CAT Gain Scores
Table 6 below summarizes the gain scores for each of the CAT exams alreadymentioned in this report. Seventh graders averaged a gain score of 18points on the Math Computation portion ot the CAT exam and 10.12 gain pointson the Math Concepts and Application portion. This resulted in a Total MathGain score mean of 14.09. For eighth graders, the Math Computation gain scoremean was 5.63; the Math %ncepts and Application mean was 2.37 yielding aTotal Math mean of 3.93.
Table 6
Seventh and Eighth Grade CAT Gain Scale Score Means forMath Computation, Math Concepts and Application, and Total Math
Math MathComputation Concepts and
ApplicationIIIIIIMMI.Grade 7 18.00
Total Math
10.12 14.09eyNiM40..bGrade 8 5.63 2.37 3.93
13
2. Attendance
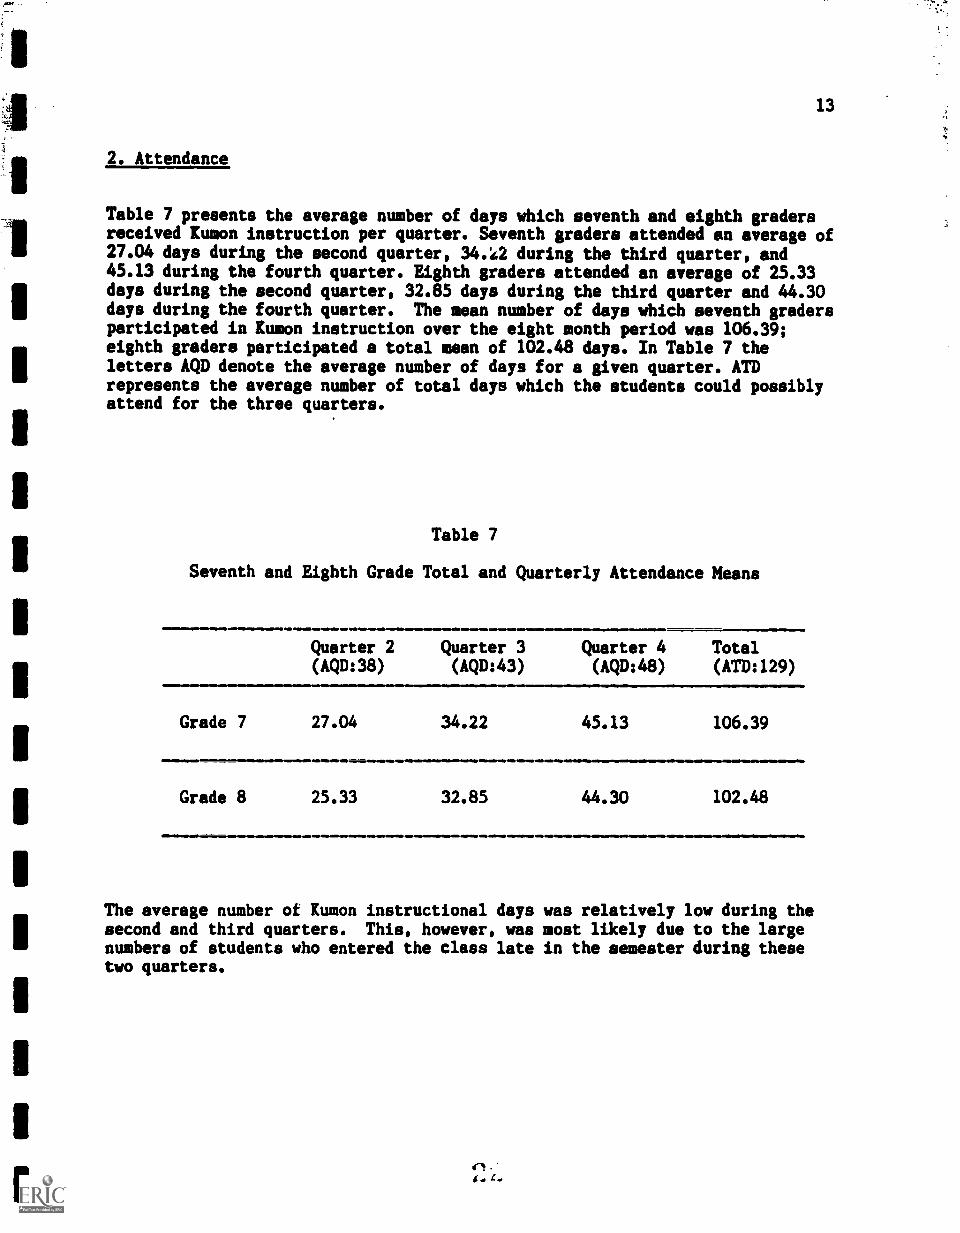
Table 7 presents the average number of days which seventh and eighth gradersreceived Kumon instruction per quarter. Seventh graders attended an average of27.04 days during the second quarter, 34.2 during the third quarter, and45.13 during the fourth quarter. Eighth graders attended an average of 25.33days during the second quarter, 32.85 days during the third quarter and 44.30days during the fourth quarter. The mean number of days which seventh gradersparticipated in Kumon instruction over the eight month period was 106.39;eighth graders participated a total mean of 102.48 days. In Table 7 theletters AQD denote the average number of days for a given quarter. ATDrepresents the average number of total days which the students could possiblyattend for the three quarters.
Table 7
Seventh and Eighth Grade Total and Quarterly Attendance Means
/BOMBAMIMNIMID1111./MMEIO.INNOMMONEMIN1111MMI111111411=111111.1,11.
IMIMM110111
Quarter 2 Quarter 3 Quarter 4 Total(AQD:38) (AQD:43) (AQD:48) (ATD:129)
Grade 7 27.04 34.22 45.13 106.39
Grade 8 25.33 32.85 44.30 102.48
.1111011111M11111
The average number of Kumon instructional days was relatively low during thesecond and third quarters. This, however, was most likely due to the largenumbers of students who entered the class late in the semester during thesetwo quarters.

3. Kumon Exam
A. Kumon Exam Scores
14
The seventh grade Kumon pretest mean of 66.93 was significantly different(.01) from the post test mean of 68.32. The eighth grade pretest mean (67.11)and post test mean (69.15) were statistically significant at the .001 level.Table 8 displays these means as well as their corresponding standarddeviations and t values.
Table 8
Seventh and Eighth Grade Kumon Pretest and Post Test Siore Means,Standard Deviations and t Values
IMIIIIM11 NPretest Post Test t value
Grade 7 1***Means 66.93 68.32 3.68SD 3.39 2.28
Grade 8 2 ***
Means 67.11 69.15 4.55SD 2.57 .92
=11...111111!
1
P = .00042
P < .001
While the difference of 2 to 3 points was statistically significant, theactual magnitude was small and does not represent a substantive ccntent gain.It should be noted that with means in the high 60's, and a total possible cf70, the distribution was highly skewed with many students achieving themaximum score.

B. Kumon Exam Time Scores
As displayed in Table 9, 7.54 minutes represent the seventh grade pretestmean; 4.91 minutes represent the post test mean. This difference in pretestand post test scores was statistically significant (.001). Eighth graderspretested with a meah of 6.78 minutes and post tested with a mean of 4.23minutes. The diffbrence between pre and post tests was statisticallysignificant (.001) as well.
Table 9
Seventh and Eighth Grade Kumon Pretest and Post Test Time Score Means(in minutes) and Corresponding t Values
.1111M1M110IMMMWO .11111MMIIPretest Post Test t value
***
Grade 7 7.54 4.91 8.254111***
Grade 8 6.78 4.23 6.12
*** P < .001
=111111111
15

The average numberin Table 10 below.graders during the34.22, and 45.13.30.73, and 15.33.
16
4. Kumon Packets Completed
of Kumon packets completed per quarter have been displayedThe mean number of Kumon packets completed by seventhsecond, third, and fourth quarters was as follows: 27.04,For eighth graders these means per quarter were 36.33,
Table 10
Seventh and Eighth Grade Mean Number of Packets Completed per Quarter
=IMM.MMMIOMMD.MINOMINIDONWMIMIIIIMINO.M. 16.6MMIDIMIMMIMM=Quarter 2 Quarter 3 Quarter 4
IIIIIIMEMIIMINININIII IIIMENIAMMO11111=14MMENIMIMIIMMIMMMINNIM
Grade 7 27.04 34.22 45.13
4.=1.......m.IMMONO.1MIIMGrade 8 36.33 30.73 15.33
.........~.1 _.Inmwo.pmimmommA number of factors may have influenced that number of packets completed.Lower level Kumon packets require less time to complete than do the higherlevel packets, therefore, one would expect higher level students to completefewer pockets. Also, the figures provided in Table 10 include the number ofpackets completed by students who entered at differing times during the
quarter. Given this, it is not surprising that the mean number of packetswere so low during the second quarter when a large number of students enteredthe program late in the quarter. During the fourth quarter, most students werepresent from the very beginning of the quarter.

1 5 lamon Level Advancement
....
The average l'Alsion'entry4nd exit levels.belonging to seventh' and eighthgraders are displayed in tte Table 11. As determined.by the Kumon diagnosticexamination, the average seventh grade Kumon entry level was 2A-31 while theaverage exit level was D-51. This difference represented a mean advancement.of 4.10 Kumon levels (i.e., 4 levels and 2 packets). The eighth gradersadvanced four Kumon levels over the duration of this study since they began aa mean level of 2A-81 and exited at level D-81.
17
Table 11
Seventh and Eighth Grade Means of Limon Entry Level,Exit Level and Total Levels Completed
11M1.10101.41.11i.....11.,Entry Level Exit Level Total Levels
MINIMMIINIMIONMM=NIAMI/NO IIMMGrade 7 2A-31 D-51 4.10
ItrenrmwoloasommiwolmmilGrade 8 2A-81 1081 4.00
.mlliad..mmmwmmAmmmrrmlwmm.m.NM .1=1.1N1111.11N111.=1114111,......
18
SECTION B - CORRELATIONS BENEEN THE VARIABLES AND GAIN SCORES
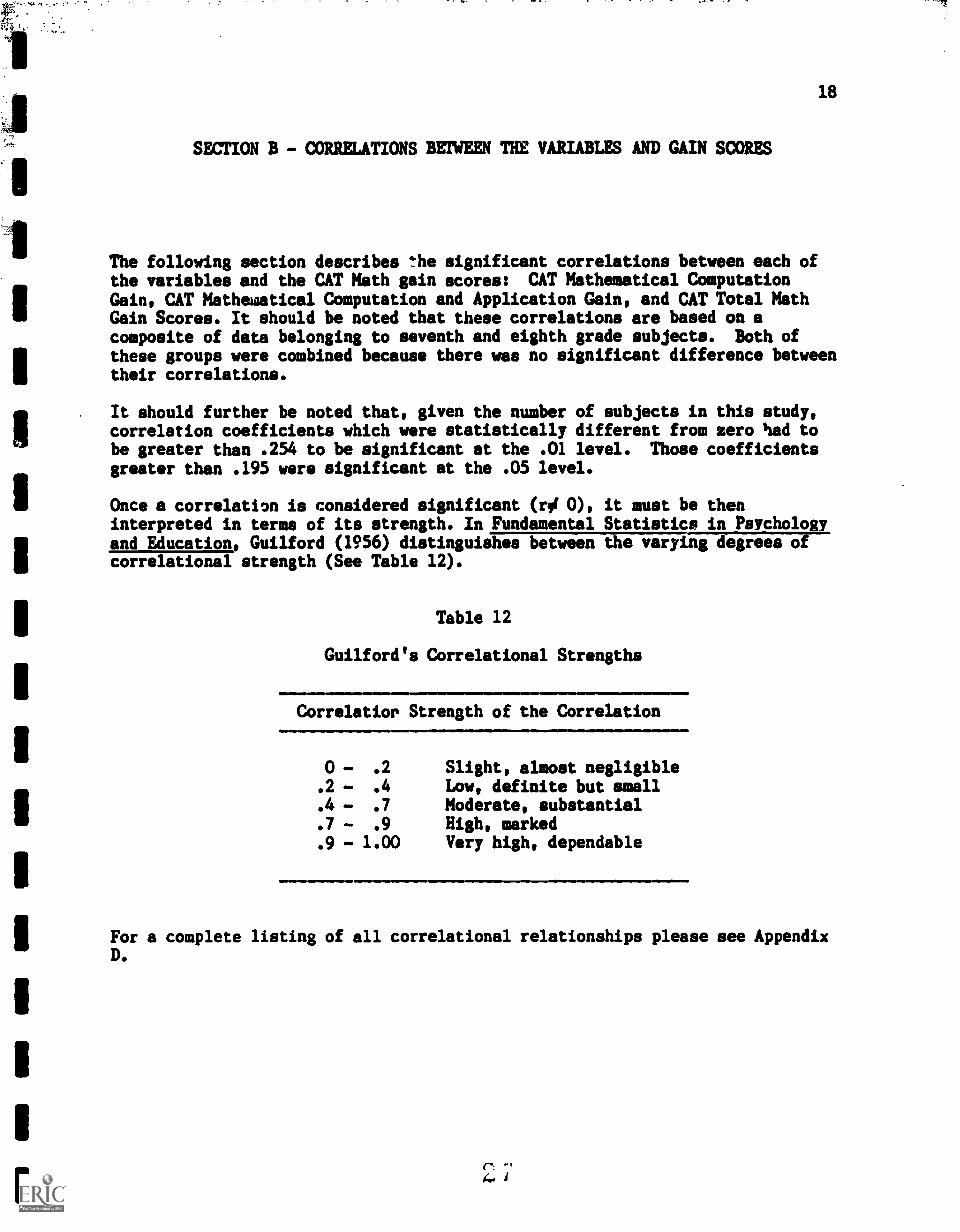
The following section describes 'he significant correlations between each ofthe variables and the CAT Math gain scores: CAT Mathematical ComputationGain, CAT Mathematical Computation and Application Gain, and CAT Total MathGain Scores. It should be noted that these correlations are based on acomposite of data belonging to seventh and eighth grade subjects. Both ofthese groups were combined because there was no significant difference betweentheir correlations.
It should further be noted that, given the number of subjects in this study,correlation coefficients which were statistically different from zero had tobe greater than .254 to be significant at the .01 level. Those coefficientsgreater than .195 were significant at the .05 level.
Once a correlation is considered significant (r# 0), it must be theninterpreted in terms of its strength. In Fundamental Statistics in Psychologyand Education, Guilford (1956) distinguishes between the varying degrees ofcorrelational strength (See Table 12).
Table 12
Guilford's Correlational Strengths
Correlatior Strength of the Correlation
0 - .2
.2 - .4
.4 - .7
. 7 - .9
.9 - 1.00
Slight, almost negligibleLow, definite but smallModerate, substantialHigh, markedVery high, dependable
For a complete listing of all correlational relationships please see AppendixD.
19
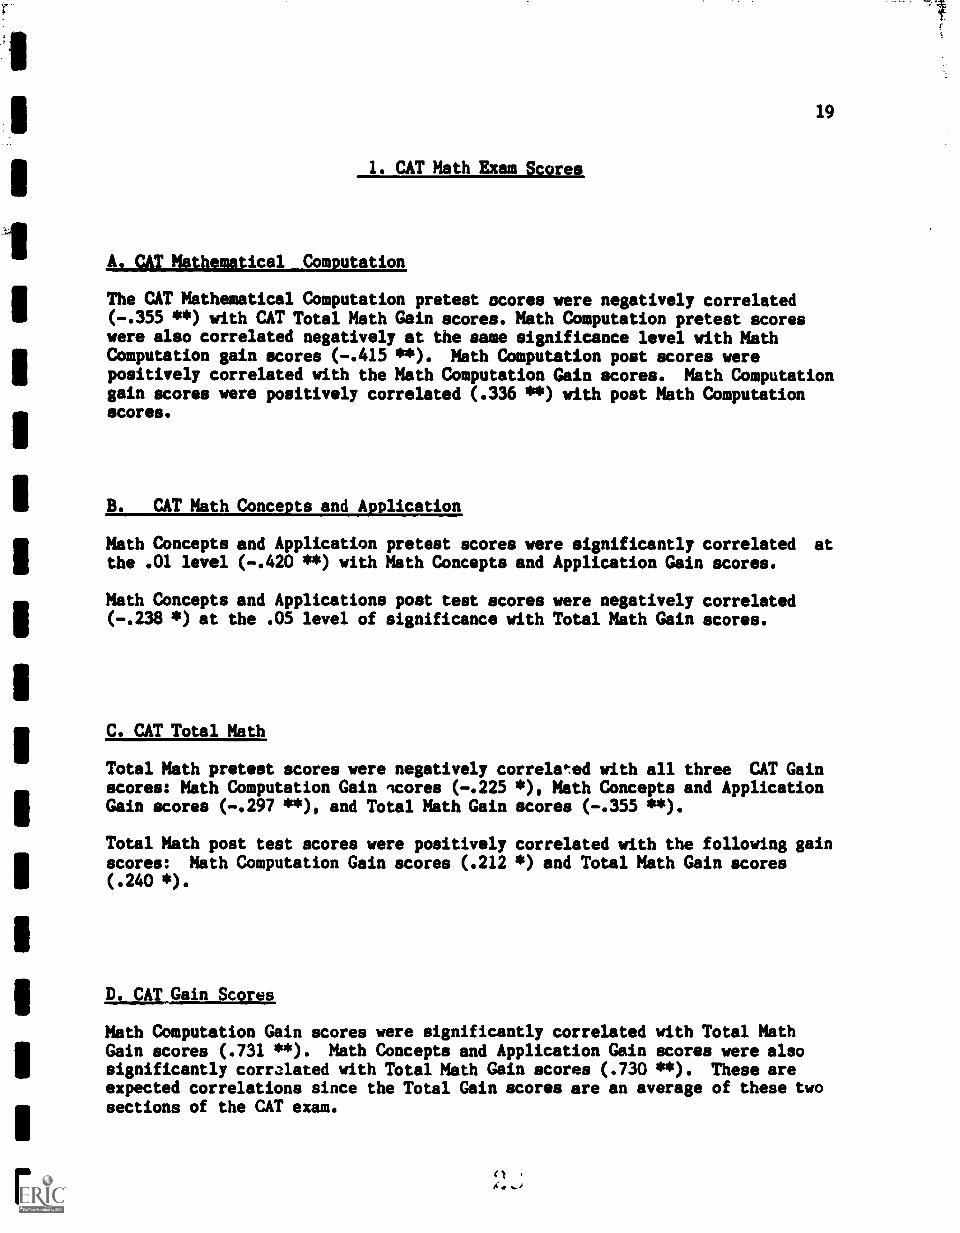
1. CAT Math Exam Scores
A. CAT Mathematical Computation
The CAT Mathematical Computation pretest scores were negatively correlated(-.355 **) with CAT Total Math Gain scores. Math Computation pretest scoreswere also correlated negatively at the same significance level with MathCbmputation gain scores (-.415 **). Math Computation post scores werepositively correlated with the Math Computation Gain scores. Math Computationgain scores were positively correlated (.336 **) with post Math Computationscores.
B. CAT Math Concepts and Application
Math Concepts and Application pretest scores were significantly correlated atthe .01 level (-.420 **) with Math Concepts and Application Gain scores.
Math Concepts and Applications post test scores were negatively correlated(-.238 *) at the .05 level of significance with Total Math Gain scores.
C. CAT Total Math
Total Math pretest scores were negatively correlated with all three CAT Gainscores: Math Computation Gain 'mores (-.225 *), Math Cbncepts and ApplicationGain scores (-.297 **), and Total Math Gain scores (-.355 **).
Total Math post test scores were positively correlated with the following gainscores: Math Computation Gain scores (.212 *) and Total Math Gain scores(.240 *).
D. CAT Gain Scores
Math Computation Gain scores were significantly correlated with Total MathGain scores (.731 **). Math Concepts and Application Gain scores were alsosignificantly correlated with Total Math Gain scores (.730 **). These areexpected correlations since the Total Gain scores are an average of these twosections of the CAT exam.
20
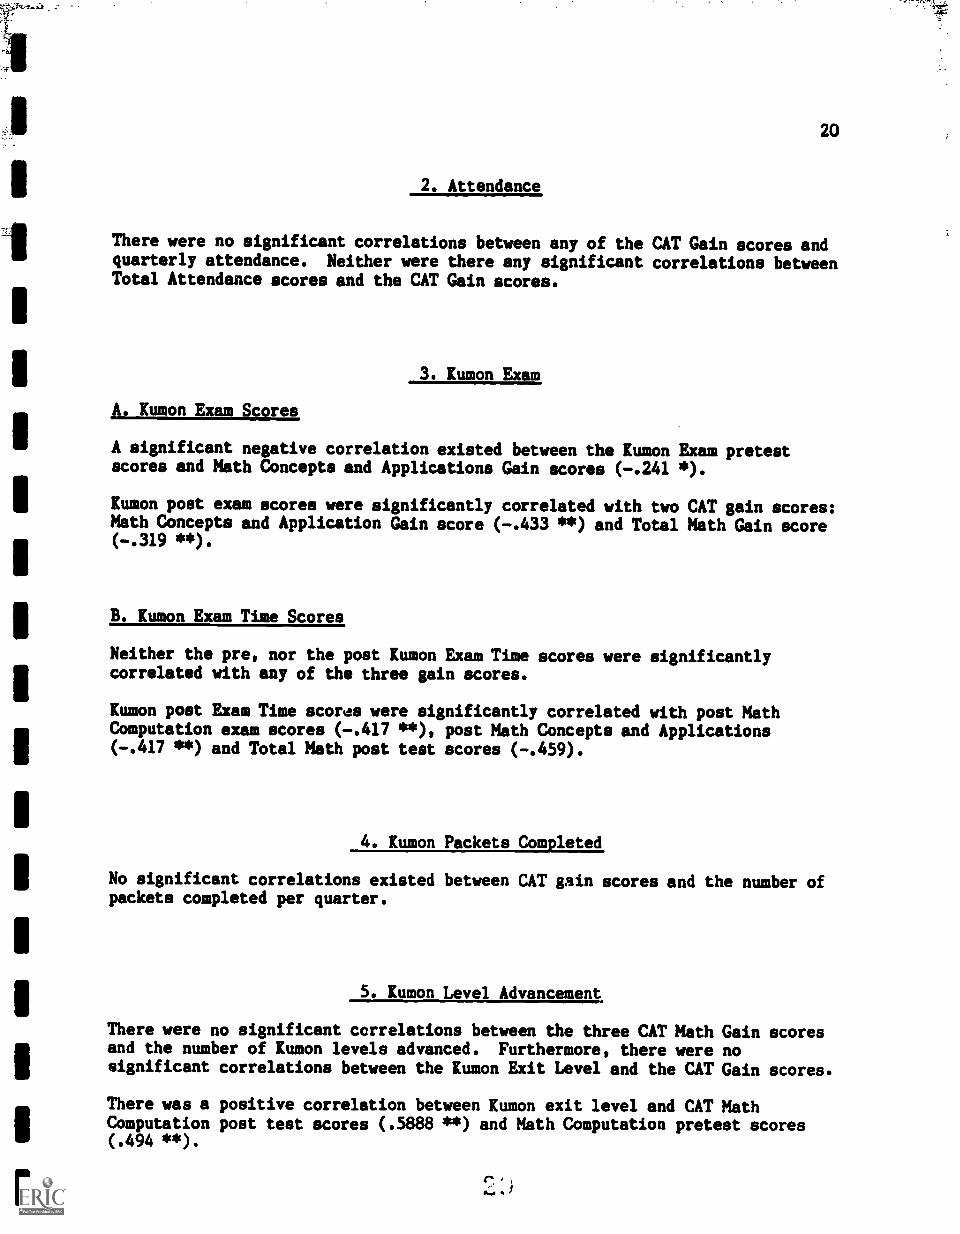
2. Attendance
There were no significant correlations between any of the CAT Gain scores andquarterly attendance. Neither were there any significant correlations betweenTotal Attendance scores and the CAT Gain scores.
3. Kumon Exam
A. Kumon Exam Scores
A significant negative correlation existed between the Kumon Exam pretestscores and Math Concepts and Applications Gain scores (-.241 *).
Kumon post exam scores were significantly correlated with two CkT gain scores:Math Concepts and Application Gain score (-.433 **) and Total Math Gain score(-.319 **).
B. Kumon Exam Time Scores
Neither the pre, nor the post Kumon Exam Time scores were significantlycorrelated with any of the three gain scores.
Kumon post Exam Time scorve were significantly correlated with post MathComputation exam scores (-.417 **), post Math Concepts and Applications(-.417 **) and Total Math post test scores (-.459).
4. Kumon Packets Completed
No significant correlations existed between CAT gain scores and the number ofpackets completed per quarter.
5. Kumon Level Advancement
There were no significant correlations between the three CAT Math Gain scoresand the number of Kumon levels advanced. Furthermore, there were nosignificant correlations between the Kumon Exit Level and the CAT Gain scores.
There was a positive correlation between Kumon exit level and CAT MathComputation post test scores (.5888 **) and Math Computation pretest scores(.494 **).

21
6. Grade
Grade level was negatively correlated with Math Computation Gain (-.197 *).There v7- also a negative correlation between Grade level and Total Math Gain(-.221 **).
7. Additional Correlations
There were other correlations found in the data which were not directlyrelated to the issue at hand. Here, track and period correlations will bediscussed briefly.
Track
There were no significant correlations between the track to which the studentbelonged and the CAT Gain scores.
Period
There were two negative correlations between the Period and CAT Gain scores.Period was significantly correlated with Math Computation Gain scores(-.238 **) and Total Math Gain scores (-.278 **).
In short, a number of other significant correlations were found inhowever, it was not within the scope of this study to deal with all oi Chese.For a complete listing of all correlational relationships please refer toAppendix D.

22
VI SUMMARY OF FINDINGS
The following section summarizes the findings for each of the variablesdiscussed in this report. Each variable is discussed in terms of the seventhand eighth grade means as well as its correlation with gain scores.
1. CAT Math Scores
A. CAT Mathematical Computation
1) Means, (Table 3)
* The 18 point difference between pre and post CAT Math Computationscores was statistically significant (.01) for seventh graders.
* The 5.63 difference between pre and post CAT Math Computation scoreswas not statistically significant for eighth graders.
* The seventh grade percentile rank increased from the 6th percentile onthe pretest to the 10th percentile on the post test of the CAT Math
Computation exam.
* Eighth grade percentile rank did not significantly change between pre
and post tests of the Math Computation exam. Eighth grade studentsappear to have maintained their percentile rank in Math Computation.
2) Correlations with CAT Math Gain scores
* Low Math Computation pretest scores were related to high gain scores:1) Total Math Gain scores (.355 **), and 2) Math Computation Gainscores (.415 **).
* High gains on the Math Computation portion of the exam were correlatedwith high post Math Computation scores (.336 **).
23
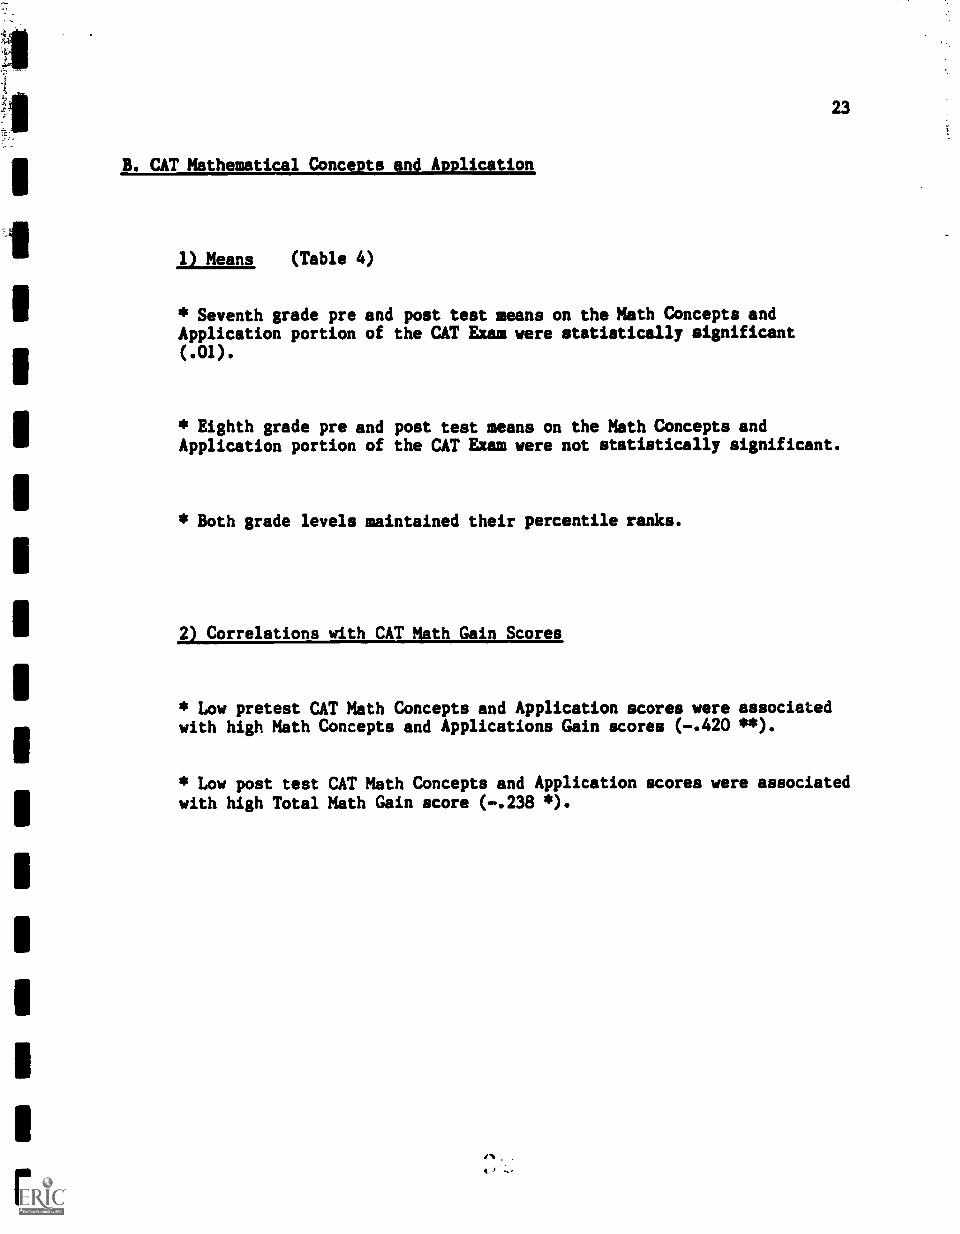
B. CAT Mathematical Conce ts and A lication
ILAVEIL (Table 4)
* Seventh grade pre and post test means on the Math Concepts andApplication portion of the CAT Exam were statistically significant(.01).
* Eighth grade pre and post test means on the Math Concepts andApplication portion of the CAT Exam were not statistically significant.
* Both grade levels maintained their percentile ranks.
2) Correlations with CAT Math Gain Scores
* Low pretest CAT Math Concepts and Application scores were associatedwith high Math Concepts and Applications Gain scores (.420 **).
* Low post test CAT Math Concepts and Application scores were associatedwith high Total Math Gain score (.238 *).

24
C. CAT Total Math
111WEIE (Table 5)
* CAT Total Math pre and post scores were significantly different forthe seventh grade group. This was expected since Total Math scores arean average of the other two CAT Math exams which were also significant.
* The eighth grade CAT Total Math pre and post scores were notsignificantly different.
2) Correlations with CAT Math Gain Scores
* The lower the scores were on the CAT Total Math pretest, the higherwere the following gain scores: 1) Math Computation Gain scores(-.225 *); 2) Math Concepts and Application Gain scores (-.297 **); and3) the Total Math Gain scores (-.355 **). It was important to note thatthe relationship between the gain scores represented a regressioneffect. This implies the existence of some regression effect with lowerscores making higher gains. While statistically significant at the .01level, it represents only 12.6 Z of the common variance (r squaredequals .126).
* The higher the scores were on the CAT Total Math post test, thehigher were the following gain scores: 1) Math Computation Gainscores (.212 *) and 2) Total Math Gain Scores (.240 *).
25
D. CAT Gain Scores
112.1111E (Table 6)
* Total CAT Math Gain score means were higher for seventh graders thantbc; -mt.& for eighth graders. This included Math Computation Gain
',Jth Concepts and Applications Gain scores, and Total MAth Gainsco:...
* The greatest gain scores reported for seventh graders was on the MathComputation battery of the CAT exam.
2) Correlations with CAT Math Gain Scores
* High 'Ath Computation Gain scores as well as Math Concepts andApplication Gain scores were correlated with high Total Math gains.Given that the Total Math gains are an average of the first two, thisrelationship was expected.

1
1
1
1
26
2. Attendan e
allIELIE (Table 7)
* For seventh graders, the mean number of Kumon instructional daysincreased over the course of the three quarters.
* For eighth graders, the mean number of Kumon instructional days
increased over the course of the three quarters.
* The average total number of days the two grade levels attended Kumon
classes differed by 4 days.
2) Correlations with CAT Math Gain Scores
* The attendance variable did not appear to be related to any of the CAT
Gain scores.
3. Kumon Exam
A. Kumon Exam Scores
altEris (Table 8)
27
* Differences between pre and post Kumon exam scores were statisticallysignificant for the seventh grade group (.01).
* Differences between pre and post Kumon exam scores were statisticallysignificant for the eighth grade group (.001).
2) Correlations with CAT Math Gain Scores
* Low Kumon pretest scores were associated with high Math Concepts andApplications Gain scores (-.214 *).
* Low Kumon post test scores (-.433 **) were associated with high gainsin Math Concepts and Application.
* Low scores on the Kumon Post test were correlated with high Total MathGains scores (-.319 **)
-tft

II0
I1
28
B. Kumon Exam Time Scores
Jalittat (Table 9)
* The amount of time required to complete the Kumon examinationsignificantly decreased for seventh graders (.001).
* The amount of time required to complete the Kumon examinationsignificantly decreased for eighth graders (.001).
2) Correlations with CAT Math Gain Scores
* There was no relationship between Kumon Time scores and CAT Math Gainscores.
* Low Kumon Post test time scores were related to high scores Oh twoCAT Math exams: 1) Post Math Computation exam (-.417 **), and thePost Math Concepts and Application Exdh (-.417 **). Consequently, lowKumon post test time scores were correlated with Total Math post testscores (.459 **).
29
4. Kumon Packets Completed
lijiejins (Table 10)
* The number of Kumon packets completed by seventh gradersincreased with each quarter.
* The number of Kumon packets completed by eighth gradersincreased with each quarter.
* Eighth grade packet ccmpletion dropped from an average of 30.73packets during the Quarter 3 to 15.33 packets during Quarter 4.
* During the fourth quarter, the mean number of Kumon packets completedby eighth graders consisted of 15.33 packets.
* Diring the fourth quarter, the mean number of Kumon packets completedby seventh graders consisted of 45.13 packets.
2) Correlations with CAT Math Gain Scores
* The number of packets completed per quarter were not correlated in any
way with CAT Math Gain scores.
30
5. Kumon Level Advancement
112129m (Table 11)
* Eighth graders advanced an average of 4 Kumon levels.
* Seventh graders advanced an average of 4.10 Kumon levels.
* The average seventh grade Kumon entry level was 2A-31 while theexit level was D-51.
* The average eighth grade Kumon entry level was 2A-81 while the exitlevel was D-81.
2) Correlations with CAT Math Gain Scores
* There was no relationship between CAT Math Gain scores and Kumonlevels completed.
* CAT Math Gain scores and Kumon exit level were not correlated.
* A high Kumon exit level was related to CAT Math Computation post testscores (.588 **).
* A high Kumon exit level was related to Math Computation pretest scores(.494 **). Based on these last two correlations, the Kumon levelsappear to have a degree of construct validity with respect to the
CAT (r squared equals .336).
6. Grade
Correlations with CAT Math Gain Scores
* The low grade level was related to high Math Computation Gain scores(-.197 *) and high Total Math Gain scores (-.221 *).

31
VII OBSERVATIONS
A number of relationships uncovered by the data have been presented anddiscussed in this report, yet there are a number of observations which will bemade with respect to the program and these data.
Kumon Program Modifications
There were a number of modifications which were made to the Kumon instructionpresented at Bell Gardens Interme:iate school which distinguish it from theKumon instruction which might take place in a private school setting.
1) Kumon in the Traditional Curriculum
At Bell Gardens, Kumon materials were used in place of the traditional ones.That is, Kumon instruction was not used to supplement a traditionalcurriculum.
2) Motivation Techniques
These public students were motivated by their instructor in a number of wayswhich may not be similar to those methods employed in the privately instructedKumon classes. These included pep talks, certificates, the opportunity topurchase candy rewards, etc.
3) Public School Setting
In this study, Kumon Math was studied during the various periods of the day.Those participating during the later periods may have been subject to a numberof factors which could have affected their performance. The correlationsbetween period and CAT Gain scores support this: Students attending later inthe day had lower CAT Math Computation Gain scores (-.238 *) and Total MathGain scores (-.278 **) than those attending earlier.
4) Implementation of the Kumon Method
The way in which the Kumon program was executed also differed. The BellGardens Math instructor modified the method slightly by allowing students tohave greater control over the time at which the mastery test was taken. Thatis, students were allowed to prove mastery of a given level when they feltthey were ready. This introduced into the Kumon method an element of "learnercontrol" (Hannafin and Peck, 1988), a highly desirable characteristic ofinstructional programs. Yet, it should be understood that students were notpermitted to advance themselves to the next level, but simply have the freedomto take a level mastery test prior to completing all of the packets belongingto that level.
,
32
This element, however, does not characterize the Kumon method in its current
form. The Kumon method is linear in its approach to instruction, therefore,
once a student is placed into the appropriate level, there is no deviationfrom a prescribed sequence of levels and materials. The learn does not have
the option of taking the mastery test prior to the completion of packets for
that given level.
Interpretation of Results
While tho results were not dramatic, the Kumon Method did appear to have
positive effects upon a segment of the students participating in the study.
It was apparent from studying the seventh grade CAT pre and post test scoresthat significant improvement had been made. (See Tables 3 thru 5) Studentsmoved from the 6th percentile rank during their pretest to the 10th percentile
during the post test in Math Computation.
Although eighth graders did not experience a similar increase, eighth graders
maintained their percentile rank, indicating that they, at least, experienced
an expected amount of progress in mathematical skill over the duration of this
study. Since these studens were mathematically several grade levels behind
upon entry into this Kumon program, the maintenance of mathematical gradelevel should be viewed positively as the normal expectation is that students
below grade level tend to fall further behind over time.
The results obtained characterize Kumon instruction in a public setting during
an initial eight month stage only. The amount of improvement may have beengreater than that reported here if the study had extended over a longer period
ef time.

gcr
lila 111111 III GNI 1111 MN MID NI 11111 Ell IN NS INS IMO IN

34
A PPE NDDC A
FREQUENCY DISTRIBUTIONCAT MATH COMPUTATION LAIN SCORES
FREQUENCY DISTRIBUTION OF 1400/GN
CLASS FREQ FREQINTERVAL 4- 4-20 - 29 1 .9730 - 39 3 2.9140 - 49 6 5.8350 - 59 9 8.7460 .. 69 11 10.6870 - 79 19 18.4580 - 89 11 10.6890 - 99 12 11.65100 - 109 12 11.65110 - 119 8 7.77120 - 129 7 6.8130 - 139 2 1.94140 - 149 0 0150 - 159 0 0160 - 169 1 .97170 - 179 1 .97
> 180 0 0
Note: A gain scare of 70 represents no gain. Gain scoresbelow 70 signify negative gains, while those above 70reiresent positive gains.
4.;
35
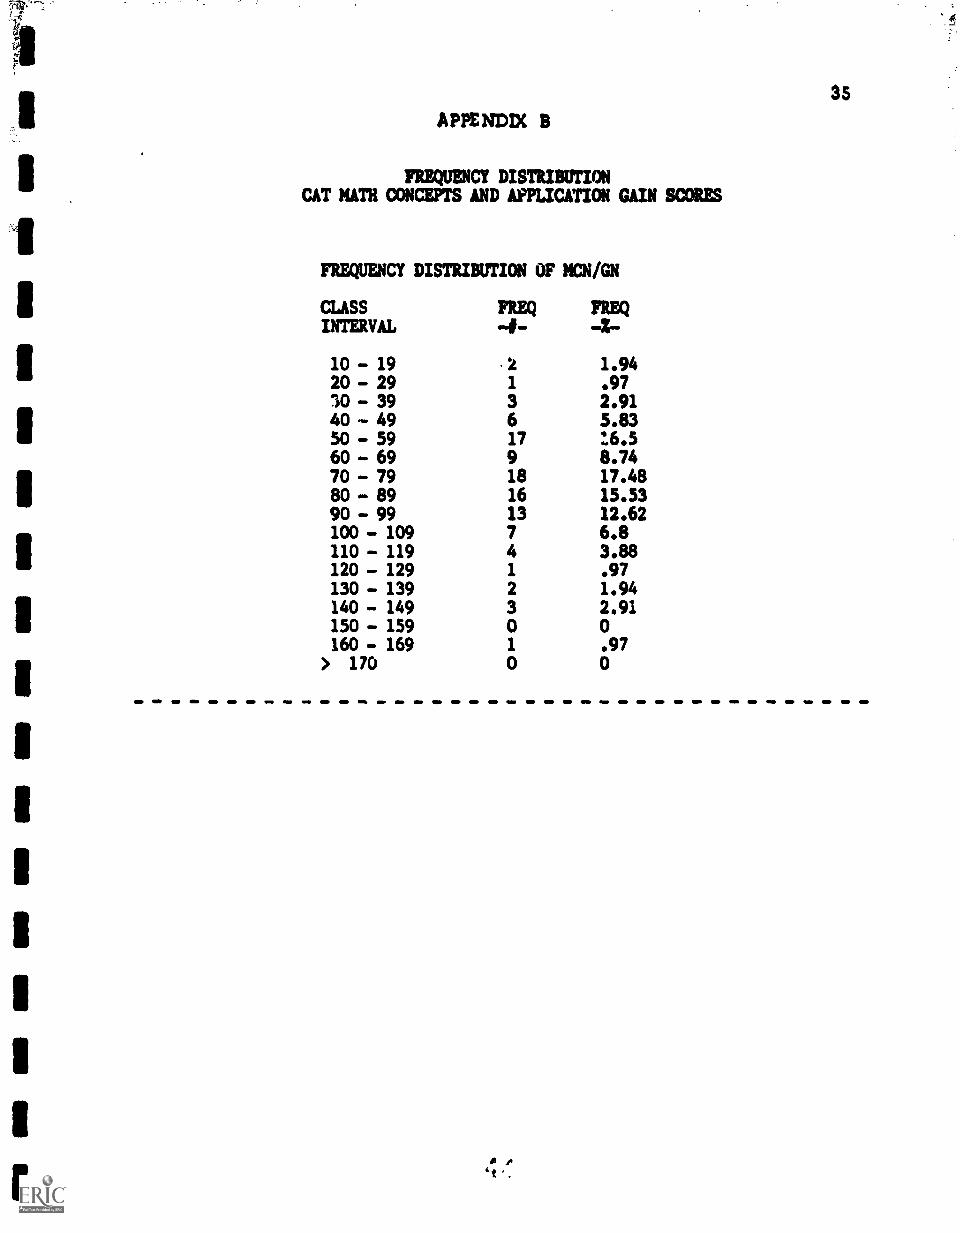
APPENDDC B
FREQUENCY DISTRIBUTIONCAT MATH CONCEPTS AND APPLICATION GAIN SCORES
FREQUENCY DISTRIBUTION OF MCN/GN
CLASS FREQ FREQINTERVAL 4- 4-10 - 19 .2 1.9420 - 29 1 .9730 - 39 3 2.9140 - 49 6 5.8350 - 59 17 :6.560 - 69 9 8.7470 - 79 18 17.4880 - 89 16 15.5390 - 99 13 12.62100 - 109 7 6.8110 - 119 4 3.88120 - 129 1 .97130 - 139 2 1.94140 - 149 3 2.91150 - 159 0 0160 - 169 1 .97
> 170 0 0
36
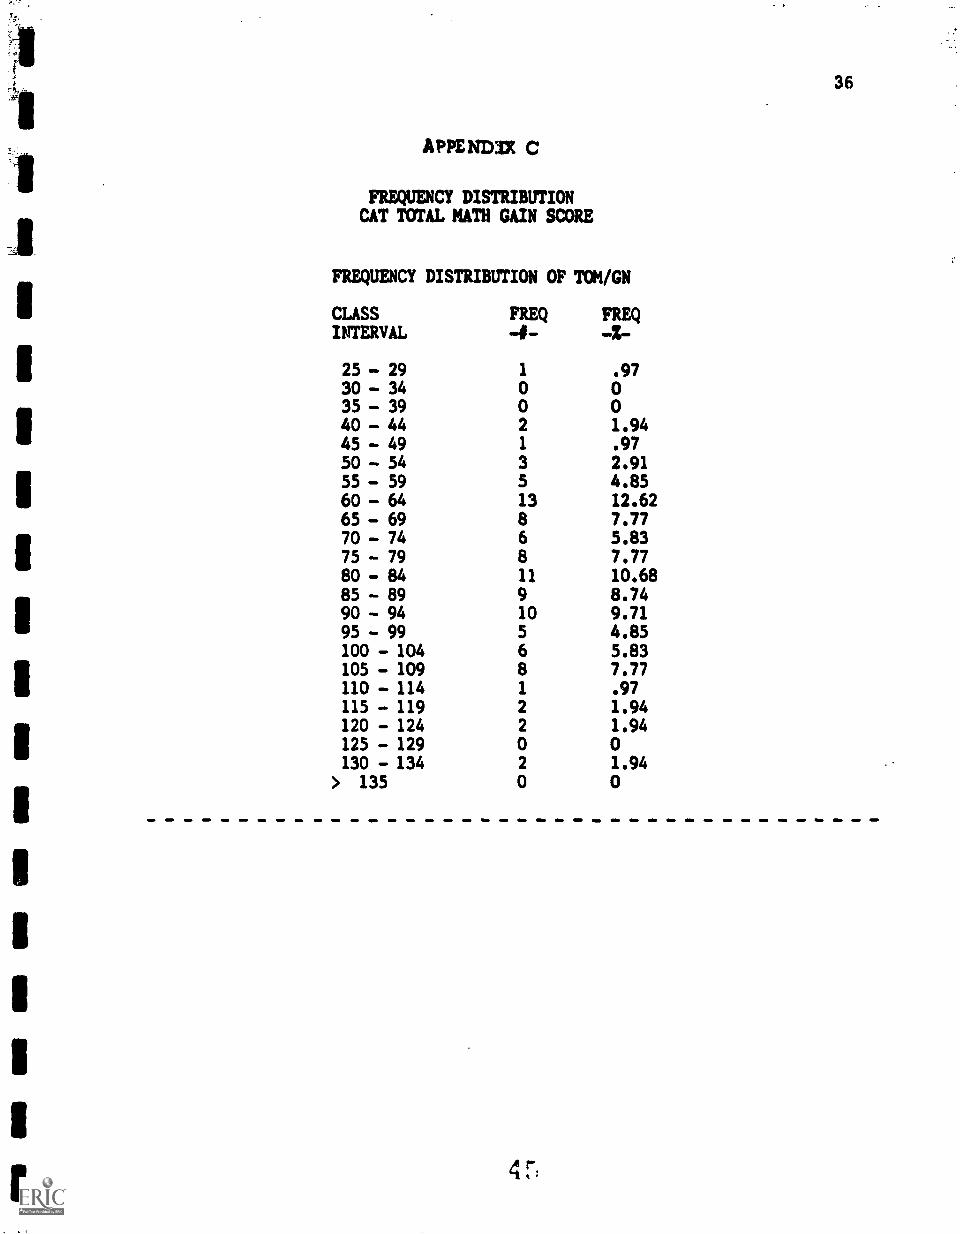
A PPE ND:IX C
FREQUVICY DISTRIBUTIONCAT TOTAL MATH GAIN SCORE
FREQUENCY DISTRIBUTION OF TOM/GN
CLASS FREQ FREQINTERVAL
25 - 29 1 .9730 - 34 o o35 - 39 o o40 - 44 2 1.9445 - 49 1 .9750 - 54 3 2.9155 - 59 5 4.8560 - 64 13 12.6265 - 69 a 7.7770 - 74 6 5.8375 - 79 8 7.7780 - 84 11 10.6885 - 89 9 8.7490 - 94 10 9.7195 - 99 5 4.85100 - 104 6 5.83105 - 109 a 7.77110 - 114 1 .97115 - 119 2 1.94120 - 124 2 1.94125 - 129 o o130 - 134 2 1.94
> 135 o o
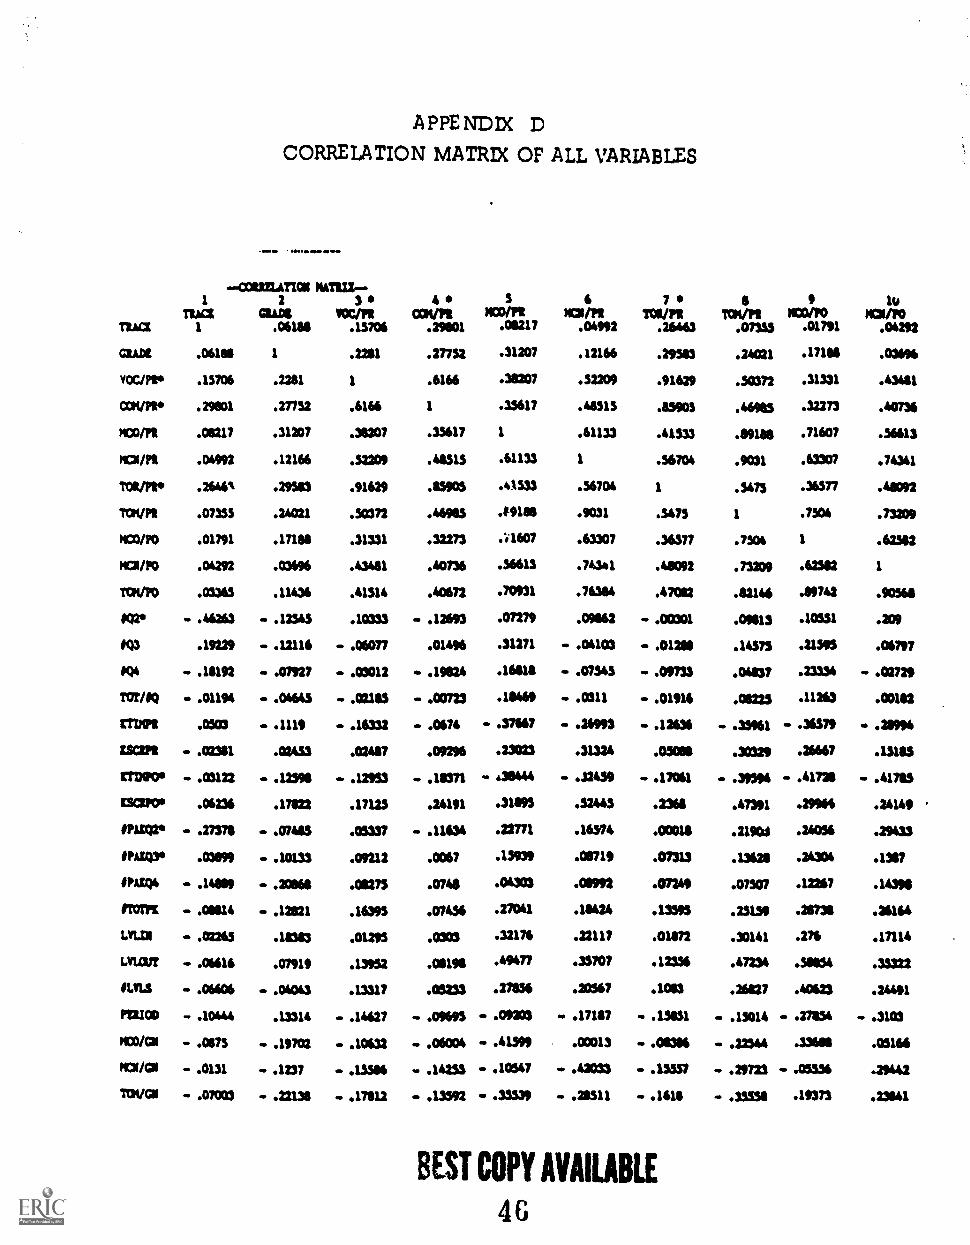
A PPE ND IX D
CORRELATION MATRDC OF ALL VARIABLES
.Owsw 61
42310.1.611131 2411170.1 2 3
MCC MAN /00/711.13706
.2211
1
.6166
.21237
.52209
.91629
.30372
.31331
.43481
.41514
.10333
.06077
.03012
.02185
.1032
.02417
.12933
.17123
.05337
.09212
.0127S
.16395
.01293
nu.13317
.14627
.10632
.13546
.17112
TRACI 1 .06184
ClAbe .06188 1
VOC/140 .15706 .1281
CCVVW .29801 .27752
ROOM .08217 41207
MOI/P11 .04992 .12166
TOR/P1' .2646% .29513
111WPIt .0705 .2A011
1C0/70 .01791 .17196
1401/P0 .04292 .03696
TOVIV .03365 .11436
Mr .4620 .1230
.19129 .12116
104 .18192 .07927
TOMQ .01194 .04645
[TIM .0503 .1119
LSC139 .01381 .02433
MVO° . .0122 .12S%
TSCV04 .06236 .17122
0711127$ .27378 .07415
OPALQ3s .03199 .10133
0404 . .14899 .20161
AVM .08814 .12221
LAU .0220 .11313
LVLCVT .06616 .07919
AVIS .06406 .0043
MIOD .10444 .13314
14111/(31 .003 .19702
P031/C11 .0131 .1237
MVO, .07003 .22138
400201
3P100/72
61131/71
710/P1
11334/P1
920/70
1110
101/10.29101 .0017 .04992 .26463 .07355 .01791 .0092
.27731 .31207 .12166 .29513 .24021 .17118 .036%
.6166 .38207 .32209 .91629 .30372 .31331 .43441
1 .33617 .48513 .115905 .46985 .32273 .40726
.35617 1 .61133 .41333 .19181 .71607 .36613
.44313 .61133 1 .56704 .9031 .63307 .74341
.85905 .41533 .56704 1 .5473 .36577 .48092
.46983 .19188 .9031 .5475 1 .7504 .73209
.32273 .*:1607 .63307 .3607 .7504 1 .62342
.40736 .56613 .74341 .41092 .73209 .62382 1
.40672 .70931 .76384 .47082 .42146 .19742 .90561
.12693 .07279 .09122 .00301 .09813 .10251 .209
.01496 .31271 .0003 .01218 .14573 .21395 .06797
.19824 .16111 .07343 .09733 .06837 .23334 .02729
.0023 .18469 .0311 .0116 .0225 .11263 .001112
.0674 .3760 .2093 .12636 .35961 .3609 .219%
.09296 . non .31324 .03098 .313329 .26667 ,13163
.18371 40444 .22459 .17061 .39594 .41731 .4170
.24191 .311195 .52443 .2364 .47E291 .29966 .24149
.11634 .28771 .16374 .00011 .219013 .24056 .29433
.0067 .13939 .0019 .07313 .1360 .2001 .1387
.0748 .04303 .01992 .07249 .07307 .12267 .14398
.07436 .2700 .10424 .13395 .25139 .1032 .36164
.0303 .32176 .32117 .01072 .30141 .276 .17114
.08191 .49477 .33707 .12356 .47234 .31134 .33322
.05n3 .27136 .2067 .1083 .26137 .40623 .24491
.09695 .0920 .17117 .1301 .15014 .2704 .3103
.06004 .41399 .00013 .08386 .22344 .33649 .05166
.14235 .10547 .4033 .15557 .29725 .0036 .29442
.13592 .35.50 .21311 .1611 .3508 .19373 .23141
BEST COPY AVAILABLE
46

11101/10
.0330
120.46263
1 13
.19229
14/06
.16192
IS1171VOQ
.01194
16apn.050
170001
.023111
IS 11ETWO
.03122
190020
.06236
20/PA=
.2737$
.11436 .12343 .12116 .07927 .01643 .111 .0203 .12396 .17122 .0740
.41314 .10333 .06077 . .03012 . .0210 .163 .02417 .12933 .17123 .03337
.40672 . .12693 .01496 .19624 . .00713 .067 .09296 .10371 .24191 .1104
.70931 .07279 .31271 .1661S .111669 .3740 .0013 . .36444 103 42771
.76364 .09662 .0610 .07345 .out .269! .31324 42439 .52443 .1074
.47012 .00301 .0120 .00733 .01916 .121k .03091 .17061 .2366 .000111
.82146 .09613 .14373 .007 .011223 .3391 .3029 .39394 .47391 41903
.0742 .1001 .21393 .23334 .11263 363.. .26667 .41728 .29966 .24056
.90366 .209 .06797 .02729 .00162 .131115 .41713 44149 .29433
1 .17433 .13629 1106 .01213 .36.V .2304 .43977 .29646 .29637
.17433 1 .16143 .37$011 .73397 .1631 .03607 .02023 .00963 .37117
.13629 .16143 1 .33119 .69074 .0721 .0406 . .16204 .01101 .02311
.1106 .37= .33119 1 .31993 .03139 .0201 .07629 .01132
.06263 .73397 .69974 .36993 1 .1371 .14064 .17972 .0213 .2260
.36332 .1630 .07243 .02433 .13743 I .14431 .0376 .14368 .0301$
.2306 .03107 .06406 .03139 .14064 .144: 1 .02339 .36762 .10241
. .0977 .0200 .16201 .0061 .17972 .3637 AM 1 .24066 .06331
.29646 .00963 .01101 . .07629 .0213 .1436 .367112 .24061 1 .07071
.29637 .37117 .02311 .002 .22101 .001 .10241 .06531 .07076 1
.21026 .29293 .01331 .13726 .44314 .067 .0606 .03676 .01632 .00433
.14721 .01361 .11363 .11397 .27336 .0131 .01619 .00339 .011013 .03214
.30126 .12326 .22114 .06123 .21963 .0393 .01693 .11314 .01161 .72300
.007 .03149 .0623 .07036 Ana .4927 .23639 .36323 .2471 .311147
.3102 .007 2202 .13067 .16464 .33111 .1007 .43746 03393 .31107
.3309 .02711 .1061 .07347 .21791 .00r .0014 . .17761 .1649 .49673
.32319 .031$9 .0262$ .007 .10630 .0633 .019 .01363 .0631 . .00723
41237 .04727 .14016 .07714 .1616 .0313 .0306 .02363 .03966 .03136
.13726 .11961 .13064 .07076 .0101 .0076 44137 .10336 .4331 .1=3
.2409 .11091 .00611 .0094 .03702 .0162 33636 .011633 .31957 .10611
BEST COPY AVAILABLE
47

21
OP143
32RAF44
13norm
241.111.11
ISMOUT
26 27PIRKO MCO31C11 WIZ 3°1091/1111
.031199 JON .0111114 .02203 .06616 .06606 .10644 .0673 .0131 .070113
- .10133 JOIN .12621 .10393 07919 .01043 .13314 . .19702 .1237 .22138
.09212 .01275 .111619, .01295 .13932 .13317 44027 .10633 .13316 .17112
.0017 .0744 .07454 .0303 .06196 .03233 .09693 .06004 .14255 .13392
.13930 .0303 .27061 .32176 .49477 .271136 .0920 .41399 . .10347 .3539
011719 .01092 .11424 .22117 .33707 .20367 .17117 .00013 .4= .21311
.07313 .07249 .13393 .01171 .12136 AOC .13131 .01366 .13557 .1611
.136211 .07307 .23139 .30141 .47234 26027 .13014 . .22364 . .29723 .35354
.2430 12267 .20230 .276 .5111134 .40613 .27134 .116611 .05336 .19323
.1317 .14394 .36164 .17114 .35311 .24491 .3103 .05166 .29442 .23141
.21026 .14721 .30620 .24637 .31172 .35439 .31319 .21237 .13726 4409
.29293 .01361 .12326 .03249 .0047 .03271 .03199 .04727 .11966 .11091
.0133$ .11363 .22114 .04623 .21532 .111362 .03828 .14066 .13014 .00111
43726 .11397 .06123 .07034 .13047 .07347 .0062 .07714
00 76 7702.44314 .27336 .21963 .06626 .16414 .21791 .10696 97613024
.06676 .06319 .05935 .49272 .321111 .003n - .06351 .03133 .1:0768
A66% .01E9 .01693 .23429 .10067 .02%4 Aso .03686 - .34137 .131136
.03676 .00539 .11314 .. .31323 .43746 .17761 .01363 .02363 . .10526 .01633
.011152 .04013 .011111 .2471 .3395 1649 .0651 .03961 .4331 - .31937
.0043 .03214 anal .. .31947 .32107 .49973 .00723 . 031311 -MSS .10611
1 .33419 .4005 .07299 2903 .26191 .23263 .10099 .06224 .11116
.33419 1 .31327 .0142 .3296 .32328 .16739 .10177 .06646 .1133
.4005 .39327 1 .11334 .49734 .63421 .16261 9.619999443 .0917 .07047
.07299 .01462 .21314 1 .313011 .29643 .0146 .07446 . .01313 .10146
.291113 .3294 .49734 .311301 1 .7637 .06312 .09936 .03101 .06627
.26191 .32326 .634211 . .29610 .7637 1 .02232 .133411 .0301 .13114
.23263 .16739 .16261 .0646 .06312 .02232 1 .23174 . .1734 .27139
.10099 .10177 .6499991143 .07446 .09936 .13341 .13674
1.06969
. 069% .73171
.06224 .06646 .0917 .01310 .03101 .03139 .1734 1 .73012
.11116 .1133 .07067 .101111 .13114 .27139 .73176 .73012 1
slug COPY AVAILABLE
48
38
IX REFERFXCES
Guilford, J. (1956) Fundamental statistics in _psTcholoss and education.New York $ McGraw.Mill Book Company.
Hannafin, M. & Peck, I. (1988) The desisn, development, and evaluation ofinstructional software. New York : Macmillan PUblishins Company.
4 9

1 Dept. of Education
Office of Educationalsearch and Improvement (OERI)
ON
IMMM INI ut
Date FilmedInteamhPr 94 1c14;41