A STRUCTURAL HEALTH MONITORING (SHM) APPROACH USING …
12
Proceedings IRF2020: 7th International Conference Integrity-Reliability-Failure. J.F. Silva Gomes and S.A. Meguid (editors), INEGI-FEUP (2020), pp.491-502. https://paginas.fe.up.pt/~irf/Proceedings_IRF2020/ -491- PAPER REF: 16534 A STRUCTURAL HEALTH MONITORING (SHM) APPROACH USING A MULTIDISCIPLINARY DIGITAL TWIN FOR HIGH-PRESSURE TURBINE DISCS IN CIVIL AVIATION Tolga Yağcı 1(*) , Klaus Höschler 1 , Stephan Pannier 2 , Sven von Ende 2 1 Brandenburg University of Technology, Cottbus, Germany 2 Rolls-Royce Deutschland, Dahlewitz, Germany (*) Email: [email protected] ABSTRACT The health status of an aircraft rotating turbine component depends heavily on the flight profiles flown by the operator. In contrast of this dependency, the declared Low Cycle Fatigue (LCF) life is typically determined for a designed flight profile, which is representative for most fleet flight profiles. A significant improvement in component utilization without compromising safety can be achieved by using Engine Health Monitoring (EHM) data in order to monitor the LCF life by means of a digital engine twin. This paper is focussed on the development of a digital twin for a Civil Small and Medium Engine (CSME) and the structural health monitoring (SHM) of LCF life. The digital twin combines analytical models from multiple disciplines such as system performance, thermals and structures and aims to connect operational data to the component’s accumulated damage. This enables individual monitoring of the component’s health status, and prediction of Remaining Useful Life (RUL). Keywords: structural health monitoring, digital twin, critical parts, fatigue monitoring, remaining useful life, safety assessment. INTRODUCTION One of the most important components of an aero engine when it comes to safety is the High Pressure Turbine (HPT) disc as it is exposed to harsh operating conditions such as fatigue, creep, or corrosion [1]. As opposed to military aircrafts, structural health monitoring (SHM) is currently not widely applied for critical components in CSMEs [2]. In some cases a surrogate model is manually setup once with performance, thermal and structural analysis of a training flight profile, which aims to comprise many manoeuvres. Afterwards this surrogate model, called cycle counter, is applied to predict the stress and temperature histories. Besides the high manual effort for the setup, not all possible manoeuvres are included in the training profile and consequently are not represented in this model. Therefore this model is to be more conservative, which may lead to an overestimation of the accumulated damage resulting in a higher life cycle cost. It is also limited to certain monitored positions or a rough local presentation of the monitored disc. A more flexible way to deal with various EHM data, which monitors crucial operational parameters of an engine, is by the utilization of a multidisciplinary digital twin [3], [4]. This approach automates the Finite Element Method (FEM) analyses of a real flight thus guaranteeing that no manoeuvre is missed, opposed to the cycle counter, which may extrapolate damage differently. In this paper, the composition of multiple disciplines like performance, thermals, structure, and lifing into a digital twin is presented for the Rolls Royce BR725 aero engine which is used in business jets like the Gulfstream G650 aircraft.
Transcript of A STRUCTURAL HEALTH MONITORING (SHM) APPROACH USING …

Proceedings IRF2020: 7th International Conference Integrity-Reliability-Failure.
J.F. Silva Gomes and S.A. Meguid (editors), INEGI-FEUP (2020), pp.491-502.
https://paginas.fe.up.pt/~irf/Proceedings_IRF2020/
-491-
PAPER REF: 16534
A STRUCTURAL HEALTH MONITORING (SHM) APPROACH USING A MULTIDISCIPLINARY DIGITAL TWIN FOR HIGH-PRESSURE TURBINE DISCS IN CIVIL AVIATION Tolga Yağcı1(*), Klaus Höschler1, Stephan Pannier2, Sven von Ende2
1Brandenburg University of Technology, Cottbus, Germany 2Rolls-Royce Deutschland, Dahlewitz, Germany (*)Email: [email protected] ABSTRACT
The health status of an aircraft rotating turbine component depends heavily on the flight profiles flown by the operator. In contrast of this dependency, the declared Low Cycle Fatigue (LCF) life is typically determined for a designed flight profile, which is representative for most fleet flight profiles. A significant improvement in component utilization without compromising safety can be achieved by using Engine Health Monitoring (EHM) data in order to monitor the LCF life by means of a digital engine twin. This paper is focussed on the development of a digital twin for a Civil Small and Medium Engine (CSME) and the structural health monitoring (SHM) of LCF life. The digital twin combines analytical models from multiple disciplines such as system performance, thermals and structures and aims to connect operational data to the component’s accumulated damage. This enables individual monitoring of the component’s health status, and prediction of Remaining Useful Life (RUL). Keywords: structural health monitoring, digital twin, critical parts, fatigue monitoring,
remaining useful life, safety assessment.
INTRODUCTION
One of the most important components of an aero engine when it comes to safety is the High Pressure Turbine (HPT) disc as it is exposed to harsh operating conditions such as fatigue, creep, or corrosion [1]. As opposed to military aircrafts, structural health monitoring (SHM) is currently not widely applied for critical components in CSMEs [2]. In some cases a surrogate model is manually setup once with performance, thermal and structural analysis of a training flight profile, which aims to comprise many manoeuvres. Afterwards this surrogate model, called cycle counter, is applied to predict the stress and temperature histories. Besides the high manual effort for the setup, not all possible manoeuvres are included in the training profile and consequently are not represented in this model. Therefore this model is to be more conservative, which may lead to an overestimation of the accumulated damage resulting in a higher life cycle cost. It is also limited to certain monitored positions or a rough local presentation of the monitored disc. A more flexible way to deal with various EHM data, which monitors crucial operational parameters of an engine, is by the utilization of a multidisciplinary digital twin [3], [4]. This approach automates the Finite Element Method (FEM) analyses of a real flight thus guaranteeing that no manoeuvre is missed, opposed to the cycle counter, which may extrapolate damage differently. In this paper, the composition of multiple disciplines like performance, thermals, structure, and lifing into a digital twin is presented for the Rolls Royce BR725 aero engine which is used in business jets like the Gulfstream G650 aircraft.

Track-I
Civil and Structural Engineering Applications
-492-
THE URGE OF SHM
In general, mechanical systems are designed for certain conditions and based on assumptions about the operation which are monitored for their appropriateness during service. If real operation is less demanding, the system’s behavior may change, and will lead to a higher life than expected. For CSME it is common that the design assumptions are chosen to be a representative quantile of all flights, for instance 95%-quantile might be an appropriate assumption. The design assumptions need to be monitored in service and preferable crucial engine parameters are measured directly like Turbine Gas Temperature (TGT). It needs to be checked that the distribution of those parameters does not exceed the design assumptions, see Figure 1, otherwise action needs to be taken. It can be seen that as intended only a small percentage of flights will reach the designed temperature, but for all other flights the temperature stays well below which provides a considerable margin for the RUL. While the evaluation for measured engine parameters like TGT is straightforward the generation of such a graph for damage and life using surrogate models is expensive and time consuming and also might be too conservative. A more viable option is the utilization of a digital twin presented in this paper.
Fig. 1 - Principle distribution of TGT across the fleet
A strategy to track component’s damage and predict RUL is SHM [1]. It has become popular in many different industries like infrastructure, e.g. bridges and dams, naval industry, and as exemplified in this paper in aviation industry [2], [3], [4]. Stolz and Neumair partitioned SHM into the following four main parts [5].
1. Event monitoring 2. Fatigue monitoring 3. Remaining life assessment 4. Damage detection monitoring
Event monitoring is the process of observing in real-time flight parameters which may lead to structurally significant events whereas fatigue monitoring in the light of aircraft engines utilises stored flight data for the calculation of current system damages [6], [7]. With the assumption of future flight profiles based on the current damages the RUL can be predicted. In order to assure safe operation damage detection monitoring is being assessed with periodic inspections. These frequent inspections enable the detection of failure cases, which are hard to predict, like wear, tear or corrosion [5]. This paper focuses mainly on fatigue monitoring.
In SHM for aviation, most of the past work was conducted for military aircrafts due to frequently changing flight missions featuring numerous and harsh manoeuvers. However, civil aircrafts and especially private jets like CSME with widely varying flight profiles and very high

Proceedings IRF2020
7th International Conference Integrity-Reliability-Failure
-493-
usage diversity can benefit from this knowledge. In analogy to [5], on the one hand severe usage may lead to a rise of an early end of life (EOL) risk whereas this risk can be lowered to an acceptable value with appropriate SHM actions, as shown in Figure 2. On the other hand less demanding usage may extend residual life. With the utilization of SHM these benefits can be gained and the overall life cycle cost lowered.
Fig. 2 - Benefits of structural health monitoring, in analogy to (Stolz and Neumair 2010)
During the last decades SHM has become an important strategy to ensure safety and reliability during the intended operations of a structure with economical cost for maintenance of aircrafts. However, no SHM approach has been introduced to CSME since at the moment it is not possible to measure stresses and temperatures at turbine discs due to extremely high temperatures. This paper presents a method to address SHM for CSME HPT discs without implementing additional sensors. The thermal and structural loads are obtained via a digital twin approach, mirroring the flight condition into a simulation model. Subsequently, stresses and temperatures go into a damage calculation. This way the current state of a turbine disc can be evaluated and if necessary, action can be taken.
STRUCTURE OF THE DIGITAL TWIN
The digital advancements over the last decades enable to pursue new strategies especially by means of digitalization. One of these methods is the digital twin which is a digital model of a physical system modelling its real operations. These may be used either for simulations of future or past operations. With the matched operations, additional information, like stresses and temperatures in the disc throughout the flight, can be extracted from the digital twin [8].
For modern aero engines, EHM data is measured and stored for every flight. A set of more than 200 sensors with sampling rates of 1 Hz or higher describes the operation of an engine. This is the input for the digital twin, as depicted in Figure 3. The monitored data will be used for performance, thermal, and structural calculations. The major steps of the digital twin will be discussed in the following.

Track-I
Civil and Structural Engineering Applications
-494-
Fig. 3 - Main structure of the turbine disc digital simulation twin
EHM data
In EHM systems sensor data is stored to identify the current and future health state of an engine based on measurements. Data is recorded for many different fields like performance, vibration, or oil system. For the digital twin at hand not all sensor data is needed. In a performance calculation the thermodynamic state for the current time point is needed and can be summarized with the following input parameters:
• Altitude and thereby the atmospheric pressure • Atmospheric temperature given by the temperature after inlet T20 • Velocity represented by the Mach number • Bleed flows for cabin, cowl anti-icing, and wing anti-icing
Normally the Full Authority Digital Engine Control (FADEC) controls the parameters and sets the actuator positions for valves and fuel flow and thereby controls the spool speeds based on the Engine Pressure Ratio (EPR). However, for the purpose of damage assessments of the HPT disc with the digital twin the HP spool speed is a more reasonable control parameter since this parameter mainly drives stresses in the disc. This work is done in preparation for the performance model.
Representation
The representation method is used since the selected data is stored with a sample rate of 1 Hz for each parameter resulting in an excessive amount of data. To reduce computation time whilst guaranteeing an acceptable quality key points are selected that assure a close representation of the initial flight envelope with far less points.
For this step an adaptive piecewise linear approximation method was used which is based on [9]. Given is a maximum tolerance g ∈ ℝV and a time series � � = {G¢�, «�J, G¢/, «/J, … , G¢�, «�J | ¢ < ¢ V�, ¢ , « ∈ ℝ , �, Õ ∈ ℕÓ

Proceedings IRF2020
7th International Conference Integrity-Reliability-Failure
-495-
The algorithm sets an initial linear representation o� of � with the first G¢�, «�J and last G¢�, «�J points and interpolates linearly between «� and «�.
o�G¢ J = «� − «�¢� − ¢� ¢ + «�
Afterwards, for all � ∈ Õ the distance = o�G¢ J − �G¢ J is calculated. The time point ¢M is identified where the distance between o� and � is a maximum (max ∈� ) and greater than g.
The interval [¢�, ¢�] is split in two new intervals [¢�, ¢M] and [¢M , ¢�] and a linear representation of � is defined for each interval. This process is repeated for all intervals �¢h , ¢�� ⊆�¢�, ¢�� :, ∈ ℕ, which are an arbitrary interval in [¢�, ¢�]. A linear representation for each interval �¢h , ¢�� is defined as
oG¢ J = «� − «h¢� − ¢h G¢ − ¢hJ + «h
and the time point ¢M is identified where the distance between o and � is a maximum max ∈�h,�� oG¢ J − �G¢ J and greater than g. The interval [¢h , ¢�] is split in two new intervals [¢h , ¢M]
and [¢M , ¢�]. This process deteminates if the distance in all intervals is smaller than the user- defined tolerance.
In Figure 4, the initialization step, the first two steps and the final step of the algorithm is depicted for the normalized spool speed of an example flight envelope. The full flight is shown in red, whereas the blue curve is the sampled representation, and the green curve is the difference between the original one and its representation. The horizontal black lines are the threshold lines for user defined maximum tolerance.
Fig. 4 - Example of the representation method for the spool speed, top left: initialization step, top right: first step, bottom left: second step, bottom right: final representation
Track-I
Civil and Structural Engineering Applications
-496-
One can clearly see how the representation starts with 2 points and adds more points to reduce the difference until it converges. It is also noticeable that in areas with high fluctuations more points are added while in areas with little fluctuations points are added more rarely. This is exactly the behavior that is aimed for. The compression rate for this example is above 95 % with a maximum tolerance of 1 %. Higher compression rates can be achieved by raising the maximum tolerance.
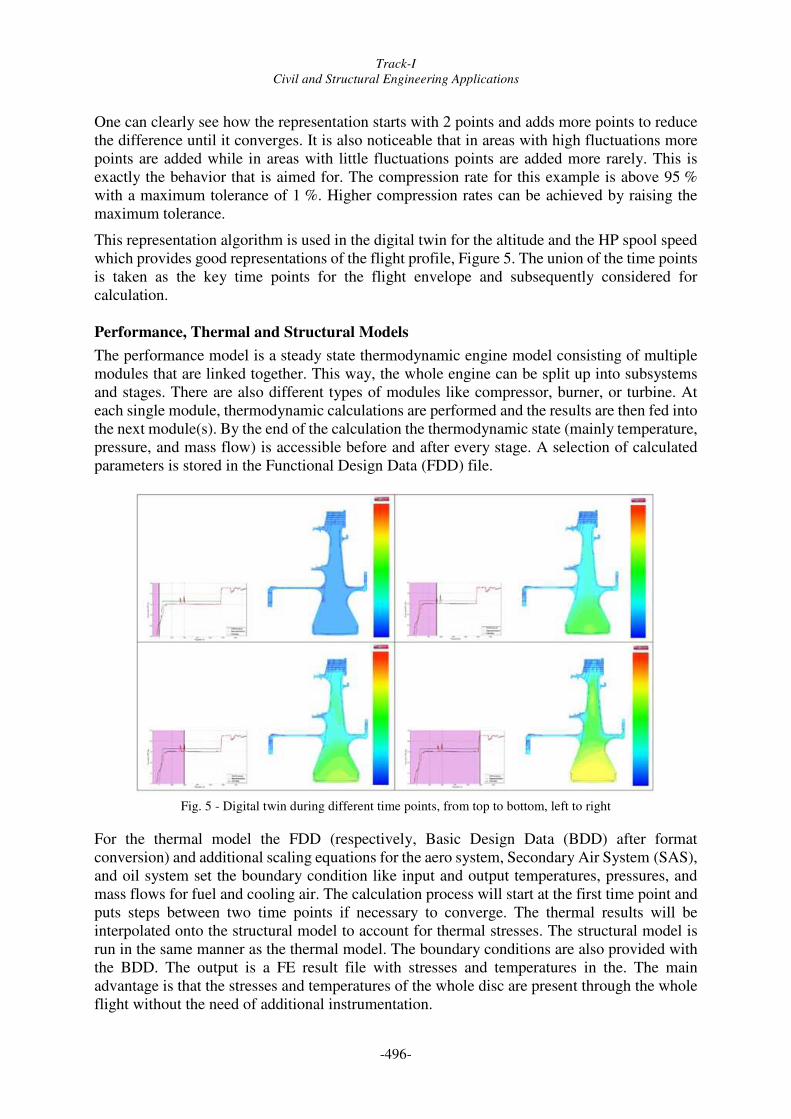
This representation algorithm is used in the digital twin for the altitude and the HP spool speed which provides good representations of the flight profile, Figure 5. The union of the time points is taken as the key time points for the flight envelope and subsequently considered for calculation. Performance, Thermal and Structural Models
The performance model is a steady state thermodynamic engine model consisting of multiple modules that are linked together. This way, the whole engine can be split up into subsystems and stages. There are also different types of modules like compressor, burner, or turbine. At each single module, thermodynamic calculations are performed and the results are then fed into the next module(s). By the end of the calculation the thermodynamic state (mainly temperature, pressure, and mass flow) is accessible before and after every stage. A selection of calculated parameters is stored in the Functional Design Data (FDD) file.
Fig. 5 - Digital twin during different time points, from top to bottom, left to right
For the thermal model the FDD (respectively, Basic Design Data (BDD) after format conversion) and additional scaling equations for the aero system, Secondary Air System (SAS), and oil system set the boundary condition like input and output temperatures, pressures, and mass flows for fuel and cooling air. The calculation process will start at the first time point and puts steps between two time points if necessary to converge. The thermal results will be interpolated onto the structural model to account for thermal stresses. The structural model is run in the same manner as the thermal model. The boundary conditions are also provided with the BDD. The output is a FE result file with stresses and temperatures in the. The main advantage is that the stresses and temperatures of the whole disc are present through the whole flight without the need of additional instrumentation.

Proceedings IRF2020
7th International Conference Integrity-Reliability-Failure
-497-
In Figure 5 different steps of an example flight during the taxi and take off phases are depicted. Each figure shows a time point during the flight mission and the matching spool speed on the left and the stress distribution of the first principle stress in the engine disc on the right. The first figure (top left) shows the initial condition of the disc at engine start with almost no stresses. At the second time point (top right) the HP spool speed has its first little peak during the taxi phase resulting in a raise of stress in the whole disc, especially in the bore region. The same is true for the third time point (bottom left). There is a second even bigger peak in the taxi phase, again leading to higher stresses. The last depicted time point (bottom right) is during the take-off phase. One can see a fully stressed bore and another peak stress location in the diaphragm.
Data Extraction and Life Assessment
The information from the FEM result needs to be post-processed in order to obtain the predicted safe lives and the damages based on the calculated flight profile. Therefore the temperature and stress results as well as mesh information are written into a HDF5 file. This step enables the life assessment to be independent from the FE software.
The life assessment is carried out with the safe life approach. This strategy is based on testing similar features representative for the engine feature in a full scale component spin test. This test is assumed to be a conservative sample from the population. The calculated engine stresses and temperatures are then compared against the once measured/calculated in the spin test resulting in a component life [10].
DEMONSTRATION OF THE DIGITAL TWIN
The usage of the digital twin is shown for two different flight profiles. The two flights are depicted in Figure 6.
Fig. 6 - Two example flights (flight 1 left, flight 2 right), altitude and HP spool speed

Track-I
Civil and Structural Engineering Applications
-498-
Flight 1 is characterized with a smooth profile with only 1 long cruise phase. The flight length is approximately 6000 seconds. However, during the descent and especially approach phase the HP spool speed shows some fluctuations due to the non-static manoeuvres. The maximum altitude is at 43000 ft. On the other hand, flight 2 has a total flight length of around 2000 seconds in which it shows 3 cruise phases at different altitudes. The maximum altitude at this flight is 13000 ft. As a comparison, one can say that the parts of the flights until the descent phases the spool speed are much smoother for flight 1 than in flight 2 but for the descent phase the amplitude of fluctuations of flight 1 become greater than for flight 2.
The different flight profiles influence also the component stresses in different features. This shall be exemplified by three features in the HPT disc 1, bore as feature 1, rear drive arm fillet as feature 2, and diaphragm fillet as feature 3 for which the most damaging points are considered, see Figure 7. All these features classify with different stress spectra. While the bore is mainly stressed by hoop perpendicular to the cross section which is influenced by the centrifugal force and thereby the spool speed, the rear drive arm is driven by bending. The diaphragm fillet is sensitive to harsh changes in the temperature of the air flow.
Fig. 7 - Selected features for the HPT disc 1
Figure 8 shows the stress curves of each feature for both flights normalised by the maximum stress from the designed mission. During the first flight one can see a strong increase for the bore stress during the taxi phase which seems to stablize at around 0.4. Also both spool speed peaks are clearly noticeable. It has to be mentioned that the time before engine start is not included for the stress curves. The maximum normalised stress is during take-off at around 1.05 and stabilises after the climb phase at around 0.9. The other two features are at a lower overall stress ratio level than the bore. It can also be seen that the normalised stress for the other two features is not as heavily dependent on the HP spool speed as it shows a drop during the taxi phase. For the take-off and climb phase a small delay is noticable compared to the bore. All normalised stress curves, however, show high fluctuations during the descent and approach phase, which is due to the constantly changing conditions.
For flight 2, the normalised bore stress is again at a much higher level than the drive arm and diphragm and also shows a strong dependency to the HP spool speed. The two high spool speed

Proceedings IRF2020
7th International Conference Integrity-Reliability-Failure
-499-
plateaus are clearly evident in the bore stress. During the first half of the flight the other two features show similar behaviour as in the first flight. With the spool speed drop after the major cruise phase, however, the characteristics appear to be different. While there is a small decrease in normalised rear drive arm fillet stress, the diaphragm fillet stress increases significantly. This is due to the thermal stresses which dominate for the diaphragm fillet. While the bore of the disc is still hot the upper part cools down quite fast as cold air passes the gas path. The opposite takes place as the spool speed increases for the next cruise phase, leading to a high gas path temperature while the bore was cooled down. The descent and approach part is again dominated by the fluctuations but this time being much smaller compared to the previous flight.
Fig. 8 - Normalised first principle stress curves of all features for both flights (flight 1 left, flight 2 right)
The damage values of both flights compared to the designed damage values for all features at both flights are given in Table 1. These values can also be interpreted as multiples of the designed flight mission damage. In general, all damage ratios are above 1 meaning that for each location the accumulated damage is higher than the designed damage. Damages ratios for flight 1 are higher than for flight 2, which can be explained by the minor cycles during the descent and approach phase. During each cycle damage is accumulated which sums up to these high values. Additional emphasis needs to be placed to the comparison between each feature. While for flight 1 the diaphragm has a higher damage value than the rear drive arm fillet and bore, the damage values for the rear drive arm fillet and diaphragm are similar but higher than the bore for flight 2. This shows that different flight profiles act differently on each feature making it more difficult to predict the health status of each feature. This is because damage is not only depending on the first principle stress, but also on other parameters like the temperature, stress concentration around that feature, multiaxiality, etc. Therefore, these damage ratios need to be calculated and accumulated for all flights of an engine providing information of the current health status and RUL of each feature in the disc.
Table 1 - Damage ratios of the features for both flights
Flight 1 Flight 2
Bore 1.889 1.002
Rear drive arm fillet 1.897 1.339
Diaphragm fillet 2.558 1.280

Track-I
Civil and Structural Engineering Applications
-500-
With the automation of the whole process loop EHM to FEM, it now becomes possible to analyse every feature for different flights and draw information to assist future decisions. As an example, the distribution of the normalised maximum first principle stress in the bore for 489 different flights is shown in Figure 9. The stress value for design assumption is given by the vertical dashed line and is consequently at 1. One can clearly see that the majority of flights are well below the designed stress giving additional credit for those engines. This is just a glance of the possibilities that come by the utilization of the digital twin. Similar distribution can be exploited by means of temperatures, strains, and damages.
Also a single engine can be monitored by simulating each flight and accumulating the damage values. The current RUL can be assessed and thereby the potential of the component maximised which is at the same time lowering the overall life cycle cost of that component.
Fig. 9 - Distribution of the normalized first principle stress in the bore
CONCLUSION
The usage of SHM has several advantages for aerospace engines. However, it is still a rarely used strategy for CSME. This paper shows how a multidisciplinary digital twin can be utilized to perform SHM for those engines and gain benefits by further disc utilization until RUL is exhausted. This raises the potential to lower overall life time costs significantly.
The architecture and the single steps are outlined and illustrated with examples. The main advantages compared to the current system is that this strategy does not rely on additional instrumentations and therefore does not add weight and complexity. Also the stresses and temperatures can be calculated for all critical components on the whole surface. This way, the analysis of the whole fleet becomes handy. As shown in the example above, it is now possible to simulate a representative amount of flights and compare the results against the designed mission.

Proceedings IRF2020
7th International Conference Integrity-Reliability-Failure
-501-
Furthermore, the current health status of a component can be assessed by simulating all flights for one particular engine with the digital twin and calculating the current damage with suitable accumulation rules.
Also different flight manoeuvres can easily be analyzed, allowing to identify groups of features which are triggered by certain events. This can lead to a better feature understanding and an improvement for future designs.
ACKNOWLEDGMENTS
This work has been carried out in collaboration with Rolls-Royce Deutschland as part of the research project VIT-V (project number 35035001) funded by the State of Brandenburg and the European Regional Development Fund. Rolls-Royce Deutschland’s permission to publish this work is greatly acknowledged.
REFERENCES
[1] Mangalgiri PD, Harinarayana K, “Structural Health Monitoring,” in Indian Institute of Metals Series, Aerospace Materials and Material Technologies, N. E. Prasad and R.J.H. Wanhill, Eds., Singapore: Springer Singapore, 2017, pp.449-477.
[2] Brownjohn JMW, “Structural health monitoring of civil infrastructure,” Philosophical transactions. Series A, Mathematical, physical, and engineering sciences, vol. 365, no. 1851, pp.589-622, 2007, doi: 10.1098/rsta.2006.1925.
[3] Perez I, Di Ulio M, Maley S, Phan N, “Structural Health Management in the NAVY,” Structural Health Monitoring, vol. 9, no. 3, pp.199-207, 2010, doi: 10.1177/14759217103 66498.
[4] P. Cawley, “Structural health monitoring: Closing the gap between research and industrial deployment,” Structural Health Monitoring, vol. 17, no. 5, pp.1225-1244, 2018, doi: 10.1177/1 475921717750047.
[5] Stolz C, Neumair M, “Structural Health Monitoring, In-service Experience, Benefit and Way Ahead,” Structural Health Monitoring, vol. 9, no. 3, pp.209-217, 2010, doi: 10.1177/1 475921710366655.
[6] Hunt SR, Hebden IG, “EUROFIGHTER 2000: An Integrated Approach to Structural Health and Usage Monitoring”, in RTO MP, 1998. Accessed: Jan. 9 2020. [Online]. Available: http://citeseerx.ist.psu.edu/viewdoc/download?doi=10.1.1.464.4345&rep=rep1&type=pdf.
[7] Molent L, Aktepe B, “Review of fatigue monitoring of agile military aircraft,” Fat Frac Eng Mat Struct, vol. 23, no. 9, pp.767-785, 2000, doi: 10.1046/j.1460-2695.2000.00330.x.

Track-I
Civil and Structural Engineering Applications
-502-
[8] Tao F, Zhang M, Liu Y, Nee AYC, “Digital twin driven prognostics and health management for complex equipment,” CIRP Annals, vol. 67, no. 1, pp.169-172, 2018, doi: 10.1016/j.cirp.2018.04.055.
[9] Douglas DH, Peucker TK, “Algorithms for the Reduction of the Number of Points Required to Represent a Digitized Line or its Caricature”, Cartographica: The International Journal for Geographic Information and Geovisualization, vol. 10, no. 2, pp.112-122, 1973, doi: 10.3138/FM57-6770-U75U-7727.
[10] Corran RSJ, Williams SJ, “Lifing methods and safety criteria in aero gas turbines,” Engineering Failure Analysis, vol. 14, no. 3, pp.518-528, 2007, doi: 10.1016/j.engfailanal. 2005.08.010.
![Aircraft integrated structural health monitoring using ... · reported in 2003 [6]. Various approaches have been studied regarding SHM for UAVs. Scalea et al. suggested a SHM system](https://static.fdocuments.in/doc/165x107/5f4016838285d2175d0d2a80/aircraft-integrated-structural-health-monitoring-using-reported-in-2003-6.jpg)