A Structural Equation Modeling Approach to Discovering the Experience of Presence
24
Modeling spatial presence: A Structural regression model exploring aspects the Temple Presence Inventory Maria Cipollone School of Communication and Theater Temple University This paper is intended to be a submission to the journal Media Psychology.
-
Upload
maria-cipollone -
Category
Documents
-
view
37 -
download
0
description
In this paper, I conducted a Confirmatory Factor Analysis, which is a way to figure out what latent (or hidden variables) contribute to a feeling of presence. Presence (or telepresence) is an experience where a person forgets that there's media involved. If you've ever jumped out of your seat when watching a suspenseful movie, then you've had a presence experience.
Transcript of A Structural Equation Modeling Approach to Discovering the Experience of Presence
Modeling spatial presence: A Structural regression model exploring aspects the Temple Presence Inventory
Maria Cipollone School of Communication and Theater
Temple University
This paper is intended to be a submission to the journal Media Psychology.
Cipollone 2
ABSTRACT This paper describes an analysis of the Temple Presence Inventory (TPI), a survey instrument that examines (tele)presence experiences across many dimensions and media formats. In the analysis, a structural regression model was used to confirm the latent variables proposed in earlier exploratory factor analyses (Lombard et. al., 2011). Also, it was hypothesized that there was a positive relationship between the latent variables known as mental immersion, perceptual realism, and spatial presence. The proposed model was upheld by the data, and the analysis revealed significant positive relationships between the latent variables. Finally, the implication of these results for the (tele)presence scholarship are discussed, along with potential future analyses.

MODELING PRESENCE 3
INTRODUCTION
Though scholars have long discussed telepresence (hereafter called ‘presence’)
(Minsky, 1980; Rheingold, 1990; Reeves & Nass, 1996), it is Lombard and Ditton’s
(1997) definition as “the perceptual illusion of nonmediation” that most succinctly
summarizes the core concept, and is one of the more widely cited definitions. Presence
can occur in a multitude of contexts, which range from experiencing spatial presence, or
‘being there’ in the mediated environment, to social presence, which is similar to viewing
the mediated environment as a social actor or being (Reeves & Nass, 1996). Scholars
debate the complexity of these concepts, and the existence of this complexity calls for
more stringent measures of the experience so it is more reliable in a research scenario
(Lombard, Ditton, Crane, Davis, Gil-Egui, Horvath, Rossman & Park, 2000). This
analysis will validate an instrument that measures the presence experience, and
specifically focuses on spatial presence, and its relationship to mental immersion and
perceptual realism. These terms are defined in detail below.
Presence is a concept vital to many academic fields such as computer science,
artificial intelligence, education, health, and art (Lombard, Ditton & Weinstein, 2009).
Scholars attempt to elucidate its cognitive effects because presence can be implicated in
persuasion, desensitization, or even learning via media and technology. If the role of
presence is identified in these effects, then an instrument used to measure the experience
must be tested for reliability (Lombard, Weinstein & Ditton, 2011). The evolution of the
presence scholarship has lead to a call for more tested measures of the experience. Many
scales have been designed to address varying aspects of presence, but the Temple
Cipollone 4
Presence Inventory (TPI) was developed as theory-based tool to measure across the many
dimensions of a presence-based experience, and the many possible media that might
induce a presence-based experience (Lombard et al., 2000; 2009).
In this analysis, the validity of the TPI was tested using a structural equation
modeling technique known as structural regression. This technique allows researchers to
examine relationships among latent variables, as well as the strength of their relationship
to certain factor indicators (scale items), because it includes both a measurement model
and a path model with subsequent latent variables. Specifically, the analysis was focused
on the TPI’s ability to measure experiences of mental immersion, perceptual realism, and
spatial presence. First, the presence of the latent variables was confirmed (see Lombard et
al., 2011), and relationships between those variables were tested. It was proposed that the
greater the degree of mental immersion, thus a greater degree of perceptual realism, and
finally, a greater degree of spatial presence. In this paper, the concepts of presence are
reviewed; the development of the TPI is discussed, and the rationale for this analysis is
presented. Finally, the results of the analysis are discussed along with the implications
for further use of the TPI scale.
Defining spatial presence
One of the more common conceptions of presence is the medium’s ability to give
the viewer a sense of being ‘within’ the environment that is presented, or spatial presence
(Ijsselstein, de Ridder, Freeman, & Avons, 2000). Lombard & Ditton (1997) discussed
this concept in three ways: ‘you are there’, ‘it is here’ and ‘we are together’. The nuances
of each are very subtle and scholars argue over their distinctions.

MODELING PRESENCE 5
The sense of ‘being there’ in the environment is possibly one of the oldest forms
of presence. Biocca & Levy (1995) cited the earliest examples of symbolic exchange
such as storytelling and cave painting, which tried to bring the viewer into the mediated
environment. Many scholars have focused on the role of spatial presence (being there)
and its role in virtual environments (Biocca, 1997). In virtual environments, a sense of
‘being there’ has been found to assist in remote surgeries (Westwood, Hoffman, Robb &
Stredney, 1999) and successful psychotherapy (Rizzo, Buckwalter, Neumann,
Kesselman, & Thiebaux, 1998). Ravaja, Saari, Laarni, Salminen & Kallinen (2006)
reported that the level of spatial presence a gamer feels within a gaming environment can
heighten his or her experience of emotional arousal.
The notion of ‘being there’ is, in some ways, symbiotic with the concept of spatial
presence as ‘it is here’. The ‘it is here’ concept can be best exemplified by viewers who
are physically startled by events in a mediated environment or attempt to physically move
out of the path of a mediated object (Lombard & Ditton, 1997). Scholars have also
considered the role of presence as ‘it is here’ in television screen-size (Bracken, 2005),
Scholars have also thought of spatial presence as a notion of ‘we are together’ or
in shared space (Lombard & Ditton, 1997). This form of presence is particularly salient
in terms of virtual environments, and teleconferencing (e.g., Skype or Google Hangout).
A sense of shared space is also seen as vital to the success of virtual learning
environments and engagement with virtual identities (Nowak, 2004; Arbaugh et al.,
2008).
Cipollone 6
Mental immersion
Whether ‘being there’, ‘it is here’, or ‘we are together’, the experience of spatial
presence may dependent on other cognitive states, such as mental immersion. Mental
immersion, or immersion, is the degree to which the individual is submerged in the
virtual environment and sequestered from distracting inputs in the surrounding physical
environment (Biocca & Delaney, 1995). In this analysis, mental immersion encompasses
both physiological and psychological engagement. Although screen-size and quality can
be related to experiences of spatial presence (Bracken, 2005), immersion is not
necessarily dependent on these technological elements. In the discussion of 3D game
environments, McMahan (2003) suggested that immersion is an acceptance of an
environment that does not stray too far from the viewer’s (or in her case, player’s)
expectation of the imaginary conventions of that environment, as long as they are
consistent (p. 69). Others have proposed that if the mediated environment is preferred to
the viewer’s imaginative environment, then immersion can occur (Wirth, 2006). If the
viewer sees the imaginary environment as inconsistent or implausible, mental immersion
cannot be achieved. Researchers argued that without sensory, psychological and
emotional immersion, spatial presence can not be adequately achieved (Biocca &
Delaney, 1995). Thus, in this analysis, it was hypothesized that mental immersion would
directly affect the degree to which a participant experiences spatial presence.
Perceptual realism
Just as immersion is dependent upon the viewer’s expectation being matched with
the conventions of the mediated object or environment, perceptual realism is dependent
upon a similar concept. Perceptual realism can include an element of social realism.
MODELING PRESENCE 7
Although both concepts (perceptual and social realism) consider the plausibility of events
in real life, perceptual realism does not require that the events can actually happen, or that
the objects can actually exist. For example, in science fiction films, viewers can know
that the events in the mediated event are not plausible (such as the existence of an
incredibly hulking, green superhero), but if the details of the events are displayed as
realistically as one would expect, then the event can be viewed as perceptually realistic
(Lombard & Ditton, 1997). If mental immersion is the degree of engagement in the
environment, then perceptual realism is an aspect of environment that can assist in
immersion.
Measuring presence
Prior to the creation of the TPI, researchers measured different types of presence
in specific contexts with extensive drawbacks. Lombard et al. (2011) discussed the
shortcomings of some of the more widely used measurement instruments. For example,
the Slater-Usoh-Steed Presence questionnaire, or the Presence Questionaire ,which
respectively assess spatial presence (as ‘being there’ or ‘it is here’) as well as perceptual
realism and mental immersion, are designed for virtual environments. Thus, these scales
are not validated using other media, (e.g., film or television) rendering them isolated to
the virtual reality experience.
Other measures, such as the ITC Sense of Presence Inventory (Lessiter, Freeman,
Keogh & Davidoff, 2001) or the Community of Inquiry Instrument (Arbaugh, Cleveland-
Innes, Diaz, Garrison, Ice, Richardson, & Swan, 2008) are pan-media scales, but they
address issues of social presence, and largely ignore aspects of mental immersion,
perceptual realism, and spatial presence.
Cipollone 8
Researchers have also used physiological measures of the spatial presence
(Meehan, et al., 2002; Brogni, Vinayagamoorthy, Steed, & Slater, 2006) but the depth of
these measures does not provide extensive ground for interpretation (Lombard et al.,
2011) suggested that these measures are best used in tandem with more subjective
measures.
Development of the Temple Presence Inventory (TPI)
As it was discussed earlier, Lombard et al. (2000) called for the creation of the
TPI partly because of the many conflicting measures of presence that already existed.
Also, the TPI was designed to address the effect of presence across the conceptual
dimensions proposed by Lombard and Ditton in 1997. These dimension include
measures of mental immersion, social presence, social realism, perceptual realism and
spatial presence. The TPI was designed to address these dimensions across media as well
(Lombard et al., 2000; 2009; 2011).
The data for the present analysis came from the initial testing of the TPI in 1999,
when Lombard and colleagues first formulated 114 items for the scale (Lombard et al.,
2000). They tested across conditions, meaning some participants viewed 3D IMAX film
(presumably high presence) and some were in a classroom with a monaural television
playing VHS cassette tapes of a television show that hasn’t aired in nearly 35 years
(presumably low presence; see Sample section for further details). The results from this
initial study revealed significant mean differences across conditions, thus validating the
scale across conditions. Additionally, exploratory factor analysis (using principal
components analysis followed by principal axis factoring with oblique rotation) initially
revealed seven potential factors (Lombard et al., 2000).

MODELING PRESENCE 9
In 2009, Lombard, Ditton, and Weinstein analyzed the same data in order to
eliminate some of the scale items, and test for reliability between items. Exploratory
factor analysis was conducted (principal axis factoring with oblique rotation), and the
researchers found eight potential factors. This time, they retained scale items that loaded
.40 or greater, but dropped items that did not. They reduced the items to 42 questions
across eight factors, and performed tests of internal validity (using Cronbach’s alpha) to
justify their retention of certain questions (Lombard et al., 2009).
To analyze the validity of the items across media format, they tested the TPI with
46 undergraduates at a large urban university. Participants viewed three types of
television programs (a science-fiction film, a comedic news program, and a historical
documentary). The researchers found significant mean differences between groups in
their reporting of social presence, spatial presence, and other dimensions measured in the
TPI (Lombard et al., 2009). Ultimately, the researchers surmised that these results
provided further validity to the instrument.
A 2011 study by Lombard, Weinstein, and Ditton tested the validity of the scale
across low- and high- presence conditions, but this time using video games (SimCity
Classic and Sims3). The researchers surveyed undergraduate students (N=85) using the
TPI and six other prominent presence scales, in order to test the convergent validity of the
TPI (Lombard et al., 2011, p. 5). Analyses of internal validity, inter-correlations among
subscales, and mean scores supported the validity of the TPI to measure across
dimensions of presence, and across media (Lombard et al., 2011, p. 7).
Rationale

Cipollone 10
The current study revisited data generated by the TPI (Lombard et al., 2000) to
apply a structural regression approach. This analysis was conducted as further validation
of the TPI through a measurement model (using Confirmatory Factor Analysis), and
subsequent path model with latent variables, which is a basic method of structural
equation modeling used to explore the relationships between those variables, or factors
(McDonald & Ho, 2002). This method is particularly strong because it combines the
elements of confirmatory factor analysis, which assess convergent validity, along with a
regression/path analysis among the latent variables confirmed by the measurement model
(Floyd & Widaman, 1995). It was expected that this analysis would not only provide
further support for the use of the TPI, but also support the prior analyses by Lombard et
al., (2000; 2009; 2011).
Additionally, the inclusion of the path model would test predicted relationships
among the variables. It was hypothesized that the level of mental immersion would
predict both spatial presence and perceptual realism. It was also predicted that there
would be a significant indirect relationship between mental immersion and spatial
presence through perceptual realism. These hypotheses were derived from conclusions
found in the presence literature, specifically from Lombard and Ditton’s conceptual
explication (1997). This analysis is the first of its kind to use the structural equation
modeling format to test the construct validity of the TPI.
METHOD Sample
The data set used for this analysis (N= 469) was obtained in a prior research
experiment, when the TPI was given to participants in both low and high presence

MODELING PRESENCE 11
conditions (Lombard et al., 2000). A set of participants viewed a 3D IMAX film, T-Rex:
Back to the Cretaceous (N=307), while another group viewed black and white images
with monaural sound, as well as a few episodes of a once-popular American sitcom,
Three’s Company (N=162). Participants were solicited at separate sites, during separate
experiments with the TPI. The data from the low-presence condition was collected at an
earlier point with students at a large urban university. In order to collect data for the high-
presence condition, researchers asked potential participants at an IMAX theater (located
in New York City, NY) to assist university researchers with their work. If they agreed,
participants filled out a paper and pencil version of the TPI. Of the 469 participants,
46.3% were females, and males 52.2% from ages 16 to 76 (M = 30.56, SD = 12.18). A
majority of the participants were White (49.8%), and 17.8% African American, 12.7%
were Hispanic, 11% were Asian, and 6.4% listed “other”. A majority of the participants
had some college education (37.1%), or a college degree (20.8%), a graduate degree
(20%). The original data set was collected as further development of the TPI, and
researchers later tested the internal validity of the scale items and the validity of the
measure across media content and context (Lombard et al., 2009).
Model Results
For the modeling portion of the analysis, the MPlus (sixth edition) program was
used (Muthén & Muthén, 2011). The fit of the model was assessed using the chi-square
model fit statistic (χ2M), the Root Mean Square Error of Approximation (RMSEA), the
Bentler Comparative Fit Index (CFI), and the standardized Root Mean Square Residual
(SRMR) (Kline, 2011, p. 210). The chi-square statistic will test whether there was a
significant difference in the observed covariance data (Klein, 2011, p. 200). The RMSEA
Cipollone 12
was examined to also approximate the fit of the model. Klein (2011) points out that
customarily, a value of .05 or greater demonstrates good fit for the RMSEA, but it is very
important to report and inspect the 90% confidence interval, where if the lower bound
estimate is less than .05, then the good fit hypothesis is retained, but if the upper bound
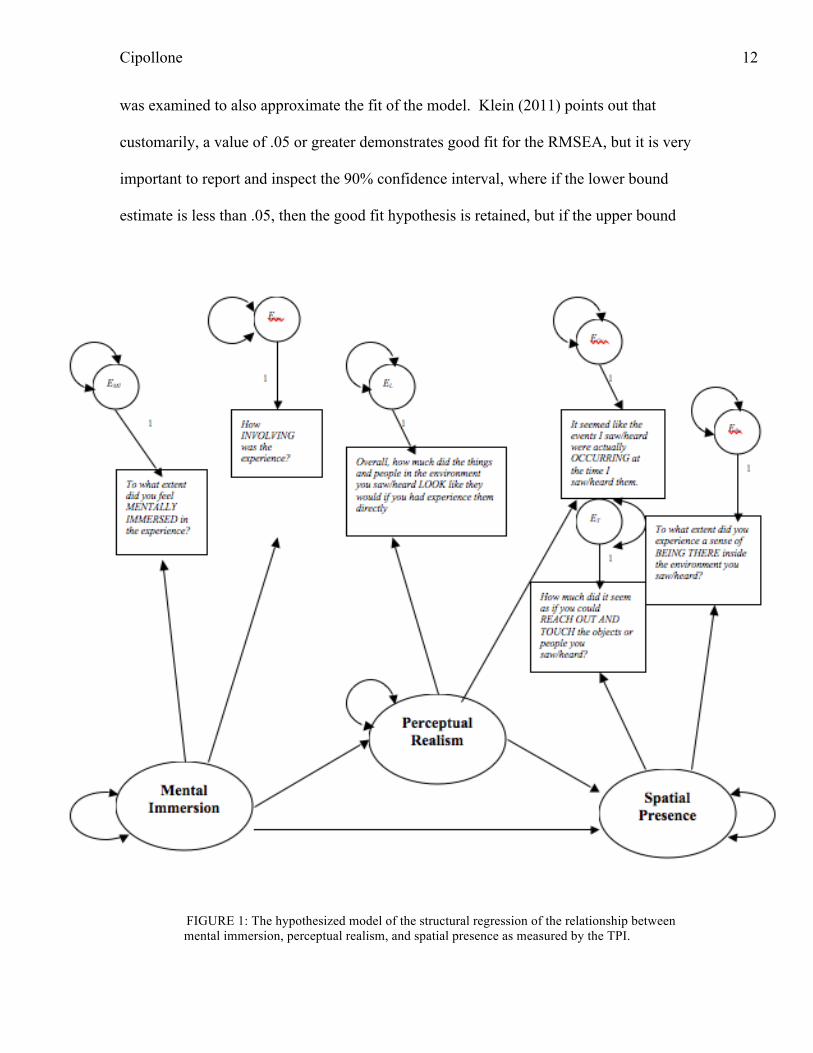
FIGURE 1: The hypothesized model of the structural regression of the relationship between mental immersion, perceptual realism, and spatial presence as measured by the TPI.
MODELING PRESENCE 13
confidence interval exceeds .10, then the poor-fit hypothesis can not be rejected. The
CFI indicates the relative success of the model compared the baseline, and the close-fit
hypothesis tested the baseline model against the researcher’s hypothesized model. CFI
values for goodness of fit should be greater than or equal to .95. The SRMR gives a
sense of the proposed covariance matrix and its relative closeness of fit, and should be
less than or equal to .08 (Kline, 2011, p. 209).
Additionally, path coefficients (both standardized and unstandardized) were
examined to understand the relationship between variables, and the proportion of the
variance that these relationships explain.
Measures
The TPI is a scale that has been developed over the last decade (Lombard et al.,
2000; Lombard et al., 2009; Lombard et al., 2011) to amalgamate the various measures
and theoretical conceptions of presence (namely spatial/social) (Lombard & Ditton,
1997). The TPI is a 42-item, 7-point Lichert scale that asks participants to rate their
experiences concerning a mediated experience. In order to ensure a parsimonious model,
six indicators (out of the 42) were chosen to estimate the model for this particular
analysis.
Mental Immersion
Respondents are asked questions concerning their engagement in the mediated
experience, their perception of being ‘within’ the mediated experience, their physical
condition during the experience (e.g., dizziness or nausea) as well as their awareness of
the ‘mediated’ nature of the event. The proposed model used 6 manifest variables from
Cipollone 14
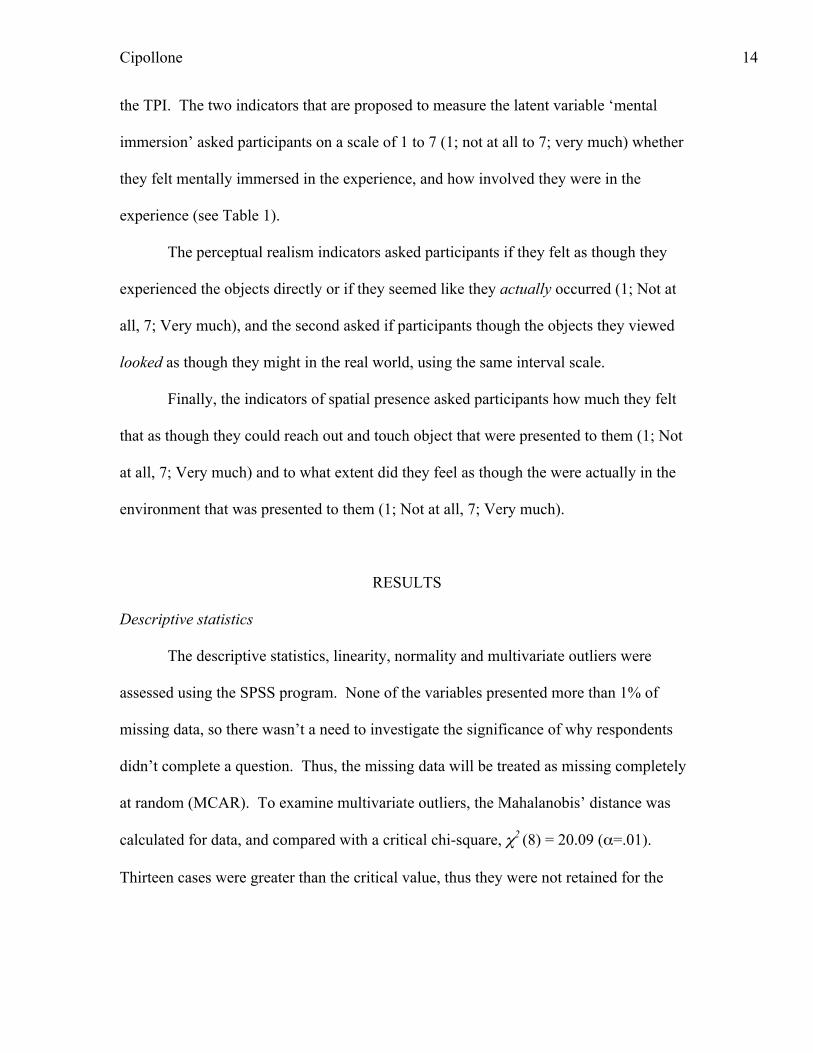
the TPI. The two indicators that are proposed to measure the latent variable ‘mental
immersion’ asked participants on a scale of 1 to 7 (1; not at all to 7; very much) whether
they felt mentally immersed in the experience, and how involved they were in the
experience (see Table 1).
The perceptual realism indicators asked participants if they felt as though they
experienced the objects directly or if they seemed like they actually occurred (1; Not at
all, 7; Very much), and the second asked if participants though the objects they viewed
looked as though they might in the real world, using the same interval scale.
Finally, the indicators of spatial presence asked participants how much they felt
that as though they could reach out and touch object that were presented to them (1; Not
at all, 7; Very much) and to what extent did they feel as though the were actually in the
environment that was presented to them (1; Not at all, 7; Very much).
RESULTS
Descriptive statistics
The descriptive statistics, linearity, normality and multivariate outliers were
assessed using the SPSS program. None of the variables presented more than 1% of
missing data, so there wasn’t a need to investigate the significance of why respondents
didn’t complete a question. Thus, the missing data will be treated as missing completely
at random (MCAR). To examine multivariate outliers, the Mahalanobis’ distance was
calculated for data, and compared with a critical chi-square, χ2 (8) = 20.09 (α=.01).
Thirteen cases were greater than the critical value, thus they were not retained for the
MODELING PRESENCE 15
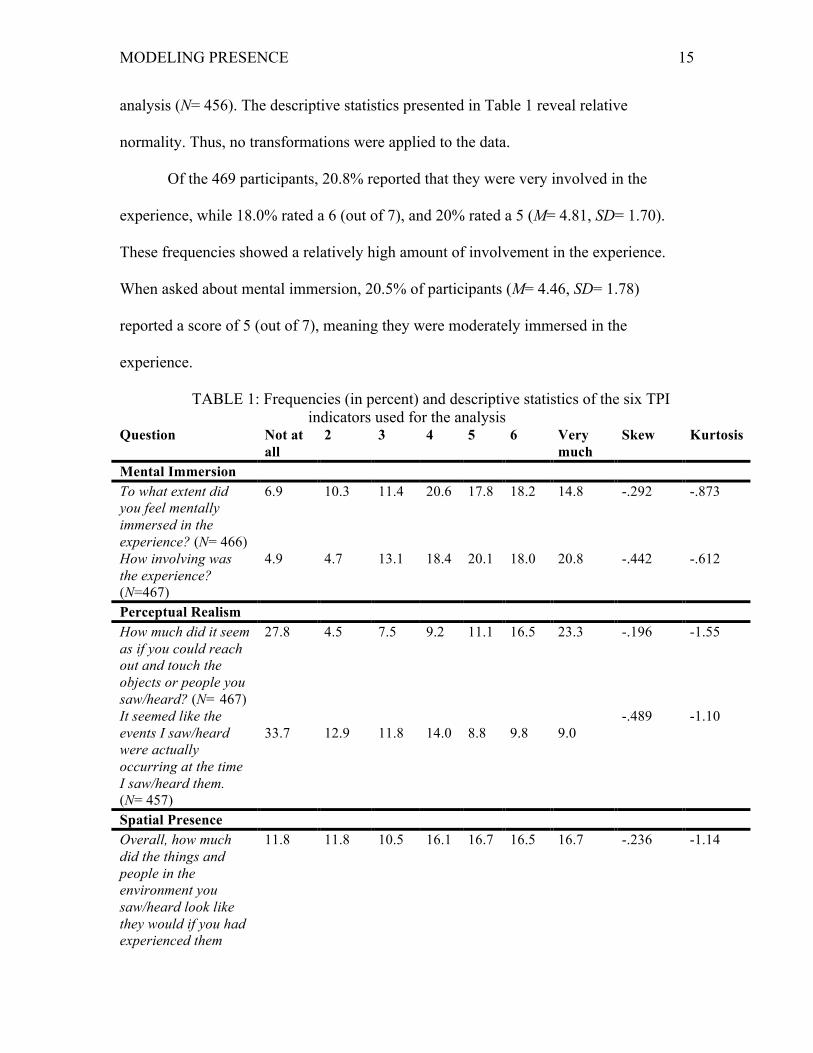
analysis (N= 456). The descriptive statistics presented in Table 1 reveal relative
normality. Thus, no transformations were applied to the data.
Of the 469 participants, 20.8% reported that they were very involved in the
experience, while 18.0% rated a 6 (out of 7), and 20% rated a 5 (M= 4.81, SD= 1.70).
These frequencies showed a relatively high amount of involvement in the experience.
When asked about mental immersion, 20.5% of participants (M= 4.46, SD= 1.78)
reported a score of 5 (out of 7), meaning they were moderately immersed in the
experience.
TABLE 1: Frequencies (in percent) and descriptive statistics of the six TPI indicators used for the analysis
Question Not at all
2 3 4 5 6 Very much
Skew Kurtosis
Mental Immersion To what extent did you feel mentally immersed in the experience? (N= 466)
6.9 10.3 11.4 20.6 17.8 18.2 14.8 -.292 -.873
How involving was the experience? (N=467)
4.9 4.7 13.1 18.4 20.1 18.0 20.8 -.442 -.612
Perceptual Realism How much did it seem as if you could reach out and touch the objects or people you saw/heard? (N= 467)
27.8 4.5 7.5 9.2 11.1 16.5 23.3 -.196 -1.55
It seemed like the events I saw/heard were actually occurring at the time I saw/heard them. (N= 457)
33.7
12.9
11.8
14.0
8.8
9.8
9.0
-.489 -1.10
Spatial Presence Overall, how much did the things and people in the environment you saw/heard look like they would if you had experienced them
11.8 11.8 10.5 16.1 16.7 16.5 16.7 -.236 -1.14
Cipollone 16
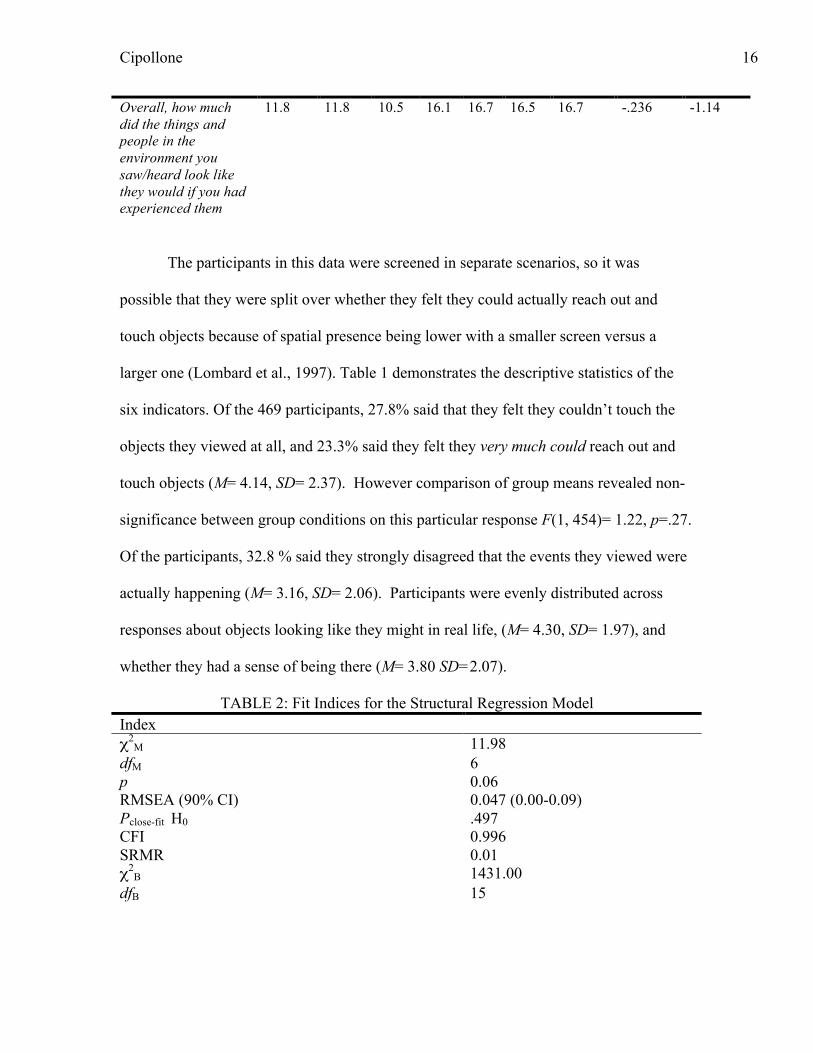
The participants in this data were screened in separate scenarios, so it was
possible that they were split over whether they felt they could actually reach out and
touch objects because of spatial presence being lower with a smaller screen versus a
larger one (Lombard et al., 1997). Table 1 demonstrates the descriptive statistics of the
six indicators. Of the 469 participants, 27.8% said that they felt they couldn’t touch the
objects they viewed at all, and 23.3% said they felt they very much could reach out and
touch objects (M= 4.14, SD= 2.37). However comparison of group means revealed non-
significance between group conditions on this particular response F(1, 454)= 1.22, p=.27.
Of the participants, 32.8 % said they strongly disagreed that the events they viewed were
actually happening (M= 3.16, SD= 2.06). Participants were evenly distributed across
responses about objects looking like they might in real life, (M= 4.30, SD= 1.97), and
whether they had a sense of being there (M= 3.80 SD=2.07).
TABLE 2: Fit Indices for the Structural Regression Model Index χ2
M 11.98 dfM 6 p 0.06 RMSEA (90% CI) 0.047 (0.00-0.09) Pclose-fit H0 .497 CFI 0.996 SRMR 0.01 χ2
B 1431.00 dfB 15
Overall, how much did the things and people in the environment you saw/heard look like they would if you had experienced them directly? (N=462)
11.8 11.8 10.5 16.1 16.7 16.5 16.7 -.236 -1.14
To what extent did you experience a sense of being there inside the environment you saw/heard? (N= 457)
21.9 12.3 10.6 11.0 18.2 14.9 11.0 -.010 -1.37
MODELING PRESENCE 17
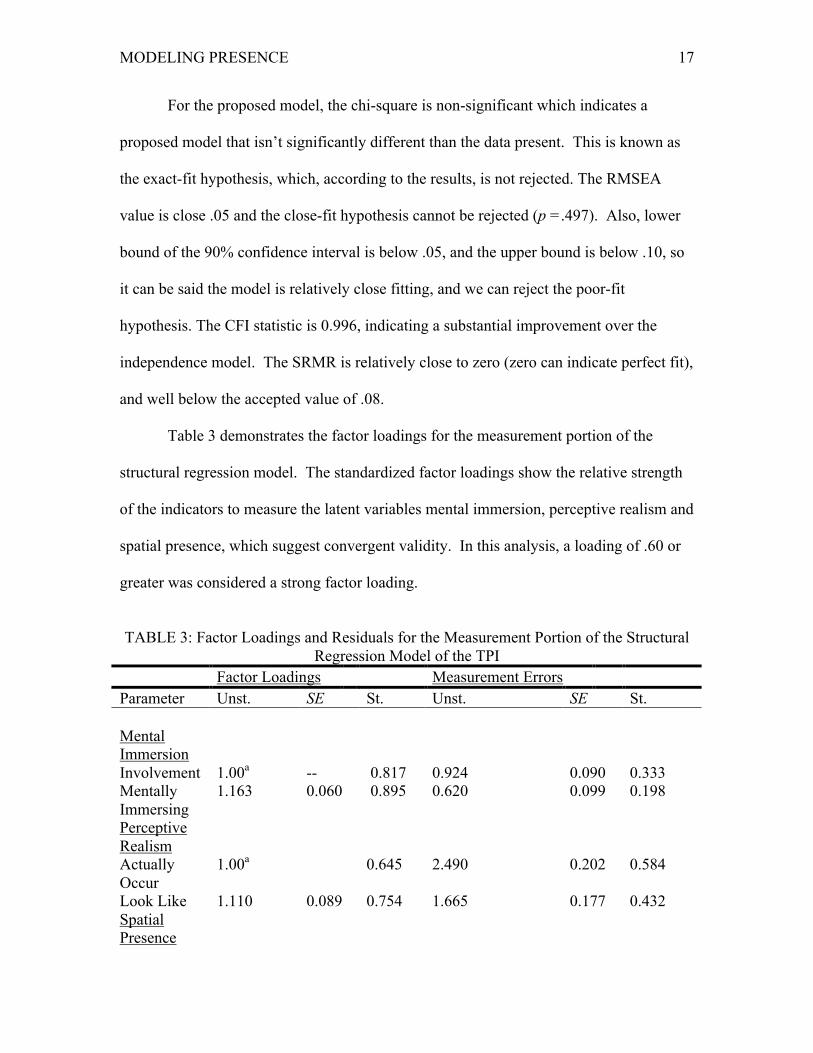
For the proposed model, the chi-square is non-significant which indicates a
proposed model that isn’t significantly different than the data present. This is known as
the exact-fit hypothesis, which, according to the results, is not rejected. The RMSEA
value is close .05 and the close-fit hypothesis cannot be rejected (p =.497). Also, lower
bound of the 90% confidence interval is below .05, and the upper bound is below .10, so
it can be said the model is relatively close fitting, and we can reject the poor-fit
hypothesis. The CFI statistic is 0.996, indicating a substantial improvement over the
independence model. The SRMR is relatively close to zero (zero can indicate perfect fit),
and well below the accepted value of .08.
Table 3 demonstrates the factor loadings for the measurement portion of the
structural regression model. The standardized factor loadings show the relative strength
of the indicators to measure the latent variables mental immersion, perceptive realism and
spatial presence, which suggest convergent validity. In this analysis, a loading of .60 or
greater was considered a strong factor loading.
TABLE 3: Factor Loadings and Residuals for the Measurement Portion of the Structural
Regression Model of the TPI Factor Loadings Measurement Errors Parameter Unst. SE St. Unst. SE St. Mental Immersion
Involvement 1.00a -- 0.817 0.924 0.090 0.333 Mentally Immersing
1.163 0.060 0.895 0.620 0.099 0.198
Perceptive Realism
Actually Occur
1.00a 0.645 2.490 0.202 0.584
Look Like 1.110 0.089 0.754 1.665 0.177 0.432 Spatial Presence
Cipollone 18
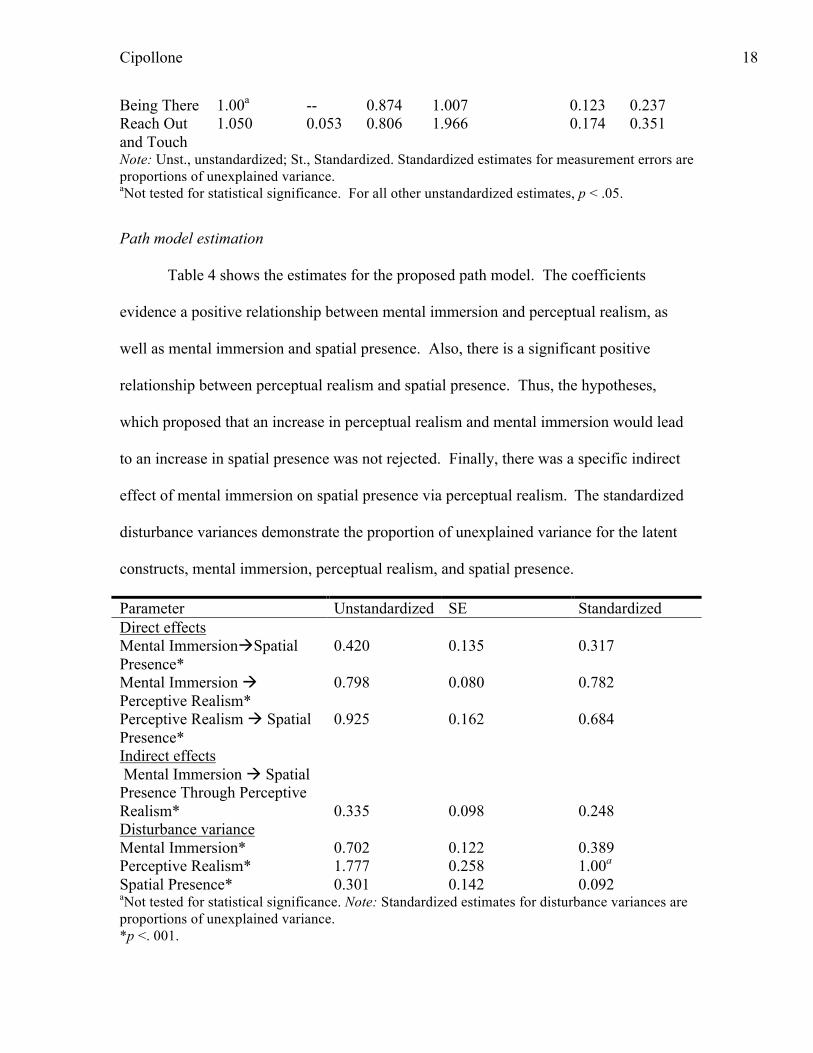
Being There 1.00a -- 0.874 1.007 0.123 0.237 Reach Out and Touch
1.050 0.053 0.806 1.966 0.174 0.351
Note: Unst., unstandardized; St., Standardized. Standardized estimates for measurement errors are proportions of unexplained variance. aNot tested for statistical significance. For all other unstandardized estimates, p < .05.
Path model estimation
Table 4 shows the estimates for the proposed path model. The coefficients
evidence a positive relationship between mental immersion and perceptual realism, as
well as mental immersion and spatial presence. Also, there is a significant positive
relationship between perceptual realism and spatial presence. Thus, the hypotheses,
which proposed that an increase in perceptual realism and mental immersion would lead
to an increase in spatial presence was not rejected. Finally, there was a specific indirect
effect of mental immersion on spatial presence via perceptual realism. The standardized
disturbance variances demonstrate the proportion of unexplained variance for the latent
constructs, mental immersion, perceptual realism, and spatial presence.
Parameter Unstandardized SE Standardized Direct effects Mental ImmersionSpatial Presence*
0.420 0.135 0.317
Mental Immersion Perceptive Realism*
0.798 0.080 0.782
Perceptive Realism Spatial Presence*
0.925 0.162 0.684
Indirect effects Mental Immersion Spatial Presence Through Perceptive Realism*
0.335
0.098
0.248
Disturbance variance Mental Immersion* 0.702 0.122 0.389 Perceptive Realism* 1.777 0.258 1.00a Spatial Presence* 0.301 0.142 0.092 aNot tested for statistical significance. Note: Standardized estimates for disturbance variances are proportions of unexplained variance. *p <. 001.
MODELING PRESENCE 19
DISCUSSION
The results of this structural regression analysis demonstrate that the proposed
model (see Figure 1) fit the data. The indicators had strong factor loadings on the
proposed latent variables, thus confirming the strength of the TPI in its measurement of
mental immersion, perceptual realism, and spatial presence. Finally, the results indicate
that there is a significant relationship between the three latent variables, both in direct and
indirect paths. Thus, the hypothesis that an increase in the amount of mental immersion
would lead to an increase in perceptual realism, and an increase in the amount of spatial
presence was confirmed. These significant findings implicate that the TPI is adequately
estimating the proposed dimensions of presence first conceptualized by Lombard and
Ditton (1997). Furthermore, the measurement portion of the model confirms the validity
of the exploratory factor analysis conducted in prior research using the TPI (Lombard et
al., 2009; 2011).
There were several limitations to this analysis. First, the use of structural
equation modeling required a larger sample size, so some of the newer data collected in
more recent studies was not suitable for the method (Kline, 2011, p. 12). In the future,
new data would have to be collected to assess the validity of the TPI using structural
regression techniques.
Another limitation of the study was the selection of only six manifest variables to
measure the latent variables. This analysis investigated the paths of the latent variables
concerning mental immersion, perceptual realism, and spatial presence, but the other
types of presence should be incorporated into the model using a structural regression
technique. More importantly, because the TPI was designed to measure presence across
Cipollone 20
the dimensions explicated by Lombard and Ditton (1997), including the other latent
variables would further validate the strength of the scale. A subsequent analysis would
include the dimensions of social presence through parasocial interaction, which is an
intimate but one-sided type of presence, or social presence- active/passive interpersonal,
where the viewer considers mediated objects that are like other beings, and either
passively or actively respond to those actors (Reeves & Nass, 1996; Lombard & Ditton,
1997). It would also be necessary to include the dimensions of social richness, in which
the medium evokes a sense of immediacy and intimacy, and social realism, in which the
viewer believes that the events in the mediated event could possibly occur in the real
world.
However the inclusion of 42 indicators would increase the complexity of the
model, and may not be practical. Thus, in future analyses, the indicators might be
parceled together to measure latent variables. In case of the TPI, domain representative
parcels could be made using Lombard & Ditton’s (1997) unidimensional constructs.
These parcels could be incorporated into a more parsimonious model with greater
reliability (Coffman & McCallum, p. 237). In their analysis of path models, Coffman and
McCallum (2005) found that models with pareceled indicators (also known as partially
disaggregate models) have larger path coefficients and smaller residual variances than
those models that include unparceled indicators. Therefore, it would make a great deal of
sense to test the TPI using this technique.

MODELING PRESENCE 21
CONCLUSION
The validity of the TP1 was assessed in this analysis, specifically in its ability to
measure the latent variables: spatial presence, mental immersion, and perceptive realism.
The use of the structural regression model was useful in that it was able to confirm prior
factor analyses of the TPI (Lombard et al., 2000; 2009; 2011), but also because important
relationships between the latent variables were evaluated. As a result of this research, the
conditions that induce a spatial presence experience are better understood. On the level
of scale development, these results make a strong case for the use of the TPI when
measuring presence. In a broader sense, the results add strength to the presence
scholarship, because they ensure a more clear measure of the experience. As scholars are
able to more acutely understand presence-based experiences, they can further understand
the nature of these dynamic experiences, and the cognitive processes behind them.

Cipollone 22
References Arbaugh, J.B., Cleveland-Innes, M., Diaz, S.R., Garrison, D.R., Ice, P., Richardson, &
Swan, K.P. (2008). Developing a community of inquiry instrument: Testing a measure of the Community of Inquiry framework using a multi-institutional sample. The Internet and higher Education, 11(3-4), 133-136.
Bracken, C. C. (2005). Presence and image quality: The case of high-definition
television. Media Psychology, 7 (2), 191–206. Brogni, A., Vinayagamoorthy, V., Steed, A., & Slater, M. (2006). Variations in
physiological responses of participants during different stages of an immersive virtual environment experiment. In Proceedings of the ACM Symposium on Virtual Reality Software and Technology (Limassol, Cyprus, November 01 - 03, 2006). VRST '06. ACM, New York, NY, 376-382.
Biocca, F. (1997). The cyborg’s dilemma: progressive embodiment in virtual
environments. Journal of Computer-Mediated Communications, 3(2), [Online]. Available: http://www.ascusc.org/jcmc/vol3/issue2/biocca2.html.
Biocca, F., & Delaney, B. (1995). Immersive virtual reality technology. In F. Biocca &
M. Levy (Eds.), Communication in the age of virtual reality (15–32). Hillsdale, NJ: Lawrence Erlbaum.
Coffman, D.L., & MacCallum, R.C. (2005). Using parcels to convert path analysis
models into latent variable models. Multivariate Behavioral Research, 40 (2), 235–259.
Floyd, F. J., & Widaman, K. F. (1995). Factor analysis in the development and
refinement of clinical assessment instruments. Psychological Assessment,7, 286-‐299.
IJsselsteijn, W. A., de Ridder, H., Freeman, J., & Avons, S. E. (2000). Presence: Concept,
determinants and measurement. Proceedings of the SPIE, Human Vision and Electronic Imaging V, 3959–76. Presented at Photonics West-Human Vision and Electronic Imaging V 23–28 January 2000, San Jose, CA
Kline, R. B. (2011). Principles and practice of structural equation modeling (3rd
ed.). New York: Guilford Press. Lessiter, J., Freeman, J., Keogh, E. & Davidoff, J. (2001). A cross-media presence
questionnaire: The ITC-sense of presence inventory. Presence: Teleoperators and Virtual Environments, 10(3), 282-297.

MODELING PRESENCE 23
Lombard, M. (1995). Direct responses to people on the screen: Television and personal space. Communication Research, 22, 288–324.
Lombard, M., & Ditton, T.B. (1997). At the heart of it all: The concept of presence.
Journal of Computer-Mediated Communication, 3(2). Lombard, M., & Ditton, T. B., Crane, D., Davis, B., Gil-Egui, G., Horvath, K., Rossman,
J., & Park, S. (2000, October). Measuring presence: A literature-based approach to the development of a standardized paper-and-pencil instrument. Presented at the Third International Workshop on Presence, Delft, The Netherlands.
Lombard, M., Ditton, T. B., & Weinstein, L. (2009, November). Measuring
(tele)presence: The Temple Presence Inventory. Presented at the Twelfth International Workshop on Presence, Los Angeles, California, USA.
Lombard, M., Weinstein, L., & Ditton, T. B. (2011, November). Measuring telepresence:
The validity of the Temple Presence Inventory (TPI) in a gaming context. Presented at the Thirteenth International Workshop on Presence, Edinborough, Scotland, UK.
McDonald, R. P., & Ho, M-H. R. (2002). Principles and practice in reporting structural
equation analyses. Psychological Methods, 7, 64-82. McMahan, A. (2003). Immersion, engagement, and presence: A method for analyzing 3-
D video games. In M.J.P Wolf & B. Perron (eds.). The video game theory reader (67-86). New York: Taylor & Francis.
Minsky, M. (1980, June). Telepresence. Omni, 45-51. Meehan, M., B. Insko, M. Whitton and F. P. Brooks Jr. (2002). "Physiological Measures
of Presence in Stressful Virtual Environments." ACM Transactions on Graphics 21(3): 645-652. Proceedings of ACM SIGGRAPH 2002, San Antonio, Texas.
Muthén, L. K., & Muthén, B. O. (1998-2011). Mplus User's Guide. Sixth Edition. Los Angeles, CA: Muthén & Muthén.
Nowak, K. L. (2004). The influence of anthropomorphism and agency on social judgment in virtual environments. Journal of Computer Mediated Communication, 9(2). Ravaja, N., Saari, T., Laarni, M.,Salminen, J., Kallinen, K. (2006). Phasic emotional
reactions to video game events: A psychophysiological investigation. Media Psychology, 8, 343–367.
Reeves, B., & Nass, C. (1996). The media equation: How people treat computers,
television, and new media like real people and places. Stanford, CA: CSLI Publications.
Cipollone 24
Rheingold, H. (1991). Virtual reality. New York: Summit Books. Rizzo, A., Buckwalter, J. G., Neumann, U., Kesselman, C. & Thiebaux, M. (1998). Basic
issues in the application of virtual reality for the assessment and rehabilitation of cognitive impairments and functional disabilities. CyberPsychology and Behavior, 1(1), 59–78.
Westwood, J. D., Hoffman, H. M., Robb, R. A. & Stredney, D. (Eds.). (1999). Medicine
meets virtual reality: The convergence of physical and informational technologies options for a new era in healthcare. Amsterdam: IOS Press
Wirth, W. (2006). Involvement. In J. Bryant & P. Vorderer (Eds.), Psychology of
Entertainment (p. 199-213). Mahwah, NJ: Erlbaum.