A STATISTICAL REVIEW OF
46
TERN is supported by the Australian Government through the National Collaborative Research Infrastructure Strategy and the Super Science Initiative. A STATISTICAL REVIEW OF TERRESTRIAL PLOT NETWORKS WITHIN TERN — SuperSites December 2014
Transcript of A STATISTICAL REVIEW OF

TERN is supported by the Australian Government through the National Collaborative Research
Infrastructure Strategy and the Super Science Initiative.
A STATISTICAL REVIEW OF
TERRESTRIAL PLOT NETWORKS
WITHIN TERN — SuperSites
December 2014

Authors: Mr Philip Tennant and Professor Alan Welsh
Author Bios
Philip Tennant is a statistician at the Fenner School for Environment and Society at The Australian
National University. He has a Bachelor of Applied Science in Ecology and Natural Resources from the
University of Canberra, a Graduate Diploma in Maths and Statistics from Murdoch University, and a
Masters in Scientific Studies (Statistics) from the University of New England.
Professor Alan Welsh is based at the Mathematical Sciences Institute, The Australian National
University. Alan Welsh obtained a BSc with a University Medal in Mathematical Statistics from the
University of Sydney in 1982 and obtained a PhD from The Australian National University (ANU) in
1985. He was an Assistant Professor at the University of Chicago in the USA from 1984 to 1987
before he became a lecturer at the ANU. He held the Chair of Statistics at the University of
Southampton in the UK from 2001 to 2003, and is currently at The Australian National University
where he is the EJ Hannan Professor of Statistics.
Citation: Tennant, P., and Welsh, A. (2014). A STATISTICAL REVIEW OF TERRESTRIAL PLOT
NETWORKS WITHIN TERN — SuperSites. A report for the Terrestrial Ecosystem Research Network,
Australia.
Fenner School of Environment and Society
(Bld #141)
The Australian National University
TEL: +61 2 6125 1867
EMAIL: [email protected]
Material contained within this report has been prepared
for the Terrestrial Ecosystem Research Network, and
represents the professional opinions of the authors. The
content is not to be used or modified without prior
written consent from the authors.
Corresponding Author: P. Tennant
Document Version: V2.4(SS)
Status: Final
Date: 27/12/2014

FNQ Rainforest SuperSite, Cape Tribulation node in March 2014. Ecophysiologists are using equipment in the
open air field laboratory at the Daintree Rainforest Observatory. Field buildings are located at SuperSites to
allow scientists, in this case external researchers, to undertake intensive field work out of the elements.
ii
Contents
Table of Figures ...................................................................................................................................... ii
Executive Summary ............................................................................................................................... iii
Purpose Statement ................................................................................................................... v
Report Structure ...................................................................................................................... v
SECTION 1: Context ................................................................................................................................ 1
Background .............................................................................................................................. 1
Overview of terrestrial plot networks within TERN .................................................................... 1
Approach taken ........................................................................................................................ 3
SECTION 2: Individual project reviews .................................................................................................. 4
Calperum Mallee ............................................................................................................................ 7
FNQ Rainforest ............................................................................................................................. 11
Great Western Woodlands .......................................................................................................... 16
SEQ Peri-urban ............................................................................................................................. 20
Warra Tall Eucalypt ...................................................................................................................... 24
SECTION 3: Synopsis ............................................................................................................................. 28
Selection bias and representativeness ........................................................................................ 30
The role of diagnostics in statistical modelling ........................................................................... 32
Combining project datasets ......................................................................................................... 33
Power analysis .............................................................................................................................. 35
Acknowledgements .............................................................................................................................. 36
Appendix ............................................................................................................................................... 37
Table of Figures
Figure 1: Spatial distribution of plot networks within TERN (ex-MSPN) 2
Figure 2: The general location of the five SuperSites included in this review 7
Figure 3: Calperum Mallee SuperSite location 7
Figure 4: Far North Queensland Rainforest SuperSite location 11
Figure 5: Great Western Woodland SuperSite location 16
Figure 6: South East Queensland Peri-Urban SuperSite location 20
Figure 7: Warra Tall Eucalypt SuperSite location 24

iii
Executive Summary
This report is a companion document to the main report: A statistical review of terrestrial plot
networks within TERN. This document reviews TERN-funded, on-ground plot activities at the
SuperSites facility.
This report provides an overview of the SuperSites facility, with the focus on clearly documenting
their components and their ability to meet stated objectives. In total, five SuperSites were subject to
review. Since the review process started, five additional SuperSites have been added to the facility.
These new SuperSites were regarded as outside the scope of the review.
The review was undertaken primarily using an enquiry-based approach. Consultation was needed to
obtain insight into how the projects were designed as there was a distinct lack of documentation
available on the design of the component projects both at the inception, and throughout the review
process. This was primarily because the review was undertaken through a demanding ‘build-phase’
of the SuperSites facility.
The target of the review were TERN-funded terrestrial plots that measure flora and fauna attributes.
Atmospheric and other environmental measurements recorded from flux tower installations were
not part of the project. Similarly, hydrological studies involving bores, weirs and other infrastructure
to measure and subsequently model stream flow and water quality were not examined. In this
regard, it is important to realise that this report does not review the SuperSites facility per se, but is
restricted to understanding, documenting and reviewing the flora and fauna on-ground (terrestrial)
plot-based activities that are part of SuperSite activities. Examining relationships between on-ground
plot-based measurements and attributes measured from flux tower-based instrumentation is a core
part of SuperSite activities, but is not considered as part of this review.
A difficulty experienced with the review was understanding what constituted TERN-funded work. For
nearly all SuperSites, existing, externally-funded work has been brought under the TERN umbrella to
a greater or lesser extent. This made it unclear what was TERN infrastructure and intellectual
property, and what was not. During the review, we attempted to avoid documenting and reviewing
activities that were neither funded by TERN, nor within the control of the SuperSite Director or
SuperSite scientists. Some activities we believed were TERN funded, and discussed, we learned
toward the end of the review that they were not. Discussion of these activities have not been
included.
In 2012 the Australian SuperSite Network (originally ASN, now SuperSites) commenced development
on a set of field protocols to be applied consistently across each of the five SuperSites. The focus of
on-ground, plot-based activities at each of the SuperSites is one, 1ha ‘core’ plot on which a range of
vegetation and soil attributes are measured. Acoustic monitoring for avifauna is also being
undertaken. The establishment of one, 1ha plot with measurements undertaken using consistent
SuperSite protocols is a standard requirement for each of the individual SuperSites within the
facility. The field monitoring protocols and procedures used at the SuperSites are continuing to be
developed in collaboration with TERN facilities (primarily AusCover, AusPlots, LTERN, Eco-informatics
and eMAST), and also with regard to activities of international organizations including the US-based

iv
National Ecosystem Observatory Network Inc. (NEON), Europe’s Analysis and Experimentation on
Ecosystems (AnaEE), and the Center for Tropical Forest Science.
SuperSites are a different type of facility compared to the other three (ex-MSPN) groups. At
SuperSites, measurement occurs intensively and in a spatially local, concentrated manner to better
understand ecosystem processes that are a function of a complex of variables including flora, fauna,
soils and atmospheric variables. At a SuperSite, field survey resources are concentrated at a location
(the core 1ha plot), rather than geographically distributed like they are for AusPlots, the Long Term
Ecological Research Network and the Australian Transect Network.
The SuperSites have a history that has led to their location being deliberately chosen. It is not
necessarily sensible to expect that any one of many locations could have been chosen randomly at
which to establish a particular SuperSite. It is common for a SuperSite to be established at a location
to complement previous and ongoing work. In addition to the deliberate, subjective placement of
SuperSites in particular locations, there are technical requirements that constrain the siting of the
flux tower to facilitate effective atmospheric measurements. While flux tower associated
measurements were not part of this review, the siting of the flux tower subsequently affects the
placement of the 1ha core vegetation plot which sits in the fetch or footprint of the tower.
The historical location of the SuperSite and technical factors influencing the siting of the flux tower
and correspondingly, the associated 1ha core plot are realities of the SuperSite facility. SuperSite
scientists have emphasised that the focus of the SuperSites is in intensively collecting data from the
1ha plot in association with flux tower measurements to investigate and examine ecosystem
processes operating at this local scale. This is understood, but the historical and technical realities of
choosing the primary location and the position of the flux tower, and the subjectivity of choosing the
location of the 1ha plot, do not change the statistical issues associated with the site, tower or core
plot selection process. This is something that users of the data should consider.
The original choice for the location of the SuperSite, combined with the purposive selection of the
tower location, and then subsequently, the subjective placement of the 1ha core plot within the
tower footprint, affects the representativeness of the plot location in a statistical sense. In this
regard, the vegetation on the 1ha core plot is being sampled in a restricted part of the environment
(due to the constraints on flux tower placement), and the lack of an element of randomisation
means that selection bias may have inadvertently been introduced when selecting the survey site
where measurements are made. Where scientists using data from these sites are interested in
drawing conclusions across the broader district or landscape, caution should be used.
Survey sites may be chosen non-randomly by aligning the environmental attributes of a potential
survey site with desirable properties from the surrounding landscape. This non-probabilistic form of
selection does not ensure the survey site is a statistically representative example that provides
security for drawing conclusions across the broader landscape. The idea of representativeness and
selection bias is discussed in the synopsis at the end of this review.

v
Table 1. SuperSite grouping by broad theme and type of study. Attributes correspond to the SuperSites defined
more broadly. For example, the effects of disturbance are being examined at Great Western Woodlands and
Warra, but through associated projects at these respective locations that are not TERN funded.
SuperSite
Fau
na
Flo
ra
Soil
Hyd
rolo
gy
Clim
ate
chan
ge
Cro
ss T
ERN
lin
kage
s
Inte
rnat
ion
al
linka
ges
Bio
me
or
Reg
ion
al
Dis
turb
ance
Co
mm
un
ity
dyn
amic
s
Calperum Mallee y y y y y y y y
FNQ Rainforest y y y y y y y y
Great Western Woodlands y y y y y y y y
SEQ Peri-urban y y y y y y y
Warra Tall Eucalypt y y y y y y y
Purpose Statement
This report was commissioned as part of the Australian Government Education Investment Fund
under a Collaborators Agreement between The University of Adelaide and The Australian National
University in mid-2012.
The purpose of this document is to provide an overview of the strengths and weaknesses of the
terrestrial, on-ground, plot-based activities of the five SuperSites within the TERN SuperSite
network. In particular, the review sought to document the objectives and methodology of the TERN-
funded plot-based activities from each of the SuperSites and make recommendations where
relevant. Projects were reviewed against the study objectives as described by principal investigators
or facility leader.
A critical examination of the collective ability of the SuperSite network to inform synthesis-based
research questions was beyond scope. However, we do provide some limited commentary on this
important topic toward the end of the report.
Report Structure
This report has three sections. Section 1 provides background and contextual information relevant
to the review. Section 2 provides a review of each of on-ground plot-based activities within the five
SuperSites. Section 3 provides key statistical considerations to inform development of SuperSite plot
systems and to facilitate the use of plot-based data from the SuperSites in synthesis initiatives.

1
SECTION 1: Context
This section of the report provides relevant contextual information.
Background
The Terrestrial Ecosystem Research Network, www.tern.org.au is a collection, storage and sharing
infrastructure network for Australian ecosystem science. TERN was initiated in 2008 and has been
funded primarily through the Australian Government National Collaborative Infrastructure Strategy
(NCRIS) and the Education Investment Fund Super Science Initiative (EIF).
TERN is administered by The University of Queensland but the administration of the terrestrial plot-
based components of TERN were outsourced to The University of Adelaide. These plot-based
components were collectively known as the Multi-Scaled Plot Network (MSPN) until mid-2013, and
were administered by the MSPN facility at The University of Adelaide.
The MSPN was inclusive of five separate sub-facilities: AusPlots Forests, AusPlots Rangelands, the
Australian Transects Network (ATN), the Long Term Ecological Research Network (LTERN) and the
Australian Supersite Network (SuperSites). In July 2013, the MSPN Facility was formally dissolved
and four standalone facilities were established within TERN.
This document, which focusses on the SuperSites facility, was commenced in May 2012 after the
recruitment of the lead author. The review includes the five SuperSites operational during the TERN
EIF funding period.
Overview of terrestrial plot networks within TERN
The collective purpose of the terrestrial plot networks within TERN is to provide a scientific basis to
understand environmental change across Australia and, in turn, to inform effective natural resource
management. Four facilities within TERN are responsible for the delivery and management of these
terrestrial plot networks. These are:
(1) the Ausplots Facility which administers Ausplots Rangelands, which is a new continental network
of surveillance monitoring plots in rangelands, and Ausplots Forests, which is a new large-scale
network of surveillance monitoring plots in tall eucalypt forests;
(2) the Long Term Ecological Research Network (LTERN), which is built on pre-existing long-term
terrestrial ecology research plot networks;
(3) the Australian Supersite Network (SuperSites), which is a series of new and established sites
undertaking intensive ecosystem measurements and providing field infrastructure and support to
external researchers and educators; and
(4) the Australian Transect Network (ATN), which is a network of new and established monitoring
transects spanning environmental gradients.
This report only has information relating to the SuperSites as this network is different from the
others, being focused on intensively studying process at comparatively small spatial scales rather
than studying ecological patterns across a geographic area.
2
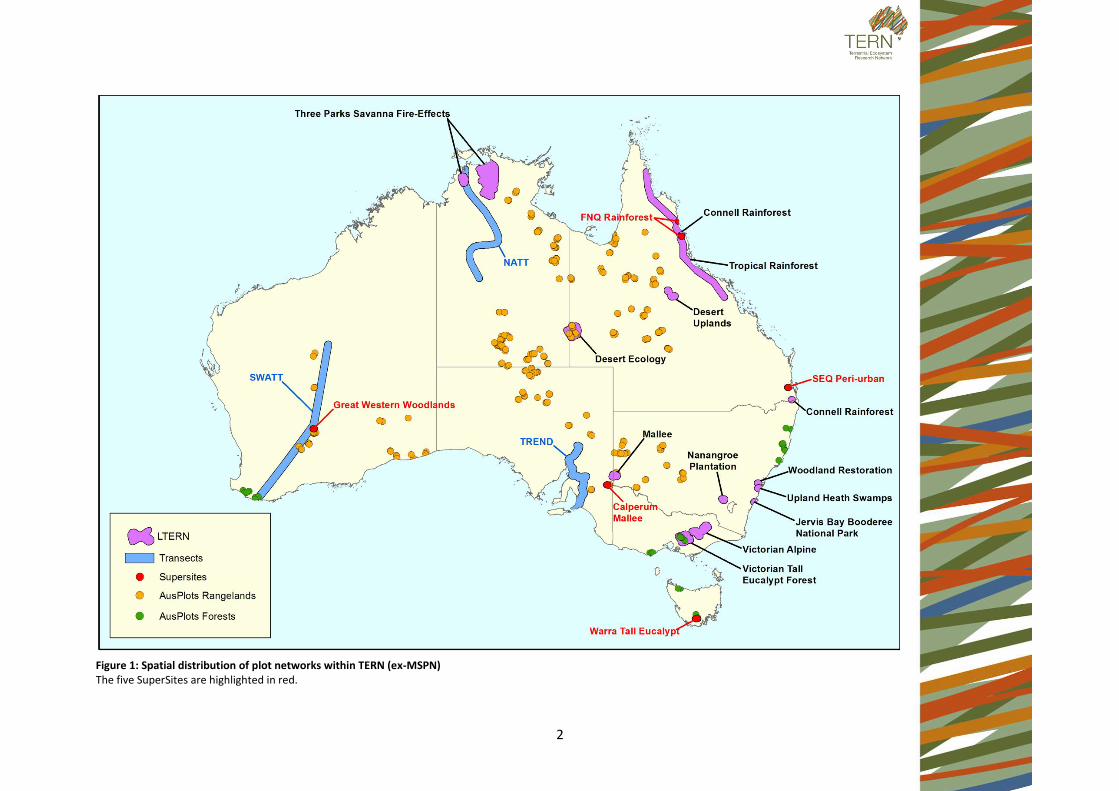
Figure 1: Spatial distribution of plot networks within TERN (ex-MSPN) The five SuperSites are highlighted in red.

3
Approach taken
For the approach undertaken in completing this review, including report utilisation, please see the
main report (A statistical review of terrestrial plot networks within TERN) which covers the AusPlots,
Long Term Ecological Research Network and the Australian Transect Network facilities.
This document is not a review of the SuperSites facility as a whole. It excludes both non TERN-
funded components, and discussion around the measurements obtained from the flux tower and
associated instrumentation. In addition, some of the SuperSites have substantial hydrological
components which are not the focus of the broader review across the four (ex-MSPN) TERN facilities.
Table of dates of consultations and requests for information from TERN scientists excluding the
report review period 14 November to 12 December 2014.
SuperSite Consultations and requests for information.
Plot network contacts
Calperum Mallee
January, February, and June 2013, September 2014.
Wayne Meyer, Peter Cale
FNQ Rainforest
August 2012, March 2013, September 2014
Mike Liddell, Matt Bradford, Stephen Williams, David Westcott
Great Western Woodlands
August and December 2012, January 2013, September 2014.
Suzanne Prober
SEQ Peri-urban
August 2012, January, February, June, July and August 2013, February, March, April, July 2014.
Jean-Marc Hero, Martin Labadz, Andy Stevens, Jonathan Hodge, Michelle Gane, Remke Van Dam, Peter Grace
Warra Tall Eucalypt
August and November 2012, February 2013, October 2014.
Tim Wardlaw

4
SECTION 2: Individual project reviews
This section reports on the on-ground (terrestrial) plot-based activities of the five SuperSites that
were TERN-funded when this review commenced. To understand, discuss and assess the way each of
the SuperSites are using on-ground plots, we sought to document several aspects of the individual
SuperSites as part of the review. This is the same approach as was taken in the main report.
Background to the project. Many of the SuperSites have been running for some time. In
some cases, project implementation has been staggered where additional methodologies
have been incorporated over time. The background or history of the project provides
context with respect to how the work is currently being implemented.
Broad objectives and specific objectives. The objectives of a given SuperSite focus the
interest on specific topics but generally do not provide the detail on how the work will be
undertaken.
Specific questions being addressed or proposed to meet the objectives. The questions that
an environmental scientist investigates reflect the objectives of their work and are a critical
aspect that influences how they design and undertake their scientific studies. Without
specific research questions it is hard to statistically evaluate a scientific investigation.
Study design. Design aspects such as site selection, sampling schemes, and any use of
stratification are significant components of scientific field studies. An important part of the
review will be trying to understand how well scientific questions can be answered using the
implemented study design. While analysis of field data is an important step, it is often
aspects of study design that determine how well study objectives can be met.
Measurement protocols. Measurement protocols differ from aspects of study design in that
they relate to what is actually measured or recorded on the study sites, and how.
How will the SuperSite’s scientific questions be examined or answered using the data? The
approach and implementation of data analysis is an important part of a study. We sought to
document the approach to data analysis that the principal investigators had used, or were
planning to use, where possible.
Discussion. A discussion of the SuperSite’s features and how they relate to meeting the
objectives.
The SuperSites are located in examples of different vegetation communities or land uses. When this
review commenced, there were five TERN-funded SuperSites: Warra, in tall eucalypt forest in
Tasmania; Calperum, in South Australian Mallee country; the semi-arid woodlands of the Great
Western Woodlands in west Australia; the Far North Queensland site in tropical rainforest; and the
south east Queensland Peri-urban SuperSite near Brisbane. A variety of environmental, hydrological,
ecological and edaphic measurements is made at the different SuperSites. There is a suite of
measurements, or variables that are measured at each of the sites and there are also SuperSite-
specific measurement that are only undertaken at particular SuperSites.
Some historical context is helpful in understanding where the SuperSites facility is today. Prior to the
EIF funding in TERN, the Queensland Government funded two 'Demonstrator SuperSites'with the
aim of evaluating if the concept of an intensively monitored site was a useful investment for
infrastructure funding in environmental science. At that stage there were no consistent measures

5
across the two SuperSites, FNQ Rainforest and SEQ Peri-urban, beyond each being required to host
an OzFlux station. Subsequently, the above two SuperSites lead an expansion into a new network,
the Australian SuperSite Network (SuperSites) during the TERN EIF period.
The new SuperSites facility established working groups during TERN EIF to develop network-wide
measurment protocols. Working group activity was accompanied with a modest level of federal
funding which provided minimum resourcing for developing network survey infrastructure. All
components of the program during the EIF period that were implemented on the ground had been
scaled back to suit the level of funding that existed across the network as a whole. Correspondingly,
the working groups focused on drafting reasonably standard measurement protocols to be applied
consistently across the network.
As NCRIS funding was, and is provided for research 'infrastructure' and not research projects, the
aim of the SuperSite investment has been to provide ecosystem monitoring data streams and to
provide on-site infrastructure which can be used by external researchers and educators funded to
answer research questions. Long-term monitoring data streams are 'data as infrastructure' which
may be used byresearchers as base-line data or used for calibration and validation, modelling and
other purposes.
The sample unit for SuperSite vegetation measurement protocols is a 'core 1ha vegetation plot'. This
plot size is widely used providing information at a suitable scale for vegetation monitoring
applications. In this building, development stage of the SuperSite facility where available funding
was adequate to only establish one, 1ha vegetation plot at each SuperSite location, there has been
no intention by researchers to generalise results beyond single plots to the broader district or
landscape. Within the one, 1ha plot that has been established on the sites, measurements have
occurred at an intensive level that researchers compare to activity undertaken by the NEON group in
the USA.
The siting of the 1ha plot at each of the SuperSites has been determined by the requirements to
locate the plot within the footprint or fetch of the OzFlux tower. It is a requirement of the program
that each SuperSite must have an OzFlux tower. OzFlux is a separate facility within TERN. In turn, the
siting of the flux tower is influenced by several factors and the objective is for the tower to collect
data from a reasonably uniform area of about 5km by 5km (minimum) across the landscape. This
means no sharp changes in vegetation type or terrain, nor creeks or lakes. It is understood from
researchers that the topography needs to be as flat as possible. For each SuperSite the selection of
the flux tower location was made by the Principal Investigator of the the OzFlux site which is part of
the SuperSite. The selection was carried out in consultation with both the key science advisors in
OzFlux, personnel from AusCover (to ensure that the 5km by 5km area was as appropriate as
possible), and the botanists associated with the SuperSite.
Once the flux tower location was chosen the siting of the 1ha core vegetation plot was then
undertaken. The core 1ha vegetation plot was required to be within the flux footprint of the OzFlux
tower, which means it had to be within 1km of the tower. In this regard, placement of the core 1ha
vegetation plot is constrained by the methodological requirements of the flux tower. That is, its
location cannot be freely sited, randomly or otherwise without regard to the flux tower
methodological requirements. With the tower situated in vegetation cover that was considered

6
typical or characteristic of the broader landscape, subsequent selection of the 1ha plot location was
based primarily on lack of disturbance, convenience of access and avoiding creeks.
Variables that were measured at all SuperSites during the NCRIS EIF funding period included:
vegetation monitoring at the core 1Ha (vascular plant species list with a minimum of one voucher
specimen collected for each species; the three most dominant species per strata (ground, mid and
upper), a visual estimate of cover for each stratum, the dominant growth form per species, average
height class for each stratum; height and diameter at breast height (DBH) for stems ≥10cm DBH),
avian surveys (see below) and the deployment of acoustic sensors (6 hours dawn/6 hours dusk
recording in stereo, 44KHz, 16Bit). The measurement of soil characteristics in the core 1Ha was
carried out at each SuperSite (full soil description, soil structure, soil chemistry). The vegetation
monitoring protocols were at a first version stage during the EIF period, but have succeeded in
providing each SuperSite with a consistent approach to measuring vegetation inside the 1ha core
plot. It is the intention of the SuperSite researchers to repeat all of the vegetation measurements
approximately every five years, although annual measurement has been proposed during the first
few years for some of the variables to provide some baseline information on year to year variation.
Avian surveys were carried out with different methods at each SuperSite during the EIF period, with
most using protocols similar to those recommended by Bird Life Australia. Following a period of
multi-year (and multi-season) surveys at the SuperSites, researchers are planning to reconvene their
avifauna survey groups to discuss and develop a network-wide approach to bird monitoring at the
SuperSites.
Acoustic sensors were provided to all five SuperSites during the EIF period. Other than Samford,
none of the teams had any expertise with these sensors. Researchers have advised that the location
of the acoustic sensor was chosen randomly either within the 1ha plot and/or co-located with the
avifauna survey in another part of the SuperSite. In the near future and where resourcing allows, it is
the SuperSites intention to develop standardised field protocols for vegetation sampling at the site
level (i.e. beyond the plot level), soil sampling at the site level and fauna sampling for selected taxa
other than birds.
There are a range of additional SuperSite-specific measurements which vary depending on the
particular SuperSite. TERN-funded SuperSite-specific activities are discussed in the following
individual sections.

7
Figure 2: The general location of the five SuperSites included in this review
Calperum Mallee
Figure 3: Calperum Mallee SuperSite location The shading seeks to highlight the general area of the study and does not indicate an effective study area.

8
Background to the project
The Mallee Calperum SuperSite is located on a 242 800 ha former pastoral station approximately
50km north west of Renmark, South Australia. In 1993, the lease was sold to the Federal
Government and soon after sheep were removed from the property. The property, along with
neighbouring Taylorville Station (92 600ha), is currently managed as a conservation reserve by the
Australian Landscape Trust in conjunction with the local community. The Calperum property spans
three major vegetation types from dune/swale mallee systems where the OzFlux flux tower is
located, south east through Callitris woodland to Black box (Eucalyptus largiflorens) floodplain
adjacent to the Murray River.
This review is largely confined to the on-ground biodiversity plot and associated EIF funded activities
that have been established as part of the TERN initiative.
Objectives
The objectives of the Calperum SuperSite are to investigate fluxes of water vapour and carbon
dioxide between the atmosphere, upper soil layers and groundwater as well as monitoring the
changes in vegetation and dependent biota associated with the different ecosystems of the
SuperSite.
Research Questions
The (non-atmospheric flux related) research questions that the scientists are examining are:
1. How are the biota changing in frequency and distribution as climate changes and more
management interventions are imposed?
2. How important is the connectivity between key ecosystems for hydrology, faunal movement
and refugia in times of drought?
Study Design
The core 1ha SuperSite vegetation plot has been established on a dune Mallee site within 25m of the
base of the Calperum flux tower. The site of the flux tower was chosen based on ecological, logistical
and security considerations. The researchers wanted to site the tower in a relatively large, consistent
patch of mallee that was minimally disturbed by historic grazing and a recent (110 000 ha) fire, while
also affording good vehicular track access for the convenience of future work. An additional
consideration was that the site for the flux tower needed to be reasonably isolated to help avoid
vandalism. Calperum generally has closed access with limited opportunity for third parties to enter
the property which was a motivating reason for Calperum to be chosen as a site for a flux tower.
Twenty bird survey sites have been established across a 5km by 4km area that is approximately
centred on the flux tower in Mallee vegetation. One survey site of 80m radius (2.01ha) was located
in each 1km block with selection focusing on sites characterising both the dune crests and dune
swales found in the mallee system, in addition to obtaining coverage of several fire ages present
across the 5km by 4km area. The researchers felt that the proportion of survey sites within each of

9
the fire ages classes largely corresponded to the prevalence of the age classes that were present
across the 5km by 4km area. Survey sites are generally a minimum distance of 500m apart. A total of
16 bird survey sites has been established on Black Box floodplain where the geomorphology of the
river systems means that survey sites have not been established in a rectangular grid like in the
Mallee system above, but are sited along the riparian strip of the river in order to confine the sites to
the Black Box floodplain vegetation. The bird surveys on the mallee grid centred on the flux tower
have been undertaken for the last three years while the surveys in the floodplain Black Box
community were first completed in 2013.
A total of 16 AusPlots Rangelands 1ha plots have been established on Calperum across the three key
vegetation types (Mallee, Callitris woodland, floodplain), including some established as part of the
Ausplots Rangelands training programs. SuperSite-specific protocols are likely to be undertaken at
an additional three of the AusPlots Rangelands plots, one in each of the key vegetation types. While
the location of some of the plots have been placed to help inform restoration activities on Calperum,
the Ausplots Rangelands plots are not considered further here as they are part of AusPlots
Rangelands activities rather than specifically being part of the Calperum SuperSite objectives.
Measurement protocols
Bird surveys are undertaken annually with each of the mallee and Black box floodplain set of sites
surveyed four times within a two week period. A 20 minute timed search is made of the 80m radial
distance survey site with the search undertaken in a spiral pattern within the circular area. All
surveys are undertaken by the same two observers with starting site and observer rotated among
the four annual surveys to help reduce confounding between bird detection and observer and time
of day.
Analysis
The researchers have not yet undertaken any analysis of the bird survey data but anticipate a range
of statistical modelling approaches could be useful including detection-occupancy modelling.
Discussion
The location of the Calperum SuperSite 1ha core vegetation plot lies about 25m from the foot of the
flux tower. The location of the flux tower itself was chosen using personal judgment and was made
after considering OzFlux criteria, ecological, logistical and security issues. Within these constraints
the flux tower has been established in an area of mallee that is regarded by researchers as being
typical or characteristic of the surrounding vegetation type. The location of the core 1ha plot within
the footprint of the tower was chosen subjectively. The benefits of employing an element of
randomisation in site selection (within constraints or otherwise) is discussed later in this report.
At Calperum, the intention is to complete SuperSite-specific protocols at multiple core vegetation
plots within each of the three vegetation communities that are present on the conservation reserve.
This replication will provide a measure of variability for a response variable of interest (e.g. basal
area). Where establishing additional plots in future at the SuperSites within vegetation types of
interest, it is recommended that researchers introduce an element of randomisation to avoid any
site selection bias that may occur through subjectively choosing the location of plots.

10
Over time, the bird survey work being undertaken in the mallee and in the floodplain provides an
opportunity for the researchers to examine the question of whether the Black Box floodplain
community may act as a refuge for species in times of drought. Within each of the mallee and
floodplain communities where the survey work is being undertaken there are multiple, well
separated survey sites that are repeatedly measured within a season to help characterise the
avifauna that occur there. The researchers chose the location of the survey sites across the 4km by
5km grid to try and represent the heterogeneity that occurred across the area with regard to the
available combinations of topography (dune crests/swales) and fire age. The researchers wanted to
do this because both of these factors influence vegetation structure, which in turn influence the bird
species which are likely to be found in these areas. An effort was also made to include landforms
that were less common, but frequently encountered across the broad mallee vegetation type, like
claypans. Again, the researchers chose to do this to try and include as much of the structural
diversity as they could. The same strategy was used for the Black Box floodplain sites. The
researchers emphasised that their interest is in characterising the avifauna of the 4km by 5km
mallee grid as a whole, for comparison with the floodplain community, rather than contrasting
results from different fire age and topographic combinations within the area itself. The researchers
considered the benefits of using some form of randomisation to avoid site selection bias but
regarded it as too impractical. This was due partly to the difficulty of knowing which dune crests and
swales were well-formed enough to accommodate a 2ha survey site without first walking the area to
understand this potential constraint. That is, identifying potential sites that they considered were
suitable for inclusion for a random selection process would have required them to undertake an
initial ground survey. Additionally, the researchers were also interested in including a range of
mallee vegetation structure that occurred across the 4km by 5km area, but this information was not
available without first walking and mapping this finer classification of the vegetation. Effectively, the
factors that the researchers were most interested in stratifying by where not identifiable without a
resource-intensive survey to map them, so they instead chose the sites subjectively. The researchers
stressed they did not go out of their way to choose grossly dissimilar sites with regard to vegetation
structure, but were interested in including a range of what was available.
Notwithstanding the researchers desire to choose a range of diverse sites to encompass the diversity
of the mallee (and floodplain) area, the absence of an element of randomisation in site selection
introduces the potential for inadvertent bias. This is the case whether the motivation for study is
contrasts within the 4km by 5km area or comparisons with other larger areas of a different
vegetation type (e.g. with the Black box floodplain community). Introducing an element of
randomisation in the site selection process would afford greater reliability that the sites chosen
stood to more effectively characterise the broader 4km by 5km area of interest.
The use of detection-occupancy models is an active research area. It is recommended that
researchers use these methods with caution as it is unclear when these types of models provide
improved estimates compared to the approach where no adjustment is made for detectability. The
four survey repetitions that the researchers do annually may be expected to provide a reasonable
level of confidence that a large proportion of species present at the site are detected compared to
studies that complete fewer surveys.
11
Summary
The Mallee Calperum SuperSite has been funded to implement standard SuperSite protocols,
currently at one core vegetation plot. Long term bird survey sites have been established in mallee
and floodplain vegetation to investigate whether floodplain vegetation may act as a refuge in times
of drought. With consistent observers and repeated surveys within a season, the implemented field
measurement protocols can be expected to reduce measurement errors compared to a less
systematic, more opportunistic survey method. However, with the absence of some form of
probability sampling used to select the bird survey sites themselves, caution should be used when,
or if, generalising the results across the broader mallee and floodplain vegetation communities. At
the district scale, the Calperum property provides an opportunity to record the pattern of flora and
fauna distribution and abundance following the removal of grazing pressure from the property in
1994.
FNQ Rainforest
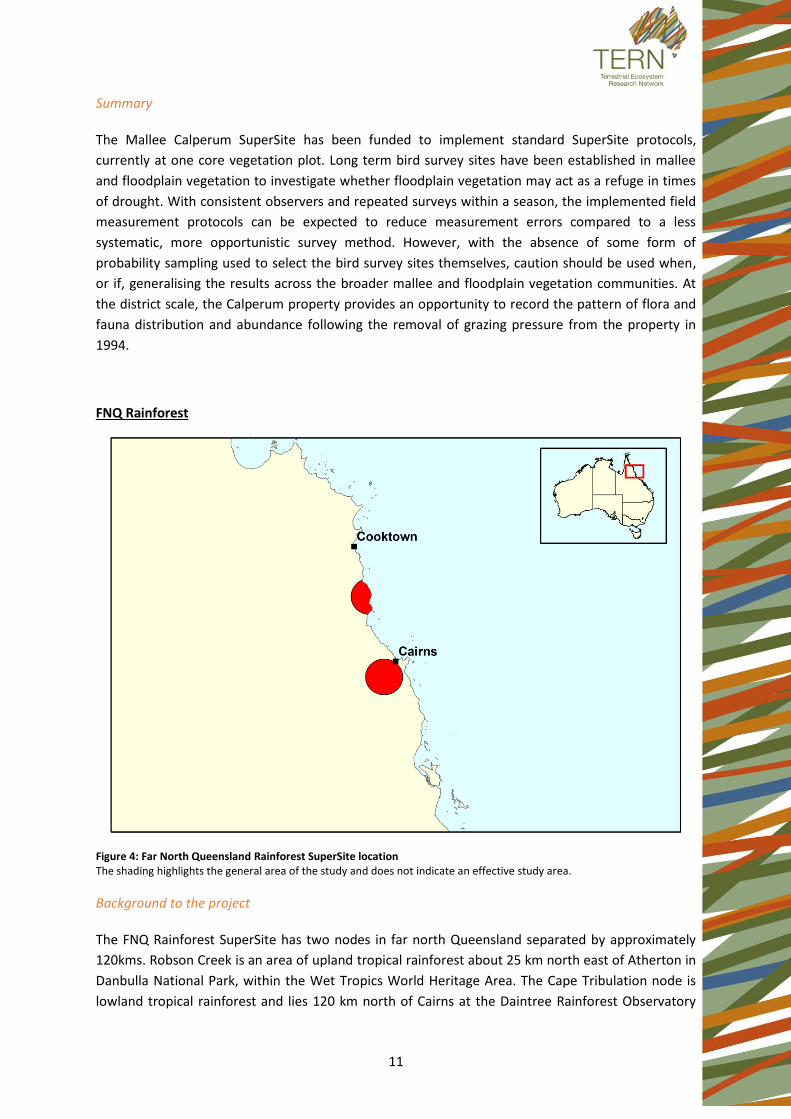
Figure 4: Far North Queensland Rainforest SuperSite location The shading highlights the general area of the study and does not indicate an effective study area.
Background to the project
The FNQ Rainforest SuperSite has two nodes in far north Queensland separated by approximately
120kms. Robson Creek is an area of upland tropical rainforest about 25 km north east of Atherton in
Danbulla National Park, within the Wet Tropics World Heritage Area. The Cape Tribulation node is
lowland tropical rainforest and lies 120 km north of Cairns at the Daintree Rainforest Observatory

12
(DRO). Rainforest research at each of the two nodes, Robson Creek and Cape Tribulation, pre-dates
TERN. The Canopy Crane at the DRO was established with ARC Infrastructure funding in 1998 and a
1ha vegetation plot and the flux station on the crane tower date back to 2000 and 2001 respectively
and were previously supported by the Cooperative Research Centre for Tropical Rainforest Ecology
and Management (CRC-TREM) and the Marine and Tropical Sciences Research Facility (MTSRF). No
activities were carried out with TERN funding during this period at the DRO and so the Cape
Tribulation node is not discussed further.
Objectives
The objectives of the FNQ Rainforest SuperSite are to investigate fluxes of water vapour and carbon
dioxide between the atmosphere, upper soil layers and groundwater as well as monitoring the
changes in vegetation and dependent biota associated with these tropical rainforests.
Research Questions
The (non-atmospheric flux related) research questions that the scientists are examining are:
1. How are the biota (in particular locally endemic species) changing in frequency and
distribution and what are the drivers for this?
2. Does the vegetation represent a stable structure (overstorey versus understory dynamics) or
has climate change affected it?
3. Which taxa of organisms are the most sensitive to local climate change and how can these
be assembled into an accurate biodiversity monitoring tool?
4. How important is the connectivity between ecosystems for hydrology, faunal movement and
as refugia under conditions of past and future climate change?
Study Design
The 500m by 500m, 25ha plot at Robson Creek was established from 2010-2012. There were distinct
choices made as to the plant community type (complex mesophyll vine forest RE 7.3.36a,
Queensland Government 2006), the elevational range (mid elevation around 700m), a consistent,
common soil type (Acidic, Dystrophic, Brown Dermosol), rainfall regime (moderate, around 2m) and
logging history (selectively logged). These joint attributes corresponded to tropical rainforest in
other parts of the bioregion that the researchers were interested in. Within the area chosen for the
plot, for convenience when measuring the vegetation, the western and southern edge of the plot
were aligned with specific map grid coordinates. In addition the location of the 25ha plot had some
logistical constraints, to have 12-month, all weather access, while incorporating minimal
topographical variation across the plot limited to include creeks, low ridges and gullies to allow for
the installation of a flux station. Inside the 25ha plot, sub-plot 6, a relatively homogeneous area,
floristically and edaphically, was chosen for the core 1ha vegetation plot at Robson Creek.
Some selected fauna survey work has been undertaken at the Robson Creek node during the EIF
period. The vertebrate fauna survey work that was carried out by the Centre for Tropical Biodiversity

13
and Climate Change (CTBCC, JCU) is largely funded from external funding sources. Invertebrate
survey work within the 25ha plot has been undertaken at Robson Creek.
Measurement protocols
For establishing the 500m by 500m, 25ha plot at Robson Creek, differential GPS with post-processing
was used to maximise the accuracy of permanently marking out the plot. Twenty-five, 1ha
contiguous subplots were delineated and for convenience, field measurements were undertaken by
dividing each hectare into 20m by 20m subplots. There is separate numbering of measured trees
within each of the 25, 1ha subplots. Trees, palms, vines and ferns ≥10cm diameter at breast height
(DBH; generally 1.3m from the ground), had their diameters measured and had their location
mapped on the plot. Stems measured have had the point of measurement marked by painting a ring
around the stem where diameters were recorded. Heights have been visually estimated to the
nearest metre on these same trees that are ≥10cm DBH, using a laser rangefinder where possible
and visual estimation for the remainder of the stems.
The core vegetation SuperSite protocols are implemented in the 1ha plot at Robson Creek.
An additional work program has established a set of seedling transects on the 25ha plot. The aim of
the Seedling Survey was to document the diversity and patterns of relative species abundances from
a sample of seedlings. For this survey, a seedling was defined as any stem ≥ 15cm in height, and ≤
1cm diameter at breast height (130cm), and thus included not only tree seedlings, but also herbs,
shrubs and vines. A total of 169 seedling transects (lines) were established using the 20m grid
established by CSIRO. Each line is nominally 20m long and to 1m wide. The 169 Lines are arranged in
a 13 by 13 m grid. All Lines are oriented south-north, with the start of each Line at the southern end.
Plants have been tagged, mapped, measured and ID to species (around 12500 individuals). The
same methods have been used in this work as have been used in the LTERN Connell Rainforest Plots
to enable comparisons across the Lamb Range.
Bird survey work is being undertaken at Robson Creek. Fortnightly surveys are undertaken on the
25ha plot using a transect approach that is largely consistent with the Bird Life Australia
recommended protocol. Researchers commence surveys from between 6-8 am (depending on the
season), and walk three set trails across and adjacent to the plot within three hours. The same two
observers have been used over the duration of the study where possible. A range of attributes are
recorded as part of the survey including: species, number of individuals and time since
commencement of the survey. An acoustic sensor to detect fauna calls has been established at the
start of the first transect that is used for the bird survey.
Additional fauna survey work is carried in accordance with protocols established in the Centre for
Tropical Biodiversity and Climate Change (CTBCC) at James Cook University. The larger program that
runs out of CTBCC is composed of five locations where a range of taxa are recorded using systematic
protocols over each of the five altitudinal gradients. As part of this larger project, a transect has been
set up at Robson Creek (as part of the Lamb Range location). The base unit is a 1km transect with 6
evenly-spaced points (200m interval) along which a range of fauna are surveyed. It is unknown how
the location of the transect was originally chosen. Spotlighting is undertaken for 60 minutes along
the 1km transect by two people, each using one high-powered spotlight (arboreal mammals, owls)
14
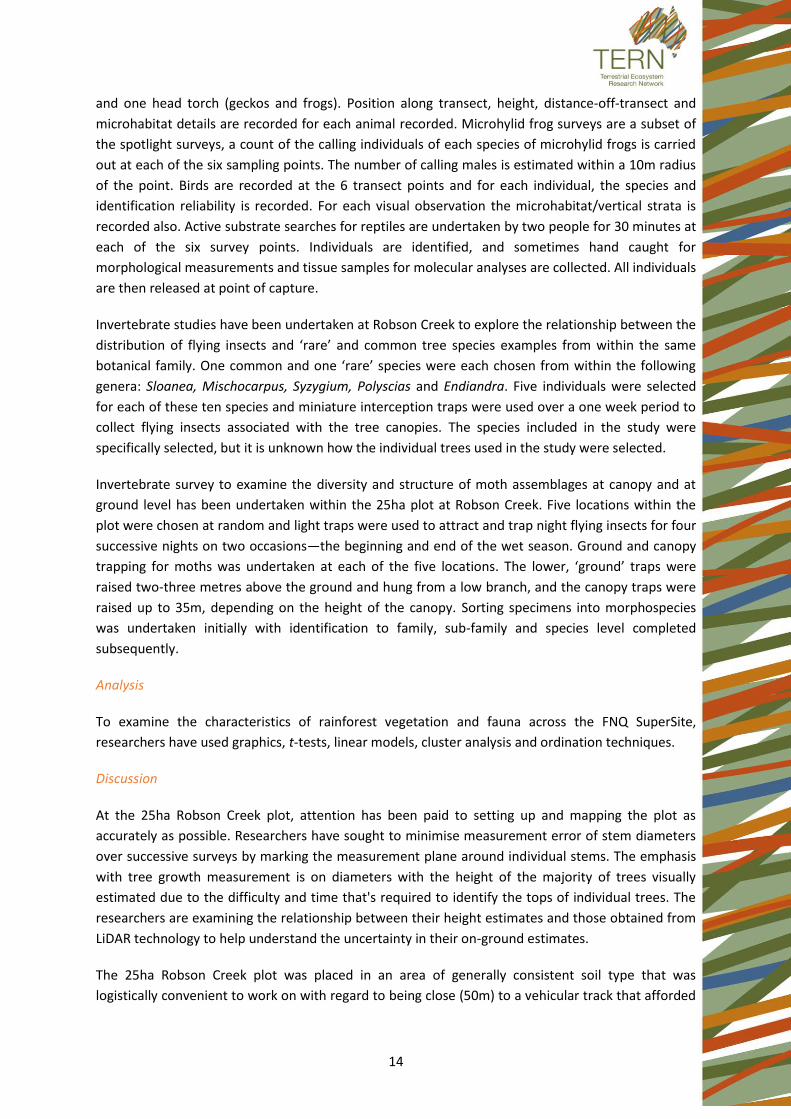
and one head torch (geckos and frogs). Position along transect, height, distance-off-transect and
microhabitat details are recorded for each animal recorded. Microhylid frog surveys are a subset of
the spotlight surveys, a count of the calling individuals of each species of microhylid frogs is carried
out at each of the six sampling points. The number of calling males is estimated within a 10m radius
of the point. Birds are recorded at the 6 transect points and for each individual, the species and
identification reliability is recorded. For each visual observation the microhabitat/vertical strata is
recorded also. Active substrate searches for reptiles are undertaken by two people for 30 minutes at
each of the six survey points. Individuals are identified, and sometimes hand caught for
morphological measurements and tissue samples for molecular analyses are collected. All individuals
are then released at point of capture.
Invertebrate studies have been undertaken at Robson Creek to explore the relationship between the
distribution of flying insects and ‘rare’ and common tree species examples from within the same
botanical family. One common and one ‘rare’ species were each chosen from within the following
genera: Sloanea, Mischocarpus, Syzygium, Polyscias and Endiandra. Five individuals were selected
for each of these ten species and miniature interception traps were used over a one week period to
collect flying insects associated with the tree canopies. The species included in the study were
specifically selected, but it is unknown how the individual trees used in the study were selected.
Invertebrate survey to examine the diversity and structure of moth assemblages at canopy and at
ground level has been undertaken within the 25ha plot at Robson Creek. Five locations within the
plot were chosen at random and light traps were used to attract and trap night flying insects for four
successive nights on two occasions—the beginning and end of the wet season. Ground and canopy
trapping for moths was undertaken at each of the five locations. The lower, ‘ground’ traps were
raised two-three metres above the ground and hung from a low branch, and the canopy traps were
raised up to 35m, depending on the height of the canopy. Sorting specimens into morphospecies
was undertaken initially with identification to family, sub-family and species level completed
subsequently.
Analysis
To examine the characteristics of rainforest vegetation and fauna across the FNQ SuperSite,
researchers have used graphics, t-tests, linear models, cluster analysis and ordination techniques.
Discussion
At the 25ha Robson Creek plot, attention has been paid to setting up and mapping the plot as
accurately as possible. Researchers have sought to minimise measurement error of stem diameters
over successive surveys by marking the measurement plane around individual stems. The emphasis
with tree growth measurement is on diameters with the height of the majority of trees visually
estimated due to the difficulty and time that's required to identify the tops of individual trees. The
researchers are examining the relationship between their height estimates and those obtained from
LiDAR technology to help understand the uncertainty in their on-ground estimates.
The 25ha Robson Creek plot was placed in an area of generally consistent soil type that was
logistically convenient to work on with regard to being close (50m) to a vehicular track that afforded

15
year-round access to the plot. These are important considerations in making large projects such as
this feasible—ready access and constraining the study material with regard to factors, (here, soil),
that are known to influence the response the scientists are interested in (e.g. species diversity, stem
density). The researchers have remarked that after restricting potential sites to all-weather access
and consistent soil type, there were limited options to choose from and once the requirement for
moderately flat terrain became involved (for flux measurements) there is limited opportunity to use
any form of randomisation in site selection.
The 25ha plot represents an example of simple to complex notophyll vine forest on a low-relief
landform, with low or moderately low soil fertility. Logging across most of the plot dates back to the
early-mid 1960's with some harvesting occurring up until 1969. It is thought that prior to harvesting,
some silvicultural treatment (non-harvest of large seed trees, thinning or poisoning), may have been
applied across most of the 25ha plot. It may be expected that most of these characteristics;
landform, soil fertility and disturbance history, may influence aspects of forest dynamics that the
researchers are interested in. While it is clear the plot represents a massive investment of resources,
lack of independent replication at the 25ha whole-of-plot level means that no measure of variability
is available at the same scale for estimates derived from the plot like biomass or carbon. Researchers
stress that the function of these large plots is to track vegetation dynamics over time and the
appropriate scale for this is 25-50ha—there is little expectation that such resource-intensive studies
can be replicated. The researchers have learned much from the measurements made at the
extensive 25ha Robson Creek plot. However, it is unknown how typical the values and relationships
derived from the plot are of rainforest at similar elevation, terrain and soils in the region. The
subjective placement of the vegetation plots at the FNQ SuperSite, including the core 1ha SuperSite
plot, introduces the potential for inadvertent bias in site selection. The benefits of employing an
element of randomisation in site selection (within constraints or otherwise), is discussed later in this
report. Methodology to investigate moth assemblages at the ground and canopy level employed
randomisation to select the samples across the 25ha plot. Results from this study have a secure
inferential basis to draw conclusions across the broader plot area.
Researchers have collected baseline data on rainforest structure and composition. It is understood
there is an intention to re-measure the plot approximately every 5 years.
Summary
The FNQ Rainforest SuperSite is composed of two nodes: lowland rainforest at Cape Tribulation and
upland rainforest at the Robson Creek location. Core 1ha SuperSite vegetation plots have been
established in each location and a large 25ha plot for investigating forest structure and dynamics has
been established at Robson Creek. Vertebrate and invertebrate surveys have been undertaken at
Robson Creek. The location of the vegetation plots have been subjectively chosen across the FNQ
SuperSite. Probability-based sampling in the moth assemblage study provides a secure basis for
inference across the 25ha plot.

16
Great Western Woodlands
Figure 5: Great Western Woodland SuperSite location The shading seeks to highlight the general area of the study and does not indicate an effective study area
Background to the project
The Great Western Woodlands in south-western Western Australia cover approximately 16 million
hectares and have remained largely unmodified due to the highly variable rainfall and absence of
readily available groundwater for livestock. The woodlands have a high diversity of semi-arid
Eucalypt species. The SuperSite was established to undertake long-term ecological studies on
woodland processes and biodiversity. The flux tower site is located on Credo Station, a former
pastoral property which is located about 120km north west of Kalgoorlie. Credo was purchased in
2007 as a proposed conservation reserve. There is a variety of work being undertaken under the
broader umbrella of the Great Western Woodlands project and researchers have said much of the
work being done at the SuperSite has a significant amount of co-funding, with the TERN-funded
component being relatively modest. Where the proportion of co-funding is substantial, these
scientific sub-components are often designed around the external partner's preferences rather than
being directly in control of the Great Western Woodlands SuperSite researchers themselves.
There are three key sets of terrestrial plots established as part of the Great Western Woodlands
SuperSite: six, 1ha SuperSite vegetation plots; 70, 50m by 50m Gimlet (Eucalyptus salubris)
woodland `fire-chronosequence' plots; and 100, 20m by 20m Salmon gum (E. salmonophloia) plots,
the latter to survey and describe the variation in the Salmon Gum woodland community across the
broader region. In addition to the above there is a set of experimental plots in the wheatbelt to the
south west of the woodlands that are part of the international Nutrient Network study
(http://nutnet.org/). There is a range of further supporting projects such as the Ngadju Kala project

17
which facilitated traditional owners documenting their fire knowledge and their current land
management aspirations.
To examine how Gimlet woodland changes with fire age, 70 permanently marked 50m by 50m plots
were established across three different districts in the western region of the Great Western
Woodlands. Fire age of the stands of woodland were estimated through a combination of Landsat
image interpretation, growth ring counts, and growth ring-tree size relationships. It is understood
that survey sites were stratified by three classes of fire history where the last fire was: <10 years
ago; between 38-60 years ago; and >60 years ago. Sites were constrained to Nature Reserves or
unleased crown land and were within 1km of a vehicular track. Sites were a minimum distance of
250m apart, except when they were located in a fire damaged area from the same fire, when they
were placed 500m apart. Within the above constraints, personal judgment was used to establish the
sites in an area of relatively uniform vegetation. More information can be found in Gosper et al.
(2013). This project was reviewed, but researchers have informed us that the project does not
receive TERN funding so the content has been removed and the project is not discussed further.
The discussion here is largely restricted to the core 1ha SuperSite vegetation plot which was the key
activity associated with TERN EIF SuperSite funding.
Objectives
The objectives of the Great Western Woodlands SuperSite are to investigate fluxes of water and
carbon dioxide between the atmosphere, vegetation and upper soil layers in a semi-arid woodland
ecosystem at the edge of its climatic range, and to provide a supporting long-term data stream
indicating fluctuations and trends in a constrained sample of the biota over a long timeframe.
Further, through its infrastructure it aims to facilitate a diversity of related projects to understand
and manage the biological assets of the Great Western Woodlands and inform restoration of the
Western Australian wheatbelt.
Research Questions
Over longer time frames, core monitoring plots in conjunction with supporting studies, aim to
address the questions:
1. What are the fundamental ecological processes operating to support semi-arid E.
salmonophloia woodlands?
2. How do elements of the flora and fauna vary seasonally and inter-annually and can these be
related to associated flux and environmental data?
3. Are the biota stable or is there evidence for directional change over longer time periods?
How does this relate to environmental data? Are trends consistent among different
elements of the biota or are particular elements good candidates as biological indicators of
change?
Scientists associated with the SuperSite are building on the basic research infrastructure through a
range of associated, externally supported research projects focusing on questions related to climate
change, fire, biogeography, ecophysiological processes and Aboriginal engagement in the Great
Western Woodlands; and to broader, cross-supersite questions such as relationships between

18
remote sensing and ground-based measurements, and within- vs among-site drivers of plant trait
diversity. These associated studies are not reviewed here.
Study Design
The flux tower at the Great Western Woodlands SuperSite is located in an area of mature Salmon
Gum woodland on the proposed Credo conservation reserve in the north of the Great Western
Woodlands. The flux tower is 36m high and is estimated by the researchers to have a collection
distance or footprint of about 2km from which the tower instrumentation can draw measurements.
Researchers contrast this broader footprint with a smaller, `prime' sub-area, where most of the
information from the flux tower instrumentation is sourced. The location and effective footprint of
the tower influences where the core 1ha vegetation plots are placed. It is understood that the
location of the flux tower was chosen to represent characteristic of Salmon gum (Eucalyptus
salmonophloia) and associated woodland, selected on the basis of key criteria (old growth woodland
dominated by Salmon gum, suitable uniformity across the approximately 4km2 flux footprint,
absence of apparent air drainage issues or interference from salt lakes) and extensive
reconnaissance survey across the Great Western Woodlands. The Credo location was also
considered advantageous due to proximity to the ‘Mulga line’ approximately 20 km to the north.
This represents a major ecotone between eucalypt woodland and acacia-dominated vegetation
associated with a temperature gradient, and hence climate change responses may become evident
here sooner than in more southern locations.
SuperSite vegetation measurements have been undertaken at two, 1ha plots within the `prime'
footprint of the flux tower and an additional four 1ha plots that are also being measured in a staged
process (due to limited resources). The two 1ha plots closest to the tower are a Salmon Gum
woodland plot and Gimlet woodland plot reflecting the dominant vegetation. The four additional
plots are examples of associated, more minor vegetation types within the flux footprint: Blackbutt
woodland (Eucalyptus clelandii), Redwood woodland (Eucalyptus transcontinentalis), Mulga
woodland and chenopod shrubland. Annual monitoring of floristics is being undertaken in the core
Salmon Gum woodland plot, with the other five plots are being surveyed on a rotational basis
according to resources.
A total of six test bores were drilled to establish ground water quality and monitoring. None of the
bores initially struck groundwater, but a bore in Salmon Gum woodland and one in Blackbutt
woodland have been retained for permanent monitoring approximately every four months. These
two bores subsequently filled with some water, the greatest depth being around 45m with a high
saline concentration from the Salmon Gum bore.
Measurement protocols
The standard SuperSite vegetation protocol has been used at the Salmon Gum core 1ha vegetation
plot and where resources permit, similar measurements are also being completed at the other five
1ha plots in or near the footprint of the flux tower. Two acoustic sensors are installed at the
SuperSite, one in the 1ha Salmon Gum plot, and another in the 1ha Gimlet plot. These are recording
bird and other calls 12 hours a day from one hour before sunrise for six hours and for six hours in the
afternoon until an hour after sunset. Twenty dendrometers to record continuous tree diameter/girth
growth have been employed across the four eucalypt core 1ha plots (Salmon Gum, Gimlet,

19
Blackbutt, Redwood). In each of the four plots, dendrometers have been placed on four mature
individuals, with an additional four smaller sized stems being measured in the Salmon Gum plot.
Researchers have installed 15 litter traps at each of the four eucalypt core 1ha plots which survey
litter fall 3-4 times per year. The dendrometers and litter traps are additional to the standard
SuperSite vegetation protocol. AusPlots Rangelands protocols have been completed at the six Great
Western Woodland 1ha plots within the footprint of the flux tower.
Birdlife Australia volunteers undertake bird surveys at selected 1ha vegetation plots as part of a
broader bird survey project across the Great Western Woodlands. The volunteers use a 20-minute
2ha timed search, a protocol recommended by Birdlife Australia. The 2ha search areas are
superposed on the 1ha SuperSite plots, with the Salmon Gum and Gimlet plots (those closest to the
flux tower), being the priority for survey. Researchers reported that the Birdlife Australia volunteers'
intention is to do surveys at all six SuperSite vegetation plots twice per year if possible. Bird surveys
are completed in Spring and Autumn each year.
Analysis
This is a new SuperSite and researchers reported that analyses will only commence on the SuperSite
core plots in future years.
Discussion
As with all of the SuperSite projects, the location of the flux tower is chosen based on a number of
considerations including the desire to collect data from a typical or characteristic example of the
vegetation types of interest. On the Credo property, the most prominent vegetation types are
Salmon Gum woodland and Gimlet woodland. While the researchers used personal judgment in
choosing a typical, homogeneous patch of woodland to place the 1ha core plots, they stressed they
were conscious of not choosing the most attractive, statuesque area to include within the plot
boundary and were more interested in obtaining a typical example of the vegetation community.
However, with no formal mechanism of randomisation used in the site selection process, both at the
tower and the plot level, there is the potential for bias to have inadvertently been introduced.
Researchers have stressed that the main purpose of the plots is to compare time sequences within
plots rather than draw conclusions more broadly about the respective vegetation communities. The
benefits of employing an element of randomisation in site selection (within constraints or
otherwise), is discussed later in this report. While limited resources make independent replication of
each of the Salmon Gum and Gimlet plots within the flux tower unfeasible, vegetation survey within
these communities across the Great Western Woodlands may help to place the ‘flux tower’ plots in a
regional context.
The bird survey work on the Great Western Woodlands SuperSite is being done by BirdLife Australia
volunteers using a protocol recommended by the volunteer organisation. While it is understood that
many of the volunteers are experienced bird watchers, there is no deliberate plan to either minimise
the number of observers participating in the surveys or to keep the same individual observers in the
surveys. This is understandable with volunteer programs, where participation and learning is
encouraged as a priority. The use of an informal approach to using different observers for the 20-
minute, 2ha timed searches may be expected to result in observer bias and variability in
measurement error for recording birds.

20
Summary
The Great Western Woodlands SuperSite is a focal point for a variety of different environmental,
ecological and cultural studies that are improving the understanding of this poorly surveyed region
of Western Australia. Multiple vegetation plots have been established at the SuperSite, but lack of
replication from limited resourcing means variability of whole-of-plot estimates cannot be obtained
for each vegetation type. The use of volunteers to undertake the bird surveys can be expected to
introduce some unknown variability in the data due to the range of observers being used in the
surveys.
References
Gosper, C.R., Prober, S.M., and Yates, C.J. (2013). Multi-century changes in vegetation structure and
fuel availability in fire sensitive eucalypt woodlands. Forest Ecology and Management, (310) 102-
109.
SEQ Peri-urban
Figure 6: South East Queensland Peri-Urban SuperSite location The shading seeks to highlight the general study area and does not indicate an effective study area.
Background to the project
The motivation for the South East Queensland Peri-urban Supersite is to investigate the reduction in
ecosystem services due to increasing land use intensification on the outskirts of Brisbane. Land use
intensification adjacent to cities and large towns may be commonly characterised by the conversion
of: a) rural land supporting varying levels of native vegetation; to b) rural residential zoning with
accompanying loss of vegetation and water quality; through to c) an urban environment with high

21
density housing and associated infrastructure. The South East Queensland Peri-urban Supersite
seeks to examine the effects of land use intensification with a strong hydrological perspective during
the TERN EIF period. During TERN EIF there were three distinct components to this Supersite
alliance: the Samford node approximately 20km to the north of Brisbane, the Logan and Albert River
activities to the south of Brisbane, and a 900ha native vegetation reserve, Karawatha Forest Park,
which lies within the Brisbane urban perimeter in the north of the Logan River catchment.
For the Samford node, detailed information was provided by the researchers on the application of
the hydrological model across the Samford/Pine River catchment and replicated greenhouse gas flux
measurements at Samford.
At Samford, the influence that land use and vegetation types have on relatively small scale water
and nitrogen cycling on the SERF property are investigated using a combined data capture-model
calibration-validation approach. This approach utilizes a three-dimensional water balance estimation
and nutrient export model; the Soil and Water Assessment Tool (Arnold et al. 1998). Within the SERF
property, a series of soil moisture probes were nested within transects orientated along drainage
lines across the property. Field data from the moisture probes is used to calibrate and validate the
tool (hydrological model) and the potential effect of land use intensification is examined by
contrasting flows from the areas supporting native vegetation on the property with those that have
been cleared for agriculture. More information on the specifications of the hydrological model can
be obtained from the principal investigator, Professor Peter Grace (QUT).
In addition to the intensive soil moisture measuring undertaken in the two different areas within the
sub-catchments of the SERF property, two permanent measurement stations have been established
on Samford Creek to provide continuous stream quality and flow data. One station, representing less
intensified land use, is located on the SERF property while the second is sited about 4-5km
downstream and is fed by water from the nearby Samford Village and the greater area of the
Samford Valley. The researchers contrast the results from the two stations to help understand the
effect of land use intensification in the Samford district. More information on the sensors used to
record the water quality and flow can be obtained from the researchers.
As hydrological work is not the focus of the review, detail of the hydrological work being pursued at
the northern node in the Samford/Pine River catchment of the South East Queensland Peri-urban
SuperSite is not examined further.
Objectives
The objectives of the South East Queensland Peri-urban SuperSite are to assess the impact of
urbanisation, development and subsequent fragmentation of the landscape on selected terrestrial
and aquatic biogeochemical processes and their impact on faunal biodiversity and overall ecosystem
health.
Research Questions
The (non-atmospheric flux related) research questions that the scientists are examining are:
1. What are the current stocks and fluxes of water and nutrients between the terrestrial (and
aquatic) ecosystem components and the hydrosphere/geosphere?
22
2. How are stocks/fluxes of water and nutrients influenced by management / disturbance /
inter-annual variability?
3. How are the key processes expected to respond to future environmental change?
Study Design
The Samford Ecological Research Facility (SERF) is a 50ha property located about 20kms north of
Brisbane and used by the Queensland University of Technology for a variety of different kinds of
research. The property lies in the Samford Valley which occupies an area of approximately 50km2.
The dominant land use in the Valley is rural residential, residential and some rural properties. The
SERF property has patches of remnant native vegetation adjacent to cleared pasture. It was
therefore regarded by the researchers as an appropriate site to investigate land use intensification
on water flows and water quality. In addition to the onsite measurements taken, water quality
measurements are also recorded from the Samford Creek, which is beyond the SERF property (as
summarised above under Background to the project).
Karawatha Forest Park is a 900ha conservation reserve, in Logan, south of Brisbane. The Park is
managed by Brisbane City Council and contains a variety of native vegetation communities. The
property lies within the urban perimeter but has rural and rural residential land on the southern and
south east boundary. In 2007, prior to the advent of TERN, 33 biodiversity survey plots were
systematically located across Karawatha Forest Park.
Measurement protocols
A 1ha SuperSite vegetation plot has been established on the SERF property where acoustic sensors
have also been deployed and conventional timed (20 minute) bird surveys are undertaken. The
timed bird surveys are undertaken across the 1ha vegetation plot every month but it is not known
how many observers participate in this part of the project or what type of information is recorded
during the surveys. The researchers from the Samford node are using birds, with data obtained from
the acoustic sensors and the conventional timed-searches, as selected fauna to examine the
patterns and dynamics of terrestrial biodiversity.
Biodiversity survey plots in Karawatha are 250m by 40m belt transects, each orientated along the
contour and separated by 500m. A range of flora and fauna attributes is measured using a nested
protocol where larger diameter plant individuals (or more active fauna species) are measured across
a broader width of belt transect. A one metre-wide buffer strip, where measurement protocols are
not implemented, is established either side of the transect midline. More details can be found in
Hero et al. (2010). A range of variables and taxa have been recorded using standardised protocols
since the plots were established in 2007, including vegetation composition and abundance, birds,
herpetofauna, small mammals and vegetation structure attributes including hollow bearing trees.
Different bird protocols have been contrasted using the plots by systematically investigating data
recorded from experienced ornithologists, 'citizen scientists', and acoustic recorders.
Analysis
A range of analyses have been undertaken on the measurements recorded from Karawatha Forest
Park examining vegetation attributes and the distribution and abundance of a range of fauna
including multivariate, and regression analyses and kriging.

23
Discussion
Samford Valley, north of Brisbane, has seen significant changes in land use in changed a lot in the
last 50 years, and particularly in the last twenty. The SERF property supports a range of different
land uses that are typical of those found in the broader district.
The systematic placement of field study plots across the 900ha Karawatha Forest Park is uncommon
among ecological field studies which instead, predominantly use personal judgement in deciding
where to place field plots. The systematic placement of plots, based initially on an arbitrarily placed
grid, provides a sound basis on which to generalise results across the Park, provided the plot
locations do not inadvertently coincide with any cyclical or landscape pattern across the area. The
researchers acknowledge this point and do not believe that the placement of the plot grid coincides
with any systematic bias across Karawatha Forest Park. The design at Karawatha Forest Park is
unbiased and effective for examining the variability of a range of flora and fauna attributes.
Researchers have reported that the spacing of the survey plots is adequate for measurements from
the plots to be regarded as spatially independent for a range of variables that they are interested in.
The researchers routinely explore autocorrelation of response variables when they undertake
analyses. It is recommended that when kriging results are presented or discussed, the researchers
complement them with the associated modelled standard error surface to communicate the
uncertainty associated with the fitted response surface.
The 'expansive', hierarchical nature of the belt transects on which the measurement protocols are
implemented is a useful approach that provides larger survey areas for larger organisms. This helps
to obtain field measurements at a meaningful ecological scale. The incorporation of a 2m-wide
survey 'dead-zone' down the middle of the long axis of the transect helps improve survey access and
reduces disturbance of ‘active’ parts of the plot from foot traffic associated with survey activities.
Summary
The Samford Valley node of the South East Queensland Peri-urban Supersite focuses on contrasting
modelled water flows between cleared and vegetated land to describe land use intensification. The
biodiversity survey work undertaken at Karawatha Forest Park is a compact study in its own right
and has the foundational design to explore variation in flora and fauna across the Park and how this
may change over time.
References
Arnold, J.G., Srinivasan, R.S. Muttiah, Williams, J.R. (1998). Large area hydrologic modeling and
assessment-Part 1: model development. Journal of the American Water Resources Association 34(1):
73-89.
Hero, J-M., Castley, J.G., Malone, M., Lawson, B., Magnusson, W.E. (2010). Long-term ecological
research in Australia: innovative approaches for future benefits. Australian Zoologist, 35(2), 216-228.

24
Warra Tall Eucalypt
Figure 7: Warra Tall Eucalypt SuperSite location The shading highlights the general study location and does not indicate an effective study area.
Background to the project
The Warra SuperSite is located approximately 50km south west of Hobart and occupies an area of 15
500 ha of Tall Eucalypt forest between the Weld and Huon Rivers in Tasmania. Over half of the
SuperSite lies within Tasmanian Wilderness World Heritage Area with the remaining tenure being
State forest. The location of the TERN Warra SuperSite was chosen to coincide with the existing
Warra Long-term Ecological Research (LTER) area that was formally established in 1997. Wet
Eucalyptus obliqua forest is the most common forest type at Warra and is also the most common
forest community across Tasmania.
The Warra LTER site has focused on exploring topics related to sustainable forest management.
Continuing research projects at the Warra SuperSite that pre-date TERN include the Silvicultural
Systems Trial that investigates alternative coupe-scale harvesting methods, the Altitudinal Transects
project to examine the distribution of selected taxa, gauged weirs that record stream flow and water
quality, a Bureau of Meteorology climate station, and a log decay study that examines the response
of beetles to the condition of coarse woody debris. Additional Warra LTER projects that have some
survey locations within the SuperSite boundaries (but are largely conducted across broader State
forest tenure), include the Wildfire Chronosequence study looking at successional change following
fire or harvesting, and the Southern Forests Experimental Forest Landscape plots which investigate
the response of selected taxa in two age classes of forest to varying levels of landscape modification.

25
The Silvicultural Systems Trial that continues at the Warra Tall Eucalypt SuperSite developed as a
result of the 1997 Regional Forest Agreement. The purpose of the trial was to investigate alternative
techniques for harvesting and regenerating wet eucalypt forests. The study involves comparing the
conventional Clearfell, Burn and Sow (CBS) method with five alternate treatments: Aggregated
Retention (ARN) where selected vegetation on the coupe is retained in distinct 0.5-1.0ha sized
patches; Dispersed Retention (DRN) which involves 10-15% basal area retention with evenly
distributed standing trees; CBS with retained undisturbed understorey (CBS-UI); Group Selection
(GS) for harvesting of limited numbers of aggregated trees; and Single-tree or Small-group selection
(SGS) which retain greater forest cover than GS and the width of extraction tracks is narrower. It is
understood there were two coupes representing the ARN, DRN and CBS-UI treatments and one
coupe for the GS, SGS treatments and also a single control coupe within the immediate study area.
Coupes of different treatments are adjacent to each other with minimal separation. Harvesting took
place over a 10 year period with the first DRN coupe being logged in 1998 and the sole GS coupe
logged in 2007. This study is not discussed further as it is a State forestry initiative and does not
receive TERN funding.
The Altitudinal Transects are composed of 24, 50m by 20m survey sites in, or immediately adjacent
to, the Warra Tall Eucalypt SuperSite. The survey sites have been established across four different
locations to survey vegetation, birds and invertebrates. In each of the four locations, between 3 and
9 survey sites have been established along a ridge or spur at an approximately 100m elevational
spacing. Three groups of survey sites are located in State forest on the eastern side of the SuperSite
and are located in an uphill orientation toward Mt Frederick, with the fourth group of sites placed on
a spur running up to Mount Weld within World Heritage area, on the northern boundary of the
SuperSite. Three groups of survey sites are located in mature, unlogged forest with a fourth group (3
sites), located in approximately 20 year-old regrowth at the time of establishment. It is not known
why or how researchers chose the four ridges to establish the survey sites. Within a ridge, it is
understood that the location of survey sites, within the constraint of being approximately 100m
apart altitudinally, was chosen to minimise environmental heterogeneity in terms of geology, aspect
and slope. The sites were established between 1999 and 2000 and it is understood the intention is
to re-survey them for vegetation, invertebrates and birds every 10 years. More details can be found
in Grove (2004). This project was reviewed, but researchers informed us that the project does not
receive TERN funding so the content has been removed and the project is not discussed further.
As part of the TERN initiative, an 80m flux tower and a core 1ha vegetation plot have been
established at the Warra SuperSite. The discussion below is focused on the SuperSite activities that
were supported with TERN infrastructure funding: the core 1ha vegetation plot.
Objectives
The objectives of the Warra Tall Eucalypt SuperSite are to investigate fluxes of water vapour and
carbon dioxide between the atmosphere, upper soil layers and groundwater as well as monitoring
the changes in vegetation and dependent biota associated with these tall wet forests. Objectives
that reflect the heritage of Warra as a LTER site, also include providing a multi-disciplinary focus
which complements research programs elsewhere in Tasmania, and to link Tasmanian forest
research with national and international programs having a long-term ecological focus.

26
Research Questions
The (non-atmospheric flux related) research questions that the scientists are examining include:
1. What are the fundamental ecological processes operating in E. obliqua wet forests?
2. What are the long term effects of different forest management regimes on natural diversity and ecological processes?
3. How might Tall Eucalypt flora and fauna species respond to environmental change, including changing climate?
Study Design
The 1ha core vegetation plot was established using Supersite vegetation protocols. It is understood
the plot was expanded to 1.6ha to avoid disturbed areas due to flux tower construction.
Measurement protocols
Core vegetation SuperSite protocols are implemented at the 1ha plot in the footprint of the flux
tower. Planning is underway to establish bird surveys at the core 1ha SuperSite vegetation plot in
the footprint of the flux tower. Acoustic sensors have been installed at the core plot to record faunal
calls from a range of species.
Analysis
With the non-TERN funded plot systems a range of analyses has been undertaken to explore
contrasts in the response of biota to different management prescription and seasonal patterns
including permutation tests, t-tests, non-parametric tests, ordination methods and linear models.
Discussion
Researchers report that only minimal funding was allocated to Warra during TERN EIF and as a result
all that was established was a 1ha plot to complement the flux tower. This plot is located close to
1ha plots established by AusPlots Forests (see main report) and will contribute to understanding the
changes in this tall wet forest that is a common vegetation type in Tasmania. Research questions
associated with different forest management regimes (Q2), and how flora and fauna species may
respond to environmental change (Q3) are most clearly associated with non-TERN funded work
being, or having been undertaken at Warra—the Silvicultural Systems Trial, the Altitudinal Transects
project, and potentially, the Southern Forests Experimental Forest Landscape plots.
Summary
The Warra Tall Eucalypt SuperSite has been established on the research foundation of the existing
Warra LTER. A variety of scientific projects that pre-date TERN related to helping to understand the
dynamics of tall eucalypt forest and the vegetation community's response to disturbance, continue
at Warra but are not TERN funded. A single core 1ha vegetation plot has been established as part of
the SuperSite initiative.

27
References
Grove, S.J. (2004). Warra – Mount Weld altitudinal transect ecotonal and baseline altitudinal
monitoring plots (BAMPs): establishment report. Technical Report no 17/2004. Forestry Tasmania,
Hobart.

28
SECTION 3: Synopsis
This review sought to document the TERN-funded on-ground, terrestrial plot survey activities that
were being undertaken at the first five SuperSites that were established. The review does not cover
all SuperSite work, as key components—measurements recorded from the flux tower and
hydrological work are out of scope. Additionally, there are supporting projects at all SuperSites most
of which are not TERN-funded, and therefore not reviewed here. In preparing this review we drew a
distinction between Study Design and Measurement Protocols because it is useful to think of them
as different things when describing field-based survey activities. While the measurement
protocols—what’s measured on the ground and how—is clearly an important characteristic of a
scientific program, it is the design, or how the study has been set up that more directly influences
the breadth of inference or how reliable we can expect results to be over a target population of
interest.
Taken as a whole, the focus of SuperSite activity is in understanding ecosystem processes that are a
function of a set of variables including flora, fauna, soils and atmospheric variables. Measurement
occurs intensively and in a concentrated manner at a SuperSite, and researchers neither have the
resourcing, nor the intention to establish additional SuperSites within a particular ecosystem (e.g.
within tropical rainforest). In this sense, the SuperSites are a different type of facility to the other
three (ex-MSPN) facilities, where individual studies are composed of multiple field survey sites
distributed across a geographic area. At a SuperSite, TERN-funded field survey resources are chiefly
concentrated at the one location (predominantly the 1ha core plot), rather than geographically
distributed.
Consistent SuperSite-specific methodology is a feature of the facility. This standardisation of
measurement protocols, while ensuring the relevance of the methods in the different environments
in which SuperSites have been established, is an achievement. The different SuperSite working
groups plan to continue working on consistent measurement protocols where resourcing allows.
Where implemented protocols differ between the SuperSites, reflecting the different environments
in which they occur, this may complicate later comparisons.
With regard to study design, the origin of how the location of a 1ha core plot is chosen at the
SuperSites affects how representative the plot can be considered in a statistical sense. There are
three factors or stages that influence placement of a 1ha core plot—the original historic choice of
where the SuperSite was located, the siting of the flux tower within the SuperSite location, and the
subjective decision in choosing the location for the 1ha core plot within the footprint or fetch of the
flux tower. Choosing the location of the SuperSite is made deliberately, often establishing them in
areas where previous or ongoing work has, or is being done. Establishment of the SuperSite at
existing scientific sites seeks to build on the knowledge and understanding of the ecological system
that has been obtained at these respective locations. Here, it may be unknown what factors
(subjective, or otherwise), led to the location being originally selected for a research station.
The original site for the SuperSite may also be chosen with the purpose of including a typical site
that characterises a particular environment or ecosystem. For example, joint criteria may be used to
select an area that corresponds to a particular vegetation community, soil type, rainfall regime,
elevational range and/or management history. Any constraints used to decide on the location of the

29
SuperSite understandably restricts the target population of interest down to areas that jointly satisfy
those criteria. However, the lack of randomisation within these constraints mean that selection bias
may inadvertently have been introduced when choosing the location. In this regard, while the parcel
of land selected may ‘qualify’ against the criteria of interest, it is unknown how representative, in a
statistical sense, the parcel can be expected to be of the restricted set of sites that make up the
constrained target population.
Within a SuperSite, methodological constraints limit the siting of the flux tower to areas where
effective measurements can be obtained from the tower instrumentation. As discussed earlier,
these largely correspond with topographical factors where it is important for the land to be
relatively flat, and for there to be no gross changes in vegetation type or land forms over a minimum
area of approximately 5km by 5km. These technical constraints, largely on relief, are necessary, and
help contribute to effective operation of an eddy covariance flux station. The constraints applied, do
however, further restrict the target population to which results from any subsequent plot-based
survey samples can be generalised to.
Within the footprint or fetch of the flux tower, the core 1ha plot(s) are located. Here, there is usually
some effort used by researchers to ensure that the 1ha plot covers a reasonably homogeneous
extent of the vegetation type of interest. The sampling method may be described here as
‘haphazard’—there is an effort to choose the location of the plot in an informal, non-systematic way
while ensuring the plot covers the vegetation community of interest, but there is no demonstrable
mechanism of randomisation used in the process. At the level of choosing a plot within the tower
footprint, an absence of randomisation means that selection bias may have inadvertently been
introduced when selecting the plot location. In this regard, caution should be exercised in assuming
measurements from the plot are representative of the larger flux tower footprint.
In some locations where SuperSites have been established, district or regional surveys have been
undertaken. Similar information to that recorded on the 1ha SuperSite plot has been collected on
some, or many of these other plots. While comparisons and contrasts of results between the two (or
more) different types/sets of plots may be informative in some way, the comparison cannot
‘validate’ or confirm the statistical representativeness of non-random SuperSite core plot site
selection within a SuperSite.
For users of the data, these aspects of site and plot selection do not invalidate the use of the data in
trying to understand the study area. But it is important for an analyst to understand the origin of the
measurements. What the plot selection process does mean, is that due to the lack of probability-
based sampling, caution should be exercised by data users when generalising results beyond the
study area boundaries.
Plot-based SuperSite-specific activity varies across the SuperSites because scientific investigations
depend on the ecosystem, particular themes being explored, and researcher’s interests. For these
SuperSite-specific activites, it is recommended that when, or if, new on-ground plots are being
established, thought is given to how stratification and randomisation can play a role in helping to
meet objectives. These are tools that can be used to help allocate samples over variables of scientific
interest (e.g. an environmental gradient), while reducing the chance of confounding occurring
between variables, and avoiding potential selection bias when survey plots are chosen. Both of these
issues (reducing the chance of confounding and minimizing selection bias) help provide reliable

30
information from scientific studies. If additional SuperSite 1ha core plots are to be established within
the footprint of the flux tower, it is recommended that some formal mechanism of randomisation is
used to select the location of the plot, within the necessary constraints that apply (e.g. within a
particular vegetation type and distance from the flux tower).
In learning about the different field-based activities that have been established, or are on-going at
the TERN SuperSites, there was one issue that recurred frequently enough (and also across the other
three plot-based TERN facilities), that warranted some extended comment to be made. This was the
idea of working with a representative site or a representative set of survey plots in a study and is
discussed below. The main report contains a discussion of the value of diagnostics in statistical
modelling. While SuperSites is a new network and correspondingly, researchers report that analyses,
largely, have not been undertaken to date and will be pursued in future, we reproduce this section
on model diagnostics as it may be of interest. For the same reason, we also include remarks from the
main report on the separate issues of combining datasets and power analysis.
Selection bias and representativeness
Having study sites which are representative of the district or region over which a researcher would
like to generalise their results (the target population) is regarded as a valuable quality for a research
or monitoring project. The word `representative' or the idea of `representativeness' has several
meanings so it is important to be clear what we mean when we use these words and why we think it
is important to have, say, a `representative sample' or representative study sites.
We could say that a common meaning of representative denotes the typical or ideal case of
something. It has connotations of similarity with a larger group or population. That is, if a study unit
(site, transect, quadrat) characterises well the class of objects of which it is regarded as a member, it
may be considered representative of that class. This is the meaning of representativeness that was
used for the JANIS criteria for forest management in the 1990's (Commonwealth of Australia 1997).
Assessing representativeness in this sense involves identifying a suite of known factors or
characteristics that are believed to be important and then determining similarities with those
accordingly. Simplistically, a conservation officer may ask themselves: “I believe a typical or
characteristic site of River-flat Eucalypt forest on Coastal Floodplain would have certain qualities or
attributes present — yes, this one does — I consider this patch a representative example of that
vegetation community."
The above approach of characterising and selecting a study site can be contrasted with probability-
based sampling. Using randomisation to select study sites offers protection (on average) against
selection bias. This is because it removes personal judgement from the site selection decision and
helps distribute the effects of influential, but unknown factors across the study units. For doing
statistical inference---using a probability-based model to draw conclusions beyond your study sites---
an absence of bias in how we choose study sites, and secondly, how we calculate the estimates of
interest, are important. While selection bias is avoided through the mechanism of some form of
probability sampling, bias also may arise from the choice of estimator (function) used to calculate
the estimates of interest1. The use of probability sampling in site selection allows results to be
1 Reliable estimates can be obtained following the use of a biased sampling method but formal incorporation of additional information (e.g. the variables used to determine representativeness) into the analysis is required

31
generalised beyond the study sites to the broader region of interest. Randomisation offers support
or protection against selection bias at the (nested) level at which it is implemented: for example,
small quadrats within larger plot, plot within site or location of the primary observational unit (site).
Where some element of randomisation is not used for site selection (and neither was a transparent,
purposive sampling scheme to enable adjustment of the estimator), researchers should think
carefully about how their sites were originally selected and consider how bias may have been
introduced into that selection when discussing results. They should then proceed cautiously when
drawing conclusions beyond their study sites.
Due to a variety of factors, including logistical constraints in the field, it can be uncommon for
ecological studies to use some form of randomisation when selecting study sites. In such
circumstances, it is useful to think about the history and context of the site(s) and how bias may
have been introduced during the original site selection. Effort in describing how characteristic the
site is compared to the surrounding region also may be useful. However, while having a high
correlation between the characteristics of a chosen site and the broader region of interest may
increase confidence that a given site shares characteristics with the broader region within which it is
located (with respect to the factors used for the contrast), this doesn't grant an ability to claim
`statistical representativeness' nor an entitlement to draw conclusions without fear across the
broader region of interest.
Depending on the objectives of a study, random selection of a study site may not be needed or may
not be important. If the purpose is to demonstrate the existence of a process or phenomenon, say,
the relationship between carbon flux patterns and the competitive dynamics in tropical rainforest,
working in a patch that is `not un-representative' may meet study objectives. Here, the study
objectives may include demonstrating the complexity of the flux-forest dynamics relationships, but
the focus is not on concluding that the relationships apply within tropical rainforest across the
broader district or region. If a researcher is interested in drawing conclusions beyond their study
sites at hand, it is important to think about how bias may have been introduced during the initial
selection of on-ground study locations. It is a reality that probability-based sampling is often not
used in ecology. Where it is absent, caution should be used when drawing conclusions beyond the
surveyed study sites. Unbiasedness and the entitlement to generalise results beyond surveyed study
sites is borne out of site selection procedures and cannot be secured through post-hoc comparisons
with selected biophysical attributes.
Reference
Commonwealth of Australia (1997). Nationally agreed criteria for the establishment of a
comprehensive, adequate & representative reserve system for forest in Australia. A report by the
Joint ANZECC/MCFFA. National Forest Policy Statement Implementation Sub-committee.
Commonwealth of Australia, Canberra.
to make the necessary adjustment to the estimator. This information is not usually available in ecological studies due to the informal nature of the sampling method used.

32
The role of diagnostics in statistical modelling
Statistical methods are based on models that involve probability distributions with parameters that
need to be estimated for understanding and prediction. Familiar techniques like the one-sample t-
test to investigate the value of the population mean is an example of a simple statistical method.
When using this test, a researcher uses properties of Student's t-distribution to determine how
plausible particular values are for the population mean. The one-sample t-test includes inherent
assumptions about the data that researchers rely upon when they use the test: the population from
which the sample has been taken is expected to be normally distributed and sample values are
assumed to be obtained independently of one another. The assumptions of simple models like the t-
test are comparatively easy to assess. The properties of more complex models, for example, that
accommodate spatially clustered or temporally dependent data with a non-Gaussian response, are
more difficult to understand and harder to evaluate as a result.
For a model to be relevant or informative, it needs to be a useful approximation to how the system
under consideration is working2. For example: Is the relationship quantified by the researcher's
statistical model between species richness and fire severity a good approximation to how the actual
system is generating the data? Can this relationship be used reliably to recommend on-ground
management or help design additional research studies? A well-fitting model that satisfies inherent
assumptions affords confidence in using the approximation while a poor-fitting model does not.
Diagnostic graphical plots can be used to evaluate a range of model assumptions that help
determine the fit of a model and whether it is likely to be a good approximation of the system under
consideration. For regression, as a minimum, assessing fit conventionally includes plots of residuals
(unexplained variation3) to explore non-normality, temporal dependence, non-constant variance,
the presence of `outliers' and the absence of required (additional) covariates.
Regression models are widely used and while assessing the fit of these models requires judgement,
the principles and protocols for evaluating assumptions are well established. For more complex
models with multiple sources of variation, dependent data structures and/or non-Gaussian
response, this is not the case. Many researchers are familiar with the graphical tools to evaluate the
assumptions of regression models. If statistical models are used for inference, it is necessary to
assess the fit and evaluate model assumptions before the model is used. Fitting and evaluating more
complex models that accommodate clustered or longitudinal data, like mixed models, is not
straightforward due to the presence of both regression parameters and variance parameters and the
uncertainty in how the relative importance of each of these should be apportioned during model
selection. Evaluating distributional assumptions can be difficult with non-Gaussian responses (e.g.
binary data). These challenges don't eliminate the need to consider model fit. On the contrary, using
models that are hard to evaluate should induce greater caution when using them for inference.
2The emphasis here is on using a model for understanding. Statistical models can be used effectively for prediction in some circumstances in the absence of a direct physical relationship between the response and `predictor' variables. 3There are three residual quantities commonly used for model diagnostics: raw, standardised and studentised. The latter two quantities can be more effective in detecting influential observations than the raw residuals.

33
Combining project datasets
An attractive idea for some is using datasets from different studies to investigate scientific
questions. This may involve proposals to draw on remote-sensing or atmospheric flux data to use
with on-ground plot-based measurements to explore relationships of interest. Here, different
technologies, or methodologies more generally, are commonly used to measure different variables
of interest, and there is nothing remarkable or unusual about this, other than perhaps scientists
from different disciplines collaborating on the one investigation.
What is more unusual, and challenging, is the idea of combining raw data on similar themes that are
collected from different scientific studies. The different projects may measure similar attributes in
the same, or in different ways. Among studies, different field protocols are commonly used to
measure the same attributes. For example, basal area or foliage cover may be calculated in different
ways (using points, lines or plots as the survey framework). Small mammal abundance may be
obtained using different types and configurations of traps. It is common for different projects to
measure similar themes in different ways because particular field techniques are more efficient in
certain environments, and scientists have individual preferences and/or different priorities for
measuring certain attributes.
Attributes may be measured directly or an index may be used to provide a relative measure. For
example, the number of animals in a population, or equivalently the number of animals per unit
area, are both direct measures of abundance whereas relative measures of abundance are used with
indices such as animals trapped per 100 trap nights, possums seen per km walked, or owls heard per
hour. Generally, the relationship between such an index and absolute density is unknown. A
contributing reason for this is when animals are more active or vocal, or the ability to see or hear
them is increased, they are more likely to be detected. When using the same technique to make
comparisons within a study site over time or across study sites at the one time, there is the potential
for differences in animal activity and detectability to be confounded with differences in abundance.
Higher counts per level of survey effort may reflect greater movement by individuals rather than
differences in abundance per se (e.g. following wildfire; see Whelan, 1995). Where possible,
ecologists seek to control factors that influence activity levels and detectability when deciding when
to conduct surveys—weather conditions, season, time of day, food supply or observers. Factors that
influence species activity can be problematic when investigating the effects of disturbance on
biodiversity—reptiles in burnt and unburnt areas may have different activity levels or movement
patterns4 (Whelan 1995).
If seeking to investigate animal abundance by amalgamating data that has used different relative
density survey techniques (e.g. birds recorded from stationary point-counts vs. 2ha timed-searches),
the potential confounding aspects of activity levels and detectability remain, and are compounded
by the uncertainty of the relationship between absolute density and relative density for the two
techniques. Variation in the relationship between an index of abundance and absolute density also
may occur using the same index but in widely separated ecosystems. Ecologists commonly work with
indices due to the prohibitive cost of additional survey work involved in obtaining estimates of
absolute density or total population size. In the case of SuperSite bird monitoring, the aims also
include the provision of calibration and validation data for acoustic recordings collected at each site
4 Aside from potential differences in detectability due to removal of vegetation cover.

34
to assist in the development of novel biodiversity monitoring techniques. While comparisons
between SuperSites may be problematic, the comparison of long-term trends at each location may
be informative when taken in context with the long-term trends in biophysical parameters
monitored at these sites.
The challenges involved in combining data that measure the ‘same’ variable in different ways are not
eliminated by moving away from the use of indices (nor are these challenges confined to faunal
studies). The field survey protocols that are used in a study can be viewed as a measurement
instrument with inherent variability and bias. Within a study, measurement error from the
instrument helps comprise part of the variability in the data and the researcher assumes (usually)
the unknown bias in the method remains constant over the duration or geographical extent of the
study, so patterns in the response of interest can be reliably inferred. Where two different studies
measure tree basal area using different methods, the researchers are measuring the ‘same thing’
but each method has its own variability and bias associated with it. A common approach to working
with multiple datasets like this is not to combine the data, but to analyse them within the project-
specific context in which they were collected. That is, the same relationship, say between basal area
and biomass carbon, is examined in both studies, but parameters are estimated conditional on the
field protocol used. Variability is captured in the statistical model and some consideration is given by
researchers on the assumptions that (any unknown) bias associated with the methodology remains
constant over the particular study. Results between the two studies can then be contrasted
informally—was the pattern between response and predictors consistent between the two studies?
The situation becomes much less transparent when combining the data from the two studies as two
different ‘measuring instruments’ have been used in the study, each with their own inherent
variability and bias. Rather than increase the precision of an estimate, such an approach, if it doesn’t
strive to incorporate survey type effects, is more likely to obscure understanding of the relationships
being studied. Researchers can try to adjust for bias if comprehensive evaluation exercises are done
to understand the difference between the methods, but understandably, the resources are not
usually available.
Careful thought should be given to drawing on and using data from different field projects. The
merits of doing so should be considered on a case-by-case basis with a clear understanding of the
objectives. In all cases, assumptions made about the variability and unknown bias associated with
the measurement protocols should be explicitly stated so others can understand the decisions that
were made in collating and analysing the data.
There are other important aspects that influence whether it is likely to be productive to combine
data to answer a scientific question. The study design of the potential component projects is an
important aspect that determines how well the individual projects can meet their original scientific
objectives. This concerns how sites, individuals or study units in general were selected for inclusion
in the study. Was an informal, idiosyncratic method used to choose study sites or was some principle
of experimental or survey design employed? When thinking about combining data, consideration
should be given to how useful those data are, given their origins. The use of survey design principles
to initially design a study does not necessarily make it more valuable for subsequent data integration
exercises, but it does provide necessary information to help evaluate how effective integrating data
may be to help explore a new scientific question. When thinking about the benefits of combining
data, it may be important to think about just how scientifically interesting such contrasts are likely to

35
be across well-separated geographic areas. Single studies are typically located within the one district
or region where climate, geomorphology and/or chronobiological rhythms are more or less
constant. To undertake cross-regional and cross-continental comparisons among different studies is
to invite factors into the mix that may influence the response of interest, but have not been
incorporated in the original study designs. These factors may influence animal behaviour, for
example, but be difficult to identify, or if known, difficult to measure. Differences between widely
separated ecosystems may increase the risk of confounding the effects of interest (e.g., time-since-
fire), with some unrecorded region-specific factor affecting activity or movement (detectability) of
fauna species.
Reference
Whelan, R.J. (1995). The Ecology of Fire. Cambridge University Press, Cambridge.
Power analysis
Ecologists sometimes wish to complete a power analysis for their field projects. Generally, their
motivation stems from wanting to know whether they have enough study sites to feel confident that
they have a high probability of detecting an important effect, of an explicitly specified size, in the
response variable of interest (if one exists). They would then like to use that information to help
them make decisions about their project. For example, does the power calculation suggest that they
need to establish additional sites within their study? Conversely, if a power analysis indicates that
they have more than an adequate number of sites for detecting the effect size they are interested in,
perhaps they should omit some sites from future surveys to reduce costs.
Power calculations assume an underlying model and often require some parameters to be given
numerical values, so the more we know about the context and the data we are trying to collect, the
more useful the analysis will be. To reduce the number of quantities that we have to specify to
conduct the calculations, the problem and the model are often chosen to be very simple. For
example, a single hypothesis test under an independent and identically distributed normal model. If
the underlying model in the power analysis doesn't correspond to the project data at hand, the
results of the power analysis cannot be expected to be reliable and facilitate good decision making.
Importantly, ignoring some structure can lead both to conservative calculations (the calculated
power is lower than the actual power when covariates are ignored), and to over-optimistic
calculations (the calculated power is higher than the actual power when dependence is ignored). To
try and minimise these sorts of outcomes, the assumptions and their consequences need to be
thought through carefully. On the other hand, over-elaborate analyses (that strive to reflect realistic
structure in the data), are probably not very useful either because the specification of “nuisance
aspects”5 of the model are difficult.
One issue with power calculations is how we react to the numbers they produce. We might be
pleased if the power calculation suggests that we can reduce the number of sites, but we may still be
reluctant to actually do so if we have simplified the model or restricted the goals of the study to
obtain a feasible calculation. Similarly, a calculation that suggests that we need to increase the
number of sites has to be qualified by the available resources. Especially with multi-objective
5 Those not of primary interest for the question at hand, but nevertheless an important component of the model being relied on.

36
studies, low power for one objective does not mean that we should not conduct the work. Even for
single objective studies, low power does not mean that the study is pointless; the effect may be
bigger than we expect but, even if it is not, the study may later be incorporated into a meta-analysis
that achieves more than a single study could. Additionally, undertaking the work, even if the
calculation suggests it would have low power, may result in an outcome that suggests useful
modifications to other studies, interesting lines of research and generally help progress knowledge
of some phenomena (such as ecosystem dynamics after fire).
Power calculations are useful in assessing the sensitivity of a (formal) experimental design in
advance of project data collection. This is provided that useful estimates of data variability can be
obtained (most reliably sourced through an appropriately designed pilot study) and there is a
reasonably precise idea of the size of an important effect. Power calculations conducted after an
experimental or observational study has been completed (sometimes called post-hoc or a posteriori
power analysis), are often not particularly useful. First, the power calculation describes a general
property of a test that holds over repeated samples so there are logical difficulties in trying to apply
it post-hoc to a particular realisation. Second, the so-called observed power is completely
determined by the p-value, so the calculation adds nothing to the interpretation of the results.
Researchers should be clear about what their objectives are when they are thinking they would like
to do a power analysis. Usually, completing a power analysis will be seen as a means-to-an-end,
rather than the final, end result. Measures of uncertainty around parameter estimates from previous
analysis may answer questions about where to enhance or where to rationalise an existing study
more effectively than a formal power calculation.
Acknowledgements
Many thanks to the busy SuperSite researchers who made time to talk to us, provided information
and responded to queries we had about their work. Feedback from SuperSite scientists in December
2014 improved the report. Thanks to Emma Burns for project management and direction. Thanks to
Karl Bossard and Tabitha Boyer for map preparation and help with word processing respectively. The
report was improved thanks to proof reading by David Lindenmayer and Emma Burns.

37
Appendix
Written material that was consulted as part of the review is listed below.
SuperSite Written material consulted
Calperum Mallee
Australian SuperSite Network: Calperum Mallee SuperSite. (url: http://www.tern-supersites.net.au/index.php/calperum) Australian Supersite Network Vegetation monitoring protocol (Sept. 2011) TERN Australian SuperSite Network, Draft Vegetation Protocol (Jan. 2014) Australian Landscape Trust. Engaging Communities in Sustainable Landscape Management, Calperum and Taylorville Stations. (url: http://alt.org.au/projects/riverland/calperum-taylorville.aspx) Meyer, W. (2008). Landscape Futures Program: Climate, soil, water, biota, economics and people—researching complexity. Natural Resource Science, The University of Adelaide (presentation). Lubke, T. Calperum OzFlux Tower. (presentation).
FNQ Rainforest
Australian SuperSite Network: FNQ Rainforest SuperSite (url: http://www.tern-supersites.net.au/index.php/fnq) Australian Supersite Network Vegetation monitoring protocol (Sept. 2011) TERN Australian SuperSite Network, Draft Vegetation Protocol (Jan. 2014) Metcalfe D., Liddell, M., Bradford, M., and Green, P. (2014). Tropical rainforests of Eastern Australia. In Lindenmayer, D. Burns, E., Thurgate, N. and Lowe, A. Editors. Biodiversity and Environmental Change: Monitoring, Challenges and Direction. CSIRO Publishing, Melbourne.
Great Western Woodlands
Australian SuperSite Network: Great Western Woodlands SuperSite. (url: http://www.tern-supersites.net.au/index.php/gww) Australian Supersite Network Vegetation monitoring protocol (Sept. 2011) TERN Australian SuperSite Network, Draft Vegetation Protocol (Jan. 2014) Summary of Great Western Woodland Sampling. (Internal ASN summary document.) Great Western Woodland Supersite—Affiliated projects summary. (Internal ASN summary document). Gosper, C. R., Prober S. M., Yates C. J., Wiehl G. (2013) Estimating the time since fire of long-unburnt Eucalyptus salubris (Myrtaceae) stands in the Great Western Woodlands. Australian Journal of Botany 61, 11–21 Gosper C. R., Yates C. J., Prober S. M., Wiehl, G. (2014) Application and validation of visual fuel hazard assessments in dry Mediterranean-climate woodlands. International Journal of Wildland Fire 23, 385–393. Gosper C. R., Prober S. M., and Yates C. J. (2013). Multi-century changes in vegetation structure and fuel availability in fire-sensitive eucalypt woodlands. Forest Ecology and Management, 310, 102-109.

38
SuperSite Written material consulted
Gosper, C. R., Yates, C. J., Prober, S. M. (2013), Floristic diversity in fire-sensitive eucalypt woodlands shows a ‘U’-shaped relationship with time since fire. Journal of Applied Ecology, 50: 1187–1196. NutNet Design and Protocol. June 2008. Observational Study and Core Experiment. Lindenmayer, D., Prober, S., Michael, D., Crane, M., Okada, S., Kay, G., Keith, D., Montague-Drake, R., and Burns, E. (2014). Temperate eucalypt woodlands. In: Lindenmayer, D., Burns, E., Thurgate, N., and Lowe, A. Editors. Biodiversity and Environmental Change: Monitoring, Challenges and Direction. CSIRO Publishing, Melbourne.
SEQ Peri-urban
Australian SuperSite Network: SEQ Peri-urban SuperSite. (url: http://www.tern-supersites.net.au/index.php/seq) Australian Supersite Network Vegetation monitoring protocol (Sept. 2011) TERN Australian SuperSite Network, Draft Vegetation Protocol (Jan. 2014) Queensland University of Technology. Samford Ecological Research Facility: ecology, environments, exploration, climate, community. (url: http://www.serf.qut.edu.au/) Labadz, M. Research details for the Samford/Pine River node of the SEQ Supersite. (unpublished documentation Aug. 2013, supplemented July 2014 by Peter Grace). Govender, M. and Everson, C.S. (2005). Modelling streamflow from two small South African experimental catchments using the SWAT model. Hydrological Processes, 19, 683-692. Arnold, J.G., Srinivasan, R.S. Muttiah, Williams, J.R. (1998). Large area hydrologic modeling and assessment-Part 1: model development. Journal of the American Water Resources Association, 34(1): 73-89. Hero, J-M. and Castley, G. (2011). Program for Planned Biodiversity and Ecosystem Research at Karawatha Forest Park. Research Report to Brisbane City Council (Biodiversity Research Partnerships Program). Griffith University, Environmental Futures Centre. Hero, J-M., Castley, J.G., Malone, M., Lawson, B., Magnusson, W.E. (2010). Long-term ecological research in Australia: innovative approaches for future benefits. Australian Zoologist, 35(2), 216-228. Hero, J-M., Lollback, G., Shuker, J. Castley, J.G. (2014). PPBio long-term ecological research plots in subtropical eucalypt woodland of Karawatha Forest within the Australian Supersite Network. In: Chapter 8, Temperate eucalypt woodlands, Lindenmayer, D., Burns, E., Thurgate, N., and Lowe, A. Editors. Biodiversity and Environmental Change: Monitoring, Challenges and Direction. CSIRO Publishing, Melbourne.
Warra Tall Eucalypt
Australian SuperSite Network: Warra Tall Eucalypt SuperSite. (url: http://www.tern-supersites.net.au/index.php/warra). ASN/OzFlux Quarterly Newsletters (url: http://www.ozflux.org.au/publications/newsletter/) Australian Supersite Network Vegetation monitoring protocol (Sept. 2011) TERN Australian SuperSite Network, Draft Vegetation Protocol (Jan. 2014) Warra Tall Eucalypt – Australian Supersite! Forest Education Foundation, National Forest Learning Centre. The stories behind our trees. (Educational resource).

39
SuperSite Written material consulted
(url: http://www.forest-education.com/sites/forest-education/files/explore_category/files/warra_allsml_0.pdf) Brown, M.J., Elliott, H.J., and Hickey, J.E. (2001). An overview of the Warra long-term ecological research site. Tasforests 13 (1). Wardlaw, T., and Neyland, M. Submission to the Legislative Council Select Committee on the Tasmanian Forests Agreement Bill 2012. (url: http://www.parliament.tas.gov.au/CTEE/Council/Submissions/Sub%2079%20-%20Dr%20Tim%20Wardlaw.pdf) Doran, N.E., Balmer, J., Driessen, M., Bashford, R., Grove, S., Richardson, A.M.M., Griggs, J., and Ziegeler (2003). Moving with the times: baseline data to gauge future shifts in vegetation and invertebrate altitudinal assemblages due to environmental change. Organisms, Diversity and Evolution, 3, 127-149. Grove, S (2004) Warra – Mount Weld Altitudinal Transect Ecotonal and Baseline Altitudinal Monitoring Plots (BAMPs): Establishment report. Technical Report no. 17/2004. Forestry Tasmania, Hobart. Neyland, M.G. and Jarman, S.J. (2011) Early impacts of harvesting and burning disturbances on vegetation communities in the Warra silvicultural systems trial, Tasmania, Australia. Australian Journal of Botany, 59, 701–712. Turner, P.A.M., Grove, S.J., Airey, C., McElhinny, C., Scanlan, I., Power, J. Stott, O., and Sohn, J. (2007). Establishment of a set of wildfire chronosequence benchmark plots in southern Tasmania. (summary fact sheet). Hingston, A.B., and Grove S. (2010). From clearfell coupe to old-growth forest: Succession of bird assemblages in Tasmanian lowland wet eucalypt forests. Forest Ecology and Management, 259, 459-468. Wood, S., Bowman, D., Prior, L., Lindenmayer, D., Wardlaw, T., and Robinson, R. (2013). Tall wet eucalypt forests. In Lindenmayer, D., Burns, E., Thurgate, N., and Lowe, A. Editors. Biodiversity and Environmental Change: Monitoring, Challenges and Direction. CSIRO Publishing, Melbourne.