A SOCIAL PORTRAIT OF - · PDF fileA SOCIAL PORTRAIT OF CHILDREN IN IRELAND ... Age of women...
64
Building an Inclusive Society A SOCIAL PORTRAIT OF CHILDREN IN IRELAND
Transcript of A SOCIAL PORTRAIT OF - · PDF fileA SOCIAL PORTRAIT OF CHILDREN IN IRELAND ... Age of women...
Building an Inclusive Society
Building an Inclusive Society
A SOCIAL PORTRAIT OF CHILDREN IN IRELAND
A S
OC
IAL P
OR
TRA
IT OF
CH
ILDR
EN
IN IR
ELA
ND
Department of Social and Family Affairs, Áras Mhic Dhiarmada, Store Street, Dublin 1.Tel: + 353 1 7043 851 Fax: + 353 1 7043 032 e-mail: [email protected] www.socialinclusion.ie
Building an Inclusive Society
Building an Inclusive Society
barcode / isbngoes here

Printed on recycled papers with the following accreditations:
THE
OF
FIC
E F
OR
SO
CIA
L INC
LUS
ION
A SociAl PortrAit of children in irelAnd
BAILE ÁTHA CLIATHARNA FHOILSIÚ AG OIFIG AN tSOLÁTHAIR
Le ceannach díreach ónOifig Dhíolta Foilseacháin Rialtas,
TEACH SUN ALLIANCE, SRÁID THEACH LAIGHEAN, BAILE ÁTHA CLIATH 2nó tríd an bpost ó
FOILSEACHÁN RIALTAS, AN RANNÓG POST-TRÁCHTA,51 FAICHE STIABHNA, BAILE ÁTHA CLIATH 2.
(Teil: 01 647 6834/35/36/37; Fax: 01 647 6843)nó trí aon díoltáir leabhar.
DublinPUBLISHED BY THE STATIONERY OFFICE
To be purchased directly from theGOVERNMENT PUBLICATIONS SALES OFFICE,
SUN ALLIANCE HOUSE, MOLESWORTH STREET, DUBLIN 2or by mail order from
GOVERNMENT PUBLICATIONS, POSTAL TRADE SECTION,51 ST. STEPHENíS GREEN, DUBLIN 2.
(Tel: 01 647 6834/35/36/37; Fax: 01 647 6843)Or through any bookseller.
Price s1.00
ISBN 0-7557-7500-7Government of Ireland 2007
(Prn: A7/0036)

�
Allison dunne, tony fahey, Bertrand Maitre,Brian nolan, emer Smyth and christopher t. Whelan
the economic and Social research institute february �007
�
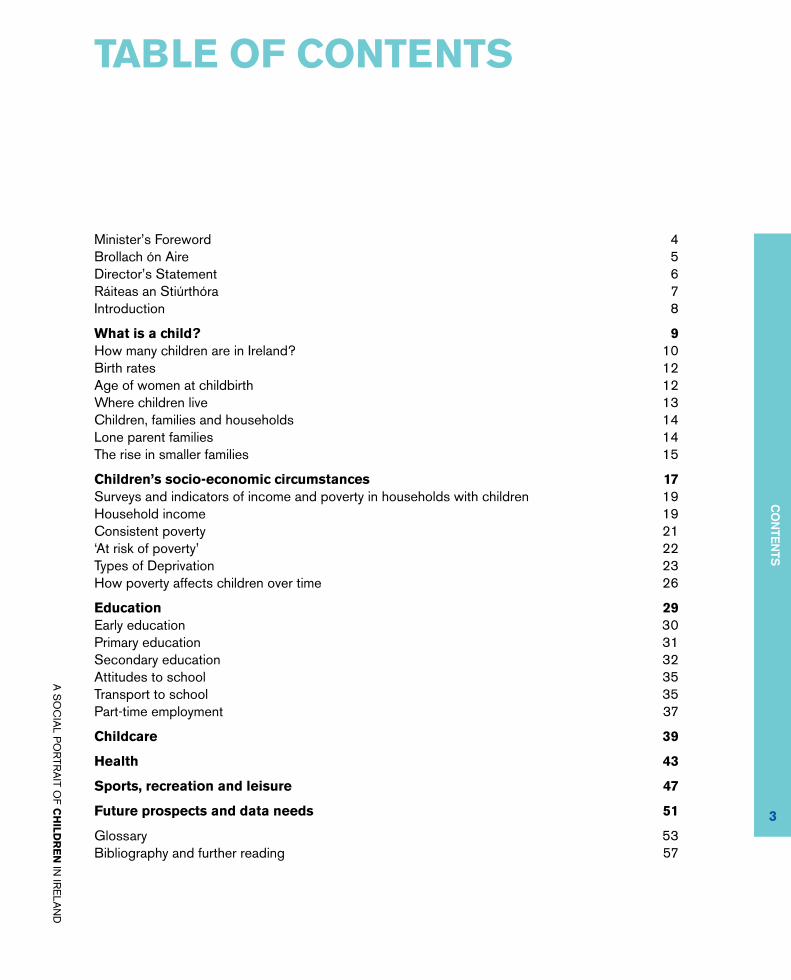
Minister’s Foreword 4Brollach ón Aire 5 Director’s Statement 6Ráiteas an Stiúrthóra 7 Introduction 8
What is a child? 9 How many children are in Ireland? 10Birth rates 12Age of women at childbirth 12Where children live 13Children, families and households 14Lone parent families 14The rise in smaller families 15
children’s socio-economic circumstances 17 Surveys and indicators of income and poverty in households with children 19Household income 19Consistent poverty 21‘At risk of poverty’ 22Types of Deprivation 23 How poverty affects children over time 26
education �9Early education 30Primary education 31Secondary education 32Attitudes to school 35Transport to school 35Part-time employment 37
childcare �9
health 4�
Sports, recreation and leisure 47
future prospects and data needs 51
Glossary 53 Bibliography and further reading 57
tABle of contentSC
ON
TEN
TS
A S
OC
IAL P
OR
TRA
IT OF C
HILD
RE
N IN
IRE
LAN
D
4
foreWord froM the MiniSter
It gives me great pleasure to introduce this social portrait of children in Ireland. This is one of a series of reports commissioned by the Office for Social Inclusion from the Economic and Social Research Institute. The reports are based on the lifecycle approach, which underpins the social partnership agreement, Towards 2016, and the new National Action Plan for Social Inclusion 2007-2016 (NAPinclusion). This portrait is designed to provide data and information on the situation of children in Ireland in an easily understood manner and should be useful to members of the public in general as well as policy makers.
The overall aim of the lifecycle approach is to achieve a better balance between the scope and delivery of individual policies such as social welfare, education and health and the combined outcomes being achieved in improving welfare and well-being. The approach will promote greater coordination and integration of policies, and their implementation, to achieve better outcomes.
The social portraits also help in identifying the challenges we face in ensuring that the resources of Government are used to best effect in achieving social inclusion and wider social policy goals. There will be a particular emphasis in this context on the position of vulnerable groups. Children can be among the most vulnerable of all life stages, depending on a combination of the family, community, wider society and the State for their well-being and for realising their potential. Children also represent our future as a society.
This portrait shows that children can be more vulnerable to poverty than those in other lifecycle stages. There are additional costs for families in raising children and greater difficulties in achieving work life balance. It is not surprising, therefore, that among households with children, those headed by lone parents, and larger families, are most vulnerable to poverty. Meeting the challenge of reducing child poverty, therefore, requires policies to support children directly, and also further development of supports and the removal of obstacles to employment for their parents.
Real progress has been made in combating child poverty. In less than a decade some 100,000 children have been lifted out of consistent poverty. The key goal over the next decade is not just to maintain this progress but to aim to eliminate consistent poverty for children and their families by 2016. The Government is confident that the policies, targets and commitments set out in the NAPinclusion, and in Towards 2016 and the new National Development Plan 2007-2013, Transforming Ireland – A Better Quality of Life for All, will move us towards that goal. Over the next 10 years the outcomes of our policies on the lives and development of our children will be comprehensively documented through Growing Up in Ireland, the National Longitudinal Study of Children. The findings of this survey and other studies will inform future policy development and future editions of this profile.
Finally, I would like to thank the Office for Social Inclusion and, especially, Allison Dunne, Tony Fahey, Bertrand Maitre, Brian Nolan, Emer Smyth and Christopher T. Whelan of the ESRI who prepared this fine report for the Office. Thanks are also due to the National Adult Literacy Agency who provided guidance on plain English standards for the production of the portrait.
Séamus Brennan tdMinister for Social and Family Affairs
A S
OC
IAL P
OR
TRA
IT OF C
HILD
RE
N IN
IRE
LAN
D
THE
OF
FIC
E F
OR
SO
CIA
L INC
LUS
ION

5
BrollAch ón Aire
Cuireann sé an-áthas orm an phortráid sóisialta de leanaí in Éirinn a thabhairt isteach. Tá sí seo ar cheann de shraith tuarascálacha coimisiúnaithe ag an Oifig um Chuimsiú Sóisialta ón Institiúid um Thaighde Eacnamaíochta agus Sóisialta. Tá na tuarascálacha bunaithe ar chur chuige na saolré, a chuireann taca faoin gcomhaontú páirtíochta sóisialta, Towards 2016, agus an Plean Gníomhaíochta Náisiúnta um Chuimsiú Sóisialta 2007-2016 (cuimsitheacht PGN). Tá an phortráid seo deartha chun sonraí agus eolas a sholáthar ar dháil na leanaí in Éirinn i mbealach atá éasca le tuiscint agus ba cheart go mbeadh sí úsáideach do bhaill an phobail go ginearálta chomh maith le déantóirí polasaí.
Is í aidhm foriomlán cur chuige na saolré na chun cothromaíocht níos fearr a bhaint amach idir scóip agus seachadadh polasaithe indibhidiúla ar nós leas sóisialta, oideachas agus sláinte agus na torthaí comhcheangailte á bhaint amach i bhfeabhsú leasa agus folláine. Cuirfidh an cur chuige comhordú agus comhtháthú polasaithe chun cinn níos mó, agus a bhfeidhmiú, chun torthaí níos fearr a bhaint amach.
Cabhraíonn an phortráid sóisialta seo freisin in aithint na ndúshlán atá romhainn i gcinntiú go húsáidtear acmhainní an Rialtais chuig an éifeacht is fearr i mbaint amach cuimsitheacht sóisialta agus spriocanna polasaí sóisialta níos leithne. Beidh béim ar leithligh sa chomhthéacs seo ar sheasamh na ngrúpaí leochaileacha. Is féidir le leanaí a bheith i measc an grúpaí is leochailí de chéimeanna uile na beatha, ag braith ar chomhcheangal den teaghlach, pobal, sochaí níos leithne agus an Stát dá leas agus le haghaidh réalú a bpoitéinseal. Ionadaíonn leanaí ár dtodhchaí mar shochaí freisin.
Léiríonn an phortráid seo gur féidir le leanaí a bheith níos leochailí do bhochtaineacht ná iad siúd sna saolréanna eile. Tá costais bhreise le haghaidh teaghlaigh i dtógáil leanaí agus deacrachtaí níos mó i mbaint amach cothromaíocht oibre saoil. Ní haon ionadh, mar sin, i measc teaghlaigh le leanaí, is iad teaghlaigh faoi cheannas tuismitheoirí aonair, agus teaghlaigh níos mó, atá is leochailí do bhochtaineacht. Mar sin i bhfreastal ar an dúshlán de bhochtaineacht
linbh a laghdú, tá polasaithe riachtanach chun leanaí a thacú go díreach, agus freisin forbairt bhreise de thacaíochtaí agus an ruaigeadh de chonstaicí ar fhostaíocht dá dtuismitheoirí.
Tá dul chun cinn dáiríre tar eis a bheith déanta i gcomhrac bochtaineacht linbh. I níos lú ná deich mbliana tá thart ar 100,000 leanbh tar éis a bheith tógtha ó bhochtaineacht chomhsheasmhach. Ní hí an phríomhsprioc thar an deich mbliana le teacht chun an dul chun cinn seo a choinneáil amháin ach chun aimsiú chun bochtaineacht chomhsheasmhach a dhíbirt do leanaí agus a dteaghlaigh faoi 2016. Tá an Rialtas muiníneach go bhfuil na polasaithe, spriocanna agus gealltanais leagtha amach sa chuimsitheacht PGN, agus i Towards 2016 agus an Plean Forbartha Náisiúnta 2007-2013, Athrú Mórar Éireann - Caighoeán Beatha Níos Fearr do Chách, chun cinn a bhogadh i dtreo an sprioc sin. Sa 10 mbliana atá le teacht beidh torthaí ár bpolasaithe ar shaoil agus forbairt ár leanaí doiciméadaithe go cuimsitheach trí an Fadstaidéar Náisiúnta Leanaí, Growing up in Ireland. Tabharfaidh torthaí an tsuirbhé seo agus staidéar eile eolas d’fhorbairt polasaí an todhchaí agus eagráin na próifíle seo sa todhchaí.
Ar deireadh, ba mhaith liom buíochas a ghabháil leis an Oifig um Chuimsiú Sóisialta agus, go háirithe, Allison Dunne, Tony Fahey, Bertrand Maitre, Brian Nolan, Emer Smyth agus Christopher T. Whelan de chuid an ERSI a ullmhaigh an tuarascáil bhreá seo don Oifig. Tá buíochas tuillte freisin ag an Gníomhaireacht Náisiúnta um Litearthacht d’Aosaigh a sholáthair treoir ar bhonn caighdeáin gnáth Bhéarla le haghaidh táirgeadh na portráide.
Séamus Brennan tdAire Gnóthaí Sóisialacha agus Teaghlaigh
MiN
iSTE
r’S
fOr
Ew
Or
d
A S
OC
IAL P
OR
TRA
IT OF C
HILD
RE
N IN
IRE
LAN
D
THE
OF
FIC
E F
OR
SO
CIA
L INC
LUS
ION

�
director’S StAteMent
Social inclusion is about enabling people who are marginalised to obtain at a minimum the standards of living, access to services and the social life that is regarded as the norm for the majority of people in Ireland. Government policies and programmes make an enormous contribution to social well-being, but we need to focus more on the outcomes being achieved.
This new set of social portraits is designed to assist in enabling us see how people at various stages of the lifecycle are faring in relation to social inclusion. Subsequent social portraits will cover further aspects of the lifecycle and will also enable us see the extent to which progress is being made.
Children represent about one quarter of our population. The formative years of childhood make this a key stage in the lifecycle. The actions detailed in the National Action Plan for Social Inclusion 2007-2016 (NAPinclusion) seek to ensure that the Government’s long term goals are achieved. However, for us to monitor and evaluate progress we need to know the current social and economic situation of children. This social portrait uses data from a variety of sources to show the main trends in the lives of children, including where they live, their social and economic circumstances, their education and health and how they spend their free time.
The overall poverty goal in the NAPinclusion is to reduce the number of those experiencing consistent poverty to between 2% and 4% by 2012, with the aim of eliminating consistent poverty by 2016. Over the past ten years, levels of consistent poverty have fallen sharply for both children and for adults, reflecting declining levels of deprivation and real increases in living standards. This portrait also highlights positive outcomes for children in health and education over the last twenty years, with, for example, improved survival rates for low birth weight babies and increases in the number of children staying on to complete the Leaving Certificate.
However, children are still more likely than adults to be in households experiencing deprivation. Recent
statistics from the EU Survey on Income and Living Conditions found that in 2005 about 10% of children lived in consistent poverty, accounting for about one third of all persons in consistent poverty. A major challenge remains, therefore, over the next 10 years in combating child poverty and in maintaining and, if possible, exceeding the progress of the past 10 years. On a more technical note, the report also highlights the future prospects and the data needs that are required to ensure effective monitoring of the lifecycle approach. Although there continue to be data gaps that hinder the monitoring of progress in policies aimed at tackling the challenges faced by children, the report notes that significant progress is being made with the start of Growing Up in Ireland, the National Longitudinal Study of Children in Ireland.
Finally, I wish to join with the Minister in thanking the ESRI authors for producing this portrait, and the staff of this Office who worked on the project.
Gerry ManganDirectorOffice for Social Inclusion
A S
OC
IAL P
OR
TRA
IT OF C
HILD
RE
N IN
IRE
LAN
D
THE
OF
FIC
E F
OR
SO
CIA
L INC
LUS
ION
z

7
ráiteAS An StiúrthórA
Baineann cuimsitheacht shóisialta le daoine atá imeallaithe a chumasú chun caighdeáin maireachtála, rochtain ar sheirbhísí agus an saol sóisialta a fháil a áirítear mar an norm do thromlach na ndaoine in Éirinn. Cuireann polasaithe agus cláir an Rialtais go mór le leas sóisialta, ach tá orainn díriú níos mó ar na torthaí á bhaint amach.
Tá an sraith nua portráidí sóisialta seo deartha chun cuidiú i sinn a chumasú chun a fheiceáil conas mar atá ag éirí le daoine ag céimeanna éagsúla na saolré maidir le cuimsitheacht sóisialta. Clúdóidh portráidí sóisialta iartheachtacha gnéithe breise den saolré agus cumasófar sinn freisin chun méid an dul chun cinn atá á dhéanamh a fheiceáil.
Seasann leanaí le haghaidh thart ar ceathrú dár ndaonra. Déanann blianta foirmitheacha na hóige príomhchéim de seo sa saolré. Féachann na gníomhaíochtaí sonraithe sa Phlean Gníomhaíochta Náisiúnta um Chuimsiú Sóisialta 2007-2016 (cuimsitheacht PGN) i dtreo a chinntiú go baintear amach spriocanna fadtéarmacha an Rialtais. Mar sin féin, chun go ndéanfaimis monatóireacht agus luacháil ar dhul chun cinn i gá dúinn fhios a bheith againn ar dháil reatha sóisialta agus eacnamaíoch leanaí. Úsáideann an phortráid sóisialta seo sonraí ó héagsúlacht foinsí chun na príomhtreochtaí i saoil leanaí a thaispeáint, lena n-áirítear an áit ina gcónaíonn siad, a gcúinsí sóisialta agus eacnamaíocha, a n-oideachas agus sláinte agus conas mar a chaitheann siad a gcuid ama saor.
Is í sprioc foriomlán na bochtaineachta sa chuimsitheacht PGN ná chun líon na ndaoine ag eispéiriú bochtaineacht chomhsheasmhach a laghdú go idir 2% agus 4% faoi 2012, leis an aidhm de bhochtaineacht chomhsheasmhach a dhíbirt faoi 2016. Sa deich mbliana atá imithe, tá leibhéil na bochtaineachta comhsheasmhach tar éis titim go géar do leanaí agus do dhaoine fásta araon, ag léiriú na leibhéil meatha díothachta agus méaduithe dáiríre i gcaighdeáin maireachtála. Aibhsíonn an phortráid seo freisin na torthaí dearfacha do leanaí i sláinte agus oideachas le fiche bliain anuas, le, mar shampla, rátaí marthanais feabhsaithe do naíonáin ísealmheáchain bhreithe
agus méaduithe i líon na leanaí ag fanacht chun an Ardteistiméireacht a chomhlíonadh.
Mar sin féin, tá leanaí fós níos dóchúla ná daoine fásta chun a bheith i dteaghlaigh ag eispéiriú díothacht. D’aithin staitisticí déanaí ó Suirbhé an AE ar Ioncam agus Coinníollacha Maireachtála i 2005 gur chónaigh thar ar 10% de leanaí i mbochtaineacht chomhsheasmhach, ag seasamh le haghaidh thart ar trian de dhaoine uile i mbochtaineacht comhsheasmhach. Fanann dúshlán mór, dá bharr sin, sa 10 mbliana le teacht i gcomhrac bochtaineacht linbh agus i gcoinneáil agus, más féidir, ag sárú an dul chun cinn den 10 mbliana atá imithe. Ar phointe níos teicniúla, aibhsíonn an tuarascáil freisin ionchais an todhchaí agus na riachtanais sonraí atá riachtanach chun monatóireacht éifeachtach a chinntiú de chur chuige na saolré. Cé go bhfuil bearnaí sonraí fós ann a chuireann bac ar mhonatóireacht dul chun cinn i bpolasaithe dírithe ar déileáil leis an dúshlán os comhair leanaí, tugann an tuarascáil faoi deara go bhfuil dul chun cinn suntasach á dhéanamh le tús Growing Up in Ireland, an Fadstaidéar Náisiúnta Leanaí in Éirinn.
Ar deireadh, ba mhian liom dul i dteannta an tAire i mbuíochas a ghabháil le húdair ERSI as ucht an phortráid seo a sholáthar, agus baill foirne na hOifige seo a oibrigh ar an dtionscnamh seo.
Gerry ManganStiúrthóirAn Oifig um Chuimsiú Sóisialta
dir
EC
TOr
’S S
TATEM
EN
T
A S
OC
IAL P
OR
TRA
IT OF C
HILD
RE
N IN
IRE
LAN
D
THE
OF
FIC
E F
OR
SO
CIA
L INC
LUS
ION

�
introduction1
1 The authors wish to acknowledge the very helpful comments received from the staff of the Office for Social Inclusion on early drafts of this portrait.
This report aims to bring together some facts and figures about children in Ireland today, drawing on a range of statistical sources and studies. This information is particularly useful when developing policies that affect children, for example, the National Action Plan for Social Inclusion (NAPinclusion).
We start the report by describing the main trends in numbers of children and their importance in the overall population. We then go on to look at the following topics:
the households in which children live;
their social and economic circumstances;
their education;
whether they work;
the childcare they receive;
their health and physical activity; and
their activities during their free time.
We have tried to make the information as clear as possible for a wide range of readers. However, we have kept certain terms related to statistics, population changes and economics, as replacing these would lead to inaccurate reporting. These terms are defined in the glossary.
•
•
•
•
•
•
•
THE
OF
FIC
E F
OR
SO
CIA
L INC
LUS
ION

9
WhAt iS A child?

Of course, the ages at which children become economically independent of their parents are less fixed. Some children, for example, may start full-time work at 16 and help to support their families. Others, while still teenagers, may start a family themselves. On the other hand, increasing numbers of young people remain in third-level education well into their 20s and remain economically dependent on their parents.
Despite these exceptions, it now seems reasonable to take ‘under 18’ as the cut-off in looking at children, without any reflection on their maturity and awareness. Of course, there is a world of difference between a fully dependent pre-school child and a 17-year old ‘near-adult’, so we will also look at numbers and trends for sub-groups within the general under-18 population. We may also sometimes divide the under-18 population into ‘children’ (those aged 0 to 14) and ‘youth’ (those aged 15 to 17). This is because available national and international statistics sometimes divide them this way.
how many children are in ireland?
The Irish Census of Population gives a full picture of the population only every five years. No detailed data (including breakdowns by age) are yet available from the last Census in April 2006. The 2002 Census, however, showed that just over one million (1,013,031) people aged under 18 years of age were in the country in April 2002.
The Central Statistics Office also produces estimates of the population by age group in April each year. The most up-to-date figures show major growth in both the overall population and in the numbers aged under 15. By April 2005, the number of under 18s in Ireland had reached about 1,045,000, an increase of 3.16% in three years.
Figure 1 shows the estimated age breakdown of children in 2005. We see that about 29%, or about 300,000, are children aged between 0 and 4. Similar numbers are aged 5 to 9 and 10 to 14, while over 17%, close to 200,000, are aged between 15 and 17.
figure 1: distribution of children by age (%) in �005
the un convention on the rights of the child (Article 1) states that normally “a child means every human being below the age of 1� years”. this is reflected in ireland today, where the age of majority – the age when somebody becomes an adult – is normally 1�. for example, at this age, people usually leave school and become entitled to vote.
Source: B
ased on Census of P
opulation 2002 and C
SO
Population E
stimates 2005
28.8%
27.2%
26.6%
17.4%
0-4
5-9
10-14
15-17
10

11
wh
AT iS A
Ch
ild?
10.0
15.0
20.0
25.0
30.0
35.0
29.2
27.5
31.228.9
20.7
1926 1946 1966 1986 2006
%
Ireland
Sweden
Finland
UnitedKingdom Denmark
GermanyBelgium
Estonia
Spain
Italy
Cyprus
Latvia
Lithuania
Luxembourg
Hungary
Malta
Netherlands
Austria
Poland
Portugal Slovenia
SlovakiaFrance
Greece
CzechRepublic
1994 percentage
2004 percentage
EU 25 EU 15
18.5 16.4
17.7 16.3
25.2 20.9
19.4 18.3
18.4 18.5
18.1 17.3
18.1 18.8
19.8 18.6
18.4 15.717.5 14.5
14.9 14.2
19.1 14.6
17.8 16.3
19.4 15.2
16.4 14.7
17.1 18.9
18.7 17.8
19.1 17.6
21.2 16.6
21.1 15.4
22.2 17.7
23.7 17.2
23.5 17.6
18.6 15.9
18.0 14.6
25.2 20.0
N/A 18.2
In 2002, children made up just over a quarter (26%) of the population. More than a fifth of the population (21%) is under 15. Figure 2 shows that in 2004 Ireland had the highest level of 0-14 year olds among the EU 25 Member States.
Figure 2 also illustrates that children have been making up less of the overall population in Ireland over the last decade, falling by about 4% since 1994. This trend exists in most other countries
now in the EU, though the scale of the decline varies a good deal.
Looking back over a longer time period, Figure 3 shows that the share of the population aged 0 to 14 peaked in the 1960s, fell slowly until the mid-1980s and then fell sharply from then until 2002. The most recent population figures show it to be stable since then, but we will need the full results of the 2006 Census to confirm that picture.
figure �: Percentage of children aged 0-14 in the population across eu �5 Member States
Source: E
urostat
figure �: Percentage share of children aged 0-14 in the irish population
Source: C
ensus of Population
A S
OC
IAL P
OR
TRA
IT OF C
HILD
RE
N IN
IRE
LAN
D

1�
Birth rates
The change in the share of children in the population mainly reflects trends in birth rates in Ireland. This can be seen by looking at the most commonly used measure of fertility, known as the total fertility rate2. As Figure 4 shows, this fertility rate was much higher in Ireland than elsewhere in the EU15 in the 1960s, but it fell rapidly for two decades from 1970. The fertility rate reached its lowest point in the 1990s and has since recovered slightly. By 2003, it was a little higher (average of 1.98 births per woman) than it had been in 1995 (when it was 1.84). While fertility rates in Ireland are now slightly below the level required to reproduce the current population level,3 the arrival of migrants into Ireland means that the population is expected to continue growing.
2 This is the average number of births a woman would have during her childbearing years if she had the typical fertility rates of various childbearing age groups in a particular year.
3 This “replacement” level is just over 2 children per woman.
Age of women at childbirth
Women in Ireland have traditionally been older when having children, and this tradition persists. In 1960, the average age of women giving birth was 31.6 years. Over the following two decades, that age shifted slightly downwards and was 28.8 years in 1980. From then on, it edged slowly upwards again, and by 2003 it reached 30.6 years.
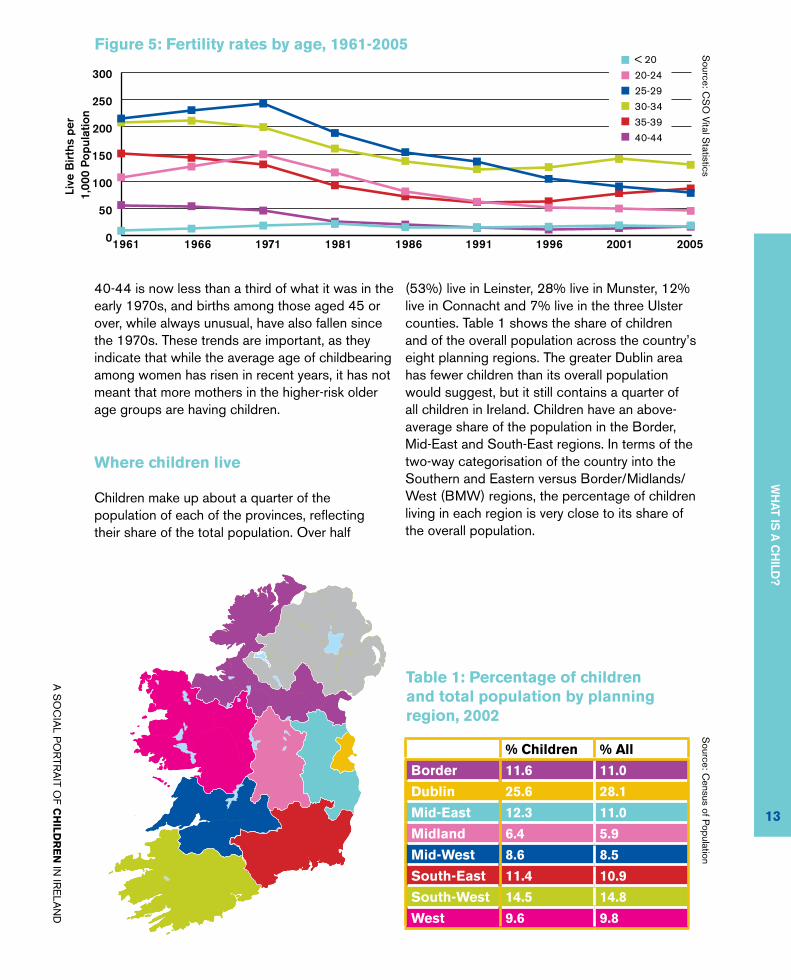
Figure 5 shows that, since the 1970s, fewer women have been having children in their teens and early 20s, at one end of the childbearing age span, and in their 40s, at the other end. The result is that childbearing has become concentrated around the average age: more women are having children in their 30s. In 1971, those aged 25-29 had the highest number of births, but over the past ten years, 30-34 has taken over as the dominant age group for childbearing among women.
Teenage birth rates are low, accounting for less than 6% of births, and have fallen slightly since the early 1980s. At the other end of the maternal age range, the birth rate among women aged
figure 4: total fertility rates in ireland and the eu15, 19�0-�00�
Source: E
urostat
1.0
1.5
2.0
2.5
3.0
3.5
4.0
4.5
1.0
1.5
2.0
2.5
3.0
3.5
4.0
4.5
1960 20001995199019851980197519701965
Ireland
EU15
Birt
hs
THE
OF
FIC
E F
OR
SO
CIA
L INC
LUS
ION
1�
wh
AT iS A
Ch
ild?
40-44 is now less than a third of what it was in the early 1970s, and births among those aged 45 or over, while always unusual, have also fallen since the 1970s. These trends are important, as they indicate that while the average age of childbearing among women has risen in recent years, it has not meant that more mothers in the higher-risk older age groups are having children.
Where children live
Children make up about a quarter of the population of each of the provinces, reflecting their share of the total population. Over half
(53%) live in Leinster, 28% live in Munster, 12% live in Connacht and 7% live in the three Ulster counties. Table 1 shows the share of children and of the overall population across the country’s eight planning regions. The greater Dublin area has fewer children than its overall population would suggest, but it still contains a quarter of all children in Ireland. Children have an above-average share of the population in the Border, Mid-East and South-East regions. In terms of the two-way categorisation of the country into the Southern and Eastern versus Border/Midlands/West (BMW) regions, the percentage of children living in each region is very close to its share of the overall population.
figure 5: fertility rates by age, 19�1-�005
1.0
1.5
2.0
2.5
3.0
3.5
4.0
4.5
1.0
1.5
2.0
2.5
3.0
3.5
4.0
4.5
1960 20001995199019851980197519701965
Ireland
EU15
0
50
100
150
200
250
300
1961 20052001199619911986198119711966
0
50
100
150
200
250
300
< 20
20-24
25-29
30-34
35-39
40-44
Live
Birt
hs p
er
1,00
0 Po
pula
tion
Source: C
SO
Vital Statistics
Source: C
ensus of Population
Border
Dublin
Mid-East
Midland
Mid-West
South-East
South-West
West
% children % All
Border 11.� 11.0
dublin �5.� ��.1
Mid-east 1�.� 11.0
Midland �.4 5.9
Mid-West �.� �.5
South-east 11.4 10.9
South-West 14.5 14.�
West 9.� 9.�
table 1: Percentage of children and total population by planning region, �00�
A S
OC
IAL P
OR
TRA
IT OF C
HILD
RE
N IN
IRE
LAN
D
A S
OC
IAL P
OR
TRA
IT OF C
HILD
RE
N IN
IRE
LAN
D
THE
OF
FIC
E F
OR
SO
CIA
L INC
LUS
ION
14
A S
OC
IAL P
OR
TRA
IT OF C
HILD
RE
N IN
IRE
LAN
D
THE
OF
FIC
E F
OR
SO
CIA
L INC
LUS
ION
Children are also slightly more likely than adults to live in rural rather than urban areas, though a clear majority live in towns. In the 2002 Census, 57% of children compared to 60% of the overall population lived in towns, with 43% versus 40% in rural areas.
children, families and households
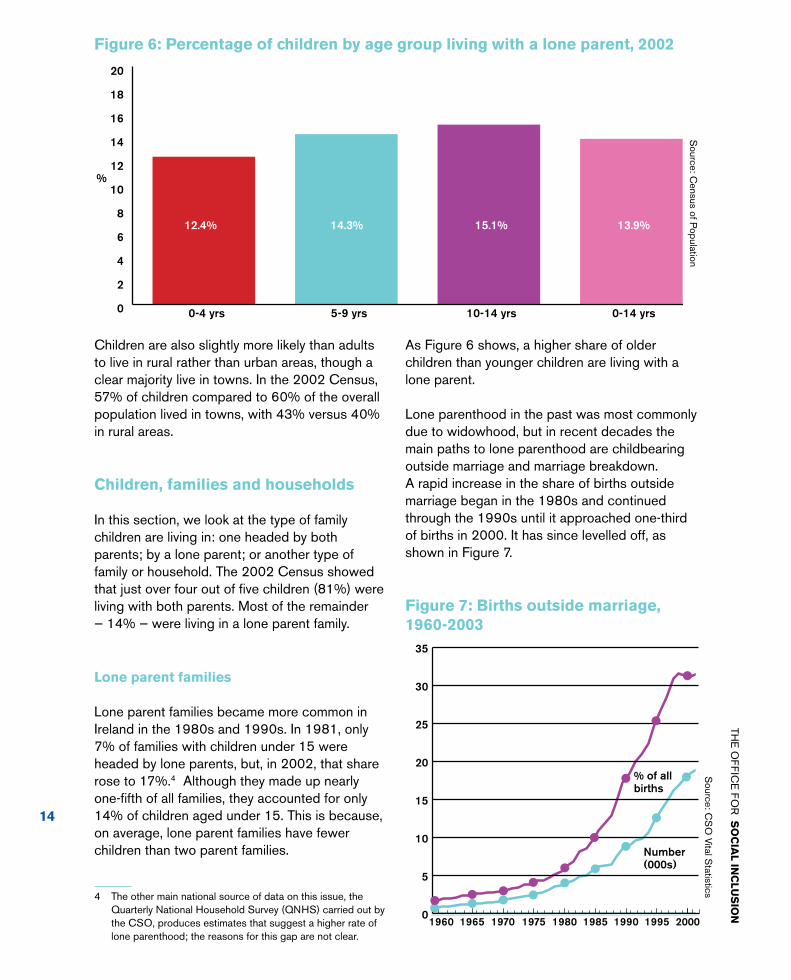
In this section, we look at the type of family children are living in: one headed by both parents; by a lone parent; or another type of family or household. The 2002 Census showed that just over four out of five children (81%) were living with both parents. Most of the remainder — 14% — were living in a lone parent family.
lone parent families
Lone parent families became more common in Ireland in the 1980s and 1990s. In 1981, only 7% of families with children under 15 were headed by lone parents, but, in 2002, that share rose to 17%.4 Although they made up nearly one-fifth of all families, they accounted for only 14% of children aged under 15. This is because, on average, lone parent families have fewer children than two parent families.
4 The other main national source of data on this issue, the Quarterly National Household Survey (QNHS) carried out by the CSO, produces estimates that suggest a higher rate of lone parenthood; the reasons for this gap are not clear.
As Figure 6 shows, a higher share of older children than younger children are living with a lone parent.
Lone parenthood in the past was most commonly due to widowhood, but in recent decades the main paths to lone parenthood are childbearing outside marriage and marriage breakdown. A rapid increase in the share of births outside marriage began in the 1980s and continued through the 1990s until it approached one-third of births in 2000. It has since levelled off, as shown in Figure 7.
figure 7: Births outside marriage, 19�0-�00�
figure �: Percentage of children by age group living with a lone parent, �00�
Source: C
ensus of Population
0
2
4
6
8
10
12
14
16
18
20
12.4%
0-4 yrs 5-9 yrs 10-14 yrs 0-14 yrs
14.3% 15.1% 13.9%
%
0
2
4
6
8
10
12
14
16
18
20
12.4%
0-4 yrs 5-9 yrs 10-14 yrs 0-14 yrs
14.3% 15.1% 13.9%
%
% of all births
Number (000s)
1960 1965 1970 1975 1980 1985 1990 1995 20000
5
10
15
20
25
30
35
Source: C
SO
Vital Statistics

A S
OC
IAL P
OR
TRA
IT OF C
HILD
RE
N IN
IRE
LAN
D
THE
OF
FIC
E F
OR
SO
CIA
L INC
LUS
ION
A S
OC
IAL P
OR
TRA
IT OF C
HILD
RE
N IN
IRE
LAN
D
THE
OF
FIC
E F
OR
SO
CIA
L INC
LUS
ION
Source: C
ensus of Population
The difference between two parent and one parent families is not as clear-cut as it might seem, mainly because a large percentage of unmarried mothers are living with a partner when their child is born. In addition, the actual level of lone parenting among mothers with children aged 4 or under who started out as unmarried could be considerably below 50%.
Census 2002, for example, recorded that only 11.4% of children aged 0 to 4 years (25,400 children) were living with lone parents. However, this is equal to only 35% of the children in that age group born outside of marriage. This trend is reflected in a study (Mahon et al. 1998) that gathered information on over 2,000 women who were pregnant in 1996. In this study, 35% of respondents were unmarried, but only 11% described themselves as ‘single’ (that is, not in any ongoing relationship). Over two-thirds of those who were unmarried and pregnant reported that they were in a stable relationship of some kind.
By 2002, cohabiting couples with children under 15 made up 6.5% of all families with children. In addition, 4.8% of all children were living in these families.
the rise in smaller families
Families are now having fewer children, with the average number of children per family falling from 2.2 in 1981 to 1.6 in 2002. Table 2 shows that the number of children aged under 15 living in households with only one or two children under 15 rose sharply between 1981 and 2002, while the numbers living in households with four, five or six or more children fell equally sharply. By 2002, 60% of children were living in households with one or two children, compared with 35% in 1981, and 15% of children were living in households with four, five or six or more children, compared with 38% in 1981.
This change reflects the fact that large families were very common in Ireland in the quite recent past, but, as Figure 8 shows, their numbers have been falling very rapidly. In 1960, for example, for every 10 first-born children, over 15 children were born the fifth or later children in their families. In contrast, by 2005, for every 10 first-born children, only one child was born the fifth or later child. So the very large family, which little more than a generation ago was very common, has now become rare as birth rates have fallen.
wh
AT iS A
Ch
ild?
15

A S
OC
IAL P
OR
TRA
IT OF C
HILD
RE
N IN
IRE
LAN
D
THE
OF
FIC
E F
OR
SO
CIA
L INC
LUS
ION
1�
A S
OC
IAL P
OR
TRA
IT OF C
HILD
RE
N IN
IRE
LAN
D
THE
OF
FIC
E F
OR
SO
CIA
L INC
LUS
ION
So children are now living in much smaller families. As Table 2 shows, in 2002 less than 40,000 children were living in households that had five or more children.
figure �: number of births by birth order in ireland, 19�0-�005
0
5
10
15
20
25
30
1960 1965 1970 1975 1980 1985 1990 1995 2000 2005
First births
Second births
Third births
Fourth births
Fifth plus
0
5
10
15
20
25
30
1960 1965 1970 1975 1980 1985 1990 1995 2000 2005
First births
Second births
Third births
Fourth births
Fifth plus
Source: C
SO
Vital Statistics

A S
OC
IAL P
OR
TRA
IT OF C
HILD
RE
N IN
IRE
LAN
D
THE
OF
FIC
E F
OR
SO
CIA
L INC
LUS
ION
ch
ildr
en
’S S
oc
io-e
co
no
Mic
cir
cu
MS
tAn
ce
S
The number of children aged under 15 living in households with only one or two children under 15 rose sharply between 1981 and 2002
•
A S
OC
IAL P
OR
TRA
IT OF C
HILD
RE
N IN
IRE
LAN
D
THE
OF
FIC
E F
OR
SO
CIA
L INC
LUS
ION
children’S Socio-econoMic circuMStAnceS

A S
OC
IAL P
OR
TRA
IT OF C
HILD
RE
N IN
IRE
LAN
D
THE
OF
FIC
E F
OR
SO
CIA
L INC
LUS
ION
A S
OC
IAL P
OR
TRA
IT OF C
HILD
RE
N IN
IRE
LAN
D
THE
OF
FIC
E F
OR
SO
CIA
L INC
LUS
ION
A household’s standard of living is also affected if one or both parents:
• are unemployed or have a disability; or
• if in employment, have a low income; or
• live in a disadvantaged area.
As employment is the main route out of poverty, households where one or both parents are not working outside the home are more vulnerable to poverty. Parents may be involved in rearing children when they are still in the early stages of their working life and earning a relatively low income, compared to later. They may also have a
high mortgage or other high housing costs, such as rent, and need to buy consumer durables, such as kitchen appliances, phones, furniture and so on.
State schemes offer help in finding and staying in work. They also increase the income of households with children through schemes such as Child Benefit, the Early Childcare Supplement (in respect of children under six years of age), and social welfare payments especially for low-income families with children, lone parents and those who are unemployed or have a disability. These schemes and payments are designed to secure at least a basic standard of living for these households.
normally children live in households with parents who provide and care for them, so their circumstances are affected by those of their parents. in general, the additional cost of providing for children means that households with children are on average slightly less well off than households without children. these households also incur what are called ‘opportunity costs’. these arise in a two parent household, for example, when one parent, usually the mother, may not work full-time, or even part-time, because she cares for the children. As a result, the household is earning less money that it would if both parents were working. employment for lone parents is even more difficult, especially when the children are small, as they have to combine earning a living and caring for their children.
1�

A S
OC
IAL P
OR
TRA
IT OF C
HILD
RE
N IN
IRE
LAN
D
THE
OF
FIC
E F
OR
SO
CIA
L INC
LUS
ION
19
ch
ildr
en
’S S
oc
io-e
co
no
Mic
cir
cu
MS
tAn
ce
S
A S
OC
IAL P
OR
TRA
IT OF C
HILD
RE
N IN
IRE
LAN
D
THE
OF
FIC
E F
OR
SO
CIA
L INC
LUS
ION
Surveys and indicators of income and poverty in households with children
Regular surveys on living conditions in Ireland enable us to monitor changes in the socio-economic circumstances in which Irish children live. More children are likely to be vulnerable to poverty than adults, as there are on average more children in poorer households than there are adults. So the findings of the surveys greatly assist in monitoring how effective government policies are in supporting households with children, especially those most in need.
Our focus here is on the main indicators of income and poverty from the national household surveys. In particular we draw on the first full wave of the EU Survey on Income and Living Conditions (EU-SILC) conducted by the CSO in 2004. For trends over time, we can also draw on the Living in Ireland Survey carried out by the ESRI between 1994 and 2001.5
5 In the results we present from analysis of these data, a child is defined as aged under 18, though the published results from EU-SILC employ the age categories 0-14, 15-64 and 65+. LIIS and EU-SILC are not identical in terms of methodology so comparison between them is restricted to broad trends. Methodological difficulties also account for the lack of comparability in the consistent poverty results between the two surveys. A full breakdown of data from EU-SILC for 2005 is not yet available.
We look at a number of indicators in this section:
overall household income;
consistent poverty;
relative income, compared with income for the overall population; and
links between employment and poverty risk.
household income
We start with household income and report for adults and children the overall incomes of the households in which they live. To take household size and membership into account we calculate ‘equivalised income’. This applies a weight of 1.0 for the first adult, 0.66 for each additional adult and 0.33 for every child. This way, the results adjust for different needs between households and for economies of scale.
From Figure 9 we see that, on average, households with children have a slightly lower equivalised income than those with only adults. This reflects the fact that adult-only households have slightly higher income than those containing both adults and children. The gap in income is about 9%.
•
•
•
•
Source: E
U-S
ILC S
urvey 2004

�0
0
5
10
15
20
25
23.1
Children
Adults
18.8 21.3 19.5 21.4 19.5 19.0 20.3 15.2 21.8
BottomQuintile
2 3 4 TopQuintile
%
0
10
20
30
40
50
60
70
64.4
Children
Adults
58.9 13.7 12.7 7.2 6.2 14.8 22.3
< 25% 25% to 50% 50% to 75% > 75%
%
By their nature, the average income figures only tell part of the story, so next we look at where children are located across the spread of income. Figure 10 shows the spread of children versus adults across five income ranges (each known as a quintile). The quintiles are ranked from first (the bottom) to fifth (the top). The chart shows that children are more likely than adults to be in the bottom quintile, with 23% of children versus 19% of adults in households that are located there. Children are also slightly more likely to be in households located in the second and third quintiles. As a result, 66% of children are found in the bottom three quintiles compared to 58% of adults. Children have a particularly low likelihood of being in the top quintile where only 15% are located, compared with 22% of adults.
Social welfare benefitsOne important feature of household income is the extent to which it comes from social welfare benefits, also known as social transfers. Figure 11 compares children and adults in this area. At one end of the scale, about 15% of children are in households that rely very heavily on social welfare benefits (in other words, get three-quarters or more of their income from that source). At the other end, almost two-thirds of children are found in households where less than a quarter of household income is from social welfare benefits. It can be seen that adults are more likely to be in households that rely heavily on social welfare, but the adult figures of course include those aged sixty-five or over who particularly depend on these benefits.
figure 10: children and adults by equivalised household income quintile position
Source: E
U-S
ILC S
urvey 2004
figure 11: children and adults by percentage of household income from social welfare benefits
Source: E
U-S
ILC S
urvey 2004
A S
OC
IAL P
OR
TRA
IT OF C
HILD
RE
N IN
IRE
LAN
D
THE
OF
FIC
E F
OR
SO
CIA
L INC
LUS
ION
�1
ch
ildr
en
’S S
oc
io-e
co
no
Mic
cir
cu
MS
tAn
ce
S
0
10
20
30
40
50
60
70
64.4
Children
Adults
58.9 13.7 12.7 7.2 6.2 14.8 22.3
< 25% 25% to 50% 50% to 75% > 75%
0 5 10 15 20 25 30 35
9.5%
7.6%
32.1%
5.8%
6.2%
6.8%
Children
Children in Households with 3+ children
Children in lone parent households
Adults
Working age population
Total population
%
consistent poverty
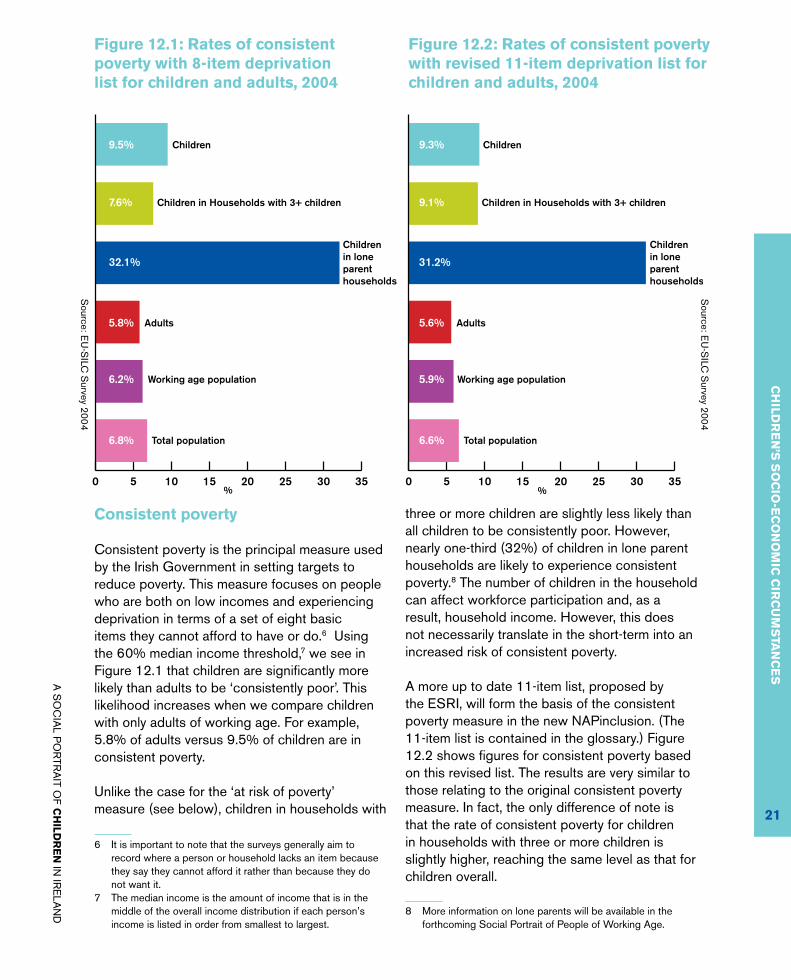
Consistent poverty is the principal measure used by the Irish Government in setting targets to reduce poverty. This measure focuses on people who are both on low incomes and experiencing deprivation in terms of a set of eight basic items they cannot afford to have or do.6 Using the 60% median income threshold,7 we see in Figure 12.1 that children are significantly more likely than adults to be ‘consistently poor’. This likelihood increases when we compare children with only adults of working age. For example, 5.8% of adults versus 9.5% of children are in consistent poverty.
Unlike the case for the ‘at risk of poverty’ measure (see below), children in households with
6 It is important to note that the surveys generally aim to record where a person or household lacks an item because they say they cannot afford it rather than because they do not want it.
7 The median income is the amount of income that is in the middle of the overall income distribution if each person’s income is listed in order from smallest to largest.
three or more children are slightly less likely than all children to be consistently poor. However, nearly one-third (32%) of children in lone parent households are likely to experience consistent poverty.8 The number of children in the household can affect workforce participation and, as a result, household income. However, this does not necessarily translate in the short-term into an increased risk of consistent poverty.
A more up to date 11-item list, proposed by the ESRI, will form the basis of the consistent poverty measure in the new NAPinclusion. (The 11-item list is contained in the glossary.) Figure 12.2 shows figures for consistent poverty based on this revised list. The results are very similar to those relating to the original consistent poverty measure. In fact, the only difference of note is that the rate of consistent poverty for children in households with three or more children is slightly higher, reaching the same level as that for children overall.
8 More information on lone parents will be available in the forthcoming Social Portrait of People of Working Age.
figure 1�.1: rates of consistent poverty with �-item deprivation list for children and adults, �004
Source: E
U-S
ILC S
urvey 2004
figure 1�.�: rates of consistent poverty with revised 11-item deprivation list for children and adults, �004
0
10
20
30
40
50
60
70
64.4
Children
Adults
58.9 13.7 12.7 7.2 6.2 14.8 22.3
< 25% 25% to 50% 50% to 75% > 75%
0 5 10 15 20 25 30 35
9.3%
9.1%
31.2%
5.6%
5.9%
6.6%
Children
Children in Households with 3+ children
Children in lone parent households
Adults
Working age population
Total population
%
Source: E
U-S
ILC S
urvey 2004
A S
OC
IAL P
OR
TRA
IT OF C
HILD
RE
N IN
IRE
LAN
D
THE
OF
FIC
E F
OR
SO
CIA
L INC
LUS
ION

��
A S
OC
IAL P
OR
TRA
IT OF C
HILD
RE
N IN
IRE
LAN
D
THE
OF
FIC
E F
OR
SO
CIA
L INC
LUS
ION
A S
OC
IAL P
OR
TRA
IT OF C
HILD
RE
N IN
IRE
LAN
D
THE
OF
FIC
E F
OR
SO
CIA
L INC
LUS
ION
0
10
20
30
40
50
60
22.7% 26.7% 52.8% 18.2% 16.6% 27.0% 19.4%
Children Children in Households with 3+ children
Children in lone parent households
Adults Working age population
Older people Total population
%
falling levels of consistent poverty among childrenLevels of consistent poverty have fallen sharply for both children and for adults over the past ten years, reflecting declining levels of deprivation and real improvements in living standards. However, the fall for children has been sharper. In the 1994 Living in Ireland Survey, 25% of children versus 14% of adults were in consistent poverty (based on the list of eight deprivation items). This meant that the rate for children was nearly 80% higher than that for adults. But in 2004, this gap narrowed to 64%. Although the gap between children and adults has narrowed in terms of consistent poverty over the 10 years, children are still more likely than adults to be in households experiencing basic deprivation.
‘At risk of poverty’
We now turn to relative income poverty, also known as the ‘at risk of poverty’ indicator. A person is said to be ‘at risk of poverty’ when their household receives less than 60% of median income.9 While the ‘at risk of poverty’ measure
9 The 60% threshold is most commonly used at EU level, but the Organisation for Economic Co-operation and Development (OECD) and the United Nations (UN) use a threshold of 50%. The threshold is adjusted for household size, so, for example, the threshold for a household with an adult couple and one child is about twice that for a single adult household.
is often used to make comparisons between countries, there are several factors that limit its usefulness. These factors include difficulties when making comparisons between countries with different levels of economic development or within a country undergoing rapid economic growth, as has been the case in Ireland. However, the measure is one of several used at EU level to monitor progress in tackling poverty.
Figure 13 shows the percentage of those falling below the ‘at risk of poverty’ threshold of 60%. It reports rates for children, adults and for the total population. Within the child population, it distinguishes children in households with three or more children and children in lone parent households. Within the adult population, it identifies those of working age. We see that ‘at risk of poverty’ rates are higher for children than adults, with 23% of all children being ‘at risk of poverty’ compared with 18% of adults, a difference of 5%. If children are compared with adults of working age, the gap rises to 6%. Over a quarter of children in households that have three or more children are ‘at risk of poverty’. This figure rises to over half of children in lone parent households.
figure 1�: ‘At risk of poverty’ rates at �0% of median income for children, adults, and working-age population, �004
Source: E
U-S
ILC S
urvey 2004

A S
OC
IAL P
OR
TRA
IT OF C
HILD
RE
N IN
IRE
LAN
D
THE
OF
FIC
E F
OR
SO
CIA
L INC
LUS
ION
��
ch
ildr
en
’S S
oc
io-e
co
no
Mic
cir
cu
MS
tAn
ce
S
A S
OC
IAL P
OR
TRA
IT OF C
HILD
RE
N IN
IRE
LAN
D
THE
OF
FIC
E F
OR
SO
CIA
L INC
LUS
ION
0
10
20
30
40
50
60
22.7% 26.7% 52.8% 18.2% 16.6% 27.0% 19.4%
Children Children in Households with 3+ children
Children in lone parent households
Adults Working age population
Older people Total population
%
change in income position of children compared to adultsChildren are more likely to experience ‘risk of poverty’ than adults, but the gap between them has narrowed a lot. In 1994, twice as many children as working-age adults were in households ‘at risk of poverty’, but in 2004, only one-third more children than adults were in this situation. This shift reflects most importantly the improved employment situation in Ireland and the resulting fall in the share of children in households affected by unemployment. (The continued decline in average family size would in itself also have reduced the ‘needs’ of the average family.)
The absolute incomes of the households in which children live — like other households in the period of the ‘celtic tiger’ — have risen very sharply between 1994 and 2004. This means that the numbers falling below poverty thresholds, held constant in purchasing power terms (rather than rising in step with average income), also fell very sharply indeed.
There is a strong relationship between labour market position and being ‘at risk of poverty’ and this extends to its impact on children. Here we focus on children in ‘jobless households’ — those where none of the working-age adults in the household are at work for at least 30 hours weekly. Data from the EU-SILC survey in 2004 show that a quarter of children are found in these jobless households. Figure 14 illustrates the sharp contrast between these households and others: six out of ten children in jobless households are ‘at risk of poverty’, but only one child in 10 faces the same situation in a household where at least one working age adult is at work for at least 30 hours a week.
figure 14: ‘At risk of poverty’ rates for children in (and not in) jobless households, �004
types of deprivation
It is interesting to look at the differences between children and adults in relation to some individual items that make up the consistent poverty index referred to above. (The information about this deprivation comes from the person in the household who is responsible for the housing arrangements.)
Children In jobless households
0
10
20
30
40
50
60
70
61.6% 9.4%
Children not in jobless households
%
Source: E
U-S
ILC S
urvey 2004

�4
A S
OC
IAL P
OR
TRA
IT OF C
HILD
RE
N IN
IRE
LAN
D
THE
OF
FIC
E F
OR
SO
CIA
L INC
LUS
ION
A S
OC
IAL P
OR
TRA
IT OF C
HILD
RE
N IN
IRE
LAN
D
THE
OF
FIC
E F
OR
SO
CIA
L INC
LUS
ION
From Figure 15 we can see that, across a range of items, households with children have higher levels of enforced deprivation than those with only adults. Households with three or more children are similar or less likely to be deprived. However, levels of deprivation are a lot higher for children in lone parent households: 14% say they are deprived of adequate warmth, 16% say they cannot buy presents for family and friends and 22% say they cannot have a roast joint or equivalent once a week.
Mixed rates of deprivation of consumer durablesIn Figure 16 we look at differences between households with children and those with adults only in terms of whether they can afford a number of widely available consumer durables – items that are used over time. We focus on a freezer, a stereo, clothes dryer, a video, a phone and a car. The gaps are similar to those seen with the basic deprivation items, with deprivation rates for children about two percentage points higher than for adults. Differences between children overall and those in households with more than three children are uneven across items. However, children in households with
three or more children are a lot less likely to be in a household that lacks a car because it cannot afford it. Presumably this is because owning a car is more essential for these households.
As in earlier measures of poverty and deprivation, children in lone parent households fare worse. Between 30% and 42% experience an enforced lack of a clothes dryer, a phone or a car, while 12% lack a stereo and 18% lack a freezer. In most cases, deprivation levels are about three times higher than for the adult population. For a phone they rise to seven times higher.
These differences are also seen when we look at indicators relating to the economic pressures that different households are or feel under. Figure 17 shows that children are twice as likely as adults to be in households that say they are behind in paying the rent or mortgage and in repaying hire purchase loans and debts for routine expenses. Between 25% and 31% of children are in households that cannot cope with unexpected expenses, have difficulty in making ends meet or experience housing costs as a great burden. This compares with about 20% of adults in households facing the same situations.
Source: E
U-S
ILC S
urvey 2004

A S
OC
IAL P
OR
TRA
IT OF C
HILD
RE
N IN
IRE
LAN
D
THE
OF
FIC
E F
OR
SO
CIA
L INC
LUS
ION
�5
ch
ildr
en
’S S
oc
io-e
co
no
Mic
cir
cu
MS
tAn
ce
S
A S
OC
IAL P
OR
TRA
IT OF C
HILD
RE
N IN
IRE
LAN
D
THE
OF
FIC
E F
OR
SO
CIA
L INC
LUS
ION
So children are much more likely than adults to be in households that are struggling to maintain adequate current living standards. Further, one in seven children is in a household experiencing problems with arrears or debts. Once again, there is no evidence that households with
three or more children experience greater economic stress: between 25% and 30% are in households that cannot cope with unexpected expenses, have ‘difficulty’ or ‘great difficulty’ in making ends meet or experience housing costs as a great pressure.
figure 17: economic pressures on households of children versus adults
Source: E
U-S
ILC S
urvey 2004
Source: E
U-S
ILC S
urvey 2004
0
10
20
30
40
50
60
70
Arrears Debts Unable to cope with unexpected
expenses
Difficulty in making ends meet
Housing costs a great pressure
Total population
Working age population
Adults only
Lone parent households
Households with 3+ children
Households with Children
%
��
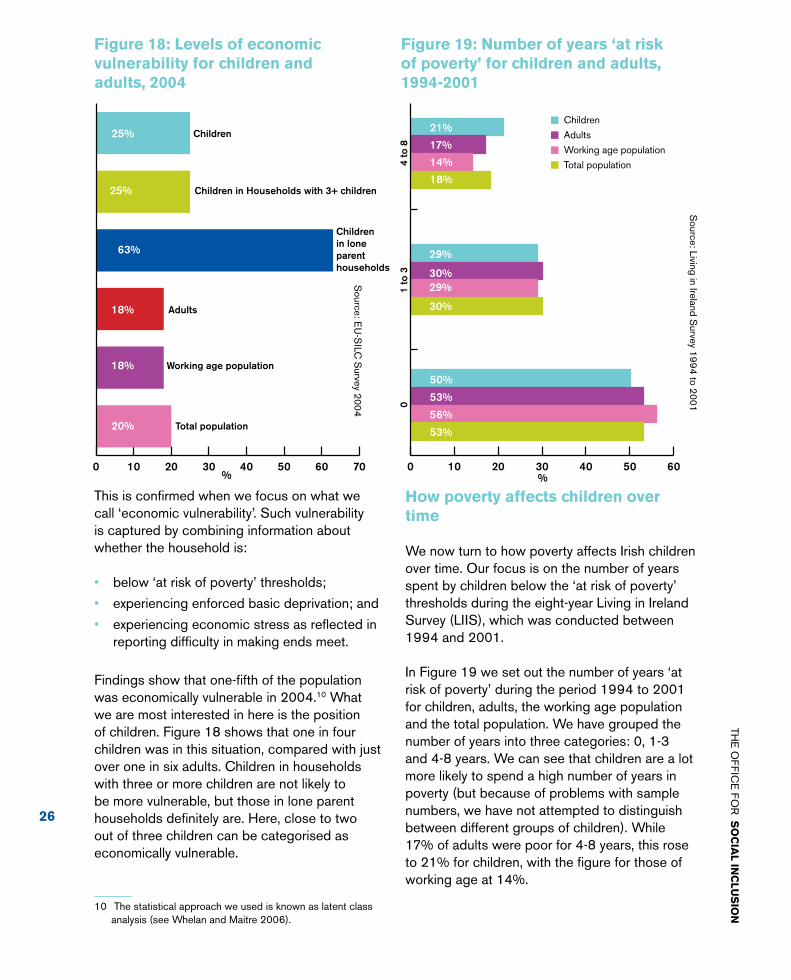
This is confirmed when we focus on what we call ‘economic vulnerability’. Such vulnerability is captured by combining information about whether the household is:
below ‘at risk of poverty’ thresholds;
experiencing enforced basic deprivation; and
experiencing economic stress as reflected in reporting difficulty in making ends meet.
Findings show that one-fifth of the population was economically vulnerable in 2004.10 What we are most interested in here is the position of children. Figure 18 shows that one in four children was in this situation, compared with just over one in six adults. Children in households with three or more children are not likely to be more vulnerable, but those in lone parent households definitely are. Here, close to two out of three children can be categorised as economically vulnerable.
10 The statistical approach we used is known as latent class analysis (see Whelan and Maitre 2006).
•
•
•
how poverty affects children over time
We now turn to how poverty affects Irish children over time. Our focus is on the number of years spent by children below the ‘at risk of poverty’ thresholds during the eight-year Living in Ireland Survey (LIIS), which was conducted between 1994 and 2001.
In Figure 19 we set out the number of years ‘at risk of poverty’ during the period 1994 to 2001 for children, adults, the working age population and the total population. We have grouped the number of years into three categories: 0, 1-3 and 4-8 years. We can see that children are a lot more likely to spend a high number of years in poverty (but because of problems with sample numbers, we have not attempted to distinguish between different groups of children). While 17% of adults were poor for 4-8 years, this rose to 21% for children, with the figure for those of working age at 14%.
figure 1�: levels of economic vulnerability for children and adults, �004
figure 19: number of years ‘at risk of poverty’ for children and adults, 1994-�001
Source: Living in Ireland S
urvey 199
4 to 2001
0
10
20
30
40
50
60
70
64.4
Children
Adults
58.9 13.7 12.7 7.2 6.2 14.8 22.3
< 25% 25% to 50% 50% to 75% > 75%
0 10 20 30 40 50 60 70
25%
25%
63%
18%
18%
20%
Children
Children in Households with 3+ children
Children in lone parent households
Adults
Working age population
Total population
%0 10 20 30 40 50 60
18%
14%
30%
17%
21%
4 to
81
to 3
0
50%
53%
56%
53%
29%
29%
30%
Children
Adults
Working age population
Total population
%
Source: E
U-S
ILC S
urvey 2004
A S
OC
IAL P
OR
TRA
IT OF C
HILD
RE
N IN
IRE
LAN
D
THE
OF
FIC
E F
OR
SO
CIA
L INC
LUS
ION
�7
ch
ildr
en
’S S
oc
io-e
co
no
Mic
cir
cu
MS
tAn
ce
S
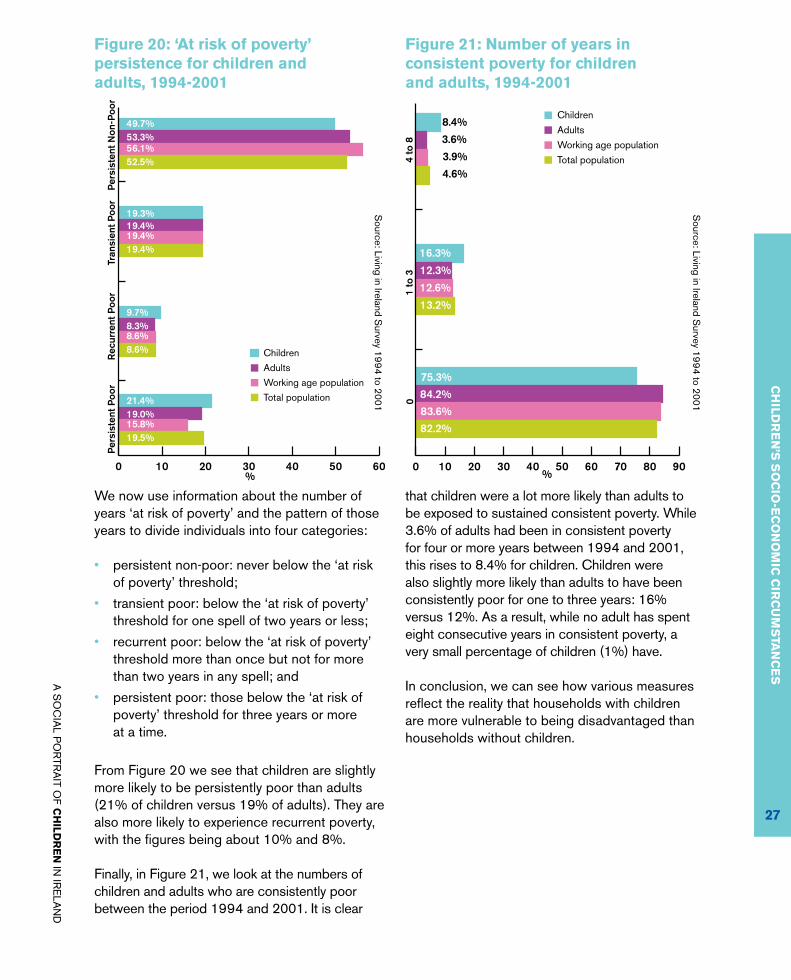
We now use information about the number of years ‘at risk of poverty’ and the pattern of those years to divide individuals into four categories:
persistent non-poor: never below the ‘at risk of poverty’ threshold;
transient poor: below the ‘at risk of poverty’ threshold for one spell of two years or less;
recurrent poor: below the ‘at risk of poverty’ threshold more than once but not for more than two years in any spell; and
persistent poor: those below the ‘at risk of poverty’ threshold for three years or more at a time.
From Figure 20 we see that children are slightly more likely to be persistently poor than adults (21% of children versus 19% of adults). They are also more likely to experience recurrent poverty, with the figures being about 10% and 8%.
Finally, in Figure 21, we look at the numbers of children and adults who are consistently poor between the period 1994 and 2001. It is clear
•
•
•
•
that children were a lot more likely than adults to be exposed to sustained consistent poverty. While 3.6% of adults had been in consistent poverty for four or more years between 1994 and 2001, this rises to 8.4% for children. Children were also slightly more likely than adults to have been consistently poor for one to three years: 16% versus 12%. As a result, while no adult has spent eight consecutive years in consistent poverty, a very small percentage of children (1%) have.
In conclusion, we can see how various measures reflect the reality that households with children are more vulnerable to being disadvantaged than households without children.
figure �0: ‘At risk of poverty’ persistence for children and adults, 1994-�001
Source: Living in Ireland S
urvey 199
4 to 2001
figure �1: number of years in consistent poverty for children and adults, 1994-�001
Source: Living in Ireland S
urvey 199
4 to 2001
Children
Adults
0 10 20 30 40 50 60
Tran
sien
t Poo
rR
ecur
rent
Poo
rPe
rsis
tent
Poo
r
Children
Adults
Working age population
Total population
49.7%53.3%56.1%52.5%
19.3%19.4%19.4%19.4%
9.7%8.3%8.6%8.6%
21.4%19.0%15.8%19.5%
Pers
iste
nt N
on-P
oor
%0 10 20 30 40 50 60 70 80 90
4.6%
3.9%
12.3%
3.6%
8.4%
4 to
81
to 3
0
75.3%
84.2%
83.6%
82.2%
16.3%
12.6%
13.2%
Children
Adults
Working age population
Total population
%
A S
OC
IAL P
OR
TRA
IT OF C
HILD
RE
N IN
IRE
LAN
D
THE
OF
FIC
E F
OR
SO
CIA
L INC
LUS
ION

��
A S
OC
IAL P
OR
TRA
IT OF C
HILD
RE
N IN
IRE
LAN
D
THE
OF
FIC
E F
OR
SO
CIA
L INC
LUS
ION
A S
OC
IAL P
OR
TRA
IT OF C
HILD
RE
N IN
IRE
LAN
D
THE
OF
FIC
E F
OR
SO
CIA
L INC
LUS
ION

A S
OC
IAL P
OR
TRA
IT OF C
HILD
RE
N IN
IRE
LAN
D
THE
OF
FIC
E F
OR
SO
CIA
L INC
LUS
ION
ed
uc
Atio
n
The number of children aged under 15 living in households with only one or two children under 15 rose sharply between 1981 and 2002
•
A S
OC
IAL P
OR
TRA
IT OF C
HILD
RE
N IN
IRE
LAN
D
THE
OF
FIC
E F
OR
SO
CIA
L INC
LUS
ION
educAtion

A S
OC
IAL P
OR
TRA
IT OF C
HILD
RE
N IN
IRE
LAN
D
THE
OF
FIC
E F
OR
SO
CIA
L INC
LUS
ION
A S
OC
IAL P
OR
TRA
IT OF C
HILD
RE
N IN
IRE
LAN
D
THE
OF
FIC
E F
OR
SO
CIA
L INC
LUS
ION
early education
We focus first on early education. Figures from the OECD in 2003 show that 26% of 3 to 4 year olds were enrolled as either full-time or part-time students. According to the Department of Education, 0.7% of those aged 3 or under (as at 1 January 2004) were in full-time education. This rose to 46% for those aged 4.
In 1994, eight centres began providing the Early Start pre-school programme, which aimed to involve young children in an educational programme in areas with the greatest disadvantage. By the school year 2003-2004, 39 schools — comprising 1,544 pupils — were taking part in this programme. These pupils are considered to be part-time students, so they are not included in the overall Department of
We now turn from social and economic circumstances to education. education is vital for developing children and their economic independence, standard of living and overall well-being later in life. Missing out on an adequate education at any stage can harm not only children’s immediate well-being but also affect them in their adult life. We now look at patterns of attendance at different levels of education and sketch some features of children’s educational experiences.
figure ��: estimated rate of participation in full-time education by age
0
20
40
60
80
100
0.7% 45.6% 99.7% 100%
3 and under 4 5 6 to 14
Source: D
epartment of E
ducation and Science
Statistical R
eport 2003/4
�0
A S
OC
IAL P
OR
TRA
IT OF C
HILD
RE
N IN
IRE
LAN
D
THE
OF
FIC
E F
OR
SO
CIA
L INC
LUS
ION
�1
ed
uc
Atio
n
A S
OC
IAL P
OR
TRA
IT OF C
HILD
RE
N IN
IRE
LAN
D
THE
OF
FIC
E F
OR
SO
CIA
L INC
LUS
ION
Education statistics of the percentage of under 5s in full-time education (see Figure 22).
Primary education
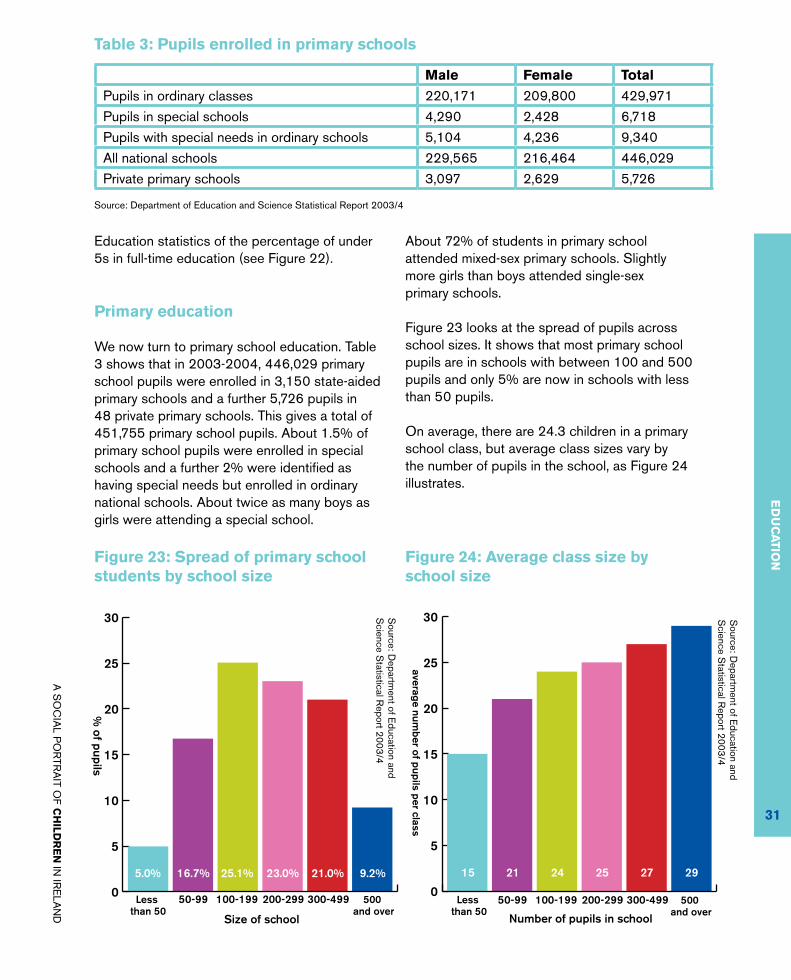
We now turn to primary school education. Table 3 shows that in 2003-2004, 446,029 primary school pupils were enrolled in 3,150 state-aided primary schools and a further 5,726 pupils in 48 private primary schools. This gives a total of 451,755 primary school pupils. About 1.5% of primary school pupils were enrolled in special schools and a further 2% were identified as having special needs but enrolled in ordinary national schools. About twice as many boys as girls were attending a special school.
About 72% of students in primary school attended mixed-sex primary schools. Slightly more girls than boys attended single-sex primary schools.
Figure 23 looks at the spread of pupils across school sizes. It shows that most primary school pupils are in schools with between 100 and 500 pupils and only 5% are now in schools with less than 50 pupils.
On average, there are 24.3 children in a primary school class, but average class sizes vary by the number of pupils in the school, as Figure 24 illustrates.
table �: Pupils enrolled in primary schools
Male female total
Pupils in ordinary classes 220,171 209,800 429,971Pupils in special schools 4,290 2,428 6,718Pupils with special needs in ordinary schools 5,104 4,236 9,340All national schools 229,565 216,464 446,029Private primary schools 3,097 2,629 5,726
Source: Department of Education and Science Statistical Report 2003/4
figure ��: Spread of primary school students by school size
figure �4: Average class size by school size
0
20
40
60
80
100
0.7% 45.6% 99.7% 100%
3 and under 4 5 6 to 14
0
5
10
15
20
25
30
5.0% 16.7% 25.1% 23.0% 21.0% 9.2%
Size of school
Less than 50
500 and over
% of pupils
0
5
10
15
20
25
30
15 21 24 25 27 29
Number of pupils in school
Less than 50
500 and over
average number of pupils per class
Source: D
epartment of E
ducation and S
cience Statistical R
eport 2003/4
Source: D
epartment of E
ducation and S
cience Statistical R
eport 2003/4
��
A S
OC
IAL P
OR
TRA
IT OF C
HILD
RE
N IN
IRE
LAN
D
THE
OF
FIC
E F
OR
SO
CIA
L INC
LUS
ION
A S
OC
IAL P
OR
TRA
IT OF C
HILD
RE
N IN
IRE
LAN
D
THE
OF
FIC
E F
OR
SO
CIA
L INC
LUS
ION
Over 4,000 primary pupils were retained in the same class as they had been in the year before. This is more likely to happen to boys – they made up 56% of those retained in the same class.
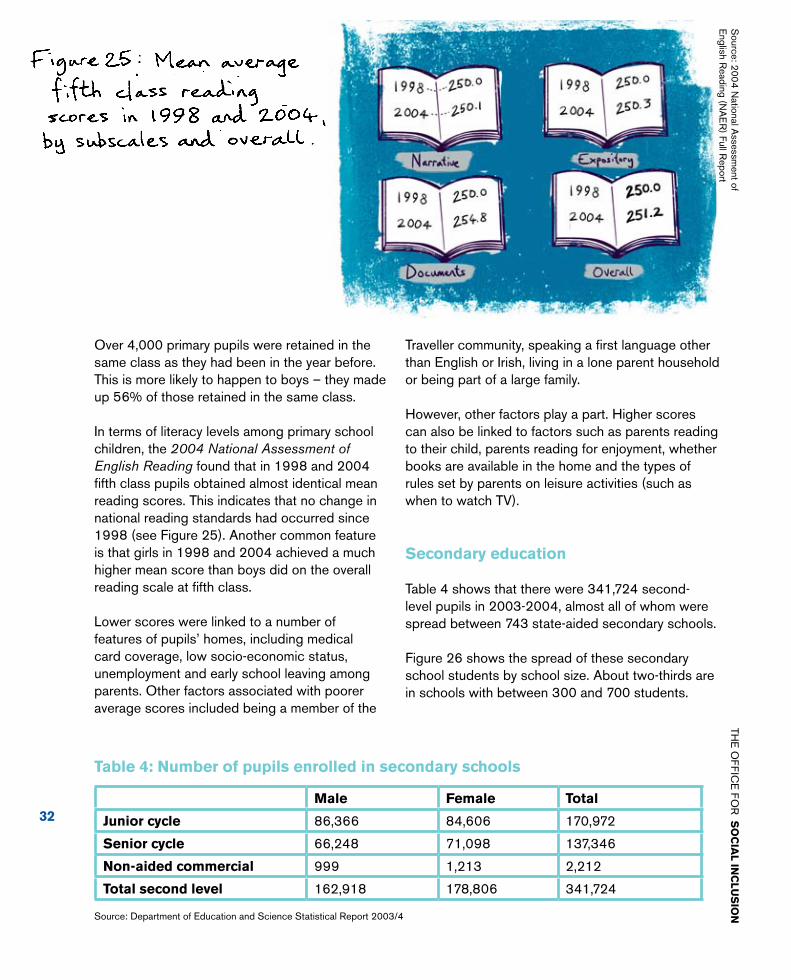
In terms of literacy levels among primary school children, the 2004 National Assessment of English Reading found that in 1998 and 2004 fifth class pupils obtained almost identical mean reading scores. This indicates that no change in national reading standards had occurred since 1998 (see Figure 25). Another common feature is that girls in 1998 and 2004 achieved a much higher mean score than boys did on the overall reading scale at fifth class.
Lower scores were linked to a number of features of pupils’ homes, including medical card coverage, low socio-economic status, unemployment and early school leaving among parents. Other factors associated with poorer average scores included being a member of the
Traveller community, speaking a first language other than English or Irish, living in a lone parent household or being part of a large family.
However, other factors play a part. Higher scores can also be linked to factors such as parents reading to their child, parents reading for enjoyment, whether books are available in the home and the types of rules set by parents on leisure activities (such as when to watch TV).
Secondary education
Table 4 shows that there were 341,724 second-level pupils in 2003-2004, almost all of whom were spread between 743 state-aided secondary schools.
Figure 26 shows the spread of these secondary school students by school size. About two-thirds are in schools with between 300 and 700 students.
table 4: number of pupils enrolled in secondary schools
Male female total
Junior cycle 86,366 84,606 170,972
Senior cycle 66,248 71,098 137,346
non-aided commercial 999 1,213 2,212
total second level 162,918 178,806 341,724
Source: Department of Education and Science Statistical Report 2003/4
Source: 200
4 National A
ssessment of
English R
eading (NA
ER
) Full Report

A S
OC
IAL P
OR
TRA
IT OF C
HILD
RE
N IN
IRE
LAN
D
THE
OF
FIC
E F
OR
SO
CIA
L INC
LUS
ION
��
ed
uc
Atio
n
A S
OC
IAL P
OR
TRA
IT OF C
HILD
RE
N IN
IRE
LAN
D
THE
OF
FIC
E F
OR
SO
CIA
L INC
LUS
ION
0
5
10
15
20
25
30
15% 21% 24% 25% 27% 29%
Number of pupils in school
0
5
10
15
20
25
0.6% 2.9% 8.7% 12.6% 15.3% 14.9% 19.1% 8.6% 17.1%
Number of pupils in school under 100 100-199 800 and over700-799600-699500-599400-499300-399200-299
% of total pupils
Comparing different types of school, 56% of second level students are in the secondary school sector, 30% are in vocational schools and the rest are in community schools. Boys are slightly more likely than girls to be in vocational or community schools. Half of all pupils at second level are in the Junior Cycle. Of those in the Senior Cycle, half are on the Established Leaving Certificate Course, 24% are taking the Leaving Certificate Vocational Programme and 6% take the Leaving Certificate Applied. A lot more girls than boys take languages, Art, Music
and Home Economics and Biology. On the other hand, more boys than girls study Physics and the technological subjects.
As well as the courses they take at school, a considerable number of young people take ‘grinds’ or private tuition outside school hours. Among those who sit the Leaving Certificate, 49% of females and 42% of males have taken grinds. As Figure 27 shows, this also varies by socio-economic background.
figure ��: Spread of secondary school students by school size
Source: D
epartment of E
ducation and S
cience Statistical R
eport 2003/4
figure �7: Share, by father’s socio-economic group, of students sitting the leaving certificate taking grinds
Source: S
chool Leavers’ Survey, 200
4
0
5
10
15
20
25
30
15% 21% 24% 25% 27% 29%
Number of pupils in school
0
10
20
30
40
50
60
70
40.5% 58.3% 55.7% 62.2% 46.4% 44.6% 37.5% 32.3% 31.5%
Number of pupils in school
Farmers Higher prof. UnknownUnemployedSemi/unskilled manual
Skilled manual
Other nonmanual
Employers/managers
Lower prof.
%

�4
A S
OC
IAL P
OR
TRA
IT OF C
HILD
RE
N IN
IRE
LAN
D
THE
OF
FIC
E F
OR
SO
CIA
L INC
LUS
ION
A S
OC
IAL P
OR
TRA
IT OF C
HILD
RE
N IN
IRE
LAN
D
THE
OF
FIC
E F
OR
SO
CIA
L INC
LUS
ION
0
5
10
15
20
25
30
15% 21% 24% 25% 27% 29%
Number of pupils in school
0
10
20
30
40
50
60
70
80
90
4.1% 3.4% 17.8% 11.6% 78.1% 84.9%
Number of pupils in school
No qualifications Leaving CertJunior Cert
Male
Female
%
Figure 28 shows that over four-fifths of young people leave school at Leaving Certificate level. However, 4% leave school without taking any exams, while 15% leave after the Junior Certificate exam. There was a marked increase in those staying on to Leaving Certificate level during the 1980s and early 1990s, but since the mid-1990s, the rate of those taking the Leaving Certificate has levelled off.
Patterns of school leaving vary by gender and family background: young women are more likely than young men to stay on in school to Leaving Certificate level. Figure 29 shows us that those with unemployed parents are least likely to stay on.
Various international programmes have aimed to survey and record students’ performance
figure ��: educational level of school leavers, �00�
Source: S
chool Leavers’ Survey, 200
4S
ource: School Leavers’ S
urvey, 2004
0
5
10
15
20
25
30
15% 21% 24% 25% 27% 29%
Number of pupils in school
0
10
20
30
40
50
60
70
80
90
100
88.5% 90.3% 88.1% 90.3% 83.2% 82.4%
Number of pupils in school
80.3% 58% 60.5%
Farmers Higher prof. UnknownUnemployedSemi/unskilled manual
Skilled manual
Other nonmanual
Employers/managers
Lower prof.
%
figure �9: Share, by father’s socio-economic group, of those staying in school to leaving certificate, �00�

A S
OC
IAL P
OR
TRA
IT OF C
HILD
RE
N IN
IRE
LAN
D
THE
OF
FIC
E F
OR
SO
CIA
L INC
LUS
ION
�5
ed
uc
Atio
n
A S
OC
IAL P
OR
TRA
IT OF C
HILD
RE
N IN
IRE
LAN
D
THE
OF
FIC
E F
OR
SO
CIA
L INC
LUS
ION
0
10
20
30
40
50
60
Too many troublemakers Lack of order in class Discipline unfair Didn't deal with bullying
No qualifications
Junior Cert
Leaving Cert
Total
55.7
%
52.3
%
21.6
%
25.7
%
53.9
%
43.5
%
26.0
%
29.4
%
37.1
%
25.7
%
12.1
%
14.9
%
32.9
%
26.6
%
16.5
%
18.4
%
%
in a range of everyday, ‘real life’ tasks. One of these is the Programme for International Student Assessment (PISA), a project of the OECD. In the PISA survey, a quarter of Irish students tested (at about age 15) scored in the top three levels on a scale for numeracy. This compares with an average of one-third for all countries in the OECD. At the other end of the scale, 40% of Irish students were in the bottom three levels, compared with an average of one-third of all OECD-country students (see OECD 2006).
Attitudes to school
Attitudes to their schooling and their teachers among school leavers are broadly positive. Most young people feel that their teachers helped them to do their best and cared about them, that they could talk to their teacher if they had a problem and that their teachers listened to their views. Early school leavers, however, have more negative views about their teachers and about schoolwork and were very unlikely to be surrounded by people who took school seriously.
As Figure 30 shows, only a minority of young people feel that major discipline problems existed in their school, to the point where there was no orderly learning environment. However, over a quarter of students report that there were too many troublemakers in their class and that their teachers were unable to keep order. Students who leave school early were much more likely to see their peers as disruptive and report a lack of order in class.
transport to school
We now look at school transport for primary and secondary students. A 2005 study (Fahey et al.) found that most Irish primary school children are driven to school, either by car (55%) or by bus (18%). A further 23% walk to school and only 3% cycle. Second-level school pupils also travel to school either by bus (35%) or by car (32%). Just over a quarter (27%) walk to school, while, as with primary school pupils, only 3% cycle. Most primary and secondary pupils take 15 minutes or less to walk or cycle to school.
figure �0: Perceptions of the disciplinary climate of the school by educational level
Source: S
chool Leavers’ Survey, 200
4

��
A S
OC
IAL P
OR
TRA
IT OF C
HILD
RE
N IN
IRE
LAN
D
THE
OF
FIC
E F
OR
SO
CIA
L INC
LUS
ION
A S
OC
IAL P
OR
TRA
IT OF C
HILD
RE
N IN
IRE
LAN
D
THE
OF
FIC
E F
OR
SO
CIA
L INC
LUS
ION
According to figures published by the Department of Education, 120,253 primary and secondary school children were carried on 3,012 school buses in 2003. This cost €54.7 million for a total of 53,144 primary school pupils, or, in other words, about €28 per primary school pupil per week.
Census information from 1981 to 2002 shows interesting changes in how children travel to school. In 1981, nearly half (47%) of all children aged 5 to 12 walked to school, 20% travelled by car, 19% by bus and only 4% cycled. By 2002, only 26% walked to school, those travelling in cars rose to 50% and only 1% said they cycled, while those travelling by bus remained constant at 18%.
Source: Census 2002, Volume 9-Travel to Work, School and College, CSO
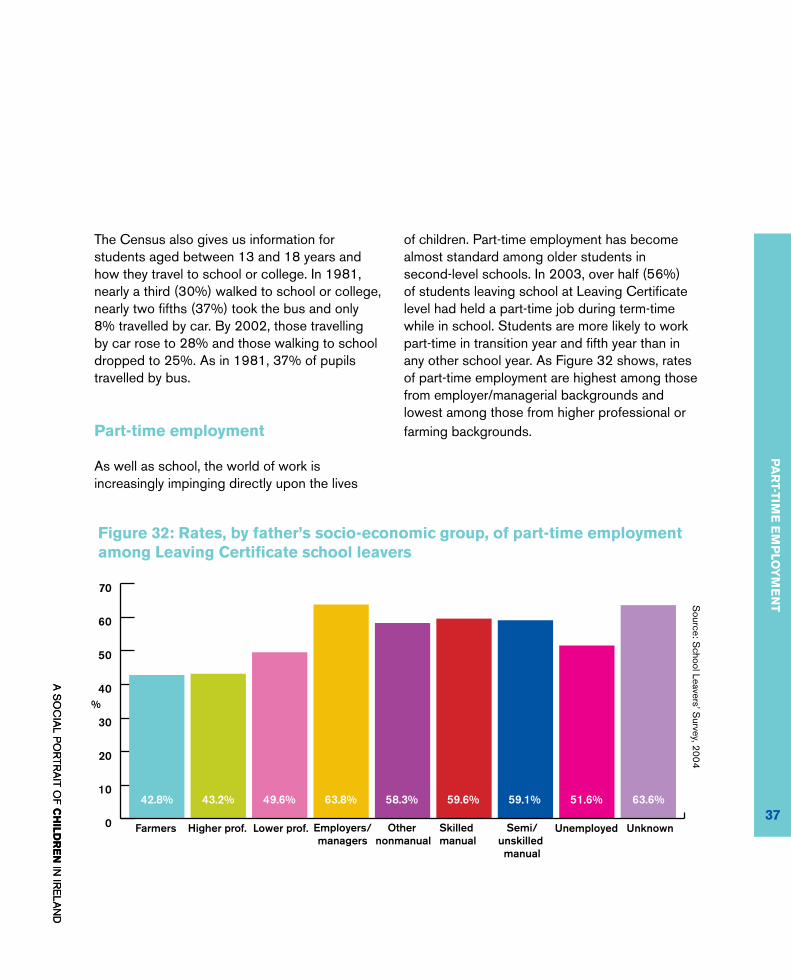
A S
OC
IAL P
OR
TRA
IT OF C
HILD
RE
N IN
IRE
LAN
D
THE
OF
FIC
E F
OR
SO
CIA
L INC
LUS
ION
�7
PA
rt-tiM
e e
MP
loY
Me
nt
A S
OC
IAL P
OR
TRA
IT OF C
HILD
RE
N IN
IRE
LAN
D
THE
OF
FIC
E F
OR
SO
CIA
L INC
LUS
ION
The Census also gives us information for students aged between 13 and 18 years and how they travel to school or college. In 1981, nearly a third (30%) walked to school or college, nearly two fifths (37%) took the bus and only 8% travelled by car. By 2002, those travelling by car rose to 28% and those walking to school dropped to 25%. As in 1981, 37% of pupils travelled by bus.
Part-time employment
As well as school, the world of work is increasingly impinging directly upon the lives
of children. Part-time employment has become almost standard among older students in second-level schools. In 2003, over half (56%) of students leaving school at Leaving Certificate level had held a part-time job during term-time while in school. Students are more likely to work part-time in transition year and fifth year than in any other school year. As Figure 32 shows, rates of part-time employment are highest among those from employer/managerial backgrounds and lowest among those from higher professional or farming backgrounds.
0
5
10
15
20
25
30
15% 21% 24% 25% 27% 29%
Number of pupils in school
0
10
20
30
40
50
60
70
42.8% 43.2% 49.6% 63.8% 58.3% 59.6%
Number of pupils in school
59.1% 51.6% 63.6%
Farmers Higher prof. UnknownUnemployedSemi/unskilled manual
Skilled manual
Other nonmanual
Employers/managers
Lower prof.
%
Source: S
chool Leavers’ Survey, 200
4
figure ��: rates, by father’s socio-economic group, of part-time employment among leaving certificate school leavers

��
A S
OC
IAL P
OR
TRA
IT OF C
HILD
RE
N IN
IRE
LAN
D
THE
OF
FIC
E F
OR
SO
CIA
L INC
LUS
ION
THE
OF
FIC
E F
OR
SO
CIA
L INC
LUS
ION
ch
ildc
Ar
e
The number of children aged under 15 living in households with only one or two children under 15 rose sharply between 1981 and 2002
•
A S
OC
IAL P
OR
TRA
IT OF C
HILD
RE
N IN
IRE
LAN
D
THE
OF
FIC
E F
OR
SO
CIA
L INC
LUS
ION
childcAre

one of the largest changes affecting children in ireland in recent years has been the rapid rise in the number of women, especially mothers with young children, working outside the home. in 19��, ��% of all women, and around �0% of women with children of school or pre-school age, were in employment. By �00�, over half of all women were in work. however, much of that rise was in part-time employment, especially among women with children. despite the low level of formal childcare, women with children under � are more likely than those with children aged � to 1� to be in full-time employment.
data on childcare in ireland are patchy and the recent picture on the use and cost of childcare is unclear. the most recent detailed data on use are for �00�. these show that 4�.5% of families with pre-school children used childcare, but almost half of this was provided by relatives, most of whom were unpaid (table 5). Among families with primary school pupils, only a quarter (�5.�%) used childcare. here again, relatives, most of whom were unpaid, accounted for over half of this. only a minority of children with mothers in paid work was in formal childcare.
40

41
ch
ildc
Ar
e
Most childcare in Ireland is provided privately, with families paying the full costs. In recent years, the Government has provided grants to childcare providers to create more childcare places. This has led to a greater supply and, as a result, lower costs to parents than they would otherwise have faced. In spite of this, from the rather scanty data available, it appears that the burden of childcare costs on parents is high. An OECD estimate found that the average childcare fee paid in Ireland amounted to 20% of the earnings of an average production employee, much higher than in comparison countries (OECD 2003: 146). Drawing together data from a number of sources for a number of years, the National Women’s Council arrived at broadly similar results. It found, for example, that a two parent family with two children in childcare and earning the average industrial wage would pay 16.7% of earnings on childcare costs (National Women’s Council 2005: 37-38).
table 5: types of childcare among families with pre-school and primary school children, September-november �00�
Pre-school Primary school
number of families (000s)
%number of families (000s)
%
unpaid relative 22.8 31.2 31.1 46.1
Paid relative 8.8 12.0 9.5 14.1
Paid carer 21.5 29.4 21.5 31.9
crèche/Montessori 19.8 27.1 4.1 6.1
other 5.4 7.4 2.9 4.3
total 73.1 100.0 67.5 100
% of families with children in childcare
42.5 25.3
Source: Central Statistics Office, QNHS 4th Quarter 2002 Childcare Module (Survey allows for multiple responses)
A S
OC
IAL P
OR
TRA
IT OF C
HILD
RE
N IN
IRE
LAN
D
4�
THE
OF
FIC
E F
OR
SO
CIA
L INC
LUS
ION

wh
AT iS A
Ch
ild?
heAlth

health is as essential to well-being for children as it is for adults. Broad indicators of children’s health internationally often focus on mortality rates for children around birth, for infants or for those under 5. however, these have now reached such a low level in rich countries that they may not adequately capture further progress in this area. the perinatal mortality rate (stillbirths and death during the first week) for ireland, for example, fell by about two-thirds between the mid-19�0s and the mid-19�0s, but it has been stable since then. the perinatal mortality rate in ireland in �00�, at about � per 1,000, is similar to the uK. it is higher, though, than the rates in the Scandinavian countries, which are as low as 5 per 1,000.
despite reaching a low level, perinatal mortality is still linked to socio-economic background, as illustrated in figure ��. Where the father’s occupation is recorded as unemployed (or no occupation is given), perinatal mortality is a good deal higher than where an occupation is reported.
44
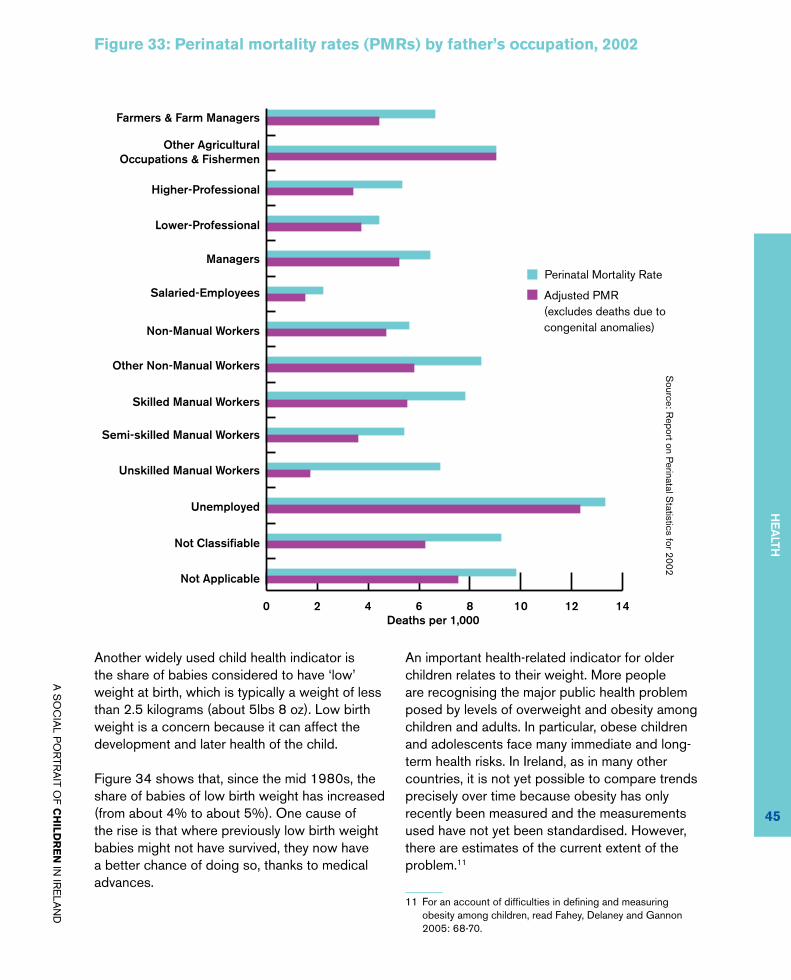
45
Another widely used child health indicator is the share of babies considered to have ‘low’ weight at birth, which is typically a weight of less than 2.5 kilograms (about 5lbs 8 oz). Low birth weight is a concern because it can affect the development and later health of the child.
Figure 34 shows that, since the mid 1980s, the share of babies of low birth weight has increased (from about 4% to about 5%). One cause of the rise is that where previously low birth weight babies might not have survived, they now have a better chance of doing so, thanks to medical advances.
An important health-related indicator for older children relates to their weight. More people are recognising the major public health problem posed by levels of overweight and obesity among children and adults. In particular, obese children and adolescents face many immediate and long-term health risks. In Ireland, as in many other countries, it is not yet possible to compare trends precisely over time because obesity has only recently been measured and the measurements used have not yet been standardised. However, there are estimates of the current extent of the problem.11
11 For an account of difficulties in defining and measuring obesity among children, read Fahey, Delaney and Gannon 2005: 68-70.
figure ��: Perinatal mortality rates (PMrs) by father’s occupation, �00�
hE
AlTh
Children
Adults
0 2 4 6 8 10 12 14
Higher-Professional
Other AgriculturalOccupations & Fishermen
Farmers & Farm Managers
Perinatal Mortality Rate
Lower-Professional
Managers
Salaried-Employees
Non-Manual Workers
Other Non-Manual Workers
Skilled Manual Workers
Semi-skilled Manual Workers
Unskilled Manual Workers
Unemployed
Not Classifiable
Not Applicable
0 2 4 6 8 10 12 14
Higher-Professional
Other AgriculturalOccupations & Fishermen
Farmers & Farm Managers
Perinatal Mortality Rate
Adjusted PMR
Lower-Professional
Managers
Salaried-Employees
Non-Manual Workers
Other Non-Manual Workers
Skilled Manual Workers
Semi-skilled Manual Workers
Unskilled Manual Workers
Unemployed
Not Classifiable
Not Applicable
Deaths per 1,000
Adjusted PMR(excludes deaths due tocongenital anomalies)
A S
OC
IAL P
OR
TRA
IT OF C
HILD
RE
N IN
IRE
LAN
D
Source: R
eport on Perinatal S
tatistics for 2002

4�
0
10
20
30
40
50
60
70
80
90
Normal Overweight Obese
80.1
%
79.5
%
15.4
%
16.6
%
4.5%
4.94
%3.
8%
Boys
Girls
%
0
1
2
3
4
5
6
1985 1992 1999 2000 2001 2002 2003
4.02
%
4.13
%
4.99
%
4.87
%
5.17
%
4.94
%
5.07
%
%
Figure 35 shows the share of boys and girls aged between 13 and 17 who were found in a recent school-based survey to be normal weight, overweight and obese. The survey defined overweight and obesity based on the cut-off points by age and gender, set by the International Obesity Task Force (IOTF), for what is called the Body-Mass Index. This index relates a person’s weight to their height.
A higher percentage of boys (4.5%) than girls (3.8%) are obese. But the rate of overweight is slightly lower for boys (15.4%) than for girls (16.6%). The National Survey of Children’s Dental Health 2001-2002, as reported by the
National Taskforce on Obesity (2005: 26) found broadly similar results. The rates of overweight and obesity are slightly below those found for children in the Health Survey for England 2002, which also used IOTF cut-offs (Sproston and Primatesta, 2003).
Evidence in the United States suggests that a higher socio-economic status is linked to lower rates of obesity in children and vice versa (Goodman, 2003). In Ireland, the picture seems different, as Table 6 shows. Here, the percentage of children who are obese does not vary consistently by father’s socio-economic group.
figure �4: Percentage of babies born with low birth weight (less than �.5 kilograms), 19�5-�00�
Source: R
eport on Perinatal S
tatistics for 2002
figure �5: Boys and girls aged 1�-17 by weight category, �004
Source: Fahey, D
elaney and Gannon (2005: 71)
table �: children aged 1�-17 by weight category and socio-economic group of father, �004
normal overweight obese total
Professional or technical 79.4 17.2 3.4 100
Business owner 75.0 20.2 4.8 100
Manager 85.7 12.4 2.0 100
clerical or administration 85.0 10.0 5.0 100
Service or sales 78.5 16.9 4.5 100
Skilled or semi-skilled 78.3 17.8 3.9 100
labourer 79.3 16.2 4.5 100
farmer 83.3 14.0 2.7 100
Source: Fahey, Delaney and Gannon (2005: 72)
THE
OF
FIC
E F
OR
SO
CIA
L INC
LUS
ION

wh
AT iS A
Ch
ild?
SPortS, recreAtion And leiSure

4�
We next examine children’s participation in sports. Most school-going children and young people have at least some involvement in sports within the school. figure �� shows that involvement in these sports is more frequent among secondary pupils than among primary pupils, and that male pupils in general are more likely than female pupils to have high levels of involvement (4 or more days per week).1�
Most school-going children and young people also have at least some involvement in sports outside school. Once again, male pupils in primary and secondary schools are more likely than female pupils to have high levels of
involvement (4 or more days per week) in these sports. A significant percentage (about 30%) of female students in secondary schools has no involvement in sports, either within or outside school.
figure ��: how often children take part in sport, by gender, �004
Source: Fahey, D
elaney and Gannon. (2005)
0
5
10
15
20
25
30
35
4+ days wk 2-3 days wk 1 day wk Less often Never
18%
13%
33%
10%
21%
25%
29%
30%
20%
26%
15%
23%
13%
11%
7% 9% 26%
24%
16%
29%
Primary Male
Primary Female
Second-level Male
Second-level Female
%
12 These results also come from the survey described in Fahey, Delaney and Gannon (2005)
THE
OF
FIC
E F
OR
SO
CIA
L INC
LUS
ION

49
wh
AT iS A
Ch
ild?
recreation and leisure
The last area we look at is children’s and young people’s pastimes. In a recent survey of young people aged 12 to 18 carried out for the National Children’s Office (de Roiste and Dinneen, 2005), two-thirds reported one or more hobby and nearly one-third took part in a community club or group. Almost all respondents (94%) said they watched television during free time, while 89% said they listened to music. One-third (mostly young males) said they played computer games most days. Girls and young women read more often than boys (there was also a link between reading and socio-economic status). Over 90% of young people reported that they spent time ‘hanging around with friends’. About one-quarter said they attended a disco every week, but one in five never did. About a quarter go to the cinema every week.
For the one-third of young people who are members of a club or community group, the most important are youth clubs, choir or folk groups, scouts or guides, or groups doing voluntary work. Those in rural areas are more likely than urban youth to be involved in clubs or groups.
When asked about what prevented them from doing leisure activities, only a small minority of respondents (10% of those aged 12 and 13 and 15% to 20% of those aged 17 and 18) said that money was a barrier. Transport can be a barrier in rural areas, with rural dwellers also more likely to say that their locality has little to offer in the way of leisure activities. Study is also a factor, particularly for girls: in sixth year 60% of young women compared with 28% of young men report that they spend most of their free time studying.
A S
OC
IAL P
OR
TRA
IT OF C
HILD
RE
N IN
IRE
LAN
D

50
THE
OF
FIC
E F
OR
SO
CIA
L INC
LUS
ION
wh
AT iS A
Ch
ild?
future ProSPectS And dAtA needS

5�
The likely level of migration is one of the major uncertainties in estimating what the population will be like in the future. Between 2000 and 2005, estimates suggest that about 11% of inward migrants to Ireland were aged 14 or under, compared with only 4% of those leaving the country. Children (of those ages) made up about 17% of net migrants. While children are likely to make up a smaller percentage of the population in the future, this is likely to be due to an increase in those aged over 18 in the overall population than to a fall in the number of children. Indeed, depending on the scale of increase in the overall population, the number of children may actually increase significantly.
Thinking about the future also points towards gaps in the information on which policy has to be made. Here the landscape is changing in a significant way with the start of the Growing Up in Ireland, the National Longitudinal Study of Children, which will follow a representative sample of children over time. This will be enormously valuable in recording and tracking important aspects of children’s lives in Ireland, as well as in understanding the factors of disadvantage and its transmission across generations. In addition, the Office for the
Minister for Children, as well as sponsoring this major new source of information, is to produce a set of child well-being indicators that will help to monitor change over time as well as make comparisons between Ireland and other countries (Hanafin and Brooks, 2005).
Despite these initiatives, there will remain important gaps in information about children, notably on relatively small but particularly marginalised groups. Future efforts to enhance statistical data and research methods will need to be directed at including these groups.
We saw at the outset that children make up over a quarter of the population at present, which is very high compared with other european countries. however, this is likely to fall significantly over time. Population estimates produced by the central Statistics office suggest that the proportion of children in the population could fall by as much as 5 percentage points in the period to �0�� (projections by Barrett and Bergin suggest little further decline between then and �050).
THE
OF
FIC
E F
OR
SO
CIA
L INC
LUS
ION

wh
AT iS A
Ch
ild?
GloSSArY
A S
OC
IAL P
OR
TRA
IT OF C
HILD
RE
N IN
IRE
LAN
D
THE
OF
FIC
E F
OR
SO
CIA
L INC
LUS
ION
54
A S
OC
IAL P
OR
TRA
IT OF C
HILD
RE
N IN
IRE
LAN
D
THE
OF
FIC
E F
OR
SO
CIA
L INC
LUS
ION
‘At risk of poverty’ lines: Income thresholds derived as proportions of median income, for example, 60% of median income in a sample.
Absolute incomes: Incomes measured against a fixed purchasing power standard rather than a relative standard that moves up over time in line with average incomes.
consistent poverty: This measure of poverty originally identified from those people who were ‘at risk of poverty’ (i.e., receiving below 60% of median income), those who were also experiencing basic deprivation i.e. deprived of at least one out of � items considered necessary to ensure a basic standard of living. The 8 items were as follows:
Two pairs of strong shoes
A warm waterproof overcoat
Buy new not second-hand clothes
Eat meals with meat, chicken, fish (or vegetarian equivalent) every second day
Have a roast joint or its equivalent once a week
Had to go without heating during the last year through lack of money
Had a day in the last two weeks without a substantial meal due to lack of money
Experienced debt problems arising from ordinary living expenses
The revised consistent poverty measure identifies from those people who are ‘at risk of poverty’ (i.e., receiving below 60% of median income), those who are also deprived of at least two out of the following 11 items:
•
•
•
•
•
•
•
•
Without heating at some stage in the past year due to lack of money
Unable to afford two pairs of strong shoes
Unable to afford a roast joint (or its equivalent) once a week
Unable to afford a meal with meat, chicken or fish (or vegetarian equivalent) every second day
Unable to afford new (not second-hand) clothes
Unable to afford a warm waterproof coat
Keep the home adequately warm
Presents for family or friends at least once a year
Replace any worn out furniture
Have family or friends for a drink or meal once a month
Have a morning, afternoon or evening out in the last fortnight, for entertainment
echP: European Community Household Panel, survey organised across 13 EU Member States by Eurostat, the Statistical Office of the European Communities, between 1994 and 2001, of which the Living in Ireland Surveys were the Irish component.
economic vulnerability: A measure of the economic situation of a household that combines information about whether the household is below the ‘at risk of poverty’ threshold, experiencing enforced basic deprivation, and having difficulty making ends meet.
economically independent: Having an income of one’s own rather than relying on other family members.
•
•
•
•
•
•
•
•
•
•
•

A S
OC
IAL P
OR
TRA
IT OF C
HILD
RE
N IN
IRE
LAN
D
THE
OF
FIC
E F
OR
SO
CIA
L INC
LUS
ION
55
A S
OC
IAL P
OR
TRA
IT OF C
HILD
RE
N IN
IRE
LAN
D
THE
OF
FIC
E F
OR
SO
CIA
L INC
LUS
ION
equivalence scales: A set of relativities between the needs of households of differing size and composition, used to adjust household income to take into account the greater needs of larger households.
eu 15: Member States of the European Union prior to the accession of 10 new member states on 1 May 2004, i.e. Austria, Belgium, Denmark, Finland, France, Germany, Greece, Ireland, Italy, Luxembourg, the Netherlands, Portugal, Spain, Sweden, United Kingdom.
eu �5: Member States of the European Union after the accession of 10 new member states on 1 May 2004, i.e. EU 15 plus Cyprus, the Czech Republic, Estonia, Hungary, Latvia, Lithuania, Malta, Poland, Slovakia, Slovenia.
eu-Silc: European Union Statistics on Income and Living Conditions, in Ireland a survey carried out by the Central Statistics Office each year starting in 2003.
household equivalent (or equivalised) income: Household income adjusted to take account of differences in household size and composition by means of equivalence scales.
household reference person: In a household survey context, term used to refer to one individual, often the person responsible for the housing costs.
liiS: Living in Ireland Survey, household survey carried out by the Economic and Social Research Institute between 1994 and 2001.
low birth-weight: Conventionally measured as below 2,500 grams at birth.
Mean: The average value (for example, the average income in a sample obtained via household survey).
Median: The value that divides a sample in half (e.g. the income level above and below which half the people in a sample fall).
Perinatal morality rate: Stillbirths and deaths during the first week of life.
Planning region: The eight regions into which Ireland has been divided for certain planning and administrative purposes. Poverty dynamics: Changes in the poverty status of an individual or household over time, movements in or out of poverty.
Poverty persistence: The extent to which the same persons or households remain in poverty over time.
Quintile position: In income distribution terms, the fifth of the sample in income terms in which a person or household is located (e.g. the bottom quintile).
risk of poverty: A term used at EU level to denote whether a household falls below the 60% of median income threshold.
Social transfers: Cash receipts paid from various social welfare schemes received by the individual or household.
GlO
SS
Ar
Y
5�
total fertility rate (tfr): The average number of births a woman would have during her reproductive life if she had the fertility rates characteristic of various childbearing age groups in a particular year.
urban/rural location: In EU-SILC each country is divided into eight levels based on population density. These areas are further grouped into urban and rural areas as follows:
urban:
cities, suburbs of cities, mixed urban/rural areas bordering on the suburbs of cities, towns and surrounding areas with populations of 5,000 or over (large urban);
mixed urban/rural areas bordering larger towns; and
towns and surrounding areas with a population of 1,000 to 5,000 (other urban).
rural:
mixed urban/rural areas, and rural areas.
•
•
•
•
•
•
THE
OF
FIC
E F
OR
SO
CIA
L INC
LUS
ION

wh
AT iS A
Ch
ild?
BiBlioGrAPhY And further reAdinG
A S
OC
IAL P
OR
TRA
IT OF C
HILD
RE
N IN
IRE
LAN
D
THE
OF
FIC
E F
OR
SO
CIA
L INC
LUS
ION
5�
A S
OC
IAL P
OR
TRA
IT OF C
HILD
RE
N IN
IRE
LAN
D
THE
OF
FIC
E F
OR
SO
CIA
L INC
LUS
ION
Barrett, A. and A. Bergin (2005). “Assessing Age-Related Pressures on the Public Finances 2005 to 2050”, in Budget Perspectives 2006, ed. T. Callan and A. Doris, The Economic and Social Research Institute: Dublin.
Bonham, S. (2006). Report on Perinatal Statistics for 2002, The Economic and Social Research Institute: Dublin.
Central Statistics Office (2003a). Census of Population 2002, Vol. 2: Ages and Marital Status: Dublin/Cork.
Central Statistics Office (2003b). Census of Population 2002, Vol. 3: Household Composition and Family Units: Dublin/Cork.
Central Statistics Office (2004). Census 2002, Volume 9: Travel to Work, School and College: Dublin/Cork.
Central Statistics Office (2004). Population and Labour Force Projections 2006-2036: Dublin/Cork.
Central Statistics Office (2005). Population and Migration Estimates, April 2005: Dublin/Cork.
Department of Education and Science Statistical Report 2003/4, (2005) Stationery Office: Dublin.
Eivers, E., Shiel, G., Perkins, R. & Cosgrove, J. (2005). The 2004 National Assessment of English Reading (NAER) Full Report, Educational Research Centre, St. Patrick’s College, Dublin.
Eurostat (2002). European Social Statistics: Demography, Office for Official Publications of the European Union: Luxembourg.
Fahey, T., L. Delaney and B. Gannon (2005). School Children and Sport in Ireland, The Economic and Social Research Institute: Dublin.
Goodman, E., Slap, G. and G. Huang (2003). ‘The public health impact of socioeconomic status on adolescent depression and obesity’, American Journal of Public Health 93(11): 1844-1850.
Hanafin, S. and A.-M. Brooks (2005). Report on the Development of a National Set of Child Well-Being Indicators in Ireland, National Children’s Office: Dublin.
Maitre, B., B. Nolan and C.T. Whelan (2005). Reconfiguring the Measurement of Deprivation and Consistent Poverty in Ireland, Policy Research Series Paper No. 58, The Economic and Social Research Institute: Dublin.
A S
OC
IAL P
OR
TRA
IT OF C
HILD
RE
N IN
IRE
LAN
D
THE
OF
FIC
E F
OR
SO
CIA
L INC
LUS
ION
59
A S
OC
IAL P
OR
TRA
IT OF C
HILD
RE
N IN
IRE
LAN
D
THE
OF
FIC
E F
OR
SO
CIA
L INC
LUS
ION
National Taskforce on Obesity (2005). Obesity. The Policy Challenges. The Report of the National Taskforce on Obesity, (Dublin), Department of Health and Children: Dublin.
National Women’s Council (2005). An Accessible Childcare Model. National Women’s Council: Dublin.
OECD (2003). Education at a Glance, OECD: Paris.
OECD (2003b). Babies and Bosses. Reconciling work and family life. Volume 2: Austria, Ireland and Japan. OECD: Paris.
OECD (2006). Education at a Glance, OECD: Paris.
Whelan, C.T. and B. Maitre (2006). Levels and Patterns of Material Deprivation in Ireland: after the “Celtic Tiger”, Working Paper, The Economic and Social Research Institute: Dublin.
BiB
lioG
rA
Ph
Y A
nd
fu
rth
er
re
Ad
inG
A S
OC
IAL P
OR
TRA
IT OF C
HILD
RE
N IN
IRE
LAN
D
THE
OF
FIC
E F
OR
SO
CIA
L INC
LUS
ION
�0

Printed on recycled papers with the following accreditations:

Building an Inclusive Society
Building an Inclusive Society
A SOCIAL PORTRAIT OF CHILDREN IN IRELAND
A S
OC
IAL P
OR
TRA
IT OF
CH
ILDR
EN
IN IR
ELA
ND
Department of Social and Family Affairs, Áras Mhic Dhiarmada, Store Street, Dublin 1.Tel: + 353 1 7043 851 Fax: + 353 1 7043 032 e-mail: [email protected] www.socialinclusion.ie
Building an Inclusive Society
Building an Inclusive Society