Social Supports for Individuals with Disabilities Impacted by Disaster


A Social Portrait of
People with Disabilities in Ireland
Dorothy Watson Brian Nolan
Published by
Department of Social Protection Gandon House, Amiens Street
Dublin 1, Ireland
and
The Economic and Social Research Institute Whitaker Square, Sir John Rogerson’s Quay
Dublin 2, Ireland
ISBN: 978-1-908109-07-1 Department of Social Protection 2011
(PRN: A11/0887)
Dublin, Ireland 2011

Authors: Dorothy Watson Dorothy Watson is Associate Research Professor at the Economic and Social Research Institute and the Department of Sociology, Trinity College Dublin. More information on the author is available online at: http://www.esri.ie/staff/view_staff_by_alphabetica/view/index.xml?id=71 Brian Nolan Brian Nolan is Professor of Public Policy in the School of Applied Social Science, University College Dublin (UCD), and was previously Head of the Social Policy Research Division in the Economic and Social Research Institute (ESRI). More information on the author is available online at: http://www.ucd.ie/geary/aboutus/people/briannolan/ This report is available online at: http://www.socialinclusion.ie/publications.html & http://www.esri.ie The Foreword and the Executive Summary are available online in English and Irish at: http://www.welfare.ie/EN/socialinclusion/ & http://www.welfare.ie/ga/socialinclusion/ This report was commissioned from the Economic & Social Research Institute by the Social Inclusion Division in the Department of Social Protection, as part of the National Action Plan for Social Inclusion 2007–2016. It is jointly published by the Department and the ESRI as part of the Social Inclusion Research Report series. The authors are solely responsible for the views expressed, which are not attributable to the ESRI which does not itself take institutional policy positions, nor are the views attributable to the Department. The researchers are responsible for the accuracy of the research and all reports are peer reviewed.
i
Authors’ Acknowledgements The authors are grateful to Joanne Mulholland, Jim Walsh and Deirdre Bodkin of the Social Inclusion Division of the Department of Social Protection for comments on an earlier draft of this paper. Christine Linehan and Anne Goode of the National Disability Authority (NDA) and our colleague, Helen Russell of the Economic and Social Research Institute (ESRI), also provided very helpful comments. We would like to thank the participants in a workshop, organised by the Social Inclusion Division, in July 2010 for many useful suggestions. Finally, we owe a debt of gratitude to the Central Statistics Office (CSO) interviewers and staff for their professionalism and to the respondents to the National Disability Survey (NDS) for giving so generously of their time to make this research possible. Any remaining errors and omissions are the sole responsibility of the authors.


iii
Table of Contents
Authors’ Acknowledgements ........................................................................ i Table of Figures .............................................................................................v Foreword from the Minister ......................................................................... vii Réamhrá ón Aire ...........................................................................................ix Executive Summary ......................................................................................xi
Prevalence and Type of Disability................................................................................... xi Children with Disability ................................................................................................... xii Education, Work and Living Standards .......................................................................... xii The Social Environment ................................................................................................. xiii Physical Environment and Transport ............................................................................. xiii Policy Implications ........................................................................................................ xiv
Introduction ....................................................................................................1 Chapter 1.........................................................................................................3 What Do We Mean By Disability? .................................................................3
How Many People can be Classified as Having a Disability? .......................................... 3 Measures of Population with Disability ............................................................................ 4 Prevalence by Age Group and Gender ............................................................................ 5 Detailed Age Patterns from Census Data ........................................................................ 5 Prevalence of Disability by Type of Disability .................................................................. 7 Disability Rates by Region ............................................................................................... 9 Onset and Cause of Disability ........................................................................................ 10 Summary ........................................................................................................................ 12
Chapter 2....................................................................................................... 13 Impact of Disability ...................................................................................... 13
Level of Difficulty by Age and Gender – Mobility & Dexterity ........................................ 14 Self-Care Activities ......................................................................................................... 15 Health and Stamina ....................................................................................................... 15 Children with Disability ................................................................................................... 16 Summary ........................................................................................................................ 17
Chapter 3....................................................................................................... 19 Education, Work and Living Standards ..................................................... 19
Education ....................................................................................................................... 19 Highest Level of Education Completed (Census figures) .............................................. 20 Economic status ............................................................................................................. 21 People with a Disability at Work or Interested in Work .................................................. 24 People with a Disability Not at Work and Not Interested in Work .................................. 25 Disability and Living Standards ...................................................................................... 26 Cost of Disability ............................................................................................................ 28 Summary ........................................................................................................................ 29

iv
Chapter 4....................................................................................................... 31 The Social Environment .............................................................................. 31
Marital Status and Living Arrangements ........................................................................ 31 Access to Other Care Services...................................................................................... 34 Attitudes of Other People ............................................................................................... 36 Experience of Discrimination ......................................................................................... 38 Participation in Social Activities ..................................................................................... 39 Summary ........................................................................................................................ 41
Chapter 5....................................................................................................... 43 The Physical Environment and Transport ................................................. 43
Routine Tasks in the Home ........................................................................................... 43 Access outside the Home .............................................................................................. 44 Transport ........................................................................................................................ 45 Summary ........................................................................................................................ 47
Chapter 6....................................................................................................... 49 Conclusion and Policy Implications ........................................................... 49
Disability and Ageing ..................................................................................................... 49 Children with Disability ................................................................................................... 49 Education and Work ...................................................................................................... 50 The Social Environment ................................................................................................. 51 The Physical Environment and Transport ..................................................................... 52 Future Prospects and Data Needs ................................................................................ 53
Appendix 1 .................................................................................................... 55 Technical Note on Measurement of Disability ........................................... 55
Differences between the Census/NDS Disability and Total Disability Samples ............ 58 Bibliography and Further Reading ............................................................. 59 Glossary ........................................................................................................ 61

v
Table of Figures Figure 1.1: Prevalence of Disability by Gender and Age (percentages) ..................................................... 5 Figure 1.2: Census Prevalence of Disability by Type and Age Group (percentages) ................................ 6 Figure 1.3: NDS Measures of the Different Types of Disability .................................................................. 7 Figure 1.4: Prevalence of Different Types of Disability (number in ‘000) ................................................... 8 Table 1.1: Percentage of those with each Main Disability Type who also have each Other Disability
Type .......................................................................................................................................... 9 Figure 1.5: Disability Rate and Age-Standardised Disability Rate by Region .......................................... 10 Figure 1.6: Age of Onset of Disability by Type of Disability ...................................................................... 11 Table 1.2: Cause of Disability .................................................................................................................. 12 Figure 2.1: Level of Difficulty by Type of Disability (percentages) ............................................................ 13 Figure 2.2: Level of Difficulty associated with Mobility & Dexterity Disability by Gender and Age Group
(percentages) .......................................................................................................................... 14 Figure 2.3: Level of Difficulty with Self-care Activities by Type of Activity (percentages) ......................... 15 Figure 2.4: Health and Stamina of the General Population and of People with a Disability, by Living
Arrangements ......................................................................................................................... 16 Figure 2.5: Type of Disability and Level of Difficulty among Children with Disability ................................... (number in ‘000) ...................................................................................................................... 17 Figure 3.1: Limited by Disability before Completion of Full-Time Education, by Age Group and Gender
(percentage) ........................................................................................................................... 19 Figure 3.2: Highest level of Education Completed by Type of Disability (percentages) ........................... 20 Figure 3.3: Level of Education by Age Group for Adults Aged 25 to 64 (percentages) ............................ 21 Figure 3.4: Principal Economic Status for All Adults and for Adults with a Disability by Type of Disability
(adults aged 25 to 64, percentages) ....................................................................................... 22 Figure 3.5: Main Activity of Adults with a Disability which affected them before Age 65 by Sex and age
Group (percentages) ............................................................................................................... 23 Figure 3.6: Main Activity by Main Disability Type (percentages) .............................................................. 24 Figure 3.7: Features or Aids Required for Work (percentages) ................................................................ 25 Figure 3.8: Reasons for not being Interested in Work by Gender and Age Group (percentages) ........... 26 Table 3.1: At-risk-of-poverty Rate and Consistent Poverty Rate for Adults Aged 16 and Over in 2007,
2008 and 2009 by Disability Status (percentages) ................................................................. 27 Table 3.2: Income, Deprivation and Consistent Poverty by Principal Economic Status in 2009............. 28 Figure 4.1: Marital Status by Age for All Adults and People with a Disability (percentages) .................... 32 Figure 4.2: Marital Status by Type of Disability for Adults Aged 25 to 44 (percentages) ......................... 32 Figure 4.3: Living Arrangements of Adults with a Disability, by Gender (percentages) ........................... 33 Figure 4.4: People with a Disability who Receive Help with Everyday Activities by Gender and Age Group
(percentages) .......................................................................................................................... 34 Figure 4.5: Source and Frequency of Help with Everyday Activities given to People with a Disability
(percentages) .......................................................................................................................... 34 Figure 4.6: Services Required by People with a Disability (percentages) ................................................ 35 Figure 4.7: People with a Disability Unable to Access Help needed with Everyday Activities by Gender
and Age Group (percentages) ................................................................................................ 35 Figure 4.8: Percentage who Avoid Doing things because of Attitudes of Other People by Gender and
Age group ............................................................................................................................... 36

vi
Figure 4.9: Percentage with Main Disability Type who Avoid Doing Things because of the Attitudes of Other People (percentages) ................................................................................................... 36
Figure 4.10: Whether Attitudes of Certain People Generally Support or Hinder (percentages) ............... 37 Figure 4.11: Percentage of Males and Females by Age Group Hindered by the Attitudes of Others ........ 37 Figure 4.12: Odds of People with a Disability having experienced Discrimination relative to People Without
a Disability .............................................................................................................................. 38 Figure 4.13: Percentage of People with a Disability who do NOT Participate in Social Activities by Gender
and Age Group ....................................................................................................................... 40 Figure 4.14: Percentage of People with a Disability who do NOT Participate in Social Activities by Type of
Disability ................................................................................................................................. 40 Figure 5.1: Difficulty Performing Routine Tasks in the Home by Gender and Age Group (percentage with
difficulty) ................................................................................................................................. 43 Figure 5.2: Access Difficulties Experienced by Adults with a Disability by Gender and Age Group
(percentages) ......................................................................................................................... 44 Figure 5.3: Use and Level of Difficulty of different Modes of Transport for People with a Disability aged 5
and over (percentages) .......................................................................................................... 45 Figure 5.4: Percentage of People with a Disability aged 5 and over who Have Difficulty Using Public
Transport by Region ............................................................................................................... 46 Figure A1: Questions on Disability in the 2006 Census of Population ..................................................... 55 Table A1: Comparative Population Estimates for numbers of People with Disabilities in Census 2006
and NDS ................................................................................................................................. 56 Figure A2: Prevalence of Disability from Census 2006 and National Disability Survey .......................... 57 Table A2: Profile of People with Disability from the Total Sample and the Census/NDS Disability
Sample (percentage of people with a disability) ..................................................................... 58

Foreword from the Minister
This research report details the social and living conditions of people with disabilities. The report was commissioned by my Department and is one of a series of five ‘social portraits’ of the lifecycle groups identified in the National Action Plan for Social Inclusion (NAPinclusion), the others being children, people of working age, older people and communities. The reports provide key facts and figures about vulnerable groups across the lifecycle in an accessible manner. The information is intended to assist policy makers and service deliverers to meet the national poverty target and the high level social inclusion goals set out in the national action plan. It also can inform the implementation of the National Disability Strategy. This report is based on a model of disability which understands disability in terms of how the individual interacts with their physical and social environment. The impact of a disability is, therefore, mediated by the resources people have, the services they can access, the environment in which they live and the attitudes they encounter. In this context, the report finds that people with disabilities have a higher poverty risk, are more likely to be unemployed and are excluded from a range of everyday activities. One of the main problems in addressing the situation of people with disabilities is having the necessary information about the extent and types of disability and the social profile of those affected. Drawing on different data sources, the report estimates that up to 800,000 people have a disability, almost one in five of the population. The report focuses its analysis on a sub-set of this group, the 325,000 people (8 per cent of the population) identified as having a disability by both the 2006 Census of Population and the follow-up National Disability Survey. Using either measure, it is evident that disability is very prevalent in society and affects all age groups. Furthermore, the study shows that most disability is acquired through the life course, rather than being present from birth or childhood. The focus of the study is on the links between disability and poverty and social exclusion. Poverty and social exclusion can in certain circumstances cause disability, for example, by leading to depression or by impairing health due to living in bad housing conditions. However, the main relationship is where having a disability leads to a greater risk of poverty and social exclusion. This can occur through unemployment, higher living costs or difficulties in accessing services. On the basis of this report, it is clear that disability issues must be mainstreamed into social inclusion policy. The national poverty target and high level goals pertaining to income support, employment and access to services in the national action plan are relevant to people with disabilities, be they children, people of working age or older people. In addition, the national action plan has a specific goal in relation to addressing the specific barriers to employment for people with disabilities. Of particular concern to my Department is how the social welfare system can support and assist people in receipt of disability payments to access the labour market.
vii

A thorough reading of this report can guide policy to take account of the diverse needs of people with disabilities across a range of domains including education, work, living standards, social participation, public attitudes, the physical environment and transport. For each topic, the report identifies policy implications for addressing the disadvantages experienced by people with disabilities. While as a society we face strong economic and financial challenges, it is important that we continue to address the barriers to the social and economic participation of people with disabilities. In turn, this will enable people with disabilities to make their contribution to national recovery and to underpin future progress. Finally, I wish to thank the authors of the report, Dorothy Watson of the ESRI and Brian Nolan from UCD. They were diligent and persistent in seeking to unearth the important new information provided in this report about the lives of people with disabilities. I wish to acknowledge the work of my Department’s Social Inclusion Division in guiding this report and overseeing its publication in conjunction with the ESRI. Joan Burton TD Minister for Social Protection
viii

Réamhrá ón Aire
Sonraítear sa tuarascáil taighde seo dálaí sóisialta agus maireachtála daoine faoi mhíchumas. Ba í mo Roinn féin a choimisiúnaigh an tuarascáil agus ‘portráid shóisialta' atá inti, portráid amháin i sraith chúig phortráid de na grúpaí saolré a sainaithníodh sa Phlean Náisiúnta Gníomhaíochta um Chuimsiú Sóisialta (NAPinclusion). Is iad na grúpaí eile leanaí, daoine in aois oibre, seanóirí agus pobail. Gheofar sa tuarascáil fíricí agus figiúirí tábhachtacha so-aimsithe mar gheall ar ghrúpaí leochaileacha i ngach cuid den tsaolré. Tá súil go gcabhróidh an fhaisnéis le lucht déanta beartas agus le soláthraithe seirbhísí chun comhlíonadh a dhéanamh ar an sprioc náisiúnta maidir le bochtaineacht agus ar na spriocanna ardleibhéil um chuimsiú sóisialta atá leagtha amach sa phlean náisiúnta gníomhaíochta. D’fhéadfadh sé bheith mar bhonn eolais, leis, chun an Straitéis Náisiúnta Míchumais a chur i ngníomh. Bunaíodh an tuarascáil ar choincheap an mhíchumais inarb é an chiall a bhaintear as míchumas an tslí a idirghníomhaíonn an duine leis an timpeallacht fhisiceach agus shóisialta. Mar sin braitheann déine an mhíchumais ar na hacmhainní atá ag daoine, ar na seirbhísí atá ar fáil dóibh, ar an timpeallacht ina maireann siad agus ar na dearcthaí atá ag daoine ina leith. Ina fhianaise sin, ba é a fuair lucht na tuarascála ná gur airde an dóchúlacht go mbeidh daoine faoi mhíchumas bocht, dífhostaithe agus eisiata ó raon gníomhaíochtaí laethúla, i gcomparáid le daoine nach bhfuil faoi mhíchumas. Ceann de na fadhbanna is mó ó thaobh díriú ar staid daoine faoi mhíchumas ná a dheacra atá sé an fhaisnéis chuí a fháil mar gheall ar fhairsinge míchumais agus ar chineálacha míchumais agus ar phróifíl sóisialta iad siúd atá faoi mhíchumas. Bhain an tuarascáil leas as foinsí éagsúla sonraí agus ba é an tátal a baineadh astu ná go bhfuil suas le 800,000 duine faoi mhíchumas sa tír, sin duine nach mór as gach cúigear den daonra. Díríodh an anailís sa tuarascáil seo ar fhothacar den ghrúpa sin, an 325,000 duine (8 faoin gcéad den daonra) a sainaithníodh mar dhaoine faoi mhíchumas i nDaonáireamh na bliana 2006 agus sa Suirbhé Náisiúnta Míchumais dá éis. Chuirfeadh ceachtar beart díobh sin i bhfios go bhfuil líon mór daoine faoi mhíchumas sa tsochaí agus i ngach aoisghrúpa. Thairis sin, taispeánann an staidéar gur i gcúrsa a saoil a fhaigheann formhór na ndaoine a míchumas, seachas é a bheith ann ó bhreith nó ó óige an duine. Díríonn an staidéar ar na naisc idir míchumas, bochtaineacht agus eisiamh sóisialta. Féadfaidh bochtaineacht agus eisiamh sóisialta bheith ina gcúiseanna le míchumas, i gcásanna áirithe, toisc gur minic a bhuailtear daoine le dúlagar nó le drochshláinte toisc iad a bheith ina gcónaí i gcóiríocht neamhoiriúnach. Ach an príomhghaol a scrúdaítear ná cibé an dóchúla ná a mhalairt go leanfaidh bochtaineacht agus eisiamh sóisialta an míchumas. Féadfaidh an bhochtaineacht agus an t-eisiamh sin a bheith ina thoradh ar dhífhostaíocht, ar chostais mhaireachtála atá níos airde ná mar is gnách agus ar a dheacra atá sé teacht a fháil ar sheirbhísí. Ar bhonn na tuarascála seo, is léir go gcaithfear gnáthchuid den bheartas um chuimsiú sóisialta a dhéanamh de cheisteanna míchumais. An sprioc náisiúnta bochtaineachta agus na spriocanna ardleibhéil maidir le tacaíocht ioncaim, fostaíocht agus teacht ar sheirbhísí atá sa phlean náisiúnta gníomhaíochta, baineann siad le daoine faoi mhíchumas, cibé acu leanaí, daoine in aois oibre nó seanóirí iad. Lena chois sin, tá sprioc ar leith sa phlean náisiúnta gníomhaíochta maidir le díriú ar na bacainní ar leith a bhíonn le sárú ag daoine faoi mhíchúmas nuair a lorgaíonn siad post. Ábhar ar leith is cúram do mo Roinn ná slite a fháil inar féidir leis an gcóras leasa shóisialaigh tacú le daoine atá ag fáil íocaíocht mhíchumais chun gur féidir leo dul isteach sa mhargadh saothair.
ix

x
D’fhéadfadh grinnstaidéar ar an tuarascáil seo a bheith ina threoir bheartais chun riachtanais éagsúla daoine faoi mhíchumas i réimsí éagsúla a chur san áireamh, réimsí ar a n-áirítear an t-oideachas, saol na hoibre, caighdeáin mhaireachtála, rannpháirtíocht shóisialta, dearcthaí an phobail, an timpeallacht fhisiceach agus cúrsaí iompair. I gcás gach topaice, sainaithnítear sa tuarascáil na himpleachtaí beartais a thiocfadh de dhíriú ar na míbhuntáistí a bhíonn le sárú ag daoine faoi mhíchumas. Cé go bhfuil dúshláin mhóra eacnamaíocha agus airgeadais fúinn mar phobal, tá sé tábhachtach go leanfaí de bheith ag díriú ar na bacainní ar rannpháirtíocht shóisialta agus eacnamaíoch atá le sárú ag daoine faoi mhíchumas. Má dhéantar amhlaidh, beidh sé ar chumas daoine faoi mhíchumas rannchuidiú leis an téarnamh náisiúnta agus cuidiú le dul chun cinn sna blianta atá romhainn. Mar fhocal scoir, is mian liom mo bhuíochas a ghabháil le húdair na tuarascála, Dorothy Watson ón ESRI agus Brian Nolan ó UCD. Léirigh siad dúthracht agus dianseasmhacht sa tslí a lorg siad faisnéis nua, fáisnéis a thugann chun solais nithe tábhachtacha faoin gcineál saoil atá ag daoine faoi mhíchumas. Is mian liom a admháil, leis, go ndearna foireann Rannóg um Chuimsiú Sóisialta mo Roinne féin a gcion leis an tuarascáil seo a threorú agus le foilsiú na tuarascála a mhaoirsiú in éineacht leis an ESRI. Joan Burton TD An tAire Coimirce Sóisialaí

Executive Summary
xi
Executive Summary This report – A Social Portrait of People with Disabilities in Ireland – examines the circumstances of people with disabilities in Ireland. It is one of a series of Social Portraits on vulnerable groups in Ireland commissioned by the Social Inclusion Division of the Department of Social Protection, from the ESRI. The report draws on a number of sources, primarily the first and second reports from the National Disability Survey (Central Statistics Office, 2008 and 2010). For the first time in Ireland, the National Disability Survey facilitates estimation of the prevalence of disability in the population and also provides the basis for a detailed analysis of the living circumstances and needs of people with disabilities. The concept of disability that underlies this social profile is the ‘biopsychosocial model’ of disability advocated by the World Health Organisation. In this model, disability is understood in terms of how the individual interacts with the physical and social environment. In other words, in order to understand what people are able to do, we need to take account of the resources available to them and the barriers placed before them in their environment as well as their own physical, mental and emotional resources. Therefore, in this report – as well as examining the number of people with disability and the impact their disability has on them – we consider their experiences in the educational system and labour market, their social participation and social support and the physical environment and transport. Prevalence and Type of Disability
The best estimate of the number of people with a disability in Ireland comes from combining information from the 2006 Census of Population and the National Disability Survey (NDS). This indicates that between one in five and one in six of the population has a long-term disability. The NDS provides detailed and reliable information on the subset of this group (about 8.1 per cent of the population) who declared a disability in both the Census and the NDS and it includes the majority of those with severe disabilities.
The overall prevalence of disability as measured by the NDS is similar for males and females. However, the male prevalence rate is slightly higher among children and adults aged 55 to 64. The female prevalence rate is higher among those aged 75 and over.
Most disability is acquired through the life course rather than being present from birth or childhood. An intellectual & learning disability is the exception in that it peaks in the early teens. This form of disability is more likely to be noted during the school years and is more frequently diagnosed now than in the past.
The NDS distinguishes nine different types of disability. The average person with a disability has 2.6 of these different types. The most common disability type is a mobility & dexterity disability which includes difficulties in walking, lifting and carrying things and in picking up small objects (about 184,000 people). The second most common form is pain (about 153,000 people). Other types include remembering & concentrating disability (113,000 people), emotional, psychological & mental health disabilities (111,000), intellectual & learning disability (72,000), breathing disability (71,000), sensory impairments of hearing (58,000) and vision (51,000) and speech disabilities (35,000).

A Social Portrait of People with Disabilities in Ireland
xii
Impact of Disability
About two thirds of those with a disability either have a lot of difficulty performing everyday activities or cannot perform them at all. People with a mobility & dexterity disability are most likely to experience a great deal of difficulty with everyday activities.
Most people with a disability have no difficulty with basic self-care activities such as feeding or dressing themselves, taking a bath or shower, staying alone and getting in and out of bed without help. The self-care activities most likely to cause difficulty for people with a disability are staying by themselves (33 per cent) or taking a bath or shower (36 per cent).
The health status and the stamina of people with a disability have an important bearing on their quality of life and on their capacity to participate in work and social activities. Disease or illness is the most frequently cited cause of disability among people with disabilities (41 per cent overall). Health problems are more common among people with a disability than among the general population. Only about one half of people with a disability consider their health to be good, compared to nearly nine out of ten in the general population. Only 43 per cent of people with a disability in private households considered their stamina to be very good, or good, and 20 per cent considered their stamina to be very bad or bad.
People with a disability living in communal establishments such as nursing homes or hospitals tend to be older: nearly three quarters are over the age of 65. Sixteen per cent of this group experience bad or very bad health and 40 per cent experience fair health. Just under one third of this group have good stamina levels and over one quarter have bad or very bad stamina levels.
Children with Disability
As most disability is acquired throughout the life course, the prevalence of disability among children is lower than among adults. The NDS indicates that 3.5 per cent of children have a disability and that disability is more common among boys (4.4 per cent) than among girls (2.6 per cent). The two most common forms of disability among children are an intellectual & learning disability and a remembering & concentrating disability. These types of disability are most likely to be noted during the school years as they create a particular challenge in terms of education.
Education, Work and Living Standards
Educational disadvantage and disability bear a reciprocal relationship. The relationship between disability and education in the youngest cohort of adults is likely to be mainly driven by the barriers to completing education associated with a disability. The pattern in the older age group is likely to be mainly a result of the negative health impact of life circumstances ensuing from educational disadvantage. There is a strong association between disability and educational achievement for young adults. Among people with a disability aged 18 to 34, well over half were affected by their disability before finishing school or college. Over one third of young adults (aged 25 to 29) with a disability left school before completing second level compared to one in six of young adults with no disability. Among older adults with a disability, the disability was less likely to have affected them during their school years. Nevertheless over half of adults with a disability aged 60-64 have primary education or less, compared to 38 per cent of people without a disability.
Census figures indicate that people with a disability are only half as likely to be at work as the general population between the ages of 25 and 64. Among people with a disability, those with intellectual & learning disabilities are most likely to be at work and those with a pain disability are least likely to be at work. Over one third of people with a disability who are not at work would be interested in a job if the circumstances were right. The figure is higher still (almost two thirds) for young adults with a disability. Those at work or interested in work most often identified aspects of the organisation of work, such as flexible working arrangements (45 per cent) or modified job tasks (29 per cent) as important in enabling them to work.
Data from the Survey of Income and Living Conditions (EU-SILC) shows that those who are limited in their daily activities and those experiencing chronic health problems are at a higher risk of income poverty and of being unable to afford basic goods and services.
Apart from reduced opportunities to earn income, the living standards of people with a disability are also affected by costs associated with the disability itself, such as health care, assistance, aids and devices. One study suggested that the estimated long-run cost of disability is about one third of an average weekly income.

Executive Summary
xiii
The Social Environment Under this heading, the living arrangements and marital status of people with a disability are considered. The report also looks at the levels of help received from other people, access to services and the attitudes of other people.
People with a disability are less likely to marry. According to the 2006 Census, about half of the general population aged 25 to 44 is married, compared to just over one third of people with a disability. The gap widens further for those in the 45 to 64 year age group (72 per cent of the general population and 57 per cent of people with a disability are married).
Women with a disability tend to be older, on average, than men with a disability, and older adults are more likely to live alone or in communal establishments. One in five women and about one in six men with a disability lives alone. Women with a disability are also more likely to live in communal establishments (12 per cent vs. 9 per cent).
Adult women with a disability are somewhat more likely than men to receive help with everyday activities. The proportion receiving help with everyday activities rises slowly with age, reaching over three quarters of women and two thirds of men aged 75 and over.
The study examines the use of specific services by people with a disability: day care, respite services, meal or drop-in services, supported housing and long-stay residential care. Overall, 13 per cent of people with a disability used one or more of these services. The care services with the greatest level of usage were day care on less than five days a week (5 per cent); respite services (4 per cent); or day care on five or more days a week (4 per cent). Eight per cent of people with a disability in private households needed, but did not use, some of these care services. The service which people needed most often was respite care (3.7 per cent).
In general, the attitudes of other people do not stop people with a disability from doing things they would otherwise do. Almost one in seven ‘frequently’ or ‘always’ avoids doing things because of the attitudes of other people. The proportion falls with age, however. These attitudes tend to be more of an issue for young adults, particularly for men with a disability in the 35 to 44 age group.
In general, the attitudes of all groups of other people are supportive rather than hindering. Family, health service and care providers and friends are most likely to be supportive (over eight in ten). More women than men are hindered by the attitudes of other people, but the gap narrows with age. Older adults are less likely than younger adults to report being hindered by the attitudes of other people.
People with a disability are more likely than non-disabled adults to report discrimination. An analysis of 2004 data found that nearly one in five people with a disability, compared to one in eight of the general population, reported discrimination (Russell et al., 2008). People with a disability were even more likely to report discrimination in relation to accessing health services or in using transport services.
Most people with a disability in all age groups participate in social activities. Participation is slightly higher among women (96 per cent) than among men (95 per cent) and is slightly higher for younger adults. Among younger adults, men are more likely than women not to participate in any social activities, particularly in the 35 to 54 age group (5 to 6 per cent). People with a disability are less likely than the general population to have participated in sports or physical exercise (38 per cent compared to 67 per cent of people without a disability). The NDS results also show that men and younger adults with a disability are more likely to participate in sports than are women and older adults with a disability.
Physical Environment and Transport Under this heading, the report looks at the barriers to carrying out routine tasks in the home, to participating in activities outside the home and to using different modes of transport.
Women are more likely than men to report difficulty in performing routine tasks in the home. The percentages increase with age for both women and men. About 39 per cent of women in the 18 to 34 age groups have at least some difficulty. This compares to 70 per cent of women aged 75 and over. The corresponding figures for men are 27 and 59 per cent, respectively. About one quarter of people with disabilities need and use specialised features around the home. Bathroom modifications are needed most frequently (one in five). However, over one in five people with a disability need modifications within the home but do not have them. The most common reason for this is that they do not have the money or are not eligible for a grant. Fewer than 10 per cent ever received a grant for house adaptations.
Most access problems outside the home arise in three areas: when socialising in public venues, availing of general services, or moving about in the local area (36 to 37 per cent). Women are more likely to have access difficulties than men and the gap widens with age.

A Social Portrait of People with Disabilities in Ireland
xiv
In terms of transport, what is striking is the level of non-use of the different modes by people with a disability, rather than the proportions who use each mode with difficulty. The mode of transport used most often by people with a disability is the car, as a passenger. About 8 out of 10 people with a disability use this mode regularly. Over 6 in 10 have no difficulty as a car passenger. Among adults with a disability, less than half regularly drive a car, about one third do so with no difficulty and 8 per cent do so with some difficulty. Almost one person in four with a disability either does not use or has a difficulty using public transport for accessibility reasons. These include getting on or off, transferring between services, getting to the stop or station, and the availability of public transport in the area. A similar proportion experience barriers due to service-related reasons. These include needing someone to accompany the person with a disability, overcrowding and cost. Just under one person in ten with a disability does not use or has difficulty using public transport for information-related reasons. These include difficulty in hearing announcements or seeing signs.
Policy Implications
As the population ages, there is likely to be an increase in the prevalence of disability. This will heighten the challenge of facilitating the full participation of people with disabilities in social life.
The challenge for society and the educational system is to adapt to the needs of children and young people with a disability and to accept their differences, while enabling them to maximise their achievements.
Job design – including flexible hours and modification of tasks – is very important to the participation of people with a disability in work.
Since many people with a disability do not marry or have lost a partner, their need for social involvement is likely to be greater. Meeting the needs of people with disabilities is not just about help with everyday activities. It is also about companionship and social contact.
In terms of the physical environment, the area where most people with a disability experience difficulty is in the home. There is scope for either additional help or physical modifications to improve access in the home.
Outside the home, access difficulties are most common in public venues, general services and moving about the local area. There is scope for improvements in access in these areas and also in access to medical services.
Improvements to the accessibility of public transport or services, more generally, could benefit up to one in four people with a disability. Accessibility issues include getting on or off; transferring between services; getting to the stop or station; and the availability of public transport in the area. Such improvements could also benefit general users of these services.
Further research using the NDS is possible in a number of areas, including the reciprocal relationship between disadvantage (educational and labour market) and disability and the link between living arrangements and care or assistance.

Introduction
1
Introduction This report examines the circumstances of people with disabilities in Ireland. Background information on the prevalence of disability for different social groups is provided but the main focus of the report is on the characteristics of people with disabilities. This includes the type of disability and level of difficulty in everyday activities; the social environment (attitudes of other people, social participation and support); education; work; living standards and the built environment. The goal is to provide a detailed social portrait of people with disabilities in order to inform social policy. The report is one of a series of Social Portraits on lifecycle groups, commissioned from the Economic and Social Research Institute (ESRI) by the Social Inclusion Division of the Department of Social Protection. The Social Portraits are based on the lifecycle approach which recognises the different challenges encountered at different life cycle stages and the resources needed to address these. It underpins the social partnership agreement, Towards 2016, and the National Action Plan for Social Inclusion 2007–2016 (NAPinclusion). The report draws on a number of sources, primarily the first and second reports from the National Disability Survey (CSO, 2008, 2010) and the 2006 Census of Population Sample of Anonymised Records (COPSAR). The 2006 National Disability Survey (NDS) was the first major survey of people with disabilities in Ireland. It provided a basis for the estimation of the prevalence of disability in the population and for the examination of the living circumstances and needs of people with disabilities. The first report from the NDS (CSO, 2008) produced tables showing the nature, severity and cause of the disability. It also showed the age of onset by gender, age group and region. The second report (CSO, 2010) focused on a broad range of characteristics of people with a disability, including education, work and important aspects of the social and physical environment. In Chapter 1 the report examines what is meant by disability and how it is measured in the National Disability Survey. The way disability is measured is a very important issue. It has implications both for how many people are defined as having a disability and for the characteristics of people with a disability. We also examine the prevalence of disability by age, gender and region and look at the main causes of disability. Chapter 2 looks the nature of disability: in what areas people are limited in their activities; the health status and stamina of people with a disability; and the level of difficulty experienced by them. For the first time the NDS provides us with important information on this issue. We are also able to examine the prevalence and impact of disability among children. In Chapter 3 the focus is on the education, work and living standards of people with a disability. Chapter 4 explores the social environment of disability. This includes marital status and living arrangements, help received from other people, use of care services, the attitudes of other people, the experience of discrimination and participation in social activities. In Chapter 5 the focus is on the physical environment. The report examines the level of difficulty people with disabilities have in carrying out routine daily activities in the home and in accessing a range of services and activities outside the home, including transport. Finally, in Chapter 6, conclusions are formed on all the information from previous chapters to highlight the main challenges for disability policy in Ireland.


What do we mean by Disability?
3
Chapter 1
What Do We Mean By Disability? The term disability can mean different things, depending on the context. In recent years there has been a major shift in the assumptions held about the nature of disability. There has been a move away from what has been termed a ‘medical model’ of disability towards what is termed a ‘biopsychosocial model’ (WHO, 2001). In a medical model of disability, the focus is on a person’s impairments and how these impairments affect functioning. Disability is seen primarily as a personal or medical issue. The medical model has been criticised by those proposing a social model of disability. The social model of disability shifts the focus from the individual’s impairments to the environment; the organisation of society; and the social, attitudinal and environmental barriers that restrict the full participation of people with a disability. The social model is underpinned by a human rights perspective and is concerned with equality of access to resources and opportunities. The social model of disability has been criticised for paying insufficient attention to the individual, to the diversity of impairments and how they are experienced, and to the benefits of treatment to the individual. The World Health Organisation (WHO) advocates a ‘biopsychosocial model’ of disability, which combines elements of both the medical and social models. This model underlies the International Classification of Functioning, Disability and Health (WHO, 2001). In this model, disability is understood in terms of how the individual interacts with the physical and social environment (NESC, 2009). In other words, in order to understand what people are able to do, we need to take account of the resources available to them and the barriers placed before them in their environment as well as their own physical, mental and emotional resources. These resources and barriers include:
Modes of transport and physical access The structure of the educational and labour market systems The format in which information is made available Access to health care; and Legislative provisions around equality of opportunity.
The International Classification of Functioning, Disability and Health is the concept of disability underlying the National Disability Survey. How Many People can be Classified as Having a Disability? Answering this question is not as straightforward as it might seem, for a number of reasons. First, there are conceptual and practical difficulties in defining the boundary between those ‘with a disability’ and others. This is because disability is a matter of degree, i.e. the number of people with a disability will depend on the threshold used to define disability. Second, a practical difficulty is the fact that estimates of the prevalence of disability are sensitive to how the question is asked. In particular, people may be reluctant to identify themselves as a ‘person with a disability’, particularly where they have concerns that this may result in stigma or unfair treatment.
A Social Portrait of People with Disabilities in Ireland
4
Until recently the information available at a national level also had serious limitations. The 2006 National Disability Survey, which builds on the information relating to disability obtained in the Census of Population of April 2006, is a landmark in terms of in-depth information about people with disabilities. The 2006 Census contained two questions on disability. Answers to these questions suggested that between 323,500 and 328,200 (or between 8.7 and 8.9 per cent of the population in Ireland) had a disability. The NDS was a follow-up survey which interviewed 14,518 people, who were classified in Census 2006 as having a disability.1 Of these, the majority (88 per cent) also met the (slightly different) criteria for having a disability used in the NDS. Many of those who did not record a disability in the NDS (but recorded a disability in the Census) had low levels of difficulty. For the NDS, people were regarded as ‘having a disability’ if they experienced a moderate or greater level of difficulty. However, in the case of an intellectual & learning disability or an emotional, psychological or mental health disability ‘just a little difficulty’ was adopted as the threshold.2 The NDS also had a time threshold. The respondent was asked to think about difficulties that have lasted, or are expected to last, six months or more, or difficulties that recur regularly. The CSO concluded that the differences between the Census and NDS disability estimates seem to occur mainly around the threshold of the definition of disability. The NDS also interviewed a smaller sub-sample (1,551) of people who had not recorded a disability in the 2006 Census. Of these, a small percentage (11.5 per cent, after weighting to population totals) recorded a disability in the NDS. This group were reporting disabilities which were generally not covered in the Census – pain, speech or breathing – or they were reporting lower levels of difficulty than those who had declared a disability. The result is that the Census and the NDS report somewhat different estimates of the prevalence of disability. We can derive an overall estimate by adding those who said ‘no’ in the Census and those who said ‘yes’ in the NDS (‘false negatives’), and by discarding those who said ‘yes’ in the Census and ‘no’ in the National Disability Survey (‘false positives’), (see Appendix 1, Table A1 and Figure A2). Given the difficulties outlined above in identifying one single measure of disability, the best estimate is that between 16.8 per cent and 20.4 per cent of the population has a long-term disability. In other words between one in five and one in six of the population has a disability.3 Measures of Population with Disability The detailed analysis in this report is based on the survey returns in respect of those who declared a disability in both the Census and the NDS. We will refer to this as the Census/NDS measure of disability. This group constitutes 8.1 per cent of the population. It includes the majority of those with the most severe disabilities. The scale of disability presented in this analysis can be regarded as a minimum baseline, with perhaps around twice as many affected, but to a lesser degree of disability. For some analyses, where detailed information has not yet been published from the NDS, we will use data from the 2006 Census. This group, whom we will refer to as the Census of Population Disability Sample, includes a certain proportion of ‘false positives’ since their disability would not have met the threshold used in the NDS. However, the very large number of cases and the fact that some information on people with a disability (including marital status and educational achievement) has not yet been published from the NDS makes this a very useful source for some analyses. For many of the analyses the focus on people with a disability living in private households.4 More detailed information is available in respect of this group. But we do include people living in communal establishments in the overall prevalence figures discussed in this chapter and in the figures which draw on the Census data.
1 In order to be as inclusive as possible, the NDS made use of facilitated and interpreted interviews where these were needed. In some cases where the person with a disability was unable to participate, the interview was conducted with a proxy respondent on their behalf. 2 The reasoning here was to be as inclusive as possible. The level of difficulty associated with these types of disability may vary depending on the context (such as learning disability being more salient during the school years) or may vary with the episodic nature of the condition (such as in the case of depressive illnesses). 3 For more detail on the prevalence estimates and the sub-samples involved, see Appendix 1. 4 Ninety-one per cent of men with a disability and 88 per cent of women with a disability live in private households, according to the Census/NDS definition.
What do we mean by Disability?
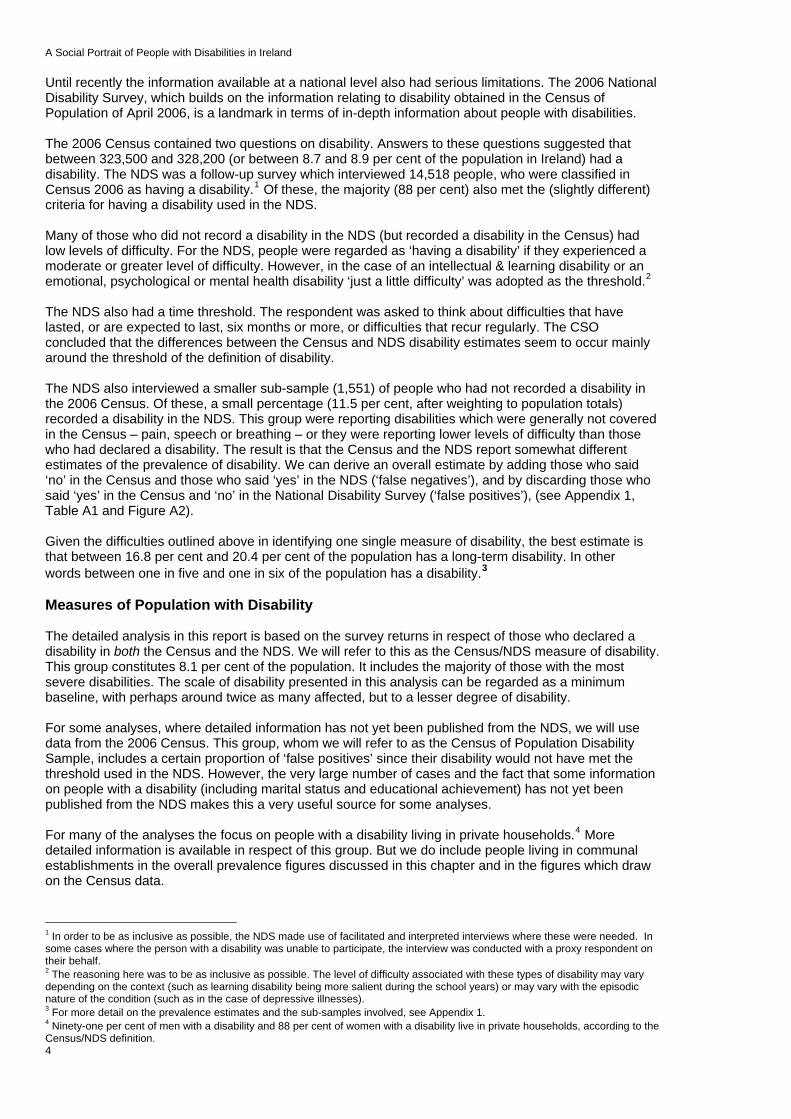
Other sources of information include the Survey of Income and Living Conditions (EU-SILC) (CSO, 2009) and the Quarterly National Household Survey (QNHS) (CSO, 2007; Russell et al., 2008). The definition of disability employed varies from one data source to another, and the precise way it was captured also differs from one dataset to another (see NDA, 2006). Throughout this Social Portrait, as the key features of people with disabilities and their socio-economic situation are presented, we will draw attention to the sources employed and the differences in the way they define and measure disability. Prevalence by Age Group and Gender Figure 1.1 shows the percentage of men and women in each age group who have a disability, based on the Census/NDS Sample. Disability is very clearly age-related. It rises steadily with age among adults and increases sharply in prevalence among adults aged 75 and older. Overall, the prevalence is very similar for men and women. Figure 1.1: Prevalence of Disability by Gender and Age (percentages)
5
Source: CSO, 2008, Table 1.10. Census/NDS definition
0.0
5.0
10.0
15.0
20.0
25.0
30.0
35.0
40.0
45.0
0-17 18-34 35-44 45-54 55-64 65-74 75 & over
Males Females
At the younger ages, however, men and boys are more likely than women and girls to experience disability: 4.4 per cent of boys under the age of 18 have a disability compared to 2.6 per cent of girls in this age group. Among those aged 75 and over, the prevalence is higher for women: 40.8 per cent of women 75 and over have a disability compared to 33.1 per cent of men. This is because women in this broad age group will, on average, be older than men, due to women’s longer life expectancy. Detailed Age Patterns from Census Data For a more detailed breakdown by age, we turn to the 2006 Census data and the definition of disability the Census adopted. It is important to note that this definition includes some ‘false positives’ – people who would not have met the threshold or criteria used in the NDS. Nevertheless, the large sample size, which allows a breakdown by single year of age, makes this a useful exercise. Figure 1.2 shows a detailed breakdown of disability type (as recorded at question 15 on the Census) by single year of age. The type categories here are different from those used in the NDS. There are less of them (5 vs. 9) and the categories are broader and less precisely defined than in the NDS questions. Nevertheless, the figure reveals some very interesting differences by type of disability.

A Social Portrait of People with Disabilities in Ireland
6
Figure 1.2: Census Prevalence of Disability by Type and Age Group (percentages)
Source: CSO, 2007b, Table 4. Census of Population definition of disability
Vision /hearing
Physical
Learning /intellectual
Psychological /emotional
Other - incl. Chronic illness
0%
5%
10%
15%
20%
<1 5 10 15 20 25 30 35 40 45 50 55 60 65 70 75 80+
First, intellectual & learning disabilities are distinctive in that the prevalence does not increase with age in the same way as with other types of disability. Intellectual & learning disability is a broad category, and combines two very different groups – those with an intellectual disability (usually diagnosed at birth or during early childhood) and those with learning difficulties such as dyslexia and Attention Deficit Hyperactivity Disorder (ADHD), which tend to be noted during the school years. Earlier generations would not have had conditions such as dyslexia and Attention Deficit Hyperactivity Disorder (ADHD) diagnosed. This would account for the peak for the combined category (intellectual & learning disability) at about age 12, where it affects about 4 per cent of children. Thereafter it declines until the age of 23. It remains at about 1 per cent of the population until the age of 70, when it begins to rise slightly. The decline in the prevalence of an intellectual & learning disability from the early twenties on may be due to the fact that this is more likely to be diagnosed now than in the past.5 Another feature of the pattern by age is that the rate of increase with age, and the age at which disability rates begin to accelerate, both differ by type of disability. Physical disability rises at an accelerating rate with age. It is usually 1 per cent or lower until the early thirties and then increases sharply between the ages of 65 to 80 years, to affect from 10 per cent to 20 per cent of the population, respectively.6 ’Other disability’ (the category that includes chronic illness) is similar to physical disability. It rises gradually until the age of 60, but at that stage the prevalence increases with age more slowly than physical disability. The prevalence figure is 16 per cent for those aged 80 and over. Sensory disabilities (seeing and hearing) increase yet more slowly with age. The prevalence remains below 2 per cent until the age of 50. It rises to almost 10 per cent by the age of 79 and rises steeply thereafter (18 per cent of those over the age of 80 are affected). The final category we can distinguish from the Census is psychological and emotional disability, which has a weaker relationship with age. The prevalence increases slowly, and somewhat unsteadily, to 1 per cent at the age of 23 and 2 per cent at the age of 40. It remains between 2 and 2.5 per cent until the age of 75, with no clear trend. Then it begins to rise more steeply so that 6 per cent of those aged 80 and over are affected. We noted earlier that, according to the biopsychosocial model of disability, disability depends not only on the physical and emotional conditions people may experience but also on the environment and on expectations as to the type of activities in which people engage. Figure 1.2 shows that intellectual & learning disabilities reach a peak at the point where young people are typically making the transition from primary to secondary education. This is a time when difficulties related to intellectual & learning disabilities will be very salient and are more likely to be noted.
5 Another consideration is that people with severe intellectual disability often have associated conditions which result in a reduced life expectancy, particularly in earlier generations when fewer treatment options were available (Patja et al., 2001). 6 In fact, for those over 80 the increase is even sharper, reaching 56 per cent of those aged 90 and over.

What do we mean by Disability?
7
Prevalence of Disability by Type of Disability At this point we move to the National Disability Survey (NDS). In the NDS, the disability had to be present (or to be expected to continue) for six months or longer. The types of disability identified in the NDS differ from those in the Census and are more precisely defined. The NDS broadly classified disabilities into nine categories, as shown in Figure 1.3. A person is considered to have a seeing or hearing disability if he/she experiences ‘a moderate or greater level of difficulty’ with these senses. A mobility & dexterity disability involves a moderate or greater level of difficulty in moving around inside the home; going outside; walking for about 15 minutes; or using the hands and fingers for activities such as picking up small objects or opening and closing containers. Someone is considered to have a remembering & concentrating disability if he/she has a moderate or greater level of difficulty in remembering to do important things, remembering where he/she has put things or concentrating on doing something for 10 minutes. Figure 1.3: NDS Measures of the Different Types of Disability Type Specific Measure
Seeing (‘Wearing your glasses/contact lenses’), ‘Do you have difficulty seeing?’
Hearing (‘Using your hearing aid’) ‘Do you have difficulty hearing?’
Speech ‘Do others generally have difficulty understanding you when you speak?’
Mobility & dexterity ‘Do you have difficulty … Moving around inside your home?’, ‘Going outside of your home?’, ‘Walking a longer distance, e.g. walking for about 15 minutes?’, or ‘Using your hands and fingers, e.g. picking up small objects or opening and closing containers?’
Remembering & concentrating
‘Do you have difficulty remembering to do important things?’, ‘Do you often forget where you have put things?’ or ‘Do you have difficulty concentrating on doing something for 10 minutes?’
Intellectual & learning ‘Do you have any difficulty with intellectual functions due to a condition such as acquired brain injury, Down Syndrome, brain damage at birth?’, ‘Do you have any difficulty with interpersonal skills due to any condition such as autistic spectrum disorders?’, ‘Do you have any difficulty in learning everyday skills such as reading, writing, using simple tools, learning the rules of a game due to a condition such as Attention Deficit Hyperactivity Disorder (ADHD) or dyslexia?’
Emotional, psychological & mental health
‘Because of any emotional, psychological or mental health difficulties, do you have difficulty in the amount or kind of everyday activities you can do? (Note: These conditions include depressive illnesses, anxiety or panic disorders, schizophrenia, alcohol or drug addictions, eating disorders such as anorexia, bulimia.)’
Pain ‘Because of constant or recurrent pain, do you have difficulty in the amount or the kind of everyday activities you can do?’
Breathing ‘Because of breathing difficulty, do you have difficulty in the amount or kind of everyday activities you can do’
Source: CSO, 2008, Appendix 1 The next two categories, intellectual & learning disability and emotional, psychological & mental health disability, are the only two types of disability where a lower threshold is used. Someone with ‘just a little’ difficulty with activities associated with either of these is considered to have a disability. Intellectual & learning disability includes a number of very different types of disability, such as: (1) any difficulty with intellectual functions due to brain injury, Down Syndrome, or brain damage at birth; (2) difficulty with interpersonal skills due to conditions such as autistic spectrum disorders; and (3) difficulty in learning everyday skills such as reading, writing, or using simple tools due to conditions such as Attention Deficit Hyperactivity Disorder (ADHD) or dyslexia. Emotional, psychological & mental health disability also covers a broad range of difficulties such as depressive illnesses, anxiety or panic disorders, schizophrenia, alcohol or drug addictions and eating disorders.
A Social Portrait of People with Disabilities in Ireland
8
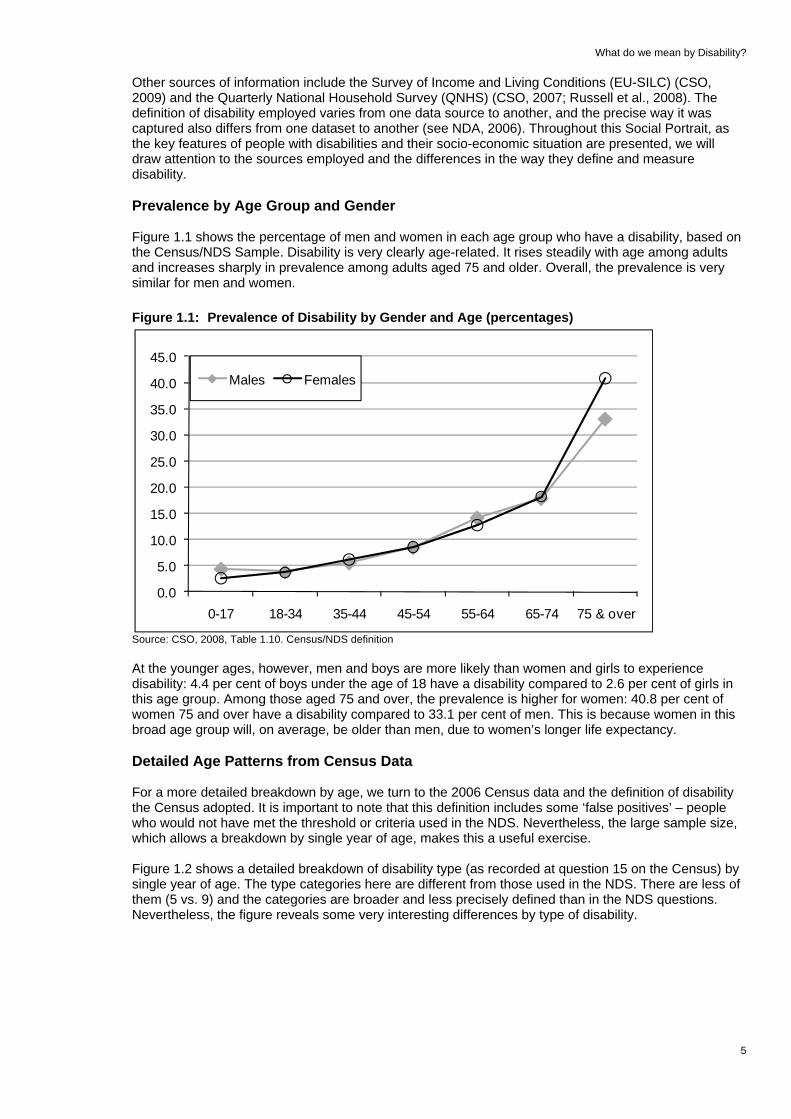
Disability associated with the final two categories – pain and breathing – is considered to be present if the person (as a result of these conditions) has a moderate or greater level of difficulty in the amount or kind of everyday activities he/she can do. Figure 1.4 shows the estimated total number of people (in thousands) with each type of disability. Mobility & dexterity disability is the most common form, affecting an estimated 184,000 people. The second most common form is pain, which limits the activities of 153,000 people. Pain was one of the categories not explicitly covered in the questions on the Census form. Figure 1.4: Prevalence of Different Types of Disability (number in ‘000)
Source: CSO, 2008, Table 13B (Census/NDS Disability Sample). Multiple types of disability are possible. ‘Single disability’ means that this is the only type of disability this person reports; ‘Multiple – main’ means the person reports more than one type but this type presented the greatest difficulty; ‘Multiple – other is main’ means the person reports more than one type and another type presents the greatest difficulty. Over 110,000 people are affected by remembering & concentrating and emotional, psychological & mental health disabilities. Just over 70,000 people experience an intellectual & learning disability. A similar number experience limitations arising from breathing. Sensory impairments of hearing and vision affect between 50,000 and 60,000 people. Finally, 35,000 people have a speech disability – the third type of disability not explicitly mentioned in the Census. An individual may have several different types of disability. Of the people interviewed in the NDS, 26 per cent reported a single disability only (CSO, 2008, Table 13B). The NDS found that the average person with a disability had 2.6 of the 9 types of disability covered. The average was higher for women than for men (2.7 compared to 2.5) and ranged from 2.3 for young adults to 2.8 for adults over the age of 75 (CSO, 2008, Table 1B). Figure 1.4 also shows the importance of multiple disabilities.7 For a very small percentage, there is only one disability present (‘single disability). Many people have to deal with two or more disabilities. Among those with speech or remembering & concentrating disabilities, virtually all (96 to 97 per cent) have at least one other type of disability and fewer than one in five consider these types to be their main disability (‘Multiple – main’ in the chart). Among those with mobility & dexterity or pain disabilities, over 90 per cent have more than one disability. For the remaining types of disability – seeing; hearing; intellectual & learning; emotional, psychological & mental health; or breathing – more than 80 per cent have at least one other type of disability as well.
7 People with multiple types of disability were asked which one presented the greatest difficulties for them.

What do we mean by Disability?
9
Some particular areas of overlap can be seen in Table 1.1. This table – which is read across the columns – shows the percentage of people with each main disability type who also have another type of disability. For instance, of those whose main disability is seeing, 19 per cent also have a hearing disability and 41 per cent also have a mobility & dexterity disability. Table 1.1: Percentage of those with each Main Disability Type who also have each Other
Disability Type Percentage of those whose main disability is:
…..who also have this disability type (percentage)
Seeing
Hearing
Speech
Mobility &
dexterity
Rem
embering &
concentrating
Intellectual &
learning
Emotional,
psychological &
mental health
Pain
Breathing
Seeing 100 19 3 41 21 7 15 22 11Hearing 10 100 11 23 20 6 12 19 8Speech 10 11 100 40 48 52 29 11 11Mobility & dexterity 15 14 8 100 26 8 22 58 19Remembering & concentrating 13 13 15 40 100 29 32 21 11Intellectual & learning 8 5 28 19 50 100 30 10 9Emotional, psychological & mental health 8 9 8 26 41 22 100 28 13Pain 12 13 2 65 26 5 27 100 19Breathing 11 13 2 49 21 5 17 37 100
Source: CSO, 2008, Table 13B (authors’ calculations), Census/NDS Disability Sample A mobility & dexterity disability is the most widespread for those whose main disability is one of the other categories. For instance, nearly two thirds of those whose main disability is pain also have a mobility & dexterity disability. Forty per cent or more of people whose main disability is seeing, speech, remembering & concentrating or breathing, also have a mobility and dexterity disability. A remembering & concentrating disability occurs for half of those whose main disability is intellectual & learning; for 48 per cent of those whose main disability is speech and for 41 per cent of those whose main disability is emotional, psychological & mental health. Just over half of those whose main disability is speech also have an intellectual & learning disability. Over half of those whose main disability is mobility & dexterity also have a pain disability. The extent to which the different types of disability overlap is important to keep in mind when interpreting results by main disability in later chapters. Disability Rates by Region Figure 1.5 shows how the Census/NDS disability rate differs by geographical region. The disability rate ranges from 6.6 per cent in the Mid-East to 8.7 per cent in the Mid-West. The differences across region are partly driven by differences in the age distribution of the population. To control for this, the CSO has calculated the age-standardised disability rates. This is the rate we would expect, based on the age profile of the population. By comparing the observed disability rate to the age standardised rate, we can get a sense of whether the disability rate in each region is higher, lower or about the same as we would expect from the age profile of the population. For example, the rate in the West is 8.2 per cent. Based on the age of the population in the West, we would expect a disability rate of 8.6 per cent. We can deduce from this that the disability rate is lower than we would expect in this region.

A Social Portrait of People with Disabilities in Ireland
10
Figure 1.5: Disability Rate and Age-Standardised Disability Rate by Region
8.4 8.1 8.2
6.6
8.4 8.1 8.18.2 8.7
(8.4) (8.1)(8.6)
(7.8)(7.3)
(8.3) (8.3) (8.3) (8.1)
0123456789
Border Midlands West Dublin Mid-East Mid-West
South-East
South-West
State
Rate (Age standardized (expected) rate)
Source: CSO, 2008, Tables 1.11 and 1.12, Census/NDS Disability Sample Comparing the regions, we see that the disability rate is lowest in the Mid-East (6.6 per cent) and highest in the Mid-West (8.7 per cent). The rate is also higher than the national figure in the South-East (8.4 per cent) and slightly higher in Dublin and the West (both 8.2 per cent). The age standardised percentages (shown by the diamond symbol in the chart and by the figures in parentheses) show the disability rates we would expect in each region, based on the age structure of the population. Comparing the actual rate to the age-standardised rates shows that the disability rate is higher than we would expect in Dublin and the Mid-West; lower than we would expect in the West and Mid-East; and slightly lower than expected in the South-West. We do not have enough detailed analysis of the NDS by region at this stage to be able to explain these differences in age standardised prevalence by region. Onset and Cause of Disability Given the pattern by age reported earlier, it should not be surprising that most disability is acquired throughout adulthood, rather than being present from childhood. About one in eight people with a disability has had the disability from birth. Approximately 1 in 10 with a disability acquired the disability in each successive age group – from birth to age 17; age 18 to 34; age 35 to 44; age 45 to 54; age 55 to 64; age 65 to 74 and 75 and over. The cumulative effect means that the proportion of people with a disability increases with age. The main exceptions to this steady rise in prevalence with age are an intellectual & learning disability8, and a speech disability, where about 40 per cent of people with these disabilities have had them since birth (Figure 1.6). Pain, on the other hand, is most likely to be acquired as life progresses, with only 3 per cent of those with this condition having had it from birth.
8 Strictly speaking, intellectual disabilities are generally defined (e.g. Schalock et al., 2010) as occurring before 18 years of age. The term ‘learning disability’ is broader, however, and includes conditions that can be acquired at any age.

What do we mean by Disability?
Figure 1.6: Age of Onset of Disability by Type of Disability
11
Source: CSO, 2008, Census/NDS Disability Sample
A
B C
D
E
0%
5%
10%
15%
20%
From birth 0-17 18-34 35-44 45-54 55-64 65-74 75 & over
A Seeing B Hearing C Mobility and Dexterity D Pain E Breathing
F
H
G
I
0%5%
10%15%20%25%30%35%40%45%50%
From birth 0-17 18-34 35-44 45-54 55-64 65-74 75 & over
F Speech H Remembering /concentrating
G Intellectual and Learning I Emot./psych./mental health
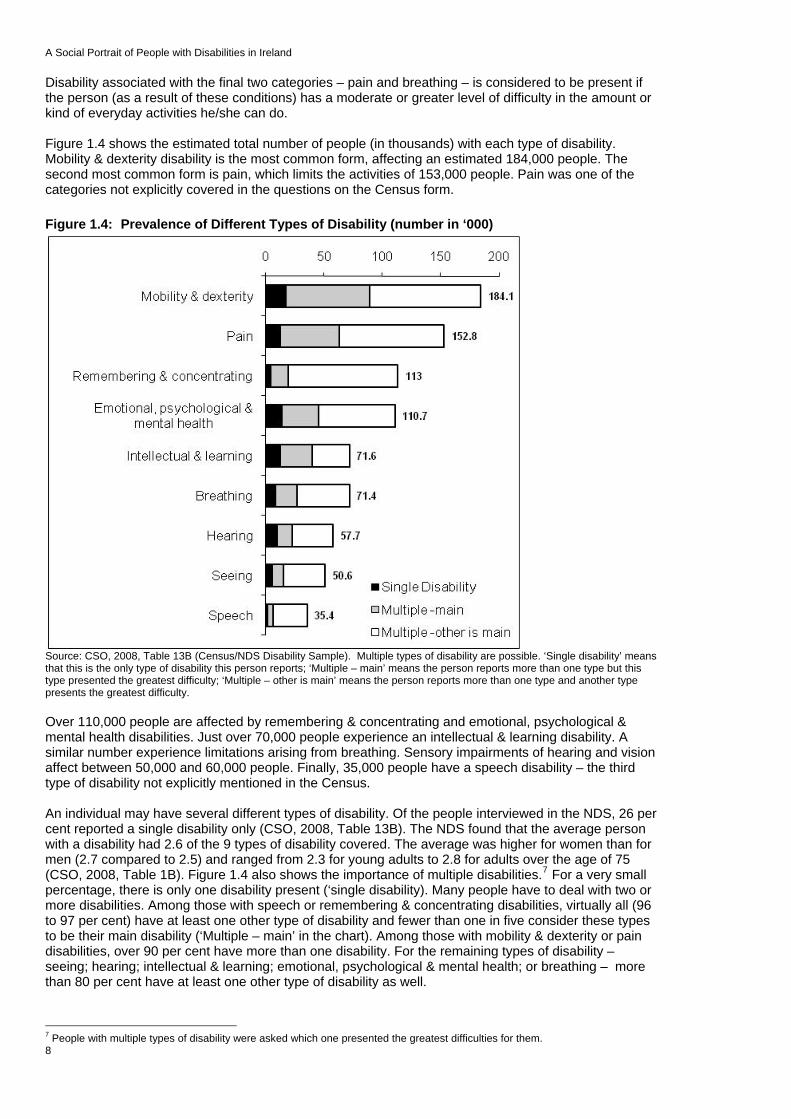
Table 1.2 illustrates the causes of disability, including the contribution of health-related issues.9 Disease or illness is the largest single cause of disability and accounts for 41 per cent of disability, overall. In the case of breathing disabilities, this rises to 59 per cent. Overall, one in eight cases of disability is caused by genetic or hereditary factors. For intellectual & learning disabilities, however, the figure is one in four. Accidents, injuries and falls figure most strongly in the case of pain (18 per cent) and mobility & dexterity disabilities (16 per cent). Stress is identified as a causal factor by 17 per cent of people with emotional, psychological & mental health disabilities and by 9 per cent of people with a remembering & concentrating disability. Twelve per cent of people with a hearing disability identified work conditions as a causal factor of their disability.
9 The main causes were presented to the respondent as a list of standard responses which included options for “Don’t know” and “No specific cause”.
A Social Portrait of People with Disabilities in Ireland
12
Table 1.2: Cause of Disability by Type of Disability (Row percentages)
Cause (% of causes)
Disease or illness
Hereditary / Genetic
An accident, injury or fall Stress
Work Condit-ions
Other cause
No specific cause/ unknown
Seeing 38.6 17.5 6.3 1.4 1.0 15.0 20.3Hearing 18.7 15.2 4.8 1.4 11.9 21.6 26.3Speech 35.5 19.4 4.2 1.4 0.6 18.0 20.8Mobility & Dexterity 45.2 10.0 16.0 1.8 3.2 13.3 10.5Remembering & concentrating 32.6 11.0 4.9 8.6 0.6 18.0 24.3Intellectual & Learning 33.0 24.6 3.3 1.3 0.0 11.8 26.0Emotional/ psychological/ mental health 39.2 10.3 6.5 17.3 1.8 12.3 12.7Pain 48.6 8.5 18.1 2.3 4.6 9.1 8.8Breathing 58.6 12.9 1.7 4.6 2.2 10.3 9.7
All 40.8 12.6 9.6 4.9 2.9 13.5 15.7Source: CSO, 2008, Census/NDS Disability Sample There are also a substantial number of cases (16 per cent overall) where the cause is unknown or there is no specific cause. The highest figures are 26 per cent in the case of a hearing disability and an intellectual & learning disability and 24 per cent in the case of remembering & concentrating. Summary In this chapter, we discussed the concept of disability and how it is measured in the National Disability Survey. We presented figures on the overall prevalence of disability. There are between one in five and one in six people living in Ireland with a disability. The overall prevalence is similar for men and women. The pattern of accumulation of disability by age was also very evident. Most disability is acquired through the life course, rather than being present from birth or childhood. This leads to much higher prevalence figures for most disability types for older age groups. An intellectual & learning disability, for which the prevalence peaks in the early teenage years, is an exception to this. This is probably because older adults were less likely to have conditions such as dyslexia and Attention Deficit Hyperactivity Disorder (ADHD) diagnosed and because learning disabilities are most salient during the school years. This chapter also demonstrated the strong link between health and disability. Disease or illness was identified as a cause of disability by 41 per cent of people with a disability. This rose to over half for those with a breathing disability. In the next chapter we look in more detail at the different types of disability and their impact on people’s everyday lives.

Impact of Disability
Chapter 2
Impact of Disability
In this chapter, the focus is on the Census/NDS Disability Sample, which defines people as having a disability if they experience a ‘moderate or greater level of difficulty’. The exceptions to this are the categories of intellectual & learning disability and emotional, psychological & mental health, where those reporting ‘just a little difficulty’ are included. In terms of the severity of disability then, the category ‘just a little’ refers to people with these kinds of disability only. The study draws on the NDS survey to gain an understanding of the level of difficulty associated with disability, its impact on basic self-care activities, the health and stamina of people with a disability and the level of difficulty experienced by children with a disability. Figure 2.1 shows the level of difficulty experienced by people with a disability. Where someone experiences more than one type of disability, these are classified according to the greatest level of difficulty reported. Figure 2.1: Level of Difficulty by Type of Disability (percentages)
Source: CSO, 2008, Table 1.8. Census/NDS Disability Sample
0 10 20 30 40 50 60 70 80 90 100
Seeing
Hearing
Speech
Mobility & dexterity
Remembering/concentrating
Intellectual & learning
Emot./psych./mental health
Pain
Breathing
All persons with a disability
Just a little A moderate level A lot of difficulty Cannot do at all
Overall, 2 per cent of those with a disability had ‘just a little’ difficulty, 31 per cent had a ‘moderate’ level of difficulty, 43 per cent had ‘a lot’ of difficulty and 24 per cent were completely unable to do certain things. In number terms, this would translate into about 7,200 people with a little difficulty; 101,300 with a moderate level of difficulty; 138,800 with a lot of difficulty and 78,800 who are completely unable to
13

A Social Portrait of People with Disabilities in Ireland
14
perform certain everyday activities.10 This means that about two thirds of those with a disability either have a lot of difficulty performing everyday activities or cannot perform them at all. Figure 2.1 also shows the level of difficulty by type of disability. For those with several types of disability, the level of difficulty is taken as the highest level reported. Since the average person with a disability has 2.6 different types of disability, the difficulties experienced may be associated with another disability type. Note, also, that the level of difficulty ‘just a little’ would have resulted in people being regarded as not having a disability for most types of disability. Someone with ‘just a little’ difficulty would only be included in the case of an intellectual & learning or an emotional, psychological & mental health disability. For all of the nine types of disability examined, except for mobility & dexterity, people were most likely to report a moderate level of difficulty (36 to 65 per cent). Over half of those with a disability in the area of seeing, hearing and breathing experience a ‘moderate’ level of difficulty. The proportion is just under half in the case of pain and remembering & concentrating. Among those with a disability related to mobility & dexterity, the biggest group (35 per cent) have at least one activity they cannot carry out at all and a further 34 per cent have ‘a lot’ of difficulty with everyday activities. Of those with an intellectual & learning disability, one in six has ‘just a little’ difficulty. The figure is just below one in four for those with a disability in the emotional, psychological & mental health area. Level of Difficulty by Age and Gender – Mobility & Dexterity We saw above that those with a mobility & dexterity disability were likely to experience the greatest levels of difficulty as a result. Figure 2.2 shows the percentage of men and women, within each age group, with a mobility & dexterity disability and the level of difficulty they experience with activities such as moving about in the home, walking for 15 minutes and picking up small objects or opening and closing cans. Figure 2.2: Level of Difficulty associated with Mobility & Dexterity Disability by Gender and Age
Group (percentages)
Source: CSO, 2008, Table D.4. Census/NDS Disability Sample – people with a mobility & dexterity disability The level of difficulty is greatest for older adults and is higher for older women than for older men. For instance, 38 per cent of men and 50 per cent of women aged 65 and older, with a mobility & dexterity disability, cannot do certain everyday activities at all. However, it should be noted that women in this age category will, on average, be older than men, reflecting the tendency of women to live longer. Men and women aged 18 to 64 with a mobility & dexterity disability have similar levels of difficulty in carrying out everyday activities.
10 In the case of hearing and seeing, ‘cannot do at all’ refers to people who cannot hear or see. In the case of a speech disability, this refers to people who cannot be understood by others when they speak. In the case of other disability types, ‘cannot do at all’ refers to being unable to perform certain everyday activities.

Impact of Disability
Self-Care Activities The NDS also queried people about the level of difficulty a specific set of self-care activities presented for them. These are shown in Figure 2.3. The activities are different from those used to assess the level of difficulty associated with the disability itself, which was discussed above. For instance, someone with a moderate level of difficulty in walking for 15 minutes might well have no difficulty in performing these basic self-care activities. Figure 2.3: Level of Difficulty with Self-care Activities by Type of Activity (percentages)
Source: CSO, 2010, Table 2.1. Census/NDS Disability Sample
66
65
75
89
80
85
14
14
7
4
6
6
0 10 20 30 40 50 60 70 80 90 100
Staying by yourself
Taking a bath or shower by yourself
Dressing yourself
Feeding yourself
Getting in and out of bed by yourself
Going to the toilet by yourself
No Difficulty Some difficulty A lot of difficulty Cannot do at all
Figure 2.3 shows that most people with a disability can perform all of these everyday activities with no difficulty (65–89 per cent). Of the different activities, people with a disability are most likely to have some difficulty staying by themselves or taking a bath or shower (33–36 per cent). It is not surprising, then, that bathroom adaptations are the most used adaptation in the home. Twenty per cent of people with a disability in private households use them and a further 12 per cent say that they need but do not have them (CSO, 2010, p.58). Of the other self-care activities, about one quarter have at least some difficulty dressing while one fifth have some difficulty in getting in or out of bed. About one in seven people with a disability have at least some difficulty going to the toilet unaccompanied and about one in eight has difficulty feeding himself or herself. Health and Stamina As reported in the last chapter, the largest single cause of disability is disease or illness, accounting for 41 per cent of disability overall. In the following section, we draw on the NDS findings to examine the health status and the stamina of people with a disability. These have an important bearing on quality of life and on people’s capacity to participate in work and social activities. Figure 2.4 shows how people with a disability rate their health and stamina, distinguishing between those living in private households and those living in communal establishments. For comparison, it also shows figures on health status for the general population living in private households.
15

A Social Portrait of People with Disabilities in Ireland
16
Figure 2.4: Health and Stamina of the General Population and of People with a Disability, by Living Arrangements
Sources: CSO, 2010, Tables 10.4a, 10.4b, 10.5a and 10.5b. Census/NDS Disability Sample. CSO, 2008b, Table 2 (QNHS Q3 2007) for general population figures. Note: Health and stamina levels are self rated. The categories ‘very bad’ and ‘bad’ are combined in the case of the general population
47
1613
6
4035
30
38
11
38 38 40
2
1015
11
2 5 5
0
10
20
30
40
50
60
Health Health Stamina Health
Private households Private Households Communal Establishments
General Population People with a disability
Very good Good Fair Bad Very Bad
Compared to the general population, people with a disability are much less likely to rate their health as very good or good. They are more likely to rate their health as bad or very bad. For instance, 47 per cent of the general population rate their health as very good and 40 per cent rate their health as good. This compares to 16 and 35 per cent, respectively, for people with a disability living in private households. On the other hand, only 2 per cent of the general population rate their health as bad or very bad (there are too few cases in these two categories for the CSO to report them separately). This compares to 12 per cent of people with a disability living in private households. People with disabilities who live in private households tend to have better health and stamina than those living in communal establishments. About half of people with a disability living in private households rate their health as good or very good. This compares to a figure of about 45 per cent for those living in communal establishments. At the other end of the scale, only about one person in eight with a disability, living in a private household, rates his or her general health as bad or very bad. This compares to one in six of those living in communal establishments. People tend to be more positive about their overall health than about their stamina. People with disabilities are less likely to rate their stamina as very good or good (43 per cent for those living in private households and 32 per cent of those living in communal establishments). The proportions rating their stamina as bad or very bad are just under one in five for people with a disability living in private households and over one in four of people with a disability living in communal establishments. The proportions reporting good health and stamina are higher for younger people with a disability. They are also higher for people with intellectual & learning, speech and hearing disabilities (CSO, 2010, Tables 10.3, 10.4, 10.5 and 10.6). Children with Disability As seen in the previous chapter, the prevalence of disability increases with age. The percentage of children with disability is, therefore, lower than the percentage of adults with disability. According to the Census/NDS definition, 3.5 per cent of children under age 18 have a disability, compared to 9.6 per cent of adults. The figure is higher among boys than among girls (4.4 per cent and 2.6 per cent, respectively; CSO, 2008, Table 1.10).11 Although the prevalence of disability is lower among children, children with a disability are likely to face particular challenges in terms of schooling and preparation for adult life. Figure 2.5 shows the type of disability and the level of difficulty in everyday activities for boys and girls under age 18.
11 The finding of a higher rate of disability, particularly severe disability, among boys than among girls is common to several developed countries (e.g. Statistics Canada, 2002; Nazma, 2004), although there is some debate about whether disability is under-diagnosed in girls (e.g. Bandian, 1999).

Impact of Disability
Figure 2.5: Type of Disability and Level of Difficulty among Children with Disability (number in ‘000)
17
Source: CSO, 2010, Tables A.4, B.4, C.4, D.4, E.4, F.4, G.4, H.4 and I.4. Census/NDS Disability Sample
1,300
1,800
6,300
4,700
11,900
17,900
6,300
1,900
3,300
1,400
1,500
3,800
3,400
6,000
9,100
3,600
1,800
2,200
18 16 14 12 10 8 6 4 2 0 2 4 6 8 10 12 14 16 18
Seeing
Hearing
Speech
Mobility/dexterity
Remember./concentrat.
Intellectual/learning
Emot./Psychological
Pain
Breathing
Moderate/a little
A lot
Cannot do
Girls ('000) Boys ('000)
The most common type of disability among both boys and girls is intellectual & learning disability. This affects nearly twice as many boys (17,900) as girls (9,100). This category covers two distinct categories of disability – intellectual disability, and specific learning difficulties such as dyslexia or Attention Deficit Hyperactivity Disorder. The next most common type of disability is remembering & concentrating which affects about 11,900 boys and 6,000 girls. The salience of these types of disability among children is clear evidence of the importance of the biopsychosocial model of disability, which emphasises the importance of the social, environmental and emotional contexts. These are the types of disability that are likely to create challenges for young people in the educational system. The other types of disability that are more common among boys than girls are speech (6,300 boys and 3,800 girls); emotional, psychological & mental health (6,300 boys and 3,600 girls); mobility & dexterity (4,700 boys and 3,400 girls); and breathing (3,300 boys and 2,200 girls). The gender difference is smaller for hearing and pain disabilities, and there are roughly equal numbers of boys and girls with a seeing disability. Among children with each type of disability, the level of difficulty experienced by boys tends to be higher than the level experienced by girls in the case of seeing and remembering & concentrating. On the other hand, girls with a mobility & dexterity disability or an emotional, psychological & mental health disability experience a greater level of difficulty with everyday activities than boys with the same disability. The level of difficulty experienced by boys and girls with the other types of disability is broadly similar. Summary In this chapter, we discussed the type of disability experienced and the impact of disability on basic self-care activities. We saw that about two thirds of people with a disability have a lot of difficulty associated with their disability or cannot do certain everyday activities at all. The level of difficulty tends to be greater among people who have a disability related to mobility & dexterity and tends to be greater for people who are older.

A Social Portrait of People with Disabilities in Ireland
18
On the other hand, most people with a disability have no difficulty in completing basic self-care activities such as getting in and out of bed alone. Taking a shower/bath was the most common area of difficulty, and bathroom adaptations were the most frequently-cited adaptations people used, or needed, in the home. The second greatest area of difficulty cited was staying at home alone. The most common types of disabilities among both boys and girls are intellectual & learning and remembering & concentrating. In both instances, the disabilities are nearly twice as prevalent amongst boys as girls. This prevalence may relate to their relative performance in the school system. The social and environmental contexts of disability are considered in more depth in the next several chapters. The next chapter focuses on the important areas of education and work. The extent to which people with disability are able to participate in these key areas of life and the consequences for their living standards are examined.

Education, Work and Living Standards
19
Chapter 3
Education, Work and Living Standards This chapter explores the difficulties experienced by people with disabilities in the areas of work, education and living standards. Education and work are key to understanding the standard of living that individuals and households enjoy in Irish society today. For instance, the 2008 Survey of Income and Living Conditions (EU-SILC) (CSO, 2009) showed that the annual average disposable income of households headed by someone with a third level degree was €75,686, compared to €31,595 for households headed by someone with a primary education only. The annual average disposable household income was €24,721 in households where no adult worked, compared to €68,749 where two adults were in employment (CSO, 2009, Table 1.3). Education Figure 3.1 shows the proportion of people with a disability whose disability limited them before the completion of full-time education. Since most disability is acquired over time, we would expect higher proportions of younger people with a disability to report limitations due to disability on the completion of full-time education than older people, who are longer out of the education system. This is borne out by the patterns in the Figure 3.1. Among those aged 5 to17 with a disability, all had been affected by it before the completion of full-time education. This is true of 59 to 64 per cent of young adults (aged 18 to 34); 30 to 36 per cent of adults aged 35 to 44; 23 to 26 per cent of adults aged 45 to 54; 11 to 12 per cent of adults aged 55 to 64; and below 10 per cent of adults aged 65 and over. The proportion drops to just 3 per cent for adults aged 75 and over. Figure 3.1: Limited by Disability before Completion of Full-Time Education, by Age Group and
Gender (percentage)
100
64
3626
11 73
100
59
3023
127
30
10
2030
405060
7080
90100
5-17 18-34 35-44 45-54 55-64 65-74 75+
MalesFemales
Source: CSO, 2010, Table 6.4. Census/NDS definition of disability Men and women with a disability in the 18 to 54 age group differ in that the disability is more likely to have limited the completion of full-time education of more men than women.

A Social Portrait of People with Disabilities in Ireland
20
Highest Level of Education Completed (Census figures) The tables published to date, from the NDS, do not show the highest level of education attained by people with a disability. For this, we turn to the Census of Population. We saw in Chapter 1 that the Census of Population definition excludes a large group of people who were subsequently identified in the NDS as having a disability. It also includes a number of individuals who, when presented with the more detailed NDS questions, turned out not to meet the NDS definition in terms of severity. Nonetheless, until further analysis of the NDS is completed, the Census is the most up to date source of information on the educational level of people with a disability. Figure 3.2 shows the highest level of education achieved by the general population and by adults aged 15 and over who have a disability. Compared to the general adult population, adults with a disability are very disadvantaged in terms of educational level. Figure 3.2: Highest level of Education Completed by Type of Disability (percentages)
Source: CSO, 2007b, Table 21. Note: Age of adults is 15 years and over, using Census of Population definition of disability
19%
43%
49%
51%
63%
39%
37%
19%
10%
8%
6%
4%
10%
14%
0% 10% 20% 30% 40% 50% 60% 70% 80% 90% 100%
Total population
All People with a Disability
Sensory disability
Physical Disability
Learning/Intellectual
Psychological/Emotional
Other, including chronic illness
Primary or less Lower Second Level Complete 2nd level Non-degree Degree+
Among people with disabilities, 43 per cent have not progressed beyond primary education. This compares to 19 per cent of all adults. Only 10 per cent of people with disabilities have a third level degree. This compares to 19 per cent of all adults. As we might expect, those with an intellectual & learning disability are the most disadvantaged, with only 4 per cent having obtained a third level degree and 63 per cent not having progressed to second level. Those with a chronic illness fare somewhat better, with 37 per cent having left school before second level and 14 per cent having achieved a third level degree. To some extent, the results in Figure 3.2 reflect both age-cohort effects and disability effects. Older adults are more likely to have a disability. Also, the level of education completed by older cohorts of adults is generally lower than that completed by younger cohorts. However, even if we control for the fact that people with disabilities tend to be older (and, hence, belong to a cohort that typically left education sooner), we can still see the educational disadvantage experienced by people with disabilities. Figure 3.3 shows the highest level of education achieved by people with a disability and by people with no disability. This is broken down by age group. The analysis is based on the COPSAR data (the CSO 5 per cent sample from Census 2006). The definition of disability, therefore, is the Census of Population definition.12
12 See Appendix 1 for further detail on the different definitions of disability.

Education, Work and Living Standards
21
Figure 3.3: Level of Education by Age Group for Adults Aged 25 to 64 (percentages)
Source: Special Analysis of Census 2006, COPSAR data, Census of Population Sample
19
18
22
23
26
35
48
52
36
34
29
23
21
18
15
13
3
4
5
7
11
19
32
38
52
50
41
33
28
26
21
18
100 80 60 40 20 0 20 40 60 80 100
25-29
30-34
35-39
40-44
45-49
50-54
55-59
60-64
People with no disability People with a disability
Primary or less Lower secondary Upper secondary Third Level (non-degree or degree)
For each age group, people with disabilities have lower levels of education than people without disabilities. For instance, among those in the 25 to 29 year age group without a disability, only 3 per cent of people finished schooling with primary education or less. This compares to 19 per cent of people with a disability. In this same age group, 84 per cent of people without a disability have completed second level education, while only 63 per cent of people with a disability have done so. While 52 per cent of people with no disability in the 25 to 29 age group have a third level qualification, this is true of only 36 per cent of people with a disability in the same age group. These results could be expected from our earlier analysis of the proportion of younger people with a disability whose disability limited them before the completion of full-time education. In the oldest age group (those aged 60 to 64), the proportion of people with disabilities who have primary education, or less, is starkly higher (52 per cent) than the corresponding figure for people without a disability (38 per cent). We saw earlier that much of the disability experienced by older adults develops through the life course (Chapter 1). This raises the question as to whether low levels of education, with associated disadvantages in the labour market and in living standards, increases the risk of developing a disability as a person gets older. Earlier studies have detected a similar association of disability with low educational attainment in the older age group. They concluded that this is likely to be a result of the unfavourable labour market and living standards ensuing from educational disadvantage.13 The NDS provides further detail on the experiences of people whose disability affected them in their school years. In order to complete their education, people with disabilities who were affected during their schooling needed additional supports. These included: accessible transport (16 per cent); accessible or adapted classrooms and equipment (14 per cent); a teacher’s aide or learning support assistant (14 per cent); a personal assistant (11 per cent); and accessible buildings and facilities (10 per cent). While most people with a disability were able to access these necessary supports, about one third of people left education before they intended to because of their disability (CSO, 2010, pp 73-74). Economic status We now turn to the economic status of people with disabilities, focusing on those in the 25 to 64 age group. Labour force participation is an important goal for people with disabilities. As with all vulnerable groups, this is the primary route out of poverty and disadvantage. Recognising this, one of the goals of
13 Gannon and Nolan (2005) report a similar pattern of a higher incidence of disability in later life among people with lower levels of education. Jones reports a similar pattern in the UK (Jones, 2010). See also White and Edgar (2010) for relationship between social class and disability-free life expectancy in England.

A Social Portrait of People with Disabilities in Ireland
22
the National Action Plan for Social Inclusion (NAPinclusion) is to ’increase the employment of people with disabilities who do not have a difficulty in retaining a job’ (NAPinclusion, 2007, p. 56). Figure 3.4 shows the economic situation of people with disabilities who have left education, compared to the total population. This comes from the Census of Population. The definition of disability used is based on the Census questions. Economic status is based on the person’s self-defined main status. Figure 3.4: Principal Economic Status for All Adults and for Adults with a Disability by Type of
Disability (adults aged 25 to 64, percentages)
Source: CSO, 2007b, Table 9. Census of Population definition of disability. Students are excluded
0% 20% 40% 60% 80% 100%
All persons
All persons with a disability
Sensory disability
Physical disability
Learning/intellectual disability
Psychological/emotional disability
Other, incl. chronic illness
At work
Unemployed
Caring for home/family
Retired
Unable to work-ill/disabilityOther
Overall, 73 per cent of adults in the 25 to 64 age group were at work in 2006 according to the Census figures.14 The percentage for people with a disability was 35 per cent. It was particularly low for those with a physical disability (22 per cent) and for those with a psychological or emotional disability (26 per cent). Those with a sensory disability fared better in that 47 per cent were in employment. While 5 per cent of the general population were unable to work due to illness or disability, the figure rose to 41 per cent among all people with a disability and 55 per cent of those with a physical disability. It is worth examining the figures separately for men and women to determine whether there is a relationship between the gender of a person with a disability and their principal economic status. For this, we move to the National Disability Survey and the Census/NDS definition of disability. The higher threshold (‘moderate’ or greater for most disability types) used in the NDS means that some people with less severe disabilities are excluded. As these individuals are more likely to work, the percentage ‘at work’ in the NDS will be lower than the corresponding percentage in the Census of Population sample of people with disabilities. Figure 3.5 focuses on adults aged 18 to 64 living in private households whose disability limited or affected them before 65 years of age. It excludes students, people who retired at normal age and those whose main activity is ‘other’.15 Overall, 24 per cent of people with a disability in this group are at work; 7 per cent are unemployed; 56 per cent are unable to work because of their disability; and a further 7 per cent retired early because of their illness or disability.
14 This was close to the peak of the economic boom in Ireland, and would be lower in 2010. The 2006 figures are useful because they allow us to compare the situation of people with different types of disability to the overall adult population. 15 This is a small group, ranging from about 5 per cent of people with a disability aged 18 to 34 to about 1 per cent of people with a disability aged 55 to 64.

Education, Work and Living Standards
23
Figure 3.5: Main Activity of Adults with a Disability which affected them before Age 65 by Sex and age Group (percentages)
Source: CSO, 2010, Table 7.3, p. 240. Census/NDS definition of disability. Note: Includes adults in private households aged 18 to 64 but excludes students, people who retired at normal age and ‘other’
40%
35%
23%
12%
43%
56%
63%
68%
33%
24%
16%
10%
44%
53%
65%
56%
100% 80% 60% 40% 20% 0% 20% 40% 60% 80% 100%
Age 18-34
Age 35-44
Age 45-54
Age 55-64
Women Men
Working Unemployed Caring for Home/Family Unable work-ill/disability Retired early
There is a clear age pattern among the younger age groups of people with a disability and their likelihood to be at work. For instance, 40 per cent of men, and 33 per cent of women, aged 18 to 34 and with a disability, are at work. The comparative figures for adults in the 55 to 64 age group are for 12 per cent of women and 10 per cent of men, with a disability, to be at work. The largest category of activity for all age groups of people with a disability is that described in terms of being ‘unable to work due to illness or disability’. The proportion of both men and women, described as such, also increases with age – from 43 to 44 per cent of men and women aged 18 to 34, to 68 per cent of men and 56 per cent of women aged 55 to 64. In all age groups, men with a disability are more likely to be at work, than women with a disability. The percentage of people with a disability in the older age groups who are at work is lower, for both men and women. For instance, 40 per cent of men and 33 per cent of women with a disability aged 18 to 34 are at work. The corresponding figures for the 55 to 64 age group are 12 per cent of men and 10 per cent of women. Men are slightly more likely than women to be unemployed and to have retired from work early. The other significant difference in the principal activities of men and women with a disability relates to the proportion of women occupied looking after the home and family. Twelve per cent of women within the 18 to 34 age group are occupied in home or family care activities, rising to a figure of 19 per cent for women aged 55 to 64. A very small percentage of men, in the 35 to 54 year age bands only, are similarly occupied. Unemployment is higher for the younger age groups of adults with a disability. Seventeen per cent of men and 12 per cent of women aged 18 to 34 are unemployed whereas only 2 per cent of both men and women aged 55 to 64 are unemployed. Early retirement is more common among older adults and reaches 17 per cent of men and 13 per cent of women in the 55 to 64 age group. This refers to people who retired before the usual retirement age for the job and may be linked to the person’s illness or disability. Figure 3.6 shows the main activity by the type of main disability16 from the NDS, for adults whose disability affected them before the age of 65. The definition used is the Census/NDS definition of disability. As before, students, those who retired at normal age and those with ‘other’ economic status are excluded. Those with an intellectual & learning disability (39 per cent) are most likely to be at work. It should be noted that this group contains some very diverse types of disability, including conditions such as Attention Deficit Hyperactivity Disorder (ADHD) and dyslexia, autistic spectrum disorders and intellectual disabilities. Those with a mobility & dexterity disability (14 per cent) and those with a pain
16 Most people with a disability have more than one of the nine types, with an average of 2.6 different types (see Chapter 1). The ‘main’ disability is self-defined.

A Social Portrait of People with Disabilities in Ireland
24
disability are least likely to be at work (15 per cent). The figure also shows the category ‘retired early’ which is most common among people with breathing difficulties (19 per cent), followed by those with hearing difficulties (17 per cent). Figure 3.6: Main Activity by Main Disability Type (percentages)
Source: CSO, 2010, Table 7.4, p. 241. Census/NDS definition of disability. Note: Includes adults in private households aged 18 to 64 whose disability affected them before age 65, excluding students, people who retired at normal age and ‘other’
26%
33%
25%
14%
24%
39%
17%
15%
17%
40%
26%
59%
56%
40%
47%
61%
58%
50%
0% 20% 40% 60% 80% 100%
Seeing
Hearing
Speech
Mobility & Dexterity
Remembering & Concentrating
Intellectual and Learning
Emotional, Psychological & Mental Health
Pain
Breathing
At work Unemployed Caring for home/family Unable to work-disability Retired early
The proportion of people with a disability who are unemployed is highest for those with intellectual & learning disability (11 per cent), followed by those with difficulties in remembering & concentrating (11 per cent). People with emotional, psychological & mental health disability are most likely to describe themselves as ‘unable to work due to disability or illness’ (61 per cent), while those with a hearing disability (26 per cent) are least likely to do so. People with a Disability at Work or Interested in Work To some extent, the figures reported above may already be coloured by the barriers people with a disability face in the world of work. Experiencing such barriers may lead people who would like to work, but who have become discouraged, to report that they are ‘unable to work due to illness or disability’. This means that measures such as the unemployment rate are likely to understate the difficulties faced by people with a disability in finding work. The NDS reveals that, of those people with a disability not in a job at present, over one third (37 per cent) would be interested in work if the circumstances were right.17 The figure is almost two thirds for younger people with a disability (63 per cent of men and 65 per cent of women in the 18 to 34 age group, CSO, 2010, Table 7.19). People who would be interested in work, as well as the 17 per cent of people with a disability who are currently at work, were asked whether they required any of a list of 13 job features or aids to be able to work. The responses are shown in Figure 3.7. Features of the job itself are by far the most important elements to enable people with a disability to work. These include flexible work arrangements (45 per cent) and modified job tasks (29 per cent). A wage subsidy was cited by about one quarter of respondents (24 per cent) as being important. This reflects the fact that the earnings of people with a disability are typically lower than average (Gannon and Nolan, 2004) and that there are substantial costs associated with the disability itself (Cullinan, Gannon and Lyons, 2010). Issues related to accessibility were cited by 10 to 17 per cent of respondents. These included: accessible transport (17 per cent); appropriate lift and parking (14 per cent respectively); accessible buildings and modified workstations (13 per cent respectively); accessible toilets (12 per cent); and handrails or ramps (10 per cent). Human support is, or would be needed, by 8 per cent of respondents, while 4 per cent would need technical aids and communication aids, respectively.
17 This figure refers to adults with a disability in private households whose disability affected them before the age of 65 and were unemployed, or retired early (i.e. before normal age), or unable to work due to permanent illness or disability, or looking after family/home, or other. Excludes persons who retired at normal age (CSO, 2010, Table 7.19).
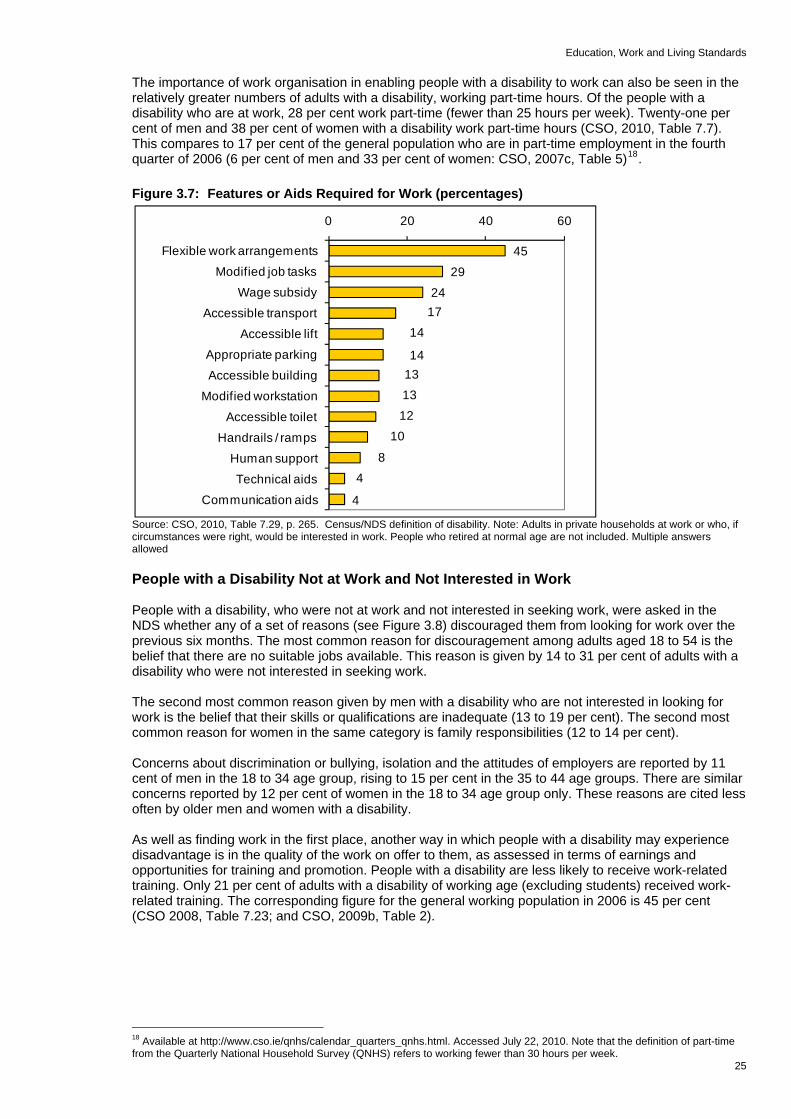
Education, Work and Living Standards
25
The importance of work organisation in enabling people with a disability to work can also be seen in the relatively greater numbers of adults with a disability, working part-time hours. Of the people with a disability who are at work, 28 per cent work part-time (fewer than 25 hours per week). Twenty-one per cent of men and 38 per cent of women with a disability work part-time hours (CSO, 2010, Table 7.7). This compares to 17 per cent of the general population who are in part-time employment in the fourth quarter of 2006 (6 per cent of men and 33 per cent of women: CSO, 2007c, Table 5)18. Figure 3.7: Features or Aids Required for Work (percentages)
4529
2417
14
14131312
10
84
4
0 20 40 6
Flexible work arrangementsModified job tasks
Wage subsidyAccessible transport
Accessible liftAppropriate parkingAccessible building
Modified workstation
Accessible toiletHandrails / ramps
Human suppor
Source: CSO, 2010, Table 7.29, p. 265. Census/NDS definition of disability. Note: Adults in private households at work or who, if circumstances were right, would be interested in work. People who retired at normal age are not included. Multiple answers allowed
0
tTechnical aids
Communication aids
People with a Disability Not at Work and Not Interested in Work People with a disability, who were not at work and not interested in seeking work, were asked in the NDS whether any of a set of reasons (see Figure 3.8) discouraged them from looking for work over the previous six months. The most common reason for discouragement among adults aged 18 to 54 is the belief that there are no suitable jobs available. This reason is given by 14 to 31 per cent of adults with a disability who were not interested in seeking work. The second most common reason given by men with a disability who are not interested in looking for work is the belief that their skills or qualifications are inadequate (13 to 19 per cent). The second most common reason for women in the same category is family responsibilities (12 to 14 per cent). Concerns about discrimination or bullying, isolation and the attitudes of employers are reported by 11 cent of men in the 18 to 34 age group, rising to 15 per cent in the 35 to 44 age groups. There are similar concerns reported by 12 per cent of women in the 18 to 34 age group only. These reasons are cited less often by older men and women with a disability. As well as finding work in the first place, another way in which people with a disability may experience disadvantage is in the quality of the work on offer to them, as assessed in terms of earnings and opportunities for training and promotion. People with a disability are less likely to receive work-related training. Only 21 per cent of adults with a disability of working age (excluding students) received work-related training. The corresponding figure for the general working population in 2006 is 45 per cent (CSO 2008, Table 7.23; and CSO, 2009b, Table 2).
18 Available at http://www.cso.ie/qnhs/calendar_quarters_qnhs.html. Accessed July 22, 2010. Note that the definition of part-time from the Quarterly National Household Survey (QNHS) refers to working fewer than 30 hours per week.

A Social Portrait of People with Disabilities in Ireland
26
Figure 3.8: Reasons for not being Interested in Work by Gender and Age Group (percentages)
Source: CSO, 2010, Table 7.21, p. 257. Census/NDS definition of disability. Note: Adults in private households not at work and who, even if circumstances were right, would not be interested in returning to work, excluding people who retired at normal age. Multiple answers allowed. Other reasons, given by fewer than 6 per cent of any age group, include ‘lack of accessible transport’, ‘discouraged by family or friends’ and ‘job information not accessible’
-35 -25 -15 -5 5 15 25 35
35 30 25 20 15 10 05 00 05 10 15 20 25 30 35
Lose some current income
Lose some additional supports
Family responsibilities
Worry about isolation
Worry-discrimination/bullying
Worry-employer attitudes
Training/education inadequate
No suitable jobs available
Age 18-34
Age 35-44
Age 45-54
Women Men
The earnings of people with disability also tend to be lower. Gannon and Nolan, drawing on the 2001 Living in Ireland Survey, found that the earnings of people with a disability are about €1.25 per hour lower, on average, than the earnings of people without a disability, when other factors are controlled (2005, p. 45). This amounts to about 12 per cent of the average hourly earnings for all participants in the survey.19 Disability and Living Standards Given the various constraints for those with a disability in seeking to participate in the everyday life of society; the additional costs that may be associated with disability; and the relatively low level of labour force participation just described, disability in itself could be expected to represent a ‘risk factor’ in terms of low income, disadvantage and deprivation. We relied on data from the EU-SILC20 to capture the socio-economic circumstances of the other groups covered in the earlier Social Portraits.21 However, there is a data problem with respect to the use of the EU-SILC in assessing the living standards of people with a disability. Unlike the QNHS and the Living in Ireland survey, which ask about ‘long-standing/chronic health problems, illness or disability’, the EU-SILC asks whether the respondent suffers from any ‘chronic (long-standing) illness or condition (health problem)’. The term ‘disability’ is not included. The survey then asks, separately, whether the person has, in the last 6 months, been limited in activities people usually do because of a health problem. Respondents can reply that they were ‘strongly limited’,’ limited’, or ‘not limited’.22 Given the difficulties in
19 Calculated from figures in Table 4.3, p. 42 of Gannon and Nolan, 2005. 20 From 2010, the EU-SILC survey will adopt the Census phraseology. 21 Social Portraits have been published on Older Adults, Children, People of Working Age and Communities. 22 The percentage of people who are limited or strongly limited is approximately the same as the percentage in the ‘Total Disability’ group (CSO, 2008; See Appendix Table A1). This means that this measure will include some individuals who are less severely limited by their disability than those captured by the Census/NDS measure used for the bulk of this report.

Education, Work and Living Standards
27
measuring disability in the EU-SILC, the figures presented in the following tables should be treated with caution. In Table 3.1, we present some results from the EU-SILC (CSO, 2010) relating to chronic illness, limited physical activity and poverty. We see that there was a heightened poverty risk for people who had a chronic illness or health problem, or who were limited in their activities. The at-risk-of-poverty rate is the percentage of people who fall below the poverty threshold set at 60 per cent of the median equivalised23 household income. In 2009, 15 per cent of people with a chronic illness or health problem fell below this income level compared to 13 per cent of people without a chronic illness or health problem. At the same time, 15 per cent of those whose activities were limited, in the previous six months, by health problems and 18 per cent of those whose activities were severely limited, fell below this income threshold. Table 3.1: At-risk-of-poverty Rate and Consistent Poverty Rate24 for Adults Aged 16 and Over in
2007, 2008 and 2009 by Disability Status (percentages) Chronic illness
or health problem
Limited activity in last 6 months
No Yes Not limited
Limited Strongly limited
2007 At–risk-of-poverty rate 14.1 22.0 13.8 24.9 27.7
Consistent poverty rate 3.2 7.9 3.3 8.1 11.9
2008 At–risk-of-poverty rate 12.7 16.0 12.6 16.5 18.7
Consistent poverty rate 2.8 6.0 3.0 5.5 7.7
2009 At–risk-of-poverty rate 12.5 15.2 12.5 15.2 17.8
Consistent poverty rate 4.4 5.5 4.3 5.5 7.8
Source: CSO, 2010, Tables 2.6 and 4.4 We now look at the consistent poverty rate, where the household reports deprivation, as measured in terms of the lack of two or more of 11 basic items,25 as well as having an income below the threshold. Table 3.1 shows that the consistent poverty rate in 2009 was higher for those reporting a chronic illness or health problem than for other adults (5.5 compared to 4.4 per cent), and was higher still for those whose activities were severely limited (7.8 per cent). For those with a disability, as well as for other adults, the at-risk-of-poverty rate dropped between 2007 and 2009. The consistent poverty rate fell between 2007 and 2008 but with some tendency to increase again between 2008 and 2009. Similar results are reported by Gannon and Nolan (2005) who conducted a detailed analysis of the circumstances of people with a disability in Ireland, using data from the 2000-2001 Living in Ireland Survey. The authors found that the at-risk-of-poverty rate and the consistent poverty rate were both about twice as high for adults reporting chronic illness or disability as for other adults. On the other hand, those with a chronic illness or health problem that did not limit their activity had the same rates of poverty as persons not reporting an illness or health problem. Gannon and Nolan also found that the total number of adults in the household at work, and the extent of social welfare dependence, were important in accounting for the high risk of poverty among people with a disability, particularly for adults under 65 years of age. Thus, since poverty is measured at the household level, the living arrangements of people with a disability will have an impact on their risk of poverty.
23 Equivalised income is disposable income from all sources after adjusting for household size and composition. 24 At-risk-of-poverty rate means that household income, including all social transfers, is below 60 per cent of the median equivalised household income. Consistent poverty means the household is below 60 per cent of median equivalised income and lacking two or more of 11 basic deprivation items. 25 These are: going without heating, or being unable to afford any of the following: a morning, afternoon or evening out in the last fortnight, two pairs of strong shoes, a roast once a week, a meal with meat, chicken or fish every second day, new (not second-hand) clothes, a warm waterproof coat, to replace any worn out furniture, to keep the home adequately warm, to have family or friends for a drink or meal once a month, to buy presents for family or friends at least once a year.

A Social Portrait of People with Disabilities in Ireland
28
The following figures from the EU-SILC 2009 (CSO, 2010b) show the importance of work to living standards and to reducing the risk of poverty. The figure compares the circumstances of people who are not at work due to illness or disability, to those who are at work and the unemployed. We saw earlier that a substantial proportion of people with a disability are not at work due to illness or disability (41 per cent using the Census of Population definition of disability and 48 per cent using the NDS definition). Table 3.2: Income, Deprivation and Consistent Poverty by Principal Economic Status in 2009
Principal Economic Status (age 16 & over)
At work Unemployed Not at work due to
illness/disability
Average annual disposable household income €28,732 €18,239 €17,196
Lack 2 or more basic goods/services (per cent) 7.9 34.3 35.7
Consistent poverty rate (per cent) 1.1 11.5 8.8Source: CSO, 2010, Tables 1.4, 3.3 and 4.1 Table 3.2 shows that the disposable household income of adults not at work due to illness or disability in 2009 was about 60 per cent of that of adults who were at work. As a result, both the level of deprivation and consistent poverty rates are higher. The most extreme deprivation, lacking two or more basic goods and services, is experienced by 36 per cent of those not at work due to illness or disability. This compares to a corresponding rate of 8 per cent for those at work. The consistent poverty rate in 2009 for those out of work due to illness/disability is 9 per cent, compared to 1 per cent for those at work. The average income and deprivation levels of people not at work due to illness or disability is similar to that of unemployed people, but their consistent poverty rate (which takes account of the standard of living) is somewhat lower (9 vs. 12 per cent). Cost of Disability A reason why people with a disability may be more likely to experience deprivation than people who are unemployed is due to the additional costs associated with the disability itself. A recent study, based on data from the Living in Ireland Survey, found that the estimated long-run cost of disability is equal to 30 to 3326 per cent of average weekly income (Cullinan, Gannon and Lyons, 2010). In other words, a household with a person who has a disability, living on an average income, would need €141 to €143 per week, at 2001 rates, to have the same standard of living as a household where no member has a disability.27 This means that statistics such as the at-risk of poverty rate, which take no account of differences in household expenditure associated with the disability, will tend to understate the true level of economic disadvantage of people with disabilities. The measure of consistent poverty, which takes account of living standards as well as household income, goes some way towards bridging this gap, but the income threshold is still one that takes no account of the additional cost of disability. In other words, some people with a disability whose incomes are above the at-risk-of-poverty income threshold may, because of the additional costs associated with disability, experience standards of living that are just as deprived as for people below the income threshold with no disability. The authors of the study estimating the additional costs of disability, argue that their findings support the case for the introduction of disability-adjusted poverty and inequality estimates and equivalence scales (Cullinan, Gannon and Lyons, 2010; see also Zaidi and Burchardt, 2005).
26 The higher figure is for households with a person with a disability, resulting in severe limitation. 27 The average household income in the survey for adults with a disability resulting in severe limitation was €429.66 and for adults with a disability causing ‘some limitation’ was €474.78.
Education, Work and Living Standards
29
Summary In this chapter we examined the education, work situation and living standards of people with a disability. We saw that, as most disability is acquired over the life course, more than half of those aged 18 to 34 with a disability were limited by this before completion of full-time education. The proportion was higher for men than for women and, as we might expect, higher for younger adults with a disability than for older adults with a disability. We also saw that disability has an impact on people’s economic status. People with a disability in the 25 to 64 age group are less than half as likely as those without a disability to be at work. Finally, we saw evidence that people with a chronic illness or health problem or whose activity is limited by illness or injury have a higher risk of consistent poverty than those without an illness and not limited in their activities. We note that existing poverty measures do not take account of the additional costs associated with the disability itself (estimated to be in the region of one third of average household income). If we did take account of these additional costs, the poverty rate of people with a disability would be even higher than the current statistics suggest. The results in this chapter highlighted both the importance of work to enabling people with a disability to achieve an adequate standard of living and the importance of how work is organised to enable people with a disability to participate in work. We saw that people with a disability at work are likely to work fewer hours, with the difference particularly marked for men, and that those with a disability who are at work or interested in work are most likely to cite flexible working arrangements as important to enabling them to work. As noted in Chapter 1, the biopsychosocial model of disability defines disability with respect to the environment in which people find themselves as well as with respect to the condition or limitation they experience. In this chapter, the educational and employment context was examined. Another important aspect of the environment is the social context, this is the focus of the next chapter.


The Social Environment
31
Chapter 4
The Social Environment As Chapter 1 shows, disability is increasingly being understood as a social construct. What people can do and the level of difficulty they experience is as much about their environment as it is about their disability. In this chapter, the social environment in which people with disability live is examined. A central aspect of the social environment for most people is the relationship with an intimate partner and with family, so the marital status and living arrangements of people with a disability will be reviewed. We go on to examine whether the attitudes of other people facilitate or hinder people with a disability and explore the extent to which people with a disability need or receive help from others. The chapter concludes with an exploration of participation in social activities. Marital Status and Living Arrangements As noted earlier, the results published to date from the NDS provide breakdowns by gender, age group, main disability type and region but not by other characteristics of the individuals. So, to examine the marital status of people with a disability, we turn to the Census of Population. In Chapter 1, we saw that the Census of Population definition of disability is based on responses to Census questions number 15 (presence of one of five types of disability) and number 16 (activities with which the person has difficulty). This definition excludes a large group of people who were subsequently identified in the NDS as having a disability, but also includes a number of individuals who turned out not to reach the NDS threshold in terms of severity. Nonetheless, until further analysis of the NDS is completed, this is the most up to date source of information available on the marital status of people with disabilities. Figure 4.1 shows the marital status of people with disabilities, by broad age group, compared to the general population. In general, people with a disability are less likely than people without a disability, to be married. This is not yet evident in the 15 to 24 age group, as the majority of people are still single at that stage (98 per cent). Within the age group 25 to 44, however, the difference is evident. While 48 per cent of the general population in this age group is married, the figure is 35 per cent for people with a disability. Within the age group 45 to 64, the gap has widened further: 72 per cent of the general population is married, compared to 57 per cent of people with a disability. The gap is also evident in those aged 65 and over, where 50 per cent of the general population is married, compared to 37 per cent of people with a disability. People with a disability aged between 25 and 64 are also more likely to be separated or divorced (7 per cent compared to 5 per cent for the general population in the 25 to 44 age group and 14 per cent compared to 10 per cent in the 45 to 64 age group). Over the age of 65, people with a disability are more likely to be widowed (41 per cent compared to 31 per cent for the general population). It is not possible to tell from the Census data whether the onset of disability pre-dates the change in marital status. One possible explanation for the association between marital status and disability is that people with a disability may have greater difficulty in meeting a suitable marriage partner and that they are more likely to experience marital breakdown.

A Social Portrait of People with Disabilities in Ireland
An alternative explanation is that failure to meet a suitable marriage partner, or the experience of marital breakdown, contributes to the development of disability. Yet a further explanation is that both disability and marital status are associated with a third factor (socio-economic status, as we saw in the previous chapter, is a clear candidate) that contributes both to the emergence of disability and to either remaining single or having a marital breakdown. Figure 4.1: Marital Status by Age for All Adults and People with a Disability (percentages)
32
Source: CSO, 2007b, Table 6. Census of Population Sample
98%
98%
47%
57%
14%
24%
17%
19%
48%
35%
72%
57%
50%
37%
4%
5%
31%
41%
0% 10% 20% 30% 40% 50% 60% 70% 80% 90% 100%
All adults
People with disability
All adults
People with disability
All adults
People with disability
All adults
People with disability
Age
15-
24A
ge 2
5-44
Age
45-
64A
ge 6
5+
Single Married Separated (incl. deserted) Widowed
Figure 4.2 looks in more detail at the link between marital status and type of disability for those in the 25 to 44 age group. We can see that the group least likely to marry are those with an intellectual & learning disability (83 per cent remain single in the 25 to 44 age group), followed at some distance by those with a psychological or emotional condition (63 per cent are single). On average, 47 per cent of the general population aged 25 to 44 years are single and 48 per cent are married. Among people with disabilities, those most likely to marry are people with ‘Other, including chronic illness’ (41 per cent), people with a condition substantially limiting physical activity (39 per cent married) and people with a sensory (hearing or vision) impairment (38 per cent married). Figure 4.2: Marital Status by Type of Disability for Adults Aged 25 to 44 (percentages)
Source: CSO, 2007b, Table 6, Census of Population Sample
47%
57%
54%
51%
83%
63%
51%
48%
35%
38%
39%
13%
27%
41%
0% 20% 40% 60% 80% 100%
All Adults
All people with disability
Sensory impairment
Physical activity impairment
Learning or intellectual disability
Psychological /emotional condition
Other, including chronic illness
Single Married Separated (incl. deserted) Widowed
Since people with a disability are less likely to marry, we would expect that a relatively greater proportion of them live alone. Figure 4.3 gives an overview of the living arrangements, in private households, for

The Social Environment
men and women (aged 15 and over) with a disability, and also shows the percentage living in communal establishments. As we use data from the 2006 Census, the Census of Population definition of disability is used. Just under half of adult men and women with a disability live with a spouse and the proportion is similar for men and women. Women with a disability are somewhat more likely than men with a disability to live alone (20 per cent vs. 17 per cent). This is partly because women with a disability tend to be older, on average, than men with a disability, and older adults are more likely to live alone. Figure 4.3: Living Arrangements of Adults with a Disability, by Gender (percentages)
33
Source: CSO, 2007b, Tables 28, 30, 31, 33 and 36. Authors’ calculations. Census of Population definition of disability for those aged 15 and over
Communal, 9%
Communal, 12%
Living alone, 17%
Living alone, 20%
Head/Spouse, 49%
Head/Spouse, 49%
With parent(s), 15%
With parent(s), 8%
Others, 10%
Others, 11%
0% 10% 20% 30% 40% 50%
% Men
% Women
Women with a disability are also more likely to live in communal establishments (12 per cent vs. 9 per cent). This, again, is driven by the different age profiles of men and women with a disability. Data from the Census shows that up to the age of 64, there are more men than women with a disability living in communal establishments. This is dramatically reversed in the over-65 age group where more than twice as many women as men live in communal establishments (CSO, 2007b, Table 28). Adult men with a disability are more likely than women to live with parents (15 per cent vs. 8 per cent). This is not entirely a function of the different age profiles of men and women with a disability. The percentage of young adults (aged 15 to 24) with a disability living with parents is higher for men than women (80 vs. 70 per cent), but the gender difference is greater for adults aged 25 and over (9 per cent of men and 5 per cent of women live with parents; CSO, 2007b, Table 36). Similar proportions of men and women live with others (10 to 11 per cent). Help with Everyday Activities We now turn to the National Disability Survey and the Census/NDS definition of disability to examine how much help people with disabilities need with daily activities. Figure 4.4 shows the percentage of people with a disability in private households who receive help with everyday activities. This is broken down by gender and age group. Among children with a disability, boys and girls are about equally likely to receive help with everyday activities (just over half). Among adults with a disability, women are somewhat more likely to receive help than men. The proportion of adults receiving help with everyday activities rises slowly with age, reaching 77 per cent of women and 68 per cent of men aged 75 and over.
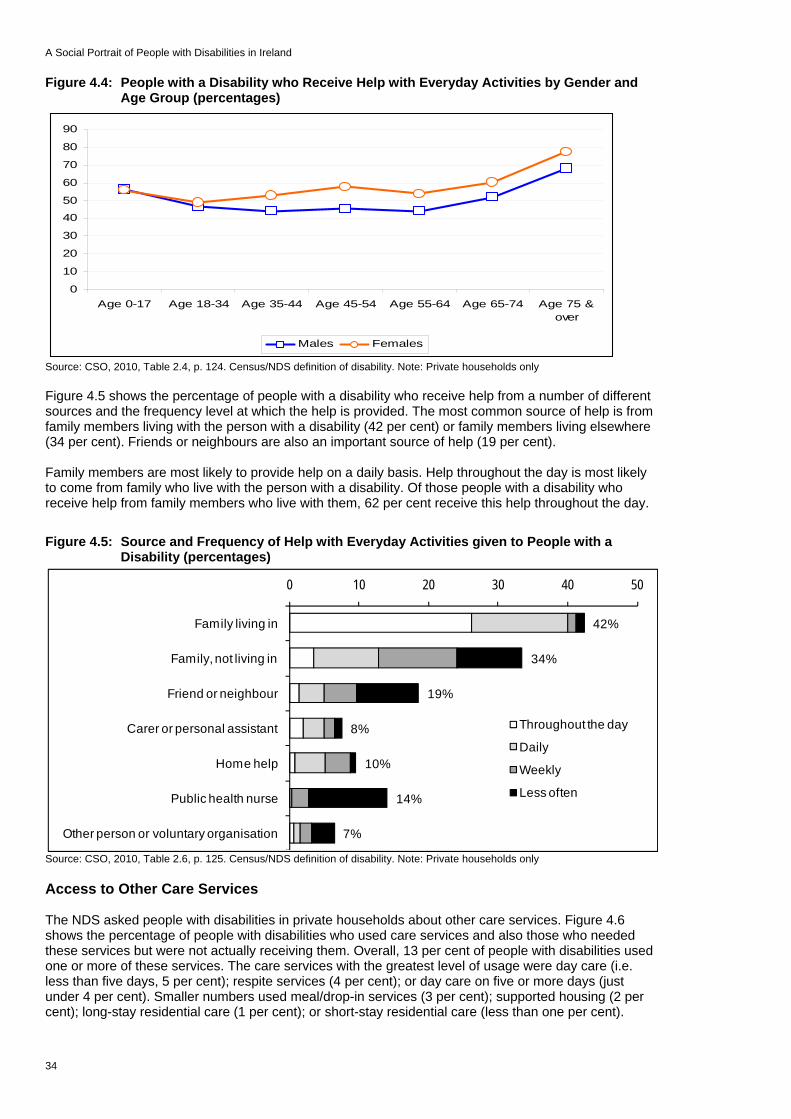
A Social Portrait of People with Disabilities in Ireland
Figure 4.4: People with a Disability who Receive Help with Everyday Activities by Gender and Age Group (percentages)
0
10
20
30
40
50
60
70
80
90
Age 0-17 Age 18-34 Age 35-44 Age 45-54 Age 55-64 Age 65-74 Age 75 &over
Males Females
Source: CSO, 2010, Table 2.4, p. 124. Census/NDS definition of disability. Note: Private households only Figure 4.5 shows the percentage of people with a disability who receive help from a number of different sources and the frequency level at which the help is provided. The most common source of help is from family members living with the person with a disability (42 per cent) or family members living elsewhere (34 per cent). Friends or neighbours are also an important source of help (19 per cent). Family members are most likely to provide help on a daily basis. Help throughout the day is most likely to come from family who live with the person with a disability. Of those people with a disability who receive help from family members who live with them, 62 per cent receive this help throughout the day. Figure 4.5: Source and Frequency of Help with Everyday Activities given to People with a
Disability (percentages)
42%
34%
19%
8%
10%
14%
7%
0 10 20 30 40 5
Family living in
Family, not living in
Friend or neighbour
Carer or personal assistant
Home help
Public health nurse
Other person or voluntary organisation
Source: CSO, 2010, Table 2.6, p. 125. Census/NDS definition of disability. Note: Private households only
0
Throughout the day
Daily
Weekly
Less often
Access to Other Care Services The NDS asked people with disabilities in private households about other care services. Figure 4.6 shows the percentage of people with disabilities who used care services and also those who needed these services but were not actually receiving them. Overall, 13 per cent of people with disabilities used one or more of these services. The care services with the greatest level of usage were day care (i.e. less than five days, 5 per cent); respite services (4 per cent); or day care on five or more days (just under 4 per cent). Smaller numbers used meal/drop-in services (3 per cent); supported housing (2 per cent); long-stay residential care (1 per cent); or short-stay residential care (less than one per cent).
34

The Social Environment
Figure 4.6: Services Required by People with a Disability (percentages)
3.7
4.7
2.8
1.4
1.7
4.1
13.2
2.7
2.8
2.6
1.1
1.1
1.9
3.7
8.0
0 5 10 15 20 25
Day care - 5 days
Day care <5 days
Meal/ drop-in centre
Residential care - 5 days
Residential care long-stay
Supported housing
Respite service
Any service
Source: CSO, 2010, Tables 2.15 p. 131 and 2.13 p. 133, Census/NDS definition. Note: Private households only
Receiving
Need but do not receive
Eight per cent of people with disabilities in private households needed, but did not use, some of these care services. The service that people needed most often was respite care (3.7 per cent), with between 2 and 3 per cent needing day care or meal/drop-in services. Almost 2 per cent needed supported housing and about 1 per cent needed residential care (long-stay or less than 5 days). There were substantial differences by main type of disability in the percentage of people using these care services, with the highest usage among people with a speech disability (28 per cent) and an intellectual & learning disability (22 per cent). The lowest usage was among people with a hearing or pain disability (both 7 per cent) (CSO, 2010, Table 2.13, p. 131). People with speech disability were also over-represented among those who needed but did not use services (11 per cent), particularly respite services (8 per cent). In interpreting these findings, it is important to remember that most people with a disability have more than one type of disability and the services may be needed because of difficulties associated with the person’s other disability (see Table 1.1). There were smaller differences, by region, in the percentages of people who needed these services, with the figure being higher than elsewhere in the South-West (9.8 per cent) and South-East (8.9 per cent) and lower than elsewhere in the Border (6.8) and Dublin (7.3) regions (CSO, 2010, Table 2.15, p. 133). Figure 4.7 shows the proportion of men and women who needed help with everyday activities but were unable to access it in the month preceding the interview. The proportion is somewhat higher for women (8 to 14 per cent) than for men (6 to13 per cent), except among children and those aged 75 and over. In general, the proportion tends to be higher for younger than for older adults. Figure 4.7: People with a Disability Unable to Access Help needed with Everyday Activities by
Gender and Age Group (percentages)
35
Source: CSO, 2010, Table 2.16, p. 134. Census/NDS definition of disability. Note: Private households only; unable to access needed service in previous month
02468
10121416
Age 0-17 Age 18-34 Age 35-44 Age 45-54 Age 55-64 Age 65-74 Age 75 & overMales Females

A Social Portrait of People with Disabilities in Ireland
Women with a disability, in the 35 to 44 year age group, experience the greatest difficulty in accessing help with everyday activities (14 per cent). In the case of males with a disability, it is boys under the age of 17 (13 per cent) and men aged 45 to 54 (11 per cent) who have the greatest difficulties in accessing the help needed. Attitudes of Other People The NDS contained two questions on the attitudes of other people, which were asked of people with a disability in the form of a direct interview (i.e. not by proxy). Figure 4.8 shows the responses to the first of these questions: ‘3.1: Are there things that you are able to do, that you sometimes avoid doing, because of how other people react?’ The figures are shown separately for males and females and are broken down by age group. In general, the attitudes of other people do not stop people with a disability from doing things they would otherwise do. We can see in Figure 4.8 that the attitudes of other people tend to be more of an issue for young adults, particularly for men with a disability in the 35 to 44 age group. Almost one in seven ‘frequently’ or ‘always’ avoids doing things because of the attitudes of other people. This is true of about one in eight women under the age of 54. The proportion falls with age, however. Fewer than one in 20 of those aged 65 and over frequently avoid doing things because of the attitudes of other people. Figure 4.8: Percentage who Avoid Doing things because of Attitudes of Other People by Gender
and Age group
36
Source: CSO, 2010, Table 3.1, p. 137. Note: frequently or always avoid doing things they would otherwise do
02468
10121416
Age 18-34 Age 35-44 Age 45-54 Age 55-64 Age 65-74 Age 75 & over
Males Females
Figure 4.9 shows the percentage of people with each type of disability who avoid doing things they would otherwise do because of the attitudes of other people. These figures are suggestive only because, as we saw in Chapter 1, most people with a disability have more than one type of disability. The proportion who avoid doing things is highest among those with emotional, psychological & mental health difficulties (one in six), followed by people with an intellectual & learning disability (about one in ten) and people with a speech disability (about one in 13). Figure 4.9: Percentage with Main Disability Type who Avoid Doing Things because of the
Attitudes of Other People (percentages)
Source: CSO, 2010, Table 3.2, p. 138. Note: frequently or always avoid doing things they would otherwise do because of attitudes of other people
2.24.5
7.85.2
6.89.7
16.65.3
4.4
0 5 10 15 20
SeeingHearingSpeech
Mobility & dexterityRemembering & concentrating
Intellectual & LearningEmotional, psychological & …
PainBreathing

The Social Environment
We now turn to the second question on attitudes: ‘3.2: Do the attitudes of the following people towards your disability generally support or hinder you?’ Figure 4.10 shows whether the attitudes of other people generally support or hinder the person with a disability. Note that the percentages where the attitudes of the other people are ‘not relevant’ (such as employers’ attitudes, for someone who is not employed) or have ‘no impact’ are not shown. In general, the attitudes of all groups of other people (family, friends, peers/colleagues/neighbours, employers, everyday service providers, public service providers, health service/care providers and others) are supportive rather than hindering. Family, health service and care providers and friends are most likely to be supportive (over eight in ten). Employers are least likely to be supportive. But this is because their attitudes are not relevant for most people with a disability, rather than because of a problem or an issue with employers’ attitudes. Figure 4.10: Whether Attitudes of Certain People Generally Support or Hinder (percentages)
37
Source: CSO, 2010, Table 3.3, p. 139. Note: ‘Do the attitudes of the following people towards your disability generally support or hinder you?’ ‘No impact’ and ‘not relevant’ are excluded
90%
79%
50%
14%
38%
37%
87%
21%
2%
1%
3%
10%
5%
7%
2%
4%
100% 80% 60% 40% 20% 0% 20% 40% 60% 80% 100%
-100.00%
Family
Friends
Peers/ co-workers / neighbours
Employers
Everyday service providers
Public service providers
Health service & care providers
Others
Support
Hinder
Figure 4.11 shows the percentage of people with a disability who are hindered by the attitudes of other people by gender and age group. As we saw earlier, younger people with a disability are more affected than older people. The percentage hindered by the attitudes of other people is higher for women than for men, but the gap narrows in the oldest age group. Almost one woman in four with a disability under the age of 44 is hindered by the attitudes of at least some other people. The figure for men with a disability in this age group is almost one in five. The proportion hindered by the attitudes of others drops to fewer than one in twenty for both men and women aged 75 and over. Figure 4.11: Percentage of Males and Females by Age Group Hindered by the Attitudes of
Others
Source: CSO, 2010, Table 3.6, p. 142
0
5
10
15
20
25
Age 18-34 Age 35-44 Age 45-54 Age 55-64 Age 65-74 Age 75 & over
Males Females

A Social Portrait of People with Disabilities in Ireland
The groups of people whose attitudes are most likely to hinder young adults differ for men and women (CSO 2010, Table 3.6). Females aged 18 to 34 are most likely to be hindered by public service providers (7.8 per cent) and employers (7.1 per cent). Men with a disability in this age group are most likely to be hindered by the attitudes of public service providers (6.1 per cent) and peers/colleagues/neighbours (5.2 per cent). In general, people with a disability are less likely to feel hindered by the attitudes of health service providers. Women are more likely than men to feel hindered by the attitudes of this group (2.3 per cent compared to 1.2 per cent) (CSO, 2010, Table 3.6). The fall with age in the percentage hindered by the attitudes of other people is likely to reflect the changing roles people perform at different life cycle stages. As people reach retirement age, the attitudes of employers, for instance, become less important and the attitudes of health service providers become more important. Experience of Discrimination The attitudes of other people can have a significant impact on people with a disability particularly when the other people are in positions of power, such as in the workplace, or in the provision of a service that the individual needs. Some very useful information on this issue can be found in an analysis of the 2004 Equality Module to the Quarterly National Household Survey of discrimination in Ireland by Russell et al. (2008). The authors examine the subjective experience of discrimination across a number of domains over the previous two years. The measure of disability used is the same as that in the 2006 Census (see Figure A.1 in Appendix 1), so it is likely to include some people who would not have met the threshold of the NDS. Russell at al. found that disability was one of the strongest predictors of discrimination. The authors found that 19.5 per cent of people with a disability reported discrimination, compared to 12.5 per cent of the general population (Russell et al., 2008, Table 4.1). Within specific domains, however, the gap between people with a disability and people without a disability is even larger, when other factors are controlled. Figure 4.12 shows the odds of a person with a disability experiencing discrimination relative to the odds for a person with no disability. These figures are based on models with other factors controlled. 28 Figure 4.12: Odds of People with a Disability having experienced Discrimination relative to
People Without a Disability
5.4
5.2
2.9
2.8
2.6
2.5
2.4
1.9
1.7
0.0 1.0 2.0 3.0 4.0 5.0 6.0
Accessing health services
Using transport services
In shops, pubs or restaurants
In the workplace
Accessing other public services
Using services of banks, insurance etc.
Obtaining housing or accommodation
While looking for work
In relation to education
Source: Russell et al, 2008, Table A2.1 and Table A2.2 (pp 29-30). Note: The figures show the odds of people with a disability having experienced discrimination in each area relative to people without a disability
38
28 Controls include gender, age, marital and family status, ethnicity, nationality, religion, education and economic status.

The Social Environment
39
With other factors controlled, people with a disability were 1.7 times as likely to report discrimination in relation to education as people with no disability. They were over five times as likely to report having experienced discrimination in relation to accessing either health services or transport services. Given, as we saw in Chapter 2, that people with a disability are more likely to report poor health, the experience of discrimination in accessing health services is likely to be especially salient for them. People with a disability are also more likely to report having experienced discrimination:
In shops, pubs and restaurants (2.9 times as often as people without a disability) In the workplace (2.8 times) In using financial services such as banks and insurance companies (2.6 times) In obtaining housing or accommodation (2.4 times) In accessing other public services (2.6 times), and In looking for work (1.9 times).
Russell et al. found that people with disabilities also report a greater incidence of repeat discrimination. Seventy-seven per cent of those who experienced discrimination reported that it occurred more than once and 35 per cent said the experience had a serious impact on their lives (ibid, p. xii). Although people with a disability experiencing discrimination form a minority (over four out of five people with a disability had not experienced discrimination in the previous two years), their experience is important. This is not only because of the disadvantage and distress it causes them personally, but because their experience can colour and shape the way people with disabilities, in general, view the world and the treatment they anticipate from others. The anticipation of negative treatment is likely to make people with a disability slow to access services and reluctant to aspire to employment. Participation in Social Activities Some useful information relating to social participation and involvement in the community was obtained from the 2001 Living in Ireland Survey (Gannon and Nolan, 2005). This covered whether the respondent was a member of a club or organisation; how often he or she talked to neighbours; how often he or she met friends or relatives (living outside the household); whether he or she had an afternoon or evening out in the last fortnight that cost money; and whether he or she intended to vote in the next general election. The responses showed that those reporting the presence of a severely hampering, chronic illness or disability have much lower levels of participation than others. Statistical analysis (reported in Gannon and Nolan, 2005) shows that this remains true when other differences between this group and the rest of the sample (such as in age or education level) are taken into account. A telephone survey of a nationally representative sample, commissioned by the NDA and carried out in 2004, also showed that those with a disability were substantially less likely than others to have had a social outing or a visit to friends or family in the previous week (see NDA, 2006). Drawing on social participation data from the 2006 NDS/Census, the CSO reports that people with a disability are somewhat less likely than other adults to be involved in community and voluntary groups (23 per cent of people with a disability compared to 29 per cent of other adults). However, it finds no significant difference in civic participation (CSO, 2009c, p. 14). While most people with a disability have at least weekly contact with relatives (82 per cent) and friends (78 per cent), the figures are slightly lower than those for other adults (85 per cent have weekly contact with relatives and 89 per cent with friends). On the other hand, people with a disability were more likely to speak to neighbours at least once a week (83 per cent vs. 77 per cent) (CSO, 2009c, pp 28-29). Results from the NDS show that most people with a disability in all age groups participate in social activities. Participation is slightly higher among women (96 per cent) than among men (95 per cent) and is slightly higher for younger adults. For instance, 97 per cent of adults under the age of 35 participate in social activities. This compares to 91 per cent of adults aged 75 and over (CSO, 2010, Table 8.1, p. 268). Using data from the NDS, Figure 4.13 shows the percentage of people with a disability who do not participate in social activities. This is broken down by gender and age group. For both men and women, non-participation is highest among those over the age of 75 (8 per cent). Among younger adults, men are more likely than women not to participate in any social activities, particularly in the 35 to 44 and 45 to 54 age groups (5 to 6 per cent).
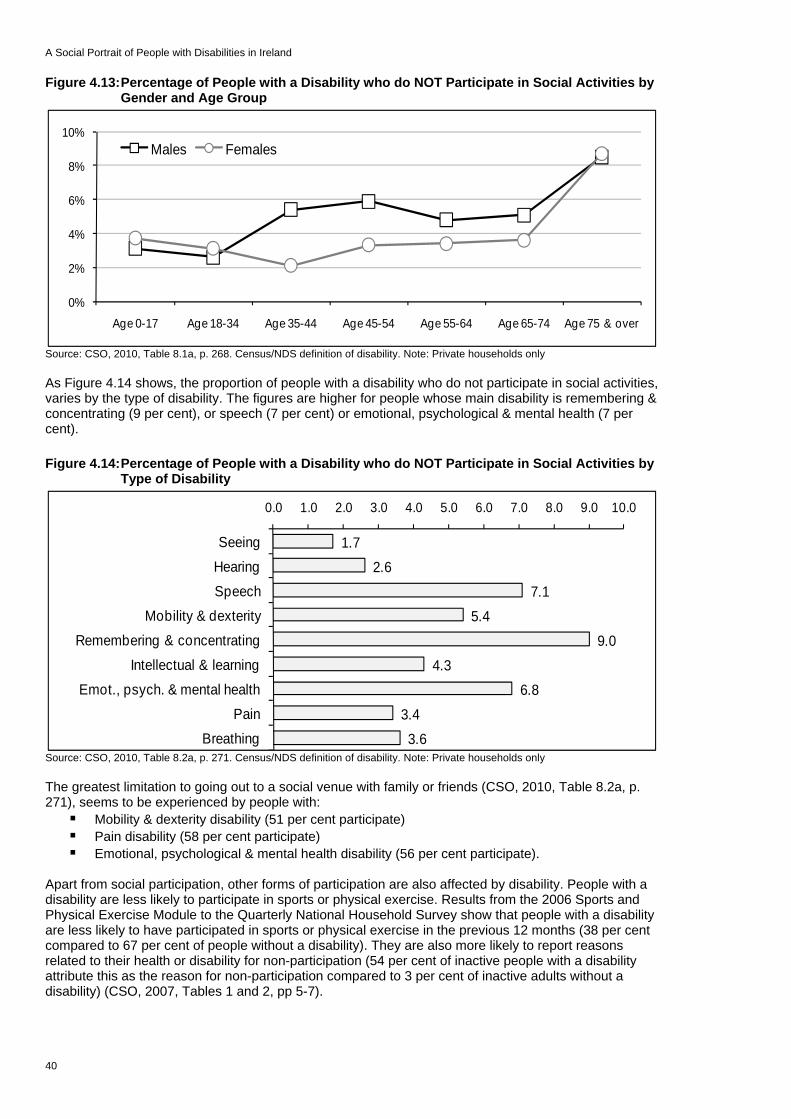
A Social Portrait of People with Disabilities in Ireland
Figure 4.13: Percentage of People with a Disability who do NOT Participate in Social Activities by Gender and Age Group
40
Source: CSO, 2010, Table 8.1a, p. 268. Census/NDS definition of disability. Note: Private households only
0%
2%
4%
6%
8%
10%
Age 0-17 Age 18-34 Age 35-44 Age 45-54 Age 55-64 Age 65-74 Age 75 & over
Males Females
As Figure 4.14 shows, the proportion of people with a disability who do not participate in social activities, varies by the type of disability. The figures are higher for people whose main disability is remembering & concentrating (9 per cent), or speech (7 per cent) or emotional, psychological & mental health (7 per cent). Figure 4.14: Percentage of People with a Disability who do NOT Participate in Social Activities by
Type of Disability
Source: CSO, 2010, Table 8.2a, p. 271. Census/NDS definition of disability. Note: Private households only
1.72.6
7.1
5.4
9.0
4.36.8
3.4
3.6
0.0 1.0 2.0 3.0 4.0 5.0 6.0 7.0 8.0 9.0 10.0
Seeing
Hearing
SpeechMobility & dexterity
Remembering & concentrating
Intellectual & learning
Emot., psych. & mental healthPain
Breathing
The greatest limitation to going out to a social venue with family or friends (CSO, 2010, Table 8.2a, p. 271), seems to be experienced by people with:
Mobility & dexterity disability (51 per cent participate) Pain disability (58 per cent participate) Emotional, psychological & mental health disability (56 per cent participate).
Apart from social participation, other forms of participation are also affected by disability. People with a disability are less likely to participate in sports or physical exercise. Results from the 2006 Sports and Physical Exercise Module to the Quarterly National Household Survey show that people with a disability are less likely to have participated in sports or physical exercise in the previous 12 months (38 per cent compared to 67 per cent of people without a disability). They are also more likely to report reasons related to their health or disability for non-participation (54 per cent of inactive people with a disability attribute this as the reason for non-participation compared to 3 per cent of inactive adults without a disability) (CSO, 2007, Tables 1 and 2, pp 5-7).
The Social Environment
41
Results from the NDS show that 45 per cent of men and 36 per cent of women with a disability participated in sports or physical exercise in the previous four weeks, and that the percentage participating is strongly related to age. For example, 83 per cent of boys and 79 per cent of girls with a disability, under the age of 18, participated in sports over the four weeks prior to the survey. This decreased to 24 per cent of men and 16 per cent of women aged 75 and over (CSO, 2010, Table 9.7, p. 311). The detailed information on participation provided in the NDS shows the importance of different modes of communication for people with particular types of disability. For instance, using the internet is relatively more important for people with a hearing disability (32 per cent) and for people with an intellectual & learning disability (37 per cent) than for all other people with a disability (25 per cent). While almost 80 per cent of all people with a disability communicate by telephone, email, text, or writing, this figure drops to 67 per cent for people with an intellectual & learning disability. Summary In this chapter, we examined the social environment of people with disabilities, including marital status, living arrangements, attitudes of other people, accessing help and social participation. We saw that people with a disability are less likely than the general population to be married and that older adults with a disability are more likely to be widowed. The most marked difference by type of disability was the higher percentage of people with an intellectual & learning disability who remain single. In general, the attitudes of other people, especially family and friends are supportive. Most people with a disability participate in social activities. We also found that most people with a disability who need help with everyday activities are able to get it. However, some groups of people with a disability are more likely to encounter problems in these areas. Of course, even where people are generally supportive, people with a disability may experience discrimination in particular instances. We saw that people with a disability were more likely than people without a disability to have experienced discrimination in the previous two years. The gap was particularly marked for access to health and transport services. As well as the social environment, aspects of the physical environment may either hinder or facilitate the participation in social life of people with a disability. The physical environment and transport are the focus of the next chapter.

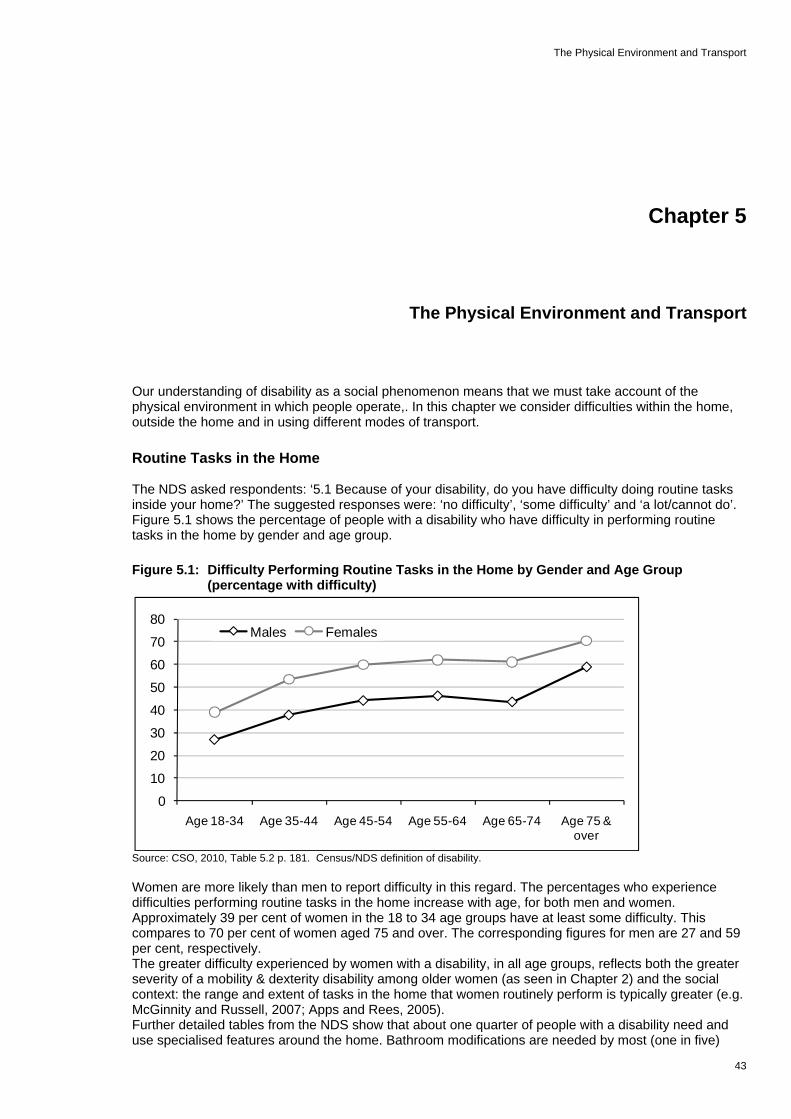
The Physical Environment and Transport
43
Chapter 5
The Physical Environment and Transport Our understanding of disability as a social phenomenon means that we must take account of the physical environment in which people operate,. In this chapter we consider difficulties within the home, outside the home and in using different modes of transport. Routine Tasks in the Home The NDS asked respondents: ‘5.1 Because of your disability, do you have difficulty doing routine tasks inside your home?’ The suggested responses were: ‘no difficulty’, ‘some difficulty’ and ‘a lot/cannot do’. Figure 5.1 shows the percentage of people with a disability who have difficulty in performing routine tasks in the home by gender and age group. Figure 5.1: Difficulty Performing Routine Tasks in the Home by Gender and Age Group
(percentage with difficulty)
Source: CSO, 2010, Table 5.2 p. 181. Census/NDS definition of disability.
0
10
20
30
40
50
60
70
80
Age 18-34 Age 35-44 Age 45-54 Age 55-64 Age 65-74 Age 75 & over
Males Females
Women are more likely than men to report difficulty in this regard. The percentages who experience difficulties performing routine tasks in the home increase with age, for both men and women. Approximately 39 per cent of women in the 18 to 34 age groups have at least some difficulty. This compares to 70 per cent of women aged 75 and over. The corresponding figures for men are 27 and 59 per cent, respectively. The greater difficulty experienced by women with a disability, in all age groups, reflects both the greater severity of a mobility & dexterity disability among older women (as seen in Chapter 2) and the social context: the range and extent of tasks in the home that women routinely perform is typically greater (e.g. McGinnity and Russell, 2007; Apps and Rees, 2005). Further detailed tables from the NDS show that about one quarter of people with a disability need and use specialised features around the home. Bathroom modifications are needed by most (one in five)

A Social Portrait of People with Disabilities in Ireland
44
(CSO, 2010, Table 5.4, p. 182). However, over one in five people with a disability need modifications within the home but do not have them (CSO, 2010, Table 5.9, p. 187). The most common reason for this is that they do not have the money or are not eligible for a grant. Fewer than 10 per cent ever received a grant for house adaptations (CSO, 2010, Table 5.11, p. 189). Access outside the Home The NDS asked respondents about access difficulties outside the home in a number of areas. These included:
Visiting family or friends Socialising in a public venue Moving out and about in the local area Availing of general services (e.g. shopping and banking) Government offices Availing of medical care (hospital, dentist, doctor) Access to the workplace (where relevant).
The second NDS report on needs showed that most access problems arose in three areas: when socialising in public venues, availing of general services, or moving about in the local area (36 to 37 per cent, CSO, 2010, Table 5.12, p. 63). A substantial minority also experienced access difficulties in visiting family and friends and in availing of medical care (26 to 29 per cent). A much smaller proportion experienced difficulties in access to the workplace (2 per cent). Figure 5.2 shows the percentage of people with a disability who experience difficulty in accessing any of these activities by gender and age group. Women are more likely to have access difficulties than men and the gap widens with age. For instance, 28 per cent of men and 31 per cent of women aged 18 to 34 with a disability have at least some access-related difficulties. This rises to 62 per cent of men and 71 per cent of women after the age of 75. Figure 5.2: Access Difficulties Experienced by Adults with a Disability by Gender and Age Group
(percentages)
Source: CSO, 2010, Table 5.14, p. 192
01020304050607080
Age 18-34 Age 35-44 Age 45-54 Age 55-64 Age 65-74 Age 75 & over
Males Females
There are some differences across age groups in the types of activities presenting access problems. Socialising in public venues tends to present access difficulties most often for young adults, while accessing general services and moving about in the local area tend to be most often associated with accessibility difficulties among the oldest adults (CSO, 2010, p.192).

The Physical Environment and Transport
45
Transport Figure 5.3 shows the use of different modes of transport by people with a disability and the level of difficulty they experience in using these modes, by gender and age groups. In general, what is striking is the level of non-use of the different modes by people with a disability, rather than the proportions who use each mode with difficulty. Figure 5.3: Use and Level of Difficulty of different Modes of Transport for People with a
Disability aged 5 and over (percentages)
Source: CSO, 2010, Table 4.9, p.166, Table 4.1, p. 149, Table 4.19, p. 176. People with a disability living in private households only
57
20
65
75
74
64
75
76
75
86
32
64
28
21
22
31
22
21
22
13
8
13
5
4
0% 10% 20% 30% 40% 50% 60% 70% 80% 90% 100%
Private car - driver
Private car - passenger
City bus
Inter-city bus
Rural bus
Taxi/hackney
DART/LUAS
Commuter train
Inter-city train
Specialised Transport
Do not use regularly
Use, no dif f iculty
Use, some dif f iculty
Use, a lot/extreme dif f iculty
The mode of transport used most often by people with a disability is the car, as a passenger. About 8 out of 10 people with a disability use this mode regularly. Over 6 in 10 have no difficulty as a car passenger. One in eight has some difficulty as a car passenger and 2 per cent have a lot of difficulty. Among adults with a disability, less than half regularly drive a car, about one third do so with no difficulty and 8 per cent do so with some difficulty. The most commonly-used forms of public transport are taxis/hackneys (36 per cent) and city buses (35 per cent). Again, most people who use these modes of transport do so without any difficulty. Other modes of transport, regularly used by about one in four people with a disability include: inter-city bus, rural bus, DART/LUAS, commuter train and inter-city train. Most people who use these modes of transport have no difficulty in using them. People with a disability who did not regularly use a private car – either as a driver or as a passenger – were asked whether the reason was related to their disability. Overall, 22 per cent of adults with a disability, living in private households, did not drive a car because of their disability. Eight per cent of people with a disability did not regularly use a car as a passenger because of their disability (CSO, 2010, p. 46). A similar pattern was found for people with a disability who do not use public transport. The reason is more often not directly related to the disability (CSO, 2010, Table 4.11, p. 168). Almost one third of people with a disability do not regularly use public transport for reasons that are unrelated to their disability. Fourteen per cent do not use public transport for reasons that are related to their disability. The proportion not using public transport for reasons related to their disability was higher (22 per cent) for people with a mobility & dexterity disability (CSO, 2010, p. 17). Nevertheless, just under one person in four with a disabilities, either does not use, or has a difficulty using public transport for accessibility reasons. A similar proportion experience barriers due to service-related reasons. Accessibility reasons include: getting on or off; transferring between services; getting to the stop or station; and the availability of public transport in the area. Service-related reasons include needing someone to accompany the person with a disability, overcrowding and cost. Just under one person in ten with a disability does not use or has difficulty using public transport for information-related reasons. These include difficulty in hearing announcements or seeing signs.

A Social Portrait of People with Disabilities in Ireland
46
Among those who had difficulty using public transport, or who did not use public transport for reasons related to their disability:
Sixteen per cent cited difficulties in getting on or off the vehicle Twelve per cent cited difficulties in transferring from one service to another Nine per cent cited difficulties in getting to the bus or LUAS stop or train station (CSO, 2010, p.
17). We saw, in the previous chapter that people with a disability were more likely than non-disabled adults to relate that they had been subject to discrimination over the previous two years (19.5 per cent compared to 12.5 per cent). The gap between people with a disability and the general population, in this respect, is larger for access to health and transport services (Russell et al., 2008). Although the risk of having experienced discrimination in access to transport was low overall (0.7 per cent for the general population compared to 4 per cent in access to housing, and 3.7 per cent in access to financial services), people with a disability were five times more likely than people without a disability to experience such discrimination (Russell et al., 2008, Table A2.2, p. 30). Apart from discrimination, people with a disability may also have difficulty in using public transport or may not use it at all. Figure 5.4 shows the proportion of people with a disability, aged 5 and over, living in private households, who do not use or have difficulty using public transport. These are broken down by region and the broad reason for the difficulty. Figure 5.4: Percentage of People with a Disability aged 5 and over who Have Difficulty Using
Public Transport by Region
Source: CSO, 2010, Tables 4.16, to 4.18, pp. 173-175; people with a disability living in private households only
25%
24%
24%
25%
24%
24%
23%
21%
24%
20%
24%
24%
28%
23%
26%
22%
22%
24%
9%
12%
12%
9%
11%
11%
11%
8%
10%
0 5 10 15 20 25 30
Border
Midland
West
Dublin
Mid-East
Mid-West
South-East
South-West
All Regions
Accessibility
Service-related
Information
In general, the percentage of people with a disability who do not use, or have difficulty in using public transport for accessibility reasons, is similar across regions. However, it is somewhat lower in the South-West (21 per cent). Service-related reasons are cited most frequently in Dublin (28 per cent). In Dublin, overcrowding and the need for someone to accompany the person are more often cited than elsewhere. Information-related reasons are somewhat less often cited in the South-West (8.1 per cent) and the Border (8.6 per cent) regions.
The Physical Environment and Transport
47
Summary The social model of disability emphasises the importance of context, as well as the person’s physical and mental resources. In this chapter, we examined the physical environment and transport. We saw that women and older people with disability are most likely to have difficulty in performing routine tasks in the home. This reflects both the greater severity of a mobility & dexterity disability in older adults, and also the different social expectations of women and men in the home. The range and extent of tasks that women routinely perform in the home is greater. Women and older adults are also more likely to experience difficulty outside the home, due to access difficulties. In this case, the gender gap widens with age. Most men and women with a disability in the oldest age group experience at least some access difficulties. The mode of transport that most people use regularly is the private car, as a passenger. The biggest group of people with a disability (64 per cent) use this mode without any difficulty. People with a disability are much less likely to use public transport. The percentages who use public transport range from 24 per cent for commuter trains to 35 per cent for city buses. Most people with a disability who use these modes of transport do so without any difficulty. Nevertheless, figures from the NDS show that 24 per cent of people with a disability either avoid using or have difficulty using public transport for reasons related to accessibility. A similar proportion report service-related reasons, while 10 per cent report information-related reasons. It is likely, then, that people with a disability who have significant difficulty with a mode of transport are more likely to avoid using it, on a regular basis, rather than try to cope with the difficulties they encounter.


Conclusion and Policy Implications
49
Chapter 6
Conclusion and Policy Implications In this chapter, we draw together some of the key results on the situation of people with a disability in order to highlight the main challenges for policy. Disability and Ageing The association between disability and ageing was very clear in Chapter 1. Apart from intellectual & learning, and speech disabilities, all other forms of disability increase with age, particularly after the age of 50 to 55. By the age of 75 and over, 41 per cent of women and 33 per cent of men experience some level of disability, according to the Census/NDS definition. This is because most disability is acquired throughout the life course, often resulting from disease or illness, rather than being present from childhood. The level of difficulty associated with disability also increases with age, so that by the age of 75, most men and women with a disability have difficulty in performing routine tasks in the home. Because disability is more prevalent among older adults, there is a sense in which some reduction in activities has become the norm for this age group. One consequence of this is that older adults with a disability are less likely than their younger counterparts to report that they are hindered by the attitudes of other people to their disability. They are also more likely than younger adults to have no difficulty in obtaining the help they need with everyday activities. On the other hand, while the majority of adults with a disability participate in at least some social activities, the proportion of older adults with a disability who do not participate is somewhat higher than the proportion of younger adults who do not participate. Because the severity of their limitation tends to be greater, older adults with a disability may be at greater risk of social isolation. The challenge of facilitating the full participation of people with disabilities in social life is likely to become greater, as the population ages. Children with Disability Although the prevalence of disability is lower among children, children with disability are likely to face particular challenges in terms of schooling and preparation for adult life. The National Disability Survey (NDS) indicates that 3.5 per cent of children have a disability and that disability is more common among boys (4.4 per cent) than among girls (2.6 per cent). The type of disability experienced by children is also different to that experienced by adults with a disability. While mobility & dexterity and pain disabilities are the most common among adults, intellectual & learning and remembering & concentrating disabilities are most common among children. The National Disability Survey indicates that17,900 boys and 9,100 girls have an intellectual & learning disability and 11,900 boys and 6,000 girls have a remembering & concentrating disability. The salience of these types of disability among children arises because these disabilities create particular challenges in their roles as students. Since most disability is acquired over time, the proportion of people with a disability who report that this impacted on the completion of their education is higher for younger adults than for older adults with a disability. Among people with a disability between the ages of 18 and 34, 64 per cent of men and 59 per cent of women were affected by their disability before finishing school or college.

A Social Portrait of People with Disabilities in Ireland
50
Another significant respect in which young adults differ from older adults with a disability is that they are more likely to limit their activities because of the attitudes of other people. This is likely to arise because, as noted above, some degree of limitation is more common among older people. While the reports from the NDS do not indicate whether children also limit their activities because of the attitudes of other people, it may well be the case. The challenge for society and the educational system is to adapt to the needs of children and young people with a disability and to accept their differences, while enabling them to maximise their achievements. Education and Work We saw in Chapter 3 that people with a disability are very disadvantaged in terms of educational achievement, participation in employment and living standards. Among those between the ages of 25 and 29, for instance, only 3 per cent of people without a disability finished schooling with primary education or less. This compared to 19 per cent of people with a disability in the same age group. As noted above, among people with a disability, 45 per cent of men and 37 per cent of women under the age of 45 were affected by their disability before they had completed their education. This percentage drops to about 7 per cent for both men and women in the 65 to 74 age group. Two per cent of both men and women with a disability, aged 75 and over, were affected by this before completion of their education. We noted that educational disadvantage and disability bear a reciprocal relationship. While the relationship between disability and education in the youngest cohort of adults is likely to be mainly driven by the barriers to completing education associated with the disability, the pattern in the older age group is likely to be mainly a result of the negative health impact of life circumstances ensuing from educational disadvantage. Labour force participation is an important goal for people with disabilities. As with all vulnerable groups this is one of the primary routes out of poverty. It is also an important means of participating in the social world. Figures from the Census indicate that people with a disability are only half as likely as the general population between the ages of 25 and 64 to be at work (35 per cent according to the Census of Population measure of disability compared to 73 per cent of all adults). The NDS reveals that among people with a disability, those with intellectual & learning disabilities are most likely to be at work and those with a disability leading to pain are least likely to be at work. At the same time, 37 per cent of people with a disability who are not at work would be interested in a job. This figure is higher for young adults with a disability (almost two thirds). Other results from the NDS on the working pattern of people with a disability confirm the importance of flexible work arrangements as an enabling factor for workforce participation. Twenty-eight per cent of people with a disability work part-time compared to 17 per cent of the general population. Those at work, or interested in work, identified aspects of the organisation of work – such as flexible working arrangements or modified job tasks – as being important. On the other hand, those not interested in work most often stated the belief that there were no suitable jobs available as a reason for not participating in the workforce. Given these disadvantages in educational and work terms, combined with the additional costs associated with many types of disability, it is not surprising that people with a disability are at a higher risk of experiencing poverty. Although the Survey of Income and Living Conditions (EU-SILC) on which we rely for national estimates of poverty risk, does not specifically measure disability, it does have two items that capture relevant data. The EU-SILC identifies respondents who suffer from any chronic (long-standing) illness or condition. It also has a separate item on whether the respondent was limited in activities people generally perform, because of a health problem, in the previous six months. The EU-SILC results indicate that there is a heightened poverty risk for people who had a chronic illness or were limited in their activities. A household is considered to be in consistent poverty if that household reports basic deprivation (i.e. is lacking certain goods and services generally deemed to be necessities) as well as being below the poverty income threshold. In 2009, the consistent poverty rate was 5.5 per cent for those reporting a chronic illness or health problem and 7.8 per cent for those whose activities

Conclusion and Policy Implications
51
were severely limited in the previous six months. This compared to 4.3 per cent for adults whose activities are not limited. These poverty measures take no account of the additional costs associated with the disability itself. Some recent research suggests that the additional costs amount to just under one third of the average household income (Cullinan, Gannon and Lyons, 2010). If the poverty figures were adjusted to take account of these additional costs, the poverty rates of people with a disability would be even higher. The challenge for society is to understand how much people with disabilities can contribute in the world of work. The range of limitations and abilities among people with a disability is broad. Just as jobs are constantly being defined and re-defined, to meet the changing needs of the workplace in the context of technological change, jobs can also be re-defined to meet the differing needs and abilities of workers with a disability. The Social Environment We saw in Chapter 1 that disability is increasingly being understood as a social construct. What people can do and the level of difficulty they experience can be as much about their environment as about their personal abilities. In Chapter 4 we examined several aspects of the social environment. A central aspect of this is the relationship with an intimate partner and with family. We began, therefore, by examining the marital status and living arrangements of people with a disability. People with a disability are less likely than other adults to marry. Older people with a disability are more likely to be widowed. In the 25 to 44 age group, only 35 per cent of people with a disability are married. This compares to 48 per cent of the general population. People with an intellectual & learning disability are least likely to marry. Only 13 per cent of this group in the 25 to 44 age group is married. In the 45 to 64 age group, 41 per cent of people with a disability are widowed. This compares to 31 per cent of the general population. As with education, the effects are likely to operate in both directions. On the one hand, young adults with a disability may have fewer opportunities to meet a suitable partner. On the other hand, economic disadvantage and the trauma of the loss of a partner may contribute to the emergence of disability in later years. Almost one in ten people with a disability live in communal establishments. One fifth of women with a disability and one sixth of men with a disability live alone. Just under half of both men and women with disabilities live as the head or joint head of a family household. The attitudes of family (90 per cent) and friends (79 per cent) are almost always supportive. However, the attitudes of providers of public and everyday services are less likely to be supportive (36 to 38 per cent). Adults between the ages of 35 and 44 are most likely to be hindered by the attitudes of at least some other people. This applies to 23 per cent of women and 18 per cent of men with a disability in this age group. The percentage falls to less than 10 per cent of women and less than 5 per cent of men after the age of 65. In all age groups, women are more likely than men to report that they are hindered by the attitudes of at least some other people. We also saw in Chapter 4 that younger adults with a disability are most likely to limit their activities because of the attitudes of other people. Between 10 and 14 per cent of adults in the 18 to 44 age group ‘frequently’ or ‘always’ avoid doing things because of the attitudes of other people. This compares to 2 to 5 per cent of adults aged 65 and over. We also examined the issue of receiving help with everyday activities from other people. Among children with a disability, boys and girls are about equally likely to receive help with everyday activities (just over half). Among adults with a disability, women are somewhat more likely to receive help than men. The proportion of adults receiving help with everyday activities rises slowly with age, reaching 77 per cent of women and 68 per cent of men by the age of 75 and over. Most people with a disability who need help are able to receive it. However, 8 to 14 per cent of women and 6 to13 per cent of men are unable to get the help they need. The highest figures are for women in the 35 to 44 age group (14 per cent) and for boys under the age of 18 (13 per cent).

A Social Portrait of People with Disabilities in Ireland
52
Participation in social activities is an important element of social inclusion. More than nine out of ten people with a disability, in all age groups, participate in social activities. For both men and women, non-participation is highest for those over the age of 75 (8 per cent). Among younger adults, men are more likely than women not to participate in any social activities, particularly in the 35 to 44 and the 45 to 54 age groups (5 to 6 per cent). Since many people with a disability do not marry or have lost a partner, their need for social involvement in other areas is likely to be greater. Meeting the needs of people with disabilities is not just about the need for help with everyday activities. It is also about the need for companionship and social contact.
The Physical Environment and Transport Under this heading, we examined the difficulties experienced by people with a disability in doing routine tasks in the home, in accessing different types of activity outside the home, and in using different modes of transport. Women are more likely than men to have at least some difficulty in performing routine tasks in the home. For both men and women, the percentages with difficulty increase with age. They rise from 39 per cent of women and 27 per cent of men in the 18 to 34 age group to 70 per cent of women and 59 per cent of men aged 75 and over. The greater difficulty experienced by women with a disability reflects the greater severity of a mobility & dexterity disability among women, as we saw in Chapter 2. It also indicates the greater range and extent of tasks in the home that women routinely perform. The NDS also shows that one in five people with a disability needs, but does not have, modifications in the home to facilitate them in carrying out routine tasks (CSO, 2010, Table 5.9, p. 187). The NDS showed that people with a disability are most likely to experience access difficulties when socialising in public venues, availing of general services and moving about in the local area (36 to 37 per cent). Smaller, but still substantial percentages experience access difficulties in visiting family and friends and in availing of medical care (26 to 29 per cent). Women are more likely than men to experience access difficulties and this gap widens with age. We saw in Chapter 2 that, after the age of 65, women with a mobility & dexterity disability are more likely than men, with the same disability, not to be able to perform certain everyday tasks at all. The mode of transport most often used, on a regular basis by people with a disability is the car, as a passenger. About eight out of ten people with a disability use this mode regularly. Over six in ten have no difficulty as a car passenger. One in eight has some difficulty as a car passenger and 2 per cent have a lot of difficulty. Among adults with a disability, less than half regularly drive a car. About one third do so with no difficulty and 8 per cent do so with some difficulty. The mode of public transport most often used by people with a disability is a taxi or hackney. Forty-six per cent use this mode regularly and thirty-two per cent use it with no difficulty. Other modes of transport used regularly by about one person in four with a disability include inter-city bus, rural bus, DART/LUAS, commuter train and inter-city train. Most people who use these modes of transport have no difficulty in using them. Where people with a disability do not regularly use public transport, the reason is generally not related to their disability. Nevertheless, just under one person in four with a disability either does not use public transport at all, or has difficulty using it for reasons related to their disability. Overall, 24 per cent of people with a disability either do not use or have difficulty using public transport for accessibility reasons (for example, getting on or off, transferring between services, getting to the stop or station, or availability of the service in their area). The proportion of people with a disability who do not use, or have difficulty using public transport for service-related reasons, is also 24 per cent. Such reasons include: needing someone to accompany the person with a disability; overcrowding and cost. Information-related reasons (such as difficulty seeing signs or hearing announcements) were cited by one person in ten with a disability. In terms of the physical environment, the area where most people with a disability experience difficulty is in the home. There is scope for either additional help or physical modifications to improve access in the home.

Conclusion and Policy Implications
53
Outside the home, access difficulties are most common in public venues, accessing general services and moving about the local area. There is scope for improvements to access in these areas and also in access to medical services. Improvements to the accessibility of public transport or to services, more generally, could benefit up to one in four people with a disability. Such improvements could also benefit general users of these services.
Future Prospects and Data Needs The National Disability Survey (NDS) is a rich source of data on the circumstances of people with disability in Ireland. There are a number of areas of research that could be fruitfully examined when access to the micro-data becomes available. One such area is the nature of the link between disability and disadvantage in terms of education, work and living standards. It would be instructive to explore further the extent to which disability is a cause or consequence of disadvantage, or both. Information from the NDS on the age of onset of disability and on whether the disability affected the individual before completion of education could be used to examine this question. Further analysis is also needed in order to link information collected on the main Census form on education, work and living arrangements, to the detailed information on disability collected in the NDS. Questions that might be addressed include how the living arrangements of people with disabilities are linked to the availability of help and to their participation in work, education and social activities. Finally, a regional analysis of service use or of inability to access services would make an important contribution to planning services so as to facilitate the participation of people with disability in education, work and social life.


Appendix 1
Appendix 1
Technical Note on Measurement of Disability In the following, we outline how ‘disability’ is defined, based on the questions included in Census 2006 and in the follow-up National Disability Survey carried out in autumn 2006. In 2006, the Census had two questions on disability: questions numbered 15 and 16 (Q15 and Q16), as shown in Figure 1 below. Individuals were classified as having a disability if they answered YES to any part of the two questions including, in particular, if they ticked YES to any of the parts of Q16, even though they may not have ticked YES to any of the parts of Q15. (On the Census form, people were instructed to skip Q16 on functional difficulties if they had not answered ‘Yes’ to Q15 on having a long-lasting condition). Answers to these two questions suggested that 370,400 people in Ireland had a disability. Figure A1: Questions on Disability in the 2006 Census of Population
The Census was followed by the National Disability Survey (NDS) in autumn 2006. The NDS was designed as a follow-up to the Census. It aimed to interview people from two groups: 12,661 people who had a disability according to the Census questions, and (as a check) 1,500 people who, according to the Census questions, did not have a disability. The purposes of the NDS were to ‘establish the prevalence, severity and impact of disability and to provide more detail on the characteristics and situation of the population with a disability’ (CSO, 2008, p. 11). Interviewing people identified by the Census questions as having a disability was the most efficient means of obtaining a representative sample of people with a disability.
55

A Social Portrait of People with Disabilities in Ireland
The second group (the smaller number of people who did not answer ‘Yes’ to Census questions 15 and 16) was interviewed to check for ‘false negatives’: individuals who, when asked the more detailed set of questions on the NDS, turned out to have a disability as defined in the NDS. The NDS questionnaires covered a broader range of difficulties than had been included in the Census. The NDS included nine different categories of disability:
Seeing Hearing Speech Mobility & dexterity Remembering & concentrating Intellectual & learning Emotional, psychological & mental health Pain Breathing.
Three of these (speech, pain and breathing) were not specifically mentioned in the Census. In most cases in the NDS analysis, people were classified as having a disability if they indicated that they had a ‘moderate’ or more ‘severe level of difficulty’ in any of the nine areas. In the case of two areas (intellectual & learning and emotional, psychological & mental health) people were regarded as having a disability if they had ‘just a little’ or higher level of difficulty. This strategy was adopted in order to be as inclusive as possible as it was felt that people with these types of disability are most likely to understate their condition because of stigma. Table A1 and Figure A2 compare the population estimates of the number of people with a disability according to the Census questions and the NDS questions. Different estimates of the number of people with a disability will be reached depending on the source and how the estimates are combined. Table A1: Comparative Population Estimates for numbers of People with Disabilities in Census
2006 and NDS National Disability Survey Has Disability Does not Have Disability Total
Census 2006: Has Disability
A. “Census / NDS Disability”
325,800
B. Has disability in Census
but has NO disability according to NDS
‘false positives’
44,600
E. “Census of Population Disability”
370,400 Census 2006: Does not Have Disability
C. No disability in Census
but has disability according to NDS
‘false negatives’
423,300
D. Has no disability in both
Census and NDS.
3,276,700
A+C “Total Disability”
749,100
Source: CSO, 2008, Table 1.4 The first was a sample identified in the 2006 Census as having a disability. This sample covered both people living in private households and those living in communal establishments. When a sample of these individuals was re-contacted, the majority met the criteria for ‘disability’ adopted in the NDS. These are the ‘Census/NDS’ group of people shown in Cell A in Table A1 and Figure A2. They have a disability according to both the Census and the NDS definitions. Interviews were conducted with 14,518 of these individuals and they represent an estimated population of 325,800.
56

Appendix 1
There were some people, however, who despite having been classified as having a disability or long-term condition on the Census, did not identify as having a disability or did not meet the severity criteria for having a disability according the NDS. This group (the ‘false positives’, or Cell B, Table A1 and Figure A2) represents an estimated 44,600 people. The second component was a sample selected from those who did not have a disability according to the Census (i.e. did not tick ‘Yes’ to any box in Census 2006, questions 15 or 16). Of this group, interviews were conducted with 1,551 individuals. Most did not meet the criteria for ‘having a disability’ adopted in the NDS. However, some of these individuals (roughly one in ten) despite being classified as NOT having a disability on the Census, met the criteria for having a disability according to the NDS. This group (the ‘false negatives’) represents a very large group in the population: an estimated 423,300 persons. The estimate is subject to a wide margin of error because of the small sample size (1,551).29 This group is shown in Cell C in Table A1 and Figure A2. Figure A2: Prevalence of Disability from Census 2006 and National Disability Survey
C. Has no disability on Census but has disability on NDS (false negatives): 10%
A. Has disability on both Census and NDS: 8 %
B. Has disability on Census but no disability on NDS (false positives): 1%
D. Has no disability on both Census and NDS: 81% ‘False positives’ and ‘false negatives’ arise for a number of reasons. The research literature shows that reluctance to disclose a disability is a widespread phenomenon. People who did not identify themselves as having a long-lasting condition in Census 2006 (Q.15) were directed not to answer the subsequent functional difficulties question (Q.16). People may experience functional difficulties – in old age, for example. But they may not identify themselves as having ‘a long-lasting condition’. Other reasons for divergence include:
The coverage of different types of disability (the NDS included pain, breathing and speech, while the Census did not),
The mode of administration (self-completion by household representative in the case of the Census and by a trained interviewer in the case of the NDS), and
The use of a threshold (‘moderate’ for most of the disability types) in the NDS compared to a ‘Yes’/’No’ response categories on the Census. Many ‘false positives’ were people who ticked the box for ‘Other, including chronic illness’ on the Census form and many ‘false negatives’ were people who had low levels of difficulty associated with their disability.
Our best estimate of the number of people with a disability in Ireland comes from combining the results of the Census (which covered the whole population) and the NDS (which dealt with the issue of disability in more depth). If we add together cells A and C in Table A1, we arrive at an estimate of 749,100 people, or 18.5 per cent of the population. The margin of error (at the 95 per cent confidence level) is about plus or minus 72,000 or 1.8 per cent of Ireland's population.30
29 The margin of error is plus or minus 20,000 persons for estimates based on the full sample of 1,551. It would be even higher for subgroups, such as age groups, because the sample would be smaller. 30 Because the 1,551 people interviewed for the NDS whose census records did NOT indicate the presence of a disability represent such a large proportion of the total population, the estimates derived from this group is larger than the estimate derived from the ‘positives’ in the Census. As the number interviewed is smaller, there is a greater margin of error associated with this figure.
57

A Social Portrait of People with Disabilities in Ireland
58
Although this is our best estimate of the prevalence of disability in Ireland, for most of the analysis in this report we focus on results for the ‘Census/ NDS’ group, representing 8.1 per cent of the overall population. This is because there is a large margin of error around the estimates for group C (the ‘false negatives’). If they were included, the results would be less reliable. For some analyses, we use group E in figure A.1 (those identified in the Census as having a disability), as figures on some aspects of the lives of people with disability have not yet been produced from the National Disability Survey. Differences between the Census/NDS Disability and Total Disability Samples For most of the analysis in this report we focus on the Census/NDS sample. As we saw in Table A1, this sample represents about 325,800 of the total population of 749,100 people with a disability. Because of the smaller sample size for the ‘false negatives’ (Cell C, Table A1) – only 264 of the 1,551 interviewed had a disability, although they represent 423,300 in the population – there is a wide margin of error around estimates based on these 749,000 estimated cases. Their detailed results are therefore not reported by the CSO and are not reported here. The ‘false negatives’ are different from those identified in both the Census and the NDS as having a disability, in that their level of disability tends to be less severe. We can see this from Table A2, which shows the profile of people with a disability for the total sample (Cells A & C from Table A.1) and the Census/NDS sample (Cell A). We can see from Table A2 that the main differences between the Census/NDS and total disability samples are in terms of the severity of the disability. The Census/NDS sample has a relatively lower proportion of people with moderate disability (31 per cent vs. 44 per cent) and a relatively higher proportion of people with severe disability (43 per cent vs. 38 per cent) or who are completely unable to do certain everyday tasks (24 per cent vs. 15 per cent). The Census/NDS sample has, on average, a greater number of different types of disability (2.6 on average compared to 2.2 for the Total Disability sample). In terms of the type of disability, mobility & dexterity (56 per cent vs. 45 per cent), remembering & concentrating (35 per cent vs. 25 per cent) and emotional, psychological & mental health problems (34 per cent vs. 26 per cent) are more prevalent in the Census/NDS sample. Table A2: Profile of People with Disability from the Total Sample and the Census/NDS Disability
Sample (percentage of people with a disability) Census/
NDS Disability
Total Disability
Level of Difficulty Just a little31 2.2 3.3 A moderate level 31.1 43.7 A lot of difficulty 42.6 38.4 Cannot do at all 24.2 14.6 Type of Disability Seeing 16% 15% (more than one type Hearing 18% 13% possible) Speech 11% 7% Mobility & dexterity 56% 45% Remembering & concentrating 35% 25% Intellectual & learning 22% 17% Emotional, psychological & mental health 34% 26% Pain 47% 47% Breathing 22% 22% Number of people with disability (000)
325.8 749.1
Average number of disabilities per person
2.6 2.2
Source: CSO, 2008, Table 1.A Census/NDS Disability Sample, and Table 1.A Total disability; Table 1B Census/NDS Disability and Table 1b Total Disability Other differences between the two groups are smaller in magnitude and are generally within the margins of error for the Total Disability sample.32
31 This level of difficulty only applies to those with Intellectual & learning or Emotional/ psychological/ mental health disabilities. 32 As noted above, the margins of error are wider for the Total Disability Sample because of the small sample size of the ‘false negatives’.
Bibliography & Further Reading
59
Bibliography and Further Reading Apps, P. and Rees, R. (2005), ‘Gender, Time Use, and Public Policy over the Life Cycle’, Oxford Review of Economic Policy, 21(3):439-461. Bardone, L. and Guio, A-C. (2005), In-Work Poverty, Luxembourg: Eurostat (Population and Social Conditions 5/2005). Bandian, N.A. (1999), ‘Reading disability defined as a discrepancy between listening and reading comprehension: A longitudinal study of stability, gender differences, and prevalence’, Journal of Learning Disabilities, 32(2):138-148. Brault, M.W. (2008), Americans with Disabilities: 2005, US Census Bureau. Available online at: http://www.census.gov/prod/2008pubs/p70-117.pdf. CSO (Central Statistics Office) (2003a), Census of Population 2002, Vol. 2: Ages and Marital Status, Dublin: Stationery Office. CSO (Central Statistics Office) (2003b), Census of Population 2002, Vol. 5: Principal Economic Status and Industries, Dublin: Stationery Office. CSO (Central Statistics Office) (2004), Census of Population 2002, Vol. 10: Disability and Carers, Dublin: Stationery Office. CSO (Central Statistics Office) (2007), Quarterly National Household Survey, Sport and Physical Exercise, Quarter 3 2006, Dublin: Central Statistics Office. CSO (Central Statistics Office) (2007b), Census 2006 Volume 11: Disability, Carers and Voluntary Activities, Dublin: Stationery Office. CSO (Central Statistics Office) (2007c), Quarterly National Household Survey, Quarter 4 2006, Dublin: Central Statistics Office. CSO (Central Statistics Office) (2008), National Disability Survey 2006, First Report, Dublin: Stationery Office. CSO (Central Statistics Office) (2008b), Health Status and Health Service Utilisation (Quarterly National Household Survey, Quarter 3 2007), Dublin: Central Statistics Office. CSO (Central Statistics Office) (2009), Survey on Income and Living Conditions (SILC): 2008, December, Dublin: Stationery Office. CSO (Central Statistics Office) (2009b), Employee Skills, Training and Job Vacancies Survey 2006, Dublin: Stationery Office. CSO (Central Statistics Office) (2009c), Community Involvement and Social Networks, 2006: Results from the Social Capital Module of the Quarterly National Survey Q3 2006 and the Social and Cultural Participation Module of the Survey of Income and Living Conditions 2006, Dublin: Stationery Office. CSO (Central Statistics Office) (2010), National Disability Survey 2006, Volume 2, Dublin: Stationery Office. CSO (Central Statistics Office) (2010b), Survey on Income and Living Conditions (SILC): 2009, November, Dublin: Stationery Office.

A Social Portrait of People with Disabilities in Ireland
60
Cullinan, J., Gannon, B. and Lyons, S. (2010), ‘Estimating The Extra Cost of Living for People with Disabilities’, Health Economics (2010), published online June 2010: doi: 10.1002/hec.1619. Gannon, B. and Nolan, B. (2004), Disability and Labour Market Participation, Dublin: The Equality Authority. Gannon, B. and Nolan, B. (2005), Disability and Social Inclusion in Ireland, Dublin: The Equality Authority and the National Disability Authority. Hanna, W.J. and Rogovsky, B. (1991), ‘Women with Disabilities: two handicaps plus’, Disability, Handicap and Society, 6(1):49-64. Jones, M. (2010), ‘Disability, Education and Training’, Economic & Labour Market Review, 4(4):32-37. Maitre, B, Nolan B. and Whelan C.T. (2005), Reconfiguring the Measurement of Deprivation and Consistent Poverty in Ireland, Dublin: The Economic and Social Research Institute (Policy Research Series Paper No. 58). McGinnity, F. and Russell, H. (2007), ‘Work Rich, Time Poor? The Time-Use of Women and Men in Ireland’, The Economic and Social Review, 38(3):323-354. NAPinclusion (National Action Plan for Social Inclusion 2007–2016) (2007), Dublin: Government Stationery Office. Nazma, N. (2004), ‘Chapter 10: Disability’ in The Health of Children and Young People, London: Office for National Statistics. NDA (National Disability Authority) (2005), Disability and Work: The Picture We Learn from Official Statistics, Dublin: National Disability Authority (Disability Research Series 1). NDA (National Disability Authority) (2006), How Far Towards Equality? Measuring How Equally People with Disabilities are Included in Irish Society, Dublin: National Disability Authority. NESC (National Economic and Social Council) (2009), Well-Being Matters: A Social Report for Ireland (Volume II, no. 119, October 2009), Dublin: The National Economic and Social Council. Patja, K., Livanainen, M., Vesala, H., Oksanen, H. and Ruoppila, I. (2001), ‘Life expectancy of people with intellectual disability: a 35-year follow-up study’, Journal of Intellectual Disability Research, 44(5):591-599. Pena-Casas, R. and Latta, M. (2004), Working Poor in the European Union, Dublin: European Foundation for the Improvement of Living and Working Conditions. Russell, H., Quinn, E., King O’Riain, R. and McGinnity, F. (2008), The Experience of Discrimination in Ireland: Analysis of the QNHS Equality Module, Dublin: The Economic and Social Research Institute and the Equality Authority. Schalock, R.L., Borthwick-Duffy, S.A., Bradley, V.J., Buntinx, W.H.E. et al (2010), Intellectual Disability: Definition, Classification, and Systems of Supports (11th Edition), Annapolis Junction, MD; AAIDD Publications. Statistics Canada (2002),A Profile of Disability in Canada, 2001, Ottawa, Ontario: Ministry of Industry. White, C. and Edgar, G. (2010), ‘Inequalities in disability-free life expectancy by social class and area type: England, 2001-03’, Health Statistics Quarterly, 45 (Spring 2010):57-80. WHO (World Health Organisation) (2001), International Classification of Functioning, Disability and Health, Geneva: WHO. Zaidi, A. and Burchardt, T. (2005), ‘Comparing incomes when needs differ: equivalization for the extra costs of disability’, Review of Income and Wealth 51(1):89-114.

Glossary
61
Glossary At-risk-of-poverty thresholds: Income thresholds derived as proportions of median income. These are based on the household income adjusted for household size and composition (referred to as equivalised income). A household at-risk-of-poverty has an adjusted (or equivalised) income below 60 per cent of the median adjusted household income. The at-risk-of-poverty rate takes account of household income from all sources, number of adults and number of children in the household. See also consistent poverty below. Census of Population Disability: People who reported a disability on the 2006 Census form, representing about 370,000 people. Census/NDS Disability: The definition of disability based on both the 2006 Census of Population and the 2006 National Disability Survey, representing 8.1 per cent of the population or approximately 326,000 people. Consistent poverty: This is a measure of poverty used in the Irish National Anti-Poverty Strategy (NAPS) that takes account of the household’s living standards as well as the household size, composition and total income. Originally, it was a measure of poverty of those who were at-risk-of-poverty and deprived of at least one out of the following eight items considered necessary to ensure a basic standard of living:
Two pairs of strong shoes A warm waterproof overcoat Buy new not second-hand clothes Eat meals with meat, chicken, fish (or vegetarian equivalent) every second day Have a roast joint or its equivalent once a week Had to go without heating during the last year through lack of money Had a day in the last two weeks without a substantial meal due to lack of money Experienced debt problems arising from ordinary living expenses.
Now a household is consistently poor if the household income is below the at-risk-of-poverty threshold (see above) and the household members are deprived of at least two out of the following 11 items (see deprivation below):
Without heating at some stage in the past year due to lack of money Unable to afford two pairs of strong shoes Unable to afford a roast joint (or its equivalent) once a week Unable to afford a meal with meat, chicken or fish (or vegetarian equivalent) every second day Unable to afford new (not second-hand) clothes Unable to afford a warm waterproof coat Keep the home adequately warm Presents for family or friends at least once a year Replace any worn out furniture Have family or friends for a drink or meal once a month Have a morning, afternoon or evening out in the last fortnight, for entertainment.
Deprivation: Deprivation in the Irish National Anti-Poverty Strategy is measured using eleven basic goods or services (items listed above under consistent poverty). Discrimination: Generally used to refer to unfair treatment of a person on the basis of his/her membership of a particular group, in terms of, for example, gender, nationality, disability or race.

A Social Portrait of People with Disabilities in Ireland
62
Economic vulnerability: A measure of the economic situation of a household based on whether it is at-risk-of-poverty, experiences enforced basic deprivation and has difficulty making ends meet. Employment rate: The employment rate is the proportion of the working-age population that is working. Equivalence scales: A set of relativities between the needs of households of differing size and composition, used to adjust household income to take into account the greater needs of larger households. EU-SILC: European Union Statistics on Income and Living Conditions; this a voluntary household survey carried out annually in a number of EU member states allowing comparable statistics on income and living conditions to be compiled. In Ireland, the Central Statistics Office (CSO) has been conducting the survey since 2003. The results are reported in the Survey on Income and Living Conditions (SILC), often commonly referred to as EU-SILC figures. EU 15: Member States of the European Union prior to the accession of 10 new member states on 1 May 2004, i.e. Austria, Belgium, Denmark, Finland, France, Germany, Greece, Ireland, Italy, Luxembourg, the Netherlands, Portugal, Spain, Sweden, United Kingdom. EU 25: Member States of the European Union after the accession of 10 new member states on 1 May 2004, i.e. EU 15 plus Cyprus, the Czech Republic, Estonia, Hungary, Latvia, Lithuania, Malta, Poland, Slovakia, Slovenia. EU 27: Member States of the European Union since 1 January 2007, namely EU25 plus Bulgaria and Romania. ‘False negatives’: People who did not report a disability on the Census form but who would be regarded as having a disability using the criteria on the National Disability Survey. This is a large group (approximately 423,000 people), but since only a small number of such people were interviewed in the NDS (264), there is a wide margin of error around any statistics based on this group. This group were predominantly reporting disabilities not covered in the Census (such as pain or breathing difficulties), or were reporting lower levels of difficulties than in the Census/NDS Disability Sample. ‘False positives’: People who reported a disability on the Census, but who would not have met the criteria for having a disability used in the NDS. Approximately 44,600 people are in this group, or 12 per cent of those who reported a disability on the 2006 Census. Household: A household is usually defined for statistical purposes as either a person living alone or a group of people (not necessarily related) living at the same address with common housekeeping arrangements – that is, sharing at least one meal a day or sharing a living room or sitting room. Household equivalent (or equivalised) income: Household income adjusted to take account of differences in household size and composition by means of equivalence scales. Inactive: The inactive population is the working-age population that is not in the labour force. Labour force participation: The labour force participation rate is a measure of the proportion of the working-age population that engages actively in the labour market, either by working or looking for work. Life expectancy: The number of years that a person could expect to live on average, based on the mortality rates of the population in a given year. LIIS: Living in Ireland Survey, a household survey carried out by the Economic and Social Research Institute between 1994 and 2001. Lone parent: A parent who has primary custody of a dependant child and is not living with the other parent. Mean: The average value (for example, the average income in a sample obtained via household survey). Median: The value that divides a sample in half (e.g. the income level above and below which half the people in a sample fall).

Glossary
63
NDS: Refers to the National Disability Survey conducted by the Central Statistics Office in 2006, following the Census. The 2006 Census contained two questions on disability. The NDS was a follow-up survey that interviewed 14,518 people who were classified in Census 2006 as having a disability. Of these, the majority (88 per cent) also met the (slightly different) criteria for having a disability that was used in the NDS. The NDS also interviewed a smaller subsample (1,551) of people who had not recorded a disability in the 2006 Census. Of these, a small number (260, or 11.5 per cent) recorded a disability in the NDS. As this latter group is represented by a very small sample, most of the analyses in this Social Portrait do not include them. Planning region: The eight regions into which Ireland has been divided for certain planning and administrative purposes. Poverty gap: The shortfall in incomes for those who fall below the at-risk-of-poverty threshold. Poverty and Social Exclusion: These terms are defined broadly in the Irish National Anti-Poverty Strategy, first adopted in 1997, as follows: ‘People are living in poverty if their income and resources (material, cultural and social) are so inadequate as to preclude them from having a standard of living which is regarded as acceptable by Irish society generally. As a result of inadequate income and resources people may be excluded and marginalised from participating in activities which are considered the norm for other people in society.’ The two concepts are very similar when used in Irish policy-making but poverty is sometimes used in the narrower context to refer to low income (or wealth). On the other hand, social exclusion is almost always used in the broader sense, to refer to the inability to participate in society because of a lack of resources that are normally available to the general population. Quintile: One-fifth of a sample divided into five equal parts to show how income, for example, is spread throughout the population; each quintile represents where a person’s or household’s income is located. Risk-of-poverty: A term used at EU level to denote whether a household falls below the 60 per cent of median income threshold. Social welfare transfers: Cash receipts paid from various social welfare schemes received by the individual or household. Total Disability: The definition of disability based on the NDS, and including an estimate of the numbers who would not have reported a disability on the census. This represents 749,100 people or 18.5 per cent of the population. Since only a small number of people who did not report a disability on the census were interviewed in the NDS, the margin of error around this estimate is wider. Urban/rural location: In EU-SILC each country is divided into eight levels based on population density. These areas are further grouped into urban and rural areas as follows:
Urban: cities, suburbs of cities, mixed urban/rural areas bordering on the suburbs of cities, towns
and surrounding areas with populations of 5,000 or over (large urban); mixed urban/rural areas bordering larger towns; and towns and surrounding areas with a population of 1,000 to 5,000 (other urban).
Rural: mixed urban/rural areas, and rural areas.
‘Working poor’: A household below the at-risk-of-poverty threshold (for example 60 per cent of median equivalised income) even though some of its members are in paid work.

A Social Portrait of People with Disabilities in Ireland
64
A Social Portrait of People with Disabilities in Ireland
64