A Simulation Study on M/M/1 and M/M/C Queueing Model in …€¦ · · 2017-05-23A Simulation...
12
Global Journal of Pure and Applied Mathematics. ISSN 0973-1768 Volume 13, Number 7 (2017), pp. 2895-2906 © Research India Publications http://www.ripublication.com A Simulation Study on M/M/1 and M/M/C Queueing Model in a Multi Speciality Hospital S.Shanmugasundaram 1 and P.Umarani 2 1 Department of Mathematics, Government Arts College, Salem – 7, Tamilnadu, India. 2 Department of Mathematics, AVS Engineering College, Salem – 3, Tamilnadu, India. Abstract In this paper, we analyse the parallel service in a single server and multi server queueing model using Monte Carlo Simulation. When a hospital has more than one department (General, Cardiologist, Gynaecologist Paediatrician, Dentist) the behaviour of the multi speciality hospital has been analysed both in simulation and analytical method. The numerical example illustrates the feasibility of the model. Keywords: Average arrival, Average service, M/M/1 and M/M/C queueing model, Monte Carlo Simulation, Analytical method, Queue length. INTRODUCTION A common situation occurring in everyday life is that of queueing or waiting in a line. Queues form at bus stops, ticket booths, doctors clinics, bank counters, traffic signals and so on. Queues are also found in industry, in shops where the machines wait to be repaired; at a tool crib where the machines wait to receive tools, in a warehouse where parts are to be used and in telephone exchange where incoming calls wait to be matured. A queue is formed when either units requiring services – commonly referred to as customers, wait for service or the service facilities stand idle and wait for customers. A.K.Erlang (1909) [1] Danish Engineer who is called the father of Queuing theory, has published his articles relating to the study of congestion in telephone traffic.
Transcript of A Simulation Study on M/M/1 and M/M/C Queueing Model in …€¦ · · 2017-05-23A Simulation...

Global Journal of Pure and Applied Mathematics.
ISSN 0973-1768 Volume 13, Number 7 (2017), pp. 2895-2906
© Research India Publications
http://www.ripublication.com
A Simulation Study on M/M/1 and M/M/C Queueing
Model in a Multi Speciality Hospital
S.Shanmugasundaram1 and P.Umarani2
1Department of Mathematics, Government Arts College, Salem – 7, Tamilnadu, India.
2Department of Mathematics, AVS Engineering College, Salem – 3, Tamilnadu, India.
Abstract
In this paper, we analyse the parallel service in a single server and multi server
queueing model using Monte Carlo Simulation. When a hospital has more
than one department (General, Cardiologist, Gynaecologist Paediatrician,
Dentist) the behaviour of the multi speciality hospital has been analysed both
in simulation and analytical method. The numerical example illustrates the
feasibility of the model.
Keywords: Average arrival, Average service, M/M/1 and M/M/C queueing
model, Monte Carlo Simulation, Analytical method, Queue length.
INTRODUCTION
A common situation occurring in everyday life is that of queueing or waiting in a line.
Queues form at bus stops, ticket booths, doctors clinics, bank counters, traffic signals
and so on. Queues are also found in industry, in shops where the machines wait to be
repaired; at a tool crib where the machines wait to receive tools, in a warehouse where
parts are to be used and in telephone exchange where incoming calls wait to be
matured. A queue is formed when either units requiring services – commonly referred
to as customers, wait for service or the service facilities stand idle and wait for
customers. A.K.Erlang (1909) [1] Danish Engineer who is called the father of
Queuing theory, has published his articles relating to the study of congestion in
telephone traffic.
2896 S.Shanmugasundaram and P.Umarani
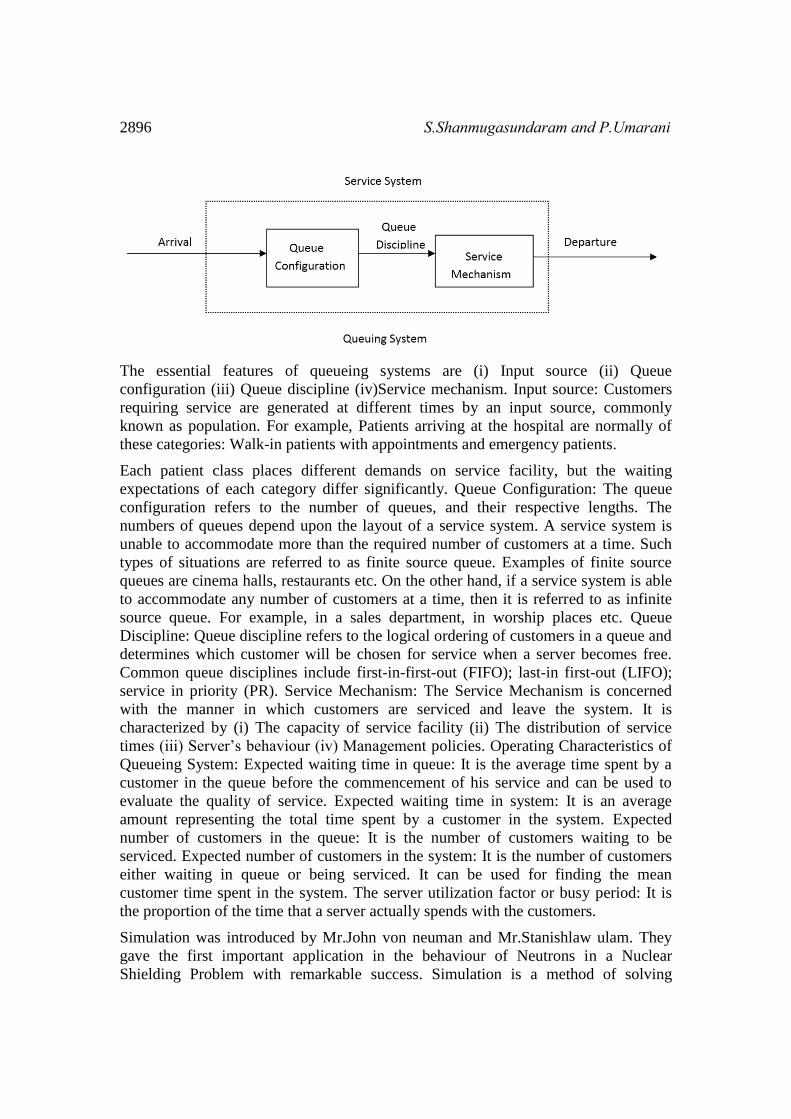
The essential features of queueing systems are (i) Input source (ii) Queue
configuration (iii) Queue discipline (iv)Service mechanism. Input source: Customers
requiring service are generated at different times by an input source, commonly
known as population. For example, Patients arriving at the hospital are normally of
these categories: Walk-in patients with appointments and emergency patients.
Each patient class places different demands on service facility, but the waiting
expectations of each category differ significantly. Queue Configuration: The queue
configuration refers to the number of queues, and their respective lengths. The
numbers of queues depend upon the layout of a service system. A service system is
unable to accommodate more than the required number of customers at a time. Such
types of situations are referred to as finite source queue. Examples of finite source
queues are cinema halls, restaurants etc. On the other hand, if a service system is able
to accommodate any number of customers at a time, then it is referred to as infinite
source queue. For example, in a sales department, in worship places etc. Queue
Discipline: Queue discipline refers to the logical ordering of customers in a queue and
determines which customer will be chosen for service when a server becomes free.
Common queue disciplines include first-in-first-out (FIFO); last-in first-out (LIFO);
service in priority (PR). Service Mechanism: The Service Mechanism is concerned
with the manner in which customers are serviced and leave the system. It is
characterized by (i) The capacity of service facility (ii) The distribution of service
times (iii) Server’s behaviour (iv) Management policies. Operating Characteristics of
Queueing System: Expected waiting time in queue: It is the average time spent by a
customer in the queue before the commencement of his service and can be used to
evaluate the quality of service. Expected waiting time in system: It is an average
amount representing the total time spent by a customer in the system. Expected
number of customers in the queue: It is the number of customers waiting to be
serviced. Expected number of customers in the system: It is the number of customers
either waiting in queue or being serviced. It can be used for finding the mean
customer time spent in the system. The server utilization factor or busy period: It is
the proportion of the time that a server actually spends with the customers.
Simulation was introduced by Mr.John von neuman and Mr.Stanishlaw ulam. They
gave the first important application in the behaviour of Neutrons in a Nuclear
Shielding Problem with remarkable success. Simulation is a method of solving
A Simulation Study on M/M/1 and M/M/C Queueing Model in a Multi Speciality Hospital 2897
Decision-Making problems by designing, constructing and manipulating a model of
the real system. Punitha.S (2014) [2] has analyzed the basic ideas of simulation
method and calculates the queue length, customer waiting time and average service
time in toll gate. Simulation is the process of designing a model of a real system and
conducting experiments with this model for the purpose of understanding the
behaviour of the operation for the system. Syed Shujauddin Sameer(2014) [3] has
applied simulation method successfully for understanding queueing behaviour and
had helped to increase the performance of the system. A simulation model initially
developed by Takakuwa (2008) [4] for the entire departments of the outpatient
hospital ward of a university hospital has been redesigned considering actual working
time of the doctors. Simulation is a numerical solution method that seeks optimal
alternatives through a trial and error process. The Simulation approach can be used to
study almost any problem that involves uncertainty, that is one or more decision
variables can be represented by a probability distribution, like decision making under
risk. Simulation approach requires an analogous physical model to represent
mathematical and logical relationship among variables of the problem under study.
After having constructed the desired model, the Simulation approach evaluate each
alternative by generating a series of values of random variable on paper over a
period of time within the given set of conditions or criteria. This process of generating
series of values one after another to understand the behaviour of the system is called
the executing model. Simulation is the use of a system model that has the designed
characteristics of reality in order to produce the essence of actual operation.
Ishan P Lade, Sandeep A Chowriwar and Pranay B Sawaitul (2013) [5] have
described the use of queueing systems to decrease the waiting time of patients in the
queue and in the system using simulation method. The random numbers so generated
are known as pseudorandom numbers: such a pseudorandom number contains a
bounded (fixed) number of digits, implying that continuous uniform distribution is
approximated by a discrete one. Pseudorandom numbers are made use of it in
simulation studies. The waiting time of the patients in the queue and in the medical
centre in the single server queueing system using simulation model in a medical
centre has been analyzed in the paper [6]. Monte Carlo method needs large number of
pseudorandom numbers and computers are in their generation. Simulation approaches
are popular and powerful. It should be emphasized that simulation is just one of
possible experiments for an interested system. Simulation analysis requires a careful
process of designing an abstract model of a real system for a given set of conditions.
Kim,B.J (2011) [7] has discussed on the basis of the sensitivity of toll plaza using a
discrete event simulation method in a conceptualization of traffic flow. Banumathi.P
(2016) [8] has analyzed the queue length of each queue and waiting time of a
customer in M/M/1 queueing system using simulation model in railway system.
MODEL DESCRIPTION
The main purpose of this paper is to apply Monte Carlo Simulation method in a multi
speciality hospital in order to find the queue lengths of five different doctors like

2898 S.Shanmugasundaram and P.Umarani
General, Cardiologist, Gynaecologist Paediatrician, and Dentist. The collected data
regarding number of patients arriving and service given to them by five doctors has
been utilized in the Monte Carlo Simulation method to find the queue length of all
five doctors and is compared to the analytical method as shown in table 6(a). The
queue lengths for two of the departments (General and Gynaecology) are seen to be
higher than that of other departments, so the multi server system (additional doctors)
is introduced for those two departments as shown in table 6(b). It can be noted from
the above mentioned table that the queue lengths have become null. The comparison
between simulation and analytical method has been given in the bar diagram. The
queue lengths of the various departments are presented by the simulation tables 6(a)
and 6(b). In a single and multi channel queueing simulation, arrival and service are
generated from the distributions by using the random variables [9].
TABLE 1: ARRIVAL DISTRIBUTION
S.NO NO.OF PATIENTS PROBABILITY
1 79 0.11
2 174 0.23
3 249 0.33
4 131 0.18
5 112 0.15
TABLE 2: TAG NUMER TABLE FOR ARRIVAL DISTRIBUTION
S.NO NO.OF
PATIENTS
PROBABILITY CUMMULATIVE
PROBABILITY
TAG
NUMBERS
1 79 0.11 0.11 1 to 10
2 174 0.23 0.34 11 to 33
3 249 0.33 0.67 34 to 66
4 131 0.18 0.85 67 to 84
5 112 0.15 1 85 to 100

A Simulation Study on M/M/1 and M/M/C Queueing Model in a Multi Speciality Hospital 2899
TABLE 3: SERVICE DISTRIBUTION
S.NO NO.OF PATIENTS PROBABILITY
1 214 0.35
2 152 0.25
3 106 0.17
4 87 0.14
5 60 0.09
TABLE: 4 TAG NUMER TABLE FOR SERVICE DISTRIBUTION
S.NO NO.OF
PATIENTS
PROBABILITY CUMMULATIVE
PROBABILITY
TAG
NUMBER
1 214 0.35 0.35 0 to 34
2 152 0.25 0.6 35 to 59
3 106 0.17 0.77 60 to 76
4 87 0.14 0.91 77 to 90
5 60 0.09 1 91 to 100
TABLE 5: TAG NUMER TABLE FOR SERVER CHOOSEN
SERVER PROBABILITY CUMMULATIVE
PROBABILITY
TAG
NUMBER
GENERAL 0.2 0.2 1 to 19
CARDIOLOGIST 0.2 0.4 20 to 39
GYNAECOLOGIST 0.2 0.6 40 to 59
PAEDIATRICIAN 0.2 0.8 60 to 79
DENTIST 0.2 1 80 to 100

2900 S.Shanmugasundaram and P.Umarani
TABLE 6(a): SIMULATION TABLE
S.N
O
RA
ND
OM
NU
MB
ER
SE
RV
ER
RA
ND
OM
NU
MB
ER
FO
R
AR
RIV
AL
AR
RIV
AL
RA
ND
OM
NU
MB
ER
FO
R
SE
RV
ICE
SE
RV
ICE
GENERAL CARDIOLOGIST GYNAECOLOGIST PAEDIATRICIAN DENTIST
NU
MB
ER
OF
PA
TIE
NT
S
FO
R S
ER
VIC
E
NU
MB
ER
OF
PA
TIE
NT
S
TR
EA
TE
D
NU
MB
ER
OF
PA
TIE
NT
S
WA
ITIN
G
NU
MB
ER
OF
PA
TIE
NT
S
FO
R S
ER
VIC
E
NU
MB
ER
OF
PA
TIE
NT
S
TR
EA
TE
D
NU
MB
ER
OF
PA
TIE
NT
S
WA
ITIN
G
NU
MB
ER
OF
PA
TIE
NT
S
FO
R S
ER
VIC
E
NU
MB
ER
OF
PA
TIE
NT
S
TR
EA
TE
D
NU
MB
ER
OF
PA
TIE
NT
S
WA
ITIN
G
NU
MB
ER
OF
PA
TIE
NT
S
FO
R S
ER
VIC
E
NU
MB
ER
OF
PA
TIE
NT
S
TR
EA
TE
D
NU
MB
ER
OF
PA
TIE
NT
S
WA
ITIN
G
NU
MB
ER
OF
PA
TIE
NT
S
FO
R S
ER
VIC
E
NU
MB
ER
OF
PA
TIE
NT
S
TR
EA
TE
D
NU
MB
ER
OF
PA
TIE
NT
S
WA
ITIN
G
1 36 CARDIOLOGIST 65 249 14 214 249 214 35
2 54 GYNAECOLOGIST 71 131 51 152 131 131 -
3 7 GENERAL 20 174 51 152 174 152 22
4 45 GYNAECOLOGIST 17 174 9 214 174 174 -
5 60 PAEDIATRICIAN 48 249 71 106 249 106 143
6 9 GENERAL 89 112 25 214 134 134 -
7 93 DENTIST 18 174 52 152 174 152 22
8 41 GYNAECOLOGIST 83 131 92 60 131 60 71
9 17 GENERAL 8 79 37 152 79 79 -
10 10 GENERAL 90 112 25 214 112 112 -
11 39 CARDIOLOGIST 5 79 32 214 114 114 -
12 94 DENTIST 89 112 4 214 134 134 -
13 95 DENTIST 18 174 50 152 174 152 22
14 61 PAEDIATRICIAN 8 79 8 214 222 214 8
15 75 PAEDIATRICIAN 26 174 70 106 182 106 76
16 83 DENTIST 47 249 89 87 271 87 184
17 43 GYNAECOLOGIST 94 112 68 106 183 106 77
18 35 CARDIOLOGIST 6 79 72 106 79 79 -
19 6 GENERAL 72 131 99 60 131 60 71
20 76 PAEDIATRICIAN 40 249 29 214 325 214 111
21 9 GENERAL 62 249 95 60 320 60 260
22 52 GYNAECOLOGIST 47 249 82 87 326 87 239
23 71 PAEDIATRICIAN 68 131 65 106 242 106 136
24 38 CARDIOLOGIST 60 249 85 87 249 87 162
25 69 PAEDIATRICIAN 88 112 68 106 248 106 142
26 80 DENTIST 17 174 1 214 358 214 144
27 92 DENTIST 36 249 85 87 393 87 306
28 44 GYNAECOLOGIST 77 131 27 214 370 214 156
29 67 PAEDIATRICIAN 43 249 62 106 391 106 285
30 47 GYNAECOLOGIST 28 174 21 214 330 214 116
31 39 CARDIOLOGIST 31 174 94 60 336 60 276
A Simulation Study on M/M/1 and M/M/C Queueing Model in a Multi Speciality Hospital 2901
32 65 PAEDIATRICIAN 6 79 20 214 364 214 150
33 5 GENERAL 58 249 52 152 509 152 357
34 59 GYNAECOLOGIST 39 249 45 152 365 152 213
35 99 DENTIST 71 131 1 214 437 214 223
36 4 GENERAL 22 174 73 106 531 106 425
37 79 PAEDIATRICIAN 76 131 58 152 281 152 129
38 60 PAEDIATRICIAN 81 131 24 214 260 214 46
39 61 PAEDIATRICIAN 88 112 72 106 158 106 52
40 73 PAEDIATRICIAN 94 112 84 87 164 87 77
41 58 GYNAECOLOGIST 53 249 35 152 462 152 310
42 47 GYNAECOLOGIST 79 131 41 152 441 152 289
43 23 CARDIOLOGIST 9 79 32 214 355 214 141
44 69 PAEDIATRICIAN 62 249 75 106 326 106 220
45 35 CARDIOLOGIST 82 131 20 214 272 214 58
46 21 CARDIOLOGIST 18 174 97 60 232 60 172
47 41 GYNAECOLOGIST 20 174 47 152 463 152 311
48 14 GENERAL 37 249 99 60 674 60 614
49 59 GYNAECOLOGIST 65 249 22 214 560 214 346
50 28 CARDIOLOGIST 71 131 16 214 303 214 89
TOTAL - 8348 - 7379 614 89 346 220 223
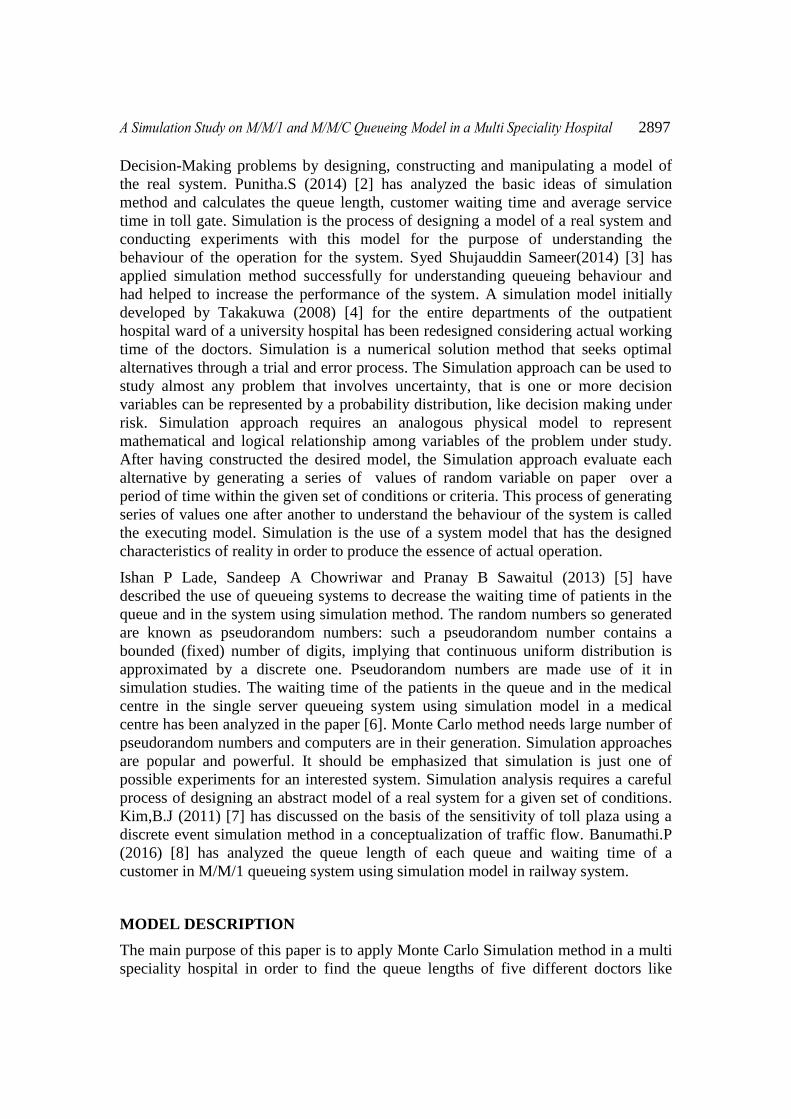
SIMULATION CALCULATION
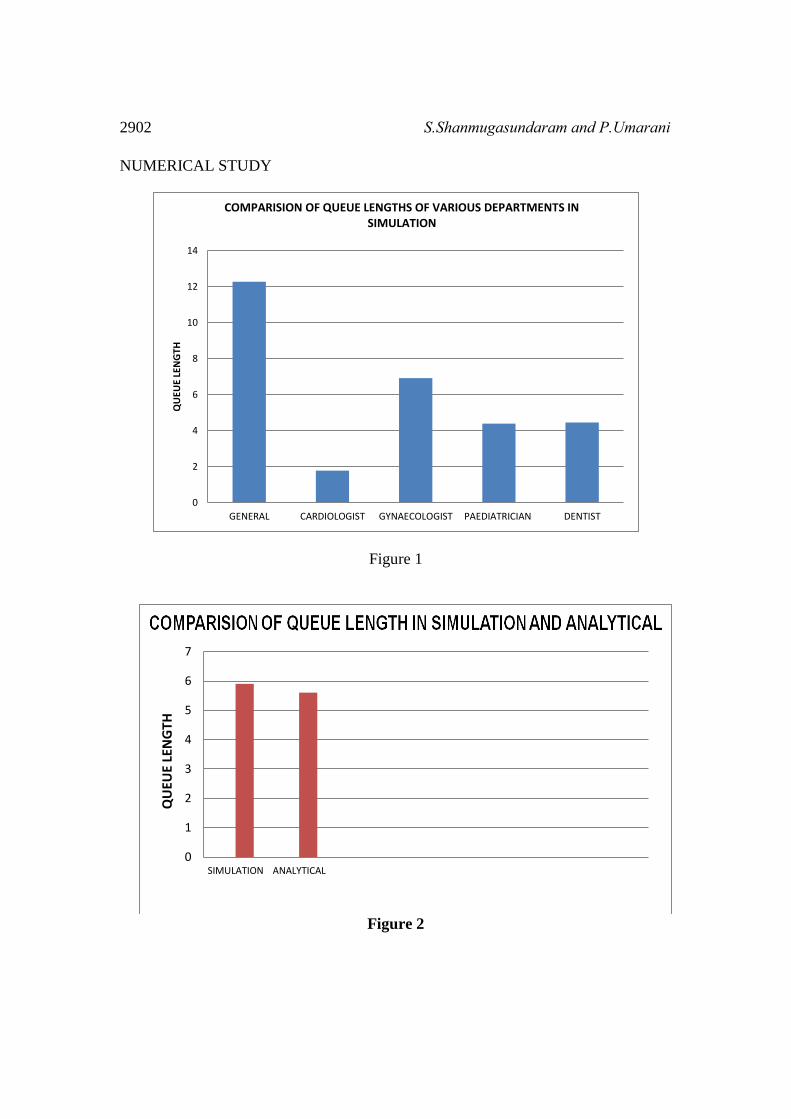
Average queue length on general = 12.28
Average queue length on Cardiologist = 1.78
Average queue length on Gynaecologist = 6.92
Average queue length on Paediatrician = 4.4
Average queue length on Dentist = 4.46
Average queue length = 5.9
ANALYTICAL CALCULATION
Average number of arrival = 171.26
Average number of service = 148.5
Arrival rate λ = 0.0058
Service rate μ = 0.0067
Average queue length = 5.6
2902 S.Shanmugasundaram and P.Umarani
NUMERICAL STUDY
Figure 1
Figure 2
0
2
4
6
8
10
12
14
GENERAL CARDIOLOGIST GYNAECOLOGIST PAEDIATRICIAN DENTIST
QU
EUE
LEN
GTH
COMPARISION OF QUEUE LENGTHS OF VARIOUS DEPARTMENTS IN SIMULATION
0
1
2
3
4
5
6
7
SIMULATION ANALYTICAL
QU
EUE
LEN
GTH
A Simulation Study on M/M/1 and M/M/C Queueing Model in a Multi Speciality Hospital 2903
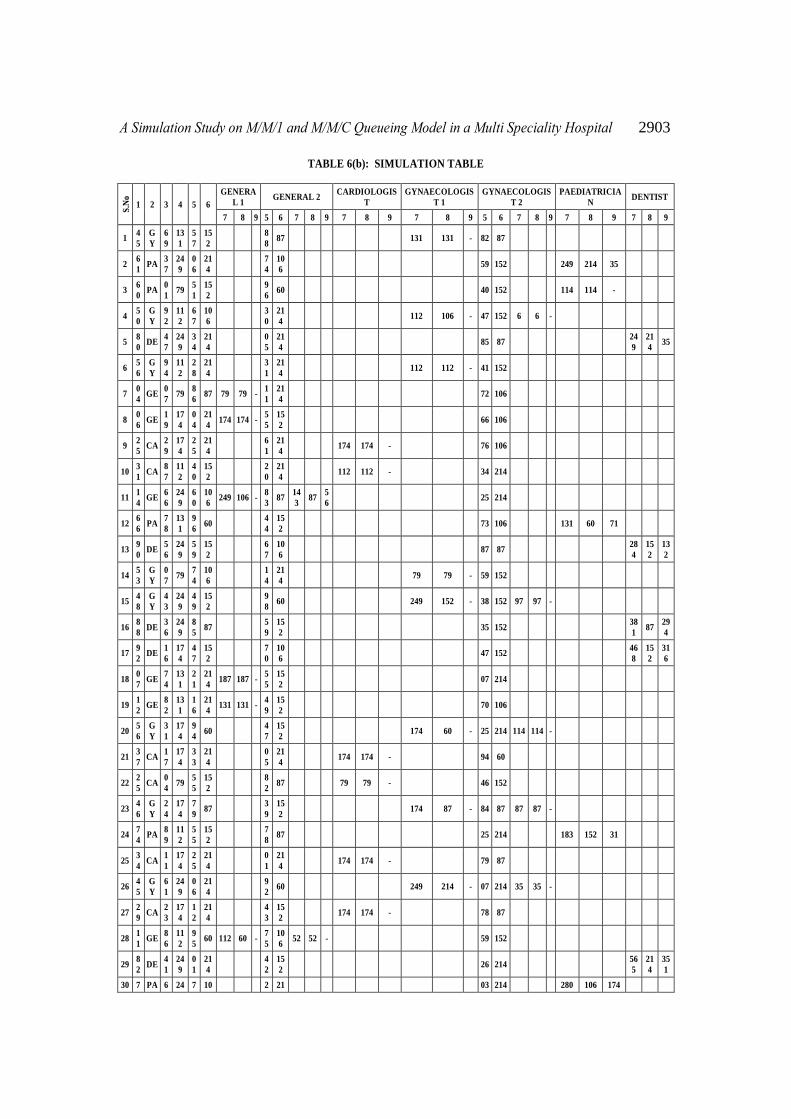
TABLE 6(b): SIMULATION TABLE
S.N
o
1 2 3 4 5 6
GENERA
L 1 GENERAL 2
CARDIOLOGIS
T
GYNAECOLOGIS
T 1
GYNAECOLOGIS
T 2
PAEDIATRICIA
N DENTIST
7 8 9 5 6 7 8 9 7 8 9 7 8 9 5 6 7 8 9 7 8 9 7 8 9
1 4
5
G
Y
6
9
13
1
5
7
15
2
8
8 87 131 131 - 82 87
2 6
1 PA
3
7
24
9
0
6
21
4
7
4
10
6 59 152 249 214 35
3 6
0 PA
0
1 79
5
1
15
2
9
6 60 40 152 114 114 -
4 5
0
G
Y
9
2
11
2
6
7
10
6
3
0
21
4 112 106 - 47 152 6 6 -
5 8
0 DE
4
7
24
9
3
4
21
4
0
5
21
4 85 87
24
9
21
4 35
6 5
6
G
Y
9
4
11
2
2
8
21
4
3
1
21
4 112 112 - 41 152
7 0
4 GE
0
7 79
8
6 87 79 79 -
1
1
21
4 72 106
8 0
6 GE
1
9
17
4
0
4
21
4 174 174 -
5
5
15
2 66 106
9 2
5 CA
2
9
17
4
2
5
21
4
6
1
21
4 174 174 - 76 106
10 3
1 CA
8
7
11
2
4
0
15
2
2
0
21
4 112 112 - 34 214
11 1
4 GE
6
6
24
9
6
0
10
6 249 106 -
8
3 87
14
3 87
5
6 25 214
12 6
6 PA
7
8
13
1
9
6 60
4
4
15
2 73 106 131 60 71
13 9
0 DE
5
6
24
9
5
9
15
2
6
7
10
6 87 87
28
4
15
2
13
2
14 5
3
G
Y
0
7 79
7
4
10
6
1
4
21
4 79 79 - 59 152
15 4
8
G
Y
4
3
24
9
4
9
15
2
9
8 60 249 152 - 38 152 97 97 -
16 8
8 DE
3
6
24
9
8
5 87
5
9
15
2 35 152
38
1 87
29
4
17 9
2 DE
1
6
17
4
4
7
15
2
7
0
10
6 47 152
46
8
15
2
31
6
18 0
7 GE
7
4
13
1
2
1
21
4 187 187 -
5
5
15
2 07 214
19 1
2 GE
8
2
13
1
1
6
21
4 131 131 -
4
9
15
2 70 106
20 5
6
G
Y
3
1
17
4
9
4 60
4
7
15
2 174 60 - 25 214 114 114 -
21 3
7 CA
1
7
17
4
3
3
21
4
0
5
21
4 174 174 - 94 60
22 2
5 CA
0
4 79
5
5
15
2
8
2 87 79 79 - 46 152
23 4
6
G
Y
2
4
17
4
7
9 87
3
9
15
2 174 87 - 84 87 87 87 -
24 7
4 PA
8
9
11
2
5
5
15
2
7
8 87 25 214 183 152 31
25 3
4 CA
1
1
17
4
2
5
21
4
0
1
21
4 174 174 - 79 87
26 4
5
G
Y
6
1
24
9
0
6
21
4
9
2 60 249 214 - 07 214 35 35 -
27 2
9 CA
2
3
17
4
1
2
21
4
4
3
15
2 174 174 - 78 87
28 1
1 GE
8
6
11
2
9
5 60 112 60 -
7
5
10
6 52 52 - 59 152
29 8
2 DE
4
1
24
9
0
1
21
4
4
2
15
2 26 214
56
5
21
4
35
1
30 7 PA 6 24 7 10 2 21 03 214 280 106 174

2904 S.Shanmugasundaram and P.Umarani
1 - RANDON NUMBER FOR SERVER
2 - SERVER 3 - RANDOM NUMBER FOR ARRIVAL
4 - ARRIVAL
5 - RANDOM NUMBER FOR SERVICE 6 - SERVICE
7 - NUMBER OF PATIENTS FOR SERVICE
8 - NUMBER OF PATIENTS TREATED 9 - NUMBER OF PATIENTS WAITING
GE – GENERAL
CA – CARDIOLOGIST
GY – GYNAECOLOGIST
PA – PAEDIATRICIAN
DE – DENTIST
3 4 9 5 6 8 4
31 1
5 GE
5
0
24
9
2
0
21
4 249 214 -
3
9
15
2 35 35 - 29 214
32 7
0 PA
6
5
24
9
3
0
21
4
8
7 87 12 214 423 214 209
33 3
3 CA
8
6
11
2 9
21
4
6
9
10
6 112 112 - 58 152
34 8
7 DE
9
9
11
2
2
3
21
4
7
1
10
6 68 106
46
3
21
4
24
9
35 9
9 DE
9
1
11
2
5
0
15
2
0
7
21
4 55 152
36
1
15
2
20
9
36 1
2 GE
7
3
13
1
3
9
15
2 131 131 -
1
2
21
4 80 87
37 5
6
G
Y
2
1
17
4
4
6
15
2
5
2
15
2 174 152 - 92 60 22 22 -
38 8
0 DE
1
1
17
4
5
8
15
2
8
6 87 18 214
38
3
15
2
23
1
39 7
2 PA
2
6
17
4
1
3
21
4
9
3 60 96 60 383 214 169
40 2
4 CA
3
6
24
9
3
1
21
4
5
5
15
2 249 214 35 68 106
41 0
7 GE
2
0
17
4
6
0
10
6 174 106 -
6
5
10
6 68 68 - 43 152
42 9
3 DE
8
8
11
2
1
3
21
4
7
9 87 23 214
34
3
21
4
12
9
43 3
5 CA
5
5
24
9
4
9
21
4
4
7
15
2 284 214 70 08 60
44 8
0 DE
8
3
13
1
5
9
21
4
1
1
21
4 67 106
26
0
21
4 46
45 1
7 GE
4
5
24
9
6
4
10
6 249 106 -
3
9
15
2
14
3
14
3 - 42 152
46 0
4 GE
1
2
17
4
4
3
15
2 174 152 -
2
9
21
4 22 22 - 77 87
47 4
5
G
Y
1
0 79
3
1
21
4
1
5
21
4 79 79 - 61 106
48 2
0 CA
2
2
17
4
7
0
10
6
3
1
21
4 244 106 138 92 60
49 0
3 GE
7
7
13
1
6
6
10
6 131 106 -
1
2
21
4 25 25 - 46 152
50 8
8 DE
4
6
24
9
7
5
10
6
9
7 60 91 60
29
5
10
6
18
9
- - 138 - 169 18
9

A Simulation Study on M/M/1 and M/M/C Queueing Model in a Multi Speciality Hospital 2905
SIMULATION CALCULATION
Average queue length on Cardiologist = 2.76
Average queue length on Paediatrician = 3.38
Average queue length on Dentist = 3.78
Average queue length on General & Gynaecologist = 0
ANALYTICAL CALCULATION
Average number of arrival = 171.26
Average number of service = 148.5
Arrival rate λ = 0.0058
Service rate μ = 0.0067
Average queue length on General & Gynaecologist = 0.2
CONCLUSION
The simulation table 6(a) is presented for queueing system with parallel services for
five departments served by one doctor each respectively. The collected data for the
arrival and service distribution has been analyzed using Monte Carlo Simulation
method, which is compared to the analytical method. The simulation method almost
coincides with analytical method. Also various departments’ queue lengths have been
analyzed in simulation method. The queue lengths for two of the departments
(General and Gynaecology) are seen to be higher than other departments, as shown in
table 6(a). So the multi server system has been introduced for those two departments
to decrease the queue length, as seen in table 6(b). From the above discussion, we can
deduce that this study will guide us to develope an efficient procedure to take
managerial decisions in a multi speciality hospital.
REFERENCES
[1] Erlang,A.K (1909), “The Theory of Probabilities of Telephone
Conversations”, Nyt Jindsskriff Mathematic, B20, 33-39.
[2] Shanmugasundaram,S. and Punitha,S (2014), “A Simulation Study on Toll
Gate System in M/M/1 Queueing Models”, IOSR – Journal of Mathematics, e
– ISSN: 2278 – 5728, p – ISSN :2319 – 765X, Volume 10, Issue 3.
[3] Syed Shujauddin Sameer(2014), “Simulation: Analysis of Single Server
Queueing Model”, International Journal on Information Theory, Vol.3, No.3.
[4] Soemon Takakuwa and Athula Wijewickrama(2008), “Optimizing Staffing
Schedule in Light of Patient Satisfaction for the whole Outpatient Hospital
2906 S.Shanmugasundaram and P.Umarani
Ward” , Proceedings of the 2008 Winter Simulation Conference 978 - 1 - 4244
-2708 – 6/08.
[5] Ishan P Lade, Sandeep A Chowriwar and Pranay B Sawaitul(2013),
“Simulation of Queueing Analysis in Hospi.tal” , International Journal of Mechanical Engineering and Robotics Research, ISSN 2278 – 0149, Vol. 2,
No. 3..
[6] Shanmugasundaram,S. and.Umarani.P(2016), “A Simulation Study on M/M/1
Queueing Model in a Medical Centre”, IJSR – International Journal of Science and Research, pp284 – 288, e – ISSN :2319 - 7064, Volume5, Issue 3.
[7] Kim,B.J(2011), “Conceptualization of Traffic Flow for Designing, Toll Plaza
Configuration: A Case Study using Simulation with Estimated Traffic
Volume”, International Journal of Industrial Engineering, 18(1): 51 – 57.
[8] Shanmugasundaram,S. and Banumathi.P (2016), “A Survey on Future
Behaviour of Railway System under M/M/1 Queueing Models”, Mathematical Sciences International Research Journal, Volume 5 Issue 2.
[9] Shanmugasundaram,S. and Umarani.P(2016), “A Simulation Study on
M/M/1and M/M/C Queueing Models in a Medical Centre”, Mathematical Sciences International Research Journal, Volume 5 Issue 2.