A Seismic-Reflection Investigation - USGS · A seismic-reflection investigation of gas hydrates and...
19
A seismic-reflection investigation of gas hydrates and sea-floor features of the upper continental slope of the Garden Banks and Green Canyon regions, northern Gulf of Mexico: Report for cruise G1-99-GM (99002) by Alan Cooper 1 , David Twichell 2 , Patrick Hart 1 Open-File Report 99-570 1999 This report is preliminary and has not been reviewed for conformity with U.S. Geological Survey editorial standards or with the North American Stratigraphic Code. Any use of trade, firm, or product names is for descriptive purposes only and does not imply endorsement by the U.S. Government. U.S. DEPARTMENT OF THE INTERIOR U.S. GEOLOGICAL SURVEY 1 Menlo Park, California 2 Woods Hole, Massachusetts
Transcript of A Seismic-Reflection Investigation - USGS · A seismic-reflection investigation of gas hydrates and...

A seismic-reflection investigation of gas hydrates and sea-floorfeatures of the upper continental slope of the Garden Banks andGreen Canyon regions, northern Gulf of Mexico:Report for cruise G1-99-GM (99002)
by Alan Cooper1, David Twichell2, Patrick Hart1
Open-File Report 99-570
1999
This report is preliminary and has not been reviewed for conformity with U.S. GeologicalSurvey editorial standards or with the North American Stratigraphic Code. Any use of trade,firm, or product names is for descriptive purposes only and does not imply endorsement bythe U.S. Government.
U.S. DEPARTMENT OF THE INTERIORU.S. GEOLOGICAL SURVEY
1Menlo Park, California2Woods Hole, Massachusetts

2
Introduction
During April 1999, the U.S. Geological Survey (USGS) conducted a 13-day cruise in theGarden Banks and Green Canyon regions of the Gulf of Mexico (Figures 1 and 2). The R/VGyre, owned by Texas A&M University, was chartered for the cruise. The general objectiveswere (1) to acquire very high resolution seismic-reflection data and side-scan sonar images ofthe upper and middle continental slope (200-1200-m water depths), (2) to study the acousticcharacter and features of the sea floor for evidence of sea-floor hazards, and (3) to look forevidence of subsurface gas hydrates and their effects.
The Gulf of Mexico is well known for hydrocarbon resources, with emphasis now on frontierdeep-water areas. For water depths greater than about 250 m, the pressure-termperatureconditions are correct for the development of shallow-subsurface gas hydrate formation(Anderson et al., 1992). Gas hydrates are ice-like mixtures of gas and water (Kvenvolden,1993). They are known to be present from extensive previous sampling in sea-floor cores andfrom mound-like features observed on the sea floor in many parts of the northern Gulf,including the Green Canyon and Garden Banks areas (e.g., Roberts, 1995). Seismic-reflectiondata are extensive in the Gulf of Mexico, but few very-high-resolution data like those neededfor gas-hydrate studies exist in the public domain. The occurrence and mechanisms of gashydrate formation and dissociation are important to understand, because of their perceivedeconomic potential for methane gas, their potential controls on local and regional sea-floorstability, and their possible effects on earth climates due to massive release of methanegreenhouse gas into the atmosphere.
Three high-resolution seismic-reflection systems and one side-scan sonar system were used onthe cruise to map the surface reflectance and features of the sea floor and the acousticgeometries and character of the shallow sub-surface (Table 1). The cruise was designed toacquire regional and detailed local information. The regional survey covered an area about3400 km2 in the Green Canyon and Garden Banks regions. Data recorded included 15 cu. in.water gun multichannel seismic-reflection and Huntec boomer information. Detailed surveyswere planned in two parts of the study area, but due to a winch failure only one detailedsurvey was done in the Green Canyon area. The detailed survey included collection of 15 cu.in. water gun multichannel seismic-reflection, chirp seismic-reflection, and side-scan data.
The regions surveyed include basins and ridges formed by salt movements and characterizedby thick surficial, relatively young (Pleistocene and younger) sediments. Swath-bathymetrydata (Figure 2) show that the sea floor has extensive sea-floor faults, piercement features, andslumps -- features whose development may be related partly to shallow gases and gashydrates.
The specific objectives of the cruise were (a) to investigate the distribution and character ofpotential sea-floor failures (hazards) and their relationship to known and inferred gas hydratedeposits; (b) to image known and suspected gas hydrate features with different seismic-reflection systems to look at systematic variations in sub-surface structure in gas hydrate andnon-hydrate areas; (c) to outline the shallow structures of the gas hydrate stability zoneincluding shallow water-flow areas, to ascertain the potential impact of gas hydrate

Figure 1. Index maps showing (A) shaded-relief bathymetry in the northern Gulf of Mexico, with box around the Green Canyon and Garden Banks study area, and (B) bathymetric contours at 200 m intervals, and locations of seismic-reflection tracklines for cruise G1-99-GM. Sidescan and chirp seismic-reflection data were collected only in detailed surveys in the eastern part of the area (i.e., Green Canyon area).

Figure 2. Shaded-relief map of NOAA swath bathymetry data in the study area. Locations of seismic-reflection tracklines for cruise G1-99-GM are also shown. The irregular bathymetry of basins, rises and sea-floor displacements result principally from movements of deep-seated salt.
3
formation/distribution on stability of the sea floor. Although seismic data alone cannot beused to identify gas hydrate deposits unequivocally, they are useful in delineating theanomalous subsurface features (e.g., structures, acoustic facies, seismic-attributes, etc.) thatare commonly associated with areas where gas hydrates have been recovered in cores.
During the cruise, about 1400 km of high resolution multichannel and single-channel seismic-reflection data and about 500 km of side-scan and chirp seismic-reflection data were recorded(Figures 1 and 2). The following report describes the field operations and equipment systemsemployed, gives some examples of ship-board seismic-reflection records, and outlines a fewpreliminary results.
Cruise science staff
Alan Cooper Co-chief scientist, Geophysicist USGS-Menlo ParkDavid Twichell Co-chief scientist, Oceanographer USGS-Woods HoleChris Anton Geologist USGS-Woods HoleJeffrey Brody Computer specialist USGS-Menlo ParkBill Danforth Geologist USGS-Woods HoleDave Foster Geologist USGS-Woods HolePatrick Hart Geophysicist USGS-Menlo ParkBarry Irwin Geophysicist USGS-Woods HoleLarry Kooker Electronics Technician USGS-Menlo ParkDavid Nichols Electronics Technician USGS-Woods HoleThomas Obrien Electronics Technician USGS-Woods HoleWalter Olsen Mechanical Technician USGS-Menlo ParkGraham Standen Huntec deep-tow technician GCHarold Williams Mechanical Technician USGS-Menlo Park
Affiliations:GC: Geoforce Consultants (under contract to USGS)USGS: U. S. Geological Survey, Menlo Park, CA
Equipment Systems
The equipment systems used during the cruise are listed in Table 1. All equipment wasprovided by USGS, with exception of a spare 15 in3 water gun that was furnished byUniversity of Mississippi. An operations log showing the amounts of data recorded with thesesystems is outlined in Table 2. Appendix A gives a detailed list of trackline data collected.Survey speeds ranged from 2.5 to 4.5 knots. Seismic-reflection systems were fired at differentenergy levels and rates, as noted. The seismic-reflection data were sampled at fast rates (4kHz to 33 kHz) at or near the capacity of the recording systems, to attain the greatest possibleresolution of waveforms for later data analysis. With the fast rates, nearly 60 gigabytes ofdata were recorded during the 8 days of data collection.
Seas were mixed with highly variable wind condtions and seas generally less than 4-6 feet,but operations were halted during a 2-day storm. Data quality is generally good, but is

4
affected in various places by noise from several sources: seismic-shooting ships, cross-talkbetween boomer and water-gun seismic-reflection systems, and nearby drilling operations.Additional information about the data recorded on the cruise, and its public availability can beobtained at the website:
http://walrus.wr.usgs.gov/docs/infobank/tiger/g/g199gm/html/g-1-99-gm.meta.html
Table 1: Equipment systems used on cruise G1-99-GM (99002)
System Components Comments
Navigation A USGS real-time YONAV system was used forlab/bridge display of positions and data recording.Inputs were from a KVH Heading Indicator and aSATPAK DGPS receiver.
Raster images of NOAAswath bathymetry weredisplayed for real-timepositioning of tracks, to crosssea-floor features of interest.
High-resolutionmulti-channelseismic-reflection
MCS data were recorded using a 24-channel ITIstreamer with 10 m groups and 3 phones per group. Thestreamer was towed at an estimated 1-3 m depths (nodepth sensors on the streamer), and farthest offsetchannel was about 270 m behind the source. AGeometrics STRATAVIEW with marine controller and2/4 gbyte DAT tape drive was used for the digitalrecording system. The source was a 15 in3 water gunfired by a SureShot gun-timing system. The navigationsystem provided gun-shot-triggers on a constant-timebasis. A 50 scfm Bauer Compressor provided air at apressure of about 2000 psi.
MCS data were sampled at 4kHz rate; and, one tracedisplayed aboard ship with aPrintrex thermal plotter, viathe STRATAVIEW marinecontroller. Water gun wasfired at 6 sec. intervals, andtowed about 1m depth.
Huntec A Huntec system owned by USGS was used, with itsboomer source fired at variable power settings of 500-1000 joules. The systems two receivers were used (ahydrophone inside of the tow fish and a 1-m-long, 3-element streamer towed behind the fish). Fish towdepth was about 150 m at a ship speed of 3.5 kt.Seismic signals from the fish were fed throughshipboard amplifier/filters (set to OUT) and then to theMudSeis recording systems and EPC graphic recorder.
The boomer was fired atrates of 0.75 -1.25 sec.depending on water depth.Data were recorded at 32kHz sampling rate. For thelast half of the cruise, asecond external streamer wasadded in place of the internalhydrophone. 60 hz noise iscommon.
Side Scan A DataSonics SIS-1000 side-scan fish was used. Side scan fired at 1 sec. rategiving a range of 750 m toeach side of the tow fish.
Chirp seismic-reflection
An internal chirp seismic-reflection system in the SIS-1000 system was used.
Fired at 1 sec. rate, with sidescan.

5
Table 2: Operations log for cruise G1-99-GM (99002)
Operation Time Spent Data Collected Comment
Multichannel seismic-reflection: water gun
~199 hours ~1400 km along 68seismic-reflectiontracklines
15 in3 water gun; done on allseismic-reflection and side-scantracklines.
Huntec deep-towseismic-reflectionsystem
~129 hours* ~900 km along 44seismic-reflectiontracklines
Boomer source; not done when chirpseismic-reflection was used.
Chirp seismic-reflectionsystem
~71 hours* ~500 km along 24seismic-reflectiontracklines
4-10 kHz chirp swept source
Side-scan system ~71 hours ~500 km along 24 side-scan tracklines
100 kHz side-scan
Transit ~49 hours* none To/from operational areaEquipment downtime ~10 hours* none Startup and repairsWeather delay ~53 hours* none Transit and 23-hour layoverTOTAL 312 hours 13 days (total of * items)
Onboard Data Processing
Data from the SIS-1000 and multichannel seismic-reflection systems were partly processedonboard ship during the cruise to facilitate data access and display.
MCS system: SEG-D digital data on magnetic tapes written by the field recording systemwere reviewed, edited, compiled into complete profiles, and written to tape in SEG-Y formatfor later processing at the Menlo Park(CA) processing facility.
SIS system: Raw side-scan sonar data from the SIS data were corrected for water travel pathand ship's position to created georeferenced images that were used to create a sea-floor mosaicshowing sea-floor backscatter. The chirp seismic-reflection profiles were cleaned up, mergedwith navigation information and plotted in profile format. The navigation and chirp seismic-reflection data were combined with other shipboard information (e.g., descriptive text,shipboard photos, etc.) and written to a set of CD-ROMs for later data reference (Foster et al.,1999).
Seismic-reflection StudiesThe seismic-reflection studies (Table 3) were conducted in water depths of 250 to 1200 m, andare in two general categories: 1) those focussing on the subsurface distribution andcharacterization of gas hydrates and related features of the gas hydrate stability zone and 2)those directed toward acoustic characterization of the sea-floor and the relation of gas hydratesand related features to sea-floor stability and mass-wasting deposits. The three seismic-reflection data sets are directed principally to the first objective, and the side-scan and chirpseismic-reflection data sets are focused largely to the second.

6
Table 3: Seismic-reflection studies done on cruise G1-99-GM
Study Area Comments
Structure and stratigraphy ofthe upper sedimentary sectionand the geometry and extent ofthe gas-hydrate stability zone(GHSZ).
Upper- to middle-continentalslope from about 300 m waterdepth (i.e, the approximate depthof shallowest known gas hydrateoccurrence in the Gulf) to about1200 m water depth.
Look for seismic-reflectionevidence of gas hydrates, trappedgases, fluid-flow zones, andlocal/regional GHSZ thicknessvariations on long profiles acrossthe continental slope.
Acoustic characterization ofthe sea floor to identifypossible links between gashydrates, sea-floor failures,mass-wasting deposits andother sea-floor features (e.g.authigenic deposits, muddiapirs)
Upper- to middle-continentalslope where steep sea-floorbathynetric gradients are known,where fault scarps are common,and where areas of highbackscatter occur.
Look for regional correlations ofsea-floor features in swathbathymetry, backscatter, andnear-surface seismic-reflectiondata to understand role of gashydrates.
Possible links between sea-floor failures, shallow faulting,intrusive structures and gashydrates of the uppermostsedimentary section.
Areas of apparent sea-floor scarpsand slumps on the continentalslope, based on regional 100-m-gridded swath bathymetry data.
Attempt to identify the role, ifany, of gas hydrates in surfaceand sub-surface failures.
The following sections briefly describes the field studies (Table 3), and gives a few examplesof initial field observations.
Structure and stratigraphy
Extensive studies on the structure and stratigraphy of the Northern Gulf of Mexico and GreenCanyon and Garden Banks regions have been done (e.g., Goodwin and Prior (1989), Weimeret al. (1998)). Yet, few long regional high-resolution multichannel seismic-reflection profilesacross the upper- and middle-slope have been published. We recorded many regional profilesto establish the regional seismic character and variability of the shallow Pleistocene andyounger sedimentary section that is locally strongly deformed by deep-seated salt structures.The three seismic-reflection systems imaged the sedimentary section at variable vertical andlateral resolutions to a maximum depth of at least the sea-floor multiple reflection. Profilelocations were chosen using NOAA swath bathymetry maps, to extend from near the shelfedge down the slope across typical basin and rise features that have locally faulted sea-floors,sometimes with anomalous acoustic features on the sea floor (Figure 3). Some profiles weredown the axis of basins, and others crossed the basin flanks and salt diapirs. Profile locationswere also chosen to cross sites where shallow-water flows have been reported in drill holesand where sea-floor gas hydrate deposits have been cored or seen from submersibles.

Figure 3. Example of side-scan data recorded on cruise G1-99-GM in the Green Canyon area, shown sea-floor backscatter information. Light colored areas are high backscatter (hard ground) and dark areas are low backscatter (soft ground). High backscatter is associated with sea-floor fault and diapir systems where gases, fluids, sediment rise to the seafloor resulting in likely diagenetic deposits (e.g., authigenic carbonates), gas hydrates (where stable), brines, and coarse or disrupted sediments. Blocky lines show approximate water depths. Solid white line is location of seismic-reflection Line 15 in Figure 4.
7
The extent of the gas hydrate stability zone (GHSZ) in the study area is not well knownbecause of potentially large variations in factors that affect hydrate-stability (e.g., water- andsubsurface-temperatures, gas concentrations and compositions, pore-water salinities, localover-pressures, etc). A bottom simulating reflection (BSR), found elsewhere at the base of theGHSZ was not observed; however, along many regional profiles the shallowest occurrence ofchaotic-seismic-facies zones with high-amplitude reflections (possible shallow gas?) in theupper sedimentary section deepened with increasing water depths -- much like thecharacteristic behavior of BSRs. The chaotic zones are stratigraphically controlled, and inmany cases where they lie close to the base of the estimated GHSZ, seismic amplitudesincrease (i.e., possible gas trapped beneath hydrate or stratigraphic horizons?). In areas ofcomplex shallow structure near piercement features, where gas hydrates have been sampledby others, local high-amplitude reflections with cross-cutting geometries are sometimesrecorded. These reflections may be from trapped gases or deformation features near the baseof GHSZ.
Acoustic characterization
The acoustic character of the seafloor and upper-sedimentary sections is highly variable. Thesea floor ranges from low-backscatter (dark) to very-high back-scatter (light) tones (Figure 3).The seismic signatures at several resolutions range from well-stratified to seismically opaque(Figures 4, 5, and 6). Areas of structural complexity are commonly marked by seismic wipe-out zones or by few coherent reflections that also have a high-backscatter signature in theside-scan images. Areas underlying known sea-floor gas hydrates commonly exhibit similarwipe-out zones with some high-amplitude chaotic seismic facies. Over broad basinal andbasin-flank areas, the upper sedimentary section is uniformly stratified but laterally deformedin thin horizons (10-50 m thick) that can be traced over large distances, up to tens ofkilometers. In these areas, side-scan images show low back-scatter for the sea floor. In someplaces on the upper slope, the thin deformed horizons may extend up to the seafloor wherethey outcrop and are marked by areas of high backscatter (Figures 3 and 4). The highbackscatter here and across similar sea-floor features on the upper slope is likely hardgroundpossibly including coarse sediment, authigenic carbonates, hydrates, and other debris. Onbasin floors, the shallow subsurface is marked in many places by chaotic or seismicallyopaque zones that also have high sea-floor backscatter -- these are likely channel and mass-wasting deposits.
The profiles across the continental slope also exhibit strong local amplitude variations in theupper sedimentary section. Many factors can cause high-amplitude reflections (e.g., large-impedance contrasts with interbedded gas, sands, gas hydrates; geometric focusing; etc.). Inthe shallow subsurface depths, the acoustic facies and geometries of high-amplitudereflections are suggestive of gas accumulations (Figures 5 and 6); however, the polarity of thereflections, expected to be negative from gas deposits, could not be determined in the fielddata. Large-amplitude variations are also observed (a) in zones along underlying structures,especially on the flanks and crests of ridges, in places where gases and fluids may beadvecting along faults and diffusing through the uppermost strata, and (b) where gas hydratesand authigenic deposits are found above shallow diapiric structures of likely mud/sand

Figure 4. Examples of seismic-reflection Line 15 recorded across a fault zone during cruise G1-99-GM. A. Chirp seismic-reflection, and B. Water gun seismic-reflection. Chirp seismic-reflection show a likely mud volcano adjacent to the fault zone where near-surface seismic-reflection amplitudes are high and the seafloor is disrupted. Water gun data illustrate that the high-amplitude reflections extend downward in two zones, one that projects steeply (i.e., the master fault with likely gas/fluid) and another that projects laterally along apparent stratigraphy (i.e., a potential gas/fluid charged stratal unit). The fault zone has high backscatter at the sea floor (Figure 3), and is an area of likely upward migrating gases, fluids, and mobilized sediment, with contributions from the two subsurface high-amplitude zones.

Figure 5. Example of water-gun seismic-reflection Line 12 recorded across the upper continental slope during cruise G1-99-GM. A well-stratified unit covers sediments with acoustic-wipeout and high-amplitude zones, broadly associated with deep-seated diapir and fault structures. Shallow water flows are reported from the area (0.6-0.9 sec water depths) where a chaotic high-amplitude zone (gases?) occurs and where shallow faults that displace uppermost strata sole out. Hydrates are stable near the sea-floor at these depths, depending on gas compositions and bottom-water temperatures. Here, as elsewhere, subsurface faulting and intrastratal deformation that displaces the sea floor seems enhanced by gas/fluid flows, which may in places be controlled at shallow depths partly by features of the gas hydrate stability zone.

Figure 6. Example of Huntec seismic-reflection Line 12 recorded across a large diapir structure (i.e., Figure 5) beneath the upper continental slope during cruise G1-99-GM. Numerous near-vertical faults are seen with some sea-floor scarps and mound-like features. Localized high-amplitude chaotic reflections may be from gassy and/or disrupted strata. The area is marked by high sea-floor backscatter.

8
derived from adjacent buried beds. Where shallow strata are within the estimated gas hydratestability zone, large amplitude variability occurs locally within chaotic subsurface layerssandwiched between well-stratified units. Some of these occurrences are in areas whereshallow-flows have been encountered in drill holes. In general, the large-amplitude variabilityin the shallow subsurface appears stratigraphically and to a lesser extent water-depthcontrolled, but the specific explanations require further analysis and acquisition of detailedgeologic core data.
In side-scan data, the sea-floor commonly has high backscatter over the crests of saltstructures and along fault zones where gas hydrates, authigenic carbonates, and biologiccommunities have been observed. High backscatter is also found on steep slopes and in basinfloors associated with mass-wasting deposits. Backscatter is generally low over slope andbasin areas that are dominated by well stratified and undisrupted strata.
Possible links
The new side-scan and high-resolution seismic-reflection data provide additional evidence, tothe 1998 cruise data (Cooper et al., 1999), to suggest that gas hydrates are more widespread atthe sea floor, and possibly below, than currently known from other studies (e.g., Roberts,1995). Features suggestive of the gas hydrates occur near many of the extensive sea-floorfailures evident in the NOAA swath bathymetry data across the continental slope (Figure 2) –failures that are in turn related on a regional scale to underlying salt movements anddevelopment of the numerous basins and rises. On a local scale, structures possiblyassociated with sea-floor gas hydrate deposits are complex and varied (e.g. diapirs, circularfault systems, en echelon headwall scarps, etc.), and in many cases are also associated withnearby mass-wasting features. Tracklines were run across many such sea-floor and buriedfailures (e.g., slumps, slides, flows) to determine the extent to which they may be affected orcaused by shallow gas-hydrate-related processes.
In swath bathymetry data, sea-floor failures range widely in displacement and style of failure.In shipboard seismic-reflection profiles, the displacements commonly increase at depthimplying prior and continuing deformation to the present time. Lateral intrastrataldeformation within shallow and thin layers along which potentially large areas of the sea-floorhave moved (or be moving?) is also observed. These deformed layers can be traced in placesupslope to sea-floor failures (e.g., Figure 4). In other places, the widespread lateraldeformation is confined to a thin zone sandwiched between flat lying strata. The associationof such features, some of which may be actively moving and deforming the sea floor, withpossible shallow-subsurface gas deposits (e.g., Figure 5) at depths where gas hydrates arestable, suggests that such failures and gas hydrates are linked. Further assessment of thepotential role of gases and gas hydrates in facilitating slope and sea-floor failures awaits dataprocessing and analysis.
Summary
High resolution seismic-reflection profiles and side-scan sonar images were recorded in April1999 across the Green Canyon and Garden Banks regions of the Gulf of Mexico to study the

9
distribution of potential gas hydrates, and to determine the link, if any, between gas hydratesand known slope and sea-floor failures. Shipboard records show evidence of widespreadshallow gas and subsurface deformation within or directly below the estimated gas hydratestability zone. These data, after futher processing, should more clearly illustrate therelationship between migrating gases/fluids, gas hydrates and slope and sea-floor failurefeatures.
Acknowledgments
Funding for the cruise was from the USGS Coastal and Marine Geology Program and a grantfrom the Department of Energy. We gratefully acknowlege the efforts of the ships's crew, theUSGS science-support staff, and the Geoforce technician to ensure a safe and productivecruise. The Minerals Management Service, New Orleans, provided valued assistanceaccessing data used in site selections. We thank the University of Mississippi for the use oftheir 15 cu.in. water gun. We appreciate the help of Rebecca Cooper in compiling data andpreparing maps, and Michael Hamer and Carolyn Degnan in preparation of swath-bathymetrymaps.

10
References
Anderson, A.L., Sloan, E.D., and J.M. Brooks, 1992, Gas hydrate recoveries in the Gulf ofMexico: What is the shallow water depth limit for hydrate occurrence?, Proceedings 24 thOffshore Technology Conference (1992), Paper 6853, 381-385.
Cooper, A.K., Hart, P., and I. Pecher, 1999, Cruise Report for aa seismic investigation of gashydrates in the Mississippi Canyon region, northern Gulf of Mexico -- Cruise M1-98-GM,U.S. Geological Survey Open-file report 98-506, 25 p.
Foster, D.S., Twichell, D.C., Danforth, W.W., Irwin, B.J., Nichols, D.R., and O'Brien, T.F.,19XX, Archive of Datasonics SIS-1000 chirp subbottom data collected during USGS cruiseGYRE 99002, Gulf of Mexico, 9-22 April, 1999: USGS Open-File Report 99-XXX, 3 CD-ROMs.
Goodwin, R.H., and D.B. Prior, 1989, Geometry and depositional sequences of theMississippi Canyon, Gulf of Mexico, Journal of Sedimentary Petrology, 59/2, 318-329.
Kvenvolden, K. A., 1993, Gas hydrates -- geological perspective and global change, Rev.Geophys, 31(2), 173-187.
Roberts, H. H., 1995, High-resolution surficial geology of the Louisiana middle-to-uppercontinental slope, Gulf Coast Association of Geological Societies Transactions, v. XLV, p.503-508.
Weimer, P. et al., 1998, Sequence stratigraphy of Pliocene and Pleistocene turbidite systems,northern Green Canyon and Ewing Bank (offshore Louisiana), northern Gulf of Mexico,AAPG Bulletin, 82/5B, 918-960.

11
Figure Captions
Figure 1. Index maps showing (A) shaded-relief bathymetry in the northern Gulf of Mexico, withbox around the Green Canyon and Garden Banks study area, and (B) bathymetric contours at 200 mintervals, and locations of seismic-reflection tracklines for cruise G1-99-GM. Sidescan and chirpseismic-reflection data were collected only in detailed surveys in the eastern part of the area (i.e.,Green Canyon area).
Figure 2. Shaded-relief map of NOAA swath bathymetry data in the study area. Locations ofseismic-reflection tracklines for cruise G1-99-GM are also shown. The irregular bathymetry ofbasins, rises and sea-floor displacements result principally from movements of deep-seated salt.
Figure 3. Example of side-scan data recorded on cruise G1-99-GM in the Green Canyon area,shown sea-floor backscatter information. Light colored areas are high backscatter (hard ground) anddark areas are low backscatter (soft ground). High backscatter is associated with sea-floor fault anddiapir systems where gases, fluids, sediment rise to the seafloor resulting in likely diageneticdeposits (e.g., authigenic carbonates), gas hydrates (where stable), brines, and coarse or disruptedsediments. Blocky lines show approximate water depths. Solid white line is location of seismic-reflection Line 15 in Figure 4.
Figure 4. Examples of seismic-reflection Line 15 recorded across a fault zone during cruise G1-99-GM. A. Chirp seismic-reflection, and B. Water gun seismic-reflection. Chirp seismic-reflectionshow a likely mud volcano adjacent to the fault zone where near-surface seismic-reflectionamplitudes are high and the seafloor is disrupted. Water gun data illustrate that the high-amplitudereflections extend downward in two zones, one that projects steeply (i.e., the master fault with likelygas/fluid) and another that projects laterally along apparent stratigraphy (i.e., a potential gas/fluidcharged stratal unit). The fault zone has high backscatter at the sea floor (Figure 3), and is an area oflikely upward migrating gases, fluids, and mobilized sediment, with contributions from the twosubsurface high-amplitude zones.
Figure 5. Example of water-gun seismic-reflection Line 12 recorded across the upper continentalslope during cruise G1-99-GM. A well-stratified unit covers sediments with acoustic-wipeout andhigh-amplitude zones, broadly associated with deep-seated diapir and fault structures. Shallow waterflows are reported from the area (0.6-0.9 sec water depths) where a chaotic high-amplitude zone(gases?) occurs and where shallow faults that displace uppermost strata sole out. Hydrates are stablenear the sea-floor at these depths, depending on gas compositions and bottom-water temperatures.Here, as elsewhere, subsurface faulting and intrastratal deformation that displaces the sea floorseems enhanced by gas/fluid flows, which may in places be controlled at shallow depths partly byfeatures of the gas hydrate stability zone.
Figure 6. Example of Huntec seismic-reflection Line 12 recorded across a large diapir structure(i.e., Figure 5) beneath the upper continental slope during cruise G1-99-GM. Numerous near-verticalfaults are seen with some sea-floor scarps and mound-like features. Localized high-amplitudechaotic reflections may be from gassy and/or disrupted strata. The area is marked by high sea-floorbackscatter.

12
Appendix A: Trackline specifications for cruise G1-99-GM
Line # JulianDay
StartTime
EndTime
LineDirection
DataTypes
test1 100 1751 1825 SW-NE mcs,ss,ctest2 100 1828 2236 SW-NE mcs,ss,c
1 100 2254 0203 N-S mcs,ss,c2 101 0228 0447 SE-NW mcs,ss,c3 101 0451 0700 N-S mcs,ss,c4 101 0701 0808 S-N mcs,ss,c5 101 0809 1131 E-W mcs,ss,c6 101 1218 1619 NE-SW mcs, h7 101 1630 1731 E-W mcs, h8 101 1732 2050 SE-NW mcs, h9 101 2103 2231 W-E mcs, h10 101 2231 2338 NE-SW mcs, h11 101 2346 0013 SE-NW mcs, h12 102 0137 0451 N-S mcs, h13 102 0458 0634 SE-NW mcs, h14 102 0635 0832 S-N mcs, h15 102 0902 1343 W-E mcs,ss,c16 102 1355 1733 E-W mcs,ss,c17 102 1740 2309 W-E mcs,ss,c18 102 2312 0228 E-W mcs,ss,c19 103 0308 0703 W-E mcs,ss,c20 103 0713 1114 E-W mcs,ss,c21 103 1123 1522 W-E mcs,ss,c22 103 1534 1905 E-W mcs,ss,c23 103 1921 2328 W-E mcs,ss,c24 104 0021 0105 E-W mcs,ss,c25 104 0325 0754 W-E mcs,ss,c26 104 0810 1238 E-W mcs,ss,c27 104 1252 1540 W-E mcs,ss,c28 106 2112 2344 S-N mcs, h29 107 0003 0024 E-W mcs, h30 no line - - - -31 107 0241 0502 N-S mcs, h32 107 0508 0819 SE-NW mcs, h33 no line - - - -34 107 0827 1545 NE-SW mcs, h35 107 1548 1653 E-W mcs, h36 107 1654 2037 NW-SE-NW mcs, h37 107 2050 2333 SE-NW mcs, h38 107 2348 0018 NE-SW mcs, h
13
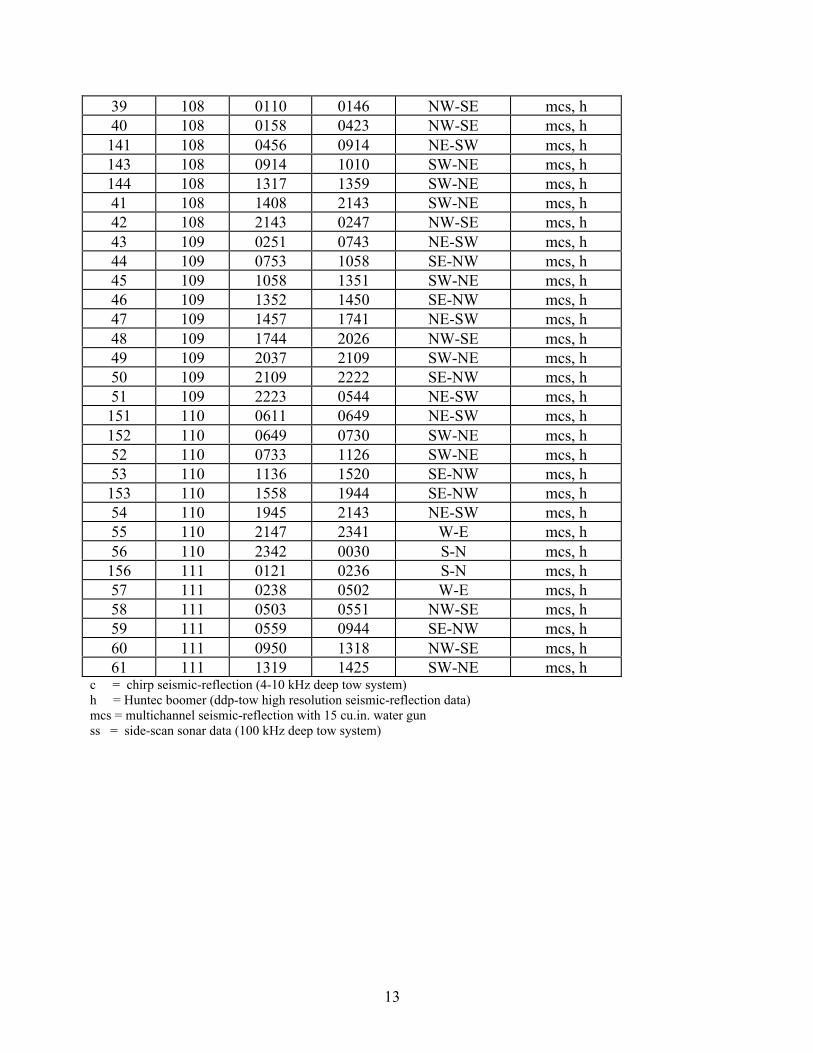
39 108 0110 0146 NW-SE mcs, h40 108 0158 0423 NW-SE mcs, h141 108 0456 0914 NE-SW mcs, h143 108 0914 1010 SW-NE mcs, h144 108 1317 1359 SW-NE mcs, h41 108 1408 2143 SW-NE mcs, h42 108 2143 0247 NW-SE mcs, h43 109 0251 0743 NE-SW mcs, h44 109 0753 1058 SE-NW mcs, h45 109 1058 1351 SW-NE mcs, h46 109 1352 1450 SE-NW mcs, h47 109 1457 1741 NE-SW mcs, h48 109 1744 2026 NW-SE mcs, h49 109 2037 2109 SW-NE mcs, h50 109 2109 2222 SE-NW mcs, h51 109 2223 0544 NE-SW mcs, h151 110 0611 0649 NE-SW mcs, h152 110 0649 0730 SW-NE mcs, h52 110 0733 1126 SW-NE mcs, h53 110 1136 1520 SE-NW mcs, h153 110 1558 1944 SE-NW mcs, h54 110 1945 2143 NE-SW mcs, h55 110 2147 2341 W-E mcs, h56 110 2342 0030 S-N mcs, h156 111 0121 0236 S-N mcs, h57 111 0238 0502 W-E mcs, h58 111 0503 0551 NW-SE mcs, h59 111 0559 0944 SE-NW mcs, h60 111 0950 1318 NW-SE mcs, h61 111 1319 1425 SW-NE mcs, h
c = chirp seismic-reflection (4-10 kHz deep tow system)h = Huntec boomer (ddp-tow high resolution seismic-reflection data)mcs = multichannel seismic-reflection with 15 cu.in. water gunss = side-scan sonar data (100 kHz deep tow system)