
A Review of Offshore Windfarm Related Underwater Noise Sources
63
Submitted to: Submitted by: Cathryn Hooper Daren Howell The Crown Estates Office Subacoustech Ltd 16 Carlton House Terrace Chase Mill London Winchester Road SW1Y 5AH Bishops Waltham Southampton Hants SO32 1AH Tel: +44 (0) 20 7210 4377 Tel: +44 (0) 1489 891849 Fax: +44 (0) 20 7839 7847 Fax: +44 (0) 8700 513060 email: [email protected] email: [email protected] website: www.subacoustech.com This report has been commissioned by COWRIE Approved for release: A review of offshore windfarm related underwater noise sources. Report No. 544 R 0308 by Dr J. Nedwell & Mr D. Howell Oct 2004 The reader should note that this report is a controlled document. Appendix A lists the version number, record of changes, referencing information, abstract and other documentation details.
-
Upload
john-williamson -
Category
Documents
-
view
62 -
download
2
description
A concerted effort is currently being made by industry to minimize any undesirable effects relating to windfarm development and operation. One potential effect of offshore windfarm development is the creation of underwater noise. Although the effect of underwater noise is not fully understood, it has the potential to disturb, and in the most severe cases, harm marine wildlife. Possible effects include attraction towards a noise source, avoidance, temporary hearing damage and permanent physicalinjury. The Crown Estate own most of the seabed up to 12 nautical miles from the British coast and lease some of this area for windfarm development. They have set up the COWRIE (Collaborative Offshore Wind Research Into the Environment) trust to conduct research into offshore windfarm development, who have highlighted the effects of underwater noise as one of several priority areas for research. This report is a review of available information on underwater noise related to windfarm development. It is one part of a larger study into the effect of windfarm related underwater noise, which includes field surveys of underwater noise from wind turbines and windfarm construction.
Transcript of A Review of Offshore Windfarm Related Underwater Noise Sources

Submitted to: Submitted by:
Cathryn Hooper Daren HowellThe Crown Estates Office Subacoustech Ltd16 Carlton House Terrace Chase MillLondon Winchester RoadSW1Y 5AH Bishops Waltham
SouthamptonHants SO32 1AH
Tel: +44 (0) 20 7210 4377 Tel: +44 (0) 1489 891849Fax: +44 (0) 20 7839 7847 Fax: +44 (0) 8700 513060
email: [email protected] email: [email protected]: www.subacoustech.com
This report has been commissioned by COWRIE
Approved for release:
A review of offshore windfarm related underwater noise sources.
Report No. 544 R 0308
by
Dr J. Nedwell & Mr D. Howell
Oct 2004
The reader should note that this report is a controlled document. Appendix A lists the version number,record of changes, referencing information, abstract and other documentation details.

A review of offshore windfarm related underwater noise sources
www.subacoustech.com ii
Executive summary
IntroductionA concerted effort is currently being made by industry to minimise any undesirableeffects relating to windfarm development and operation. One potential effect ofoffshore windfarm development is the creation of underwater noise. Although theeffect of underwater noise is not fully understood, it has the potential to disturb, andin the most severe cases, harm marine wildlife. Possible effects include attractiontowards a noise source, avoidance, temporary hearing damage and permanent physicalinjury. The Crown Estate own most of the seabed up to 12 nautical miles from theBritish coast and lease some of this area for windfarm development. They have set upthe COWRIE (Collaborative Offshore Wind Research Into the Environment) trust toconduct research into offshore windfarm development, who have highlighted theeffects of underwater noise as one of several priority areas for research. This report isa review of available information on underwater noise related to windfarmdevelopment. It is one part of a larger study into the effect of windfarm relatedunderwater noise, which includes field surveys of underwater noise from windturbines and windfarm construction.
The windfarm lifecycleKnowing the length of time the marine environment is exposed to an underwaternoise source is useful when assessing environmental effect. To help in thisassessment, the lifecycle of an offshore windfarm is split into four phases. The firstof these phases is pre-construction.
Pre-constructionBackground noise may be used as a benchmark to assess the environmental impact ofnew sources. In shallow coastal waters, where offshore windfarms will be located inthe near future, not enough is known to predict the level of background noise.Activities that occur before construction begins on a windfarm include geophysicaland geotechnical survey, meteorological mast installation and an increase in vesseltraffic. Offshore windfarm geophysical surveys are typically conducted usingboomers and sparkers, but little is known about the level of underwater noise theseemit. No measurements are available of meteorological mast installation noise, butsince they have a similar foundation to wind turbines, the noise levels may be similar.
Vessel traffic will increase in the vicinity of windfarm before its construction andcontinue through to decommissioning. Measurements of the small vessels that arelikely to be used during survey are limited. A 25 m tug pulling an empty barge, ascenario that is likely to occur during windfarm construction, has been reported tohave a 170 dB re 1 µPa @ 1 m Source Level. The effect on marine wildlife fromvessel noise is not clear, with both attraction and avoidance reactions having beenobserved.
ConstructionMeasurements of the noise from offshore windfarm construction are currently scarce.A significant addition to available information will shortly be made with the

A review of offshore windfarm related underwater noise sources
www.subacoustech.com iii
publication of the report on underwater noise surveys of windfarm construction,which has been funded by COWRIE as part of this study.
One of most significant activities during windfarm construction is foundationinstallation. While no measurements of the noise from concrete (e.g. gravity supportstructures and caissons) foundation installation are available. Measurements areavailable of pile installation using both impact and vibro pile hammers. The mostrelevant of these is a measurement of wind turbine monopile foundation installation,giving Source Levels of 215 dB re 1 µPa @ 1 m. During this and other studies,marine wildlife monitoring and injury mitigation strategies have been put in placeduring pile driving. Both physical and behavioural effects on marine wildlife havebeen noted. Drilling may be required during piled foundation installation. However,measurements are only available of offshore oil and gas drilling operations, whichwill differ significantly from windfarm related drilling.
Dredging and rock laying may be undertaken during windfarm construction.Applications include scour protection, cable protection and modifying non-idealbathymetry (water depth). Some measurements of suction and hopper dredgers havebeen taken, and show a peak spectral Source Level of up to 177 dB re 1 µPa @ 1 mbetween 80-200 Hz. The measurements were conducted in shallow water and, wheresimilar techniques are used in windfarm development, these measurements may beused for comparison.
Other construction activities include cable laying, turbine and turbine towerinstallation, and ancillary structure (e.g. offshore transformers) installation, but nomeasurements of the noise from these processes are available. In addition to this,divers will be used throughout windfarm construction to carry out underwateractivities, and they may use a variety of tools. One set of measurements exists ofdiver tools, and these show peak Source Levels of up to 200 dB re 1 µPa @ 1 m.
OperationBy far the longest phase of a windfarm's lifecycle is the operational phase. Twomeasurements of offshore wind turbine noise are available. These show lowfrequency sound levels, with a Source Level spectra showing a maximum of 153 dBre 1 µPa @ 1 m at 16 Hz. The measurements are of individual turbines of a relativelylow power (less than 1 MW). Despite the low level, low frequency nature of thesound, behavioural reactions have been observed in a study of harbour porpoise(Phocoena phocoena) response to the reproduction of wind turbine noise.
DecommissioningThe final stage of a windfarm's lifecycle is its decommissioning, the majority ofwhich will be a reflection of the installation process. However, the wind turbinefoundation decommissioning process is unclear. Options for pile foundation removalinclude jet and explosive cutting below the seabed. While the process for concretefoundation decommission is not known, it may include explosive break up followedby dredging. No measurements of jet cutting noise are known to the authors, butunderwater blast has received significant attention. Well used models exist for bothpredicting the sound level from underwater blast, and its physical effect on marinewildlife. These models require knowledge of the charge weight, and this is as yetunknown, but given this knowledge a reasonable assessment may be made of the

A review of offshore windfarm related underwater noise sources
www.subacoustech.com iv
physical effect of underwater blast. Behavioural reactions to blast are less wellunderstood.
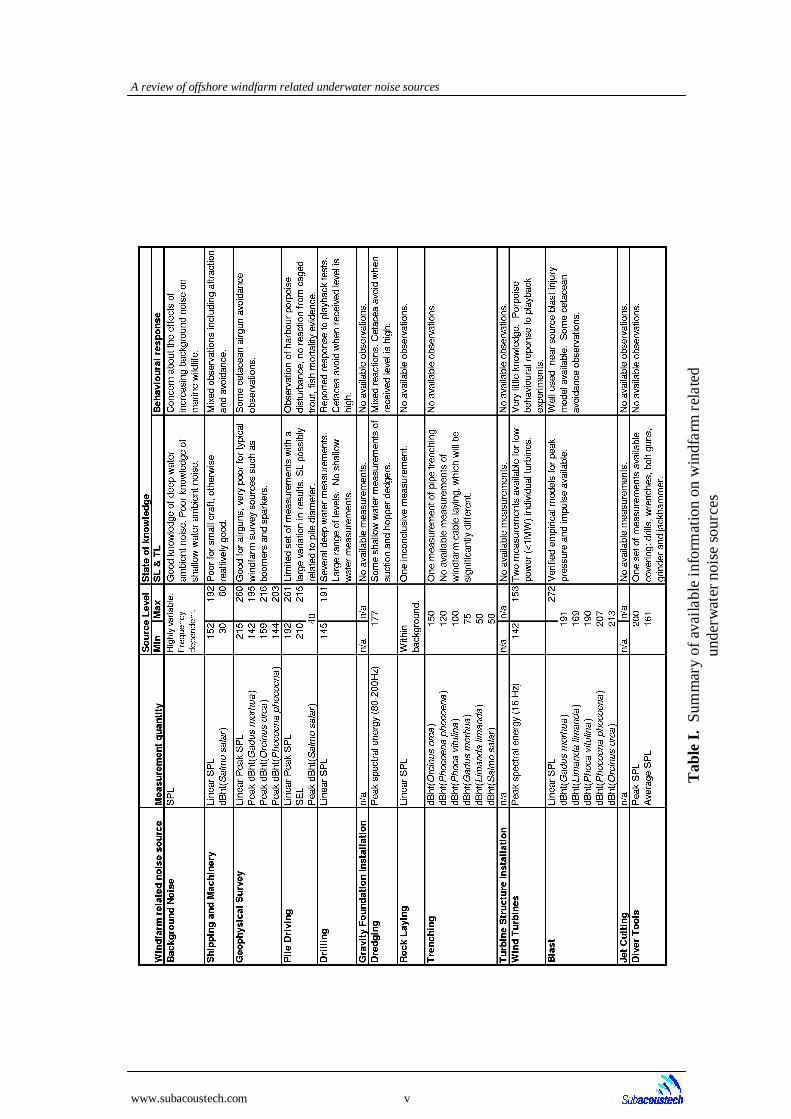
The reviewed noise sources are summarised in Table I for comparison. There aresignificant gaps in knowledge, and where research has been conducted, it is not oftenin an easily comparable form. Where possible, the minimum and maximum SourceLevels for specified measurement quantities are given for each source. All the data istaken from the body of the report although, where appropriate, measured levels areadjusted using a 20log10(r) Transmission Loss to give Source Level. A brief notesummarising the knowledge which has led to these levels is given along with asummary of reviewed behavioural observations.
RecommendationsBased on the available information and the authors' experience, recommendationsmade for priority areas for investigation into underwater noise levels and its effect onmarine wildlife are as follows (greatest priority first):
• Foundation decommissioning using explosives.• Piled foundation installation and windfarm related geophysical survey.• Drilling, rock laying, cable trenching, diver tools.• Vessel and machinery, wind turbine operation.
This assessment does not include the cumulative effects of noise, which wouldemphasise wind turbine and vessel noise because of the exposure the marineenvironment has to these sources. An assessment cannot be made of jet cutting,turbine structure installation and gravity support structure installation, as nomeasurements are available of these sources.
Amongst the sources of underwater noise, the authors believe the following areas arepriority areas for investigation (greatest priority first):
• Piled foundation installation, wind turbine operation, and windfarm relatedgeophysical survey.
• Cable trenching, drilling, rock laying, diver tools, jet cutting, gravity foundationinstallation, vessel and machinery, turbine structure installation.
A review of offshore windfarm related underwater noise sources
www.subacoustech.com v
Tab
le I
. S
umm
ary
of a
vail
able
inf
orm
atio
n on
win
dfar
m r
elat
edun
derw
ater
noi
se s
ourc
es

A review of offshore windfarm related underwater noise sources
www.subacoustech.com vi
Contents
EXECUTIVE SUMMARY.............................................................................................................. II
CONTENTS ...................................................................................................................................VI
1 INTRODUCTION................................................................................................................... 1
2 INTRODUCTION TO OFFSHORE WINDFARMS ............................................................. 2
2.1 BACKGROUND.................................................................................................................. 22.2 OFFSHORE WINDFARM TECHNOLOGY ................................................................................ 22.3 THE LOCATION OF OFFSHORE WINDFARMS......................................................................... 32.4 THE OFFSHORE WINDFARM LIFECYCLE .............................................................................. 4
3 UNDERWATER ACOUSTIC PRINCIPLES......................................................................... 7
3.1 OVERVIEW....................................................................................................................... 73.2 SOUND IN AIR AND WATER ................................................................................................ 83.3 MEASURING NOISE ........................................................................................................... 83.4 NOISE PROPAGATION MODELLING ................................................................................... 11
4 AVAILABLE INFORMATION ON WINDFARM RELATED UNDERWATER NOISE . 15
4.1 PRE-EXISTING NOISE....................................................................................................... 154.2 VESSEL AND MACHINERY ............................................................................................... 184.3 GEOPHYSICAL SURVEY ................................................................................................... 204.4 PILE DRIVING ................................................................................................................. 224.5 DRILLING....................................................................................................................... 294.6 GRAVITY SUPPORT STRUCTURE INSTALLATION ................................................................ 304.7 DREDGING ..................................................................................................................... 314.8 ROCK LAYING ................................................................................................................ 324.9 TRENCHING.................................................................................................................... 334.10 TURBINE AND SUPPORT STRUCTURE INSTALLATION .......................................................... 344.11 WIND TURBINE OPERATIONAL NOISE................................................................................ 354.12 UNDERWATER BLAST ...................................................................................................... 394.13 JET CUTTING .................................................................................................................. 424.14 DIVER TOOLS.................................................................................................................. 42
5 CONCLUSIONS ................................................................................................................... 44
5.1 ASSESSMENT OF AVAILABLE INFORMATION ..................................................................... 44
6 RECOMMENDATIONS....................................................................................................... 47
6.1 NOISE SOURCE RANKING................................................................................................. 47
7 ACKNOWLEDGEMENTS .................................................................................................. 48
8 REFERENCES...................................................................................................................... 49
APPENDICES ................................................................................................................................ 56
APPENDIX E - RECORD OF CHANGES.................................................................................... 57

A review of offshore windfarm related underwater noise sources
www.subacoustech.com 1
1 IntroductionOffshore windfarms are an important factor in the government's objective to produce15 % of the nation's electricity from renewable sources by 2015. A concerted effort iscurrently being made by industry and regulators to minimise any undesirable effectsrelating to the development and operation of these windfarms. One potential effect ofoffshore windfarm development is the creation of underwater noise. While theimpacts caused by underwater noise are not yet fully understood, it has been cited ashaving the potential to impede communication amongst groups of animals, drive themaway from feeding or breeding grounds, or to deflect them from migration routes.
Noise can be generated by a wide range of activities, both offshore and underwater.Sources of noise in the marine environment not only include windfarm developmentbut also leisure activities, such as diving or the use of jet skis, and other commercialactivities, such as rock blasting, construction work and oil exploration.
The Crown Estate owns most of the seabed to 12 nautical miles off the UK coast andhave leased, or are planning to lease, areas of this land for windfarm development. Tohelp assess the environmental impact of windfarm development and provide guidanceto developers they have set up COWRIE (Collaborative Offshore Wind Research Intothe Environment). The Group is made up of experts from the offshore wind industry,English Nature, Countryside Council for Wales, Joint Nature ConservationCommittee, CEFAS (Centre for Environment Fisheries and Aquaculture Science), theRoyal Society for the Protection of Birds, the DTI (Department of Trade and Industry)and the BWEA (British Wind Energy Association) and have identified the effect ofwindfarm related underwater noise as one of several priority areas for research [1].
The research includes both a desk based study into the potential effects of underwaternoise, and the collection and analysis of underwater noise measurements fromwindfarms in operation and under construction. This report addresses the first of theabove deliverables and is subsequent to the report commissioned by the DTI entitled,'Assessment of the effects of noise and vibration from offshore windfarms on marinewildlife'[2].
This review primarily addresses the available information on windfarm related noisesources, with an emphasis on reported measured sound levels. Behavioural andphysical responses to noise are briefly covered where appropriate but are not treatedin any great depth. Two sections are included, for readers unfamiliar with eitheroffshore windfarms or underwater acoustics, which provide a sufficient background tounderstand the terms and concepts used in the review. These are followed by thebody of the report which contains a summary of the available information onwindfarm related noise sources.

A review of offshore windfarm related underwater noise sources
www.subacoustech.com 2
2 Introduction to offshore windfarms
2.1 BackgroundA broad understanding of offshore windfarms is required for any assessment of theirenvironmental effect. The location, technology and duration of all events relating towindfarm development will all have a bearing on their effect on local marine wildlife.As an example, a wind turbine's operating power may effect underwater noise as wellas the depth of water at its location.
These issues are addressed below, with an emphasis on their relevance to thegeneration and propagation of underwater sound. Other considerations include theabundance of marine species at the proposed windfarm location, but these matters arebest dealt with in environmental impact assessments and are not covered here.
2.2 Offshore windfarm technology
2.2.1 FoundationsOne of the major differences of siting a turbine offshore, compared to its onshoreequivalent, is the foundation design. Currently there are four options for foundationdesign: monopile, multipile, gravity and caisson.
Monopile and multipile foundations consist of one or more open ended steel cylindersthat are forced into the sediment through a combination of pile driving and drilling.Gravity and caisson foundations are concrete structures that are floated out to theturbine locations and secured in place. Of these gravity foundations are moredeveloped and have been used for wind turbine foundations in Europe. They weighbetween 500 and 1000 tonnes and are filled with ballast at the turbine location. It isunlikely that one foundation design will be the best in all situations. Currently themost popular design is the monopile foundation, which has been used at both theNorth Hoyle and Scroby Sands windfarms, but in the long-term this may not be themost economic foundation option [3].
2.2.2 Turbine structureOffshore turbine structures are broadly similar to their onshore equivalent, consistingof a support tower that tapers towards its highest point. The support tower may befixed to the foundation via a transition piece that provides a physical couplingbetween the two components, and may include maintenance access amongst otherprovisions.
2.2.3 NacelleThe nacelle houses several components of a wind turbine and rests upon the turbinetower. Key components include the gearbox and generator, with ancillarycomponents such as pitch control gear and brakes dependent on the specific turbinedesign. The design of the nacelle may have a bearing on the radiated underwaternoise from a wind turbine. The degree of mechanical refinement, the controlmechanisms and the turbine's power rating may all influence wind turbine noise.

A review of offshore windfarm related underwater noise sources
www.subacoustech.com 3
2.2.4 Turbine bladesConnected to the hub of the nacelle are the turbine blades, which convert the passingwind energy into rotational energy. Their design will affect the aerodynamic noisefrom the wind turbine, which may contribute to underwater noise.
2.2.5 Ancillary structuresIn addition to an array of wind turbines, offshore windfarms may also includeancillary structures such as monitoring masts and offshore transformers. These willrequire below water foundations and above water installation, and may containvibrating machinery. For similar foundation types, it can be assumed that foundationinstallation noise for these structures will be similar. However, operational noisefrom these structures is unlikely to be similar to wind turbine noise.
2.3 The location of offshore windfarmsA windfarm's location has three major influences on the environmental effect ofunderwater noise. It determines how much sound enters the water, the efficiency withwhich that sound travels and the predominant marine species in the vicinity. Theeconomics of offshore technology currently dictates that offshore windfarms arelocated in waters less than approximately 30 metres deep [4]. This is partly due to thepreference for steel monopile foundations. Research into deep water foundations iscurrently being conducted with a view to siting larger turbines further offshore. Asthe technology and economics of deeper water foundations become more favourable,and shallow coastal water sites less abundant, the construction of offshore windfarmsmay move into deeper waters.
The language used to describe regions of water is varied and subjective, for example adefinition of 'shallow water' may depend on a vessel's draught. For clarity, Figure 1defines some of the terms that are used to describe the location of windfarms in thisreport. The term littoral is used to describe the area between high and low water markon a shore. Coastal describes the region between the shore and the oceanic edge ofthe continental shelf, which may differ dramatically in depth and distance from theshore. For the purposes of this report 'shallow coastal' is used to describe coastalwaters less than 30 metres in depth, which is where the development of currentwindfarms is proposed. Within this area, windfarms may be built upon shoals, whichare elevations in a body of water and include features such as sandbars. The edge ofthe continental shelf marks the division between deep oceanic water and coastalwaters.
Figure 1. Definition of coastal regions.
Continental Shelf
Coa
stal
Wat
ers
Shoal
Lowest Astronomical Tide
Highest Astronomical Tide
Inter-tidal Zone (Littoral Waters)
30 m
etre
s
Location of windfarms in the medium term
Not to Scale

A review of offshore windfarm related underwater noise sources
www.subacoustech.com 4
The majority of round one and two offshore windfarm sites are located within thefollowing three areas: the Thames Estuary, the Greater Wash and the Eastern Irish Sea(from Liverpool Bay to the Solway Firth). Other locations include Blyth and Teessideon the North East coast and Scarweather Sands on the South Wales coast. At the timeof writing a two turbine array is operational at the Blyth site founded on a sandy shoalapproximately 500 metres from the shore. At North Hoyle a 30 turbine array isoperational 7 km off Rhyl, North Wales, in coastal water with mixed substrate. AtScroby Sands, a sandy shoal 2 km from the Norfolk coast, 30 turbines have beeninstalled and will be operational in October 2004 and an offshore windfarm is underconstruction on the Kentish Flats.
The generation and propagation of underwater noise is affected by the geography andgeology of the windfarm location. On a scale of several metres, the sea floor geologyat a wind turbine location will affect the generation and propagation of both turbineand turbine foundation installation noise. At a 100 metre scale, the sea floor geologyand bathymetry will affect the transmission characteristics of all windfarm relatednoise and the level of background noise from wave motion. Within kilometres of thewindfarm location, land shadowing may effect the propagation of sound furtherafield. Land shadowing is likely to restrict the propagation of sound from currentlyearmarked sites to the Irish Sea and North Sea, except for Scarweather Sands on theSouth Wales coast which offers the potential for propagation into the Atlantic. Wheresound does propagate beyond the continental shelf, it may be focused into the SOFAR(SOund Fixing And Ranging) or deep water channel. This is a phenomena particularto deep waters where sound speed variation with depth acts like an acoustic lens,focusing sound into a narrow channel. This results in efficient transmission of soundto distances of several 100 km. Examples of this effect include the reception ofseismic survey noise across the Atlantic.
2.4 The offshore windfarm lifecycleA windfarm's lifecycle can be split into four phases: the pre-construction phase, theconstruction phase, the operational phase and the decommissioning phase. Figure 2gives an overview of the marine activities that take place during these phases. Theamount of exposure the marine environment has to a noise source may be significantin assessing the long term cumulative effects of underwater sound. However notenough is known for the influence of level and exposure to be assessed. In thediagram, an estimate has been made of the length of time a particular activity will beundertaken at sea.
2.4.1 Pre-constructionAt the start of a windfarm's lifecycle a suitable location must be found which,amongst other considerations, must be windy and suitable for wind turbinefoundations. The first of these requirements can initially be assessed from pre-existing historical meteorological information, but at some stage more detailedinformation will be required. At this point a meteorological mast will be installed.This will provide information on local weather conditions, such as wind speed andwave height, which are an essential part of the design of a windfarm. They aretypically of a steel lattice construction, and are built on similar foundations to windturbines. This can be either a monopile, multipile or gravity foundation structure andin good conditions should take less than a week to install. Once completed the mastwill require maintenance, increasing vessel traffic in the area.

A review of offshore windfarm related underwater noise sources
www.subacoustech.com 5
Geophysical surveys are used, in the first instance, to assess the suitability of thelocation for wind turbine foundations, and as a development progresses they provideinformation for foundation design. Surveys are often conducted from small (less than30 m) vessels and are conducted intermittently before and during a windfarm'sdevelopment. It should be noted that not all the surveys conducted will lead to thedevelopment of a windfarm.
Figure 2. The lifecycle of an offshore windfarm.
2.4.2 ConstructionThe construction programme for an offshore windfarm will depend on consentconditions. It typically begins with the installation of the wind turbine foundations.At present, the preferred foundation type is a driven monopile, however other optionsare available including gravity foundations and multipile foundations. Installing monoand multipile foundations is achieved using similar equipment, namely pile driversand drilling equipment. Gravity foundations are floated out to the location, filled witha heavy fluid and grouted into place. For each turbine, foundation installation maytake up to one week, and for a 30 turbine windfarm, foundation installation typicallylasts between 3 and 4 months. While individual events such as pile driving or drillingwill not be continuous throughout this period, they will occur regularly and thisrepeated exposure offers the potential to displace marine species.
Cable laying can take place before, during and after foundation installation. Cablesare required both between turbines and to shore. The cables are buried in softsubstrate using a cable plough or remotely operated vehicle (ROV), or may becovered in a protective rock blanket if this is not possible. Cable installation may takeseveral months.
Cables and foundations are the only subsurface installations, except for those requiredfor ancillary structures, such as monitoring mast foundations and offshore transformerstations. All other construction is performed above water. A transition piece is
Pre-Construction Activities• Site Investigation, Geophysical and Geotechnical Surveys [several weeks]• Meteorological Mast Installation [several weeks]• Increased Shipping Traffic [months]
Windfarm Construction• Geophysical Survey [several weeks]• Increased Shipping Traffic [years]• Foundation Installation [months]• Cable Laying [months]• Transition Piece Installation [months]• Tower Installation [months]• Nacelle Installation [months]• Turbine Blade Installation [months]• Monitoring Mast Installation [weeks]
Windfarm Operation• Operational Turbine Noise [20 years]• Increased Shipping Traffic [years]• Windfarm Maintenance Engineering [months]
Decommissioning or Repowering• Foundation Removal [months]• Turbine Removal [months]• Cable Removal [months]
1-5
year
s1
year
20-2
5 ye
ars
1 y
ear
30 y
ears

A review of offshore windfarm related underwater noise sources
www.subacoustech.com 6
installed on the foundation to provide a suitable connection between the foundationand the turbine tower, and to allow for access to the structure. The turbine towerraises the structure to the required height for the nacelle, which houses the majority ofthe mechanical and electrical systems used in the wind energy conversion process.Finally, turbine blades are fixed to the hub of the nacelle. These tasks, and otherminor installations, are performed from a jack-up barge. The wind turbinecomponents are lifted into place using a crane or derrick on the barge. For a 30turbine array, turbine installation may take up to 9 months. Over this period, turbinesmay be commissioned individually until the entire array is operational.
2.4.3 OperationCurrently windfarms are designed to have a 20 to 25 year life-span, and therefore themarine environment will suffer a longer period of exposure to wind turbine noise thanany other related noise source. A windfarm will be operational continuously duringthis period, except for occasional shut down for maintenance or because of severeweather conditions, but the proportion of operational turbines will vary. Maintenanceand pleasure craft may visit the site while it is operational.
2.4.4 DecommissioningThe last phase of a windfarm's lifecycle comes when it has finished its energyproducing life and must be decommissioned. The majority of the activities involvedin windfarm decommissioning are a reversal of the installation process, except forfoundation removal, which is currently a grey area. Pearson [5] concludes that piledfoundation removal will be achieved using mechanical cutting techniques, leaving anopen verdict on gravity foundations. However, experience in the oil and gas industrysuggests that explosives are most commonly used for cutting piles [6]. The time scalefor windfarm decommissioning may be similar to that of windfarm construction.Offshore windfarms may instead be re-powered after coming to the end of theirdesigned life span.

A review of offshore windfarm related underwater noise sources
www.subacoustech.com 7
3 Underwater acoustic principles
3.1 Non-technical overviewA broad understanding of the terms and units used to describe underwater sound isrequired for an appreciation of the issues involved in assessing its environmentalimpact. The most important consideration is the sound level that is received by ananimal in the water, which can be described in a number of ways. The most commonmeasure is the Sound Pressure Level (SPL), measured in deciBels referenced to 1microPascal (dB re 1 µPa). In underwater acoustics, 0 dB re 1 µPa is a very lowsound level, whereas 300 dB re 1 µPa is very high. The Sound Pressure Level isbased on an average of the pressure over a short period of time. This can give errorswhen the sound pressure varies quickly with time, such as impulsive sounds. For thisclass of signals, the peak Sound Pressure Level (SPLpeak) is a better measure. Thisgives the maximum sound pressure over an event or a short period of time.
A Sound Pressure Level is not always a good indicator of environmental effect andother measures may provide a better estimate. Very high levels of underwater soundmay cause physical injury, and impulse has been shown to be a good measure of thiseffect. It is related to the length of time a given time pressure is acting, with theimplication that a pressure of given amplitude acting for a set time will give rise to thesame effect as a pressure of half the amplitude acting for twice the time.
Behavioural effects may be better modelled by using the dBht(Species) measure. Thisrelates the magnitude and frequency content of the sound pressure to an animal’shearing ability. Using this measure, a level of 0 to 10 dBht(Species) is only justaudible to the animal, whereas levels over 90 dBht(Species) are thought likely to causebehavioural effects.
It is often useful to predict the sound level at locations other than wheremeasurements have been made. To achieve this the propagation of sound must bemodelled, which may be achieved in a number of ways. One way to model soundpropagation is using the Source Level – Transmission Loss model. This may beapplied to any of the measures described above. Using this technique, the apparentsound level at one metre from the sound source is first defined. This is usuallyachieved by applying a correction to sound level measurements taken much furtheraway. The sound level at any distance from the source may then be calculated bysubtracting a Transmission Loss.
Transmission Loss is the rate at which sound attenuates with distance. It can varysignificantly both with time and location. It is related to both the geometric spreadingof sound and the absorption of sound with distance. Often a logarithmic definition ofTransmission Loss is sufficient, and a common figure is ‘20log10(r)‘ , or sphericalspreading of sound. This means that for each tenfold increase in distance from thesource the sound level will reduce by 20 dB. For example, a 150 dB re 1 µPa at 1 mSource Level will reduce to 130 dB re 1 µPa at 10 metres, 110 dB re 1 µPa at 100metres and so on.

A review of offshore windfarm related underwater noise sources
www.subacoustech.com 8
3.2 Sound in air and waterSound is the common term for an acoustic pressure disturbance, and is characterisedby molecules moving back and forth in the direction of propagation of the wave,resulting in alternate regions of rarefaction and compression. This motion is typicallyperceived by both animals and instrumentation as a deviation from the local ambientpressure.
The speed of propagation of an acoustic wave can be expressed in terms of the bulkmodulus of the medium, which in simple terms is a measure of its compressibility, asfollows:
(1)
Here, c is the speed of propagation of an acoustic wave, γ is the ratio of specific heats,β is the (isothermal) bulk modulus and ρ0 is the ambient medium density. One of themajor differences between the air and water is the sound speed, which in water isapproximately 1500 m/s compared to 343 m/s in air. The higher sound speed in wateris due to the relative incompressibility (large bulk modulus) of water compared to air,in other terms, water is stiffer than air. This has another interesting implication onsound in water, sound pressure levels are generally higher in water than in air.
3.3 Measuring noise
3.3.1 Pressure and the deciBel scaleThere is a very wide range of sound pressures measured underwater, from around0.0000001 Pa (Pascal or Newton per square metre is the fundamental unit of soundpressure) in quiet sea to say 10,000,000 Pascal for an explosive blast. Forconvenience, sound pressure is expressed through the used of a logarithmic scale.The use of a logarithmic scale compresses the range so that it can be easily described(in this example, from 0 dB to 260 dB re 1 µPa). Sound expressed in this manner istermed the Sound Pressure Level or SPL.
The SPL is defined as:
(2)
where P is the sound pressure to be expressed on the scale and Pref is the referencepressure, which for underwater applications is 1 µPa. For instance, a pressure of 1 Pawould be expressed as an SPL of 120 dB re 1 µPa. An additional advantage ofworking with the SPL is that many of the mechanisms affecting sound underwatercause loss of sound at a constant rate when it is expressed on the dB scale.
Acoustic pressure readings vary above and below a mean value (the ambient pressure)with time. To allow for this variation, the sound pressure P is first squared (to makeall values positive) and than averaged (to smooth out the rapid fluctuations with time)before the deciBel level is calculated. In Equation 2, the averaging process is
0ργβ
=c
��
�
�
��
�
�
=2
2
10log10refP
PSPL

A review of offshore windfarm related underwater noise sources
www.subacoustech.com 9
represented by a bar above the squared pressure, P2. In practice, the Sound PressureLevel is calculated by taking the deciBel value of the ratio of root mean square (RMS)pressure, over a specified time period, to the reference pressure as follows:
(3)
Certain classes of signals do not lend themselves well to being averaged, for exampleimpulsive signals vary significantly over time, having an average that isunrepresentative of their instantaneous level. One way to report the pressure level ofthis class of signals is by using their peak pressure. The maximum pressure obtainedduring one event is found, with the deciBel level calculated as follows:
(4)
A brief note about the difference between deciBel levels in air and water isworthwhile for clarity. The convention for in air acoustics is to use a pressurereference of 20 µPa when calculating SPLs, as this is, for humans, approximately theminimum audible pressure for a 1 kHz tone. It is possible to convert betweenreference pressures by adding a constant value, and in this instance 20 µPa is 26 dBgreater than 1 µPa. However, care must be taken when applying this correction as theefficiencies of sound generation and reception in air and water differ markedly, andsimply adding a constant to the underwater SPL will not allow a reasonableassessment of the perceived loudness of a sound.
3.3.2 ImpulseFor some effects of underwater sound, such as physical injury, average or peakpressure are inadequate measures. This arises because a sound, having a givenpressure level and duration, may have the same effect as one of half the duration andtwice the level. This behaviour is better modelled by the use of impulse. In anextensive study into the effects of underwater blast [7,8], the likelihood of injury forsubmerged mammals was shown to be related to the impulse received by the animal.
The impulse, I, is defined as the integral of pressure over time and is given by:
(5)
where I is the impulse in Pascal-seconds (Pas), P(t) is the acoustic pressure in Pa ofthe blast wave at a time, t. Impulse may be thought of as the average pressure of thewave multiplied by its duration. The importance of impulse is that in many cases awave acting for a given time will have the same effect as one of twice the pressureacting for half the time. The impulse of both these waves would be the same.Impulse is the parameter of high pressure short duration events normally used as themeasure of its strength in respect of lethality.
3.3.3 Units of perception - the dBht(Species)
����
����
=ref
RMS
P
PSPL 10log20
����
�
=ref
peakpeak P
PSPL 10log20
( )dttPI �=

A review of offshore windfarm related underwater noise sources
www.subacoustech.com 10
The authors have developed a generic dB scale which enables better estimates of thebehavioural effects of sound on marine species to be made. The measure of a species'ability to perceive sound is the audiogram, which presents the lowest level of sound,or threshold, at which a species can hear as a function of frequency. Examples ofaudiograms for species common to UK waters are shown in Figure 3. Levels ofsound lower than the hearing threshold defined in the audiogram of a species cannotbe perceived by that species; the degree of perception of the sound relates to theamount it is above the threshold.
Figure 3. Examples of species' audiograms with the extent of ambient noise forreference.
In the dBht(Species), a frequency dependent filter is used to weight the sound. Thesuffix ‘ht’ relates to the fact that the sound is weighted by the hearing threshold of thespecies. The dBht(Species) level is estimated by passing the sound through a filter thatmimics the hearing ability of the species, and measuring the level of sound after thefilter; the level expressed in this scale is species specific and corresponds to theperception of the sound by the species. In effect, the scale may be thought of as a dBscale where the species’ hearing threshold is used as the reference unit. The dBht
measure reflects the level of sound above a species' threshold. The benefit of thisapproach is that it enables a single number to describe the effects of the sound on thatspecies.
The process used to calculate the dBht(Species) is similar to that used to calculatedB(A) levels, which is the standard measure of noise in air. Indeed it is possible tocalculate dBht(Homo sapiens) using the human hearing thresholds (in air) and this willgive similar results to a dB(A) weighted level. The advantage of this techniquebecomes apparent after considering that bats are one of the loudest land animals, but
0.0
50.0
100.0
150.0
200.0
250.0
1 10 100 1000 10000 100000
Frequency [Hz]
Hea
ring
Thr
esh
old
[dB
re
1uP
a]
Thermal Noise [adapted from 9]
Lowest Deep Water Ambient [adapted from 10]
Highest Deep Water Ambient [adapted from 10]
Harbour Porpoise (Phocoena phocoena) [adapted from 11]
Bottlenose Dolphin (Tursiops truncatus) [adapted from 12]
Salmon (Salmo salar) [adapted from 13]
Cod (Gadus morhua) [adapted from 13]
Harbour Seal (Phoca vitulina) [adapted from 14]
Killer Whale (Orcinus orca) [adapted from 15]

A review of offshore windfarm related underwater noise sources
www.subacoustech.com 11
as the majority of the sound energy they produce is at frequencies above that whichcan be heard by humans, or in other terms is ultrasonic, they are not a noise nuisance.
Usually, effective noise levels of sources measured in dBht(Species) are much lowerthan the unweighted levels, both because the sound will contain frequencycomponents that the species cannot detect, and also because most marine species havehigh thresholds of perception of (are insensitive to) sound.
Human hearing has a dynamic range, from the threshold of hearing, to the thresholdof pain, of about 130 dB. The range is determined by physical constraints; at thelower end, hearing is limited by natural background noise, and at the upper end, bydisplacements of the sensory structures associated with hearing to a degree that causestraumatic damage. When the sound exceeds about 90 dB above the threshold level, itis likely to cause significant behavioural effects and in particular avoidance. It maybe proposed that since these limits are set by physical constraints, the dynamic rangesavailable to other species may be similar, and a similar criterion will apply.
Modelled dBht(Species)level for Doel system
Doel system efficiency Hartlepool systemefficiency
76 dBht(Limanda limanda) 21% (flatfish results) 16% (flatfish results)90 dBht(Gadus morhua) 50% (roundfish results) 54% (whiting results)98 dBht(Clupea harengus) 80% 80%
Table 1. Efficiency of acoustic fish deflection system [16].
Amongst the evidence for strong avoidance reactions when received sound levelsexceed a 90 dBht threshold is the successful use of acoustic fish deflection systemsdesigned using this criteria. Table 1 details the measured efficiencies against dBht
level for fish deflection systems at two power station inlets [16], and shows anincreasing efficiency with increasing level above threshold. Although similar data islacking for other species, it is indicated that at 90 dBht significant behaviouralreactions will occur, and at 70 dBht mild behavioural reactions will occur. Thesethresholds are currently undergoing validation as part of a DTI funded researchprogram [17].
3.4 Noise propagation modellingIn order to provide an objective and quantitative assessment of degree of anyenvironmental effect it is necessary to estimate the sound level as a function of range.To estimate the sound level as a function of the distance from the source, and hencethe range within which there may be an effect of the sound, it is necessary to know thelevel of sound generated by the source and the rate at which the sound decays as itpropagates away from the source. These two parameters are the Source Level (i.e.level of sound) generated by the source, and the Transmission Loss, that is, the rate atwhich sound from the source is attenuated as it propagates.
3.4.1 Source LevelThe Source Level is defined as the effective level of sound at a nominal distance ofone metre, expressed in dB re 1 � Pa @ 1 m. However, the assumptions behind thissimple definition warrant careful explanation.

A review of offshore windfarm related underwater noise sources
www.subacoustech.com 12
Source Level is a somewhat confusing term as it is rarely measured, as would beexpected, at one metre from the source. Complex interactions between contributionsfrom different parts of the source occur at short ranges causing irregularities in thesound field that are difficult to predict. This region extends to a range, r0, which isgiven by:
(6)
where A is a characteristic dimension of the source and λ is the wavelength of thefrequency of interest [18]. The region from the source to r0 is termed the near field.The region beyond this range is termed the far field.
There is in general no reliable way of predicting the noise level from sources of man-made noise, and hence it is normal to measure the Source Level indirectly where arequirement exists to estimate far-field levels. The sound level is measured in the farfield, and this pressure is used to estimate the apparent (or effective) level at anominal one metre from the source. The apparent level may bear no relation to theactual level.
A measurement of the apparent level can be accomplished by assuming inversedependence of sound level on the range, r, from the noise source, or by extrapolatingthe far field sound level. For instance, if measurements were made in the range 100metres to 10000 metres in the example in Figure 4 the apparent level would, asillustrated by the extrapolation, be much higher than the actual level at one metre.The Source Level - Transmission Loss model is thus a linear fit to measured far fieldlevels, where the intersection and gradient of the line are termed Source Level andTransmission Loss respectively. This model should only be used to estimate soundlevels in the far field.
Figure 4. Source Level - Transmission Loss model.
3.4.2 Transmission LossTransmission Loss, or TL, is a measure of the rate at which sound energy is lost, andis defined as:
λA
r =0
Measured values
1 m
SL
Linear fit
Actual soundlevel
Near field
Empirical modelnot valid
Far field
Empirical modelgives a usefulapproximation
Range
So
un
d le
vel

A review of offshore windfarm related underwater noise sources
www.subacoustech.com 13
(7)
where Po is nominally the pressure at a point at one metre from the source, and Pr isthe pressure at range r away from it.
The usual method of modelling the Transmission Loss is from the expression:
(8)
where r is the range from the source in metres and N and � are coefficients relating togeometric spreading of the sound and absorption of the sound respectively. Highvalues of N and � relate to rapid attenuation of the sound and limited area ofenvironmental effect, and low values to the converse.
Transmission in the ocean has probably been the subject of more interest than anyother topic in underwater communication, since it is the parameter that is the leastpredictable and the least capable of being influenced. The sound from a source cantravel through the water both directly and by means of multiple bounces between thesurface and seabed. Sound may also travel sideways through the rocks of the seabed,re-emerging back into the water at a distance. Refraction and absorption furtherdistort the sound, leading to a complex wave arriving at a distant point which maybear little resemblance to the wave in the vicinity of the source. Finally, sound maybe carried with little loss to great distance by being trapped in sound channels. Here,variations in sound speed restrict sound propagation to a narrow channel therebylimiting geometric attenuation. Examples of channels include the SOFAR channel,the surface or mixed layer channel and the shallow water channel.
Several mathematical models exist which estimate Transmission Loss for given watercolumn properties. A value of N=20 corresponds to spherical spreading of the soundand is often assumed near to a source in deep water. Further afield, N=10 representscylindrical spreading that can occur in deep water channels and shallow watercolumns. Often a value of N=15 is used, and a mathematical model exists whichjustifies this for a particular shallow water scenario.
Despite these models, predicting the level of sound from a source is a difficult task,and where possible use is made of simple models or empirical data based onmeasurements for its estimation. Referring again to Figure 4, measurements of soundlevels must be taken in the far field to give a reasonable estimate of sound attenuationwithin this region. Transmission loss is the gradient of a linear fit to this data. In theauthors' experience, shallow water Transmission losses of between N=20 and N=25are most commonly measured [e.g. 19, 20].
Whether it is measured or predicted, the Transmission Loss used will affect thepredicted sound level significantly. For example, over a 10 metre range a noisesubject to N=15 Transmission Loss will be 10 dB louder than the same noise subjectto N=25 Transmission Loss. Over a 10 km range, using the same example, thedifference will be 40 dB. Where there is insufficient data for an accurate estimationof Transmission Loss using a linear fit, for example when measurements are onlyreported for one range, a Transmission Loss of N=20 will be assumed for Source
��������=
rP
PTL 0
10log20
( ) rrNTL α−= 10log

A review of offshore windfarm related underwater noise sources
www.subacoustech.com 14
Level calculations. This equates to spherical spreading. However care must be takento remember the influence of Transmission Loss on these calculations.
3.4.3 SummaryKnowledge of Source Level and Transmission Loss allow the sound level at all pointsin the far field to be estimated, and in the current state of knowledge are bestmeasured at sea, although it is in principle possible to estimate the Transmission Lossusing numerical models. Usually these data have to be extrapolated to situations otherthan those in which the noise was measured and the usual method of modelling thelevel is from the expression:
(9)
where SPL is the Sound Pressure Level in dB, SL is the Source Level in dB, and TL isthe Transmission Loss in dB.
If the level of sound at which a given effect of the sound is known, an estimate maybe made of the range within which there will be an effect.
Although the SL-TL model is defined in terms of SPLs in Equation 9, it may beapplied to any logarithmic measure of sound including the dBht. Using this approachit is possible to estimate the range at which the dBht value will exceed a certainthreshold, which is useful in assessing the behavioural response of animals at differentdistances. In general, the SL-TL model is frequency dependent with somefrequencies attenuated more with distance than others. As the dBht is a frequencydependent filter, this implies that SLs and TLs will vary with each species.
TLSLSPL −=

A review of offshore windfarm related underwater noise sources
www.subacoustech.com 15
4 Available information on windfarm related underwaternoise
4.1 Pre-existing noise
4.1.1 Deep water ambient noiseAmbient noise in the ocean is sound that is always present and cannot be attributed toan identifiable localised source [21]. Examples of ambient noise sources includenoise from rain falling on the ocean, from bubbles entrained into the ocean bybreaking waves, wave interaction, seismic disturbances of the sea floor, and noiseemitted by marine wildlife. The noise comes from all directions, but varies in bothmagnitude and frequency content with direction, depth, location and time. It istherefore difficult to predict the properties of ambient noise for any givenmeasurement, giving rise to statistical and empirical models for the received level.
A significant body of ambient noise measurements were taken in deep water duringthe first half of the 20th century. These measurements came as a result of the fact thata limiting factor in the performance of military SONAR (SOund Navigation AndRanging - a system used by boats and submarines to locate objects in water) is theamount of ambient noise present at the receiver location, which created a significantincentive to gain further understanding of the ambient noise process.
An important contribution to the field of knowledge was made by Knudsen [22], whoidentified that between 200 Hz and 50 kHz the level of ambient noise is dependent onthe sea-state. The underlying physical processes which cause this variation are stillunclear, but flow noise from surface wind, breaking waves and bubble formation areall thought to contribute. Wenz [10] built on the region defined by Knudsen,extending to the low and high frequency ranges. Below 10 Hz measured noise isthought to be due to oceanic turbulence and seismic disturbances. In the regionaround 100 Hz distant shipping makes a significant contribution in almost all of theworld's ocean. Mellen [9] showed that at very high frequencies, from 50 kHzupwards, molecular motion of water (thermal noise) contributes to the noise level atan increasing rate.
Figure 5 gives a summary of the range of ambient noise in the ocean as given in apaper compiled by Wenz [10]. Low frequency ambient noise from 1 to 10 Hz ismainly comprised of turbulent pressure fluctuations from surface waves and themotion of water at the boundaries. It exhibits a dependence on both wind strengthand water currents. This is especially the case in shallow water. Turbulent pressurechanges are not generally acoustic in nature: they do not propagate as alternateregions of high and low pressure. Hydrophones are equally as sensitive to turbulentpressure changes as propagating sound waves, and measurements will be acombination of both. However low frequency propagating sound does exist, and canbe measured where turbulent noise does not dominate. Low frequency acoustic noisein this region includes distant earthquakes and explosions.
Between 10 and 100 Hz distant anthropogenic noise begins to dominate, with itsgreatest contribution between 20 Hz and 80 Hz. The noise in this region is not

A review of offshore windfarm related underwater noise sources
www.subacoustech.com 16
attributable to one specific source, but a collection of sources at distance from thereceiver. Distant shipping traffic is the greatest contributor to man-made ambientnoise, with received levels up to 55 dB re 1 µPa for usual and 65 dB re 1 µPa forheavy shipping traffic.
In the region above 100 Hz, the ambient noise level depends on weather conditions,with wind and wave related effects creating sound. The peak level of this band hasbeen shown to be related to the wind speed, measured using the Beaufort scale, withlevels ranging from 20 dB re 1 µPa to 55 dB re 1 µPa. The level of wind related noisedecreases with increasing frequency above approximately 500 Hz, falling with a slopeof between 5 and 6 dB per octave (doubling of frequency).
Figure 5. Background noise [adapted from 10].
Ambient sea noiseRain noise, Bubble noise, Spray noise
Shipping Noise
Low Frequency NoiseSeismic sources, turbulence, wave
interactions
4
Therm
al Noise
1 10 100 1k 10k 100kFrequency [Hz]
0
20
40
60
80
100
120
140
So
und
Pre
ssu
re S
pec
tru
m L
evel
[d
B r
e 1u
Pa]
ShippingNoise
Upper Limit of Prevailing Noise
Lower Lim
it of Prevailing Noise
12
6
Sea
Sta
te

A review of offshore windfarm related underwater noise sources
www.subacoustech.com 17
At frequencies above 20 kHz, measured sound levels may be influenced by thermalnoise at the lowest of ambient noise levels. This increases from a level of -10 dB re1 µPa at 35 kHz by a rate of 6 dB per octave. During high winds, thermal noise maynot dominate below frequencies of several 100 kHz. Other contributions to ambientnoise include sea-ice, biological sources and near shore industrial activity.
4.1.2 Shallow water ambient noiseDue to the focus of military activity being in deep waters, oceanic ambient noisecharacteristics are relatively well understood. Windfarms however, will be situated inshallow coastal waters for well into the medium term future. Ambient noise in theseregions is less well understood and extremely variable; it can be both significantlyquieter and louder than deep water ambient noise. Sources of noise include thoselisted above and is typically dominated by shipping, wind and wave and biologicalsources. Wenz [10] states that ambient noise is 5 dB higher in shallow waters than indeep, but this is an over simplification.
Measurements by Piggot [23] off the Scotian Shelf (5 miles off the coast of FortLauderdale, Florida) in 700 ft deep open water showed a 7.2 dB increase per doublingof wind speed in the region 10 Hz to 3 kHz. These measurements, which are definedas shallow water, are in water significantly deeper than that of current offshorewindfarms. This again raises the question of the definition of 'shallow water'. Acommon definition in the underwater acoustics field is water that is less than 200 mdeep, however this definition covers the significantly different conditions ofcontinental shelf and inshore harbours and bays. A more useful definition includesfrequency dependence, with shallow water being of a depth of the same order ofmagnitude as the acoustic wavelength. For offshore windfarms, water can beconsidered shallow for frequencies ranging from below 50 Hz to below 750 Hz,which corresponds to water depths of 30 m and 2 m respectively. This definition isbased on sound propagation considerations and, though not related to the generationof ambient noise, it will have a bearing on its distribution.
4.1.3 Background noiseIn addition to ambient noise (which includes distant shipping traffic), in shallowcoastal areas, local shipping traffic, pleasure craft, oil and gas platforms, othermechanical installations and local wildlife all add to the level of noise received at ahydrophone. The combination of ambient noise, which cannot be attributed to aparticular source, and these easily identifiable local sources is termed backgroundnoise. This is all the noise received at a particular time and location that is in additionto the source of interest.
An assessment of the background noise is essential for a valid assessment of thepotential for effect from the introduction of a windfarm, as background noise maymask the sound produced by the source. However, given the variability ofbackground noise it may mask the source at some locations and times, but be wellbelow at other locations and times. One way to manage this variance is tocharacterise background noise in terms of its average and range of values, taking astatistical approach. A suitable number of measurements have been taken in deepwaters to allow statistical models of deep water background noise to be made,however only a handful of shallow coastal water background noise measurementshave been taken. As this will be the focus of windfarm development in the medium

A review of offshore windfarm related underwater noise sources
www.subacoustech.com 18
term, further measurements in shallow coastal water are needed to allow a reliableassessment of their impact on the average underwater noise level in these regions.
4.1.4 SummaryIn order to accurately assess the effect of introducing a new sound source into themarine environment a knowledge of the pre-existing (background) noise is required.In this context, background noise is all the noise which exists that is not windfarmrelated. It can vary in magnitude and frequency content in both space and time. Theimportance of this is that it may mask windfarm related noise at some locations andtimes, but be well below the source given different conditions.
There are a number of models that allow the mean level and variation of deep waternoise to be predicted. However, knowledge of shallow coastal water backgroundnoise is scarce, and although it is known that may be both significantly lower andhigher than deep water background noise, shallow coastal water background noisemodels are not well developed.
4.2 Vessel and machinery
4.2.1 BackgroundThroughout the lifecycle of a windfarm there will be an increase in vessel traffic.Before construction, survey vessels will be used to plan for the development. Duringconstruction, significant small and large vessel support will be required and, at areduced frequency, this will continue throughout the operational phase on order toconduct regular maintenance. The operational phase may also bring tourism to thesite, with vessels ranging from private motorboats and yachts to commercial pleasureboats, while other shipping traffic may be re-routed for safety or navigationalpurposes. Decommissioning will in essence be a reversal of the installation processand, except for some survey work, will require an equal amount of vessel support.
Examples of vessels include a small RIB to transfer crew from one vessel to another,boats for survey work, windfarm tourist pleasure boats, large construction supportvessels and jack-up barges. All these will create underwater noise in the vicinity ofthe windfarm adding to the general level of vessel and machinery noise from nearbyports and distant shipping.
Boat noise is dominated by propeller noise, except when operating at very low speedswhere hull radiated noise dominates [24]. During windfarm construction, bothpropeller noise from small boats or ships underway and hull radiated noise fromstationary vessels conducting works may be significant sources. In addition to this,navigational aids such as depth sounders and side scan sonars purposefully radiatehigh level sound energy into the surrounding water.
4.2.2 Available informationMeasurements of noise from small boats are limited, as the main focus of research hasbeen into noise from large vessels at sea. Richardson et al. [25] lists a range ofSource Levels for small boats ranging from a 5 m, 25 hp (outboard) Zodiac with a 152dB re 1 µPa @ 1 m Source Level, to a 25 m tug pulling an empty barge with a 170 dBre 1 µPa @ 1 m Source Level. Estimated 1/3 octave band levels are also given that
A review of offshore windfarm related underwater noise sources
www.subacoustech.com 19
show spectra peaking between 100 and 1000 Hz. In comparison, measurements byArveson et al. [26] of the M/V Overseas Harriette, a bulk cargo ship (length 173 m,displacement 25,515 tons) powered by a direct drive low-speed diesel engine, gaveSource Levels of 192 dB re 1 µPa @ 1 m when she was at 16 kt, 140 rpm. The cargoship has a design representative of many modern merchant ships, but is significantlylarger than ships likely to be used for windfarm construction.
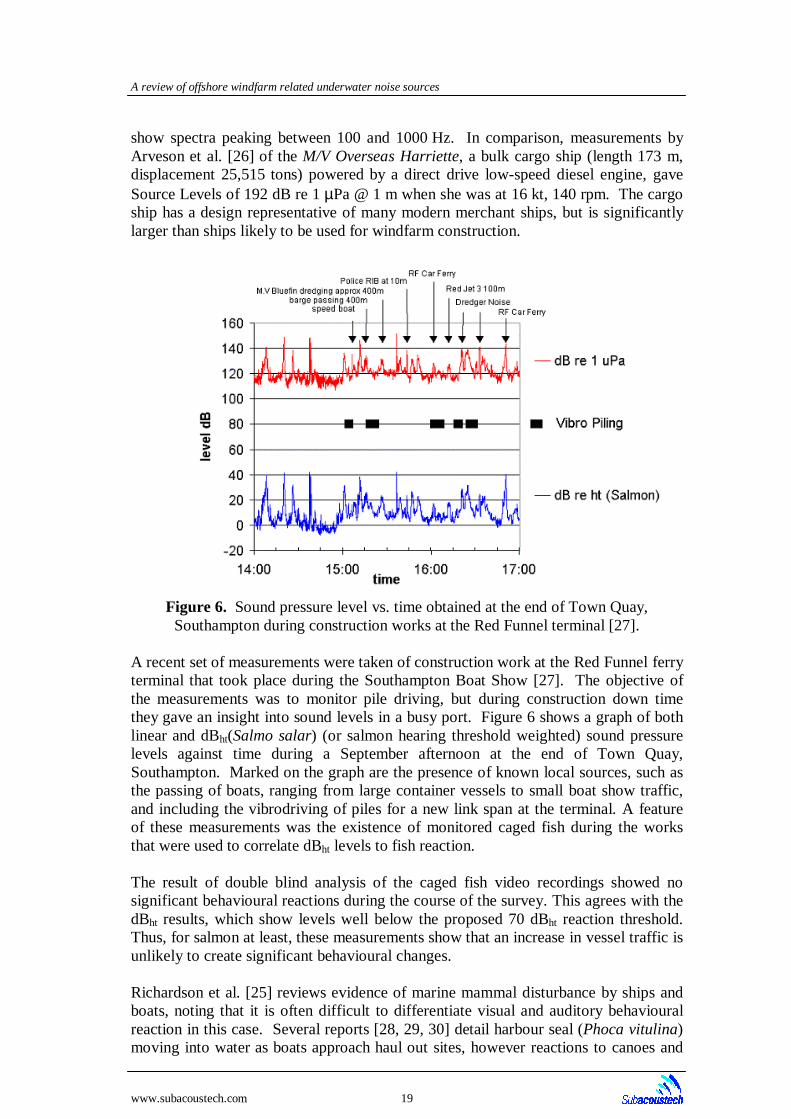
Figure 6. Sound pressure level vs. time obtained at the end of Town Quay,Southampton during construction works at the Red Funnel terminal [27].
A recent set of measurements were taken of construction work at the Red Funnel ferryterminal that took place during the Southampton Boat Show [27]. The objective ofthe measurements was to monitor pile driving, but during construction down timethey gave an insight into sound levels in a busy port. Figure 6 shows a graph of bothlinear and dBht(Salmo salar) (or salmon hearing threshold weighted) sound pressurelevels against time during a September afternoon at the end of Town Quay,Southampton. Marked on the graph are the presence of known local sources, such asthe passing of boats, ranging from large container vessels to small boat show traffic,and including the vibrodriving of piles for a new link span at the terminal. A featureof these measurements was the existence of monitored caged fish during the worksthat were used to correlate dBht levels to fish reaction.
The result of double blind analysis of the caged fish video recordings showed nosignificant behavioural reactions during the course of the survey. This agrees with thedBht results, which show levels well below the proposed 70 dBht reaction threshold.Thus, for salmon at least, these measurements show that an increase in vessel traffic isunlikely to create significant behavioural changes.
Richardson et al. [25] reviews evidence of marine mammal disturbance by ships andboats, noting that it is often difficult to differentiate visual and auditory behaviouralreaction in this case. Several reports [28, 29, 30] detail harbour seal (Phoca vitulina)moving into water as boats approach haul out sites, however reactions to canoes and
A review of offshore windfarm related underwater noise sources
www.subacoustech.com 20
kayaks can be equally as strong [31, 32] suggesting visual cues are in this case thedominant force. Reactions to boat noise by toothed whales (odontocetes) is acomplicated matter, with both attraction, for example dolphins riding bow waves, andavoidance, for example in response to hunting vessels, having been recorded. Thedependence of the type of reaction on noise level is uncertain, and may vary withinspecies. The understanding of the reaction of baleen whales is similar, with reports ofboth attraction and avoidance reactions. There is no clear evidence that cetacea willavoid a certain region due to increased boat noise. However, without a benchmarksurvey of noise and species abundance before boat traffic is increased, it may bedifficult to prove whether or not there has been an effect. Other considerationsinclude the long term cumulative effects of increased underwater noise, such asincreased stress, but little is known about these and it is difficult to make anassessment.
4.2.3 SummaryIt is clear that throughout a windfarm's lifecycle there will be an increase in vesseltraffic and a consequent increase in the general level of underwater noise, however theenvironmental effect of this is not obvious. Documented Source Levels range from152 dB re 1 µPa @ 1 m for a small vessel with an outboard engine to 192 dB re 1 µPa@ 1 m for a large container ship. Behavioural reactions to boat noise includeavoidance and attraction.
4.3 Geophysical survey
4.3.1 BackgroundGeophysical surveys are made at an early stage in the planning process for an offshorewindfarm to provide an insight into the suitability of a location for windfarmconstruction. They provide information on sediment, rock strata and underlyinggeological structures underneath the seabed. The results of these surveys are initiallyused to assess the potential for windfarm development, and when a suitable site ischosen, surveys reveal information needed for shallow water engineering (e.g.location and design of turbine foundations and cabling). Geophysical surveys willmost likely occur intermittently during the years leading up to windfarm construction,with increasing frequency as the program develops. During construction, furthersurveys may be performed, especially to plan for cable routing.
During surveys, high-energy acoustic sources are used in water to transmit sound intothe sea floor. When the acoustic waves encounter a change in acoustic impedance, forexample when rock or sediment composition changes, a portion of its energy isreflected back to the receiver, which is typically an array of hydrophones, to form animage. The sources are impulsive, and are generated using a variety of mechanisms.
Airguns are used extensively in the oil and gas industry for deep and occasionallyshallow water surveys where penetration depth is more important than resolution.These inject air at very high pressure into the water, which forms a rapidly expandingand then collapsing air bubble. The oscillations of the air bubble generates high-level,low frequency sound waves.
Where resolution is of greater importance then penetration depth, for example inshallow water construction, mid-frequency sources are commonly used. These include

A review of offshore windfarm related underwater noise sources
www.subacoustech.com 21
boomers and sparkers which have both found wide use for windfarm related surveys.Boomers consist of two plates separated by a coil across which a high voltage impulseis created. The resultant magnetic field causes one plate to vibrate and radiateacoustic energy into the surrounding water. Sparkers also generate sound from a highvoltage impulse, but in this instance sound is generated by the oscillations of the gasbubble produced from the rapid temperature rise caused by a spark forming across apair of electrodes.
High frequency sub bottom profilers use piezo-electric transducers and providegreater resolution but sacrifice penetration depth. These may be used for planningwindfarm cabling routes.
4.3.2 Available informationIndependent measurements of the noise produced by geophysical surveys in the farfield is scarce for all sources except airguns, which have been extensively studied indeep and, more recently, in shallow waters because of environmental concerns.
Manufacturers state Source Levels for boomers and sparkers in their literature, andthese range from 215 to 230 dB re 1 µPa @ 1 m [25, 33, 34], but the reliability ofthese figures is uncertain. Independent measurements of geophysical surveys usingairguns state Source Levels for individual airguns from 216 to 232 dB re 1 µPa @ 1 m[25] and airgun arrays from 235 to 259 dB re 1 µPa @ 1 m [25]. High perceivedSource Levels, from 142 to 216 dBht(Species), have also been shown for severalspecies of fish and cetacea [35].
There are no published observations of marine animal reaction to geophysical surveyusing boomers and sparkers. Recorded reactions to airgun noise are limited toobservations of cetacea, and are limited for this order. Richardson et al. [25] providesa review of documented reactions to airguns, which includes several surveys of baleenwhales, especially grey (Eschrichtius robustus) and bowhead (Balaena mysticetus)whales, showing reaction to received levels of approximately 160 dB re 1 µPa.Published observations of odontocete reaction to airguns include one report of adolphin sighting in the vicinity of a survey [36] and two reports of behaviouralreaction from sperm whales (Physeter catodon) that detailed avoidance reactions [37]and reduced vocalisations [38].
4.3.3 SummaryThere are no independent measurements or animal reaction studies available ofgeophysical survey sources, such as boomers and sparkers, used in windfarmdevelopment. Airguns have been studied and the literature shows that they producelinear Source Levels ranging from 215 to 260 dB re 1 µPa @ 1 m; dBht Source Levelsfrom 142 to 216 dBht(Species) and behavioural reactions in cetacea. While this datamay not be used to assess the environmental effect of windfarm geophysical surveys,it suggests that windfarm related geophysical surveys are an area for concern andresearch should be conducted.
A review of offshore windfarm related underwater noise sources
www.subacoustech.com 22
4.4 Pile driving
4.4.1 BackgroundA pile driven turbine foundation involves forcing a hollow cylindrical steel tube intosoft ground to such a distance that it provides a suitable foundation upon which tobuild a wind turbine. Depending on the foundation design, either a large single pile orseveral smaller piles are used to form the foundation. These are termed monopile andmultipile foundations respectively. Pile driving techniques include impact piledriving, where a pile is hammered into the ground by a hydraulic ram, andvibrodriving, where rotating eccentric weights create an alternating force on the pile,vibrating it into the ground. Impact driven monopiles have become the favouredfoundations for offshore wind turbines in recent years, with only this foundation typecurrently in existence in the UK. The dimensions of the steel monopiles vary, but forcurrent installations are approximately 4 metres in diameter and 20 to 30 metres long.Where piles are installed in mixed substrate conditions, hard rock may beencountered, and in this case a socket must be drilled for the pile. Once this iscompleted the pile may be hammered to its required depth. Underwater noise fromdrilling is covered in Section 4.5. It should be noted that there are many variations inpile hammer design, and that a pile may be hammered from both above and below thewater surface. These factors may have a considerable effect on the radiated noiselevel, however the scarcity of available measurements means that it is difficult for anassessment to be made.
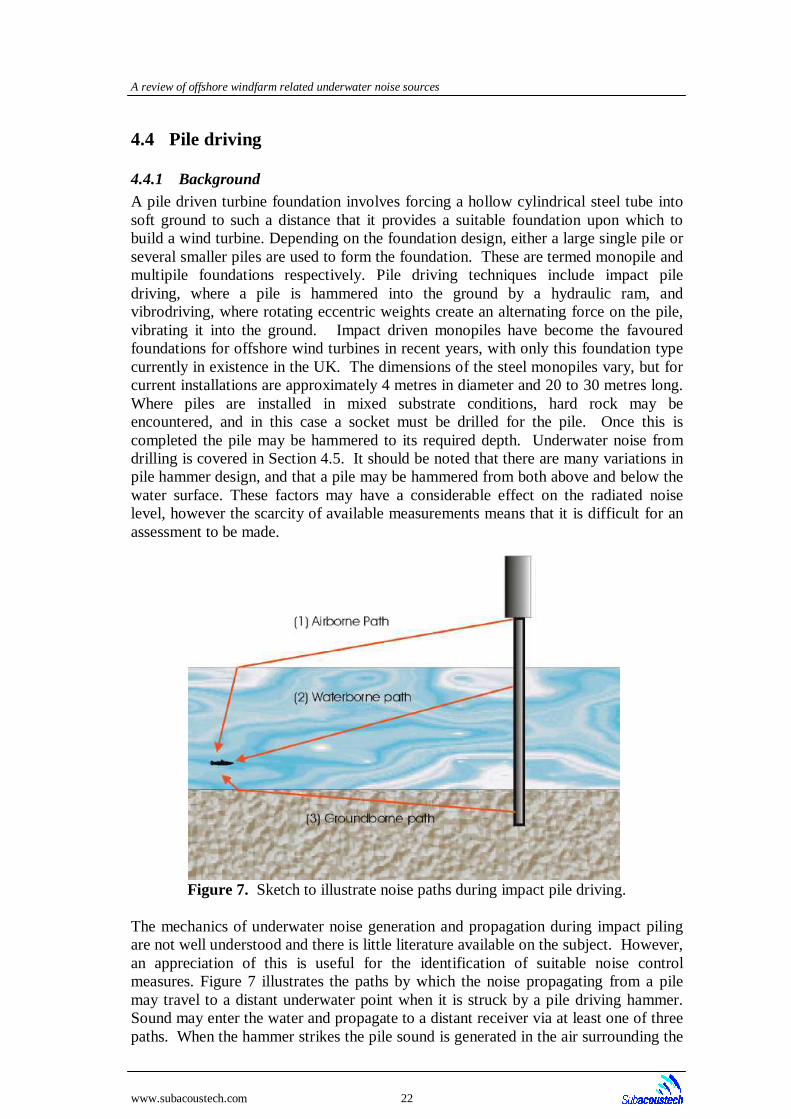
Figure 7. Sketch to illustrate noise paths during impact pile driving.
The mechanics of underwater noise generation and propagation during impact pilingare not well understood and there is little literature available on the subject. However,an appreciation of this is useful for the identification of suitable noise controlmeasures. Figure 7 illustrates the paths by which the noise propagating from a pilemay travel to a distant underwater point when it is struck by a pile driving hammer.Sound may enter the water and propagate to a distant receiver via at least one of threepaths. When the hammer strikes the pile sound is generated in the air surrounding the

A review of offshore windfarm related underwater noise sources
www.subacoustech.com 23
hammer and the pile. This sound may enter the water via an airborne path, whereairborne noise is incident upon the air-water interface and a portion of the soundenergy enters the water. Gerjuoy [39] showed that for sound incident at an anglegreater than 13° to the normal all of the energy is reflected back from the watersurface, within this range increasing proportions of the sound's energy will betransmitted. According to this model the majority of airborne sound will betransmitted in the region adjacent to the pile, although some sound may enter thewater outside this region because of surface roughness. As well as the angle ofincidence, the difference in acoustic impedance effects the amount of acoustic energytransferred from one substance to another. For air and water this difference is largeand, for this reason, it is thought unlikely that airborne transmission of pilehammering noise will contribute significantly to the level of underwater sound frompile driving.
Between the sea surface and sea floor the pile will be surrounded by water. Thecontribution from the sound generated at this interface is thought to give the greatestcontribution to the sound at the receiver location. The complex structural vibrationsof the pile, which may consist of both propagating compressional and shear wavesand non-propagating whole body motions, will generate sound waves in thesurrounding water.
At the lower end of the pile, an impulsive force is exerted on the seafloor by the pile.Energy is transmitted from the hammer by the pile not only by the mean force exertedon the sea floor but also by the structural waves radiating down the pile inducinglateral waves in the seabed. These may travel as compressional waves, in a similarmanner to the sound in the water, as shear waves, where wave motion is perpendicularto the direction of propagation, or as more complex wave types such as Rayleighwaves. The waves can travel outwards through the seabed, and as they propagatesound will tend to “ leak” upwards into the water, where it contributes to the sound atthe receiver. Since the speed of sound is generally greater in consolidated sedimentsthan in water, these waves usually arrive before the waterborne wave.
The transmission paths for vibropiling are likely to be similar to that of impact piling.However, in this instance, the pile is struck several times a second (between 5 and 50strikes per second) with a hammer causing the pile to vibrate into the ground. Theimpact energy of each strike is typically less than for a similar impact pile hammerwhich suggests that vibropiling is the quieter of the two methods. Indeed, whereairborne noise is a concern during land based construction, vibropiling is typically thepreferred installation method for this reason. There is no reason to suggest that thiswould not be the case for underwater noise. However, vibropiling may not be suitablein a number of cases, and where it is used the installation is often finished with animpact pile hammer [40].
4.4.2 Available informationPublished measurements of underwater noise from piling are relatively sparse, andeven more rare are studies linking both noise and marine wildlife observations,making an assessment of the potential effects from windfarm related piling difficult.In addition to this, piling may encompass a wide range of operations, pilingequipment, substrate types, water depths, etc giving a wide range of possible noiseSource Levels and Transmission Losses.

A review of offshore windfarm related underwater noise sources
www.subacoustech.com 24
Measurements of underwater noise in the river Arun, Littlehampton, were madeduring piling the construction of a quay wall [41]. The piles were 700 mm indiameter, significantly smaller than those likely to be used for offshore windfarms. Inrespect of the unweighted noise from impact piling, the losses were mainly due toabsorption; with a reasonable fit given by:
(10)
where the Source Level is about 192 dB re 1 µPa @ 1 m, and the Transmission Lossrate (Na) is about 0.07 dB per metre.
The measurements for selected cases were processed into dBht levels. Of most interestare the results for the salmon, which indicate a maximum (at a range of 7.5 metresfrom the piling) of 26.9 dBht(Salmo salar). This figure is not greatly above thethreshold of hearing of the species, and it is concluded that, in this case, the risk of thesound inducing behavioural responses was small. However, the report noted that thiscould have arisen from the particular conditions prevailing at Littlehampton andhence it could not be concluded that piling is, in all cases, unlikely to causeenvironmental effects.
Nedwell [27] reports on monitoring measurements of the waterborne noise resultingfrom impact piling and vibropiling at Town Quay, Southampton, during constructionoperations at Red Funnel’s Southampton Terminal in September 2003. The pilinginvolved impact piling and vibropiling of piles of 508 mm diameter and 914 mmdiameter. The average Source Level of the impact piling was found to be about 189dB re 1 µPa @ 1 m for the 508 mm diameter piles, and 201 dB re 1 µPa @ 1 m for the914 mm diameter piles. These Source Levels were associated with a TransmissionLoss rate of about 0.15 dB per metre.
Würsig [42] reports on piling in shallow water in Hong Kong, and the use of a bubblecurtain to attenuate the noise. The piling was by a 6 tonne diesel hammer, with ablow energy of 90 kJ. The noise was measured on two days at distances of 250, 500and 1000 metres; it was found that the broadband noise levels were reduced by 3 to5 dB by the curtain. The best performance of the curtain was found to be from400 Hz to 6400 Hz.
Unfortunately, the results were not being presented as peak pressures but as averagedlevels, which limits their use. In addition, no information is given as to the size of thepiles. The authors quote a typical impulse duration of 40 ms and an average strikerate of 1.15 blows per second, or a duration between impulses of 830 ms. This impliesthat the peak level would be about 13 dB higher than the averaged level.
By using this correction it is found that the results agree well with a Source Level forthe piling of 198 dB re 1 µPa @ 1 m, and a linear Transmission Loss of0.04 dB/metre. The Source Level is thus slightly higher than that at Littlehampton(192 dB re 1 µPa @ 1 m) and the rate of attenuation slightly lower (0.04 dB/metre ascompared to 0.07 dB/metre).
( )rNSLSPL a−=
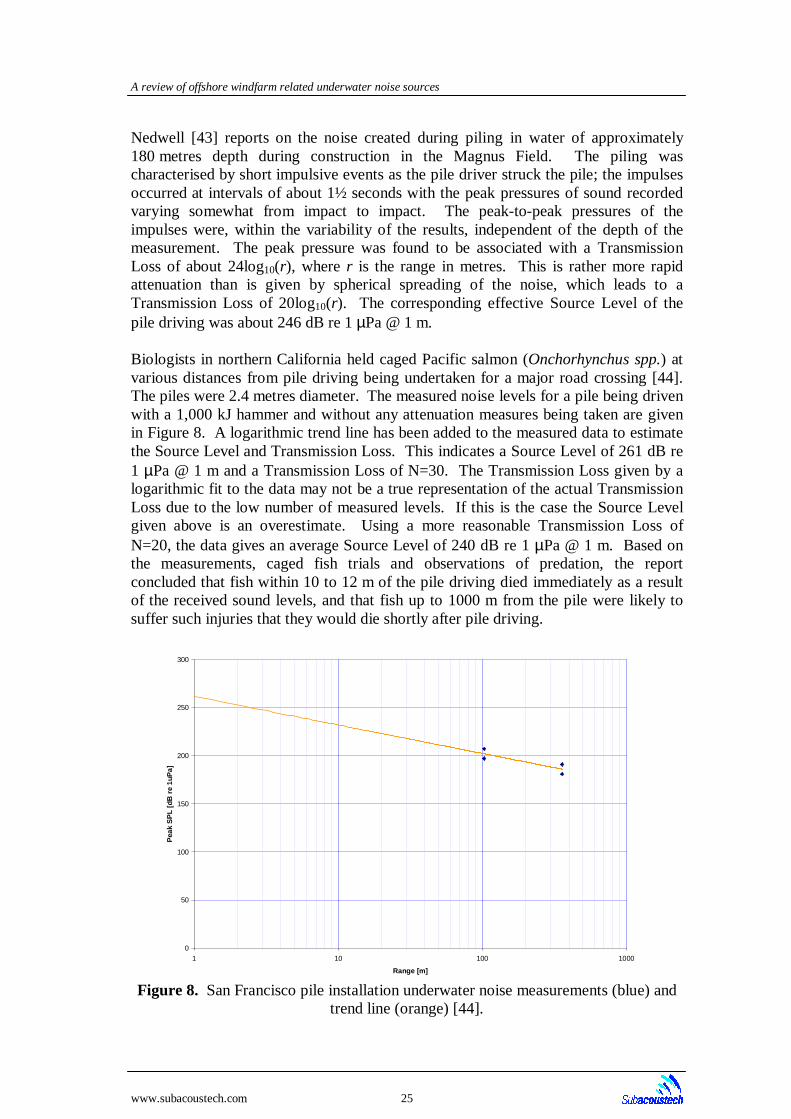
A review of offshore windfarm related underwater noise sources
www.subacoustech.com 25
Nedwell [43] reports on the noise created during piling in water of approximately180 metres depth during construction in the Magnus Field. The piling wascharacterised by short impulsive events as the pile driver struck the pile; the impulsesoccurred at intervals of about 1½ seconds with the peak pressures of sound recordedvarying somewhat from impact to impact. The peak-to-peak pressures of theimpulses were, within the variability of the results, independent of the depth of themeasurement. The peak pressure was found to be associated with a TransmissionLoss of about 24log10(r), where r is the range in metres. This is rather more rapidattenuation than is given by spherical spreading of the noise, which leads to aTransmission Loss of 20log10(r). The corresponding effective Source Level of thepile driving was about 246 dB re 1 µPa @ 1 m.
Biologists in northern California held caged Pacific salmon (Onchorhynchus spp.) atvarious distances from pile driving being undertaken for a major road crossing [44].The piles were 2.4 metres diameter. The measured noise levels for a pile being drivenwith a 1,000 kJ hammer and without any attenuation measures being taken are givenin Figure 8. A logarithmic trend line has been added to the measured data to estimatethe Source Level and Transmission Loss. This indicates a Source Level of 261 dB re1 µPa @ 1 m and a Transmission Loss of N=30. The Transmission Loss given by alogarithmic fit to the data may not be a true representation of the actual TransmissionLoss due to the low number of measured levels. If this is the case the Source Levelgiven above is an overestimate. Using a more reasonable Transmission Loss ofN=20, the data gives an average Source Level of 240 dB re 1 µPa @ 1 m. Based onthe measurements, caged fish trials and observations of predation, the reportconcluded that fish within 10 to 12 m of the pile driving died immediately as a resultof the received sound levels, and that fish up to 1000 m from the pile were likely tosuffer such injuries that they would die shortly after pile driving.
Figure 8. San Francisco pile installation underwater noise measurements (blue) andtrend line (orange) [44].
0
50
100
150
200
250
300
1 10 100 1000
Range [m]
Pea
k S
PL
[dB
re
1uP
a]

A review of offshore windfarm related underwater noise sources
www.subacoustech.com 26
Vagle [45] provides a recent review of several underwater pile installationinvestigations conducted in coastal waters in Canada. Results range from a 20 kPa,206 dB re 1 µPa @ 1 m, peak over pressure Source Level for a 8'' (203 mm) cedarpile, to a 150 kPa, 223 dB re 1 µPa, peak overpressure at an unspecified range for a36'' (914 mm) closed end steel pile. For the steel pile fish mortality was observed inthe vicinity. The use of bubble curtains is investigated in the report and it isconcluded that this mitigation measure had only a small effect on the overall pressurelevels. It is also concluded that large and especially closed end piles should becarefully monitored and mitigation measures implemented.
Recent measurements of underwater noise during wind turbine monopile hammeringin Sweden are of the greatest relevance [46]. The measurements were made at halfwater column depth at 30, 320, 490 and 720 metres from the pile during theinstallation of one pile. Across the measurement locations the water depth variedfrom 4 to 6 metres, and the wind speed varied from 1 to 4 m/s, wave heights rangedfrom 0.5 to 1.5 metres. Unfortunately, neither details of the pile (diameter) orhammer (impact energy) are presented in the report, but it may be reasonable toassume these are similar to other windfarm developments. Measurements arepresented as 1/3 octave band spectra, equivalent one second averaged sound levels(Sound Exposure Levels or SELs), and as approximately 1/100
th of a second timeaveraged levels. No high resolution time histories or instantaneous peak pressureshave been presented.
Figure 9. Underwater noise from pile hammering (blue) against distance redrawnfrom measurements taken of windfarm construction in Sweden [46]. A logarithmic
trend line is also shown (orange).
Figure 9 shows the calculated Sound Exposure Levels for the four measurementpositions from 30 to 720 metres. The levels range from 166 dB to 188 dB re 1 µPa. Alogarithmic trend line has been added to the data to allow an estimate of Source Level
0
50
100
150
200
250
1 10 100 1000
Range [m]
Sou
nd E
xpos
ure
Leve
l [d
B r
e 1u
Pa]

A review of offshore windfarm related underwater noise sources
www.subacoustech.com 27
to be made. This gives a SEL Source Level of 210 dB re 1 µPa @ 1 m with a 15 dBper decade Transmission Loss. The 15 dB per decade Transmission Loss correspondsto intermediate spreading, which is a common model used for shallow watertransmission.
Sound Exposure Levels are calculated by summing an impulsive event's acousticenergy and then calculating the level for a one second tone that has the same energy.They are a measure commonly used for in air acoustic analysis, but are have not beenshown to relate to either behavioural or physical responses in marine wildlife. It istherefore difficult to make an assessment of the likely reaction of marine wildlifeusing this metric. High resolution time histories will give peak pressures significantlyabove SELs, but as these are not available, the 1/100
th of a second time averaged levelscan be used for an indication, and are between 10 and 15 dB above the SELs. Thus,piling peak Source Levels are at least 215 dB re 1 µPa @ 1 m for the Swedish windturbine installation piling.
A 1/3 octave band spectra is shown in the report for the region from 1 Hz to 20 kHzfor a pile hammering event, and is redrawn in Figure 10. Although absolute levelsfrom spectra of impulsive events are not reliable because of time domain averaging,they do provide an insight into the relative frequency content of a signal. For thesemeasurements piling noise spectra peaks at approximately 250 Hz, which is wherefish species such as cod and salmon have their greatest hearing (Figure 3). Thefrequency content shown in the paper peaks at 250 Hz, piling noise is shown to havesignificant frequency content at both higher and lower frequencies, being fairlybroadband.
Figure 10. Measured 1/3 octave band Sound Pressure Level 320 metres from turbinefoundation piling [adapted from 46].
Harbour porpoise (Phocoena phocoena) have their greatest hearing sensitivity atapproximately 30 kHz (Figure 3), well above the peak frequency of piling noise
0
50
100
150
200
250
1 10 100 1000 10000 100000
Frequency [Hz]
Oca
tve
Ban
d L
evel
[d
B r
e 1u
Pa]

A review of offshore windfarm related underwater noise sources
www.subacoustech.com 28
(Figure 10). In a study conducted during the construction of 80 wind turbines at theHorns Reef windfarm in Denmark [47], it was concluded that pile driving affectsharbour porpoise acoustic activity on time scales of a few hours. The abundance andgeneral activity of harbour porpoises were affected over larger time scales to adistance of up to 15 km from the source. The study used both boat based observersand passive acoustic monitoring devices to study the animal's activity in the vicinityof the construction activity and a nearby haul out area. It is the only study of its kindknown to the authors. It should be noted that the displacement of harbour porpoiseduring pile hammering was intended, with acoustic deterrents placed in the waterbefore hammering as an injury mitigation measure. However, the report states that itis unlikely that all the effects observed can be attributed to the deterrents alone, whichwere of a low intensity compared to the piling noise.
Engell-Sørensen [48] makes an assessment of the effect of the pile driving noisereported by McKenzie-Maxon [46] on fish species predominant near Rødsand,Denmark. The report assesses the potential behavioural and physical effects of thenoise levels and concludes that: avoidance reactions are likely to occur up to 30 mfrom the source, especially for species with swim bladders; the measured noise levelscould harm the hearing ability of clupeids such as herring (Clupea herengus) andsprat (Sprattus sprattus), but this may regenerate over time; and, other than thosealready mentioned, the noise from pile driving is unlikely to cause any other physicaleffect. Feist [49] showed that juvenile pink (Oncorhynchus gorbuscha) and chum (O.keta) salmon distribution and general behaviour was affected by pile drivingoperations in Northwest America.
4.4.3 SummaryFrom the research reviewed above, piling noise has been reported to have suchdiverse consequences as little or no effect [27], avoidance [46, 47, 49] and mortality[44, 45] for marine animals. It is most likely that the significant factors which affectthe noise level include pile diameter, local geology and bathymetry. The first two ofthese factors affect the impact energy needed to drive the pile [50], while the last twodetermine the efficiency of noise generation and propagation. Given the results in[46], it is likely that the Source Level for a 4 metre diameter impact driven monopilehammer strike will be above 200 dB re 1 µPa @ 1 m, and will contain a broad rangeof frequencies peaking between 100 and 1000 Hz.
The effect of the noise generated by piling will not only depend on the level sound butwill also be dependant on the species and the animal's size. For windfarm pileinstallation, one report states that harbour porpoise behavioural responses have beenobserved during impact piling [47], while a second [48] predicts behavioural andphysical effects on fish. As there is only one reported observation of the effect ofwindfarm related piling noise on marine wildlife, further research is required to allowa reasonable assessment of environmental impact.
Mitigation techniques used to date include bubble curtains [42], which reduce theSource Level of the piling noise, and acoustic deterrents [47], which 'scare' marinespecies from the immediate vicinity of construction activity. Other possibilitiesinclude monitoring, including acoustic and human observation techniques, to ensurespecies are not within the area during pile driving. Monitoring has been conducted to

A review of offshore windfarm related underwater noise sources
www.subacoustech.com 29
measure behavioural effect [47], but to date it has not been used to prevent possibleharm to marine species.
4.5 Drilling
4.5.1 BackgroundDrilling may take place during the installation of wind turbine pile foundations inconjunction with pile driving. Its use will depend on the substrate at the turbinelocation, with sedimentary substrates allowing an entirely impact driven pile and hardrocky substrates requiring a drilled socket for the pile. The design of drills variesdepending on the substrate type, required diameter and mechanical constraints butwill typically consist of a single rotating shaft attached to several cutting heads. Thecutting heads are geared off the shaft and may rotate at different speeds, and have anumber of cutting teeth on their face.
Although little research has been performed into drilling noise, it is likely that soundwill be transmitted into the water during transmission via either a ground borne orstructure borne path. Ground borne vibration will be created at the drill-rock interfaceby the movement of the drill head. This will radiate out as both compressional andshear waves to the ground water interface where it will propagate into the water. Themechanical vibrations that are generated in the drill may also be transmitted to thewater via the drill shaft and the surrounding pile. In addition to these sources, rockdebris and water will be discharged from the top of the pile, which may create noiseon entering the water below.
4.5.2 Available informationThe authors are not aware of any measurements of underwater noise from shallowwater construction drilling operations, however some measurements have beenreported for oil and gas exploration and production drilling. The platform used toconduct offshore drilling may have an effect on the underwater noise produced.Types of platform include natural or man-made islands, platforms on legs and floatingor semi-submersible drilling vessels. Although not entirely applicable to currentwindfarm development, future deep water windfarms may employ some of thedrilling techniques detailed below. It should be noted, however, that the drillingvessels detailed below may be much larger than those used for windfarmdevelopment.
Shallow water measurements (6-7m deep) taken in the vicinity of a drill rig on an icepad gave results at 130 m of approximately 125 dB re 1 µPa [51], and at 480 m of 86dB re 1 µPa. Hall et al. [52] took measurements of drilling from a concrete caissonshowing little difference in levels of frequencies above 30 Hz between drilling andbackground noise. However, low frequency (1 to 2 Hz) tones were notedcorresponding to the rotation velocity of the drilling turntable. These were at level of121-124 dB re 1 µPa at ranges between 222-259 metres. The noise from the Canmarsteel sided drilling caisson was measured in 15 metre deep water with 100 % icecover by Gallagher [53]. Tonals were reported at frequencies of 5, 20, 60,150 and450 Hz with the dominant 5 Hz tone having a level of 119 dB re 1 µPa at a 115 metrerange. Drill ships and semi-submersible drill rigs have been reported to have a Source

A review of offshore windfarm related underwater noise sources
www.subacoustech.com 30
Level from 145 [54] to 191 dB re 1 µPa @ 1 m [55], but are unlikely to be usedduring windfarm development.
Richardson et al. [25] reviews reported disturbance reactions to drilling noise.Limited observations have been made of several species of cetacea near bothindustrial installations and drilling noise playback experiments. The reviewconcludes that cetacea avoid drilling activities when the received levels of underwaternoise are strong (well above background levels), but not when the sounds are barelydetectable. This agrees with the dBht hypothesis that behavioural reaction isdependent on the sound level above a species' hearing threshold.
4.5.3 SummaryBased on the available measurements, drilling noise is often of a low level, lowfrequency nature with several tonal components. However, there is not enoughresearch available to allow these results to be applied to situations that are not similarto those in which the measurements were taken. There is some evidence thatbehavioural reactions by cetacea are proportional to the received level abovebackground noise. In relation to drilling for wind turbine foundations, the aboveresults may only be used for comparison, as the drilling conditions will be markedlydifferent.
4.6 Gravity support structure installation
4.6.1 BackgroundAmong the possibilities for wind turbine foundations are gravity support structures.They consist of a pre-fabricated concrete foundation that is floated out to the windturbine location. Once there, the structure is filled with either sand or a fluid so that itsinks to the seafloor where it is secured. Scour protection is typically placed about thefoundation. The turbine tower is fixed to the structure. This foundation method is notcurrently in favour with windfarm developers with the majority of windfarms knownto the authors having a steel monopile foundation.
4.6.2 Available informationTo date, no gravity support structures have been installed for wind turbinefoundations in the UK. In the authors' knowledge no underwater noise measurementshave been made of gravity support structure installation and no behaviouralobservations have been made.
4.6.3 SummaryGravity support structures have not been used for wind turbine foundations to date inthe UK, although they have been used in Europe. As the technology and economiesof offshore windfarms develop, they may become a more favoured option. Nomeasurements of, or behavioural observation to, underwater noise from theinstallation of this foundation type are available.

A review of offshore windfarm related underwater noise sources
www.subacoustech.com 31
4.7 Dredging
4.7.1 BackgroundAlthough significant dredging, in the authors' knowledge, has not yet been undertakenas part of the construction of windfarms, it is possible that as developers become moreexperienced and suitable windfarm sites more scarce, dredging will be undertaken.The motivation for this may be to modify the windfarm site bathymetry, for exampleto allow jack-up barge access, to clear cable laying routes, for wind turbinefoundation scour protection or to clear post-construction sedimentary build up at thewindfarm site.
Dredging techniques include transfer dredging, where moored ships use suction pipesto collect sand and gravel from the sea floor and discharge pipes to deposit to thedischarge site; hopper dredging involves a ship that will fill its hoppers with materialand offload at the discharge site via gates in the bottom of the ship; a clamshelldredger scoops sand and gravel between two buckets and deposits this either at thedischarge site or on a barge. The mechanics of noise transmission during dredgingwill vary with dredging technique but is likely to consist of machinery noise,transmitted via the dredger's hull and submersed machinery, and sedimenttransportation noise, for example the motion of slurry along a pipe or the scraping ofsediment with buckets.
4.7.2 Available information
Figure 11. Estimated 1/3 octave band Source Levels for two dredgers [adaptedfrom 25].
Measurements of two suction dredgers, the Aquarius and Beaver Mackenzie, areshown in Figure 11 as Source Level octave band spectra [55]. Their octave bandspectra peak between 80 and 200 Hz, with the Aquarius having the higher of the twospectra peaking at approximately 177 dB re 1 µPa. In the 20-1000 Hz band the
0
50
100
150
200
250
1 10 100 1000 10000 100000
Frequency [Hz]
1/3
Oct
ave
Ban
d S
ourc
e L
evel
[dB
re
1 u
Pa
@ 1
m]
Aquarius Dredging
Beever Mackenzie Dredging

A review of offshore windfarm related underwater noise sources
www.subacoustech.com 32
Beaver Mackenzie and the Aquarius were measured to have a 133 dB re 1 µPa level at0.19 km and a 140 dB re 1 µPa level at 0.2 km respectively. Measurements of ahopper dredger, the Cornelis Zanen, loading at a range of 0.93 km and pumping out ata range of 13.3 km gave 20-1000 Hz band levels of 142 and 117 dB re 1 µParespectively in 20 m deep water [55]. In the same paper measurements were detailedof the Geopotes X whilst loading as 138 dB re 1 µPa at 0.43 km in band level between20-1000 Hz in 21 m deep water, and the Gateway whilst dumping in 12 m deep waterof 131 dB re 1 µPa at 1.5 km in the same band.
Documented reactions to dredging noise is scarce. One study of bowhead whale(Balaena mysticetus) reactions to the playback of dredging noise [25] showed that, aswith drilling noise, where received levels were comparable to background noise littleor no reaction was observed, but more conspicuous avoidance was observed for levels20-30 dB above ambient.
4.7.3 SummaryThere is little knowledge of dredging, but what does exist suggests that the noise isaudible to cetacea several kilometres from the source. Behavioural reactions shouldbe expected at close range to the source where the sound level is well abovebackground. For other marine wildlife, no behavioural observations are available.The measurements detailed above were conducted in shallow coastal waters and coversuction and hopper dredgers. Where similar dredging techniques and propagationconditions prevail, this limited set of results can be used as a guideline for expectednoise levels.
4.8 Rock laying
4.8.1 BackgroundRocks may be placed on the sea floor during windfarm construction for one of tworeasons, as scour protection about turbine foundations and to protect cables betweenthe turbines and to shore. The process of laying rocks on the sea floor will producenoise as they crash into each other and in addition to this sound will radiate frommachinery onboard the placement vessel.
4.8.2 Available informationMeasurements of rock placement noise are very scarce, with only one known to theauthors. The Rollingstone [43] is a dedicated rock placement vessel that canaccurately place gravel / rock in a controlled manner up to a water depth of 600metres via a fall pipe deployed through a moon pool. The bottom of the fall pipe ismonitored using a ROV. Measurements were taken while the Rollingstone was layingrock in the Yell Sound near the Shetland Islands, in waters between 60 and 70 metresdeep. The report concluded that there was no evidence that rock placement wascontributing to the noise level, and that some low frequency tonals were present frommachinery noise both while rock placement was not taking place and during rockplacement. The authors know of no marine wildlife observations in the vicinity ofrock placement.

A review of offshore windfarm related underwater noise sources
www.subacoustech.com 33
4.8.3 SummaryThe lack of measurements and behavioural observations make it difficult to assess thepotential for environmental effect from rock placement. The one availablemeasurement shows rock placement noise is within background levels. Nomeasurements of shallow water rock placement measurements have been published inthe authors' knowledge.
4.9 Trenching
4.9.1 BackgroundA significant amount of cable must be installed with a windfarm both asinterconnections between the turbines and cables to the shore based station. Toprotect the cables from damage they are trenched into the seafloor using specialmachines, such as a towed cable plough or a cable laying ROV. In addition to thenoise produced by the motion of the plough through the sea floor, noise will betransmitted through the hull of the cable laying barge from onboard machinery andhigh powered sub-bottom profilers may be used to give real time information of thelocal substrate. It should be noted that trenching will only take place where theseafloor consists of a suitable soft sediment, with other means of cable protection suchas rock placement being used where this is not the case.
4.9.2 Available information
Figure 12. dBht(Species) against range for trenching noise from the Trenchsetter inthe Yell sound [adapted from 56]. Long dashed lines indicate background noise
levels and short dashed lines are extrapolations.
0
20
40
60
80
100
120
140
160
180
200
1 10 100 1000 10000
Nominal distance (m)
Per
ceiv
ed n
ois
e le
vel i
n d
Bh
t (s
pec
ies)
harbour seal harbour porpoise
killer whale cod
dab salmon
harbour seal harbour porpoise
killer whale cod
dab salmon
background values

A review of offshore windfarm related underwater noise sources
www.subacoustech.com 34
In the authors' knowledge, there are no published measurements of cable trenchingnoise. However, during a survey of deep water pipe laying noise in the Yell Soundnear Shetland [56], measurements of pipe trenching noise from the Trenchsetter weretaken, and are shown in Figure 12 as dBht levels against range. Here themeasurements of the level above several species' thresholds are plotted with range.Measurements are highest for the killer whale, with a level of approximately80 dBht(Orcinus orca) at 500 metres, which is 10 dB above the proposed 70 dBht
reaction threshold. The harbour porpoise has a level of approximately 70dBht(Phocoena phocoena) at 500 metres, which indicates that a reaction is likely tooccur within this range. The other species have levels below this threshold at 500metres, but the sound level exceeds this value for all species except dab (Limandalimanda) and salmon (Salmo salar) at some point within this range.
It should be noted that the Trenchsetter was digging trenches for the laying of oil andgas pipelines, significantly larger in diameter then those required for windfarmcabling. In addition, cable laying is often performed with a machine that trenches,lays cable and backfills simultaneously, whereas in the cited survey these wereseparate operations.
4.9.3 SummaryThe only measurement of trenching noise known to the authors gives high dBht levels,which according to the reaction thresholds outlined in Section 3.2.3 suggest thatbehavioural reactions are likely at close range. However, the measured trenchingnoise is for pipe laying, which is likely to be significantly different to windfarm cablelaying. No measurements of shallow water cable laying noise have been publishedand therefore no conclusions may be taken to its environmental effect.
4.10 Turbine and support structure installation
4.10.1 BackgroundSeveral major installation operations will occur above water after successfulinstallation of the wind turbine foundation, these include transition piece, turbinemast, nacelle and rotor installation. These operations will, in most instances, beperformed by a barge secured close to the turbine foundation, and will involve thelifting of the components onto the foundation where they will then be fixed. Apartfrom engine and machinery noise radiated through the barge and support vessel'shulls, there is also the possibility of underwater noise being transmitted from theinstallations processes themselves, either through the air water interface or throughthe foundation structure.
4.10.2 Available informationIn the authors' knowledge there are no published measurements of the underwaternoise from turbine and turbine support structure installation.
4.10.3 SummaryTurbine and support structure installation will take place above the water surface buthas the potential to radiate underwater noise via turbine foundations and installationvessels. In the authors' knowledge no measurements have been published of theunderwater noise emitted during this operation.

A review of offshore windfarm related underwater noise sources
www.subacoustech.com 35
4.11 Wind turbine operational noise
4.11.1 BackgroundOf all windfarm related noise sources the marine environment will undergo thegreatest exposure from operational wind turbine noise. Whereas, pre-construction,construction and decommission will all take place over a period of months,operational noise will occur over a number of years and thus may effect a generationof marine wildlife. Therefore a rigorous assessment of the environmental effect froma windfarm must be made.
An appreciation of the underlying processes involved in the generation andtransmission of sound from wind turbines is beneficial in the assessment of itsenvironmental effect. The turbine rotor blades will generate aerodynamic noise asthey pass through the air, which may enter the water via an airborne path.Aerodynamic noise will increase with increasing rotational velocity of the turbine.The movement of air over the whole structure including the turbine blades and thehydrodynamic forces from passing waves will induce structural vibrations. Inaddition to this, structure borne vibrations will originate from mechanical vibrationsgenerated in the nacelle. Vibrations of the nacelle will depend on the degree ofmechanical refinement of the wind energy conversion process. As there is anefficiency advantage in reducing these vibrations, the system will be highly refined.However it is likely that the magnitude of the vibrations will increase with themachine's age due to component wear. The level of vibrations will also increase withincreasing wind speed, as the forces on the mechanical parts increase. All of thesegeneration mechanisms are likely to be dependent on each turbine's design and buildquality.
Figure 13. Wind turbine underwater noise transmission paths.
The structural vibrations may enter the water via one of three paths: airborne,waterborne or ground borne, whereas aerodynamic noise will only reach the water via
Air borne [2]
Air
bor
ne
[1]
Ground borne
Water borne
Structure bo
rne vibrations
Hydrophone

A review of offshore windfarm related underwater noise sources
www.subacoustech.com 36
an airborne path. In addition to this, vibrations in the turbine support structure,nacelle and rotor blades will also create airborne noise. Airborne noise will radiatefrom the turbine and some will encounter the air-water interface. As previouslydiscussed for airborne piling noise, the majority of airborne transmission occursdirectly beneath the turbine with a small contribution due to sea surface roughnessoutside this area, as shown in Figure 13, but it is unlikely to be the dominanttransmission path.
Structural vibrations that are transmitted to the turbine's foundation will encounter theturbine water interface. Here, the structural vibrations will directly induce waterbornesound waves that will propagate to a distant receiver. It is thought that this willcontribute the most to underwater wind turbine noise. The design of the turbinefoundation will have an impact on the efficiency of both the transmission of vibrationfrom the turbine tower to the foundation and from the foundation to the surroundingwater. Current designs include steel pile and concrete gravity foundations.
Both foundation types will be in contact with the sea floor, with piled foundationsprotruding several metres into it. Where they are in contact with sediment and rock inthe seabed, structural vibrations will induce both compressional waves, in a similarmanner to the sound in water, and seismic waves. The waves can travel outwardsthrough the seabed, and as they propagate sound will tend to leak upwards into thewater, where it contributes to the received sound level (Figure 13). Since soundabsorption in the seabed is generally greater than in water, and not all the energy inthe ground borne wave will enter the water, the contribution of the ground borne islikely be less than the water borne wave.
The identified sound generation and transmission mechanisms suggest that thereceived level of sound due to a wind turbine will be affected by the local wind speed,sound speed profile, water column depth, sea surface roughness and seabed geology.Of these factors, wind speed, sound speed profile and sea surface roughness willdepend on weather conditions, and water column depth and sound speed profile willdepend on tidal conditions. Seabed geology is unlikely to change significantly in theshort to medium term.
4.11.2 Available informationMeasurements of underwater noise from windfarms are scarce, with only twopublished measurements known to the authors. An extensive study of the Lelystad(Denmark) windfarm is noted to have been in preparation by Vella et. al. [2], howeverthe report is currently unavailable.
The first measurements of underwater noise from an operating wind turbine wereconducted by Westerburg in the mid 1990s [57]. The measurements were of the firstoffshore wind turbine in the world, a 220 kW Windworld AS turbine on a 35 metretower, located close to the shore on the South-East coast of Sweden. The results showthat, at wind speeds between 6 and 12 ms-1, wind turbine noise consists of harmonicsof the turbine's frequency of rotation (between 2.08 to 2.13 Hz). Figure 14 showsmeasured levels above ambient noise at 100 metres from the turbine. The Figureshows peaks at 8 and 16 Hz for a wind speed of 12 ms-1, and a single peak at 16 Hzfor a 6 ms-1 wind speed. The 16 Hz peak for both wind speeds remains a constantlevel above background noise. Also detailed in the report are the absolute (as

A review of offshore windfarm related underwater noise sources
www.subacoustech.com 37
opposed to relative to the background noise) sound pressure levels for the 16 Hz peakas 102 and 113 dB re 1 µPa for lower and higher wind speed respectively. Thisshows that although the absolute level of the turbine noise increases with wind speed,its level above background noise, which is also wind dependent, remains relativelyconstant.
Figure 14. Wind turbine (35 m tower, 220 kW Windworld AS turbine) noise abovebackground for two wind speeds [redrawn from 57].
In a report by Degn [58], two 500 kW turbines of differing foundations wereinvestigated with the aim of predicting the level for a proposed development of anarray of 2MW turbines. The measurements are unique in that they include towervibration measurements of both a 500 kW offshore turbine and a 2MW onshoreturbine. These were conducted to allow a prediction of the rate of underwater noiseincrease with turbine power. The Vindeby (Denmark) 450 kW Bonus Wind turbine isfounded on a concrete gravity foundation, and the Gotland (Sweden) 550 kWWindworld turbine is founded on a steel monopile foundation.
Figure 15 shows 1/3 octave band spectra of the two wind turbine measurements, bothtaken 20 m from the foundations. The measurements were taken during wind speedsof approximately 13 ms-1 and include background noise taken while the turbine wasnot operating. At Vindeby, the measurements show that wind turbine noisecontributes to the spectra up to 400 Hz, peaking at 119 dB re 1 µPa (33 dB abovebackground) at 25 Hz. It is unclear if the peak at 20 Hz is a harmonic of the turbine'srotational frequency as this is not specified, but assuming a frequency ofapproximately 2 Hz, as in Westerburg's measurement, would suggest this is the 11th
harmonic. The Gotland spectra do not suggest harmonic content, with a broad peak of95 dB re 1 µPa at 160 Hz (25 dB above background noise) falling to backgroundnoise level at 63 and 630 Hz.
-5
0
5
10
15
20
1 10 100
1/3 Octave Band Centre Frequency [Hz]
SP
L in
ex
cess
of
bac
kgro
un
d n
ois
e [d
B]
6 m/s 12 m/s

A review of offshore windfarm related underwater noise sources
www.subacoustech.com 38
Figure 15. Measured wind turbine noise and background noise for two windfarms[adapted from 58].
Tower vibration measurements were also taken from the two turbines at the same timeas underwater noise measurements. Both the Gotland and Vindeby tower velocityspectra show spectral peaks that correlate with those measured underwater at 160 Hzand 25 Hz respectively, although in this case these are not the dominant components.This would suggest that the underwater noise from wind turbines originates viastructure borne paths, although further research is needed to confirm this. In additionto the two offshore wind turbines, vibration measurements were also conducted on a2 MW onshore turbine. In conjunction with structure borne vibration to underwaternoise transfer function estimates derived from the above measurements, these havebeen used to predict the underwater noise level from a 2 MW offshore turbine. Theresult must be treated with caution as the reliability of this technique has not beenproven and the predicted increase in power is within the measurement uncertaintygiven in the report.
A study by Koschinski [59] investigated the response of seals and porpoises tosimulated wind turbine noise based on the above calculation of noise from a 2 MWturbine. The study used a CD player and an underwater loudspeaker to reproducesounds in the Fortune Channel, Canada, which is a (acoustically) quiet fjord-like areawith a population of harbour seal (Phoca vitulina) and harbour porpoise (Phocoenaphocoena). The report concludes that for the playback experiment harbour porpoise:are able to hear the wind turbine noise; seemed to be cautious when confronted withthe stimulus and explored the sound source with their biosonar. It is noted that theporpoise do not show avoidance behaviour similar to that previously observed close toacoustic deterrent devices such as gillnet pingers. The investigation into harbour seal(Phoca vitulina) reactions was less detailed, and concluded that harbour seals couldhear the sound and increased their median distance to the sound source whensurfacing.
ODS wind turbine noise
0
50
100
150
200
250
1 10 100 1000 10000 100000
Frequency [Hz]
Pow
er S
pect
ral D
ensi
ty L
evel
[dB
re
1 uP
a^2/
Hz]
Vindeby r = 14 m
Vindeby Background
Gotland Background
Gotland r = 20 m

A review of offshore windfarm related underwater noise sources
www.subacoustech.com 39
Anecdotal evidence from a fisherman local to the Vindeby windfarm suggestsavoidance of the windfarm area by turbot (Psetta maxima) during high wind speeds[60]. The Vindeby windfarm has eleven 450 kW turbines. The report investigatesboth the effect of underwater noise and magnetic fields on local flatfish and concludesthat underwater noise is unlikely to be the cause of the reported reaction and leaves anopen conclusion with respect to magnetic fields.
In addition to the measurements and observation reported above, there are severalreports that make judgements as to the likely effect of underwater noise fromoperating wind turbines [2, 61]. In general the potential for effect is judged frommarine wildlife hearing abilities in conjunction with assumptions as to the likely leveland frequency content of the underwater noise. These studies show that within thecommunity it is common to assume a relationship between the level of a sound abovea species' hearing threshold and behavioural response, which is a hypothesis behindthe dBht approach. However, without a set of measurements to reinforce the assumedsound levels in conjunction with behavioural studies they cannot be used as proof inthe assessment of environmental effect.
4.11.3 SummaryPublished results of wind turbine noise measurements and behavioural observationsare limited. However, based on current evidence radiated underwater noise fromwind turbines is of a low level and a low frequency, possibly harmonic in nature. TheSound Pressure Level increases with increasing wind speed along with thebackground noise level, maintaining a constant level above background. Publishedresults show some behavioural reaction to actual or simulated underwater noise byharbour seal (Phoca vitulina) and harbour porpoise (Phocoena phocoena). Reactionsinclude avoidance, but no 'fright reactions' were observed during a harbour seal andporpoise playback experiment [59]. Anecdotal evidence of turbot (Psetta maxima)displacement from the Vindeby windfarm during high winds could not be attributed tounderwater noise.
4.12 Underwater blast
4.12.1 BackgroundAt the end of a windfarm's lifecycle there will be a requirement to decommission thesite. While the majority of site decommissioning will be a reversal of the installationprocess, such as removal of the nacelle and rotor blades, turbine foundation removalmay be a difficult process. Current opinions on how this will take place vary. Jetcutting below the sea floor [5] is an option. Experience in the offshore oil and gasindustry however, suggests that blasting may be required [6]. Explosives may berequired for pile severance, to clear scour protection material and to break up concretegravity foundations for subsequent dredging.
When an explosion is initiated, solid explosive material is converted into incandescentgas at extremely high pressure. The way in which the energy of an explosive isconverted into blast, and the form of the accompanying pressure wave, depend on thecategory of explosive and the way in which it is used. High explosives like TNT andother nitroglycerine based explosives explode by a detonation process. A violentchemical reaction, following in the wake of the shock front propagating through theexplosive, turns the solid of the explosive into a gas at extremely high pressure. The

A review of offshore windfarm related underwater noise sources
www.subacoustech.com 40
velocity of detonation of high explosives is about 5,000 to 10,000 ms-1. Thedetonation produces a very fast build up in pressure, the resultant energy wave havinga very rapid rise and decay time [62]. This in turn causes a blast wave (pressure wave)to propagate into the surrounding medium. As the shock wave radiates outward overan expanding area, the amplitude of the peak pressure rapidly decreases, but graduallyslows as distance increases from the point of detonation. Eventually the shock wavedegenerates into a low-amplitude acoustic wave. The shock wave from a chargedetonated in the sea bed travels in a well-defined cone, expanding towards thesurface.
4.12.2 Available informationAlthough unconfined and borehole blasting have been studied extensively and arerelatively well understood, pile severance and gravity foundation removal willprobably use charges situated near to or slightly below the sea floor. This applicationfalls somewhat in between the two areas. However, recent measurements of theseverance of well heads, which are similar in structure to piled foundations, in theNorth Sea [63] have shown that in this case the explosive shock wave behaves as if itwere an unconfined charge. That is the pipe work and sediment surrounding thecharge do not act as an effective confinement mechanism. Wellheads typically have adiameter of less than 1 metre, which is about a quarter of the size of a wind turbinemonopile foundation.
Figure 16. Peak pressure against range for North Sea wellhead blast measurementsincluding predicted level with range for a 45 kg charge [63].
Figure 16 is a plot of the peak pressure versus range for measurements of theseverance of several well heads and, for comparison, the estimated peak pressure for aunconfined 45 kg charge (Equation 11). Pipe diameters were typically 30" (762 mm)requiring between 36 and 81 kg of liquid high explosive placed at between 2 and3 metres below the mud line. The water depth ranged between 32 to 116 metres. Themeasurements agree reasonably well with the model for an unconfined charge giventhat the measured charge mass varies for each wellhead. Figure 17 is drawn from thesame data as Figure 16 but in this case impulse is plotted against range. An extensivestudy by Yelverton [7,8] showed that blast related injury was strongly correlated withthe received level of impulse for submerged mammals, and similar models exist forfish mortality [64]. In this study an impulse of 69 Pas is given as leading to a low

A review of offshore windfarm related underwater noise sources
www.subacoustech.com 41
][10513.1
27.07
max Par
WP ××=
][10689.0
63.03 Pas
r
WI ××=
incidence of trivial blast injuries with no eardrum ruptures. The results given inFigure 17 show that for a typical 45 kg charge the blast impulse will fall to this levelat a range of about 2.2 km. In addition to these figures, dBht levels were calculatedfrom the stand off distances measurements at 600 metres, these are given as 136dBht(Gadus morhua) cod, 114 dBht(Limanda limanda) dab, 135 dBht(Phocoenaphocoena) harbour seal, 152 dBht(Phocoena vitulina) harbour porpoise and 158dBht(Orcinus orca) killer whale. The linear SPL at this range was 217 dB re 1 µPa.These figures are in excess of the 90 dBht reaction threshold. Observations of deadfish in the blast area were also reported by MMOs (Marine Mammal Observers).
Figure 17. Impulse against range for North Sea wellhead blast measurementsincluding predicted level with range for a 45 kg charge [63].
Most of the information that is available concerning estimating levels of unconfinedblast results from the military use of explosives, and hence concerns large charges thatare fired in deep water and are freely suspended in the water without any confinement[for example 65, 66, 67, 68, 69, 70, 71, 72]. Most of the work concerns TNT charges,but the author (Nedwell) has found that other high explosives of similar explosivestrength give very similar results.
For unconfined TNT charges in deep water expressions for estimating the values ofpeak pressure and impulse are:
(11)
(12)
where W is the charge weight in kilograms and r is the range from the explosive inmetres.
Along with the Yelverton model [7, 8], these equations provide the basis forestimating the likelihood of injury for submerged mammals in the vicinity of a blast.The Yelverton model was based on experiments using submerged land mammals,which do not have any of the adaptations to their lungs or other gas filled cavities thatdiving mammals have. This may result in an over estimation of the injury that may

A review of offshore windfarm related underwater noise sources
www.subacoustech.com 42
occur to marine wildlife in the vicinity of underwater blast. However, underwaterblast may injure or kill marine wildlife and this has been observed on severaloccasions [25].
4.12.3 SummaryIt is possible that explosives will be required for wind turbine foundation removal.Related measurements of wellhead severance demonstrate both high sound levels andinjury to marine wildlife from the use of explosives. The extent and range at whichthese responses will occur is a function of the charge weight. Marine wildlifemitigation measures have previously been used when blasting takes place, includingmonitoring and acoustic deterrents.
4.13 Jet Cutting
4.13.1 BackgroundCurrent non-explosive pile cutting techniques include mechanical and abrasivecutting. Mechanical cutters use hydraulically actuated carbide tipped tungsten bladesto mill through the inside of tubular structures (piles) [5]. Abrasive cutters havemechanisms to direct a water jet containing cutting materials to abrasively wear awaysteel. In both these techniques sound will be generated by the action of the cutter onthe pile and by the machinery which drives the cutter. This sound may radiate intothe water directly through the pile via a waterborne path or via the substrate by agroundborne path.
4.13.2 Available informationNo measurements of, or behavioural reactions to, the underwater noise produced bythese sources are known to the authors.
4.13.3 SummaryThe lack of published results make it difficult to assess the environmental impact ofjet cutting.
4.14 Diver tools
4.14.1 BackgroundDivers are often used to clear obstacles in the path of cable routes, and may also beused to cut steel monopile foundations. A variety of underwater hand-held tools areavailable for the various tasks required from a diver, which include gas cuttingequipment, jet cutters, jackhammers, grinders, bolt guns and hydraulic wrenches. Themechanism of sound generation in each of these techniques varies.
4.14.2 Available informationInformation on the noise levels from these sources is scarce, with the onlymeasurements known to the authors conducted by Nedwell [73, 74] of drills,wrenches, grinders, bolt guns and jackhammers. These measurements gave peakSource Levels of up to 200 dB re 1 µPa, and averaged levels of up to 161 dB re 1 µPa.Using average levels weighted by a diver's hearing sensitivity the report indicates that,based on in-air noise dose models, the sound levels from the bolt gun and impactwrench would exceed recommended levels.

A review of offshore windfarm related underwater noise sources
www.subacoustech.com 43
4.14.3 SummaryDivers are able to use the tools a few feet from their ears but their effect on divers hasnot been reviewed in detail. In air acoustic models suggest an unacceptable level ofnoise for some tools. The only available set of diver tool measurements show peakSource Levels of up to 200 dB re 1 µPa, and averaged levels of up to 161 dB re 1 µPa.No published observations are available of behavioural reactions to these sources bymarine wildlife.

A review of offshore windfarm related underwater noise sources
www.subacoustech.com 44
5 ConclusionsThe purpose of COWRIE funding is to 'provide generic research to benefit the earlystages of the offshore windfarm industry' [1], and windfarm related noise sourceshave been reviewed as part of this goal. The review has been conducted with anemphasis on reported measured sound levels, but also including the effect of sound onmarine wildlife. This is the only significant summary available of underwater noiseand its effects through a windfarm's lifecycle. Forthcoming research that is beingconducted as part of the COWRIE funded study and underwater noise monitoring thatis required of windfarm developers will significantly add to the knowledgesummarised within this review.
The reviewed noise sources are summarised in Table 2 for comparison. There aresignificant gaps in knowledge, and where research has been conducted it is not oftenin an easily comparable form. Where possible, the minimum and maximum SourceLevels for specified measurement quantities are given for each source. All the data istaken from Section 4 although, where appropriate, measured levels are adjusted usinga 20log10(r) Transmission Loss to give Source Level. A brief note summarising theknowledge which has led to these levels is given along with a summary of reviewedbehavioural observations.
5.1 Assessment of available information
5.1.1 Source Level and Transmission LossWorking through the sources that may be present during a windfarm's lifecycle, thefollowing conclusions may be drawn for each source.
• Vessel and machinery. Reported Source Levels range from 152 to 192 dB re1 µPa @ 1 m. This range is based on several measurements of large vessels indeep water and a few measurements of small vessels in shallow water.
• Geophysical survey. Windfarm developments will typically use boomers andsparkers during geophysical survey, but no reliable information is available onthese sources. Airguns, which are often used for geophysical survey in theoffshore oil and gas industry, have Source Levels ranging from 215 to 260 dB re1 µPa @ 1 m.
• Pile driving. A number of measurements of pile driving noise have been taken ofpiles ranging from 208 mm to approximately 4 m in diameter. Source Levelsvary, range from 192 to 261 dB re 1 µPa @ 1 m, and on average increase withincreasing pile diameter. Only one measurement of wind turbine pile installationis available, giving an SEL Source Level of up to 215 dB re 1 µPa @ 1 m forimpact pile driving. No measurements of wind turbine pile installation using avibro-driver are available, but other measurements suggest this technique isquieter than impact piling.
• Drilling. Measurements of drilling are restricted to deep water measurements ofoil and gas facilities. Based on available measurements, the range of SourceLevels is from 145 to 192 dB re 1 µPa @ 1 m. No measurements are available ofshallow water drilling such that would be used for installing wind turbine piledfoundations.
• Gravity foundation installation. No measurements are available.

A review of offshore windfarm related underwater noise sources
www.subacoustech.com 45
• Dredging. Some measurements of dredging in shallow coastal waters areavailable, which show peak spectral energy of 177 dB re 1 µPa between 80 and200 Hz. Where similar techniques are used in offshore windfarm developmentthese results may be used for comparison.
• Rock laying. There is one inconclusive measurement of relatively deep waterrock placement.
• Trenching. There is one measurement available of pipe trenching in the NorthSea, which shows high dBht levels. There are no available measurements of cabletrenching noise, which may be significantly different.
• Turbine structure installation. No measurements are available.• Wind turbines. There are two available measurements of low power (<1MW)
wind turbines, which show sound levels of a low frequency of a level up to153 dB re 1 µPa.
• Blast. Explosives may be required for windfarm decommissioning. Verifiedempirical models exist to predict blast Source Levels given a charge weight.Given knowledge of this parameter, a reasonable assessment of physical injury tomarine wildlife may be made according to the well used models, althoughbehavioural responses are still unclear.
• Jet cutting. No measurements have been made of this alternative to blasting forthe decommissioning of piled foundations.
• Diver tools. One set of measurements are available covering drills, wrenches,bolt guns, grinders and jackhammers. Peak SPLs of up to 200 dB re 1 µPa @ 1 mand average SPLs of up to 161 dB re 1 µPa @ 1 m are reported.
5.1.2 The effect of noise on marine wildlifeThe effect of noise on marine wildlife has been covered in this report, but not in anygreat depth. Based on the evidence herein reviewed, the noise sources may be splitinto four classifications of effect. Those where no observations have been madeinclude gravity foundation installation, rock laying, trenching, turbine structureinstallation, jet cutting and diver tools. Varying reactions, including avoidance andattraction, have been reported for shipping, dredging, drilling, and wind turbines.Avoidance, but no attraction reactions have been noted for geophysical survey, piledriving and blast. Physical injury has been observed in the vicinity of blast and pilehammering.

A review of offshore windfarm related underwater noise sources
www.subacoustech.com 46
Tab
le 2
. S
umm
ary
of a
vail
able
inf
orm
atio
n.

A review of offshore windfarm related underwater noise sources
www.subacoustech.com 47
6 Recommendations
6.1 Noise source rankingTo aid in the assessment of potential for environmental effect from windfarm relatednoise and provide research priorities the authors have included their personalassessment of these factors below. It should be emphasised that the judgements arecomparative and not relative, are based on the authors' significant experience in thefield and are not solely a reflection of the measurements herein reviewed or otherwise.Hence, it is in the authors' opinion that, for windfarm related noise sources, therelative potential for environmental effect is as follows (greatest risk first):
• Foundation decommissioning using explosives.• Piled foundation installation and windfarm related geophysical survey.• Drilling, rock laying, cable trenching, diver tools.• Vessel and machinery, wind turbine operation.
This assessment does not include the cumulative effects of noise, which wouldemphasise wind turbine and vessel noise because of the exposure the marineenvironment has to these sources. An assessment cannot be made of jet cutting,turbine structure installation and gravity support structure installation, as nomeasurements are available of these sources.
Amongst the sources of underwater noise, the authors believe the following areas arepriority areas for investigation (greatest priority first):
• Piled foundation installation, wind turbine operation, and windfarm relatedgeophysical survey.
• Cable trenching, drilling, rock laying, diver tools, jet cutting, gravity foundationinstallation, vessel and machinery, turbine structure installation.
In all areas, research should be conducted into both the sound levels from thesesources and its possible effect on marine wildlife. Without an understanding of bothof these factors a reasonable assessment of environmental effect cannot be made.Where an unacceptable environmental effect may occur, mitigation measures shouldbe identified, considered and if necessary implemented.

A review of offshore windfarm related underwater noise sources
www.subacoustech.com 48
7 Acknowledgements
The authors gratefully acknowledge:
• COWRIE for sponsoring the work and their comments on the report;• Gerro Vella for his reference library compiled during the preparation of the
preceding report [2];• BP for their permission to include the data from the Magnus EOR project and• everyone who helped to source reference material.
A review of offshore windfarm related underwater noise sources
www.subacoustech.com 49
8 References
[1] COWRIE website, [online document], Jan 2004, Available WWW:http://www.crownestate.co.uk/estates/marine/windfarms/cowrie.shtml
[2] Vella, G., Rushforth, I., Mason, E., Hough, A., England, R., Styles, P., Holt, T.,Thorne, P., "Assessment of the Effects of Noise and Vibration from OffshoreWindfarms on Marine Wildlife.", ETSU W/13/00566/REP, DTI/Pub URN01/1341, 2001, Available WWW:http://www.dti.gov.uk/energy/renewables/publications/pdfs/w1300566.pdf
[3] Watson, G., "Structure and Foundations Design of Offshore Wind Installations",[online document], Rep. On the Offshore Wind Energy Network Workshop, Mar.2001, Available WWW: http://www.owen.org.uk/workshop_3/ws3_final.pdf
[4] Delft University Wind Energy Research Institute, "Ready to Powera Sustainable Europe", Concerted Action on Offshore Wind Energy in Europe:Final report, Dec. 2001, Report Ref: Duwind 2001.006, Available from: DelftUniversity Wind Energy Research Institute (Duwind).
[5] Peason, D., "Decommissioning Wind Turbines In The UK Offshore Zone",Enron Wind, Prince Consort House, 27-29 Albert Embankment, London, SE17TJ.
[6] Committee on Techniques for Removing Fixed Offshore Structures, "Anassessment of techniques for removing offshore structures", Marine Board,National Research Council, 1996, [online document], Available WWW:http://books.nap.edu/catalog/9072.html
[7] Yelverton, J., et. al., "Underwater explosion damage risk criteria for fish, birds,and mammals.", presented at 102nd Meet. Acoust. Soc. Am., Miami Beach, FL,Dec., 1981.
[8] Yelverton, J., et. al., "Safe distances from underwater explosions for mammalsand birds..", DNA 3114T, Rep. From Lovelace Foundation for Medical Educ.And Res., Alburquerque, NM, for Defence Nuclear Agency, Washington, DC, 67p, NTIS AD-766952.
[9] Mellen, R., "Thermal noise limit in the detection of underwater acoustic signals.",J. Acoust. Soc. Am., vol. 24, p. 478, 1952.
[10]Wenz, G., "Acoustic ambient noise in the Ocean: Spectra and Sources", J.Acoust. Soc. Am., vol. 34, p. 1936, 1962.
[11]Andersen, S., "Auditory sensitivity of the harbour porpoise Phocoenaphocoena.", Invest. Cetacea, vol. 2, pp. 255-259, 1970.
[12]Johnson, C., "Sound detection thresholds in marine mammals.", 1967, in: W.N.Tavolga (ed), Marine bio-acoustics, vol. 2. Pergamon, Oxford, UK.

A review of offshore windfarm related underwater noise sources
www.subacoustech.com 50
[13] Hawkins, A., et al., "Hearing and sound communication under water.", 1983, In:Bioacoustics: a comparative approach. B. Lewis (ed.), pp. 347-405. AcademicPress, New York.
[14] Møhl, B., "Auditory sensitivity of the common seal in air and water.", J. Aud.Res., vol. 8, no. 1, pp. 27-38, 1968.
[15] Szymanski, M.et al., "Killer whale (Orcinus orca) hearing: Auditory brainstormresponse and behavioral audiograms.", J. Acous. Soc. Am., vol. 106, no. 2, pp.1134-1141, 1999.
[16] Nedwell, J R, et al., “Objective design of acoustic fish deterrent systems.”Proceedings of the Symposium on Cooling Water Intake Technologies to ProtectAquatic Organisms, Environmental Protection Agency, May 6- 7, 2003. HiltonCrystal City at National Airport, Arlington, VA.
[17] Research in progress. Contact Subacoustech Ltd., Hampshire, UK, for furtherinformation, quoting reference 534.
[18] Urick, R., Principles of underwater sound, New York: McGraw Hill, 1983.
[19] Nedwell, J., et. al., "Measurement of sound during a 3D seismic survey in blocks14.14a of the North Sea", Subacoustech Ltd., Hampshire, UK, Tech. Rep.356R0108, 1999.
[20] Turnpenny, A., et al., "The effects on marine fish, diving mammals and birds ofunderwater sound generated by seismic surveys.", Fawley Aquatic ResearchLaboratories Ltd, Fawley, Hampshire, Tech. Rep. No FRR 089/94, 1994.
[21] Urban, G., "Directional measurement of ambient noise spectra.", in Proceedingsof the European Conference on Underwater Acoustics, pp.222-226, 1992.
[22] Knudsen, V., et al., "Underwater ambient noise", J. of Mar. Res., vol. 7, p 410,1948.
[23] Piggot, C., "Ambient sea noise at low frequencies in shallow water of the ScotianShelf.", J. Acous. Soc. Am., vol. 36, p. 2152, 1965. Original source not seen,reference is cited in [11].
[24] Ross, D., Mechanics of Underwater Noise, New York: Pergamon Press, 1976.
[25] Richardson et al., Marine mammals and noise, San Diego: Academic Press, 1995.
[26] Arveson, P., et al., "Radiated noise characteristics of a modern cargo ship.", J.Acous. Soc. Am., vol. 107, no. 1,pp. 118-129, 2000.
[27] Nedwell, J., et al., "Measurements of underwater noise during piling at the RedFunnel Terminal, Southampton, and observations of its effect on caged fish.",

A review of offshore windfarm related underwater noise sources
www.subacoustech.com 51
[online] Subacoustech Ltd., Hampshire, UK, Tech. Rep. 558R0207, October2003, Available WWW: www.subacoustech.com/downloads.
[28]Reijnders, P., "Management and conservation of the harbour seal, Phoca vitulina,population in the international Wadden Sea area.", Biol. Conserv., vol. 19, no. 3,pp. 213-221, 1981.
[29]Brasseur, S., "Tolerance of harbour seals to human related disturbance sourcesduring haulout.", in Abstr. 10th Bienn. Conf. Biol. Mar. Mamm. (Galveston, TX,p. 130, Nov. 1992).
[30]Bowles,et. al., "Disturbances to the pinnipeds and birds of San Miguel Isalnd,1979-1980.", in Jehl, J., et al., Potential effects of space shuttle sonic booms onthe biota and geology of the California channel Islands: Research reports.(Tech. Rep. 80-1 Rep. from Cent. Mar. Stud., San Diego State Univ., andHubbs/Sea World Res. Inst., San Diego, CA, for US Air Force, Space Div. 246p.)
[31]Allen, S., et al., "The effect of disturbance on harbor seal haul out patterns atBolinas Lagoon, California.", Fish Bulletin, vol. 82, no. 3, pp 493-500, 1984.
[32]Osborn, L., "Population dynamics, behaviour, and the effect if disturbance onhaulout patterns of harbor seal Phoca vitulina richardsi, Elkhorn Slough,Monterey Bay, California.", B.A. Thesis, Dep. Environ. Stud. & Dep. Biol.,Calif., Santa Cruz., p. 75, 1985.
[33]"AAE 200 Boomer Plate with Catamaran", [online document], Available WWW:http://www.seatronics-group.com/geophys/aaeboom.htm, Feb. 2004.
[34]"GeoPulse Boomer/Sparker Profiling System", [online document], AvailableWWW: http://www.geoacoustics.com/specs/PDF_Files/GeoPulse_Boomer.pdf,Feb. 2004.
[35]Nedwell, J., et al., "Measurement of sound during a 3D seismic survey in blocks14/14a of the North Sea.", Subacoustech Ltd., Hampshire, UK, Tech. Rep.356R0108, 1999.
[36]Duncan, P., "Seismic sources in a marine environment.", in Proc. Workshop onEffects of Explosive Use in the Marine Environment, (Halifax, N.S., Jan, 1985, pp56-88).
[37]Mate, B., et al., "A change in sperm whale (Physeter macrocephalus) distributioncorrelated to seismic surveys in the Gulf of Mexico.", J. Acous. Soc. Am., vol.96, no. 5, pt. 2, pp. 3268-3269, 1994.
[38]Bowles, et al., "Relative abundance and behaviour of marine mammals exposedto transmission from the Heard Island Feasibility Test.", J. Acoust. Soc. Am., vol.96, no. 4, pp. 2469-2484, 1994.
[39]Gerjuoy, E., "The sound pressure in water resulting from a point source in air.",Physical Review, vol. 72, p. 745, 1947.

A review of offshore windfarm related underwater noise sources
www.subacoustech.com 52
[40] Andersen, M., et al., "Flange connections between offshore wind turbine towersand mono pile foundations.", LICengineering A/S, Ehlersvej 24, DK-2900Hellerup, Denmark.
[41] Nedwell, J., et al., "Measurements of underwater noise in the Arun River duringpiling at County Wharf, Littlehampton", Subacoustech Ltd., Hampshire, UK,Tech Rep. 513R0108, 2002.
[42] Wursig, B., et al, "Development of an air bubble curtain to reduce underwaternoise of percussive piling.", Marine Environmental Research, vol. 49, pp. 79-93,2000.
[43] Nedwell, J., et al., "Noise measurements during pipeline laying operations aroundthe Shetland Islands for the Magnus EOR project.", Subacoustech Ltd.,Hampshire, UK, Tech. Rep. 473R0112, 2001.
[44] San Francisco – Oakland Bay Bridge, Pile Installation Demonstration Project,Fisheries Impact Assessment, PIDP EA 01208, Caltrans Contract 04A0148, TaskOrder 205.10.90, PIDP 04-ALA-80-0.0/0.5, 2001.
[45] Vagle, S., "On the Impact of Underwater Pile-Driving Noise on Marine Life",Ocean Science Productivity Division, Institute of Ocean Sciences, DFO/Pacific,2003.
[46] McKenzie-Maxon, C., "Offshore Wind Turbine Construction, Offshore Pile-Driving Underwater and Above Water Noise Measurement and Analysis.", Rep.to: SEAS Distribution A.m.b.A, Slagterivej 25, 4690 Haslev, Danmark, Tec. Rep.00.877, 2000.
[47] Tougaard, J., et al., "Short-term effects of the construction of wind turbines onharbour porpoises at Horns Reef.", Tech. Rep. HME/362-02662, to: TechWiseA/S., Hedeselskabet, Roskilde, 2003.
[48] Engell-Sørensen, K., et al., "Evaluation of the Effect of Noise from Offshore Pile-Driving on Marine Fish", Bio/consult as, Johs. Ewaldsvej 42-44, DK-8230Åbyhøj, Tech Rep. 1980-1-03-1- rev. 2. to: SEAS, Slagterivej 25, DK-4690Haslev.
[49] Feist, B., et al., "Potential Impacts of Pile Driving on Juvenile Pink(oncorhynchus gorbuscha) and Chum (O. keta) Salmon Behaviour andDistribtuion", University of Washington, School of Fisheries, 1992.
[50] "Engineering Instructions for Pile Driving Equipment", US Army CorpEngineering Instruction, U.S. Army Corps of Engineers, Engineering DivisionDirectorate of Military Programs, Washington, DC 20314-1000 EI 02G00, 1997.
[51] Richardson et, al., "Acoustic effects of oil production activities on bowhead andwhite whales visible during spring migration near Pt. Barrow, Alaska - 1989phase.", OCS Study MMS 90-0017, 1990.

A review of offshore windfarm related underwater noise sources
www.subacoustech.com 53
[52] Hall, J., et al., "Measurements of underwater sounds from a concrete islanddrilling structure located in the Alaskan sector of the Beaufort Sea.", J. Acous.Soc. Am., vol. 51, no. 2, pp. 515-517, 1991.
[53] Gallagher, M., et al., "ARCO Alaska, Inc. Cabot prospect/Site specificmonitoring plan/Final report.", Coastal & Offshore Pacific Corp., Walnut Creek,CA, for ARCO Alaska Inc., 1992. [50] Greene, C., "Characteristics of oilindustry dredge and drilling sounds in the Beaufort Sea.", J. Acoust. Soc. Am.,vol. 82, no. 4, 1315-1324, 1987.
[54] Gales, R., "Effects of noise of offshore oil and gas operations on marinemammals - An introductory assessment.", NOSC TR 844, 2 vol., U.S. NavalOcean Systems Cent., San Diego, CA., NTIS AD-A123699 + AD-A123700.
[55] Greene, C., "Characteristics of oil industry dredge and drilling sounds in theBeaufort Sea.", J. Acoust. Soc. Am., vol. 82, no. 4, 1315-1324, 1987.
[56] Nedwell, J., et al., "Report on measurements of underwater noise from the JackBates drill rig.", Tech. Rep. 462 R 0202, Subacoustech Ltd., Hampshire, UK,2001.
[57] Westerburg, H., "Impact Studies of Sea-Based Windpower in Sweden.", Pres.At: Technische Eingriffe in marine Lebensraume, Bundesamt für Naturschutz,Internationale Naturschutzakademie, Insel Vilm, 1999.
[58] Degn, U., "Offshore Wind Turbines VVM (EIA), Underwater NoiseMeasurements Analysis and Predictions", Tech. Rep. 00.792 rev. 1, Rep. to:SEAS Distribution A.m.b.A., Slagterivej 25, 4690 Haslev, Danmark, 2000.
[59] Koschinski, S., et al., "Behavioural reactions of free-ranging porpoises and seal tothe noise of a simluated 2MW windpower generator", Mar. Ecol. Prog. Ser., vol.265,pp. 263-273, 2003.
[60] Engell-Sorensen, K., "Possible effects of the offshore windfarm at Vindeby onthe outcome of fishing.", Tech. Rep. 1920-03-001 rev. 2., Bioconsult report toSEAS, 2002.
[61] Hoffman, E., et al., "Effects of marine windfarms on the distribution of fish,shellfish and marine mammals in the Horns Rev area.", Tech. Rep.Baggrundsrapport nr.24, Prep. by: ELSAMPROJEKT A/S to: Danish Institute forFisheries Research, Department of Marine Fisheries, Charlottenlund Castle, DK2920 Charlottenlund, 2000.
[62] Tyler, R., "Use of dynamite to recover tagged salmon.", Ser. Sp. Sci. Rep. Fish.,vol. 353, pp. 9, 1960.
[63] Nedwell, J., et al., "The effects of underwater blast during wellhead severance inthe North Sea.", Tech. Rep. 469R0202, Subacoustech Ltd., Hampshire, UK,2001.

A review of offshore windfarm related underwater noise sources
www.subacoustech.com 54
[64] Department of Fisheries and Oceans, Canada, "Policy and guidelines for the useof explosives in the waters of the Northwest Territories.", DFO Western Region,Winnipeg, Manitoba, 1982.
[65] Cole, R., Underwater explosions., Princetown, NJ, 1948.
[66] Arons, A.,et al., "Secondary pressure pulses due to gas globe oscillations inunderwater explosions.", J. Acous. Soc. Am., vol. 20, pp. 271-276, 1948.
[67] Coles, J., et al., "Shockwave parameters from spherical TNT charges detonatedunderwater.", Underwater Explosives Laboratory, Woods Hole, MA, 1946.
[68] Gaspin J., et al., "Source levels of shallow underwater explosions.", NavalOrdinance Laboratory, NOLTR, pp. 71-160, 1971.
[69] Hillier, H., "Experiments on the pressure wave thrown out by submarineexplosion.", Tech. Rep. 142/19, British Department of Scientific Research andExperiments, 1919.
[70] Kirkwood, J., et al., "The pressure wave produced by an underwater explosion.",Tech. Rep. 588, Office of Scientific Research and Development, 1942.
[71] Lauer, R., et al., "A computer model of the explosive acoustic source.", J. Acous.Soc. Am, vol. 1, p. 71, 1976.
[72] Slifco, J., "Pressure-pulse charecteristics of deep explosives as functions of depthand range.", Naval Ordinance Laboratory, NOLTR, pp. 67-87, 1967.
[73] Nedwell, et al., "Underwater tool noise: implications for hearing loss", Advancesin underwater technology, ocean science and offshore engineering, vol. 31, pp.267-275, 1993.
[74] Parvin, S., et al., “A survey of noise exposure of divers operating underwatertools.” Tech. Rep. QinetiQ/CHS/PPD/CR010322/1.0, QinetiQ Ltd, Alverstoke,Fort Road, Gosport, Hants., PO12 2QU, 2001.
[75] Danish Wind Turbine Manufacturers Association (2001) Web Site, [online],Available WWW: http://www.windpower.dk, Feb 2002.
[76] "Horns Rev Offshore Wind Farm Environmental Impact Assessment - Summaryof EIA Report", Tech. Rep. EP00/025/JKG/HG by: ELSAMPROJEKT A/S,Kraftværksvej 53, DK-7000 Fredericia, Prep. for: I/S Elsam, Overgade 45, DK-7000 Fredericia, 2000.
[77] Henriksen, O., "Does underwater noise from offshore wind farms potentiallyaffect seals and harbour porpoises?", [online document], Available WWW:http://www.middelgrunden.dk/MG_UK/article/sealsnoise.htm, Feb 2004.
A review of offshore windfarm related underwater noise sources
www.subacoustech.com 55
[78] "Northsea offshore wind - a powerhouse for Europe.",Tech. Rep. Prep. For:Greenpeace Germany (GPD).
[79] Dolman, S., et al., "Marine wind farms and cetaceans.", Tech. Rep.IWC/SC/55/E4.
[80] Simmonds, M., et al., "Oceans of Noise", Whale and Dolphin ConservationSociety (WDCS), Brookfield House, 38 St Paul St, Chippenham, Wiltshire, SN151LJ, Available WWW: http://www.wdcs.org.
[81] de Boer., M., et al., "Small cetaceans along the coasts of Wales and SouthwestEngland", Whale and Dolphin Conservation Society (WDCS), Brookfield House,38 St Paul St., Chippenham, Wiltshire, SN15 1LJ., Available WWW:http://www.wdcs.org.
[82] San Francisco – Oakland Bay Bridge, Pile Installation Demonstration Project,Marine Mammal Impact Assessment, Tech. Rep. PIDP EA 01208, CaltransContract 04A0148, Task Order 205.10.90, PIDP 04-ALA-80-0.0/0.5.
[83] Burdic, Underwater acoustic systems analysis, Englewood Cliffs: Prentice-Hall,1984.
[84] Anderson, A., et al., "Ambient noise measurements at 30, 60 and 150 kHz in fiveports", J. Acous. Soc. Am., vol. 49, p. 928, 1971.
[85] Goold, J., et al., "Broadband spectra of seismic survey air-gun emissions, withreference to dolphin auditory thresholds.", J. Acoust. Soc. Am., vol. 103, no. 4,pp. 2177-2184, 1998.
[86] Bargar, J., et al., "The airgun as an implosive underwater transducer.", J. Acous.Soc. Am., vol. 68, no. 4, pp. 1038-1045, 1980.
[87] Greene, C., "Characteristics of marine seismic survey sounds in the BeaufortSea.", J. Acous. Soc. Am., vol. 83, no. 6, pp. 2246-2254, 1988.
[88] "San Francisco – Oakland Bay Bridge, Pile Installation Demonstration Project,Marine Mammal Monitoring Plan", EA 012000, Caltrans Contract 04A0148,2000.
[89] Koschinski, S.,"Offshore windfarms.", [onine document], Article from theGerman society for dolphin conservation., Available WWW:http://www.delphinschutz.org, Feb. 2004.
[90] Nedwell, J., at al., "Measurements of drill rig noise.", Tech. Rep. 452R0102,Subacoustech Ltd., Hampshire, UK, 2001.

A review of offshore windfarm related underwater noise sources
www.subacoustech.com 56
Appendices

A review of offshore windfarm related underwater noise sources
www.subacoustech.com 57
Appendix E - Record of changes.
1. This is a controlled document.2. Additional copies should be obtained through the Subacoustech Librarian.3. If copied locally, each document must be marked "Uncontrolled Copy".4. Amendment shall be by whole document replacement.5. Proposals for change to this document should be forwarded to Subacoustech.
Issue Date Details of changes544R0301 01/12/03 Initial version544R0302 16/12/03 Text added by DH544R0303 21/12/03 Text added by DH544R0304 12/01/04 Changes made by DH as a result of internal review.544R0305 20/02/04 Changes made by DH as a result of internal review.544R0306 14/05/04 Changes made by DH as a result of internal review.544R0307 20/07/04 Changes made by DH as a result of review by Zoe
Crutchfield and Mark Tasker.544R0308 21/09/04 Changes made by DH as a result of review by COWRIE
committee.
1. Originator’s current report number 544R03082. Originator’s Name & Location Daren Howell, Subacoustech Ltd.3. Contract number & period covered 544; 1st April 2003 – 30th January 20044. Sponsor’s name & location COWRIE for Crown Estates5. Report Classification & Caveats inuse
UNCLASSIFIED; UNLIMITEDDISTRIBUTION.
6a. Date written Oct 046b. Pagination 636c. Reference Nedwell, J., Howell, D., "A review of
offshore windfarm related underwaternoise sources.", Tech. Rep. 544R0308,Prep. by. Subacoustech Ltd., Hampshire,UK, for: COWRIE.
7a. Report Title A review of offshore windfarm relatednoise sources.
7b. Translation / Conference details N/A7c. Title classification UNCLASSIFIED8. Authors Daren Howell, Jeremy Nedwell9. Descriptors / Key words Underwater, noise, windfarm, piling,
drilling.10a Abstract N\A10b. Abstract classification UNCLASSIFIED; UNLIMITED
DISTRIBUTION.

![[Document title]marine.gov.scot/sites/default/files/moray_east_emp... · Moray Offshore Windfarm (East) Limited Environmental Management Plan 2 Produced by Moray Offshore WindFarm](https://static.fdocuments.in/doc/165x107/6010a4f9e04f070b2233f645/document-title-moray-offshore-windfarm-east-limited-environmental-management.jpg)