Norfolk Vanguard Offshore Windfarm Export Cable ......Norfolk Vanguard Offshore Windfarm – Export...
46
Norfolk Vanguard Offshore Windfarm Export Cable Installation Study 2210_NVOWF_Installation_Study_002 REVISION DATE ISSUE DETAILS PREPARED CHECKED APPROVED 00 21-06-17 Draft for customer review SW, DH, VT, AL, EJ SW, VT BP, EJ 01 03-07-17 Ammended based on customer comments SW, VT, AL SW, VT BP, EJ 02 25-09-17 Ammended based on final customer comments SW SW BP
Transcript of Norfolk Vanguard Offshore Windfarm Export Cable ......Norfolk Vanguard Offshore Windfarm – Export...
Norfolk Vanguard Offshore Windfarm
Export Cable Installation Study
2210_NVOWF_Installation_Study_002
REVISION DATE ISSUE DETAILS PREPARED CHECKED APPROVED
00 21-06-17 Draft for customer review
SW, DH, VT, AL, EJ SW, VT BP, EJ
01 03-07-17 Ammended based on customer
comments SW, VT, AL SW, VT BP, EJ
02 25-09-17 Ammended based on final
customer comments SW SW BP
Norfolk Vanguard Offshore Windfarm – Export Cable Installation Study Version Number: 02 Date: 25
th September 2017
Page 2 of 46
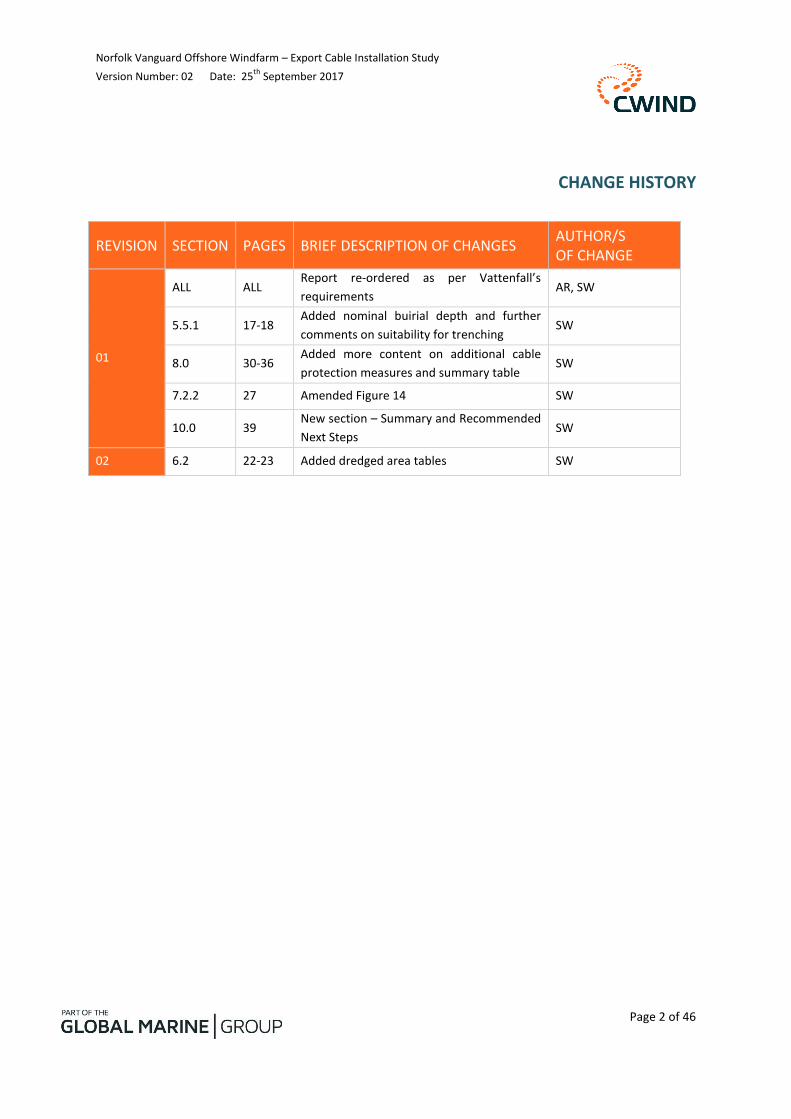
CHANGE HISTORY
REVISION SECTION PAGES BRIEF DESCRIPTION OF CHANGES AUTHOR/S OF CHANGE
01
ALL ALL Report re-ordered as per Vattenfall’s
requirements AR, SW
5.5.1 17-18 Added nominal buirial depth and further
comments on suitability for trenching SW
8.0 30-36 Added more content on additional cable
protection measures and summary table SW
7.2.2 27 Amended Figure 14 SW
10.0 39 New section – Summary and Recommended
Next Steps SW
02 6.2 22-23 Added dredged area tables SW
Norfolk Vanguard Offshore Windfarm – Export Cable Installation Study Version Number: 02 Date: 25
th September 2017
Page 3 of 46
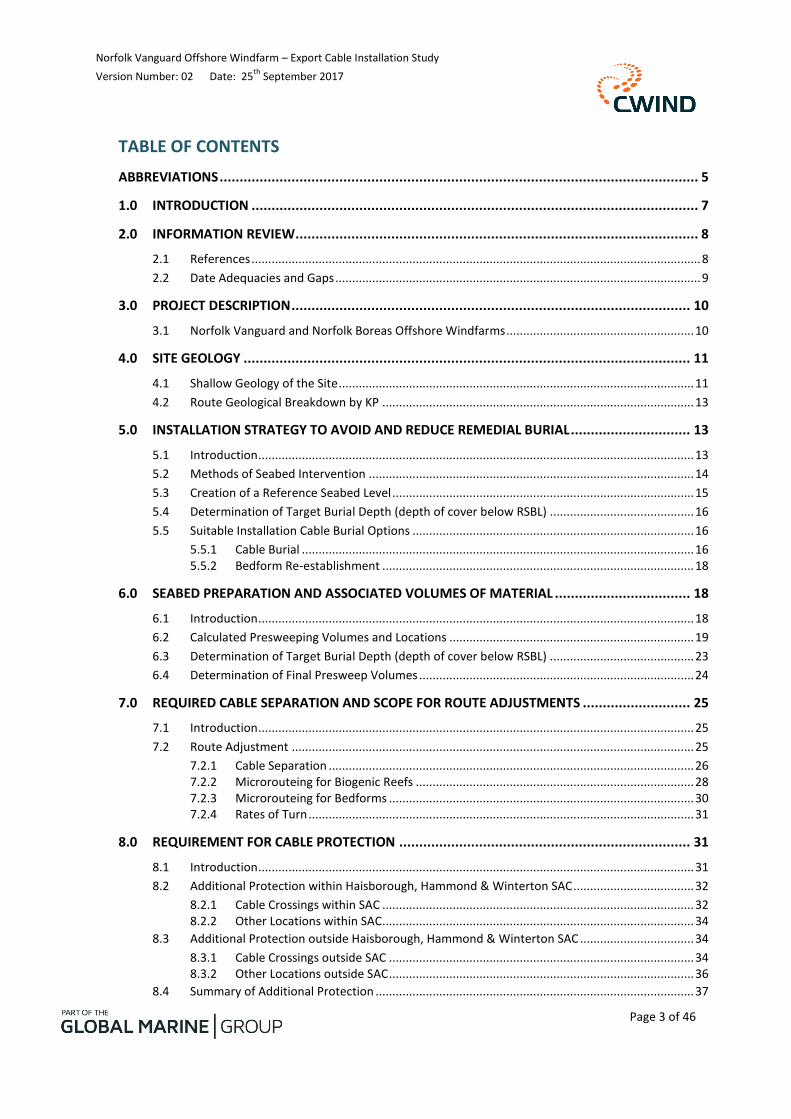
TABLE OF CONTENTS
ABBREVIATIONS ........................................................................................................................ 5
1.0 INTRODUCTION ................................................................................................................ 7
2.0 INFORMATION REVIEW ..................................................................................................... 8
2.1 References ...................................................................................................................................... 8
2.2 Date Adequacies and Gaps ............................................................................................................. 9
3.0 PROJECT DESCRIPTION .................................................................................................... 10
3.1 Norfolk Vanguard and Norfolk Boreas Offshore Windfarms ........................................................ 10
4.0 SITE GEOLOGY ................................................................................................................ 11
4.1 Shallow Geology of the Site .......................................................................................................... 11
4.2 Route Geological Breakdown by KP ............................................................................................. 13
5.0 INSTALLATION STRATEGY TO AVOID AND REDUCE REMEDIAL BURIAL .............................. 13
5.1 Introduction .................................................................................................................................. 13
5.2 Methods of Seabed Intervention ................................................................................................. 14
5.3 Creation of a Reference Seabed Level .......................................................................................... 15
5.4 Determination of Target Burial Depth (depth of cover below RSBL) ........................................... 16
5.5 Suitable Installation Cable Burial Options .................................................................................... 16
5.5.1 Cable Burial ..................................................................................................................... 16 5.5.2 Bedform Re-establishment ............................................................................................. 18
6.0 SEABED PREPARATION AND ASSOCIATED VOLUMES OF MATERIAL .................................. 18
6.1 Introduction .................................................................................................................................. 18
6.2 Calculated Presweeping Volumes and Locations ......................................................................... 19
6.3 Determination of Target Burial Depth (depth of cover below RSBL) ........................................... 23
6.4 Determination of Final Presweep Volumes .................................................................................. 24
7.0 REQUIRED CABLE SEPARATION AND SCOPE FOR ROUTE ADJUSTMENTS ........................... 25
7.1 Introduction .................................................................................................................................. 25
7.2 Route Adjustment ........................................................................................................................ 25
7.2.1 Cable Separation ............................................................................................................. 26 7.2.2 Microrouteing for Biogenic Reefs ................................................................................... 28 7.2.3 Microrouteing for Bedforms ........................................................................................... 30 7.2.4 Rates of Turn ................................................................................................................... 31
8.0 REQUIREMENT FOR CABLE PROTECTION ......................................................................... 31
8.1 Introduction .................................................................................................................................. 31
8.2 Additional Protection within Haisborough, Hammond & Winterton SAC .................................... 32
8.2.1 Cable Crossings within SAC ............................................................................................. 32 8.2.2 Other Locations within SAC............................................................................................. 34
8.3 Additional Protection outside Haisborough, Hammond & Winterton SAC .................................. 34
8.3.1 Cable Crossings outside SAC ........................................................................................... 34 8.3.2 Other Locations outside SAC ........................................................................................... 36
8.4 Summary of Additional Protection ............................................................................................... 37
Norfolk Vanguard Offshore Windfarm – Export Cable Installation Study Version Number: 02 Date: 25
th September 2017
Page 4 of 46
8.5 Project Timescales ........................................................................................................................ 37
9.0 CABLE CORRIDOR DREDGED MATERIAL MANAGEMENT ................................................... 37
9.1 Introduction .................................................................................................................................. 37
9.2 Net Regional Sediment Migration ................................................................................................ 37
9.3 Spoil Zones Within the Haisborough, Hammond & Winterton SAC ............................................. 38
9.4 Alternate Spoil Zones ................................................................................................................... 40
10.0 SUMMARY AND RECOMMENDED NEXT STEPS ................................................................. 40
10.1 Summary ...................................................................................................................................... 40
10.2 Target Burial Depth ...................................................................................................................... 41
10.3 Reference Seabed Level and Sediment Migration ....................................................................... 41
Appendix A – Presweeping Charts ............................................................................................ 43
Appendix B – Spreadsheets with Volume and Area Breakdown ................................................ 44
Appendix C – Bedform Profiles ................................................................................................ 45
Norfolk Vanguard Offshore Windfarm – Export Cable Installation Study Version Number: 02 Date: 25
th September 2017
Page 5 of 46
ABBREVIATIONS
BGS British Geological Survey
bsb Below Sea Bed
CBRA Cable Burial Risk Assessment
CPT Cone Penetration Test
DEM Digital Elevation Model
DP Dynamic Positioning
GMSL Global Marine Systems Limited (part of Global Marine Group)
HVAC High Voltage Alternating Current
HVDC High Voltage Direct Current
LAT Lowest Astronomical Tide
MFE Mass Flow Excavator
MPA Marine Protected Area
msbl Mean Seabed Level
NB Norfolk Boreas
NV Norfolk Vanguard
OSS Offshore Substation
OWF Offshore Wind Farm
RSBL Reference Seabed Level
SAC Special Area of Conservation
Norfolk Vanguard Offshore Windfarm – Export Cable Installation Study Version Number: 02 Date: 25
th September 2017
Page 6 of 46
SBP Sub-bottom Profiler
ToP Top of Product
TPI Topographic Position Index
TSHD Trailing Suction Hopper Dredger
UXO Unexploded Ordnance
VC Vibrocore
WTG Wind Turbine Generator
Norfolk Vanguard Offshore Windfarm – Export Cable Installation Study Version Number: 02 Date: 25
th September 2017
Page 7 of 46
1.0 INTRODUCTION
Vattenfall Wind Power are developing the Norfolk Vanguard (NV) and Norfolk Boreas (NB) offshore windfarms and this study by CWind (part of the Global Marine Group) describes the basis on which these cables will be installed. The study covers the following main design points;
1. Two different power transmission strategies (HVAC and HVDC)
2. The broad cable installation timeframe proposed
3. The avoidance of cable reburial campaigns during the cable design life
4. The seabed preparation required in order to achieve (3) and the associated volumes of material for disposal within and outside the MPA
5. Required cable separation and the scope for route adjustment
6. Cable protection, including crossing requirements within and outside the MPA
7. Options for retaining dredged seabed material inside the MPA, either within the cable corridor or within alternate spoil zones
8. Seabed Preparation Budgetary Costing
The Norfolk Vanguard development area is located more than 47km from the Norfolk Coast in the North Sea and will meet the electricity demand of around 1.3 million UK households. Norfolk Vanguard has a sister project of the same size called Norfolk Boreas, this project trails one year behind Vanguard in its development. Both these windfarms will require export cables to carry the power generated back to shore. The export cable corridor runs generally west from the NV East, NV West and NB turbine arrays to the landfall near Happisburgh. The export corridor is common for all the windfarm turbine array areas until they diverge to service each array at the eastern end of the corridor. The 3 separate turbine array areas can be seen along with the export corridor and example cable routes in Figure 1.
The export cable corridor crosses the Haisborough, Hammond and Winterton Special Area of Conservation (SAC) which has been primarily designated to protect biogenic reefs and sandbanks. The cable corridor crosses the SAC with a span of approximately 35km and is shown in Figure 1. As part of the permitting and consents process, Vattenfall aim to keep all the arisings and uplifted sediment within the SAC’s boundaries during presweeping seabed intervention. This will be dependant on the volume of sediment presweeped and the adjacent seaspace calculated in this installation study.

Norfolk Vanguard Offshore Windfarm – Export Cable Installation Study Version Number: 02 Date: 25
th September 2017
Page 8 of 46
Figure 1: Norfolk Vanguard and Norfolk Boreas Site Overview
CWind subcontracted part of work presented in this study to Cathie Associates Ltd, a respected marine geotechnical consultancy who are at the forefront of developing the Reference Sea Bed Level (RSBL) concept for helping to solve sandwave cable engineering issues.
2.0 INFORMATION REVIEW
2.1 References
The following references were provided by Vattenfall and used by this study;
1. Fugro, 2017. Norfolk Vanguard Offshore Wind Farm. Report 1 of 3: Geophysical Investigation Report Volumes 1-3. Ref: GE050-R1
2. Fugro, 2017. Norfolk Vanguard Offshore Wind Farm. Report 2 of 3: Geotechnical Investigation Report. Refs: GEO50/R2/Rev.2 and J11346-2 (02)
3. Fugro, 2017. Environmental Investigation Report Norfolk Vanguard Benthic Characterisation Report. Refs: GE050-R3 and 160976.2 (01)
Additional references supporting the methodologies used:
4. Carbon Trust, Cable Burial Risk Assessment Methodology, Guidance for the Preparation of Cable Burial Depth of Lowering Specification, CTC835, February 2015
5. Carbon Trust, Application Guide for the Specification of the Depth of Lowering using the Cable Burial Risk Assessment (CBRA) methodology, Dec 2015
Norfolk Vanguard Offshore Windfarm – Export Cable Installation Study Version Number: 02 Date: 25
th September 2017
Page 9 of 46
6. Sappington, J.M. et al. (2007), Quantifying landscape ruggedness for animal habitat analysis: A case study using bighorn sheep in the Mojave Desert, Journal of Wildlife Management, 71(5): 1419-1427.
7. Secomandi M., Owen MJ., Jones E., Terente V., Comrie R (2016). Application of the Bathymetric Position Index Method (BPI) for the purpose of defining a reference seabed level for cable burial.
8. GMSL EAN-1 Export Cable Constructability Assessment 2016
9. CWind Norfolk Vanguard Design Basis 2017
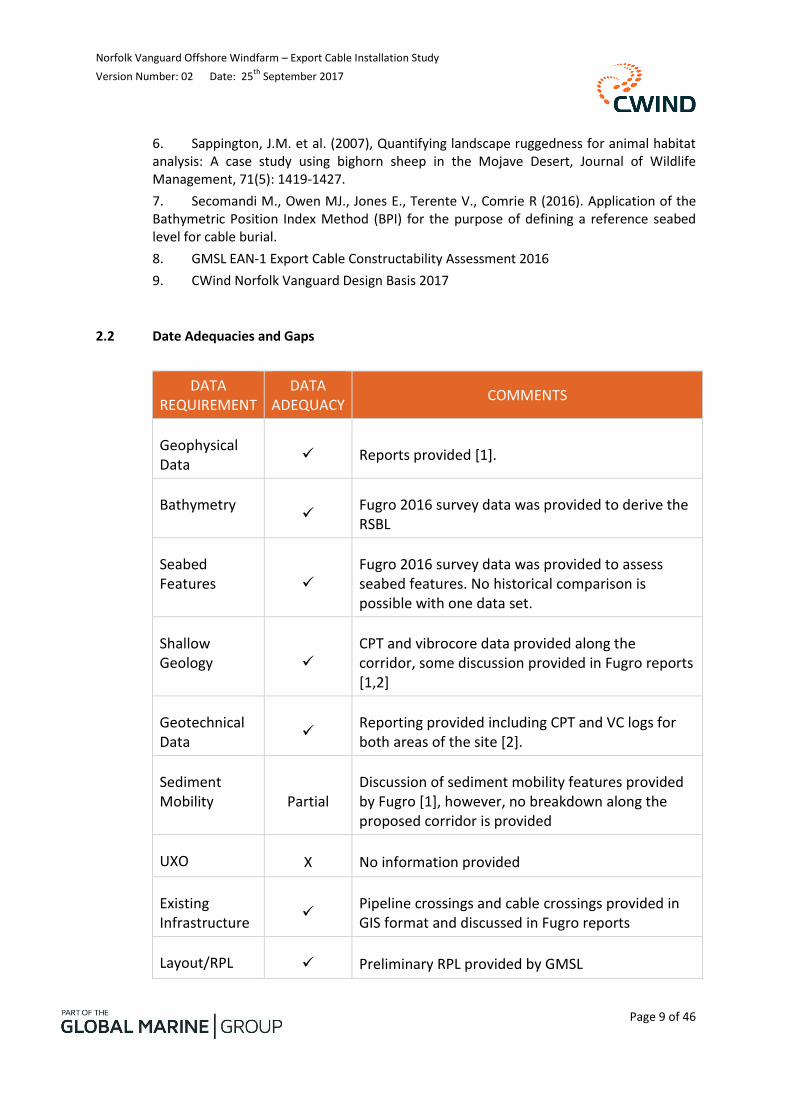
2.2 Date Adequacies and Gaps
DATA REQUIREMENT
DATA ADEQUACY
COMMENTS
Geophysical Data
Reports provided [1].
Bathymetry
Fugro 2016 survey data was provided to derive the RSBL
Seabed Features
Fugro 2016 survey data was provided to assess seabed features. No historical comparison is possible with one data set.
Shallow Geology
CPT and vibrocore data provided along the corridor, some discussion provided in Fugro reports [1,2]
Geotechnical Data
Reporting provided including CPT and VC logs for both areas of the site [2].
Sediment Mobility Partial
Discussion of sediment mobility features provided by Fugro [1], however, no breakdown along the proposed corridor is provided
UXO X No information provided
Existing Infrastructure
Pipeline crossings and cable crossings provided in GIS format and discussed in Fugro reports
Layout/RPL Preliminary RPL provided by GMSL
Norfolk Vanguard Offshore Windfarm – Export Cable Installation Study Version Number: 02 Date: 25
th September 2017
Page 10 of 46
Geophysical Data
Reports provided [1].
Bathymetry
Fugro 2016 survey data was provided to derive the RSBL
Table 1: Data Appraisal
The bathymetric and geological data and seabed mobility feature discussions provided have been used for defining the RSBL. To define an additional global erosion factor to be applied in addition to the RSBL, a comparison of historical bathymetric levels is advisable. This comparison could be based on several bathymetric data sets and historical seabed level change information together with met ocean conditions reports.
3.0 PROJECT DESCRIPTION
3.1 Norfolk Vanguard and Norfolk Boreas Offshore Windfarms
Power transmission cables for both the Norfolk Vanguard and Norfolk Boreas offshore windfarms will be placed in a common offshore corridor. The installation of the cables is planned around two competing transmission strategies. Both a high voltage AC and DC solution is being considered at the current time. These differing transmission technologies require different cable counts and configurations. The different AC and DC options will result in the following number of cables;
HVAC - 12 individual cables with design spacings based on the 2016 GMSL Cable Constructability Assessment report.
HVDC - 8 cables laid in 4 bundled pairs with design spacings based on the 2016 GMSL Cable Constructability Assessment report.
The HVAC option results in a larger overall seabed footprint than the HVDC alternative.
The aims of a good installation strategy should include cable security, a robust installation solution and achieving a one-time operation which does not require unplanned further engineering or remedial work during the lifetime of the project.
This last point is achieved by ensuring the cable is carefully installed and protected from external aggression.
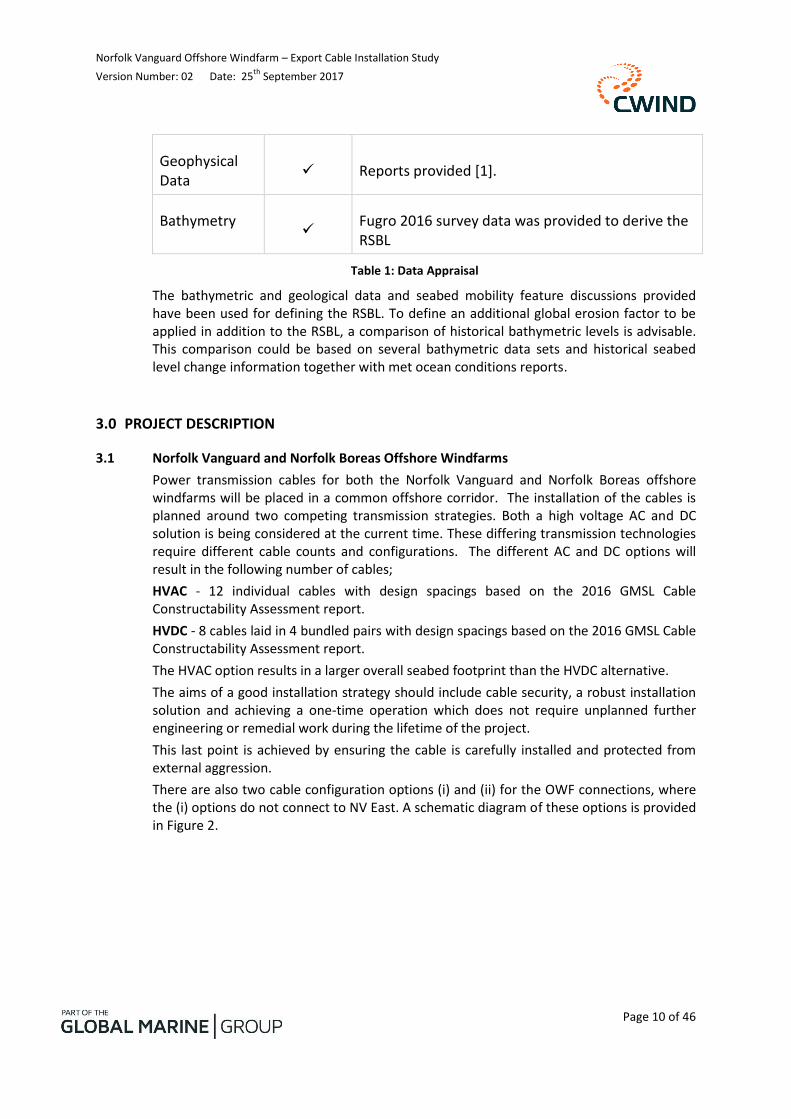
There are also two cable configuration options (i) and (ii) for the OWF connections, where the (i) options do not connect to NV East. A schematic diagram of these options is provided in Figure 2.
Norfolk Vanguard Offshore Windfarm – Export Cable Installation Study Version Number: 02 Date: 25
th September 2017
Page 11 of 46
Figure 2: Export Cable Configuration Options
CWind developed a set of basic example cable routes for this study based on the configurations in Figure 2. Each cable route is numbered 1-4 for the HVDC cables and 1-12 for the HVAC cables. These routes do not attempt to carry out any microrouteing within the corridor. The routes do use a basic form of the 2016 GMSL Cable Constructability Assessment cable separation recommendations. The CWind example cable routes were adopted for the purposes of this study and are included as part of the GIS data deliverables.
4.0 SITE GEOLOGY
4.1 Shallow Geology of the Site
This section of the report describes the shallow geology of the site. The different sediments and geological units found influence the choice of burial tool and how successful the cable is buried. These topics are covered later in this study.
The shallow geology encountered within anticipated cable burial trench depths (3 m below RSBL) on the export route reflects the environmental changes that occurred during the Pleistocene. In this period the southern North Sea was part of a wider area which experienced a series of glacial and interglacial oscillations. The Norfolk Vanguard site and cable route are near the southern edge of this area and so was only covered by ice during the Elsterian glacial maximum during the early to late-middle Pleistocene.
Today, the record of this glacial activity exists in the form of clays and sands, including the Yarmouth Roads Formation, which comprises a sequence of deltaic sediments. The more recent Swarte Bank Formation (generally not present on the cable route), Eem Hole and Brown Bank Formations overlie the older units, infilling erosional features in the older units, such as buried channels. Most recently Holocene sands and clays have been deposited throughout the study area.
All units are anticipated to be encountered during trenching operations within the Norfolk Vanguard export cable corridor.
12
1
Cable Nos
12
1
Cable Nos
HVDC
Option ii
HVDC
Option i
HVAC
Option ii
HVAC
Option i NV
West NB
NV
East
NV
West NB
NV
East
NV
West NB
NV
East
NV
West NB
NV
East
NV
West NB
NV
East
NV
West NB
NV
East
4 3 2 1
Cable Nos
4 3 2 1
Cable Nos
Norfolk Vanguard Offshore Windfarm – Export Cable Installation Study Version Number: 02 Date: 25
th September 2017
Page 12 of 46
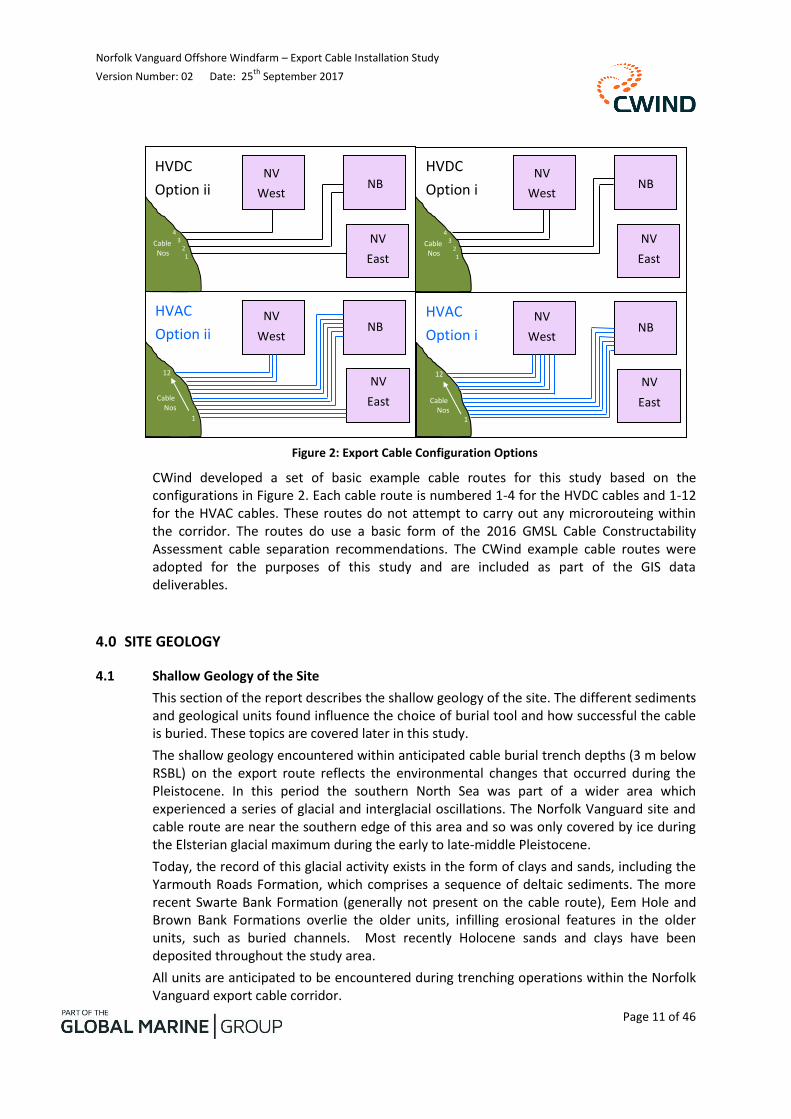
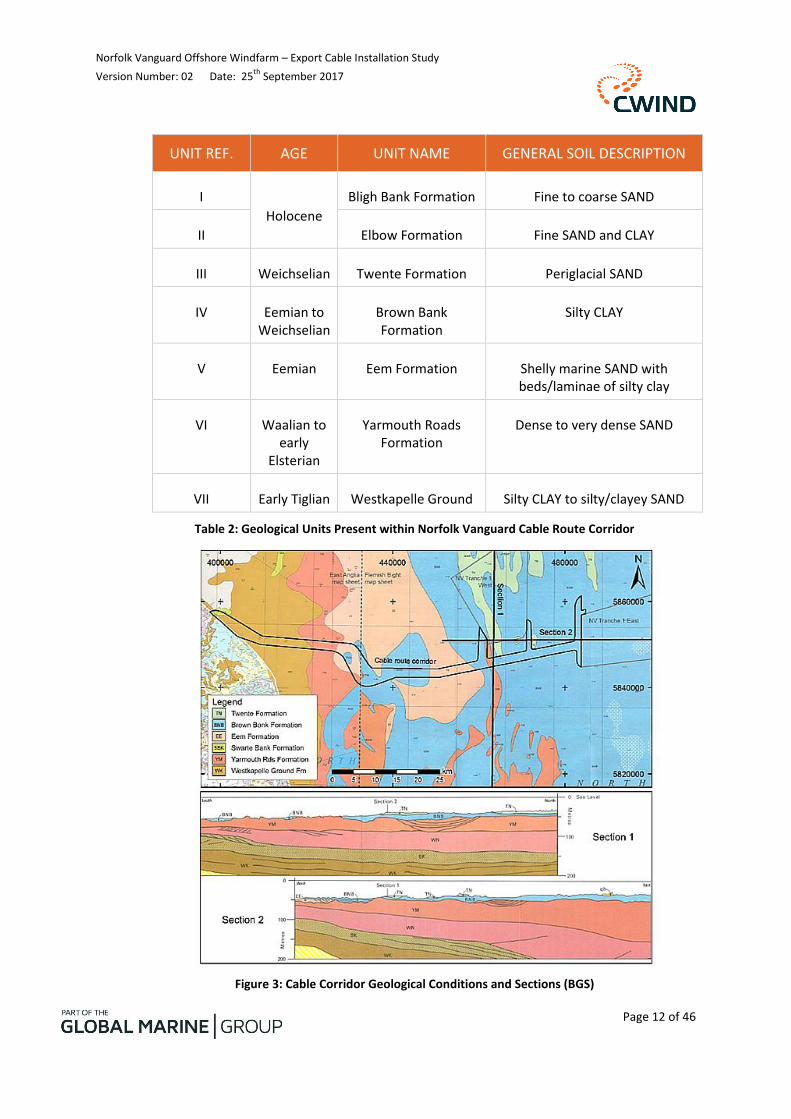
UNIT REF. AGE UNIT NAME GENERAL SOIL DESCRIPTION
I
Holocene
Bligh Bank Formation Fine to coarse SAND
II Elbow Formation Fine SAND and CLAY
III Weichselian Twente Formation Periglacial SAND
IV Eemian to Weichselian
Brown Bank Formation
Silty CLAY
V Eemian Eem Formation Shelly marine SAND with beds/laminae of silty clay
VI Waalian to early
Elsterian
Yarmouth Roads Formation
Dense to very dense SAND
VII Early Tiglian Westkapelle Ground Silty CLAY to silty/clayey SAND
Table 2: Geological Units Present within Norfolk Vanguard Cable Route Corridor
Figure 3: Cable Corridor Geological Conditions and Sections (BGS)
Norfolk Vanguard Offshore Windfarm – Export Cable Installation Study Version Number: 02 Date: 25
th September 2017
Page 13 of 46
4.2 Route Geological Breakdown by KP
The following summary of shallow geology conditions along the corridor can be derived from the assessment of 2016 Fugro CPT and vibrocore data:
KP 0 to KP 17 – Holocene over Brown Bank Formation (CPT/VCs 111 to 114).
KP 17 to KP 20 – Holocene over Twente Formation (over Brown Bank Formation) (CPT/VC 115).
KP 20 to KP 24.5 – Holocene over Brown Bank Formation. Also includes KP 0 to KP 15.681 spur “West OPT-A” (CPT/VC 116).
KP 24.5 to KP 29.5 – Holocene over Eem Formation (CPT/VC 117).
KP 29.5 to KP 32 - Holocene over Yarmouth Roads Formation (not sampled).
KP 32 to KP 42 – Holocene over Eem Formation (CPT/VCs 119, 120).
KP 42 to KP 42.7 – Holocene over Brown Bank Formation
KP 42.7 to KP 62.5 – Holocene over Eem Formation (CPT/VCs 121, 122) – locally indicated to be Holocene over Brown Bank Formation by Geophysical survey.
KP 62.5 to KP 77* – Holocene over Yarmouth Roads Formation (CPT/VCs 123 to 125).
KP 77 to KP 90.887* - Holocene over Westkapelle Ground Formation (CPT/VCs 126, 127)
*KP ranges are estimated as geophysical interpretation could not differentiate between units.
5.0 INSTALLATION STRATEGY TO AVOID AND REDUCE REMEDIAL BURIAL
5.1 Introduction
Over the past decade many offshore windfarms have been installed in Europe. A common and recurring issue involves the cable being exposed on the seabed which not only threatens the long term security of the cable but also breaches the contracted burial depth that the cable is permitted to be in. This results in the requirement for cable re-burial and maintenance works which are generally very expensive. One of the most common reasons for this failure has been mobile bedforms (sandwaves) which over time have moved and reduced the depth of cable burial.
The most prominent bathymetric feature of the Norfolk Vanguard and Norfolk Boreas export cable corridor are the sandwaves and sandbanks. These are described in detail in the 2016 Fugro geophysical survey report.
To prevent the temporal variation of burial depth, a series of seabed intervention campaigns are planned to pre-sweep the sandwaves along the proposed cable route corridors. Pre-sweeping is essentially the removal of the top of the sandwaves where the sediment is considered to be mobile and migrational. The pre-swept sediment creates a path through the sandwave that allows the cable to be buried into. This non-mobile, seabed level is to be used as the reference point for burial depths and is referred in this report as the reference seabed level (further explained in 5.3).
Norfolk Vanguard Offshore Windfarm – Export Cable Installation Study Version Number: 02 Date: 25
th September 2017
Page 14 of 46
The follow sections discuss how presweeping may be achieved, a methodology to calculate presweeping volumes, a set of example volumes for all routes and for just the portions with in the Haisborough, Hammond & Winterton SAC.
5.2 Methods of Seabed Intervention
Several tools/techniques could be used to complete the required pre-sweeping.
(i) Trailing Suction Hopper Dredger
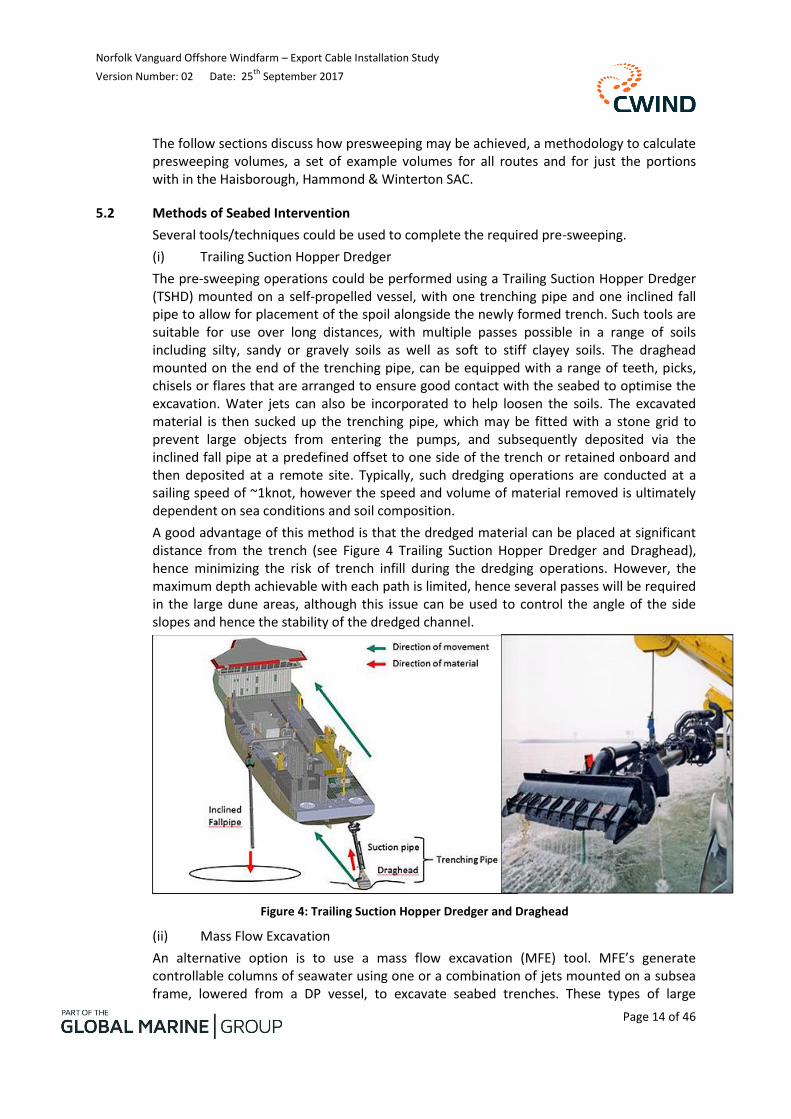
The pre-sweeping operations could be performed using a Trailing Suction Hopper Dredger (TSHD) mounted on a self-propelled vessel, with one trenching pipe and one inclined fall pipe to allow for placement of the spoil alongside the newly formed trench. Such tools are suitable for use over long distances, with multiple passes possible in a range of soils including silty, sandy or gravely soils as well as soft to stiff clayey soils. The draghead mounted on the end of the trenching pipe, can be equipped with a range of teeth, picks, chisels or flares that are arranged to ensure good contact with the seabed to optimise the excavation. Water jets can also be incorporated to help loosen the soils. The excavated material is then sucked up the trenching pipe, which may be fitted with a stone grid to prevent large objects from entering the pumps, and subsequently deposited via the inclined fall pipe at a predefined offset to one side of the trench or retained onboard and then deposited at a remote site. Typically, such dredging operations are conducted at a sailing speed of ~1knot, however the speed and volume of material removed is ultimately dependent on sea conditions and soil composition.
A good advantage of this method is that the dredged material can be placed at significant distance from the trench (see Figure 4 Trailing Suction Hopper Dredger and Draghead), hence minimizing the risk of trench infill during the dredging operations. However, the maximum depth achievable with each path is limited, hence several passes will be required in the large dune areas, although this issue can be used to control the angle of the side slopes and hence the stability of the dredged channel.
Figure 4: Trailing Suction Hopper Dredger and Draghead
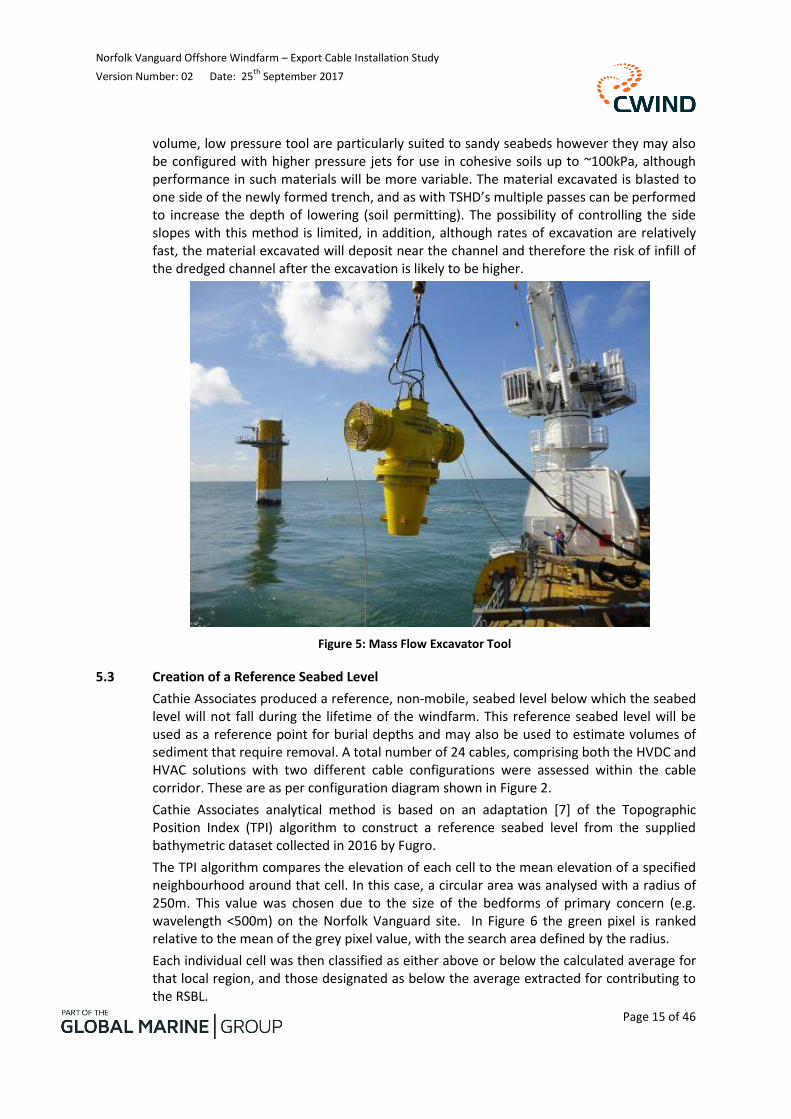
(ii) Mass Flow Excavation
An alternative option is to use a mass flow excavation (MFE) tool. MFE’s generate controllable columns of seawater using one or a combination of jets mounted on a subsea frame, lowered from a DP vessel, to excavate seabed trenches. These types of large
Norfolk Vanguard Offshore Windfarm – Export Cable Installation Study Version Number: 02 Date: 25
th September 2017
Page 15 of 46
volume, low pressure tool are particularly suited to sandy seabeds however they may also be configured with higher pressure jets for use in cohesive soils up to ~100kPa, although performance in such materials will be more variable. The material excavated is blasted to one side of the newly formed trench, and as with TSHD’s multiple passes can be performed to increase the depth of lowering (soil permitting). The possibility of controlling the side slopes with this method is limited, in addition, although rates of excavation are relatively fast, the material excavated will deposit near the channel and therefore the risk of infill of the dredged channel after the excavation is likely to be higher.
Figure 5: Mass Flow Excavator Tool
5.3 Creation of a Reference Seabed Level
Cathie Associates produced a reference, non-mobile, seabed level below which the seabed level will not fall during the lifetime of the windfarm. This reference seabed level will be used as a reference point for burial depths and may also be used to estimate volumes of sediment that require removal. A total number of 24 cables, comprising both the HVDC and HVAC solutions with two different cable configurations were assessed within the cable corridor. These are as per configuration diagram shown in Figure 2.
Cathie Associates analytical method is based on an adaptation [7] of the Topographic Position Index (TPI) algorithm to construct a reference seabed level from the supplied bathymetric dataset collected in 2016 by Fugro.
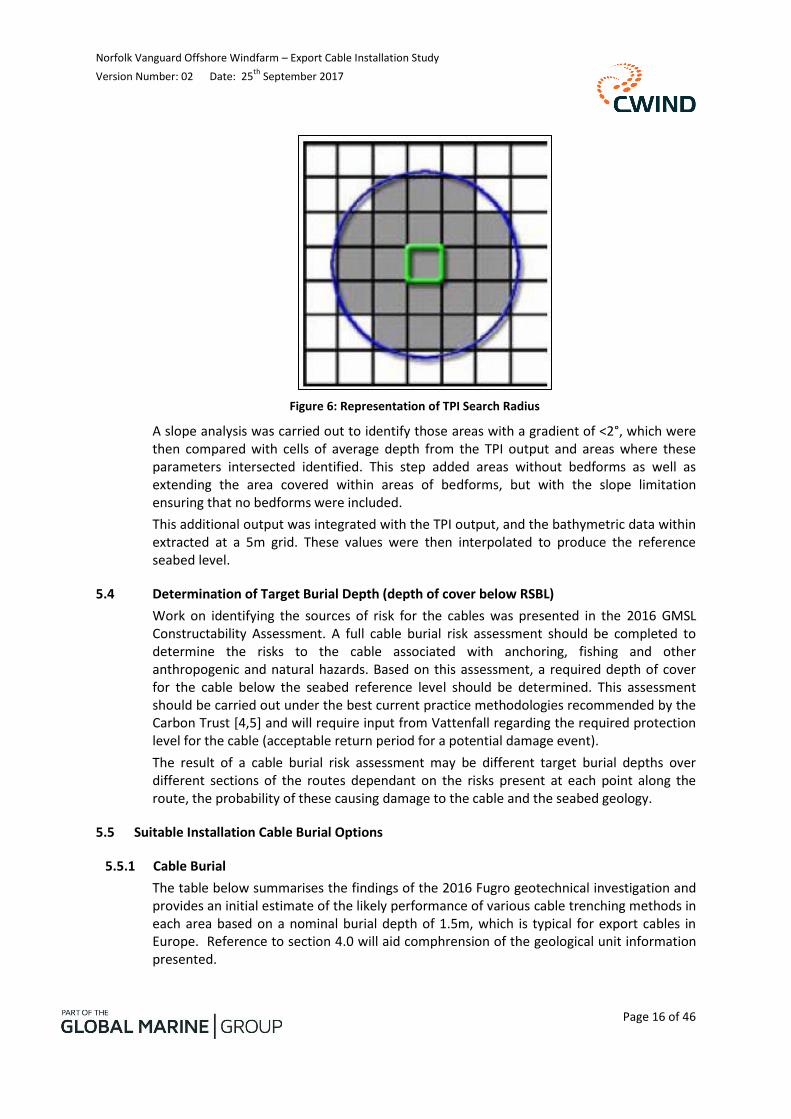
The TPI algorithm compares the elevation of each cell to the mean elevation of a specified neighbourhood around that cell. In this case, a circular area was analysed with a radius of 250m. This value was chosen due to the size of the bedforms of primary concern (e.g. wavelength <500m) on the Norfolk Vanguard site. In Figure 6 the green pixel is ranked relative to the mean of the grey pixel value, with the search area defined by the radius.
Each individual cell was then classified as either above or below the calculated average for that local region, and those designated as below the average extracted for contributing to the RSBL.
Norfolk Vanguard Offshore Windfarm – Export Cable Installation Study Version Number: 02 Date: 25
th September 2017
Page 16 of 46
Figure 6: Representation of TPI Search Radius
A slope analysis was carried out to identify those areas with a gradient of <2°, which were then compared with cells of average depth from the TPI output and areas where these parameters intersected identified. This step added areas without bedforms as well as extending the area covered within areas of bedforms, but with the slope limitation ensuring that no bedforms were included.
This additional output was integrated with the TPI output, and the bathymetric data within extracted at a 5m grid. These values were then interpolated to produce the reference seabed level.
5.4 Determination of Target Burial Depth (depth of cover below RSBL)
Work on identifying the sources of risk for the cables was presented in the 2016 GMSL Constructability Assessment. A full cable burial risk assessment should be completed to determine the risks to the cable associated with anchoring, fishing and other anthropogenic and natural hazards. Based on this assessment, a required depth of cover for the cable below the seabed reference level should be determined. This assessment should be carried out under the best current practice methodologies recommended by the Carbon Trust [4,5] and will require input from Vattenfall regarding the required protection level for the cable (acceptable return period for a potential damage event).
The result of a cable burial risk assessment may be different target burial depths over different sections of the routes dependant on the risks present at each point along the route, the probability of these causing damage to the cable and the seabed geology.
5.5 Suitable Installation Cable Burial Options
5.5.1 Cable Burial
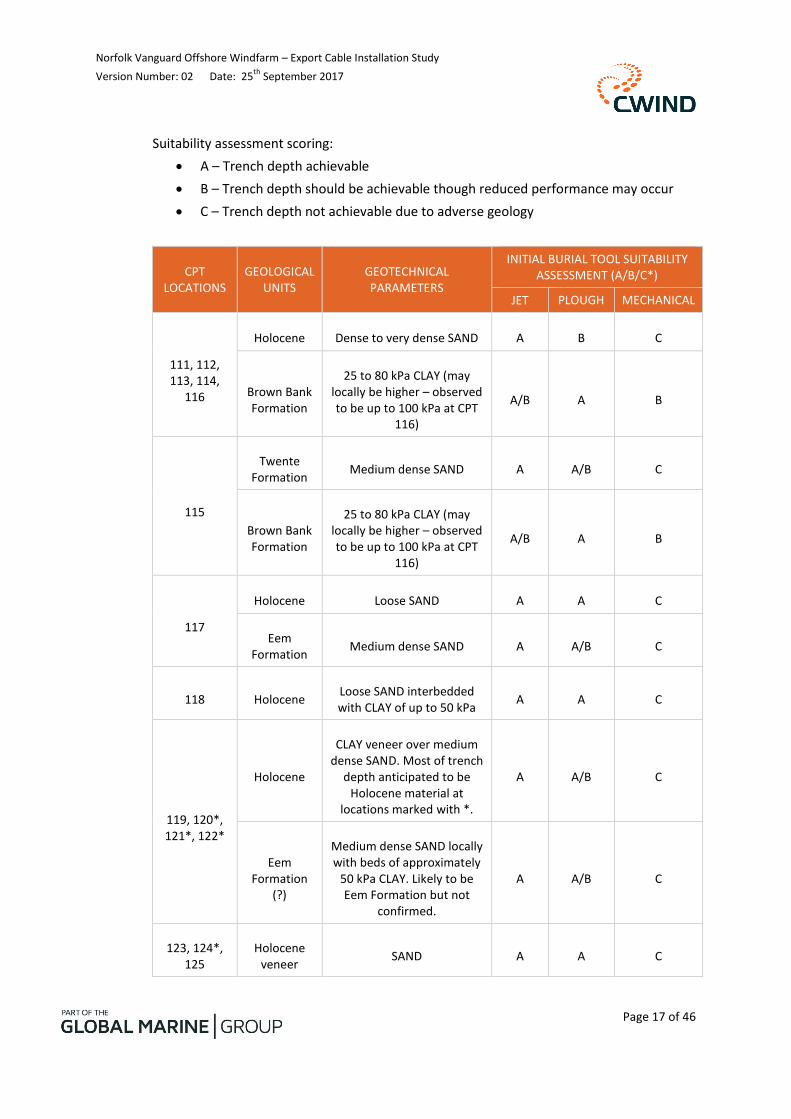
The table below summarises the findings of the 2016 Fugro geotechnical investigation and provides an initial estimate of the likely performance of various cable trenching methods in each area based on a nominal burial depth of 1.5m, which is typical for export cables in Europe. Reference to section 4.0 will aid comphrension of the geological unit information presented.
Norfolk Vanguard Offshore Windfarm – Export Cable Installation Study Version Number: 02 Date: 25
th September 2017
Page 17 of 46
Suitability assessment scoring:
A – Trench depth achievable
B – Trench depth should be achievable though reduced performance may occur
C – Trench depth not achievable due to adverse geology
CPT LOCATIONS
GEOLOGICALUNITS
GEOTECHNICAL PARAMETERS
INITIAL BURIAL TOOL SUITABILITY ASSESSMENT (A/B/C*)
JET PLOUGH MECHANICAL
111, 112, 113, 114,
116
Holocene Dense to very dense SAND A B C
Brown Bank Formation
25 to 80 kPa CLAY (may locally be higher – observed to be up to 100 kPa at CPT
116)
A/B A B
115
Twente Formation
Medium dense SAND A A/B C
Brown Bank Formation
25 to 80 kPa CLAY (may locally be higher – observed to be up to 100 kPa at CPT
116)
A/B A B
117
Holocene Loose SAND A A C
Eem Formation
Medium dense SAND A A/B C
118 Holocene Loose SAND interbedded with CLAY of up to 50 kPa
A A C
119, 120*, 121*, 122*
Holocene
CLAY veneer over medium dense SAND. Most of trench
depth anticipated to be Holocene material at
locations marked with *.
A A/B C
Eem Formation
(?)
Medium dense SAND locally with beds of approximately
50 kPa CLAY. Likely to be Eem Formation but not
confirmed.
A A/B C
123, 124*, 125
Holocene veneer
SAND A A C
Norfolk Vanguard Offshore Windfarm – Export Cable Installation Study Version Number: 02 Date: 25
th September 2017
Page 18 of 46
Yarmouth Roads
Formation (?)
Very dense SAND, some gravel noted. Hard layer at
approximately 3m at location 124 prevented first
VC and CPT attempts reaching target depth. Likely
to be Yarmouth Roads Formation but not
confirmed.
A/B B C
126*, 127
Westkapelle Ground
Formation (?)
Very dense SAND. Likely to be Westkapelle Ground
Formation but not confirmed.
A/B B C
Table 3: Cable Burial Tool Suitability
The seabed sediments found along the cable route corridor are generally condusive to jetting and plough burial methods. With the addition of presweeping seabed intervention to remove sandwave crests and reduce steeper slopes cable burial ought be achievable along the majority of the corridor.
5.5.2 Bedform Re-establishment
The volumes estimated from the RSBL assessment could be removed in such a way as to maintain a stable slope in the most efficient manner with regards to offshore operations.
It is estimated that the minimum corridor required for the use of a burial tool is in the order of 7m. The dredging of slopes constructed to 1:3 angles are likely to provide sufficient slope stability in sands during the construction period, however, the effect of seabed currents and the partial infill of the dredged channels between the start of pre-sweeping operations and the lay and burial operations should be assessed to ensure that no significant infill takes place between those key stages of installation.
To complete an infill assessment, the metocean conditions of the cable corridor must be known. Those conditions, together with the geology of the seabed (depth of Holocene deposits, grading of the sands and geological conditions of each section) can be used in combination with methodologies such as Soulsby [6] to estimate the rate of infill of the channel.
6.0 SEABED PREPARATION AND ASSOCIATED VOLUMES OF MATERIAL
6.1 Introduction
The RSBL has been used as the level to which presweeping seabed intervention is required. This section describes the methodology used to to calculate presweeping volumes, a set of example volumes for all routes and for just the portions with in the Haisborough, Hammond & Winterton SAC.
Norfolk Vanguard Offshore Windfarm – Export Cable Installation Study Version Number: 02 Date: 25
th September 2017
Page 19 of 46
6.2 Calculated Presweeping Volumes and Locations
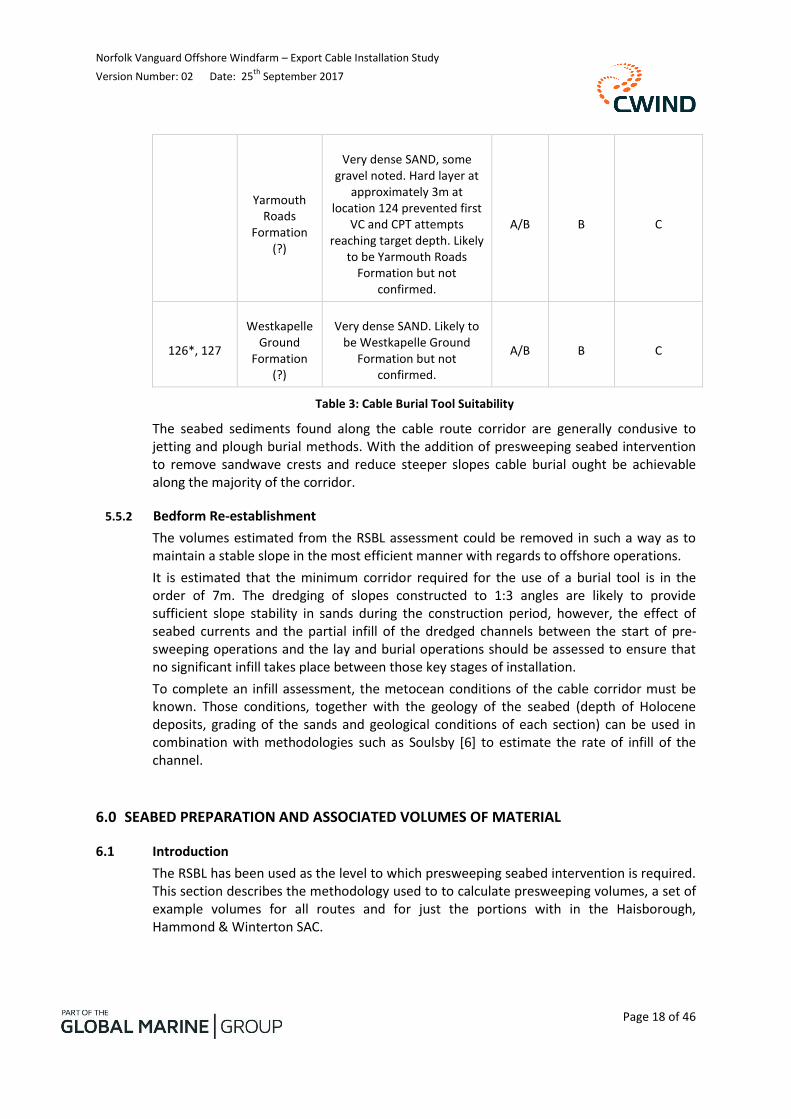
The resulting RSBL was subtracted from the bathymetric dataset to determine the potentially mobile sediment thickness.
An approximate dredging corridor was then constructed for each cable with a nominal width of 7m and associated 1:3 slopes. The areas of mobile sediments to be removed were then extracted for each cable route, as well as at 50m along each route. An illustration of the cross section of the dredging corridor is provided as Figure 7.
Figure 7: Indicative Dredging Cross Section
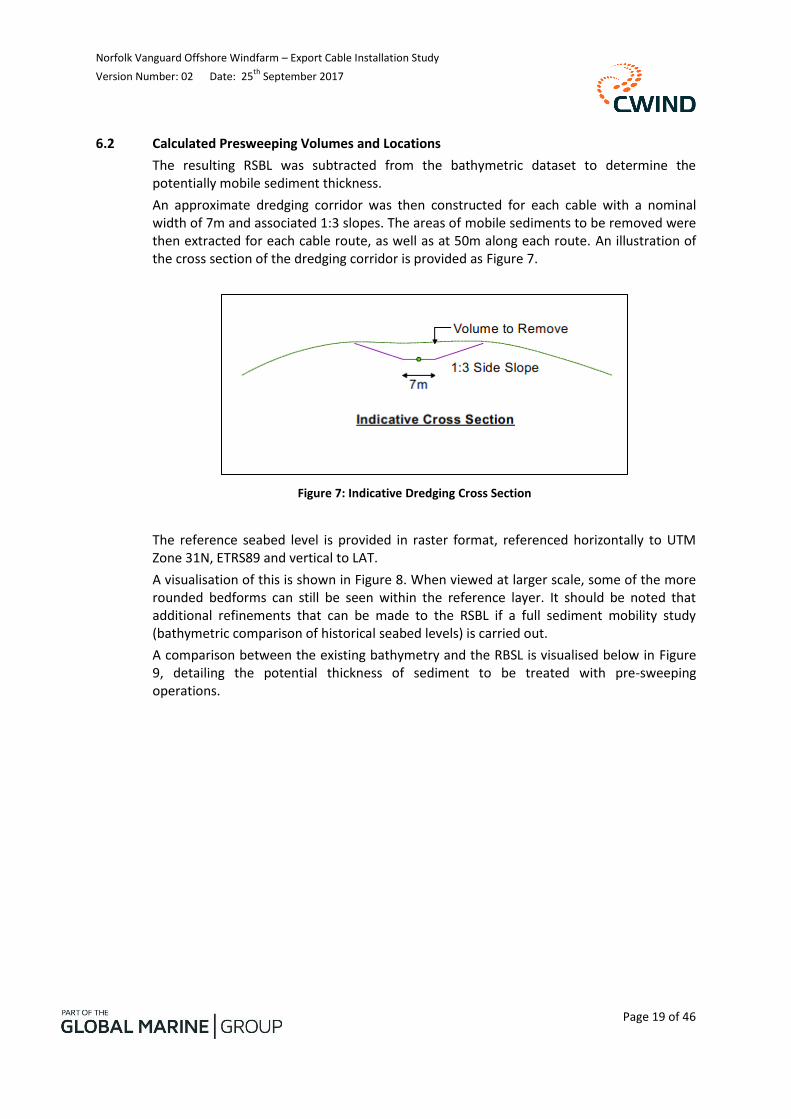
The reference seabed level is provided in raster format, referenced horizontally to UTM Zone 31N, ETRS89 and vertical to LAT.
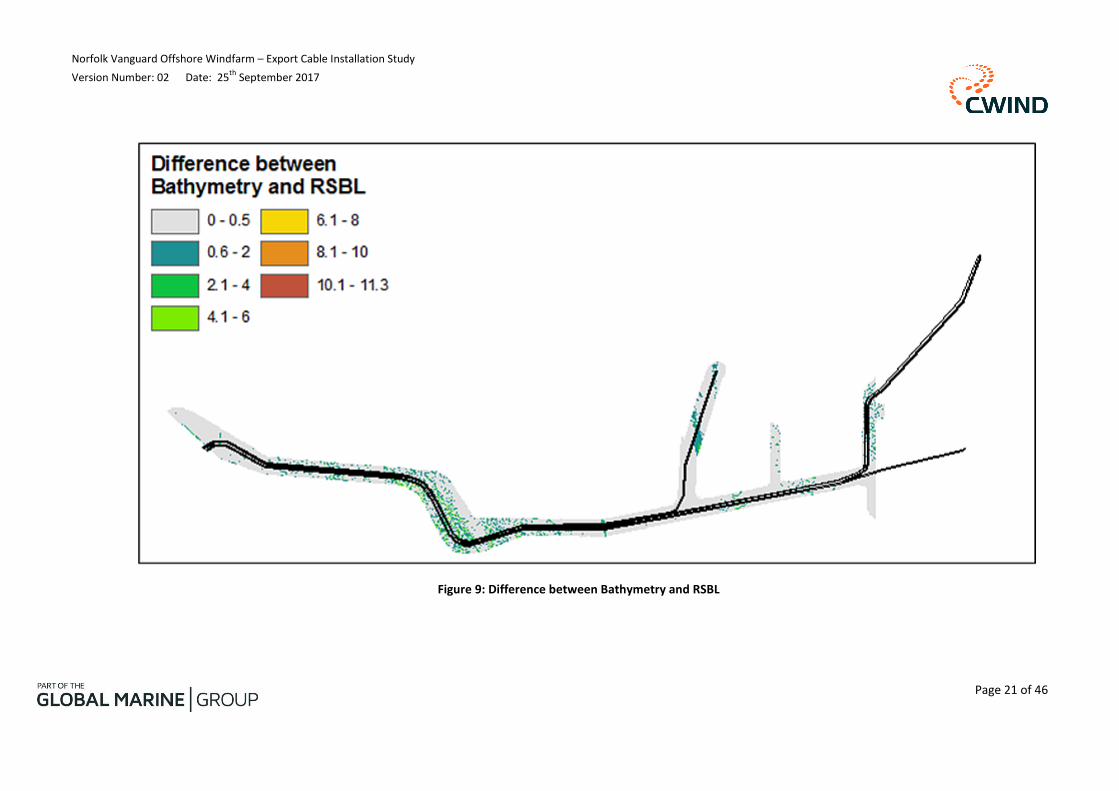
A visualisation of this is shown in Figure 8. When viewed at larger scale, some of the more rounded bedforms can still be seen within the reference layer. It should be noted that additional refinements that can be made to the RSBL if a full sediment mobility study (bathymetric comparison of historical seabed levels) is carried out.
A comparison between the existing bathymetry and the RBSL is visualised below in Figure 9, detailing the potential thickness of sediment to be treated with pre-sweeping operations.
Norfolk Vanguard Offshore Windfarm – Export Cable Installation Study Version Number: 02 Date: 25
th September 2017
Page 20 of 46
Figure 8: Reference Seabed Level
Norfolk Vanguard Offshore Windfarm – Export Cable Installation Study Version Number: 02 Date: 25
th September 2017
Page 21 of 46
Figure 9: Difference between Bathymetry and RSBL
Norfolk Vanguard Offshore Windfarm – Export Cable Installation Study Version Number: 01 Date: 3
rd July 2017
Page 22 of 46
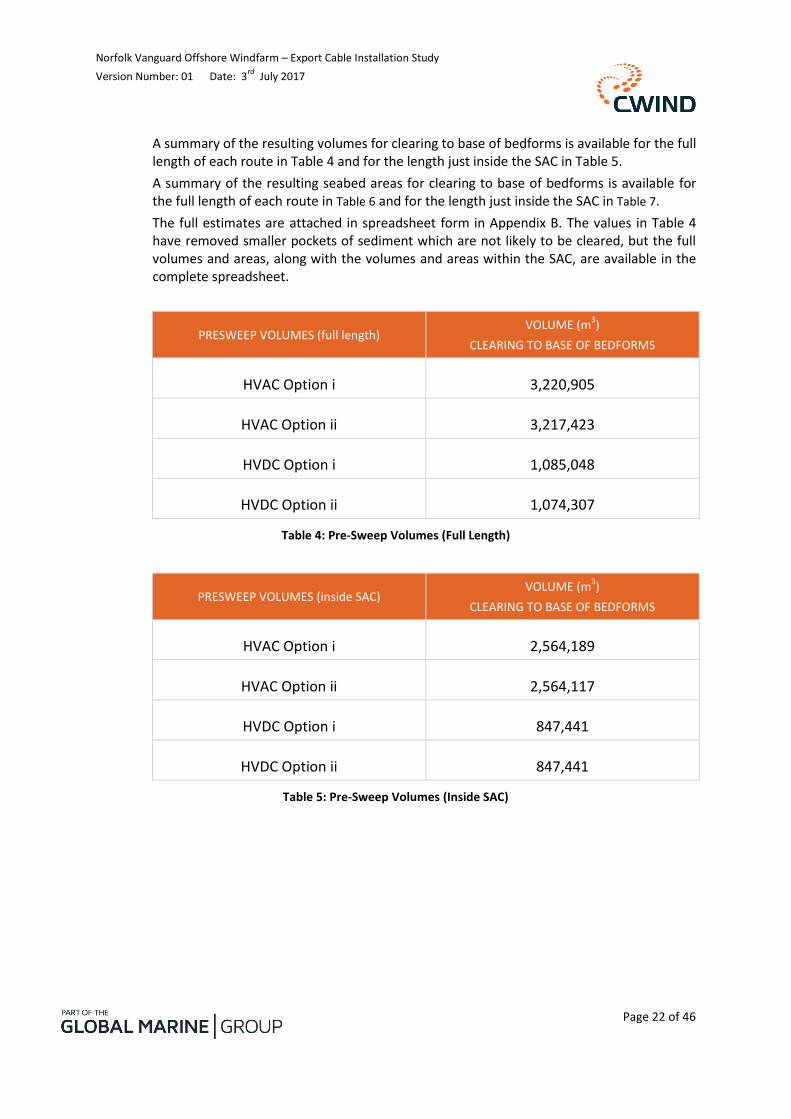
A summary of the resulting volumes for clearing to base of bedforms is available for the full length of each route in Table 4 and for the length just inside the SAC in Table 5.
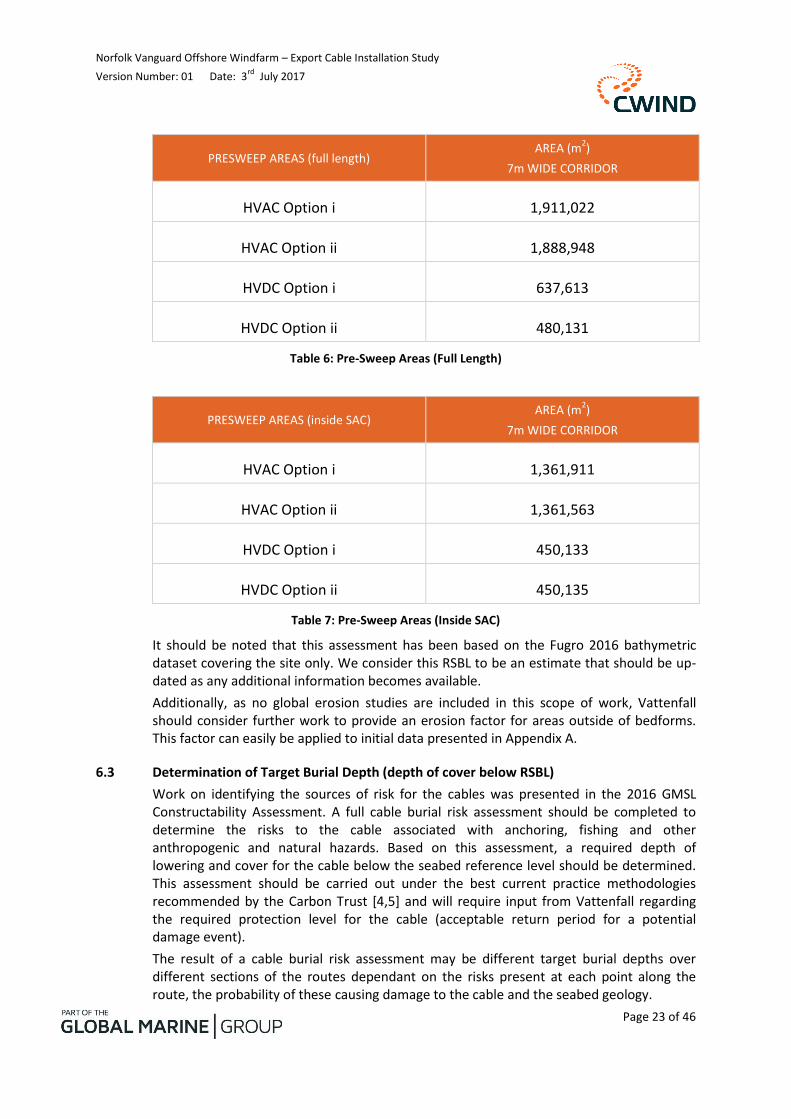
A summary of the resulting seabed areas for clearing to base of bedforms is available for the full length of each route in Table 6 and for the length just inside the SAC in Table 7.
The full estimates are attached in spreadsheet form in Appendix B. The values in Table 4 have removed smaller pockets of sediment which are not likely to be cleared, but the full volumes and areas, along with the volumes and areas within the SAC, are available in the complete spreadsheet.
PRESWEEP VOLUMES (full length) VOLUME (m
3)
CLEARING TO BASE OF BEDFORMS
HVAC Option i 3,220,905
HVAC Option ii 3,217,423
HVDC Option i 1,085,048
HVDC Option ii 1,074,307
Table 4: Pre-Sweep Volumes (Full Length)
PRESWEEP VOLUMES (inside SAC) VOLUME (m
3)
CLEARING TO BASE OF BEDFORMS
HVAC Option i 2,564,189
HVAC Option ii 2,564,117
HVDC Option i 847,441
HVDC Option ii 847,441
Table 5: Pre-Sweep Volumes (Inside SAC)
Norfolk Vanguard Offshore Windfarm – Export Cable Installation Study Version Number: 01 Date: 3
rd July 2017
Page 23 of 46
PRESWEEP AREAS (full length) AREA (m
2)
7m WIDE CORRIDOR
HVAC Option i 1,911,022
HVAC Option ii 1,888,948
HVDC Option i 637,613
HVDC Option ii 480,131
Table 6: Pre-Sweep Areas (Full Length)
PRESWEEP AREAS (inside SAC) AREA (m
2)
7m WIDE CORRIDOR
HVAC Option i 1,361,911
HVAC Option ii 1,361,563
HVDC Option i 450,133
HVDC Option ii 450,135
Table 7: Pre-Sweep Areas (Inside SAC)
It should be noted that this assessment has been based on the Fugro 2016 bathymetric dataset covering the site only. We consider this RSBL to be an estimate that should be up-dated as any additional information becomes available.
Additionally, as no global erosion studies are included in this scope of work, Vattenfall should consider further work to provide an erosion factor for areas outside of bedforms. This factor can easily be applied to initial data presented in Appendix A.
6.3 Determination of Target Burial Depth (depth of cover below RSBL)
Work on identifying the sources of risk for the cables was presented in the 2016 GMSL Constructability Assessment. A full cable burial risk assessment should be completed to determine the risks to the cable associated with anchoring, fishing and other anthropogenic and natural hazards. Based on this assessment, a required depth of lowering and cover for the cable below the seabed reference level should be determined. This assessment should be carried out under the best current practice methodologies recommended by the Carbon Trust [4,5] and will require input from Vattenfall regarding the required protection level for the cable (acceptable return period for a potential damage event).
The result of a cable burial risk assessment may be different target burial depths over different sections of the routes dependant on the risks present at each point along the route, the probability of these causing damage to the cable and the seabed geology.

Norfolk Vanguard Offshore Windfarm – Export Cable Installation Study Version Number: 01 Date: 3
rd July 2017
Page 24 of 46
6.4 Determination of Final Presweep Volumes
To calculate the final presweeping volumes requires the following information;
Target Burial Depth
Trench depth capabilities of the proposed burial tools
Final export cable routes
Once these are available the final presweeping volumes can be calculated. As the burial tool capabilities may exceed the target burial depth (depth of cover below RSBL) the amount of presweeping may be reduced, as the depth may be reached without full removal. This partial removal solution is attractive as it will reduce the time and costs to undertake the installation. To illustrate how this is calculated Figure 10 shows the relationship between the various seabed levels and burial tool capabilities and how these affect the final presweep volumes.
There is one further consideration when determining where and how much presweeping is required along the final export cable routes. There may be places along the route where the seabed does not require presweeping to reach the target burial depth but the local seabed gradient presents a stability risk to the burial tool. At these locations presweeping may have a different purpose and be carried out in order to reduce the slope gradients of the flanks of sandwaves and sandbanks. These areas can be identified by calculating and mapping the seabed gradients once the full or partial presweeping volumes have been subtracted. The seabed gradient map simply needs to show any areas where the maximum slope value exceeds the burial tool’s stability capabilities.
Figure 10: Relationship of Full and Partial Presweep Levels
There are numerous reasons why the volumes contained in this report are likely to represent a worst case scenario. The paragraphs immediately above describe how target burial depths and burial tool capabilities may reduce the volumes. Some of the other factors which may contribute to volume reductrions are
Target burial depths may vary along the route as a result of a CBRA and this may result in a volume reduction.
Microrouteing within the corridor should result in avoidance of the most prominent bedforms. Good cable routeing, working with the topology may result in a volume reduction.
Norfolk Vanguard Offshore Windfarm – Export Cable Installation Study Version Number: 01 Date: 3
rd July 2017
Page 25 of 46
Additional bathymetry datasets may result in refinement of the RSBL which is most likely to rise from the current level, resulting in a volume reduction.
7.0 REQUIRED CABLE SEPARATION AND SCOPE FOR ROUTE ADJUSTMENTS
7.1 Introduction
This section of the study reviews the cable separation required within the cable corridor and the ability to adjust the cable routes generally and specifically for biogenic reefs and bedforms.
7.2 Route Adjustment
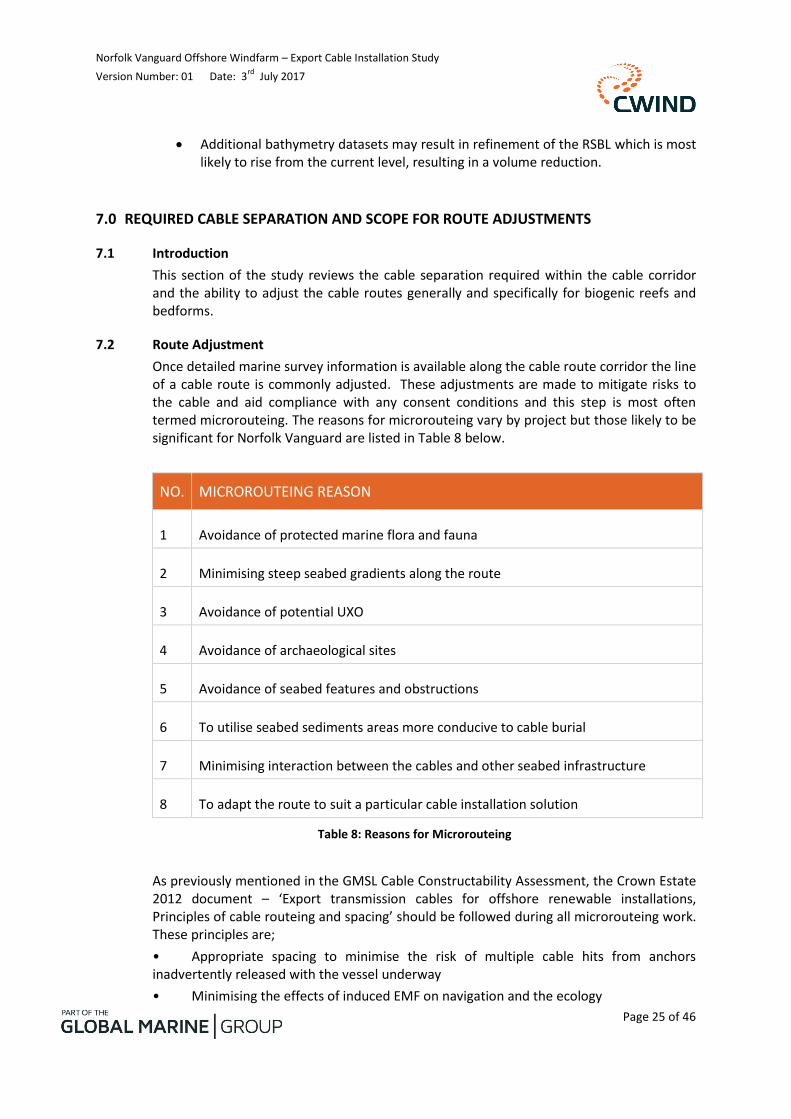
Once detailed marine survey information is available along the cable route corridor the line of a cable route is commonly adjusted. These adjustments are made to mitigate risks to the cable and aid compliance with any consent conditions and this step is most often termed microrouteing. The reasons for microrouteing vary by project but those likely to be significant for Norfolk Vanguard are listed in Table 8 below.
NO. MICROROUTEING REASON
1 Avoidance of protected marine flora and fauna
2 Minimising steep seabed gradients along the route
3 Avoidance of potential UXO
4 Avoidance of archaeological sites
5 Avoidance of seabed features and obstructions
6 To utilise seabed sediments areas more conducive to cable burial
7 Minimising interaction between the cables and other seabed infrastructure
8 To adapt the route to suit a particular cable installation solution
Table 8: Reasons for Microrouteing
As previously mentioned in the GMSL Cable Constructability Assessment, the Crown Estate 2012 document – ‘Export transmission cables for offshore renewable installations, Principles of cable routeing and spacing’ should be followed during all microrouteing work. These principles are;
• Appropriate spacing to minimise the risk of multiple cable hits from anchors inadvertently released with the vessel underway
• Minimising the effects of induced EMF on navigation and the ecology
Norfolk Vanguard Offshore Windfarm – Export Cable Installation Study Version Number: 01 Date: 3
rd July 2017
Page 26 of 46
• Appropriate spacing to minimise the risks to existing cables during subsequent cable installation or maintenance
• Avoiding interaction between transmission cables therefore avoiding or minimising the need for crossing and/or proximity agreements
7.2.1 Cable Separation
The export cable route would require differing amounts of space across the corridor due to the HVAC and HVDC cable configuration variants. The gaps provided below are sufficient for Norfolk Vanguard and Norfolk Boreas.
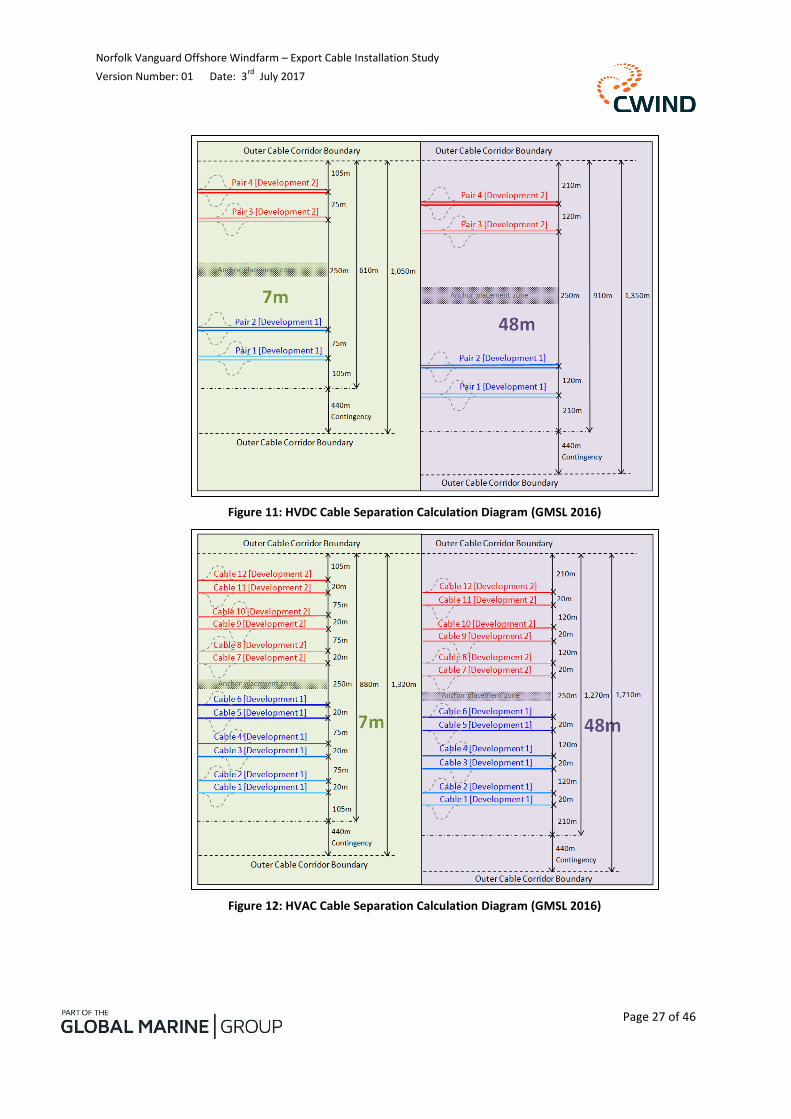
The HVDC option will require 2 x gaps of 95m-140m , ideally these will also retain a central reservation for anchor placement. This provides a minimum 86 percent contingency within the identified cable corridor (assumes a 2km wide cable corridor).
The HVAC option will require 2 x gaps of 230m-320m, ideally these will also retain a central reservation for anchor placement. This provides a minimum 68 percent contingency within the identified cable corridor (assumes a 2km wide cable corridor).
The central anchor placement zones recommended in the GMSL Constructability Assessment report were created in order to assist anchor positioned vessel solutions for the installation. With each cable installed the next cable will require the anchor wires for the installation vessel to extend over adjacent cables. Without the anchor placement zone this becomes an increasing risk to the previously installed cables. Over relatively short distances this risk may be acceptable to the project. Alternatively a DP vessel solution will not require anchors and therefore is not constrained in this way.
The variation in gap sizes is due to water depth. The distances have been calculated as per the separation figures presented in the GMSL Cable Constructability Assessment which can be found as Figure 11 and Figure 12 in this report. For more detail in how these were derived please refer to the full report.
Microrouteing of the cables may be undertaken for all the reasons listed in Table 8.
Norfolk Vanguard Offshore Windfarm – Export Cable Installation Study Version Number: 01 Date: 3
rd July 2017
Page 27 of 46
Figure 11: HVDC Cable Separation Calculation Diagram (GMSL 2016)
Figure 12: HVAC Cable Separation Calculation Diagram (GMSL 2016)
Norfolk Vanguard Offshore Windfarm – Export Cable Installation Study Version Number: 01 Date: 3
rd July 2017
Page 28 of 46
7.2.2 Microrouteing for Biogenic Reefs
The need to avoid significant adverse effects on the possible biogenic Sabellaria reefs within the cable corridor is a consenting risk for Norfolk Vanguard.
Microrouteing has tended to be the standard mitigation measure to minimise such impacts, however work is ongoing to assess the requirement (Sabellaria reefs are ubiquitous in the southern North Sea and are known to recover quite quickly (months to years) after storm events and damage from trawling) and the practicality of this given their dynamic nature (reef structures identified pre-consent may not be present at construction).
The Fugro Environmental Investigation Report provides an interpreted biotope map of the cable route corridor. The biotope SS.SBR.PoR.SspiMx (Sabellaria spinluosa on stable mixed circalittoral sediment) was identified throughout the cable corridor and in the western edges of the windfarm sites. This can be seen in the biotope mapping shown in Figure 13. A review of the geophysical data is ongoing to understand the extent of actual reef structures within the cable corridor – Sabellaria may be present as loose agglomerations, crusts or reef.

Norfolk Vanguard Offshore Windfarm – Export Cable Installation Study Version Number: 01 Date: 3
rd July 2017
Page 29 of 46
Figure 13: Biotopes in the Survey Area (Fugro 2016)
Norfolk Vanguard Offshore Windfarm – Export Cable Installation Study Version Number: 01 Date: 3
rd July 2017
Page 30 of 46
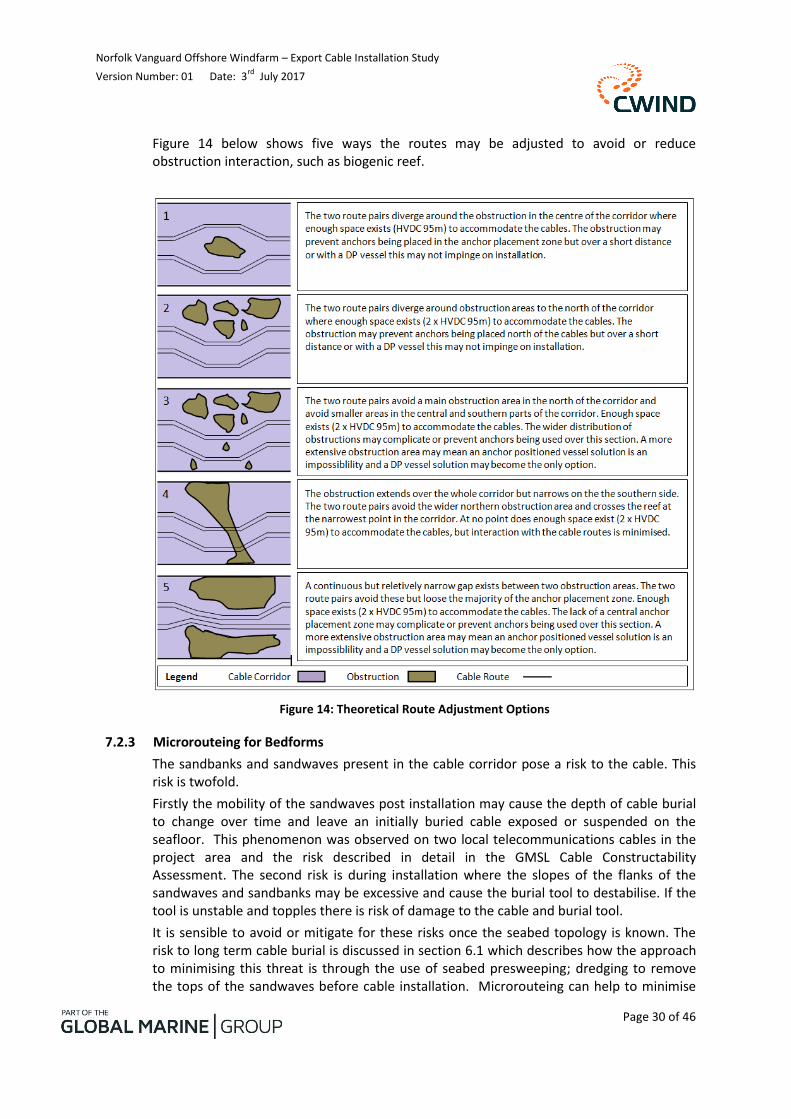
Figure 14 below shows five ways the routes may be adjusted to avoid or reduce obstruction interaction, such as biogenic reef.
Figure 14: Theoretical Route Adjustment Options
7.2.3 Microrouteing for Bedforms
The sandbanks and sandwaves present in the cable corridor pose a risk to the cable. This risk is twofold.
Firstly the mobility of the sandwaves post installation may cause the depth of cable burial to change over time and leave an initially buried cable exposed or suspended on the seafloor. This phenomenon was observed on two local telecommunications cables in the project area and the risk described in detail in the GMSL Cable Constructability Assessment. The second risk is during installation where the slopes of the flanks of the sandwaves and sandbanks may be excessive and cause the burial tool to destabilise. If the tool is unstable and topples there is risk of damage to the cable and burial tool.
It is sensible to avoid or mitigate for these risks once the seabed topology is known. The risk to long term cable burial is discussed in section 6.1 which describes how the approach to minimising this threat is through the use of seabed presweeping; dredging to remove the tops of the sandwaves before cable installation. Microrouteing can help to minimise
Norfolk Vanguard Offshore Windfarm – Export Cable Installation Study Version Number: 01 Date: 3
rd July 2017
Page 31 of 46
the amount of seabed preparation by targeting areas with the smallest sandwave amplitudes and by utilising natural sandwave troughs as cable route passages.
Microrouteing can also help to minimise the burial tool stability risk by selecting routes with the least slope gradient as sandwaves or sandbanks are crossed. In particular excessive side slopes should be avoided, so crossing slopes perpendicular to bathymetric contours is preferred where possible.
7.2.4 Rates of Turn
Any routeing adjustments should allow for the practical issues around the rate of turn that cable routes can accommodate. Various burial tools have different turning abilities on the seabed. This is important because the export cable routes must remain inside the cable corridor with appropriate cable separation distances and comply with the maximum rates of turn of typical burial tools. Extreme changes in export cable route direction must be avoided. Based on GMSL’s experiences of designing and installing previous export cable routes, a minimum turning radius of 600m should be allowed if plough burial methodologies are to remain viable. If ploughing was to be abandoned or a plough and cable developed which could improve on the 600m figure, more flexible routeing becomes possible. Where surface lay and post lay burial is considered the rate of turn may be improved to approx. 100m radius (subject also to the cable’s physical limits). The exact rates of turn adopted should be matched to the cable and equipment used and the individual installer’s experience with that equipment.
Adoption of a tighter turning radius suitable for ROVs but not ploughing will restrict the installation solution options and should be carefully considered. Cable installers tend to favour routes which are straighter as they are simpler to install compared with more sinuous routes. Frequent adjustments to vessels headings and anchor patterns to accommodate a complex route add to the complexity of the whole project. Whilst this is potentially favourable for risk reduction, a balance between installation complexity and simplicity often has to be struck by the route engineer performing the microrouteing.
8.0 REQUIREMENT FOR CABLE PROTECTION
8.1 Introduction
By far the most common form of cable protection is cable burial. However burial of the cable to the target burial depth is not always possible due to perhaps the local geology or seabed obstructions such as cables or pipelines along the route. In these situations other forms of cable protection are often used to ensure the security of the cable product.
Section 5.5.1 describes how cable burial ought to be achievable along all unobstructed sections of the route as long as the correct burial tools are selected.
This section of the report looks at the locations additional cable protection may be needed both inside and outside the Haisborough, Hammond & Winterton SAC. Typical forms and quantities of cable protection suited to these areas are described.
Norfolk Vanguard Offshore Windfarm – Export Cable Installation Study Version Number: 01 Date: 3
rd July 2017
Page 32 of 46
8.2 Additional Protection within Haisborough, Hammond & Winterton SAC
8.2.1 Cable Crossings within SAC
Within both the Haisborough, Hammond & Winterton SAC and the cable route corridor there are an in service cable and a pipeline which will require additional cable protection at the crossing points. This infrastructure is;
UK-Netherlands 14 fibre optic telecom cable
Bacton to Zeebrugge gas pipeline
There are other out of service cables in the intersecting SAC and cable corridor zone, but normal industry practice would be to cut and clear these before the installation takes place (for more information on best industry practice see ICPC Recommendation #1, Management of Redundant and Out-of-Service Cables).
The Fugro geophysical survey report from 2016 describes this infrastructure and what was found by the survey thus;
UK-Netherlands 14 fibre optic cable. Laid in 1996 from Winterton, UK to Egmond, Netherlands. Stated to be buried to 0.6 m bsb for majority of its length. Position confirmed (by MAG) where it crosses the main route. Not visible where it crosses the three approaches to the NV Tranche 1 West and East sites, but database position may be expected to be accurate.
The database positions of newer cables were found to be accurate but older cables were up to 1km from their reported database locations.
Bacton to Zeebrugge 40” gas interconnector. Commissioned in 1998, surface-laid. Visible on the MBES and SSS data in the troughs between very large dunes, but becomes fully buried near northern limit of route corridor. Nevertheless, remains evident on MAG dataset.
(i) UK-Netherlands 14
The original UK-NL14 cable installation records show the cable was buried between 0.6-0.85m deep in the Norfolk Vanguard export cable corridor. The 2016 Fugro survey did not see the cable on the SSS records and appears to remain buried (to an unverified depth). It may therefore be possible to bury the Norfolk Vanguard power cables at the crossing point, although with a fairly shallow fixed depth limitation (the UK-NL14 cable). In order to maintain some separation between the two cables some type of high impact resistant polyurethane (PU) or polyethylene (PE) protection shells may need to be applied to the power cables before they are laid. If these shells are required then a length of approx. 50m (25m either side of the crossing point) would be sufficient for each cable.
Importantly - if the shallow burial meets the target burial depth no further additional protection is likely to be required. If however the target depth is not reached, some additional protection may be considered.
The likely form of additional protection would be mattressing, placed to prevent sediment mobility at the crossing point, therefore preventing any future surface cable exposure. The mattressing would also provide additional protection from trawling and anchors if this is deemed a risk at this point of the route. The 2016 GMSL Constructability Assessment
Norfolk Vanguard Offshore Windfarm – Export Cable Installation Study Version Number: 01 Date: 3
rd July 2017
Page 33 of 46
shows an absence of beam trawling evidence from VMS data at this location, however it is crossed by dense marine traffic movements.
The exact type and quantity of any mattresses would need to be determined in a separate engineering study, however it is estimated at this point that 1 mattress (10m x 3m) per crossing may suffice. CWind (as part of the Global Marine Group) have experience of using both concrete and tyre mattresses in the southern North Sea. Tyre mattresses have a good record of sediment retention in mobile sediment environments and may pose a smaller risk of subsequent scouring around the mattresses.
A formal crossing agreement will be required between and the owners of UK-NL14 and Vattenfall. The final engineering solution will need to be approved by both parties.
(ii) Bacton to Zeebrugge 40” Gas Pipeline
This pipe was originally surface laid and the 2016 Fugro survey reports this is still the case for most of the pipeline as it crosses the Norfolk Vanguard export cable corridor. The pipe is noted as becoming buried at the northern end of the cable route corridor. As the Norfolk Vanguard and Norfolk Boreas export cables may occupy a broad portion of the corridor the pipe is most likely to be at the surface at the crossing points.
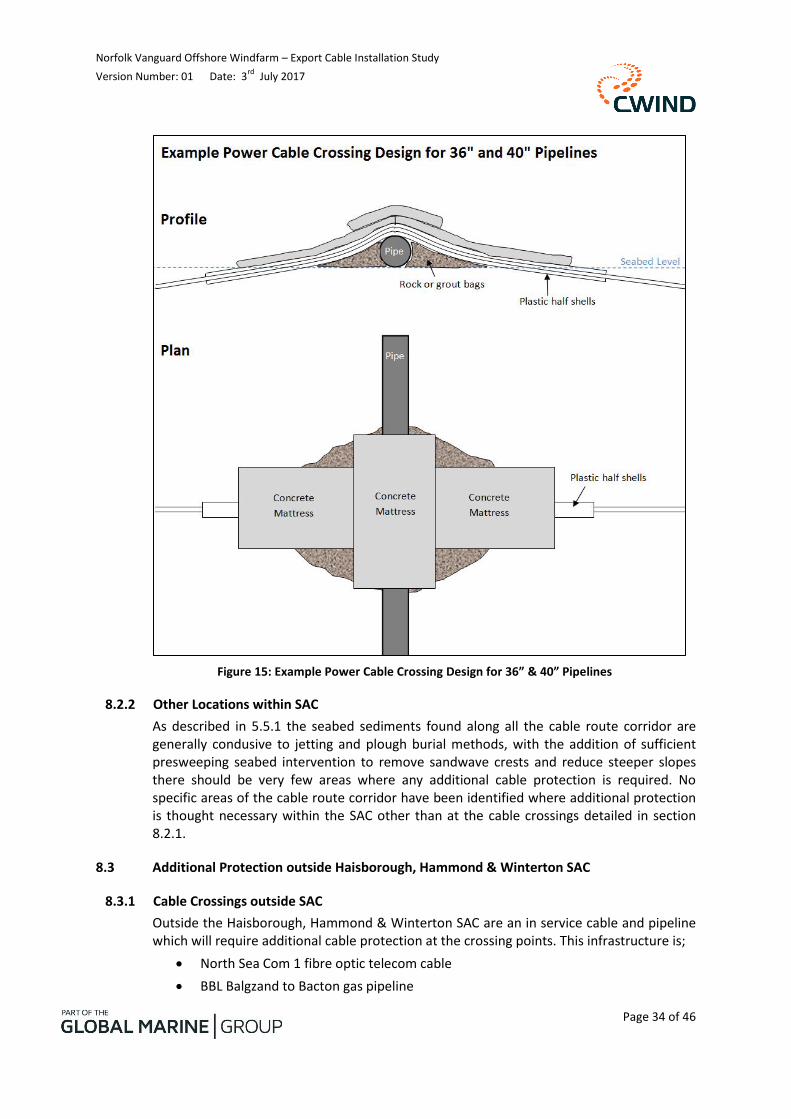
The 40” interconnector pipeline is a large obstruction and will require a detailed pipeline crossing design. With the survey information gathered by Fugro an example crossing design is presented as Figure 15.
This features a rock or grout bag berm to provide a ramp with a shallow gradient to support the cable and prevent the cable MBR being compromised. The cable is protected from the rock below and mattresses above by a plastic half shell protection system. This protection system also provides separation between the pipeline and the cable. Three concrete mattresses (10m x 3m) are laid on top to secure the cable in place and provide protection from trawlers and dropped objects. The plastic half shell protection system extends to beyond the point where the cable is buried either side of the crossing point.
The footprint of the concrete mattresses at such a crossing would be approx. 81m2. This would result in 324 m2 (4 x 81m2) for a HVDC solution and 972m2 (12 x 81m2) for a HVAC solution. Each cable would also require approx. 50m of plastic protections shells. The volume of rock or grout bags is not possible to determine as the exact crossing points are not know at this point and the seabed profile either side of the pipe has a large impact of the volumes required.
A formal crossing agreement will be required between and the owners of the Bacton to Zeebrugge pipeline and Vattenfall. The final engineering solution will need to be approved by both parties.
Norfolk Vanguard Offshore Windfarm – Export Cable Installation Study Version Number: 01 Date: 3
rd July 2017
Page 34 of 46
Figure 15: Example Power Cable Crossing Design for 36” & 40” Pipelines
8.2.2 Other Locations within SAC
As described in 5.5.1 the seabed sediments found along all the cable route corridor are generally condusive to jetting and plough burial methods, with the addition of sufficient presweeping seabed intervention to remove sandwave crests and reduce steeper slopes there should be very few areas where any additional cable protection is required. No specific areas of the cable route corridor have been identified where additional protection is thought necessary within the SAC other than at the cable crossings detailed in section 8.2.1.
8.3 Additional Protection outside Haisborough, Hammond & Winterton SAC
8.3.1 Cable Crossings outside SAC
Outside the Haisborough, Hammond & Winterton SAC are an in service cable and pipeline which will require additional cable protection at the crossing points. This infrastructure is;
North Sea Com 1 fibre optic telecom cable
BBL Balgzand to Bacton gas pipeline
Norfolk Vanguard Offshore Windfarm – Export Cable Installation Study Version Number: 01 Date: 3
rd July 2017
Page 35 of 46
There are other out of service cables outside the SAC, but normal industry practice would be to cut and clear these before the installation takes place (for more information on best industry practice see ICPC Recommendation #1, Management of Redundant and Out-of-Service Cables).
The Fugro geophysical survey report from 2016 describes this infrastructure and what was found by the survey thus;
North Sea Com 1 fibre optic cable Fibre-optic cable laid in 1998 between Lowestoft, UK and Kårstø, Norway. Stated to have a target burial depth of 1 m but depth may be changeable between 0.0–1.5 m in areas of sand waves. There is no evidence of this cable on the 2016 geophysical dataset.
Balgzand to Bacton 36” gas pipeline Commissioned in 2006, surface-laid but with post-lay trenching and/or peak shaving in areas of large sand waves. Almost fully exposed on seafloor at the crossing of the approach corridors to the NV Tranche 1 West site; mostly exposed along the crossing of the approach corridor to the NV Tranche 1 West site but partially buried by migrating very large dunes. The seabed up to 30 m north of the pipeline, within this approach corridor, is scoured to a maximum depth of ~1 m below natural level.
(iii) North Sea Com 1
In the 2016 Fugro survey report the cable was not seen on the SSS records and appears to be buried (to an unverified depth). The survey report reports the cable as being buried to 1m during its installation. It may therefore be possible to bury the Norfolk Vanguard power cables at the crossing point, although with a fairly shallow fixed depth limitation (the North Sea Com cable). In order to maintain some separation between the two cables some type of outer high impact resistant polyurethane (PU) or polyethylene (PE) protection shells may need to be applied to the power cables before they are laid. If these shells are required then a length of approx. 50m (25m either side of the crossing point) would be sufficient for each cable.
Importantly - if the shallow burial meets the target burial depth no additional protection is likely to be required. If however the target depth is not reached, some additional protection may be considered.
The likely form of additional protection would be mattressing, placed to prevent sediment mobility at the crossing point, therefore preventing any future surface cable exposure. The mattressing would also provide additional protection from trawling and anchors if this is deemed a risk at this point of the route. The 2016 GMSL Constructability Assessment shows evidence of beam trawling from VMS data at this location and it is crossed by a moderate amount of marine traffic movements.
The exact type and quantity of any mattresses would need to be determined in a separate engineering study, however it is estimated that 1 mattress per crossing should suffice. CWind (as part of Global Marine Group) have experience of using both concrete and tyre mattresses in the southern North Sea. Tyre mattresses have a proven record of sediment retention in mobile sediment environments and may pose a smaller risk of subsequent scouring around the mattresses.
A formal crossing agreement will be required between and the owners of North Sea Com and Vattenfall. The final engineering solution will need to be approved by both parties.
Norfolk Vanguard Offshore Windfarm – Export Cable Installation Study Version Number: 01 Date: 3
rd July 2017
Page 36 of 46
(iv) Balgzand to Bacton 36” gas pipeline
This pipe was originally surface laid and the 2016 Fugro survey reports this is still the case for most of the pipeline as it crosses the Norfolk Vanguard and Boreas export cable corridors. There is some ambiguity or repetition in the Fugro report as it describes the situation for the Norfolk Vanguard Tranche 1 West site twice but does not mention the crossing of the Norfolk Boreas export cable corridor.
The 36” pipeline is a large obstruction and will require a detailed pipeline crossing design. With the survey information gathered by Fugro an example crossing design is presented as Figure 15. This features a rock berm to provide a ramp with a shallow gradient to support the cable and prevent the cable MBR being compromised. The Fugro survey report mentions a 1m deep scour along the northern side of the pipeline. This scour will require more rock infill to establish the required berm profile.
The cable is protected from the rock and mattresses above by a plastic half shell protection system. This protection system also provides separation between the pipeline and the cable. Three concrete mattresses (10m x 3m) are laid on top to secure the cable in place and provide protection from trawlers and dropped objects. The plastic half shell protection system extends to beyond the point where the cable is buried either side of the crossing point.
The footprint of the concrete mattresses at such a crossing would be approx. 81m2. Depending on the exact cable configuration selected this would result in up to 324 m2 (4 x 81m2) for a HVDC solution and 972m2 (12 x 81m2) for a HVAC solution.
8.3.2 Other Locations outside SAC
As described in 5.5.1 the seabed sediments found along all the cable route corridor are generally condusive to jetting and plough burial methods, with the addition of sufficient presweeping seabed intervention to remove sandwave crests and reduce steeper slopes there should be very few areas where any additional cable protection is required. At this stage the only areas identified where additional protection might be required are at the following locations
HDD Exit points – if Horizontally Directional Drilled ducts are used at the shore ends there could be a requirement to protect the cable as it emerges from the HDD duct. This requirement will depend on the specific duct design profile, execution and seabed conditions at the exit point, but 1 concrete matress (10m x 3m) and some rock placement may be required at every duct exit point.
Offshore Substations (OSS) – Although not a common requirement for OWF OSS’s in CWind’s experience the hydrocarbon industry will often require concrete matressing in close proximity to offshore platforms to protect seabed infrastructure from dropped object damage. This is typically achieved with the use of concrete matressing and may expetend for the first 50m (5 x 10m x 3m) near to the platform. Shoukld this be deemed appropriate for the NV and NB OWF OSS’s then up to 5 matresses per cable may be required.
These are the only areas of the cable route corridor where additional protection is thought necessary outside the SAC other than at the cable crossings detailed in section 8.3.1.
Norfolk Vanguard Offshore Windfarm – Export Cable Installation Study Version Number: 01 Date: 3
rd July 2017
Page 37 of 46
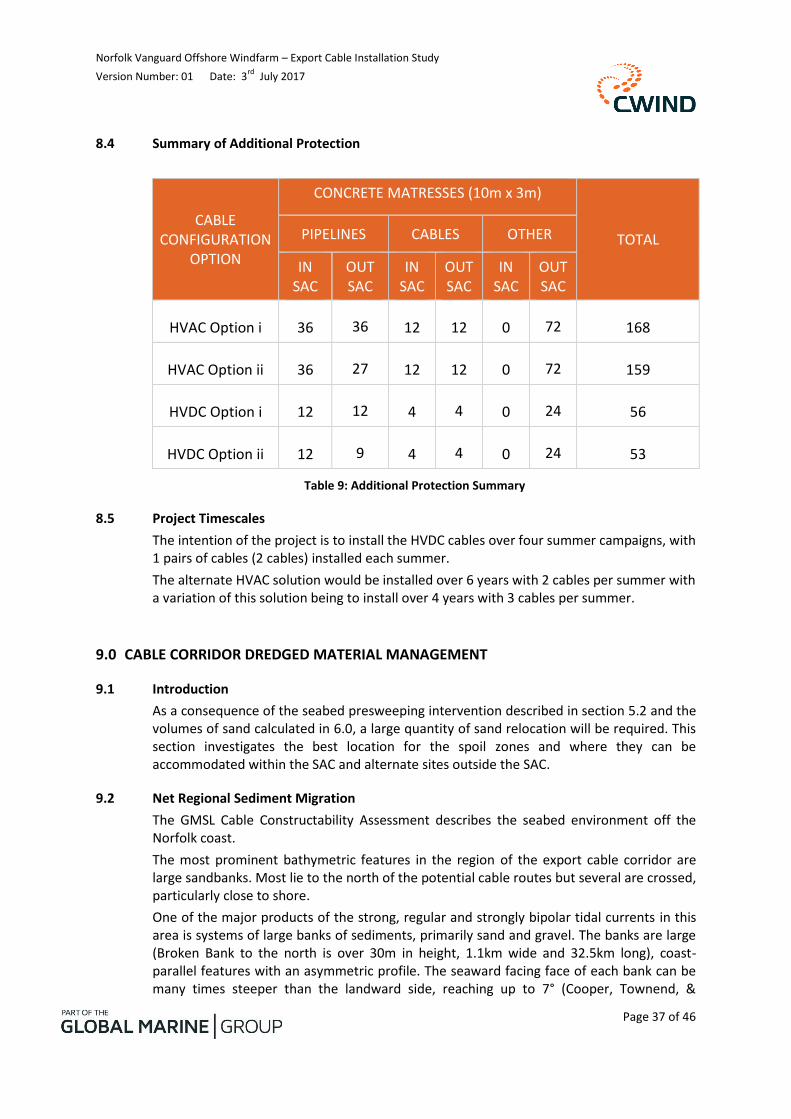
8.4 Summary of Additional Protection
CABLE CONFIGURATION
OPTION
CONCRETE MATRESSES (10m x 3m)
TOTAL PIPELINES CABLES OTHER
IN SAC
OUT SAC
IN SAC
OUT SAC
IN SAC
OUT SAC
HVAC Option i 36 36 12 12 0 72 168
HVAC Option ii 36 27 12 12 0 72 159
HVDC Option i 12 12 4 4 0 24 56
HVDC Option ii 12 9 4 4 0 24 53
Table 9: Additional Protection Summary
8.5 Project Timescales
The intention of the project is to install the HVDC cables over four summer campaigns, with 1 pairs of cables (2 cables) installed each summer.
The alternate HVAC solution would be installed over 6 years with 2 cables per summer with a variation of this solution being to install over 4 years with 3 cables per summer.
9.0 CABLE CORRIDOR DREDGED MATERIAL MANAGEMENT
9.1 Introduction
As a consequence of the seabed presweeping intervention described in section 5.2 and the volumes of sand calculated in 6.0, a large quantity of sand relocation will be required. This section investigates the best location for the spoil zones and where they can be accommodated within the SAC and alternate sites outside the SAC.
9.2 Net Regional Sediment Migration
The GMSL Cable Constructability Assessment describes the seabed environment off the Norfolk coast.
The most prominent bathymetric features in the region of the export cable corridor are large sandbanks. Most lie to the north of the potential cable routes but several are crossed, particularly close to shore.
One of the major products of the strong, regular and strongly bipolar tidal currents in this area is systems of large banks of sediments, primarily sand and gravel. The banks are large (Broken Bank to the north is over 30m in height, 1.1km wide and 32.5km long), coast-parallel features with an asymmetric profile. The seaward facing face of each bank can be many times steeper than the landward side, reaching up to 7° (Cooper, Townend, &

Norfolk Vanguard Offshore Windfarm – Export Cable Installation Study Version Number: 01 Date: 3
rd July 2017
Page 38 of 46
Balson, 2008). The banks were initially formed from glacial outwash sediments and may be fed by continuing coastal erosion at the present day. SBP evidence suggests that the banks are slowly (c.1m yr-1) migrating to the northeast but it is unconfirmed whether that this movement continues to the present day. They are however elongating to the northwest, the direction of overall regional sediment transport.
This net sediment migration in a northwest direction is supported by the evidence from the Fugro 2016 survey where a ~1m deep scour was observed north of the Balgzand to Bacton pipeline. As scour over pipelines occurs when the rate of sediment transport upstream of the pipe is less than the transport downstream. With a seabed scour observed to the north of the pipe it implies that the net sediment transport is northwards.
9.3 Spoil Zones Within the Haisborough, Hammond & Winterton SAC
As part of the consenting process it will benefit the project if any sand dredged as part of the presweeping seabed intervention within the Haisborough, Hammond & Winterton SAC can be retained inside the intersecting SAC and cable corridor boundaries in designated spoil zones.
As the cables for the project are expected to take multiple years to install it is important to locate the spoil zones where subsequent natural sediment transport processes do not accelerate the natural backfilling of the preswept cable routes. If this were to occur it may require the project to re-dredge sediment already removed during earlier presweeping work. Therefore we recommend the spoil zones are located north of the export cable routes within the SAC and cable route corridor boundaries.
The spoil zones should not be designed to overlap the cable routes as this may complicate recovery of a cable in the future should a maintenance operation be required. The spoil would increase the depth of cover over the cable. The cable would then require a more extensive deburial operation before any cable recovery could commence. The increased depth of cover may also affect the thermal condition of the cable.
To maximise space for spoil zones ideally the cable routes should be engineered to stay to the south of the corridor and this is how the example routes produced by CWind for this study have been created. We also need to be mindful of the other existing infrastructure in close proximity to the export routes and the sensitive biogenic reefs (Ross worm S. spinulosa).
Placing spoil on other cables or pipes would almost certainly be refused by the owners. In determining the recommended spoil zones a 500m exclusion buffer was placed around all of the existing pipe and cable infrastructure and the example NV export routes.
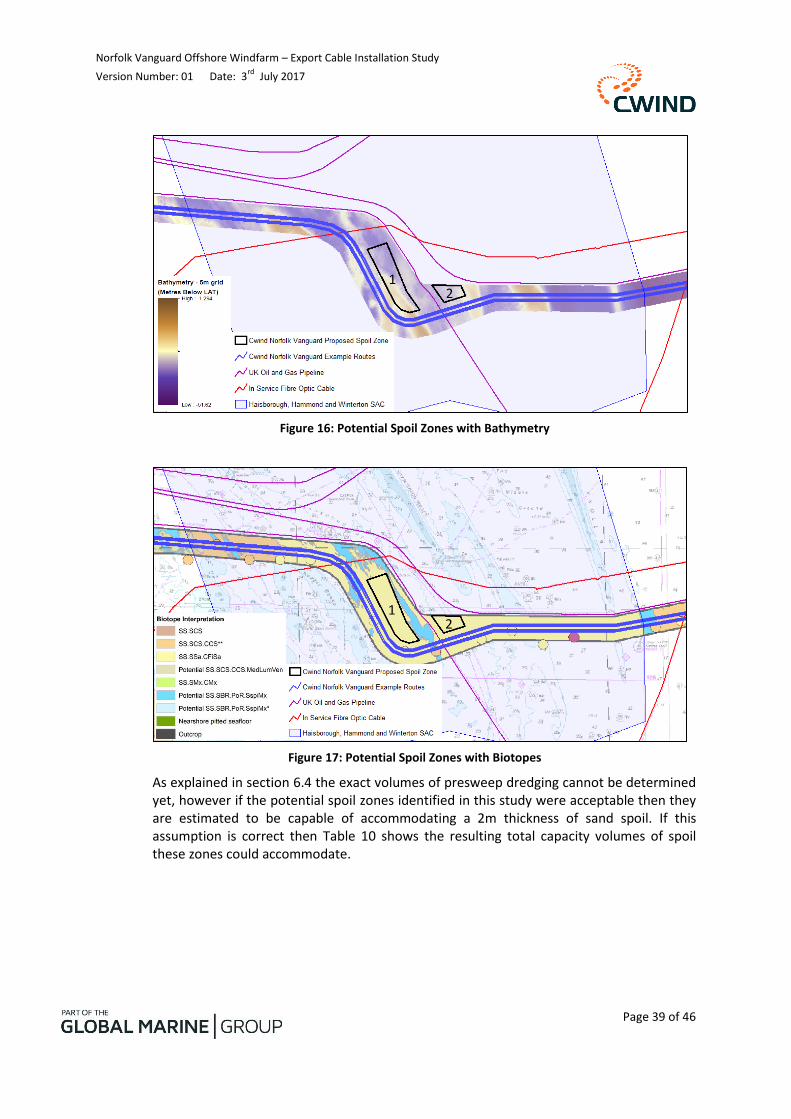
The zones also avoid all areas interpreted as potential areas for the development of Sabellaria reef identified in the 2016 Fugro biotope mapping (provided earlier in this report as Figure 13 This results in two potential spoil zones shown as black outlined areas in Figure 16 (with bathymetry) and Figure 17 (with biotopes).
The spoil zones are located in areas with a minimum of 20m water depth (LAT), so the addition of up to 2m of spoil should not present a navigational hazard. The spoil zones have the additional but consequential benefit of being fairly central in the SAC and will therefore minimise the transits required for the dredging vessel during dredging operations.
Norfolk Vanguard Offshore Windfarm – Export Cable Installation Study Version Number: 01 Date: 3
rd July 2017
Page 39 of 46
Figure 16: Potential Spoil Zones with Bathymetry
Figure 17: Potential Spoil Zones with Biotopes
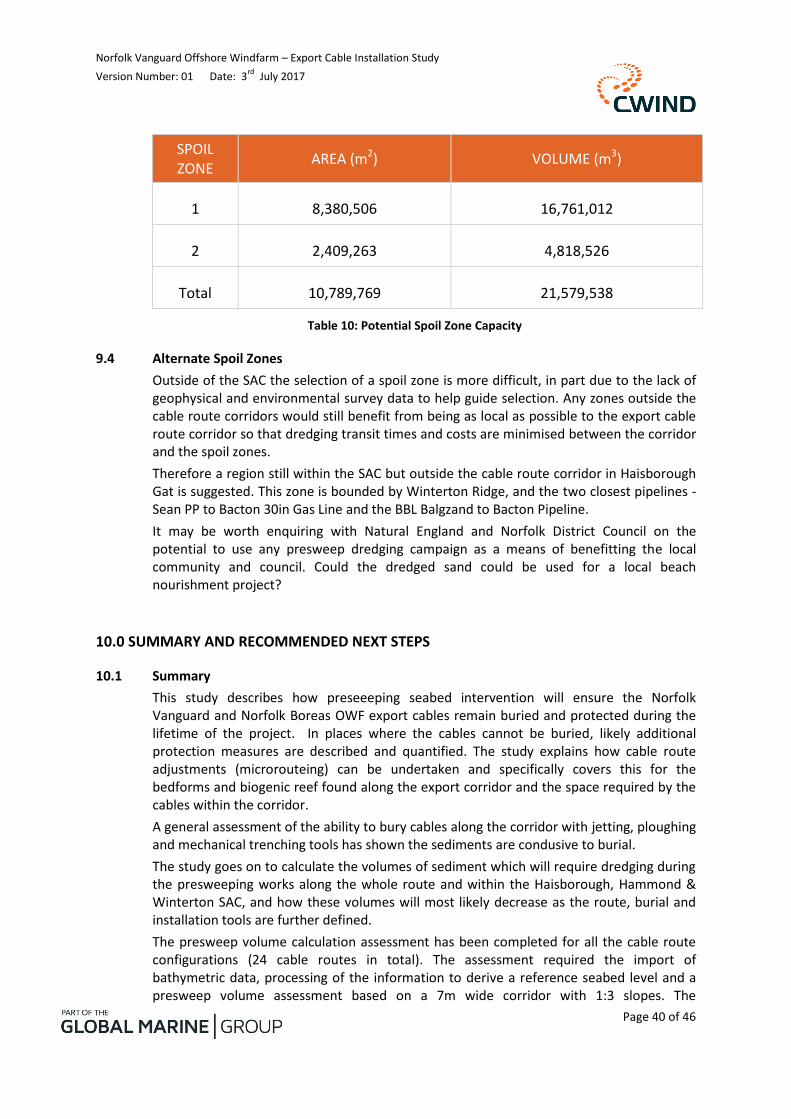
As explained in section 6.4 the exact volumes of presweep dredging cannot be determined yet, however if the potential spoil zones identified in this study were acceptable then they are estimated to be capable of accommodating a 2m thickness of sand spoil. If this assumption is correct then Table 10 shows the resulting total capacity volumes of spoil these zones could accommodate.
1 2
1 2
Norfolk Vanguard Offshore Windfarm – Export Cable Installation Study Version Number: 01 Date: 3
rd July 2017
Page 40 of 46
SPOIL ZONE
AREA (m2) VOLUME (m3)
1 8,380,506 16,761,012
2 2,409,263 4,818,526
Total 10,789,769 21,579,538
Table 10: Potential Spoil Zone Capacity
9.4 Alternate Spoil Zones
Outside of the SAC the selection of a spoil zone is more difficult, in part due to the lack of geophysical and environmental survey data to help guide selection. Any zones outside the cable route corridors would still benefit from being as local as possible to the export cable route corridor so that dredging transit times and costs are minimised between the corridor and the spoil zones.
Therefore a region still within the SAC but outside the cable route corridor in Haisborough Gat is suggested. This zone is bounded by Winterton Ridge, and the two closest pipelines - Sean PP to Bacton 30in Gas Line and the BBL Balgzand to Bacton Pipeline.
It may be worth enquiring with Natural England and Norfolk District Council on the potential to use any presweep dredging campaign as a means of benefitting the local community and council. Could the dredged sand could be used for a local beach nourishment project?
10.0 SUMMARY AND RECOMMENDED NEXT STEPS
10.1 Summary
This study describes how preseeeping seabed intervention will ensure the Norfolk Vanguard and Norfolk Boreas OWF export cables remain buried and protected during the lifetime of the project. In places where the cables cannot be buried, likely additional protection measures are described and quantified. The study explains how cable route adjustments (microrouteing) can be undertaken and specifically covers this for the bedforms and biogenic reef found along the export corridor and the space required by the cables within the corridor.
A general assessment of the ability to bury cables along the corridor with jetting, ploughing and mechanical trenching tools has shown the sediments are condusive to burial.
The study goes on to calculate the volumes of sediment which will require dredging during the presweeping works along the whole route and within the Haisborough, Hammond & Winterton SAC, and how these volumes will most likely decrease as the route, burial and installation tools are further defined.
The presweep volume calculation assessment has been completed for all the cable route configurations (24 cable routes in total). The assessment required the import of bathymetric data, processing of the information to derive a reference seabed level and a presweep volume assessment based on a 7m wide corridor with 1:3 slopes. The
Norfolk Vanguard Offshore Windfarm – Export Cable Installation Study Version Number: 01 Date: 3
rd July 2017
Page 41 of 46
assessment has not taken into consideration global seabed level changes that may occur during the life span of the cables, which may need to be carried out based on several bathymetric survey datasets and historical chart data.
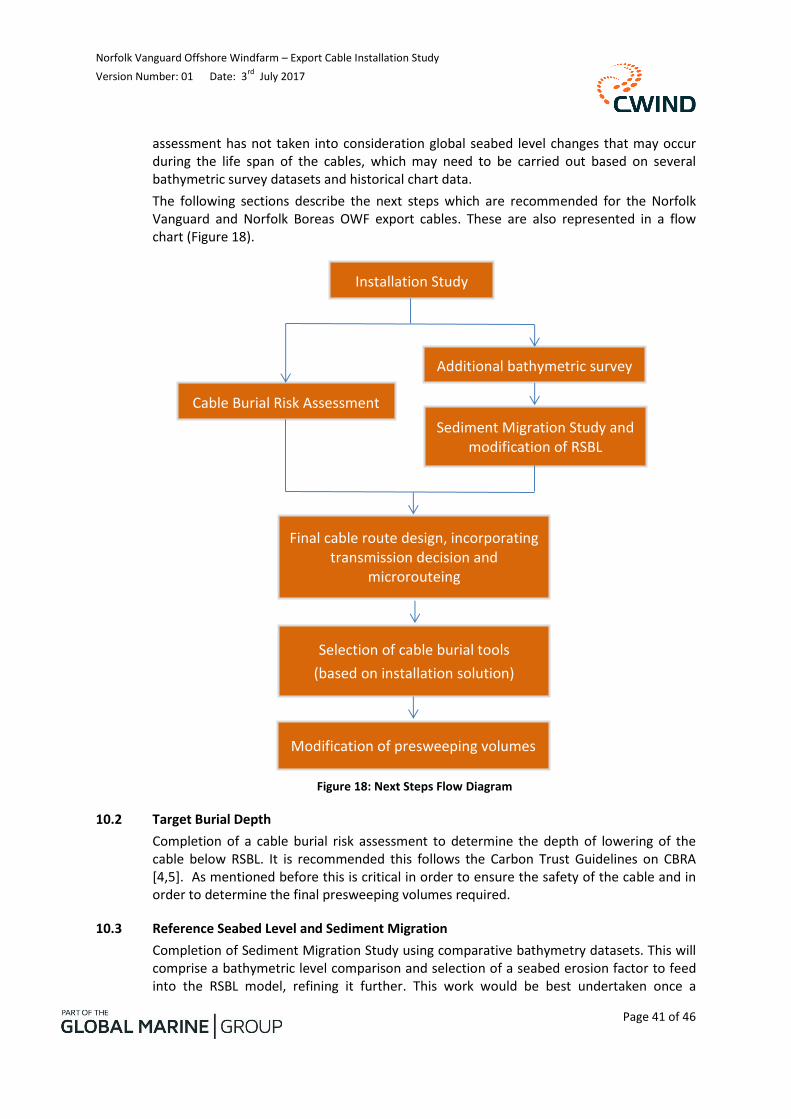
The following sections describe the next steps which are recommended for the Norfolk Vanguard and Norfolk Boreas OWF export cables. These are also represented in a flow chart (Figure 18).
Figure 18: Next Steps Flow Diagram
10.2 Target Burial Depth
Completion of a cable burial risk assessment to determine the depth of lowering of the cable below RSBL. It is recommended this follows the Carbon Trust Guidelines on CBRA [4,5]. As mentioned before this is critical in order to ensure the safety of the cable and in order to determine the final presweeping volumes required.
10.3 Reference Seabed Level and Sediment Migration
Completion of Sediment Migration Study using comparative bathymetry datasets. This will comprise a bathymetric level comparison and selection of a seabed erosion factor to feed into the RSBL model, refining it further. This work would be best undertaken once a
Installation Study
Cable Burial Risk Assessment
Additional bathymetric survey
Sediment Migration Study and modification of RSBL
Modification of presweeping volumes
Final cable route design, incorporating transmission decision and
microrouteing
Selection of cable burial tools
(based on installation solution)
Norfolk Vanguard Offshore Windfarm – Export Cable Installation Study Version Number: 01 Date: 3
rd July 2017
Page 42 of 46
comparative bathymetry dataset is available, preferably covering areas where the bedforms are present.
Implementation of a natural infill assessment for the pre-sweep corridor to anticipate potential infill rates of the corridor between pre-sweeping and cable lay and burial operations. This will provide important information pertinent to future installation scheduling.
Norfolk Vanguard Offshore Windfarm – Export Cable Installation Study Version Number: 01 Date: 3
rd July 2017
Page 43 of 46
Appendix A – Presweeping Charts
Norfolk Vanguard Offshore Windfarm – Export Cable Installation Study Version Number: 01 Date: 3
rd July 2017
Page 44 of 46
Appendix B – Spreadsheets with Volume and Area Breakdown
B1 - Full Volumetric Calculations (xlsx file)
B2 - Volume and Area Summary (xlsx file)
Norfolk Vanguard Offshore Windfarm – Export Cable Installation Study Version Number: 01 Date: 3
rd July 2017
Page 45 of 46
Appendix C – Bedform Profiles
CONFIDENTIAL. ALL RIGHTS RESERVED.
Passing on or copying of this document, use and communication of its content is not permitted without
expressed permission from Global Marine Systems Limited.
©GLOBAL MARINE SYSTEMS LIMITED 2017
The Copyright in this work is vested in Global Marine Systems Limited and the information contained herein is
confidential.
This work , either in whole or in part, must not be modified, reproduced, disclosed or disseminated to others
or used for purposes other than that for which it is supplied, without the prior written permission of Global
Marine Systems Limited.