a review of contextual factors
62
IMPLEMENTING NUTRITION LABELLING POLICIES A REVIEW OF CONTEXTUAL FACTORS
Transcript of a review of contextual factors

implementing nutrition labelling policies
a review of contextual factors


implementing nutrition labelling policies
a review of contextual factors

Implementing nutrition labelling policies: a review of contextual factors
ISBN 978-92-4-003508-9 (electronic version)ISBN 978-92-4-003509-6 (print version)
© World Health Organization 2021
Some rights reserved. This work is available under the Creative Commons Attribution-NonCommercial-ShareAlike 3.0 IGO licence (CC BY-NC-SA 3.0 IGO; https://creativecommons.org/licenses/by-nc-sa/3.0/igo).
Under the terms of this licence, you may copy, redistribute and adapt the work for non-commercial purposes, provided the work is appropriately cited, as indicated below. In any use of this work, there should be no suggestion that WHO endorses any specific organization, products or services. The use of the WHO logo is not permitted. If you adapt the work, then you must license your work under the same or equivalent Creative Commons licence. If you create a translation of this work, you should add the following disclaimer along with the suggested citation: “This translation was not created by the World Health Organization (WHO). WHO is not responsible for the content or accuracy of this translation. The original English edition shall be the binding and authentic edition”.
Any mediation relating to disputes arising under the licence shall be conducted in accordance with the mediation rules of the World Intellectual Property Organization (http://www.wipo.int/amc/en/mediation/rules/).
Suggested citation. Implementing nutrition labelling policies: a review of contextual factors. Geneva: World Health Organization; 2021. Licence: CC BY-NC-SA 3.0 IGO.
Cataloguing-in-Publication (CIP) data. CIP data are available at http://apps.who.int/iris.
Sales, rights and licensing. To purchase WHO publications, see http://apps.who.int/bookorders. To submit requests for commercial use and queries on rights and licensing, see http://www.who.int/about/licensing.
Third-party materials. If you wish to reuse material from this work that is attributed to a third party, such as tables, figures or images, it is your responsibility to determine whether permission is needed for that reuse and to obtain permission from the copyright holder. The risk of claims resulting from infringement of any third-party-owned component in the work rests solely with the user.
General disclaimers. The designations employed and the presentation of the material in this publication do not imply the expression of any opinion whatsoever on the part of WHO concerning the legal status of any country, territory, city or area or of its authorities, or concerning the delimitation of its frontiers or boundaries. Dotted and dashed lines on maps represent approximate border lines for which there may not yet be full agreement.
The mention of specific companies or of certain manufacturers’ products does not imply that they are endorsed or recommended by WHO in preference to others of a similar nature that are not mentioned. Errors and omissions excepted, the names of proprietary products are distinguished by initial capital letters.
All reasonable precautions have been taken by WHO to verify the information contained in this publication. However, the published material is being distributed without warranty of any kind, either expressed or implied. The responsibility for the interpretation and use of the material lies with the reader. In no event shall WHO be liable for damages arising from its use.
Design and layout by Ms Sue Hobbs of minimum graphics.
iii
COnTenTS
contents
Acknowledgements v
Abbreviations vi
executive summary vii
Background 1
Methodology 5
Framework and guidance questions 5
Literature search 5
Factor 1. Values 9
Factor 2. Resource implications 11
Factor 3. equity and human rights 14
Universal human rights standards 14
Impact on (health) (in)equity and (health) (in)equality 25
Factor 4. Acceptability 17
Acceptability to stakeholders 17
Sociocultural acceptability 24
Environmental acceptability 24
Factor 5. Feasibility 25
Elements that support or hinder development and implementation 25
Elements that support or hinder monitoring, evaluation and enforcement 31
Impact on health systems, food systems and the policy environment 32
References 33
Annex 1. Framework for review of contextual factors 43
Annex 2. Summary tables 45


v
ACknOWledGeMenTS
acknowledgements
This review of contextual factors on nutrition labelling policies was led by Dr Katrin Engelhardt, of the World Health Organization (WHO) Unit of Safe, Healthy and Sustainable Diet, Department of Nutrition and Food Safety (NFS/CC Healthy Diet). Ms Dorit Erichsen, NFS/CC Healthy Diet, WHO, collected, reviewed and synthesized the evidence, and prepared the first draft of the report. Mr Tomas Allen, Librarian, WHO, reviewed the search protocol and supported the search for the factor on values. Comments on the protocol and the search strategy for the factor on equity and human rights were provided by Ms Rebekah Thomas Bosco, WHO Guideline Review Committee Secretariat. Comments on the search strategy for government searches were provided by Professor Celeste Naude, Associate Professor, Centre for Evidence-based Health Care, Division of Epidemiology and Biostatistics, Stellenbosch University, South Africa, and Co-Director Cochrane Nutrition; Professor Eva Rehfuess, Chair of Public Health and Health Services Research, Ludwig-Maximilians-University, Germany; and Dr Elie Akl, Professor of Medicine, American University of Beirut, Lebanon. Ms Krista Lang, NFS/CC Healthy Diet, WHO, conducted the searches for government reports and supported the finalization of the review.
The review was prepared as part of the required process for WHO guideline development. It was presented to the WHO Nutrition Guidance Expert Advisory Group (NUGAG) Subgroup on Policy Actions at its second meeting, in December 2019.
Technical editing of the review was undertaken by Dr Andina Faragher at Biotext Pty Ltd.

implementing nutrition labelling policies
vi
abbreviations
BMI body mass index
DALY disability-adjusted life year
FOPL front-of-pack labelling
GNPR Global Nutrition Policy Review
GRADE Grading of Recommendations Assessment, Development and Evaluation
HALY health-adjusted life year
HIC high-income country
HSR Health Star Rating
LMIC low- and middle-income country
NCD noncommunicable disease
NGO nongovernmental organization
NUGAG Nutrition Guidance Expert Advisory Group
OECD Organisation for Economic Co-operation and Development
SES socioeconomic status1
SSB sugar-sweetened beverage
UN United Nations
WHO World Health Organization
1 Socioeconomic status was in this review used as synonym for “socioeconomic position”, “socioeconomic strata” and “socioeconomic group”, which were all terms used in the identified literature.

vii
exeCuTIVe SuMMARy
executive summary
Healthy dietary practices starting early in life are the foundation for good nutrition, health and development during childhood and beyond. Yet, unhealthy diets are a leading global public health risk, contributing to a rise in unhealthy weight gain and noncommunicable diseases (NCDs), including diabetes, cardiovascular disease, stroke and cancer.
Governments play a leading role in reducing the burden of diet-related NCDs, addressing malnutrition in all its forms and promoting healthy diets. In 2014, the Second International Conference on Nutrition emphasized the importance of improving the food environment, which plays a critical role in shaping people’s diets, including through policy actions.
The current food environment exposes consumers to powerful food marketing, predominantly of foods that undermine healthy diets, and to inconsistent and often misleading nutrition labelling. Enabling consumers to make healthier dietary decisions therefore requires creating a food environment that promotes a healthy diet. Such a food environment includes nutrition labelling policies that prevent labelling in a manner that is false, misleading or deceptive, or is likely to create an erroneous impression about any characteristics of the product; labelling policies should also enable consumers to make an informed selection of pre-packaged products. Nutrition labelling policies are implemented within complex systems (including the food system) that are largely country specific. They are affected by each country’s political, legal, economic, cultural and ethical contexts.
This review provides contextual information for nutrition labelling policies, including ingredient lists, nutrient declarations, supplementary nutrition information (front-of-pack labelling), and health and nutrition claims. This information was considered by the World Health Organization (WHO) Nutrition Guidance Expert Advisory Group (NUGAG) Subgroup on Policy Actions when formulating the WHO guideline on nutrition labelling policies, and moving from evidence to policy recommendations. The factors considered in this review are:
ÚÚ Factor 1 – values;
ÚÚ Factor 2 – resource implications, including the costs and cost-effectiveness of interventions;
ÚÚ Factor 3 – equity and human rights;
ÚÚ Factor 4 – acceptability, reflecting the perspectives, attitudes and opinions of consumers, government and industry, and the support of these stakeholders for nutrition labelling policies; and
ÚÚ Factor 5 – feasibility, focusing on the feasibility of developing, implementing, administering, monitoring and evaluating nutrition labelling policies.
Types of literature to inform the review included systematic reviews, primary studies and grey literature, including government reports. Search terms were defined based on factors proposed in evidence to decision (EtD) frameworks used in the WHO guideline development process, including the GRADE (Grading of Recommendations Assessment, Development and Evaluation) EtD framework and the WHO-INTEGRATE EtD framework. Only literature published in English was included, and the search was restricted to publications after 2004.
A total of 180 publications were included in the review, the majority for Factors 4 (acceptability; n = 67) and 5 (feasibility; n = 75). The majority of publications were identified from high-income countries, and focused on supplementary nutrition information.
implementing nutrition labelling policies
viii
For evidence identified on values towards health outcomes, there was some variability in relation to values about body weight status among study populations. In high-income countries, overweight and obesity were generally perceived as a serious health problem. Women were more likely than men to perceive overweight and obesity (especially childhood obesity) as a serious health problem, as were people of lower socioeconomic status (SES) compared with their higher SES counterparts. In contrast, in many studies from low- and middle-income countries, overweight and obesity were perceived as indicating good health or interpreted as “normal weight”. However, in some countries that have perceived overweight and obesity as indicating good health, values are changing, and normal weight body mass index is increasingly considered healthy. In contrast to values about body weight status, there was no variability in values about diet-related NCDs, which were perceived negatively in all identified studies. No information was identified on whether consumers value “non-misleading” labels.
Evidence on the resource implications of labelling policies was identified in modelling studies and government reports. All identified studies found nutrition labelling policies to be cost-effective; they produce larger health gains (in disability-adjusted life years or health-adjusted life years) than the cost of implementing the intervention in all countries modelled. The costs of a nutrition labelling policy and expected health gains depend on country context, and the design and regulatory nature of the policy. Many of the costs, such as label design, printing and nutrient analysis, are borne by industry. These costs vary depending on the scale and scope of the labelling requirements, as well as the type of packaging.
Labelling policies that are truthful and non-misleading, and facilitate healthy dietary decisions are in accordance with human rights standards, and relevant to the right to health and the right to appropriate information (an aspect of the right to freedom of expression). There is limited evidence on the impact of existing nutrition labelling policies on health equity. However, differences across population groups in awareness, understanding and use of nutrition labelling may either increase or reduce existing inequities and inequalities. For example, consumer use and understanding appear to be poor for nutrient declarations, particularly for groups of low SES, because of the complexity of the numerical information, small print size and positioning of the information on the back or side of pre-packaged foods. For front-of-pack labelling, people who benefit the most are likely to be those with poorer health literacy, and vulnerable populations who are at higher risk of diet-related NCDs.
Evidence identified on acceptability shows that nutrition labelling policies are generally acceptable to stakeholder groups, but this depends on context and the type of labelling. The large number of countries with nutrition labelling policies in place affirms the acceptability of such policies to government; governments prioritize labelling as a policy to promote a healthy food environment. Nutrition labelling policies are largely acceptable to the public and appear to be more acceptable than, for example, marketing restrictions, and taxes on sugar-sweetened beverages and unhealthy foods. A report from the United Kingdom found that consumers considered the information provided on food labels an important consumer right, even if they choose to ignore it. Acceptability was generally lower for industry than for other stakeholder groups and was closely linked with factors that affect the feasibility of implementing such policies. For front-of-pack labelling systems, industry appeared to prefer voluntary policies and numerical systems over more interpretive systems.
The existence of nutrition labelling policies in many countries points to their feasibility. Intersectoral collaboration and stakeholder engagement, transparent processes, supporting evidence, public campaigns and civil society support were identified as factors that can facilitate the development and implementation of nutrition labelling policies. Barriers to implementation included conflicting interests, industry interference and opposition, financial costs, the lack of continued public campaigns and media support, and the complexity of developing a labelling scheme (including

ix
exeCuTIVe SuMMARy
issues related to underlying nutrient profile models, defining “unhealthy” and deciding on the optimal system for a given context).
Monitoring, evaluation and enforcement are key elements for regulatory action, including for nutrition labelling policies. Challenges include methodological difficulties in developing formal monitoring, evaluation and enforcement structures due to the “novelty” of the policy action, and the lack of country experiences or evidence to base these on; lack of formal guidelines for existing regulations; lack of transparency; and inadequate human and financial resources. Elements that support monitoring, evaluation and enforcement of nutrition labelling policies include developing clear and transparent guidelines and structures; sharing responsibility for different parts of the monitoring, evaluation and enforcement of a policy (e.g. tasking national academia with evaluations, and health authorities with enforcement and monitoring of noncompliance); and allocating adequate resources.
This review of contextual factors showed some variability in resource implications, acceptability and feasibility of developing and implementing nutrition labelling policies. Acknowledging that most of the identified information is on front-of-pack labelling, and comes from high-income and English-speaking countries, results suggest the need to consider the local context, including the regulatory and political environment, when developing and implementing nutrition labelling policies. Overall, effective implementation of such policies could contribute to achievement of the right to health, a core WHO value.


1
BACkGROund
background
Nutrition during childhood and adolescence is key to ensuring optimal growth, health and well-being during childhood and beyond (1–3). Healthy dietary practices – the foundation for good nutrition – are initiated early in life. Their impact on healthy growth during childhood is seen in rapid growth spurts. They also have long-term health impacts, including preventing noncommunicable diseases (NCDs) later in life. As well, they have an intergenerational impact through ensuring that mothers, particularly those who are adolescent girls, have an optimal nutritional status (1, 4).
Unhealthy diets are a leading global public health risk, contributing to a rise in unhealthy weight gain and NCDs, including diabetes, heart disease, stroke and cancer (5). NCDs now account for about 70% of all deaths globally (6). The dietary risks cluster1 results in more than 10 million deaths from NCDs per year. It is responsible for 16.45% of all disability-adjusted life years (DALYs) lost to NCDs and 10.2% of DALYs lost to all causes worldwide.2 Overweight and obesity in childhood is one of the most prominent global public health challenges today. Virtually no progress has been made in reducing the spread of overweight in more than 15 years (7). Globally, 38.3 million children under the age of 5 years are estimated to be overweight, and 36% of these children live in low- and middle-income countries (7). These numbers escalate by an order of magnitude in the age group 5–19 years: 337 million children in this age group were estimated to be overweight or obese in 2016 (8). At the same time, 47 million children under 5 years of age are wasted, and 144 million are stunted (7).
Governments play a leading role in reducing the burden of diet-related NCDs, addressing malnutrition in all its forms and promoting healthy diets, including through policy actions (9, 10). The Second International Conference on Nutrition, held in 2014, emphasized the importance of improving the food environment, which shapes norms and values of food consumption, through the ways food is labelled, marketed and provided (11, 12). In the current food environment, dietary patterns have shifted, and people are consuming more foods high in energy, saturated fats, trans-fatty acids, free sugars or salt. Many people do not eat enough dietary fibre such as that provided by fruit, vegetables, whole grains and legumes (13). The current food environment exposes consumers to powerful food marketing, predominantly of foods that undermine healthy diets (14, 15), and to inconsistent and often misleading nutrition labelling (16). It is timely to implement policy actions that contribute to creating a food environment that promotes and enables healthy diets for all.
To support Member States in developing and implementing food and nutrition–related policy measures, as recommended by the Framework for Action from the Second International Conference on Nutrition (11, 12), the World Health Organization (WHO) Department of Nutrition and Food Safety started work to develop evidence-informed guidelines on nutrition labelling policies.
As a first step in this process, the WHO Department of Nutrition and Food Safety established a guideline development group: the WHO Nutrition Guidance Expert Advisory Group (NUGAG) Subgroup on Policy Actions in 2018. Priority areas for policy guidelines included nutrition labelling policies, policies to protect children from the harmful impact of food marketing, fiscal and pricing policies, and school food and nutrition policies.
1 The “dietary risks cluster” includes diets that are low in whole grains, fruit, nuts and seeds, vegetables, fibre, legumes, polyunsaturated fatty acids, calcium or milk, and/or are high in sodium, trans-fatty acids, processed meat, red meat or sugary drinks (Global Burden of Disease risk factors).
2 Global Burden of Disease statistics, 2017
implementing nutrition labelling policies
2
For the purpose of the WHO policy guidelines, nutrition labelling includes ingredient lists, nutrient declarations, supplementary nutrition information (which includes front-of-pack nutrition labelling), and nutrition and health claims, which serve different purposes and for which Codex Alimentarius has developed provisions.1 The second WHO Global Nutrition Policy Review (GNPR) found that, globally, the most common components of nutrition labelling of pre-packaged foods and beverages were ingredient lists and nutrient declarations. Having a nutrient declaration was reported by at least 80% of countries in the WHO regions of the Americas, Europe and the Western Pacific, but by less than half the countries in the WHO regions of Africa and South-East Asia. Implementation can be voluntary or mandatory, and information on nutrients is often disclosed inconsistently. Measures to regulate or guide nutrition and health claims are usually included in national labelling policies. Most nutrition and health claim policies were developed after 2007, and almost a quarter since 2013, when the Codex guidelines incorporated nutrient reference values for NCDs. An increasing number of countries are developing and implementing front-of-pack labelling (FOPL) systems. Most systems reported by countries were voluntary, with different formats, graphics, content and underlying nutrient profile models.
Despite the progress on implementing nutrition labelling policies, the policy impact varies between countries, and the impacts of nutrition labelling policies on specific outcomes, such as consumers’ nutrition and health outcomes, and food reformulation, are uncertain. Developing a more robust, evidence-informed policy guideline through the WHO guideline development process implemented since 2010 will help more countries to put in place nutrition labelling policies as a policy tool that governments can use to guide consumers to make informed food purchases and healthier eating decisions.
The process for developing the WHO guideline on nutrition labelling follows the WHO handbook for guideline development (17) (the WHO Handbook).
The WHO Handbook requires that, when developing a guideline and its recommendations, explicit consideration must be given to decision criteria (i.e. contextual factors) when moving from the evidence on the impact of interventions to recommendations; these contextual factors may affect the direction and strength of the recommendations. They include equity, human rights, resource implications, acceptability of the policy to the various stakeholders, and feasibility of adapting the recommendations, including the availability of infrastructure and mechanisms necessary for implementation, enforcement, monitoring and evaluation (18). The NUGAG Subgroup on Policy Actions, at its first meeting in December 2018, therefore requested reviews of contextual factors to be conducted for all policy guidelines in addition to systematic reviews on the effectiveness of the policy measure. This is because policy measures to promote healthy diets are implemented in complex systems (including the food system), which are country specific and unique to the interplay of each country’s contextual features. Contextual features are shaped and defined within each country’s political, legal, economic, cultural and ethical context.
The factors considered in these reviews include those outlined in the WHO Handbook: priority of the problem, values, resource implications, equity and human rights, acceptability, feasibility, and balance of benefits and harms (19). The reviews also include relevant subcriteria of the WHO-INTEGRATE evidence to decision framework (20) (e.g. the impact of the policy action on, or the policy action’s interaction with, existing health and food systems).
1 Relevant Codex Alimentarius standards and related texts on labelling can be found at the website of the Codex Committee on Food Labelling.

3
BACkGROund
A logic model was developed to conceptualize the complexity of nutrition labelling policies and to visualize the range of contextual factors that influence a policy’s impact on the outcomes of interest (Fig. 1).
The overall aim of this review was to search for, identify, summarize and present information on the impact of contextual factors on implementation of nutrition labelling policies.

implementing nutrition labelling policies
4
Fig.
1. l
ogic
mod
el d
epic
ting
path
way
s fr
om n
utrit
ion
labe
lling
pol
icie
s to
beh
avio
ural
, hea
lth a
nd n
on-h
ealth
out
com
es
Inpu
ts (w
ithin
eac
h co
untr
y c
onte
xt)
Inte
rven
tions
and
targ
et p
opul
atio
naO
utco
mes
a
nut
ritio
n la
belli
ng p
olic
ies
Targ
et g
roup
Hea
lth o
utco
mes
Beh
avio
urs
Reso
urce
s, s
truc
ture
s, m
echa
nism
s ••
Org
aniz
atio
nal s
truc
ture
s••
Gov
erna
nce
mec
hani
sms
(inc
ludi
ng fo
r acc
ount
abili
ty a
nd
tran
spar
ency
)••
Ava
ilabl
e ca
paci
ty••
Ava
ilabl
e re
sour
ces,
fina
ncin
g m
echa
nism
s••
Mec
hani
sms
to p
rote
ct a
gain
st
confl
icts
of i
nter
est a
nd s
afeg
uard
pu
blic
hea
lth••
Enfo
rcem
ent m
echa
nism
s (i
nclu
ding
cap
acity
to e
nfor
ce),
stra
tegi
es to
min
imiz
e no
ncom
plia
nce
Polic
y co
ntex
t••
Lega
l sys
tem
s an
d op
tions
for
regu
lato
ry in
stru
men
ts (
incl
udin
g ex
istin
g re
late
d po
licie
s on
co
nsum
er p
rote
ctio
n, e
xist
ing
food
la
w)
••Si
gnat
ory
to h
uman
rig
hts
trea
ties
••Po
litic
al e
cono
my
Stak
ehol
ders
nut
ritio
n la
belli
ng p
olic
y de
sign
ele
men
tsIn
gred
ient
list
s••
Qua
ntita
tive
••Fo
rmat
(in
clud
ing
inte
rpre
tive
elem
ents
, leg
ibili
ty,
nutr
ition
al g
roup
ing
– e.
g. s
ugar
s gr
oupe
d to
geth
er)
••Tr
ansl
atio
n in
to o
ffici
al c
ount
ry-s
peci
fic la
ngua
ge
nut
ritio
n de
clar
atio
ns••
Ener
gy a
nd n
utrie
nt c
onte
nt in
clud
ed••
Refe
renc
e am
ount
(e.
g. p
er s
ervi
ng, p
er 1
00
g,
varia
tions
am
ong
cate
gorie
s)••
Form
at (
incl
udin
g in
terp
retiv
e el
emen
ts, l
egib
ility
)••
Tran
slat
ion
into
offi
cial
cou
ntry
-spe
cific
lang
uage
Supp
lem
enta
ry n
utri
tion
info
rmat
ion
(incl
udin
g fr
ont-
of-
pack
labe
lling
)••
Form
at (
e.g.
col
our,
size
, sha
pe, f
ont,
grap
hics
, qu
antit
ativ
e, fo
od o
r nut
rient
s to
incr
ease
or d
ecre
ase)
••N
utrie
nt p
rofil
ing
met
hod
(foo
ds it
app
lies
to, n
utrie
nts
and
food
s in
clud
ed in
the
mod
el)
••Re
fere
nce
amou
nt (
e.g.
per
ser
ve, p
er 1
00
g, v
aria
tions
am
ong
cate
gorie
s)••
Plac
emen
t (e.
g. b
ack,
fron
t, si
de)
Hea
lth a
nd n
utri
tion
clai
ms
••C
ondi
tions
for t
he u
se c
laim
s (e
.g. t
hres
hold
s fo
r use
, he
alth
fuln
ess,
pre
senc
e of
nut
rient
dec
lara
tion)
Lega
l ins
trum
ent:
volu
ntar
y or
man
dato
ry
Entir
e
popu
latio
n
Con
sum
er a
war
enes
s
Con
sum
er u
nder
stan
d-in
g (o
bjec
tive)
Con
sum
er s
earc
h or
use
Die
t (en
ergy
, tot
al fo
od
and/
or n
utrie
nt in
take
, nu
triti
onal
qua
lity)
uni
nten
ded
cons
eque
nces
Prod
uct c
hang
e
Soci
odem
ogra
phic
, soc
iocu
ltura
l and
oth
er fa
ctor
s
Bod
y w
eigh
t sta
tus,
bo
dy m
ass
inde
x
Die
t-rel
ated
N
CD
s (i
nclu
ding
va
lidat
ed s
urro
gate
in
dica
tors
)
Food
cho
ice
a In
terv
entio
ns, t
arge
t pop
ulat
ion
and
outc
omes
sho
wn
in th
e fig
ure
are
thos
e pr
iori
tized
by
the
mem
bers
of t
he W
HO
Nut
ritio
n G
uida
nce
Expe
rt A
dvis
ory
Gro
up (
NU
GA
G)
Subg
roup
on
Polic
y A
ctio
ns in
fo
rmul
atin
g th
e re
sear
ch q
uest
ion
for t
he e
vide
nce
revi
ew to
info
rm th
e gu
idel
ine
on n
utri
tion
labe
lling
pol
icie
s.
Food
pur
chas
e

5
methodology
The review of contextual factors for nutrition labelling policies was conducted in line with the requirements of the WHO guideline development process, taking into consideration the complexity of the policy interventions (19, 21). Using best-practice methodologies for systematic reviews, rapid reviews and scoping reviews, the review process sought to respect the key principles of knowledge synthesis. These include a clear statement of objectives, predefinition of eligibility criteria, assessment of the validity of findings, and systematic presentation and synthesis of results.
Framework and guidance questions
A framework was developed to guide the review process (Annex 1). This was based on the guidance in the WHO Handbook to consider social determinants of health in the guideline process (18), the relevant decision criteria listed in Table 10.1 of the WHO Handbook (19), and the discussions at the first meeting of the NUGAG Subgroup on Policy Actions (on 11–14 December 2018 in Geneva, Switzerland). The review for nutrition labelling policies includes all factors (and criteria) listed as relevant for determining the direction and strength of recommendations in Table 10.1, with the exception of the “certainty of evidence”, which was assessed through the systematic review on the effectiveness of such policies on selected health and non-health outcomes. Building on evidence to decision frameworks proposed by the WHO Guidelines Review Committee (19, 20), guidance questions and search terms were developed to inform each of these criteria.
The factors fall under the broader categories that will be used to inform the discussion on the guideline and decisions on the strength of the recommendations to be formulated by the WHO NUGAG Subgroup on Policy Actions for each of the three policy guidelines:
ÚÚ Factor 1 – values, focusing on health and non-health outcomes;
ÚÚ Factor 2 – resource implications, including the costs and cost-effectiveness of interventions, as well as a description of the use of revenue and impacts on productivity;
ÚÚ Factor 3 – equity and human rights, focusing on health equity;
ÚÚ Factor 4 – acceptability, reflecting the perspectives, attitudes and opinions of consumers, government and industry, and the support of these stakeholders for nutrition labelling policies; and
ÚÚ Factor 5 – feasibility, focusing on the feasibility of developing, implementing, administering, monitoring and evaluating nutrition labelling policies.
literature search
Types of literature to inform the review included systematic reviews, primary studies and grey literature.
Only literature published in English was included. Editorials, commentaries, industry statements, blog posts, newspaper articles, posts from social media outlets and so on were not included in the review. Other relevant inclusion and exclusion criteria are listed in the following sections. In addition to the search strategies listed below, the review also applied the “snowballing technique” – that is, searching reference lists of eligible literature. This is a recommended method to identify additional relevant literature when conducting scoping reviews and rapid reviews (22). Date of publication was
MeTHOdOlOGy

implementing nutrition labelling policies
6
restricted to 2004, when the WHO Global Strategy on Diet, Physical Activity and Health (23) was endorsed. Initiatives that have occurred since 2004 include resolution WHA 63.14 endorsing the Set of Recommendations on the Marketing of Foods and Non-Alcoholic Beverages to Children (24), the Global Action Plan for the Prevention and Control of Noncommunicable Diseases 2013–2020 (25), and the Comprehensive Implementation Plan on Maternal, Infant and Young Child Nutrition (26), which all recommended nutrition labelling policies.
Systematic reviews
Systematic reviews were searched for in the Cochrane Library, the Campbell Library and PubMed.
Primary studies
Primary studies were searched for in PubMed. A total of 11 searches were conducted for the review of nutrition labelling policies. All searches were made up of three parts: policy search terms, decision criteria search terms and exclusion terms. Part 1 included the search terms used for the relevant policy action, and were used across all searches for that particular policy action. Initially, the guidance questions were written to ensure that the decision criteria search terms (Part 2) could adequately identify literature that could inform each of the decision criteria. As the review progressed, a few of the guidance questions and searches were combined to yield a total of 11 different searches. Another reason for having multiple searches rather than a single search related to the combination of search terms needed. For example, to inform the criterion on development and implementation for Factor 5 (feasibility), it was decided that studies should include the MeSH term “Health Policy” together with different forms of the words “develop” or “implement” in the title or abstract. To make it feasible for one reviewer to scan and retrieve the results of all these searches (with oversight by, and consultation with, a second reviewer), a list of exclusion terms was added (Part 3) to exclude types of studies that were not relevant but were often part of the list of search hits (e.g. studies on labelling of alcoholic beverages).
Finally, studies identified through each of the 11 searches informed multiple decision criteria. For example, some studies identified as part of the search for the criterion on development and implementation for Factor 5 (feasibility) also contained findings relevant to the criterion on acceptability to stakeholders for Factor 4 (acceptability). If primary studies identified as relevant were part of systematic reviews also deemed relevant, the primary study was not included unless it contributed important findings not captured by the systematic review. No publication date restriction was applied.
Both qualitative studies (e.g. stakeholder interviews, focus groups, open-ended consumer surveys and interviews) and quantitative studies (including modelling studies of non-implemented polices) were included. In the WHO guideline development process, qualitative studies provide important insights when assessing the values, perspectives and opinions of stakeholders, and may complement quantitative studies in informing acceptability of interventions and implementation considerations (27–29). Thus, additional searches were conducted in JSTOR and Scopus (databases recommended by NUGAG members, specifically for qualitative research) to inform Factor 1 (values) and Factor 4 (acceptability).
Grey literature
In addition to peer-reviewed journal articles (searched for using PubMed, Scopus and JSTOR), grey literature was also included in the review. Different search strategies were applied to identify relevant grey literature, including strategically searching for literature through relevant source sites

7
(listed below). Types of grey literature retrieved and included in the review included reports, articles, reviews, case studies, policy briefs and, for human rights, declarations and constitutions.
Publications available through the WHO Institutional Repository for Information Sharing:
ÚÚ WHO reports, case studies and policy briefs, published either by WHO headquarters or at a regional level. This also included literature developed and published with the support of WHO but where WHO was not the primary author.
Publications in journals by WHO Regional Offices:
ÚÚ Articles published in the Bulletin of the World Health Organization, the WHO South East Asian Journal of Public Health, the Pan American Journal of Public Health, the Eastern Mediterranean Health Journal and Public Health Panorama.
Publications by other united nations (un) organizations:
ÚÚ UN General Assembly documents, declarations and constitutions, including General Comments on the Convention on the Rights of the Child published by the Committee on the Rights of the Child, reports by the Special Rapporteur on the Right to Food and the Special Rapporteur on the Right to Health, and literature published by the UN Standing Committee on Nutrition
ÚÚ Publications by the United Nations Children’s Fund (UNICEF)
ÚÚ Publications by the Food and Agriculture Organization of the United Nations.
Publications by other global intergovernmental organizations and research institutions, including:
ÚÚ World Cancer Research Fund International
ÚÚ NCD Alliance
ÚÚ Organisation for Economic Co-operation and Development (OECD)
ÚÚ World Obesity Federation.
Government reports
Government reports on implemented policies in a given country were considered relevant data sources by NUGAG members, as they may provide additional evidence for the resource implications, acceptability and feasibility of policies.
Because of resource constraints, it was not possible to conduct a comprehensive search for government reports. Therefore, a strategic, targeted search for government reports was conducted based on the following two criteria:
ÚÚ knowledge of existing policies, policies in a development phase1 and ceased policies at national or subnational level, informed by evidence retrieved from peer-reviewed journal articles and other grey literature, as well as suggestions, inputs and advice received from NUGAG members and WHO regional advisers; policies, whether existing or in a development phase, must be government led; and
ÚÚ use of English language on government sites and in government reports.
For the purpose of this review, government reports were defined as reports authored, co-authored or commissioned by government departments or ministries. Examples include self-evaluations,
1 To be eligible for inclusion as a “policy in a development phase”, there must be official records of government-led action or consultations with the objective of drafting or implementing the respective policy.
MeTHOdOlOGy

implementing nutrition labelling policies
8
implementation evaluations, stakeholder consultations, public consultations, treasury statements, impact analyses and cost analyses. To be eligible, reports had to:
ÚÚ be publicly available in full-text versions on government websites; and
ÚÚ provide information relevant to Factor 2 (resource implications), Factor 3 (equity and human rights), Factor 4 (acceptability) or Factor 5 (feasibility), for the respective policy guideline.
An attempt was made to identify government reports from at least two countries in each of the six WHO regions from both low- and middle-income countries (LMICs) and high-income countries (HICs).1
The search for government reports was conducted in Google by:
ÚÚ using a list of search terms specific to each policy guideline; for labelling policies, these were “food labelling” OR “nutrition labelling” OR “nutrition fact” OR “nutrition facts” OR “nutrient declaration” OR “nutrient declarations” OR “nutrition claim” OR “nutrition claims” OR “health claim” OR “health claims” OR “front-of-pack” OR “front of pack” site:x filetype:pdf”
ÚÚ if available, using the title (or abbreviation) of an implemented policy in addition to the search term; however, for some policy guidelines, including title of policies was not applicable (e.g. when searching for reports on nutrient declarations), in which case only the list of search terms was used;
ÚÚ restricting hits to government URLs of the countries included in this review;2
ÚÚ restricting hits to pdf files (filetype:pdf);
ÚÚ screening the first 100 hits sorted by relevance; and
ÚÚ using snowballing3 as needed to retrieve other relevant government reports for the identified country.
Screening, data extraction and synthesis
Titles and abstracts of studies were screened by a single reviewer. Studies identified as relevant were screened by reading the full text, and one reviewer critically appraised the identified literature. A charting record was kept describing characteristics of the included studies and the key information relevant to the guidance questions and decision criteria. A narrative synthesis for each factor was written. A second reviewer oversaw screening, data extraction and synthesis.
1 WHO groups countries into LMICs and HICs using the World Bank income classifications. 2 For the countries search in this review, the following government sites were used: Australia (site:gov.au), Canada
(site:canada.ca), France (site:gouv.fr), Ireland (site:gov.ie), Jamaica (site:gov.jm), Kenya (site:go.ke), New Zealand (site:govt.nz), South Africa (site:gov.za), Sri Lanka (site:gov.lk), United Kingdom (site:gov.uk) and United States (site:fda.gov and site:usda.gov).
3 Snowballing involves seeking out other relevant documents identified in the screened government reports.

9
factor 1. values
This section presents a narrative synthesis of literature identified as relevant to the importance to affected populations (those affected by exposure and/or outcome) of the critical and important health outcomes of implementing or not implementing nutrition labelling policies. These include body weight status and body mass index (BMI), and diet-related NCDs (including validated surrogate indicators). For the purpose of this review, “value” is also interpreted as a belief or a perception the affected population holds towards the health outcomes.
An in-depth exploration of how food values are shaped is beyond the scope of this review. However, it is important to recognize that values are central to consumers’ food choices, and that they go beyond the taste, safety, healthiness, convenience and price of foods. Values are shaped, for example, by cultural, social and environmental beliefs. Aspects relating to environmental concerns, including how foods are produced and distributed, shape food consumption values. From a rapid literature search on consumer values and labelling, much of the identified literature related to how consumers feel – for example, about the origins of the food they buy, and how and under what conditions it is produced. A government review on food labelling found the most frequently raised consumer values to be the welfare of animals, religious beliefs, environmental issues, human rights, methods of production and the country of origin of food products (30). However, in line with the scope of the guideline, which is informed by this review and the systematic review on the effectiveness of nutrition labelling, such non-nutrition labelling is excluded.
The value that the population holds towards the intervention itself is synthesized in the section on acceptability of the intervention to the public and consumers (Factor 4). Limited information was found on consumer views about the importance of accurate information on labels, which is also further discussed in the section on acceptability.
To the extent possible, this section also presents evidence on how values vary within and across population subgroups, and the uncertainty of the importance or variability of the values.
Values related to body weight/BMI/obesity and diet-related nCds
In HICs, overweight and obesity are generally perceived negatively and as a serious health problem by the majority of adults and children (31–39). Some studies have identified differences between subgroups. For example, women and parents in Australia were significantly more likely to consider overweight and obesity to be a serious issue than men and adults without children, respectively (35). In the United States, a study found that adults generally perceived childhood obesity as more serious than adult obesity. Compared with adults residing in communities of high socioeconomic status (SES), those residing in communities of lower SES were significantly more likely to perceive obesity as a very serious problem (34). Other studies from HICs have compared values and body size preferences between women of different ethnicity. For example, a study in the United Kingdom found that women of Caribbean and African descent, despite recognizing the risk of weight-related health problems, expressed less concern about weight in general, and had more favourable attitudes towards fatness and being overweight than Caucasian women of British descent (40). A United States study found similar differences, but also identified African Americans as being significantly less likely than whites or Hispanics to view obesity as a health problem (41).
FACTOR 1. VAlueS

implementing nutrition labelling policies
10
In some cultures, particularly in LMICs, a large body size is often valued as indicating good health, well-being and wealth (42–47). For example, a study from Indonesia found a positive association between self-reported happiness and obesity, concluding that “fatness was admired” and that “thinness [was] a constant reminder of the immediate possibility of hunger and starvation” (42). Multiple studies from the African region provide similar findings. For example, indigenous men and women in Nigeria (44), adult Saharawi refugees in Algeria (45), black women in South Africa (46) and women in urban Senegal (47) all reported preferring a large body size (often overweight on the basis of BMI category; BMI >25 kg/m2). Overweight individuals in the Nigerian population generally accepted their excess weight and wanted to remain overweight, while individuals of normal weight tended to prefer a bigger size – particularly when dissatisfied with their current body image (44). The study from Algeria presented very similar results, but also concluded that younger participants (18–25 years old) had less of a desire to be overweight or obese than those who were older (45). In Senegal, study participants’ definitions of overweight and normal weight differed substantially from BMI health definitions: one third of the sample regarded the overweight or obese BMI category (illustrated through images) as normal, and over one third of women with BMI >25 kg/m2 wanted to gain more weight (47). However, although most participants regarded the overweight silhouettes (BMI >25 kg/m2) positively, people with obesity (BMI >30 kg/m2) shown in images were regarded as “greedy and having a large appetite”, indicating a shift in attitudes (47). Overweight in men was valued less positively than in women, with the former cited as a “sign of laziness” in a Zambian study (47, 48). The aversion towards a thin (normal weight) figure and the preference towards overweight in some African cultures have been linked to poverty and the presence of diseases. For example, a recent qualitative study from Zambia found that thinness or weight loss was valued negatively, and often associated with diseases such as HIV/AIDS (48). Other studies from sub-Saharan Africa have reached similar conclusions (43, 49–52). However, some studies have identified a change in values towards “Westernized” perceptions of an ideal body size in accordance with normal weight BMI (53, 54). Similar developments have been identified in the Pacific (36, 55). Whereas overweight traditionally was associated with high SES, authority and wealth among Pacific islanders (56, 57), more recent studies have identified how attitudes to body weight and size have changed over time, with an increased affinity for less overweight figures (36, 55). Economic development, globalization, and increased awareness of the association between overweight, obesity and diet-related NCDs are cited as reasons for the shift in values and preferences (36, 55). Likewise, studies from the eastern Mediterranean region have testified to a similar development, with the adoption of Western values of “thinness [as] a sign of beauty and health” (58) – concurrent with increased concerns and dissatisfactions with body weight, especially among the younger population (59, 60).
Whereas the values towards body weight status, undernutrition and obesity vary (as summarized above), diet-related NCDs are, based on the identified studies, perceived negatively and as health problems across both regions and subpopulations (48, 50, 51, 61).
Evidence exists on population subgroups’ perceived determinants of body weight status, obesity and diet-related NCDs, including awareness of risk factors (34, 36, 37, 41, 62–68). Reporting on this was deemed outside the scope of this review. Importantly, however, the belief or opinion that the food environment is a determinant of body weight status (a factor beyond individual control) or that the government and food industry bear some responsibility was associated in studies with higher acceptability for government policies to prevent and treat obesity (69–71). This association is reviewed below in the section “Acceptability of the intervention to the public and consumers” (under “Factor 4: Acceptability”).

11
factor 2. resource implications
This section presents a narrative synthesis of literature identified to assess the resource implications of nutrition labelling policies. Relevant criteria for resource implications included the ratio of costs and benefits for the intervention, the costs of the intervention in the long and short terms, and the economic impact of the intervention on national and global economies.
Nine reports and five modelling studies were identified to assess the resource implications of nutrition labelling policies. The policies modelled – including underlying assumptions, target populations, effect sizes and outcome measures – varied. All studies found the modelled policy to be a cost-effective policy action for the countries examined. No studies to the contrary were identified. Details for each study are presented below.
Two studies from Australia modelled the cost-effectiveness of two different FOPL systems: a (mandatory) traffic-light system (72) and the Health Star Rating (HSR) system (a voluntary, government-led FOPL system, implemented in Australia since 2014) (73).
The cost-effectiveness study of a hypothetical mandatory traffic-light FOPL system assumed a 10% shift in consumption towards healthier options in four food categories (breakfast cereals, pastries, sausages and pre-prepared meals) in 10% of the adult population (aged 20 years and above) in Australia in 2003. Resulting reductions in energy intake and population body weight, and subsequent impacts on DALYs were estimated. The cost of implementing the traffic-light FOPL system was estimated to be A$ 81 million (a one-time cost), which comprised costs to the government (including costs of implementing, administering and enforcing the system, and a social marketing campaign to create awareness of the policy) and costs to the food industry (including the cost of changing labels). Costs involved in setup, and research and development of the traffic-light FOPL system (e.g. for developing the nutrition criteria underlying the system) were excluded. The majority of the costs of the intervention (approximately 75%) fell on industry, and the authors expected that these costs were likely to be passed on to consumers. Future health sector costs saved because of the reduction in obesity-related conditions (caused by reductions in population body weight) as a result of the policy were estimated to be A$ 455 million. DALYs averted as a result of reductions in population body weight were estimated to be 45 100 DALYs. The authors concluded that the traffic-light FOPL system, modelled in the Australian context, was a cost-effective intervention for obesity prevention (72).
The other Australian study modelled the cost-effectiveness of the implemented HSR using both the actual voluntary rate of implementation of the system (estimated uptake of 7% across all pre-packaged products) and a scenario where the system was implemented on a mandatory basis (uptake of 100% across all pre-packaged products). Costs and effects of the two intervention scenarios were modelled for the 2010 Australian population over a lifetime (up to 100 years or death) and compared with a “no intervention” scenario. Implementation costs, including costs to industry and the government,1 were estimated to be A$ 46 million for the voluntary implementation and A$ 686 million for the mandatory implementation. Assuming that 100% of observed changes in energy density (reformulation) of pre-packaged foods after implementation of the policy were attributable to the intervention, changes in energy density of pre-packaged foods consumed and
1 Costs to industry are those related to implementation (i.e. costs of redesign and change in volume, and time required for changes to product labels) and ongoing costs (i.e. monitoring and additional requirements specific to each product, such as change in packaging materials). Costs to government are those related to implementation (i.e. education and promotion), as well as ongoing costs of monitoring and evaluating the HSR system.
FACTOR 2. ReSOuRCe IMPlICATIOnS

implementing nutrition labelling policies
12
reductions in population body weight were modelled for both scenarios. The HSR system was estimated to be cost-effective under both the voluntary and mandatory implementation scenarios, with a mean incremental cost-effectiveness ratio1 (ICER) of A$ 1728 per health-adjusted life year (HALY) gained for the voluntary scenario and a mean ICER of A$ 4752 per HALY gained for the mandatory scenario. However, the authors noted that the level of uptake of the HSR system was key to the magnitude of intervention impacts and the uncertainty around estimates. Results from sensitivity analyses indicated that the cost-effectiveness of the voluntary implementation was sensitive to the proportion of reformulation attributed to the HSR system, which should be at least 11% for the voluntary scenario to be cost-effective. HALYs and costs saved in the mandatory scenario exceeded those in the voluntary scenario, but the authors concluded that both “intervention[s] demonstrate[d] significant potential for cost-effectiveness”, as modelled in the Australian context (73).
Information from government reports, including a 5-year evaluation (74), provide insights into the funding of the HSR system. Although industry bears a large proportion of the implementation cost, there are costs to the government. Government contributions to the HSR system are co-funded by the Australian Government, the Australian states and territories, and the New Zealand Government. Each jurisdiction contributes to funding for administrative and evaluation activities. Australian jurisdictions provide additional funding for monitoring and marketing in Australia, and the New Zealand Government funds monitoring and marketing in New Zealand. A large part of the government contributions are spent on public and consumer education campaigns to promote uptake of the system (74).
A cost schedule prepared for Food Standards Australia New Zealand (the regulatory agency) for changing labels was identified through the search for government reports. This estimated total costs of making minor, medium and major changes2 to the label of a range of packaging. The costs increased according to the level of change from approximately A$ 2900 to more than A$30 000 per stock-keeping unit (75). Another report from Australia estimated key costs associated with the HSR system, which included the costs for the HSR ($500–900 per product), FOPL redesign ($2000–3000 per product) and FOPL reprinting costs (depending on the complexity of print plates for labels, $350–5000 per plate) (76).
Three studies using data from multiple LMICs and HICs have estimated the cost-effectiveness of different public health strategies to prevent obesity, including mandatory nutrition labelling policies (77–79).
Using data from a set of six countries with a high burden of diet-related chronic diseases (Brazil, China, India, Mexico, Russian Federation and South Africa), and England for comparison purposes, a study assessed the cost-effectiveness of mandatory food labelling3 by modelling changes in energy intake, body weight and cost of the intervention per capita. Cost of the intervention per capita was highest in England (US$ 1.05), and lowest in China and India (both US$ 0.05). DALYs saved per million population were highest in Russian Federation (1176 DALYs) and lowest in Mexico (358
1 Incremental cost-effectiveness ratio (ICER) is a statistic used in cost-effectiveness analysis. It is defined as the difference in cost between two scenarios divided by the difference in their effect. For this study, the two scenarios were 1) the HSR FOPL system (either voluntary or mandatory) leading to reductions in population body weight for the 2010 Australian population, and 2) exposing the same population cohort to a “do nothing” scenario, with population weight remaining unchanged in the absence of any intervention. To obtain the ICERs for each implementation scenario, the incremental net costs were divided by incremental HALYs for the voluntary and mandatory scenario, respectively. The intervention was considered cost-effective if resulting ICERs were below the Australian willingness-to-pay threshold of A$ 50 000 per HALY.
2 Minor: changes to text and one printing plate only; medium: changes to text and/or label layout, and changes to three printing plates and proofing; major: changes to text and/or label layout, changes to six printing plates and proofing, and changes to packaging shape/size/design.
3 Food labelling was the term used in the study. The study did not further specify the type of food labelling modelled.

13
DALYs). Cost-effectiveness ratios, expressed in US$ per DALY averted, represented the net cost of gaining one additional year of healthy life, relative to a no-prevention or treatment-only scenario. The cost-effectiveness ratios differed between the seven countries, with the highest ratio in England (12 577) and the lowest in China (71), but ratios for all countries were below the established cost-effectiveness thresholds (indicating the point at which an intervention would no longer be cost-effective) after 20 years. After 50 years, DALYs averted had increased and cost-effectiveness ratios had decreased for all countries. Thus, implementing mandatory food labelling was estimated to be a cost-effective public health strategy in all seven countries (78).
A simulation study by the OECD on mandatory food labelling (further described as labels “reporting easy to read ‘nutrition facts’ [that] helps consumers choose healthier diets” and thus categorized in this review as FOPL) also assessed the cost-effectiveness of the intervention by modelling changes in energy intake, population body weight and cost of the intervention per capita in five countries (Canada, England, Italy, Japan and Mexico). The estimated cost per capita of introducing mandatory FOPL ranged between 0.33 and 1.1 US$ purchasing power parities.1 This included costs for basic administration, planning, enforcement, preparation and distribution of posters, and resources needed to manage a food inspection programme. Costs related to packaging, designing and printing of labels, and reformulation of foods, which the authors estimated were likely to be borne by the private sector, were not included. The study did not specify in detail the numbers of DALYs averted, but concluded that the hypothesized policy would be “consistently cost-saving throughout the period covered by the simulation [100 years] in all of the five countries examined” (77). In a recently published analysis of 36 countries (including OECD countries in the European region as well as Australia, Canada, Japan and Mexico; non-OECD Member States of the European Union; and South Africa), the OECD concluded that the cost of implementing mandatory food labelling would be about 40% of the benefit in terms of gross domestic product for all countries examined (79).
A report from Canada referenced earlier cost-effectiveness analyses in which the government calculated the value of its nutrition information initiatives to be about $5 billion over 20 years, as a result of reductions in direct and indirect costs associated with cancer, diabetes, heart disease and stroke. Compared with the cost to industry ($300 million), mandatory nutrition labelling demonstrates significant cost savings overall (80).
To support development of FOPL in Israel, a cost analysis carried out by the Ministry of Health showed that “label changes of food packaging would involve a very small amount of money, with a minimal rise in food costs, and that this was far less than the huge potential benefit to public health” (81).
Some of the government reports noted the costs to industry associated with changing labels (75, 76, 82-86). Direct costs include label design, label production, proofing, package redesign and labour. Costs vary depending on the scale and scope of the changes, as well as the type of packaging (75, 82). Although indirect costs were not included in an estimated cost schedule prepared for Food Standards Australia New Zealand for food label changes, some of the indirect costs noted were write-off costs for stock on hand, labelling life cycle, product testing or related investigation, marketing costs, legal costs, travel costs and additional design costs (75). Costs to businesses associated with the HSR system in Australia also included efforts to calculate the star ratings of products (76). These costs are higher for small businesses that have limited in-house capacity to calculate ratings, and to redesign and produce new labels (76). Manufacturers who wish to include nutrition- or health-related claims incur additional costs, including compliance testing and validation (83). Changes to labels may also add costs for nutrient analysis (e.g. calculating added sugar content of foods) (82).
1 Purchasing power parities are rates of currency conversion that try to equalize the purchasing power of different currencies, by eliminating the difference in price levels between countries.
FACTOR 2. ReSOuRCe IMPlICATIOnS
implementing nutrition labelling policies
14
factor 3. equity and human rights
This section presents a narrative synthesis of literature identified as part of separate searches conducted for two criteria: universal human rights standards, and impact on (health) (in)equity and (health) (in)equality (including social and socioeconomic impact). The first of these criteria includes, to the extent possible based on the identified literature, both an assessment of whether nutrition labelling policies are in accordance with human rights standards (using human rights documents such as conventions, declarations and general comments) and a synthesis of studies examining nutrition labelling policies from a human rights perspective.
Equity in this review is defined as a situation in which there are no unfair or avoidable differences in health among population groups irrespective of income, gender, age, race, ethnicity, migratory status, disability, geographic location and other characteristics. Equality in this review is defined as the absence of differences, variations and disparities in living conditions of individuals and groups.
universal human rights standards
Human rights define the entitlements of all human beings and the corresponding obligations of governments as the primary duty bearers. Human rights have been negotiated by governments and agreed upon in human rights treaties, such as conventions and covenants, which are legally binding to states that are parties to them (18, 87). This section describes whether nutrition labelling policies are in accordance with human rights standards and may affect human rights.
Accordance with international human rights standards
The right to health comprises both freedoms and entitlements. Freedoms include the right to control one’s health. Entitlements include the right to a system of health protection and promotion that gives everyone an equal opportunity to enjoy the highest attainable level of health (18). The right to health is well established in international treaties such as the Universal Declaration of Human Rights; the International Covenant on Economic, Social and Cultural Rights (ICESCR); the Convention on the Rights of the Child; and major regional human rights agreements (87–92). On a national level, many countries have recognized the right to health in their constitutions (93, 94). The right to food is recognized in several instruments under international law; in particular, the ICESCR, and pursuant General Comments on the articles of the ICESCR, provide a legal framework for a rights-based approach to optimal nutrition and health (89, 95, 96).
Nutrition labelling policies are relevant to the right to health, the right to food and the right to information, which are interdependent. The right to information is encapsulated within the right to freedom of expression (87). Specifically, on nutrition labelling policies, the Special Rapporteur on the right of everyone to the enjoyment of the highest attainable standard of physical and mental health (2008–2014) called on governments to adopt, implement and enforce nutrition labelling policies with a view to respect, protect and fulfil the right to health (97). The Special Rapporteur also recognized the role of the food industry in the growing burden of diet-related NCDs, and called on the industry to ensure transparency of nutrition information and composition in meeting its responsibility to respect the right to health (97).
Governments and nongovernmental organizations (NGOs) have used the human rights argument to advance policies to promote healthy diets, including nutrition labelling policies. For example, human

15
rights defenders from civil society organizations in Colombia have lobbied in support of legislative proposals within the Colombian Congress aimed at addressing high obesity rates by using FOPL, and regulating the marketing of ultra-processed food products directed at children and adolescents (98). A report by the European Commission stated that one of the “main objectives of the legislation on food labelling [is] to enable consumers to make informed, safe, healthy and sustainable choices” (99). More generally, the social gradient of diet-related NCDs1 (which nutrition labelling policies have the potential to narrow) acts as a rationale for governments to view interventions to tackle obesity as part of their efforts to protect the health of vulnerable groups and prevent the widening of health gaps between population groups (77).
Studies or reports examining nutrition labelling policies from a human rights perspective
No primary studies were identified that examined nutrition labelling policies from a human rights perspective. However, a recent government report on consumer views from the United Kingdom found that participants felt positive about the trend towards increased information and education about food, and widely praised the increased clarity in labelling (for allergies, fat, salt, sugars and additives) (100). Such information was considered by consumers to be a right, even if they chose to ignore the information. Consumers expressed a desire for the food industry to provide additional information to support decision-making on a wider range of food issues, such as the environmental impacts of production (100, 101).
Impact on (health) (in)equity and (health) (in)equality
Few studies were identified that specifically examined the impact of nutrition labelling policies on health (in)equity or health (in)equality. This likely reflects the research gap in this area. For example, a systematic review conducted in 2015 on the impact of different interventions to promote healthy eating on socioeconomic inequalities found no relevant studies on nutrition labelling (termed as “prescriptive interventions” in the review) (102). Similarly, a recent Cochrane systematic review on nutritional labelling to encourage purchasing and consumption of healthier foods or non-alcoholic drinks concluded that there was a notable absence of evidence on potential moderators of the effect of nutrition labelling on behaviour, particularly the role of SES (103). The authors recommended that studies, at a minimum, report socioeconomic details at the study level, and preferably stratify results by SES subgroups (103).
A few systematic reviews have identified differences across population groups in awareness, understanding and use of nutrition labelling. Such differences may either increase or reduce existing inequities and inequalities. Research has found consumer use and understanding of nutrient declarations to be poor, particularly for groups of low SES, because of the complexity of numerical information, small print size and positioning of information on the back or side of pre-packaged foods (104–107). Although limited evidence exists specifically examining literacy and numeracy in relation to the use of nutrition labels (108), one review concluded that nutrition information panels are most used by, and useful for, those with higher levels of literacy in general (109). As a result, the implementation of FOPL to provide supplementary information could potentially help reduce any health inequities resulting from having only nutrient declarations, nutrition information panels or ingredient lists (109, 110), because people who benefit the most from FOPL may be people with poorer health literacy, and vulnerable populations who are at higher risk of diet-related NCDs (111, 112).
1 The social gradient of health (including diet-related NCDs) refers to the phenomenon whereby individuals of lower SES have worse health (and shorter lives) than individuals of higher SES. For diet-related NCDs, individuals of lower SES are at higher risk for excess weight gain, obesity and NCDs.
FACTOR 3. equITy And HuMAn RIGHTS

implementing nutrition labelling policies
16
However, there are still potential equity concerns for FOPL based on differential awareness, understanding and use. For example, a systematic review on the effects of FOPL on consumers’ purchasing behaviour found that individuals who were less nutrition conscious, individuals of lower SES, individuals with higher BMI, and families with children living in their households were all less likely to report using FOPL than their counterparts (113). Another systematic review concluded that use of FOPL varied considerably across subgroups, with lower use among children, adolescents and older obese adults (114). Similarly, a systematic review on consumer understanding and use of FOPL in HICs found that men were less likely to report an interest in reading nutrition labels than women, and that people with a higher income and with a higher level of educational achievement were most likely to report looking at nutrition labels (109). Additionally, consumers with a special interest in, or positive attitude to, diet and health were more likely to report higher levels of label reading (109).
The different types of existing FOPL also pose an equity question. As with the use of nutrient declarations or ingredient lists, FOPL relying on a certain level of numeracy and health literacy may pose a disadvantage to some consumer groups (109, 114–117). For example, a study on the use of FOPL in Germany, Italy, the Netherlands and the United Kingdom found that consumers who scored lowest on perceived nutritional knowledge and label reading understood the more detailed FOPL types less well than participants who perceived themselves as highly knowledgeable and reported always reading labels (118). Research in the United Kingdom found evidence of inequality associated with FOPL, in that those from more deprived backgrounds were less likely to use the multiple traffic-light system (119). In Australia, stakeholder arguments for a mandatory interpretive scheme included the importance of having food labels that could be understood by consumers with varying degrees of literacy and numeracy, to help overcome health inequities in the population (30).
17
factor 4. acceptability
This section presents a narrative synthesis of the literature identified to assess the acceptability of nutrition labelling policies. Separate searches were conducted for the following criteria: acceptability to stakeholders (divided into government and policy-makers, the public and consumers, and industry), sociocultural acceptability and environmental acceptability. For the purpose of this review, “acceptability” was interpreted as support for a nutrition labelling policy, or a preference for such a policy compared with other measures. For the public, consumer demand, attitudes to nutrition labels, reported willingness to use nutrition labels and overall consumer satisfaction with implemented nutrition labels were also interpreted as “acceptability”.
The purpose of the review was to convey the degree of overall acceptability of nutrition labelling policies, rather than the acceptability of specific labelling systems and their components. However, where the available studies examined acceptability of a specific nutrition labelling policy, such information is included.
Acceptability to stakeholders
In general, all stakeholders seem to accept nutrition labelling policies, including nutrient declarations and supplementary nutrition information in FOPL. However, acceptability greatly depends on the type of nutrition labelling proposed; particularly for industry, acceptability also depends on the regulatory measure taken (i.e. whether the policy is mandatory or voluntary). Most of the literature found on “acceptability” summarizes the views of industry stakeholders and their attempts to weaken proposed policy options. The review of selected government sites found summary reports on public consultations and stakeholder surveys (86, 119–133) that were relevant to assessing the views of stakeholders, including industry, on nutrition labelling policies. The views of stakeholders summarized in the government reports are largely consistent with the outcomes of the studies described below.
Acceptability of the intervention to government and policy-makers
The existence of nutrition labelling policies in many countries speaks to the acceptability of such policies to governments and policy-makers. Countries have made progress on implementing nutrition labelling policies, as summarized in the recent GNPR (134). Globally, the most common components of nutrition labelling of pre-packaged foods and beverages were nutrient declarations and lists of ingredients (134). Nutrient declarations were reported by at least 80% of countries in the WHO regions of the Americas, Europe and the Western Pacific, but by less than half the countries in the WHO regions of Africa and South-East Asia (134). Implementation can be voluntary or mandatory, and information on nutrients is often disclosed inconsistently. Measures to regulate or guide nutrition and health claims were usually included in national labelling policies (134). Most nutrition and health claim policies were developed after 2007, with almost a quarter developed since 2013, when the Codex guidelines incorporated nutrient reference values for NCDs. An increasing number of countries are developing and implementing FOPL systems. Most systems reported by countries in the recent GNPR were voluntary, with different formats, graphics, content and underlying nutrient profile models (134). However, more than 30 governments have led the implementation, or supported the development, of FOPL systems (135). Europe, in particular, has a long history of developing and implementing FOPL systems (104, 135).
FACTOR 4. ACCePTABIlITy

implementing nutrition labelling policies
18
Acceptability of nutrition labelling policies to governments and policy-makers appears to be closely linked to factors affecting the feasibility of such policies (see “Elements that support or hinder development and implementation” under “Factor 5: Feasibility”).
A few studies have also reported on acceptability of nutrition labelling policies to governments and policy-makers before implementation of the policies. For example, an improved food labelling system was one of four main approaches suggested by senior representatives from state and territory governments, statutory authorities and NGOs in Australia to promote healthier food environments (136). In a study from Iran, experts in health and nutrition policy-making identified food labelling1 as one the “highest prioritized policies for declining the burden of NCDs in Iran” (137). A study conducted after the implementation of the Australian HSR FOPL on the views of expert stakeholders (in governments, NGOs and academia) on how to decrease consumption of sugar-sweetened bverages (SSBs) among 0–5-year-old children found nutrition labelling of SSBs to be a recommended strategy (138). This finding should be seen in the light of low uptake and limited use of the HSR FOPL on SSBs (139).
In a public consultation on sugar labelling options for pre-packaged products in Australia and New Zealand, government stakeholders were more supportive of declaring added sugars in the nutrition information panel than other options such as advisory labels, pictorial approaches and links to web-based information (120).
Acceptability of the intervention to the public and consumers
Based on the identified literature, nutrition labelling policies are acceptable among the public in both LMICs and HICs (86, 100, 101, 104, 107, 111, 113, 119-121, 123, 125-131, 140–156). Much of the literature assesses the acceptability to the public of FOPL systems, and the majority of studies are from HICs. A number of government reports (n = 14) were identified, mainly from Australia and the United Kingdom, that summarize responses to government-initiated consultations on revising, improving and/or modernizing food labels. The reports asked about “proposed amendments to labels” rather than acceptance of current labels. Overall responses were positive, pointing to a general acceptance of government propositions (and the need to provide even better, clearer and more transparent labels).
Often comparing different systems, recent studies have examined overall consumer acceptability of FOPL. A systematic review concluded that there was strong interest from the public health sector and consumer groups in shifting from complex and confusing to easy-to-understand FOPL that includes images and clear messaging (113). An online survey in Australia found that more than 80% of parents/caregivers of children aged 3–7 years strongly agreed or agreed with the importance of FOPL (149). Another survey from Australia found even higher levels of support for the regulation of food labelling: 97% of the population surveyed reported that government control or regulation of nutrition information on food labels was quite (21%) or very (76%) important; and 93% reported that government control or regulation of a health rating on food labels was quite (24%) or very (69%) important (143). A consumer survey found that most Australians and New Zealanders are interested in standardized nutrition information on food labels and trust the information (125). The study also found that consumers used the “nutrition information panel” and “statement of ingredients” most often when making a first-time purchase, particularly for sugar, fats and sodium. Consumers found these to be understandable, believable, relevant and trustworthy. Nutrition-related claims were of less interest (125).
1 The study defined food labelling as “standard labeling of fat content, saturated and trans-fatty acids, salt, and sugar in food products in order to facilitate consumers’ understanding and literacy”.

19
A French study (conducted before implementation of the Nutri-Score system in 2017) examining the acceptability of FOPL (taking into account “liking”, “acceptance”, “attractiveness” and indicators of perceived cognitive workload) found that consumers preferred FOPL that gave complete, reliable and simplified information on the nutritional quality of foods (150). Also in France, an online petition supporting the Nutri-Score received more than 250 000 signatures from consumers supporting its implementation (151). In a study from New Zealand, the value of FOPL was well accepted by NGO stakeholders (152, 153). A study from Australia found that adult consumers with primary or shared responsibility for grocery purchases for their household strongly supported the introduction of a consistent FOPL system (154). In China, consumer demand for food labels was reported to be a key factor in implementation of the national nutritional labelling policies1 of 2007 and 2011 (155), speaking to the acceptability of these policies. The majority (77.5%) of consumers in eight cities in China considered nutrition information on pre-packaged foods essential (155). Enhanced nutrition labelling, which is already in place in Germany, was supported by the majority of the respondents to a survey as a strategy for obesity prevention (144). The authors of a narrative review on nutrition labelling2 in several countries in Asia, Africa, the Middle East and Latin America3 found that “consumers prefer that pre-packaged foods include nutrition information” (indicating consumer acceptability of nutrition labelling policies), and concluded that consumers in the countries shared preferences and attitudes with respect to labelling, irrespective of region or income classification (145). A study from Uruguay identified high levels of support among adults for an FOPL system consisting of nutritional warnings (148).
Some studies have examined consumer satisfaction with already implemented FOPL, often as part of evaluation programmes (104). In Iceland, Sweden, Norway and the Netherlands, consumer perceptions were generally good; consumers reported high levels of trust in FOPL, ease of use of labels and the existence of FOPL to be positive (104).
Qualitative and quantitative analyses of consumer views on proposed FOPL designs in Australia found strong support for an FOPL system; more than 90% of the consumer sample felt that it was a “good idea” (126, 127).
In a public consultation in Australia and New Zealand on sugar labelling on pre-packaged products, the majority of the stakeholder submissions supported the statement of the problem4 and the desired outcome.5 Many of those who were unsupportive considered the focus too narrow and thought that the scope should be broadened to consider more whole-of-diet issues, and that the desired outcome should be “expanded to include incentivizing product reformulation, support monitoring of the food supply, addressing inequalities or promoting behaviour change”. Of the seven proposed options, consumers were most supportive of pictorial approaches to convey the amount of sugars in a serving of food, as these are simple and easy to understand (120).
An independent review of food labelling commissioned by government in Australia proposed recommendations to improve food labelling law and policies (30). One recommendation was that the declaration in the nutrition information panel of the amount of nutrients per serve should no longer be mandatory unless a daily intake claim is made. Following the proposed recommendation, Food
1 The Chinese Government officially enacted the Regulation on the Management of Food Nutrition Labelling in 2007 and the General Rules for Nutrition Labelling of Pre-packaged Foods in 2011.
2 The review included studies investigating consumer use of, and attitude towards, FOPL and “back of package or BOP labels”. Based on the included studies in the review, this was deemed as encompassing both ingredient lists and nutrient declarations.
3 Botswana, Brazil, Chile, China, Ghana, India, Israel, Lesotho, Malawi, Mauritius, Mexico, Morocco, Nigeria, Pakistan, Russian Federation, Singapore, South Africa, South Korea, Sri Lanka, Thailand, Trinidad, Tunisia, United Arab Emirates
4 Information about sugar provided on food labels in Australia and New Zealand does not provide adequate contextual information to enable consumers to make informed choices in support of dietary guidelines.
5 Food labels provide adequate contextual information about sugars to enable consumers to make informed choices in support of dietary guidelines.
FACTOR 4. ACCePTABIlITy

implementing nutrition labelling policies
20
Standards Australia New Zealand conducted a public consultation and found that most submitters, including consumers, health professionals, food businesses and government agencies, did not support the recommendation to remove the mandatory requirement for per-serving information in the nutrition information panel (128).
A government-led consultation of Canadian parents and consumers in 2014 on how to improve the way nutrition information is presented on food labels found that many consumers report reading one or more parts of a food label when choosing foods, and find the information to be clear and useful. Consumers also reported using the list of ingredients and the nutrition facts table most often (121). In a subsequent consultation, consumer respondents supported government proposals to modernize the food labelling system, including enhancing access to, and understanding of, the information provided on the food label (86).
Reports from the United Kingdom show that consumers generally accept food labels and support improvements to current labelling schemes (119, 123, 129, 130). According to recent government-commissioned research, 80% of consumers look at the FOPL, with 60% sometimes referring to labels and 20% always considering them (119). Labels reported to be preferred by consumers include percentage reference intakes, use of colour-coding and per-portion information (119, 129). The government report noted that the voluntary multiple traffic-light system has proven acceptability with consumers, with 9 in 10 shoppers agreeing that it helps them to make informed decisions when purchasing food (119). Earlier consultations in the United Kingdom (before adoption of the FOPL regulation) found that many respondents thought that the different types of FOPL on the market were confusing, and favoured a clear and consistent approach (123, 129). Research was conducted through a series of workshops with 64 participants from England, Northern Ireland and Wales to understand consumers’ priorities for transparency with regard to food issues, including product labelling, and how they could be effectively engaged (130). Participants spoke in broadly positive terms about food labelling in the United Kingdom, including the traffic-light system, which was well known and praised (130).
Consumer research in Northern Ireland found that participants generally favoured increased information on labels, especially portion size and nutrition information, particularly for fat, sugars and salt. Participants also expressed a need for greater visualization and simplification of data to encourage more informed, habitual use of food labels. One of the main barriers to using labelling information was lack of understanding and inability to process inconsistent information. Participants wanted to avoid complicated calculations while making food purchasing decisions, and expressed a need for clearer information and better visualization of the information (131).
In a study on perceptions of nutrition and health claims, almost all participants believed that the government should play a role in setting standards for the use of claims to ensure that they are legitimate and correct (156).
difference in acceptability among population subgroups
Some studies identified variations by sociodemographic characteristics in acceptability of different nutrition labelling policies. For example, 63% of the respondents in a United States study would support a policy requiring warning labels on foods with high content of sugars or fat; respondents having a higher education than an undergraduate degree were most likely to support this policy (71). No difference in support according to income was found, but Hispanics were more likely to support the policy than non-Hispanics (71). A study from Uruguay found no difference in support for warning labels as an FOPL system across sex, age or SES (148). However, willingness to take warning labels into account when choosing food was lower for younger adults (18–24 years) than for older adults (148). An Australian study found that support for government regulation of nutrition

21
information on food labels was significantly lower among people who did not live in metropolitan areas, and people who reported that they did not pay “a lot of attention to the health aspect of their diet” (143). Another study from Australia found consistent trends in the preference for different FOPL types across age, sex, SES and BMI (110). A study from Turkey found a positive association between education levels of study participants and their support for FOPL (64).
In a study on the perspectives of Māori, Pacific island and low-income New Zealanders on FOPL, most participants (12 of 14) from the low-income focus group reported using nutrition labels regularly to differentiate between similar products, and to check for healthy and unhealthy ingredients. There was general agreement among participants that the single traffic-light system contained insufficient information to make an informed choice, yet multiple traffic lights caused confusion. Most participants preferred a combination of information on percentage daily intake and simple traffic-light information, but cost, lack of time and habit were identified as barriers to using nutrition labels. In contrast with the low-income group, the majority of Māori and Pacific island participants reported little use of nutrition labels, which suggests possible ethnic differences in label use (157). Evidence from the United Kingdom suggests a level of inequality in that the multiple traffic-light labels are less likely to be used by those from more deprived backgrounds (119).
Acceptability associated with view on food environment
Perceived negative impact of an unhealthy food environment has been linked to increased support for government policies to promote a healthy food environment. Much more evidence on this link is available in relation to policies to restrict marketing of food and non-alcoholic beverages to children, and fiscal and pricing policies (see reviews of decision criteria for these). However, a few studies provided insights on this link in relation to nutrition labelling policies (70, 71, 158). For example, a United States study found that framing obesity as a result of a “toxic food environment” was positively associated with support for requiring warning labels on foods with high sugar or fat content (71). The authors of a study from the Netherlands found that, for all examined intervention strategies for healthy food choices, including FOPL and “back-of-pack” labels (no details were provided), the perceived personal and societal effectiveness of the intervention, and its perceived fairness, affected acceptance (158). A related study by the same authors examined consumer acceptance of traffic-light FOPL. The majority of participants agreed that the “source of interventions should be autonomous and independent of the food industry” to increase the fairness of this intervention (70). The authors also reported that participants who perceived themselves to be solely responsible for food choice thought that consumers should not be told what is best for them, as that would imply that they were incapable of making their own choices (70). Also, participants who acknowledged a societal responsibility in personal food choice viewed governmental participation as important for the legitimacy of interventions (70). This finding is similar to a review on FOPL policies in the WHO European Region, which found that European consumers perceive commercially based FOPL systems as less credible than government-led FOPL policies (104).
Acceptability of nutrition labelling policies compared with other policies
A number of studies have compared support for different population-level regulatory approaches to obesity prevention. These studies have consistently found nutrition labelling policies to rank higher than, for example, taxes on SSBs and unhealthy foods, or marketing restrictions (64, 140, 141). For example, a study from Australia examining the extent to which “an informed group of citizens” (a so-called citizens’ jury) would support regulatory approaches to address childhood obesity found that mandatory “interpretive” FOPL was ranked second highest of all interventions (higher than fiscal policies and regulation of food marketing) (141). Similarly, another study identified much higher support for mandatory nutrition labelling (90% of the sampled participants aged 15 years and
FACTOR 4. ACCePTABIlITy

implementing nutrition labelling policies
22
over) than for taxes on unhealthy, high-fat foods and on SSBs (40% and 42%, respectively) (140). A qualitative study from the Netherlands found a strong preference among participants for the use of traffic-light FOPL,1 compared with other intervention strategies examined in the study, including “making unhealthier products more expensive”, “making healthier products less expensive”, and “restricting the promotion of unhealthier products“ (70). Another study from the Netherlands also found that consumers are more accepting of “less intrusive interventions”, including FOPL and “back-of-pack” labelling (no details were provided), than of fiscal and pricing policies, and marketing restrictions (158).
Acceptability of the intervention to industry
Industry’s acceptance of nutrition labelling policies appears to depend on the specific policy design elements – for example, the type of FOPL system, nutrients included in the system and the regulatory nature of the policy (voluntary or mandatory/statutory) (86, 120, 124, 132, 133, 152, 153, 159–164).
In the United Kingdom and France, most objections to mandatory FOPL were from the food processing industry and food retailers, who cited cost and the risk of ”demonizing” some products as reasons for their objections (162). Participants from the commercial sector (including the food and advertising industries) were unanimous in their opposition to mandatory traffic-light labelling in France and the United Kingdom (162). Similarly, a study from Ecuador found that representatives of food companies generally disagreed with the required use of a traffic-light label, regarding it as “unfairly demonizing” products that have high concentrations of fat, sugars or salt because “consumers are given the impression that these products are harmful to their health regardless of the amounts they normally consume” (160). Representatives of food companies also argued that “customers do not find the information useful”, that the “the Guideline Daily Amount label is more useful” and that the policy was an “unnecessary imposition of the government and multilateral agencies” (160). The authors concluded that the food and beverage industry used its “political and economic power” to promote the elimination or modification of the national traffic-light label (160).
Several studies from Australia and New Zealand provide evidence on low acceptability to industry of FOPL. The recommendation in a 2011 report commissioned by the Australian Government that a voluntary government-led traffic-light FOPL system should be introduced (moving to a regulated system if there was not widespread uptake) (30) received strong opposition from the food industry (159). The food industry had also voiced opposition to a traffic-light FOPL system before the recommendation (161). In a qualitative study from New Zealand, the authors reported that the food industry supported a numeric labelling system because it gave more information than other labels, including information on nutrients with positive health effects. Industry also argued that its research suggested that consumers preferred a numeric labelling system (152). The study also examined industry views on a statutory versus a voluntary FOPL system. Industry strongly opposed a statutory system, arguing that a voluntary FOPL system should be given a chance first, that it would be “easier and quicker to change”, and that a “voluntary system provides choice” (as paraphrased by the authors of the study) (152, 153). In a case study on the implementation of the national FOPL system, the authors reported that “the greatest challenge in development of the [Health Star Rating] was having industry renege on agreed positions”, detailing how manufacturers successfully had the official HSR website closed down (165).
1 The study framed the use of traffic-light FOPL as an “education intervention” being implemented by food suppliers and not government. The study reported that some participants believed that the government should force food suppliers to provide food labels with the traffic-light system.

23
In a report on the perspectives of major food and beverage manufacturing companies in New Zealand, non-interpretive nutrient profiling, such as percentage daily intake thumbnails, was the most favoured option for FOPL schemes because it was perceived to provide “factual information”, rather than a “judgement” of foods. An interpretive, colour-coded scheme was least favoured by the industry respondents (132). In a public consultation on sugar labelling options for packaged products in Australia and New Zealand, food industry stakeholders were most supportive of education on how to read and interpret labelling information about sugars, and links to web-based information about added sugar content, whereas the other stakeholder groups were not supportive of either of these options (120). Some industry stakeholders also supported having added sugars listed on the nutrition information panel, particularly if the system was voluntary; they reasoned that it would enable industry transparency with consumers, would not overemphasize added sugars on the label, and would not involve a significant change. Industry stakeholders mostly did not support changes to statements of ingredients, advisory labels for foods high in added sugars, or pictorial approaches to conveying the amount of sugars in a serving of food (120).
In Israel, the food industry challenged a draft proposal for mandatory FOPL (104). In particular, manufacturers and importers of foods high in sugars, sodium and saturated fat that would be subject to the national FOPL warning label opposed the policy (81). Industry views were perceived as a major challenge because of the powerful role of the industry, which was responsible for importation of more than 70% of food products, and its influence over policy-makers, especially within the Economy Ministry and the Ministry of Finance (81).
The authors of a narrative review on nutrition labelling1 in several countries in Asia, Africa, the Middle East and Latin America2 found that industry’s initial response to labelling varied, but, when mandatory FOPL legislation was introduced as an option, the industry played a significant role in influencing the outcome of the regulations (145). Other studies reached similar conclusions (166–170). For example, in Thailand, after the food industry disputed a proposal for traffic-light labelling that was supported by academia and consumer groups, the Thai Food and Drug Administration enacted voluntary guideline daily amount labelling for pre-packaged products (with the exception of snacks) as a compromise (166). However, the study reported that the guideline daily amount system was “not acceptable to either the food industry or academicians” (166). A range of literature from Chile testifies to strong and persistent opposition from the food industry to the development and implementation of a statutory regulation on labelling and advertising (163, 167–169, 171). For example, a case study highlighted how the food industry, throughout the development process, “overtly expressed its disagreement with the regulatory effort” and lobbied against the law (168). Chilean food companies further argued that the law violated freedom of expression, disregarded the principle of self-responsibility, and interfered with property rights by restricting industry brands and logos (163, 168). In Mexico, the food and beverage industry initially signed on to the policy recommendations of a national panel that included labelling, but later withdrew support for the FOPL system (170). In the case of Mexico, Chile and Thailand, the industry’s proposed regulatory requirements differed from the recommendations of academic or national committees (166, 169, 170).
Research with food and drink manufacturers in Northern Ireland found mixed views among manufacturers on consumer demand for “at a glance” information on the nutritional content of a product and the role FOPL plays in changing food-purchasing behaviour. Food and drink
1 The review included studies investigating consumer use of, and attitudes towards, FOPL and “back of package or BOP labels”. Based on the included studies in the review, this was deemed as encompassing both ingredient lists and nutrient declarations.
2 Botswana, Brazil, Chile, China, Ghana, India, Israel, Lesotho, Malawi, Mauritius, Mexico, Morocco, Nigeria, Pakistan, Russian Federation, Singapore, South Africa, South Korea, Sri Lanka, Thailand, Trinidad, Tunisia, United Arab Emirates
FACTOR 4. ACCePTABIlITy

implementing nutrition labelling policies
24
manufacturers who had implemented FOPL generally found the process to be straightforward and felt positive about this labelling scheme (133). Some manufacturers preferred to “wait and see” which way the market was heading before committing to FOPL, but accepted that they would most likely introduce it if consumers demanded it (133).
In response to Canada’s Food Labelling Modernization initiative, industry favoured proposals that provide flexibility and allow innovation, as well as aligning with international standards and those of trading partners (86). For FOPL, some industry stakeholders preferred more nuanced information in the symbol such as percentage daily value; whereas some supported the use of multiple colours (green, amber, red), others preferred black and white (124).
Acceptability of nutrition labelling policies compared with other policies
Industry responses to a public consultation on the proposed SSB tax in Ireland strongly opposed the measure, but believed that government and the food and beverage industry should work together to support other solutions to obesity, such as portion control, reformulation, education and food labelling (172).
Sociocultural acceptability
No studies examining the sociocultural acceptability of nutrition labelling policies were identified.
environmental acceptability
No studies examining the environmental acceptability of nutrition labelling policies were identified.

25
factor 5. feasibility
This section presents a narrative synthesis of the literature identified to assess the feasibility of nutrition labelling policies. Separate searches were conducted for the following criteria: elements that support or hinder development and implementation; elements that support or hinder monitoring, evaluation and enforcement; and impact on health systems, food systems and the policy environment. For the purpose of this review, “feasibility” was not assessed as a clear-cut “yes” or “no”, but instead treated as a continuum – barriers to, and facilitators of, development, implementation, monitoring and enforcement of nutrition labelling policies can make a policy more or less feasible.
The majority of evidence was related to FOPL; some related to nutrient declarations, and health- and nutrition-related claims. The information is summarized together rather than by label type.
The existence of nutrition labelling policies in many countries speaks to the feasibility of such policies. Countries have made progress on implementing nutrition labelling policies, as summarized in the most recent GNPR (134). Globally, the most common components of nutrition labelling of pre-packaged foods and beverages reported in the GNPR were nutrient declarations and lists of ingredients (134). Nutrient declarations were reported by at least 80% of countries in the WHO regions of the Americas, Europe and the Western Pacific, but by less than half the countries in the WHO regions of Africa and South-East Asia (134). Implementation can be voluntary or mandatory, and information on nutrients is often disclosed inconsistently. Measures to regulate or guide nutrition and health claims were usually included in national labelling policies. Most nutrition and health claim policies were developed after 2007, and almost a quarter since 2013, when the Codex guidelines incorporated nutrient reference values for NCDs (134). An increasing number of countries are also developing and implementing FOPL systems (104, 134, 173). Europe, for example, has a long history of developing and implementing FOPL systems (104), and multiple countries in Latin America have recently implemented, or are currently implementing, such systems (167, 174). In the most recent GNPR, the majority of FOPL systems reported by countries were voluntary, with different formats, graphics, content and underlying nutrient profile models.
Thus, literature identified as part of the search on the feasibility of nutrition labelling policies and the synthesis of evidence will add perspectives to what may already be regarded as a feasible policy action.
elements that support or hinder development and implementation
A range of studies were identified that described facilitators of, and challenges or barriers to, the development and implementation of nutrition labelling policies – thus affecting the overall feasibility of this policy action. Facilitators included strong political leadership, supporting evidence, intersectoral collaboration, transparency of the process and pilot-testing of FOPL systems (168, 169, 171, 175, 176). Challenges or barriers included conflicting interests, industry interference and the complexity of developing a labelling system (including nutrient profiling aspects, defining “unhealthy”, and deciding on the optimal system for a given context) (81, 152, 153, 165, 168, 169). Facilitators, challenges and barriers, as identified in the studies, are summarized below.
FACTOR 5. FeASIBIlITy

implementing nutrition labelling policies
26
Research, evidence, and expert advice or support
Robust and independent evidence can support the development and improvement of FOPL, and nutrition and health claims, and when updating nutrient declarations; evidence underpins the overall objectives of a nutrition labelling policy and helps governments overcome potential challenges during development and implementation (81, 104, 111, 120, 147, 152, 153, 168-171, 177–182).
In Chile, academia helped gather evidence to support the development and implementation of a statutory regulation on labelling and advertising (168, 171). Evidence was fundamental to justifying the policy (including information on the prevalence of obesity and NCDs), as well as in the developmental phases to formulate the policy (168, 171). For example, how to define “unhealthy foods” was cited as one of the most critical aspects of the law, because the final definition implied modifying existing national legislation, and because the two aspects of the law (labelling and marketing restrictions) were closely linked to this definition (168).
Some countries have found that the use of advisory boards or expert committees was an important facilitator in the development and implementation of FOPL. Roles of these boards and committees included overseeing the collection of country-specific evidence, gathering relevant evidence from other countries, and proposing specific evidence-based aspects of labels (81, 168–170, 177). For example, the Government of Israel appointed a regulatory committee (made up of government officials) and an independent scientific committee. The scientific committee recommended category-specific criteria for the development of the national FOPL, using Israeli dietary patterns identified in national surveys (81). In the regulatory committee, a cost analysis carried out by the Ministry of Health showed that “label changes of food packaging would involve a very small amount of money, with a minimal rise in food costs, and that this was far less than the huge potential benefit to public health”; this helped make the Economy Ministry and the Ministry of Finance strong advocates of the FOPL policy (81).
A qualitative study from New Zealand found that barriers to the development of an FOPL system included lack of agreement on what labelling system and nutrient profile model to use, and limited evidence upon which to make this decision (152, 153). The authors highlighted how publicly available and independently conducted research would be critical for an evidence-based policy change (152, 153). Research conducted and disseminated by health and consumer groups has been identified as influencing and supporting the implementation of the FOPL system (179). Independent research – for example, by academia – can also elucidate possible limitations and concerns of implemented FOPL systems (182).
Funding has been identified as a significant barrier to developing country-specific evidence, and grants and funding from philanthropic organizations have been reported to be instrumental in developing the necessary evidence base for FOPL (111).
Scientific and consumer research is crucial for the implementation of nutrition- and health-related claims to ensure that claims are based on scientific evidence, and are not misunderstood by consumers or misleading (180). Stakeholders in Canada supported publication of Health Canada’s decision for approved health claims, including a summary of the evidence submitted and Health Canada’s scientific evaluation. Strategic partnerships between government, academia, industry and nongovernment agencies could increase scientific and research capacity for health claims (181).
Stakeholder engagement
Considering the varying levels of acceptability of nutrition labelling to stakeholders (discussed above), and their different interests, any engagement and consultation process should follow defined principles and rules of engagement.

27
A review of FOPL policies in the WHO European Region found that broad stakeholder engagement and consultation were a cornerstone in establishing acceptable and feasible FOPL policies (104). Successful consultations with stakeholder groups1 were government led and “occurred at discrete time points after interpretive FOPL [was] identified as a policy priority by government” (104). Another review also emphasized the importance of timing stakeholder consultations (including with industry), describing how the policy agenda and the principles of the FOPL system should be in place before entering into dialogue with other stakeholders about the specific format and technical details of the system (111). For example, the Israeli Government decided to implement an FOPL system, based on the Chilean model, but with two colours to represent a positive and negative label. The government consulted with stakeholders on the layout of the FOPL (including industry, which opposed the Chilean white-on-black labels), and selected red (negative) and green (positive) as colours for the label (111).
A public consultation in Chile on the statutory regulation of labelling and marketing ensured that all stakeholders could contribute their opinions on the proposed regulations. The collaboration required additional efforts, but was “fundamental to the … passing of the law” (171). Focus groups to understand public opinion and to pilot-test labels were also cited as an important facilitator for the ultimate passing of the law (171). In Jamaica, the Minister of Health and Wellness commissioned the National Food Industry Task Force to support continuous dialogue and consultation with the food industry in four working areas: labelling, marketing (especially to children), product reformulation, and communication and advocacy (183), while also progressing efforts to manage conflicts of interest in public–private partnerships.
According to a case study on the policy processes leading to approval of mandatory nutrition labelling regulations in Canada, key success factors for building stakeholder agreement included 1) early development of a nutrition labelling network (including government, industry, academia, NGOs, health professional associations and consumer organizations); 2) a highly consultative policy process, in which policy-makers relied on multiple forms of evidence and clearly articulated decision-making criteria (the ability to leverage scarce resources and use new communication technologies to build citizen engagement were identified as key success factors); and 3) “champions”, who played a critical role in the organization and at the political level (80). A later consultation on Canada’s Food Labelling Modernization initiative indicated that stakeholder involvement and opportunities for partnering were limited. Consumers, industry and other stakeholders expressed an interest in having more participation in developing labelling policies (122).
A qualitative study from New Zealand (conducted before the development of the HSR system) identified the need for a robust consultation process to develop an FOPL system. This should include involving and consulting stakeholders, and identifying and agreeing on the aims and objectives of the system; as well, the system should be based on evidence, and consideration should be given to consumer education and the cost to industry (152, 153). The study concluded that government leadership would be needed to introduce an FOPL system and to facilitate open discussions between stakeholders (152, 153). A case study on the development of the HSR system reported that stakeholders were indeed involved through the formation of a “guiding coalition” (165). However, although broad stakeholder engagement has been identified as important in the development and implementation of nutrition labelling policies, the time requirements of this engagement may be a barrier. For example, the stakeholder consultations on the HSR system were so time-intensive that only a small number of technical experts with expertise in nutrition science (who had originally advised government) were present during complex political and technical negotiations (165).
1 Engagement included formal consultations with food manufacturing and retail industries, public health organizations, health services and authorities, consumer groups, scientists and the public, and the establishment of formal committees for steering policy development.
FACTOR 5. FeASIBIlITy

implementing nutrition labelling policies
28
Stakeholder consultations are also used to obtain views on the overall effectiveness of labelling schemes, to identify limitations or irregularities and provide options for improvement (184).
Before endorsement of the new standards for nutrition and health claims, the Australian Government held extensive consultation over 4 years (185). Although views differed between stakeholder groups, including government, public health groups, industry, enforcement agencies and consumers, most stakeholders supported the overall approach to developing the new standards. Taking the available evidence into account, the government developed a standard that “balances the needs of the broad community” and “encompass[es] industry’s desire to innovate, public health concerns, jurisdictional concerns for enforceable arrangements as well as FSANZ [Food Standards Australia New Zealand] objectives to provide consumers with adequate information to enable informed food choices and to prevent misleading or deceptive claims on food labels and in food advertising” (185).
In the search for government reports, numerous consultation documents were identified that describe the proposed labelling changes and solicit feedback from stakeholders (85, 119, 133, 186–191). Public consultations give stakeholders the opportunity to provide constructive input. Making submissions to the consultations publicly available increases transparency in the policy-making process.
Public campaigns and media coverage
A qualitative study on the Swedish Keyhole (a food label that identifies healthier food products) 25 years after implementation reported that the lack of contemporary public campaigns on healthy eating and promotion of the label (by the Swedish Food Agency, which is responsible for the label) had weakened commitment to the label and its reputation; this had limited the potential influence of the label on population health (146). Similarly, a qualitative study from Ecuador found that a lack of promotional activities accompanying the implementation of the traffic-light label limited active consumer participation in the implementation process; the authors speculated that this had limited the potential effectiveness of the label (160). Since implementation, the government has run a national campaign to explain the nutrition labelling policy (111). The Ministry of Health also launched a public awareness campaign across TV, radio and other media channels to inform the public about the correct use and benefits of the traffic-light label (111). Similarly, in Australia, an education campaign was part of the implementation of the HSR system. Exposure of consumers to the campaign was associated with self-reported higher awareness, trust, understanding and use of the HSR (179). Another report on the HSR system emphasized the importance of raising consumer awareness to create market demand, thereby incentivizing businesses to adopt the voluntary system (76). In Chile, public campaigns consisting of commercials, videos and downloadable posters to explain the meaning of, and justification for, the national FOPL warning label after implementation were attributed as a reason for the high awareness of the label and its use among Chilean consumers (171). Media coverage during development of the policy ensured transparency of opinions of stakeholders and kept the public debate going, which in turn helped mobilize the support of civil society (171).
Community and civil society support
In China, consumer demand for food labels was reported to be a key factor in implementation of the national nutritional labelling policies1 of 2007 and 2011 (155). Involvement and support from civil society and NGOs have been identified in the literature as important facilitators of the development and implementation of FOPL policies (111, 167, 171). In Chile, for example, civil society groups
1 The Chinese Government officially enacted the Regulation on the Management of Food Nutrition Labelling in 2007 and the General Rules for Nutrition Labelling of Pre-packaged Foods in 2011.

29
provided their support when higher limits or restrictions were proposed, and opposed the reduction of limits or requirements. Support from civil society groups was vital for advancing the process (163, 171). Similarly, in Mexico, support by NGOs also helped counteract industry opposition (170).
Conflicting interests and industry opposition
A wide range of literature has identified industry interference and opposition as major barriers to the development and implementation of nutrition labelling policies, which may affect the feasibility of such policies (81, 136, 167, 171, 176). This section is closely linked to the section “Acceptability of the intervention to industry” under “Factor 4: Acceptability”.
A case study on factors generating or hindering political priority for the implementation of nutrition labelling policies (and the regulation of pricing and marketing of “energy-dense foods and beverages”) in Australia between 1990 and 2011 found that the food, beverage and advertising industries powerfully shaped political priority (192). The power stemmed from the industries’ economic importance as large industries and employers, their access to key policy-makers and their reach into food systems (192). In Australia, senior representatives from state and territory governments, statutory authorities and NGOs perceived the lobbying power and influence of the food industry on government decision-making as barriers to food-related regulation, including nutrition labelling policies (136). Studies have also identified conflict in values between the food industry (for profit) and public health (for improved nutrition and health) as barriers to the implementation of a national FOPL policy – for example, in the case of implementation of the HSR system in Australia (152, 165). Economic considerations (i.e. the costs associated with label changes, as discussed under “Factor 2: Resource implications”) prevailing over health concerns were mentioned as a barrier to change (136). Another barrier was the lack of space on labels, leading to some manufacturers having to prioritize branding and other essential information over FOPL (133).
Further barriers reported by industry, particularly for smaller businesses, include limited time and lack of technical expertise required to calculate information for FOPL (76, 133). Concern about producing incorrect FOPL and being penalized as a result was also reported. To overcome these challenges, manufacturers suggested providing training courses or workshops and an online calculator to determine the nutritional value of products; some businesses have also sought expertise in nutritional analysis from academic institutions (133). In a review of the HSR system, reasons manufacturers did not adopt the system included lack of commercial incentives and consumer demand (“no tangible benefit”), a need for clarification in supporting guidance materials, the HSR not giving the expected result for some products, and poor alignment of the HSR with the brand (74).
Industry interference or involvement has been shown to influence how FOPL policies are developed and implemented, and whether systems end up as voluntary or mandatory policies. For example, a review on nutrition labelling in several countries in Asia, Africa, the Middle East and Latin America1 concluded that industry involvement had reduced the regulatory strength of FOPL systems on several occasions (145). A qualitative study from New Zealand identified the decision about whether an FOPL system should be voluntary or mandatory as a significant barrier to development and implementation (152, 153). A 5-year review2 of the HSR system recommended that the system remain voluntary (but with changes), which “builds on the significant investment and goodwill of industry” and follows the principle that regulation should not be adopted as the default option (74).
1 Botswana, Brazil, Chile, China, Ghana, India, Israel, Lesotho, Malawi, Mauritius, Mexico, Morocco, Nigeria, Pakistan, Russian Federation, Singapore, South Africa, South Korea, Sri Lanka, Thailand, Trinidad, Tunisia, United Arab Emirates
2 The review drew from a variety of sources, including data from the Australia Bureau of Statistics, modelling studies by the technical advisory group and academia, and information by stakeholders (e.g. consumers, nutritionists, government, industry).
FACTOR 5. FeASIBIlITy

implementing nutrition labelling policies
30
Several reports mentioned the importance of political commitment in overcoming conflicts of interest and industry opposition. In Sri Lanka, high-level political commitment was an important factor in withstanding pressure from the food and beverage industry, enabling the introduction of traffic-light labelling on SSBs (193). High-level political commitment to strengthen nutrition labelling policies was broadly demonstrated through the inclusion of nutrition labelling in the objectives of national policies and plans, such as in Jamaica and Kenya (194–196).
For further evidence on industry opposition and industry pressure acting as barriers to the development and implementation of nutrition labelling policies, see the section “Acceptability of the intervention to industry” under “Factor 4: Acceptability”.
Food product innovation
A few studies reported that the food industry perceived FOPL to be a barrier to food product innovation (146, 160). For example, in a qualitative study from Ecuador, industry representatives reported that decreasing concentrations of fats, salt and sugars in food products (to avoid the mandatory FOPL) while responding to consumer taste preferences limited opportunities to be innovative and posed technical difficulties (160). Similarly, a qualitative study on the Swedish Keyhole reported that manufacturers felt that production innovation was limited by their desire to have their products display the positive FOPL (146). The authors of the study concluded that the nutrient requirement of the label itself had constituted a barrier to its continuous implementation (146).
Financial considerations
Costs associated with labelling policies (discussed under “Factor 2: Resource implications”) have been cited as a major concern for food manufacturers. Many reports noted the importance of providing long transition times for phasing in the changes to better manage the cost implications (76, 83, 86, 132). Longer implementation times allow businesses to limit the loss of existing label stock and may even allow them to time the introduction of new labelling systems with other planned changes (76). For example, the costs can be integrated into normal relabelling associated with the standard commercial cycle (84). Research with food manufacturers in Ireland found that the cost of additional nutritional analysis and label redesign was one of the main reasons cited by manufacturers for not implementing FOPL (133). Food and beverage manufacturers who had decided to use FOPL often took the opportunity to do so when launching a new product, or making changes to packaging or brand design to reduce costs (133). A report from Canada mentioned the importance of aligning ongoing labelling initiatives to minimize impacts on industry (86). Where back-of-pack labelling is already mandatory, food manufacturers will not incur additional costs for nutritional analysis to provide nutrition information for FOPL (85). Smaller businesses reported facing higher costs due to limited in-house capacity for nutrition analysis, label redesign and label production (76).
Consistency in information and provision of information
Numerous reports noted the importance of consistency – from both a consumer and industry perspective. In a study of consumer needs in Northern Ireland, participants had issues with consistency of information provided on food labels. When asked which improvements they would make to the way information is displayed on food labels, the most common response (36%) was “The information displayed in a consistent way across all products” (131). Variable and inconsistent use of formats, positioning and wording can lead to consumer confusion, whereas greater consistency in information provided on food labels could encourage more habitual use (131). In the United Kingdom, there were several different types of voluntary FOPL in the food market, but evidence showed that a single consistent form across the marketplace was key to consumers
31
noticing the information, becoming familiar with it and gaining confidence in using it (119). Some food manufacturers believed that there should be more consistency in FOPL and that mandatory FOPL would help ensure that a consistent approach is used by all food manufacturers (133).
Many businesses, as well as government reports, commented on the need for greater harmonization across countries and within regions (119, 129, 197). In response to Canada’s Food Labelling Modernization initiative, industry favoured proposals that would align with international standards and those of trading partners (86). Industry and government identified several standards that would pose barriers to trade because they were “outdated” or “too prescriptive” (122).
Transparency and clarity
A few reports mentioned the need for clear and transparent processes (30, 76, 122, 178, 181). For example, expectations and requirements should be clearly defined for industry to meet the regulations and policies, as well as for consumers to understand how “food safety and nutrition risks are mitigated in the regulatory system” (181). Industry stakeholders reported lack of clarity, duplication and overlap in regulations, as well as difficulty in implementing policies that were unclear and did not provide sufficient guidance (122). Standards should be written clearly to communicate requirements to industry, but also to serve as an enforceable document (30).
elements that support or hinder monitoring, evaluation and enforcement
Monitoring, evaluation and enforcement are key elements for regulatory action, including for nutrition labelling policies. Ensuring that these are integral components of the policy affects overall feasibility of policy action (25, 104, 198–201). For example, a qualitative study from Ecuador found that a lack of appropriate monitoring and evaluation components failed to ensure continuity and compliance with the traffic-light label; the authors of the study concluded that this had likely limited the potential effectiveness of the label (160). The study also found that, although small- and medium-scale manufacturers of processed foods expressed their intention to comply with the established regulations, they also voiced frustration about difficulties in doing so, citing inconsistencies in the regulations (160). Some countries provide guidance to industry as part of policy implementation – for example, the United Kingdom (202), Singapore (203), the United States (204) and Australia (205–207).
A study on regulations to limit SSB consumption in South America concluded that most labelling regulations lacked implementation and monitoring structures, although formal sanctions were referred to in the regulations on FOPL of Chile, Ecuador, Mexico and Venezuela (174). In Chile, a report on implementation of the regulations on FOPL (“warning labels”) and marketing restrictions stated that the implementation of a monitoring and enforcement system posed methodological difficulties because the policy was a “new paradigm in public health”, and experience and evidence from other countries were lacking (171). The report specified that the national health authority is responsible for application and enforcement of the policy (for which purpose the Ministry of Health formulated “internal guidelines”), and concluded that the enforcement system and sanctions for noncompliance facilitated application of the regulations (171). The academic sector is tasked with evaluating the policy (171). In Iran, a retrospective summary of the newly implemented traffic-light FOPL system found that the absence of a monitoring programme “emerged as [a] major weakness” in interviews with government officials (176).
A review of FOPL in the WHO European Region found that most policies had provisions in place for periodic monitoring of adherence to nutrient criteria (104). For example, the report describes how the Food Safety Authority in Norway in 2008, shortly after introduction of the Keyhole system, investigated its appropriate use by the food industry, and found that 32 of the 35 products surveyed
FACTOR 5. FeASIBIlITy
implementing nutrition labelling policies
32
complied with the criteria. An investigation of application of the system in Sweden in 2011 also found that some foods displaying the Keyhole did not meet the eligibility criteria (104). For evaluation of FOPL policies, the authors of the review reported that “limited information was available on formal provisions for evaluation of FOPL policies as part of label implementation by administering organizations or agencies”; the authors speculated that this may “reflect poor documentation of evaluation plans or a lack of actual policy evaluation” (104).
A lack of transparency may limit the feasibility of monitoring, evaluation and enforcement. For example, analysis of industry compliance with the algorithm behind the HSR proved challenging, because companies are not required to display the relevant data on the label (179). In a report by the Canadian Food Inspection Agency, industry stakeholders commented that enforcement was not applied in an effective, consistent and transparent manner (122). Standards need to be written clearly so that they can be enforced (30).
Impact on health systems, food systems and the policy environment
Although a wide range of literature emphasizes the need for a comprehensive or “systems” approach to promote healthier food environments, of which nutrition labelling policies are one of several interventions, limited evidence exists on the impact that policies may have on health systems, food systems and the general policy environment (208).
One reason for the lack of evidence on the impact of multiple interventions may be that it is difficult to predict or measure whether combinations of interventions create synergies that translate into an overall effect that is larger than the sum of individual intervention effects, or whether the opposite is true (77). However, a large modelling study found that a multiple-intervention strategy would achieve substantially larger health gains than would individual interventions, often with an even more favourable cost-effectiveness profile (78). The interventions included health information and communication strategies that improve population awareness about the benefits of healthy eating and physical activity, fiscal measures that increase the price of unhealthy foods or reduce the cost of healthy foods rich in fibre, regulatory measures that restrict the marketing of unhealthy foods to children, and mandatory food labelling.
A 2009 study examining stakeholder views of mandatory nutritional labelling in France and the United Kingdom provided some insights on changes within the policy environment (162). The authors reported that many stakeholders in France thought that mandatory FOPL was feasible, and attributed this to other public health nutrition policies recently introduced by the government (restrictions on advertising to children and vending machines in schools). Conversely, the authors hypothesized that government inaction in the United Kingdom over the previous two decades (1989–2009) might have reduced stakeholder confidence in the feasibility of implementing a mandatory scheme in the United Kingdom (162).
Also of interest is the more direct impact that nutrition labelling policies may have on other measures to promote healthy diets. For example, nutrition labelling policies have been shown to spark reformulation of food products (133, 209). Product reformulation is an outcome examined in the systematic review, and will therefore not be discussed further here.

33
1. Darnton-Hill I, Nishida C, James W. A life course approach to diet, nutrition and the prevention of
chronic diseases. Public Health Nutr. 2004;7(1a):101–21.
2. Sawyer SM, Afifi RA, Bearinger LH, Blakemore S-J, Dick B, Ezeh AC, et al. Adolescence: a foundation
for future health. Lancet 2012;379(9826):1630–40.
3. Healthy diet. Fact sheet. Geneva: World Health Organization; 2018.
4. Das JK, Salam RA, Thornburg KL, Prentice AM, Campisi S, Lassi ZS, et al. Nutrition in adolescents:
physiology, metabolism, and nutritional needs. Ann N Y Acad Sci. 2017;1393(1):21–33.
5. GBD 2017 Diet Collaborators. Health effects of dietary risks in 195 countries, 1990–2017: a systematic
analysis for the Global Burden of Disease Study 2017. Lancet 2019;393:1958–72.
6. Noncommunicable diseases. Fact sheet. Geneva: World Health Organization; 2018.
7. United Nations Children’s Fund, World Health Organization, World Bank Group. Levels and trends in
child malnutrition: key findings of the 2020 edition of the Joint Child Malnutrition Estimates. Geneva:
World Health Organization, 2020.
8. NCD Risk Factor Collaboration (NCD-RisC). Worldwide trends in body-mass index, underweight,
overweight, and obesity from 1975 to 2016: a pooled analysis of 2416 population-based measurement
studies in 128.9 million children, adolescents, and adults. Lancet 2017;390(10113):2627–42.
9. Report of the Commission on Ending Childhood Obesity. Geneva: World Health Organization; 2016.
10. Time to deliver: report of the WHO Independent High-level Commission on Noncommunicable
Diseases. Geneva: World Health Organization; 2018.
11. Conference outcome document: framework for action. Rome: Second International Conference on
Nutrition; 2014.
12. Conference outcome document: Rome Declaration on Nutrition. Rome: Second International
Conference on Nutrition; 2014.
13. Food and Agriculture Organization of the United Nations, International Fund for Agricultural
Development, United Nations Children’s Fund, World Food Programme, World Health Organization.
The state of food security and nutrition in the world 2018: building climate resilience for food security
and nutrition. Rome: Food and Agriculture Organization of the United Nations; 2018.
14. Cairns G, Angus K, Hastings G. The extent, nature and effects of food promotion to children: a review
of the evidence to December 2008. Geneva: World Health Organization; 2009.
15. Boyland EJ, Nolan S, Kelly B, Tudur-Smith C, Jones A, Halford JC, et al. Advertising as a cue to
consume: a systematic review and meta-analysis of the effects of acute exposure to unhealthy
food and nonalcoholic beverage advertising on intake in children and adults. Am J Clin Nutr.
2016;103(2):519–33.
16. Kelly B, Buchanan L, Chong KH. Report on a scoping review of nutrition labelling for promoting
healthy diets and nutrition. Unpublished report, commissioned by NNM/NHD/NPU. Geneva: World
Health Organization; 2018.
17. WHO handbook for guideline development, second edition. Geneva: World Health Organization; 2014.
18. Incorporating equity, human rights, gender and social determinants into guidelines. In: WHO
handbook for guideline development, second edition. Geneva: World Health Organization; 2014.
19. Developing recommendations. In: WHO handbook for guideline development, second edition.
Geneva: World Health Organization; 2014.
20. Rehfuess EA, Stratil JM, Scheel IB, Portela A, Norris SL, Baltussen R. The WHO-INTEGRATE evidence
to decision framework version 1.0: integrating WHO norms and values and a complexity perspective.
BMJ Global Health. 2018;0:e000844.
references
ReFeRenCeS

implementing nutrition labelling policies
34
21. Incorporating a complexity perspective into WHO guidelines. In: WHO handbook for guideline
development, second edition. Geneva: World Health Organization; 2014.
22. Tricco AC, Langlois EV, Straus SE. Rapid reviews to strengthen health policy and systems: a practical
guide. Geneva: World Health Organization; 2017.
23. Global strategy on diet, physical activity and health. Geneva: World Health Organization; 2004.
24. Set of recommendations on the marketing of foods and non-alcoholic beverages to children. Geneva:
World Health Organization; 2010.
25. Global action plan for the prevention and control of noncommunicable diseases 2013–2020. Geneva:
World Health Organization; 2013.
26. Comprehensive implementation plan on maternal, infant and young child nutrition. Geneva: World
Health Organization; 2014.
27. Using evidence from qualitative research to develop WHO guidelines. In: WHO handbook for
guideline development, second edition. Geneva: World Health Organization; 2015.
28. Norris SL, Rehfuess EA, Smith H, Tuncalp O, Grimshaw JM, Ford NP, et al. Complex health
interventions in complex systems: improving the process and methods for evidence-informed health
decisions. BMJ Global Health. 2019;4:e000963.
29. Langlois EV, Tuncalp O, Norris SL, Askew I, Ghaffar A. Qualitative evidence to improve guidelines and
health decision-making. Bull World Health Organ. 2018;96:79-A.
30. Blewett NA, Goddard N, Pettigrew S, Reynolds C, Yeatman H. Labelling logic: review of food labelling
law and policy. Canberra: Australia and New Zealand Food Regulation Ministerial Council; 2011.
31. Baxter SL, Collins SC, Hill AJ. “Thin people … they’re healthy”: young children’s understanding of body
weight change. Pediatr Obes. 2015;11:418–24.
32. Economos CD, Bakun PJ, Herzog JB, Dolan PR, Lynskey VM, Markow D, et al. Children’s perceptions
of weight, obesity, nutrition, physical activity and related health and socio-behavioural factors. Public
Health Nutr. 2012;17(1):170–8.
33. Pop C. Self-esteem and body image perception in a sample of university students. Eurasian J Educ
Res. 2016(64):31–44.
34. Robles B, Kuo T. Predictors of public support for nutrition-focused policy, systems and environmental
change strategies in Los Angeles County, 2013. BMJ Open. 2017;7:e012654.
35. Sainsbury E, Hendy C, Magnusson R, Colagiuri S. Public support for government regulatory
interventions for overweight and obesity in Australia. BMC Public Health. 2018;18(1):513.
36. Worsley A, Wang W, Sarmugam R, Pham QTH, Februhartanty J, Ridley S. Family food providers’
perceptions of the causes of obesity and effectiveness of weight control strategies in five countries in
the Asia Pacific region: a cross-sectional survey. Nutrients. 2017;9(1):78.
37. Farrell LC, Warin MJ, Moore VM, Street JM. Socio-economic divergence in public opinions about
preventive obesity regulations: is the purpose to “make some things cheaper, more affordable” or to
“help them get over their own ignorance”? Soc Sci Med. 2016;154:1–8.
38. Perin DMP, Frerichs L, Costa S, Ramirez AG, Huang TTK. Perception of childhood obesity and support
for prevention policies among Latinos and Whites. J Obes. 2014;2014:328276.
39. Donaldson EA, Cohen JE, Rutkow L, Villanti AC, Kanarek F, Barry CL. Public support for a sugar-
sweetened beverage tax and pro-tax messages in a mid-Atlantic US state. Public Health Nutr.
2015;18(12):2263–73.
40. Shoneye C, Johnson F, Steptoe A, Wardle J. A qualitative analysis of black and white British women’s
attitudes to weight and weight control. J Hum Nutr Diet. 2011;24:536–42.
41. Sivalingam SK, Ashraf J, Vallurupalli N, Friderici J, Cook J, Rothberg MB. Ethnic differences in the self-
recognition of obesity and obesity-related comorbidities: a cross-sectional analysis. J Gen Intern Med.
2011;26(6):616–20.
42. Sohn K. The fatter are happier in Indonesia. Qual Life Res. 2017;26:393–402.

35
43. Draper CE, Davidowitz KJ, Goedecke JH. Perceptions relating to body size, weight loss and weight-loss
interventions in black South African women: a qualitative study. Public Health Nutr. 2015;19(3):548–56.
44. Okoro EO, Oyejola BA, Etebu EN, Sholagberu H, Kolo PM, Chijioke A, et al. Body size preference
among Yoruba in three Nigerian communities. Eat Weight Disord. 2014;19:77–88.
45. Naigaga DA, Jahanlu D, Claudius HM, Gjerlaug AK, Barikmo I, Henjum S. Body size perceptions and
preferences favor overweight in adult Saharawi refugees. Nutr J. 2018;17(1):17.
46. Mciza Z, Goedecke JH, Steyn NP, Charlton K, Puoane T, Meltzer S, et al. Development and validation
of instruments measuring body image and body weight dissatisfaction in South African mothers and
their daughters. Public Health Nutr. 2005;8(5):509–19.
47. Holdsworth M, Gartner A, Landais E, Maire B, Delpeuch F. Perceptions of healthy and desirable body
size in urban Senegalese women. Int J Obes. 2004;28:1561–8.
48. Tateyama Y, Musumari PM, Techasrivichien T, Suguimoto SP, Zulu R, Dube C, et al. Dietary habits,
body image, and health service access related to cardiovascular diseases in rural Zambia: a qualitative
study. PLoS One. 2019;14(2):e0212739.
49. Matoti-Mvalo T, Puoane T. Perceptions of body size and its association with HIV/AIDS. S Afr J Clin
Nutr. 2011;24(1):40–5.
50. Puoane T, Tsolekile L, Steyn N. Perceptions about body image and sizes among Black African girls
living in Cape Town. Ethn Dis. 2010;20(1):29–34.
51. Okop KJ, Mukumbang FC, Mathole T, Levitt NS, Puoane T. Perceptions of body size, obesity threat
and the willingness to lose weight among black South African adults: a qualitative study. BMC Public
Health. 2016;16:365.
52. Tateyama Y, Techasrivichien T, Musumari PM, Suguimoto SP, Zulu R, Macwangi M, et al. Obesity
matters but is not perceived: a cross-sectional study on cardiovascular disease risk factors among a
population-based probability sample in rural Zambia. PLoS One. 2018;13(11):e0208176.
53. Pedro TM, Micklesfield LK, Kahn K, Tollman SM, Pettifor JM, Norris SA. Body image satisfaction,
eating attitudes and perceptions of female body silhouettes in rural South African adolescents. PLoS
One. 2015;11(5):e0154784.
54. Puoane T, Fourie JM, Tsolekile L, Nel JH, Temple NJ. What do black South African adolescent girls
think about their body size? J Hunger Environ Nutr. 2013;8(1):85–94.
55. Swami V, Knight D, Tovee MJ, Davies P, Furnham A. Preferences for female body size in Britain and the
South Pacific. Body Image. 2007;4:219–23.
56. Pollock NJ. Cultural elaborations of obesity: fattening practices in Pacific societies. Asia Pac J Clin Nutr.
1995;4:357–60.
57. Craig P, Halavatau V, Comino E, Caterson I. Perception of body size in the Tongan community:
differences from and similarities to an Australian sample. Int J Obes. 1999;23:1288–94.
58. Musaiger A. Body weight concern among female university students in five Arab countries: a
preliminary cross-cultural study. Ann Agric Environ Med. 2015;22(2):349–52.
59. Madanat HN, Lindsay R, Hawks SR, Ding D. A comparative study of the culture of thinness and
nutrition transition in university females in four countries. Asia Pac J Clin Nutr. 2011;20(1):102–8.
60. Madanat HN, Brown RB, Hawks SR. The impact of body mass index and Western advertising and
media on eating style, body image and nutrition transition among Jordanian women. Public Health
Nutr. 2007;10(10):1039–46.
61. Patel N, Ferrer HB, Tyrer F, Wray P, Farooqi A, Davies MJ, et al. Barriers and facilitators to healthy
lifestyle changes in minority ethnic poulations in the UK: a narrative review. J Racial Ethn Health
Disparities. 2017;4:1107–19.
62. Hardus P, Vuuren CV, Crawford D, Worsley A. Public perceptions of the causes and prevention of
obesity among primary school children. Int J Obes. 2003;27:1465–71.
ReFeRenCeS

implementing nutrition labelling policies
36
63. Wang LDL, Lam WWT, Wu JTK, Fielding R. Chinese new immigrant mothers’ perception about adult-
onset non-communicable diseases prevention during childhood. Health Promot Int. 2014;30(4):929–
41.
64. Haley SJ, Li S, Uner S, Arslan U, Unlu HK, Yardim MS, et al. Perceptions of obesity prevention policies:
socioeconomic assessment in the Turkish capital. J Pediatr Nurs. 2018;44:e20-7.
65. Potestio ML, McLaren L, Vollman AR, Doyle-Baker PK. Childhood obesity: perceptions held by the
public in Calgary, Canada. Can J Public Health. 2008;99(2):86–90.
66. Andreasyan D. The problem of being overweight among the Armenian population. Public Health
Panor. 2017;4(4):764–71.
67. Dressler H, Smith C. Health and eating behavior differs between lean/normal and overweight/obese
low-income women living in food-insecure environemnts. Am J Health Promot. 2013;27(6):358–65.
68. Kimoto R, Ronquillo D, Caamano MC, Martinez G, Schubert L, Rosado JL, et al. Food, eating and
body image in the lives of low socioeconomic status rural Mexican women living in Queretaro State,
Mexico. Health Place. 2014;25:34–42.
69. Beeken RJ, Wardle J. Public beliefs about the causes of obesity and attitudes towards policy initiatives
in Great Britain. Public Health Nutr. 2013;16(12):2132–7.
70. Bos C, Lans IVD, Rijnsoever FV, Trijp HV. Understanding consumer acceptance of intervention
strategies for healthy food choices: a qualitative study. BMC Public Health. 2013;13:1073.
71. Barry CL, Brescoll VL, Brownell KD, Schlesinger M. Obesity metaphors: how beliefs about the causes
of obesity affect support for public policy. Milbank Q. 2009;87(1):7–47.
72. Sacks G, Veerman JL, Moodie M, Swinburn BA. “Traffic-light” nutrition labelling and “junk-food” tax: a
modelled comparison of cost-effectiveness for obesity prevention. Int J Obes. 2011;35:1001–9.
73. Herrera AMM, Crino M, Erskine HE, Sacks G, Ananthapavan J, Mhurchu CN, et al. Cost-effectiveness
of product reformulation in response to the Health Star Rating food labelling system in Australia.
Nutrients. 2018;10(5):614.
74. Health Star Rating system five year review report. Melbourne: mpconsulting; 2019.
75. PricewaterhouseCoopers. Cost schedule for food labelling changes. Canberra: Food Standards
Australia New Zealand; 2008.
76. Impact analysis of the Health Star Rating system for small businesses. Canberra: Centre for
International Economics; 2014.
77. Sassi F. The impact of interventions. In: Obesity and the economics of prevention: fit not fat. Paris:
Organisation for Economic Co-operation and Development; 2010.
78. Cecchini M, Sassi F, Lauer JA, Lee YY, Guajardo-Barron V, Chisholm D. Tackling of unhealthy diets,
physical inactivity, and obesity: health effects and cost-effectiveness. Lancet 2010;376:1775–84.
79. Impact of obesity policies on health and the economy. In: The heavy burden of obesity: the economics
of prevention. Paris: Organisation for Economic Co-operation and Development; 2019 (OECD Health
Policy Studies).
80. CARMEN pilot Canadian case study final report: stakeholder convergence on nutrition labelling:
building consensus on a complex issue. Ottawa: Public Health Agency of Canada; 2008.
81. Endevelt R, Grotto I, Sheffer R, Goldsmith R, Golan M, Mendlovic J, et al. Regulatory measures to
improve nutrition policy towards a better food environment for prevention of obesity and associated
morbidity in Israel. Public Health Panor. 2017;3(4):566–74.
82. Food Regulation Standing Committee. Consultation regulation impact statement: labelling of sugars
on packaged foods and drinks. Canberra: Joint Food Regulation System; 2018.
83. Final assessment report. Proposal P293. Nutrition, health & related claims (attachment 13). Canberra:
Food Standards Australia New Zealand; 2008.
84. Executive note: The Nutrition and Health Claims (Scotland) Regulations 2007 SSI 2007/383. Aberdeen:
Food Standards Agency Scotland; 2007.

37
85. Consultation on front of pack nutrition labelling. London: Food Standards Agency; 2012.
86. What we heard report. Food labelling modernization initiative phase III: engagement on key proposals
to modernize the food labelling system [website]. Ottawa: Canadian Food Inspection Agency; 2018
(https://inspection.canada.ca/food-label-requirements/labelling/labelling-modernization-initiative/
phase-iii/eng/1513957863218/1513957863658).
87. Universal Declaration of Human Rights, 1948 (https://www.un.org/en/about-us/universal-declaration-
of-human-rights).
88. Convention on the Rights of the Child, 1989 (https://www.ohchr.org/en/professionalinterest/pages/
crc.aspx).
89. International Covenant on Economic, Social and Cultural Rights, 1966 (https://www.ohchr.org/en/
professionalinterest/pages/cescr.aspx).
90. African Charter on Human and Peoples’ Rights, 1982 (entered into force 21 October 1986) (CAB/
LEG/67/3 rev. 5, 21 I.L.M. 58, Article 16; https://au.int/en/treaties/african-charter-human-and-peoples-
rights).
91. European Social Charter, 1999 (revised) (European Treaty Series No. 163, Article 11; https://www.coe.
int/en/web/european-social-charter).
92. Additional Protocol to the American Convention on Human Rights in the Area of Economic,
Social and Cultural Rights (Protocol of San Salvador), Article 10-11, 1988 (entered into force 16
November 1999) (https://www.ohchr.org/EN/Issues/Education/Training/Compilation/
Pages/4AdditionalProtocoltotheAmericanConventiononHumanRightsintheAreaofEconomic,
SocialandCulturalRightsProtocolofSanSalvador(198.aspx).
93. Advancing the right to health: the vital role of law. Geneva: World Health Organization; 2017.
94. Update and summary guide to the report: advancing the right to health – the vital role of the law.
Geneva: World Health Organization; 2018.
95. CESCR General Comment No. 12: The right to adequate food (art. 11) (adopted at the Twentieth
session of the Committee on Economic, Social and Cultural Rights, on 12 May 1999; contained in
Document E/C.12/1999/5). Office of the High Commissioner for Human Rights; 1999 (https://www.
refworld.org/pdfid/4538838c11.pdf).
96. CESCR General Comment No. 14: The right to the highest attainable standard of health (art. 12)
(adopted at the Twenty-second Session of the Committee on Economic, Social and Cultural Rights, on
11 August 2000; contained in Document E/C.12/2000/4). Office of the High Commissioner for Human
Rights; 2000.
97. Unhealthy foods, non-communicable diseases and the right to health. Report of the Special
Rapporteur on the right of everyone to the enjoyment of the highest attainable standard of physical
and mental health, Anand Grover. United Nations General Assembly; 2014.
98. Working Group on Monitoring of the Civil Society Mechanism (CSM) for relations with the Committee
on World Food Security (CFS). Civil society report on the use and implementation of the right to food
guidelines. Rome: Working Group on Monitoring of the Civil Society Mechanism; 2018.
99. Impact assessment report on general food labelling issues (SEC/2008/92). Commission staff working
document accompanying the proposal for a Regulation of the European Parliament and of the Council
on the Provision of Food Information to Consumers. Brussels: European Commission; 2008.
100. Our food future. London: Food Standards Agency; 2016.
101. Biannual public attitudes tracker. London: Food Standards Agency; 2018.
102. McGill R, Anwar E, Orton L, Bromley H, Lloyd-Williams F, O’Flaherty M, et al. Are interventions to
promote healthy eating equally effective for all? Systematic review of socioeconomic inequalities in
impact. BMC Public Health. 2015;15:457.
103. Crockett RA, King SE, Marteau TM, Prevost AT, Bignardi G, Roberts NW, et al. Nutritional labelling
for healthier food or non-alcoholic drink purchasing and consumption. Cochrane Database Syst Rev.
2018;2:CD009315.
ReFeRenCeS

implementing nutrition labelling policies
38
104. Kelly B, Jewell J. What is the evidence on the policy specifications, development processes and
effectiveness of existing front-of-pack food labelling policies in the WHO European Region?
Copenhagen: WHO Regional Office for Europe; 2018 (Health Evidence Network synthesis report 61).
105. Mhurchu CN, Gorton D. Nutrition labels and claims in New Zealand and Australia: a review of use and
understanding. Aust N Z J Public Health. 2007;31(2):105–12.
106. Jones G, Richardson M. An objective examination of consumer perception of nutrition information
based on healthiness ratings and eye movements. Public Health Nutr. 2007;10(3):238–44.
107. Portuguese consumers’ attitudes towards food labelling. Copenhagen: World Health Organization
Regional Office for Europe; 2017.
108. Malloy-Weir L, Cooper M. Health literacy, literacy, numeracy and nutrition label understanding and
use: a scoping review of the literature. J Hum Nutr Diet. 2017;30:309–25.
109. Cowburn G, Stockley L. Consumer understanding and use of nutrition labelling: a systematic review.
Public Health Nutr. 2005;8(1):21–8.
110. Pettigrew S, Talati Z, Miller C, Dixon H, Kelly B, Ball K. The types and aspects of front-of-pack food
labelling schemes preferred by adults and children. Appetite. 2017;109:115–23.
111. Building momentum: lessons on implementing a robust front-of-pack food label. London: World
Cancer Research Fund International; 2019.
112. Julia C, Peneau S, Buscail C, Gonzalez R, Touvier M, Hercberg S, et al. Perception of different formats
of front-of-pack nutrition labels according to sociodemographic, lifestyle and dietary factors in a
French population: cross-sectional study among the NutriNet-Santé cohort participants. BMJ Open.
2017;7:e016108.
113. Hersey JC, Wohlgenant KC, Arsenault JE, Kosa KM, Muth MK. Effects of front-of-package and shelf
nutrition labeling systems on consumers. Nutr Rev. 2013;71(1):1–14.
114. Campos S, Doxey J, Hammond D. Nutrition labels on pre-packaged foods: a systematic review. Public
Health Nutr. 2011;14(8):1496–506.
115. Orozco F, Ochoa D, Muquinche M, Padro M, Melby CL. Awareness, comprehension, and use of newly-
mandated nutrition labels among Mestiza and Indigenous Ecuadorian women in the central Andes
region of Ecuador. Food Nutr Bull. 2017;38(1):37–48.
116. Teran S, Hernandez I, Freire WB, Leon B, Teran E. Use, knowledge, and effectiveness of nutritional
traffic light label in an urban population from Ecuador: a pilot study. Global Health. 2019;15(1):26.
117. Vyth EL, Steenhuis IHM, Mallant SF, Mol ZL, Brug J, Temminghoff M, et al. A front-of-pack nutrition
logo: a quantitative and qualitative process evaluation in the Netherlands. J Health Commun.
2009;14(7):631–45.
118. Feunekes GIJ, Gortemaker IA, Willems AA, Lion R, van den Kommer M. Front-of-pack nutrition
labelling: testing effectiveness of different nutrition labelling formats front-of-pack in four European
countries. Appetite. 2008;50:57–70.
119. Building on the success of front-of-pack nutrition labelling in the UK: a public consultation London:
Food Standards Agency; 2020.
120. Food Regulation Standing Committee. Policy paper: labelling of sugars on packaged foods and drinks.
Commissioned by the Australia and New Zealand Ministerial Forum on Food Regulation. Canberra:
Joint Food Regulation System; 2019.
121. Consulting Canadians to modernize and improve food labels: what we heard. Ottawa: Canadian Food
Inspection Agency; 2014.
122. Food labelling modernization: engagement summary report on key issues. Ottawa: Canadian Food
Inspection Agency; 2014.
123. Front of pack (FOP) nutrition labelling (FSA 10/03/07). London: Food Standards Agency; 2010.
124. Front-of-package nutrition labelling: September 18 stakeholder engagement meeting. Ottawa: Health
Canada; 2017.

39
125. Consumer Label Survey 2015: food labelling use and understanding in Australia and New Zealand.
Canberra: Food Standards Australia New Zealand; 2015.
126. Proposed front-of-pack food labelling designs: quantitative research outcomes. Melbourne: Hall &
Partners Open Mind; 2013.
127. Proposed front-of-pack food labelling designs: qualitative research outcomes. Melbourne: Hall &
Partners Open Mind; 2013.
128. Evaluation of labelling review recommendation 17: per serving declarations in the nutrition information
panel. Canberra: Food Standards Australia New Zealand; 2015.
129. Department of Health, Food Standards Agency, Welsh Government, Scottish Government. Front of
pack nutrition labelling: joint response to consultation. London: Department of Health; 2013.
130. Kantar Public. Food Standards Agency transparency: understanding public views and priorities.
London: Food Standards Agency; 2017.
131. Kantar Public. Understanding Northern Ireland consumer needs around food labelling. Belfast: Food
Standards Agency; 2016.
132. Alexander D, Hazel J-A. Front of pack labelling: perspectives of the New Zealand food industry.
Wellington: New Zealand Food Safety; 2008.
133. Community Research, 2CV. Front of pack nutritional labelling in Northern Ireland. London: Food
Standards Agency; 2020.
134. Global nutrition policy review 2016–2017: country progress in creating enabling policy environments
for promoting healthy diets and nutrition. Geneva: World Health Organization; 2018.
135. Building momentum: lessons on implementing a robust sugar sweetened beverage tax. London:
World Cancer Research Fund International; 2018.
136. Shill J, Mavoa H, Allender S, Lawrence M, Sacks G, Peeters A, et al. Government regulation to promote
healthy food environments: a view from inside state governments. Obes Rev. 2011;13:162–73.
137. Zinab HE, Kalantari N, Ostadrahimi A, Tabrizi JS, Pourmoradian S. A Delphi study for exploring
nutritional policy priorities to reduce prevalence of non communicable diseases in Islamic Republic of
Iran. Health Promot Perspect. 2019;9(3):241–7.
138. Vercammen KA, Frelier JM, Lowery CM, Moran AJ, Bleich SN. Strategies to reduce sugar-sweetened
beverage consumption and increase water access and intake among young children: perspectives from
expert stakeholders. Public Health Nutr. 2018;21(18):3440–9.
139. Brownbill AL, Braunack-Mayer AJ, Miller C. Health Star Ratings: what’s on the labels of Australian
beverages? Health Promot J Austr. 2019;30:114–18.
140. Farrell LC, Moore VM, Warin MJ, Street JM. Why do the public support or oppose obesity prevention
regulations? Results from a South Australian population survey. Health Promot J Austr. 2019;30:47–59.
141. Street JM, Sisnowski J, Tooher R, Farrell LC, Braunack-Mayer AJ. Community perspectives on the use of
regulation and law for obesity prevention in children: a citizens’ jury. Health Policy. 2017;121:566–73.
142. Morley B, Martin J, Niven P, Wakefield M. Public opinion on food-related obesity prevention policy
initiatives. Health Promot J Austr. 2012;23(2):86–91.
143. Pollard CM, Daly A, Moore M, Binns CW. Public say food regulatory policies to improve health in
Western Australia are important: population survey results. Aust N Z J Public Health. 2013;37(5):475–
82.
144. Sikorski C, Luppa M, Schomerus G, Werner P, Konig H-H, Riedel-Heller SG. Public attitudes towards
prevention of obesity. PLoS One. 2012;7(6):e39325.
145. Mandle J, Tugendhaft A, Michalow J, Hofman K. Nutrition labelling: a review of research on consumer
and industry response in the global South. Glob Health Action. 2015;8:25912.
146. Ipsos. A qualitative study concerning the Keyhole’s influence over 25 years on product development.
Stockholm: Swedish Food Agency; 2015.
147. Front-of-pack nutritional labelling. BEUC position. Brussels: European Consumer Organisation; 2019.
ReFeRenCeS

implementing nutrition labelling policies
40
148. Ares G, Aschemann-Witzel J, Curutchet MR, Antúnez L, Moratorio X, Bove I. A citizen perspective on
nutritional warnings as front-of-pack labels: insights for the design of accompanying policy measures.
Public Health Nutr. 2018;21(18):3450–61.
149. Comans T, Moretto N, Byrnes J. Public preferences for the use of taxation and labelling policy
measures to combat obesity in young children in Australia. Int J Environ Res Public Health.
2017;14(3):324.
150. Mejean C, Macouillard P, Peneau S, Hercberg S, Castetbon K. Consumer acceptability and
understanding of front-of-pack nutrition labels. J Hum Nutr Diet. 2013;26:494–503.
151. Chantal J, Hercberg S. Development of a new front-of-pack nutrition label in France: the five-colour
Nutri-Score. Public Health Panor. 2017;3(4):712–25.
152. Signal L, Lanumata T, Mhurchu CN, Gorton D. Front-of-pack nutrition labelling in New Zealand:
an exploration of stakeholder views about research and implementation. Health Promot J Austr.
2012;23(1):48–51.
153. Signal L, Lanumata T. The feasibility of front-of-pack nutrition labelling and research to measure its
effectiveness in New Zealand: the views of key stakeholders. Wellington: Health Promotion and Policy
Research Unit, University of Otago; 2008.
154. Kelly B, Hughes C, Chapman K, Louie JC-Y, Dixon H, Crawford J, et al. Consumer testing of the
acceptability and effectiveness of front-of-pack food labelling systems for the Australian grocery
market. Health Promot Int. 2009;24(2):120–9.
155. Kong K, Liu F, Tao Y. The presence and accuracy of nutritional labelling of pre-packaged foods in
Shanghai. Asia Pac J Clin Nutr. 2017;26(13):478–83.
156. TNS Social Research. Food labelling issues: qualitative research on participants’ perceptions and
use of nutrition, health and related claims on packaged foods and associated advertising material.
Canberra: Food Standards Australia New Zealand; 2005.
157. Lanumata T, Heta C, Signal L, Haretuku R. Front of pack labelling from the perspectives of Māori,
Pacific and low-income New Zealanders. Dunedin: Health Promotion and Policy Research Unit,
University of Otago; 2008.
158. Bos C, Lans IVD, Rijnsoever FV, Trijp HV. Consumer acceptance of population-level intervention
strategies for healthy food choices: the role of perceived effectiveness and perceived fairness.
Nutrients. 2015;7:7842–62.
159. Swinburn BA, Wood A. Progress on obesity prevention over 20 years in Australia and New Zealand.
Obes Rev. 2013;14(Suppl. 2):60–8.
160. Freire WB, Waters WF, Rivas-Marino G, Nguyen T, Rivas P. A qualitative study of consumer perceptions
and use of traffic light food labelling in Ecuador. Public Health Nutr. 2017;20(5):805–13.
161. White J, Thomson G, Signal L. Front-of-pack nutrition labelling: where to now? N Z Med J.
2010;123(1324):12–16.
162. Holdsworth M, Delpeuch F, Kameli Y, Lobstein T, Millstone E. The acceptability to stakeholders of
mandatory nutritional labelling in France and the UK: findings from the PorGrow project. J Hum Nutr
Diet. 2009;23:11–19.
163. Osiac RL, Cofre C, Pizarro T, Mansilla C, Herrera CA, Burrows J, et al. Using evidence-informed
policies to tackle overweight and obesity in Chile. Rev Panam Salud Publica. 2017;41:e156.
164. Position statement: response to: labelling logic: review of food labelling law and policy. Canberra:
Australian Food and Grocery Council; 2011.
165. Moore M, Jones A, Pollard CM, Yeatman H. Development of Australia’s front-of-pack interpretative
nutrition labelling Health Star Rating system: lessons for public health advocates. Aust N Z J Public
Health. 2019;43(4):352–4.
166. Chavasit V, Kasemsup V, Tontisirin K. Thailand conquered under-nutrition very successfully but has not
slowed obesity. Obes Rev. 2013;14(Suppl. 2):96–105.

41
167. Perez-Escamilla R, Lutter CK, Rabadan-Diehl C, Rubinstein A, Calvillo A, Corvalan C, et al. Prevention
of childhood obesity and food policies in Latin America: from research to practice. Obes Rev.
2017;18(Suppl. 2):28–38.
168. Corvalan C, Reyes M, Garmendia ML, Uauy R. Structural responses to the obesity and non‐
communicable diseases epidemic: the Chilean law of food labelling and advertising. Obes Rev.
2013;14:79–87.
169. Corvalan C, Reyes M, Garmendia ML, Uauy R. Structural responses to the obesity and non‐
communicable diseases epidemic: update on the Chilean law of food labelling and advertising. Obes
Rev. 2018;20:367–74.
170. Barquera S, Campos I, Rivera JA. Mexico attempts to tackle obesity: the process, results, push backs
and future challenges. Obes Rev. 2013;14(Suppl. 2):69–78.
171. Food and Agriculture Organization of the United Nations, World Health Organization, Pan American
Health Organization. Approval of a new food act in Chile: process summary. Santiago: Food and
Agriculture Organization of the United Nations; 2017.
172. CCHBCI and CCI response to the public consultation on the proposed sugar sweetened drinks tax.
Dublin: Coca-Cola Hellenic Bottling Company Ireland; 2017.
173. Global nutrition policy review 2009–2010: what does it take to scale up nutrition action? Geneva:
World Health Organization; 2013.
174. Bergallo P, Castagnari V, Fernandez A, Mejia R. Regulatory initiatives to reduce sugar-sweetened
beverages (SSBs) in Latin America. PLoS One. 2018;13(10):e0205694.
175. Cairns G, Macdonald L. Stakeholder insights on the planning and development of an independent
benchmark standard for responsible food marketing. Eval Program Plann. 2016;56:109–20.
176. Edalti S, Omidvar N, Roudsari AH, Ghodsi D, Zargaraan A. Development and implementation of
nutrition labelling in Iran: a retrospective policy analysis. Int J Health Plan Manag. 2019;35(1):e28–44.
177. Wood A, Tenbensel T. A comparative analysis of drivers of collaborative governance in front-of-pack
food labelling policy processes. J Comp Policy Anal. 2018;20(4):404–19.
178. Report on stakeholder feedback on modernizing Canada’s framework for health claims on food.
Ottawa: Health Canada; 2009.
179. Jones A, Thow AM, Mhurchu CN, Sacks G, Neal B. The performance and potential of the Australasian
Health Star Rating system: a four-year review using the RE-AIM framework. Aust N Z J Public Health.
2019;43(4):355–65.
180. Health Canada’s action plan in response to stakeholder feedback from consultations on modernizing
Canada’s framework for health claims on food. Ottawa: Health Canada; 2009.
181. Health Canada’s regulatory modernization strategy for food and nutrition (RMSFN). Ottawa: Health
Canada; 2008.
182 Dickie S, Woods J, Baker P, Elizabeth L, Lawrence M. Evaluating nutrient-based indices against food-
and diet-based indices to assess the health potential of foods: how does the Australian Health Star
Rating system perform after five years? Nutrients. 2020;12(5):1463.
183. Highlights of key initiatives 2020–2021. Kingston: Ministry of Health & Wellness; 2020.
184. mpconsulting. Report on submissions to the five year review of the Health Star Rating system: report
prepared for the Department of Health. Melbourne: mpconsulting; 2017.
185. Final assessment report. Proposal P293. Nutrition, health & related claims (attachments 1 & 2).
Canberra: Food Standards Australia New Zealand; 2008.
186. Health Canada’s proposed changes to the format requirements for the display of nutrition and other
information on food labels. Ottawa: Health Canada; 2014.
187. Health Canada’s proposed changes to the core nutrients declared in the Canadian nutrition facts
table. Ottawa: Health Canada; 2014.
188. Toward front-of-package nutrition labels for Canadians: consultation document. Ottawa: Health
Canada; 2016.
ReFeRenCeS
implementing nutrition labelling policies
42
189. Health Canada’s proposed changes to the daily values (DVs) for use in nutrition labelling. Ottawa:
Health Canada; 2014.
190. Consultation report: policy guideline on food labelling to support consumers to make informed
healthy food choices. Canberra: Australia and New Zealand Ministerial Forum on Food Regulation;
2020.
191. Food Standards Agency consultation: front of pack (FOP) nutrition labelling for pre-packed foods sold
through retail outlets in the UK. London: Food Standards Agency; 2009.
192. Baker P, Gill T, Friel S, Carey G, Kay A. Generating political priority for regulatory interventions
targeting obesity prevention: an Australian case study. Soc Sci Med. 2017;177:141–9.
193. Prevention and control of noncommunicable diseases: think globally – act locally; lessons from Sri
Lanka. In: Mendis RSS, editor. Colombo: Ministry of Health, Nutrition and Indigenous Medicine; 2018.
194. Ministry of Health strategic business plan 2015–2018. Kingston: Ministry of Health; 2014.
195. National food and nutrition security policy. Kingston: Government of Jamaica; 2013.
196. The Kenya nutrition action plan (KNAP) 2018–2022. Nairobi: Government of Kenya; 2018.
197. Impact assessment on a statutory instrument implementing Regulation (EU) 1169/2011 on the
provision of food information to consumers. London: Department for Environment, Food and Rural
Affairs; 2012.
198. Fiscal policies for diet and prevention of noncommunicable diseases: technical meeting report 5–6
May 2015, Geneva, Switzerland. Geneva: World Health Organization; 2016.
199. “Best buys” and other recommended interventions for the prevention and control of
noncommunicable diseases. Geneva: World Health Organization; 2017.
200. WHO global strategy on diet, physical activity and health: a framework to monitor and evaluate
implementation. Geneva: World Health Organization; 2008.
201. Handbook on food labelling to protect consumers. Rome: Food and Agriculture Organization of the
United Nations; 2016.
202. Food Standards Agency, Food Standards Scotland. Guide to creating a front of pack (FoP) nutrition
label for pre-packed products sold through retail outlets. London: Department of Health and Social
Care; 2013.
203. A guide to food labelling and advertisements. Singapore: Singapore Food Agency; 2010 (amended Oct
2011, Oct 2013, Jul 2014, Jan 2015, Jul 2015, Mar 2016, Aug 2018, Feb 2019, Apr 2019, Sep 2019).
204. Guidance for industry: a food labelling guide. Maryland: Food and Drug Administration; 2013.
205. Health Star Rating system: style guide. Version 5. Canberra: Food Regulation Standing Committee,
Department of Health; 2017.
206. Guide for industry to the Health Star Rating Calculator (HSRC). Version 6. Canberra: Food Regulation
Standing Committee, Department of Health; 2018.
207. Health claims and enforcement: how regulators will enforce the nutrition and health claims standard.
Canberra: Implementation Subcommittee for Food Regulation; 2015.
208. Langellier BA, Bilal U, Montes F, Meisel JD, de Oliveira Cardoso L, Hammond RA. Complex systems
approaches to diet: a systematic review. Am J Prev Med. 2019;57(2):273–81.
209. Vandevijvere S, Vanderlee L. Effect of formulation, labelling, and taxation policies on the nutritional
quality of the food supply. Public Health Nutr. 2019;8:240–9.

43
anne
x 1.
fra
mew
ork
for
revi
ew o
f con
text
ual f
acto
rs
Fact
orC
rite
ria
Gui
danc
e qu
estio
nsTo
tal n
umbe
r of
stud
ies
incl
uded
for
each
cri
teri
on
1. Va
lues
Rela
tive
impo
rtan
ce th
e po
pula
tion
(tho
se a
ffec
ted
by
expo
sure
and
/or o
utco
me)
ass
igns
to th
e in
terv
entio
n he
alth
out
com
es
Wha
t are
the
valu
es p
eopl
e af
fect
ed b
y th
e in
terv
entio
n as
sign
to th
e in
terv
entio
n he
alth
out
com
es?
42
2. R
esou
rce
impl
icat
ions
Ratio
of c
osts
and
ben
efits
of t
he in
terv
entio
n, in
clud
ing
cost
s of
the
inte
rven
tion
in th
e lo
ng a
nd s
hort
term
s, a
nd
the
econ
omic
impa
ct o
f the
inte
rven
tion
on n
atio
nal a
nd
glob
al e
cono
mie
s
Wha
t is
the
valu
e fo
r mon
ey o
f the
inte
rven
tion
in
term
s of
cos
t-ben
efit/
cost
-eff
ectiv
enes
s/co
st-u
tility
, in
clud
ing
the
impa
ct o
n na
tiona
l/glo
bal h
ealth
care
cos
ts
in th
e sh
ort t
erm
and
long
term
, and
the
impa
ct o
n go
vern
men
t rev
enue
(in
clud
ing
the
use
of a
dditi
onal
re
venu
e; a
nd is
sues
of n
onco
mpl
ianc
e, in
flatio
n, b
lack
m
arke
t or c
ross
-bor
der t
rade
)?
15
3. E
quity
and
hum
an r
ight
sU
nive
rsal
hum
an r
ight
s st
anda
rds
Is th
e in
terv
entio
n in
acc
orda
nce
with
hum
an r
ight
s st
anda
rds,
and
wha
t is
the
impa
ct o
f the
inte
rven
tion
on
hum
an r
ight
s (i
nclu
ding
the
abili
ty to
mak
e a
com
pete
nt,
info
rmed
and
vol
unta
ry d
ecis
ion)
?
17
Impa
ct o
n (h
ealth
) (i
n)eq
uity
and
/or (
heal
th)
(in)
equa
lity
Wha
t is
the
impa
ct o
f the
inte
rven
tion
on (
heal
th)
(in)
equa
lity
and/
or (
heal
th)
(in)
equi
ty, i
nclu
ding
food
and
nu
triti
on s
ecur
ity (u
nequ
al a
nd/o
r unf
air a
cces
s to
food
)?
19
Annex 1. FRAMeWORk FOR ReVIeW OF COnTexTuAl FACTORS

implementing nutrition labelling policies
44
Is th
e in
terv
entio
n se
nsiti
ve to
sex
, age
, eth
nici
ty,
relig
ion,
cul
ture
, lan
guag
e, s
exua
l orie
ntat
ion/
gend
er id
entit
y, d
isab
ility
sta
tus,
edu
catio
n, S
ES,
plac
e of
res
iden
ce (
incl
udin
g is
sues
of s
ocia
l stig
ma,
ho
useh
old
expe
nditu
re, fi
nanc
ial r
egre
ssiv
ity, a
nd jo
bs/
empl
oym
ent)
?
4. A
ccep
tabi
lity
Acc
epta
bilit
y to
sta
keho
lder
sIs
the
inte
rven
tion
acce
ptab
le to
gov
ernm
ents
and
po
licy-
mak
ers,
the
publ
ic a
nd c
onsu
mer
s, a
nd in
dust
ry?
67
Soci
ocul
tura
l acc
epta
bilit
yIs
the
inte
rven
tion
acce
ptab
le to
, and
in a
gree
men
t with
, ex
istin
g cu
ltura
l and
rel
igio
us n
orm
s an
d be
liefs
?0
Envi
ronm
enta
l acc
epta
bilit
yIs
the
inte
rven
tion
alig
ned
with
env
ironm
enta
l goa
ls a
nd
cons
ider
atio
ns?
0
5. F
easi
bilit
yD
evel
opm
ent a
nd im
plem
enta
tion
Wha
t is
the
feas
ibili
ty o
f dev
elop
ing
and
impl
emen
ting
the
inte
rven
tion
(inc
ludi
ng b
arrie
rs a
nd fa
cilit
ator
s)?
56
Mon
itorin
g an
d en
forc
emen
tW
hat i
s th
e fe
asib
ility
of m
onito
ring
and
enfo
rcem
ent o
f th
e in
terv
entio
n (i
nclu
ding
bar
riers
and
faci
litat
ors)
?19
Impa
ct o
n he
alth
sys
tem
s, fo
od s
yste
ms
and
the
polic
y en
viro
nmen
tD
oes
the
inte
rven
tion
have
an
impa
ct o
n ch
ange
with
in
exis
ting
heal
th o
r foo
d sy
stem
s (i
nclu
ding
res
ultin
g in
ad
ditio
nal i
nter
vent
ions
to im
prov
e th
e nu
triti
on a
nd
heal
th o
f pop
ulat
ions
)?
6
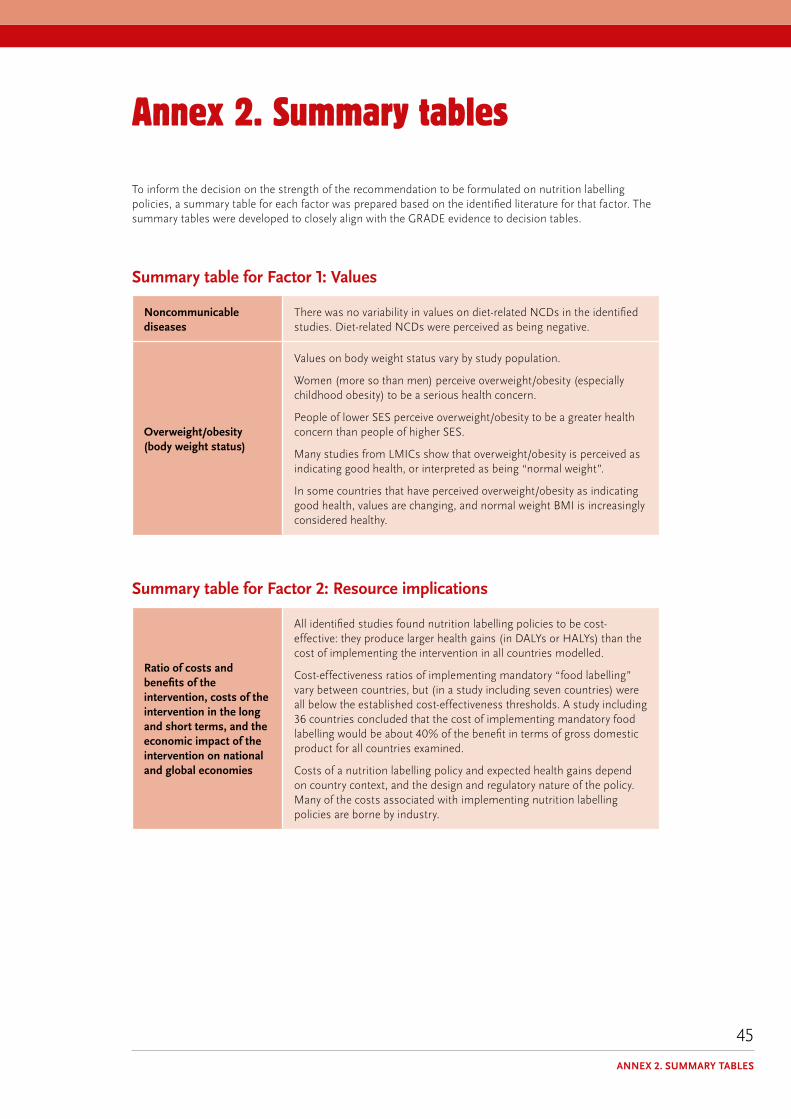
45
annex 2. summary tables
To inform the decision on the strength of the recommendation to be formulated on nutrition labelling policies, a summary table for each factor was prepared based on the identified literature for that factor. The summary tables were developed to closely align with the GRADE evidence to decision tables.
Summary table for Factor 1: Values
noncommunicable diseases
There was no variability in values on diet-related NCDs in the identified studies. Diet-related NCDs were perceived as being negative.
Overweight/obesity (body weight status)
Values on body weight status vary by study population.
Women (more so than men) perceive overweight/obesity (especially childhood obesity) to be a serious health concern.
People of lower SES perceive overweight/obesity to be a greater health concern than people of higher SES.
Many studies from LMICs show that overweight/obesity is perceived as indicating good health, or interpreted as being “normal weight”.
In some countries that have perceived overweight/obesity as indicating good health, values are changing, and normal weight BMI is increasingly considered healthy.
Summary table for Factor 2: Resource implications
Ratio of costs and benefits of the intervention, costs of the intervention in the long and short terms, and the economic impact of the intervention on national and global economies
All identified studies found nutrition labelling policies to be cost-effective: they produce larger health gains (in DALYs or HALYs) than the cost of implementing the intervention in all countries modelled.
Cost-effectiveness ratios of implementing mandatory “food labelling” vary between countries, but (in a study including seven countries) were all below the established cost-effectiveness thresholds. A study including 36 countries concluded that the cost of implementing mandatory food labelling would be about 40% of the benefit in terms of gross domestic product for all countries examined.
Costs of a nutrition labelling policy and expected health gains depend on country context, and the design and regulatory nature of the policy. Many of the costs associated with implementing nutrition labelling policies are borne by industry.
Annex 2. SuMMARy TABleS
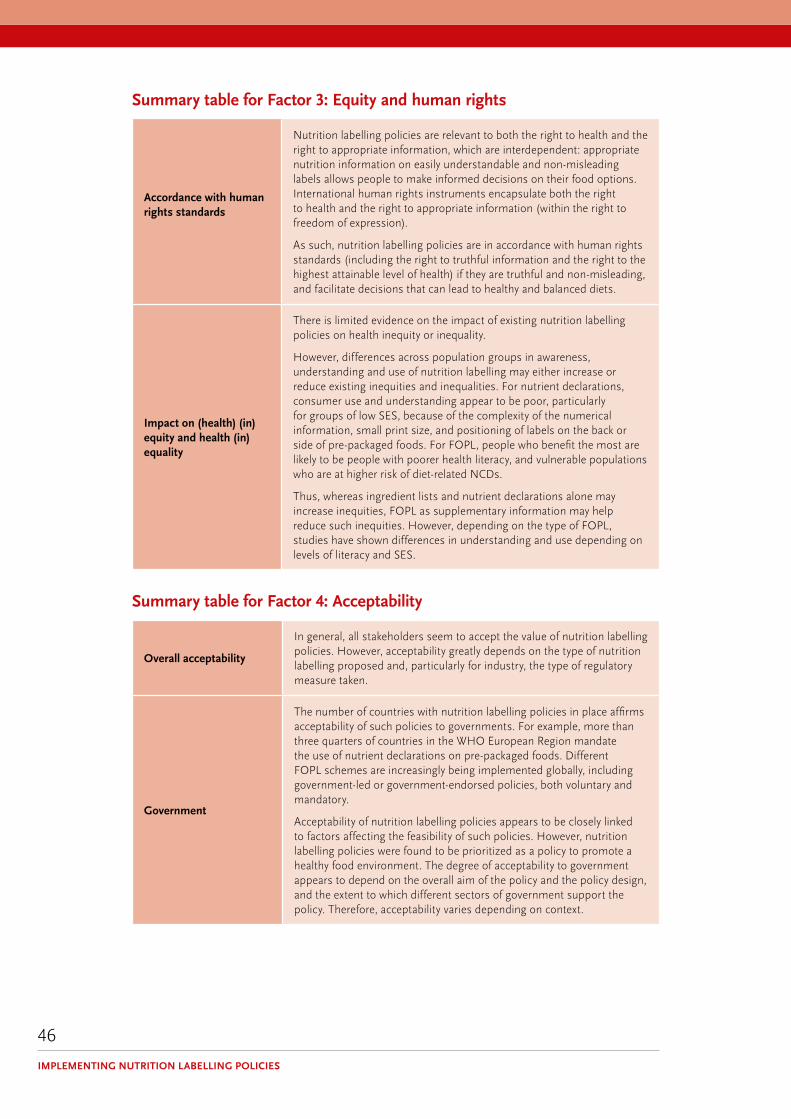
implementing nutrition labelling policies
46
Summary table for Factor 3: equity and human rights
Accordance with human rights standards
Nutrition labelling policies are relevant to both the right to health and the right to appropriate information, which are interdependent: appropriate nutrition information on easily understandable and non-misleading labels allows people to make informed decisions on their food options. International human rights instruments encapsulate both the right to health and the right to appropriate information (within the right to freedom of expression).
As such, nutrition labelling policies are in accordance with human rights standards (including the right to truthful information and the right to the highest attainable level of health) if they are truthful and non-misleading, and facilitate decisions that can lead to healthy and balanced diets.
Impact on (health) (in)equity and health (in)equality
There is limited evidence on the impact of existing nutrition labelling policies on health inequity or inequality.
However, differences across population groups in awareness, understanding and use of nutrition labelling may either increase or reduce existing inequities and inequalities. For nutrient declarations, consumer use and understanding appear to be poor, particularly for groups of low SES, because of the complexity of the numerical information, small print size, and positioning of labels on the back or side of pre-packaged foods. For FOPL, people who benefit the most are likely to be people with poorer health literacy, and vulnerable populations who are at higher risk of diet-related NCDs.
Thus, whereas ingredient lists and nutrient declarations alone may increase inequities, FOPL as supplementary information may help reduce such inequities. However, depending on the type of FOPL, studies have shown differences in understanding and use depending on levels of literacy and SES.
Summary table for Factor 4: Acceptability
Overall acceptability
In general, all stakeholders seem to accept the value of nutrition labelling policies. However, acceptability greatly depends on the type of nutrition labelling proposed and, particularly for industry, the type of regulatory measure taken.
Government
The number of countries with nutrition labelling policies in place affirms acceptability of such policies to governments. For example, more than three quarters of countries in the WHO European Region mandate the use of nutrient declarations on pre-packaged foods. Different FOPL schemes are increasingly being implemented globally, including government-led or government-endorsed policies, both voluntary and mandatory.
Acceptability of nutrition labelling policies appears to be closely linked to factors affecting the feasibility of such policies. However, nutrition labelling policies were found to be prioritized as a policy to promote a healthy food environment. The degree of acceptability to government appears to depend on the overall aim of the policy and the policy design, and the extent to which different sectors of government support the policy. Therefore, acceptability varies depending on context.

47
Industry
The acceptability of FOPL to industry depends on the policy design and its regulatory nature. Voluntary FOPL policies appear to be more acceptable to industry than statutory (mandatory) FOPL policies. Industry appears to prefer numeric FOPL over more interpretive FOPL systems.
Public
Nutrition labelling policies are largely acceptable to the public, and consumers appear supportive of efforts to improve the clarity and transparency of food labels. Support appears to be highest for FOPL policies, and varies among subgroups of the population. For example, a study found a positive association between education levels of study participants and support for FOPL. Nutrition labelling policies are more acceptable to the general public than, for example, marketing restrictions, and taxes on SSBs and unhealthy foods.
Overall, perceived negative impact of an unhealthy food environment and acknowledgement of a societal responsibility in personal food choice have been linked to increased support for government policies to promote a healthy food environment.
Sociocultural acceptability
No studies found
environmental acceptability
No studies found
Summary table for Factor 5: Feasibility
Overall feasibility
The existence of nutrition labelling policies in many countries speaks to the feasibility of such policies. However, there are elements that, depending on their context, make nutrition labelling policies more or less feasible. These are summarized below as challenges/barriers and opportunities/facilitators, for development and implementation of nutrition labelling policies, and monitoring and enforcement of policies.
development and implementation
Opportunities/facilitators for development and implementation:
Intersectoral collaboration and stakeholder engagement, transparent processes, supporting evidence, civil society support.
For example, supporting evidence has been shown to be critical to successful development and implementation in Chile, Israel and New Zealand; and media coverage has been reported to contribute to transparency, thus supporting the process and helping to mobilize civil society.
Challenges/barriers to development and implementation:
Conflicting interests, industry interference and opposition, lack of or inadequate human and financial resources, lack of continued public campaigns and media support, the complexity of developing a labelling scheme (including nutrient profiling aspects, defining “unhealthy” and deciding on the optimal system for a given context).
For example, studies from a number of countries (in Asia, Africa, the Middle East and Latin America) concluded that industry involvement reduces the regulatory strength of FOPL.
A qualitative study reported that the food industry considered FOPL a barrier to food innovation.
Annex 2. SuMMARy TABleS

implementing nutrition labelling policies
48
Monitoring and enforcement
Frameworks or programmes for monitoring and evaluation (and, when relevant, enforcement) are recognized as key elements in health policy, including nutrition labelling policies. Ensuring that these are integral components of the policy has shown to affect overall feasibility of policy action.
Opportunities/facilitators for monitoring and enforcement:
Developing clear guidelines and structures for monitoring, evaluation and enforcement as part of implementing a nutrition labelling policy; making different sectors responsible for different parts of the monitoring, evaluation and enforcement of a policy (e.g. tasking national academia with evaluations, and health authorities with enforcement and monitoring of noncompliance); allocation of adequate human and financial resources.
Challenges/barriers to monitoring and enforcement:
Methodological difficulties in developing formal monitoring, evaluation and enforcement structures due to the “novelty” of the policy action and the lack of country experiences or evidence to base these on; lack of formal guidelines for existing regulations; lack of transparency; inadequate human and financial resources.
Impact on health systems, food systems and the policy environment
Evidence is limited for this criterion. However, a large modelling study found that a multiple-intervention strategy (including health information and communication strategies that improve population awareness about the benefits of healthy eating and physical activity, fiscal measures that increase the price of unhealthy food content or reduce the cost of healthy foods rich in fibre, regulatory measures that restrict the marketing of unhealthy foods to children, and mandatory food labelling) would achieve substantially larger health gains than would individual interventions, often with an even more favourable cost-effectiveness profile.


For more information, please contact:
department of nutrition and Food Safety World Health Organization Avenue Appia 20, CH-1211 Geneva 27, Switzerland
Fax: +41 22 791 4156 email: [email protected] www.who.int/nutrition