A Systematic Review of Individual and Contextual Factors ...

INDIVIDUAL AND CONTEXTUAL LEVEL FACTORS ASSOCIATED WITH INITIATION, COMPLETION AND UP TO DATE VACCINATION IN ROUTINE
IMMUNIZATION PROGRAM: AN ANALYSIS OF PAKISTAN DEMOGRAPHIC AND HEALTH SURVEYS,
1990 AND 2006
by
Noor Sabah Rakhshani
A dissertation submitted to the Johns Hopkins University in conformity with the requirements for the degree of Doctor of Public Health
Baltimore, Maryland
January, 2014

ii
"Intended to be blank."

iii
I. Abstract
Introduction
Pakistan has one of the highest infant mortality rates at 78 deaths per 1000 live births per year;
one in every eleven children born in Pakistan dies before his or her fifth birthday. Timely and
complete vaccination is a proven and highly cost effective public health intervention to reduce
death and disability, especially in children. Among other causes, vaccine preventable infectious
diseases are a significant contributor to child mortality in Pakistan.
Study methods
We assessed the association of contextual and individual level characteristics, using Pakistan
Demographic and Health Survey (PDHS) data, with the initiation, completion and up to date
(UTD) immunization for children 12 to 23 months old in Pakistan. The contextual level
characteristics included province of residence, rural or urban place of residence and whether the
child was issued a health card by the Expanded Program of Immunization (EPI) staff. The
individual level determinants included the household wealth index, gender of the head of the
household, maternal age, maternal education and ethnicity, gender and birth order of child and
number of children under five years of age in the household. Design based analysis was carried
out to account for the complex survey design of the Pakistan DHS 2006 and 1990 datasets. Using
logistic regression analysis, we assessed the independent association of individual, household and
contextual variables with initiation and completion of vaccination for the routine immunization
schedule of children aged 12 to 23 months. Following unadjusted analysis, the independent effect
estimates were assessed along with biological plausibility to select variables for adjusted
multivariable logistic regression analysis. Confounding of variables was measured through
stratified analysis. Interaction terms were included in the final model to assess their interactive
effect but there were no statistically significant interactive effects of the variables in the final

iv
models. Chi-square goodness of fit was used to compare appropriateness between different
models.
Results
The results of the analysis of the PDHS 2006 showed the household wealth index and maternal
education as statistically significant factors with vaccination initiation. Children in the richest
household wealth index were more likely to initiate vaccination compared to children in the
poorest wealth quintile. Similarly, children whose mothers had higher education were more likely
to initiate vaccination. In 1990, maternal education was significantly associated with vaccination
initiation but mothers with primary education did not behave differently from mothers with no
education. Also household wealth was statistically significant; children in the richest wealth
quintile had ten times higher odds of vaccination initiation compared to children in the poorest
quintile. In 1990 province of residence was a significant predictor of vaccination initiation only in
the province of Sindh.
In the PDHS 2006 data analysis, having a vaccination card and mothers’ education were
statistically significantly associated with vaccination schedule completion. In the PDHS 1990
analysis, the wealth index and maternal age were found to have a significant association with
vaccination schedule completion. Between 1990 and 2006 immunization coverage improved
significantly only among the middle wealth quintile with little improvement in households in the
poorest and poor wealth quintiles. Having a health/immunization card was significantly
associated with vaccination completion in both 1990 and 2006 and it was the only predictor of up
to date immunization in the PDHS 2006 analysis. The children for whom the card was seen at the
time of the interview were 21 times more likely to be UTD compared to children who were never
issued a health card. The interaction terms of possession of health/immunization card, wealth
index, and maternal education were not statistically significant.

v
Discussion
Although position in a higher wealth quintile and mothers’ higher education are individual level
characteristics, these associations may also suggest that the health care system is geared to cater
to the needs of the population with better access to sources of income and human development.
The government should increase its efforts to reach marginal populations with limited financial
resources and access to social services like education, better transport and mass media. Once the
health care system aims for equitable access of health care services, then even children in lower
wealth quintiles are more likely to complete their vaccination schedule.
Increasing female literacy is crucial for improving the health of the population and thus reducing
infant and under-five mortality. The government has strengthened its efforts to increase female
enrollment and keep girls in school beyond primary level but it also needs to focus on the quality
of education provided to these girls. The odds of immunization initiation and completion were
similar for mothers with up to primary education and those without a formal education; therefore
while girls are enrolled in primary school every effort should be made to educate them about
health and benefits of preventive health services. It is recommended that the primary school
curriculum needs to be updated to address the significance and effect of immunization.
Possession of a health card and seen at the time of the interview is a measure of maternal attitudes
and understanding towards the importance of immunization completion but it is also the single
most significant factor predicting vaccination completion. But in our sample only 13% of the
mothers in 2006 were able to show the household held immunization record at the time of the
interview and a quarter of children initiating the immunization schedule were never issued an
immunization card according to the mothers’ reports. The EPI program must invest in
digitalization of immunization and health records for children. The importance of a health card in
vaccination schedule completion has been documented in other parts of the world, including
Pakistan. Therefore until digital immunization records are widespread, the EPI program must

vi
make provision of waterproof, tear resistant and easily stored immunization cards to each and
every child initiating the schedule. Also cards that have a better system of reminding mothers of
the vaccine due dates are highly recommended to improve immunization completion, especially
among mothers who do not have access to electronic reminder systems like cell phones and those
who lack education. The EPI program needs to evaluate its performance on more stringent
criteria. Instead of just reporting DTP 1 and 3 among children 12-23 months of age, it should also
monitor Up to date (UTD) immunization status of children 52 weeks of age. Although
vaccination and immunization programs are in their fourth decade of global introduction, there
still is a need to create a social value for immunization to reap the maximum benefits of the
vaccines on the health of children and the general population.

vii
II. Committee of Final Thesis Readers
Committee members:
1. Lawrence H. Moulton
Professor and chair of the committee
Department of International Health
2. Laura Morlock
Professor and Thesis advisor
Department of Health Policy and Management
3. Jill A. Marsteller
Associate Professor
Department of Health Policy and Management
4. Saifuddin Ahmed
Associate Professor
Population, Family and Reproductive Health
5. Daniel Salmon
Associate Professor and Thesis public health practitioner
Department of International Health
Alternate Committee Members:
I. Albert Wu
Professor
Department of Health Policy and Management
II. James Tonascia
Professor
Department of Biostatistics

viii
To Kaka, Mir Qudratullah Jamaldini, my godfather and uncle who always wanted me to excel academically

ix
III. ACKNOWLEDGMENTS
I would like to express my sincere gratitude and acknowledgement to the people without
whom it would not have been possible for me to complete my DrPH dissertation. I thank my
thesis committee, Dr. Lawrance Moulton, Dr. Laura Morlock, Dr. Saifuddin Ahmed, Dr.
Denial Salmon and Dr. Jill Marsteller for their time and insights into refining my dissertation
and helping me understand the science of vaccine research.
I would like to extend my most heartfelt thanks to Dr. Laura Morlock for her continued
support and encouragement during my five years in the DrPH program. I had the privilege of
learning from her professional expertise as well as personal excellence in management and
producing quality results. As my academic advisor Dr. Morlock followed and guided my
learning to help me build the skills needed for success in research and health care
management. As my thesis advisor Dr. Morlock supported me with her time and feedback in
conceptualizing, writing and refining my thesis proposal as well as completion and defending
my final dissertation. I have also benefited greatly from her guidance and insight in my
personal life. Dr. Morlock has always been mindful of my responsibility as a mother of two
young girls and their wellbeing. During our first meeting she asked me not to turn off my cell
phone as I am a mother of two young children and may get a call from their school any time.
Dr. Morlock encouraged all my endeavors of professional and personal growth and gave me
her unconditional support to complete my doctoral program. I will practice in my
professional life the excellence and leadership skills I have learned from the DrPH program
and from Dr. Morlock.
I would like to thank Dr. Ann-Michele Gundlach for being my academic mentor during my
MPH and DrPH programs at Johns Hopkins University. I admire her for her dedication to her
work and the degree of perfection with which she executes her work. I selected the “health
care management and leadership” concentration during my MPH program because I wanted

x
to learn and be able to execute each task with the same degree of preparedness as Ann-
Michele Gundlach. Learning from Dr. Gundlach during my MPH built in me the appreciation
for health care management and it was due to her influence that I chose to pursue a DrPH in
health care management and leadership. During my six years at Hopkins whenever I needed
to talk to someone about my studies, ambitions and limitations I contacted Ann-Michele and
she was always there to listen to me and help me figure out how to best approach a situation.
She has listened to me, guided me and expressed her well wishes for my family and me at all
times. I look forward to keeping in touch with Dr. Gundlach and to continue our
conversations for the years to come.
I would like to thank Dr. Orin Levine for accepting to be my thesis advisor and to guide me
in understanding the concepts and issues related to vaccine research. He helped me formulate
my research question and navigated me through the technical details pertaining to my
research work. He had to take responsibilities at the Gates Foundation before my graduation
from the program but what I learned from him helped me complete my dissertation under the
mentorship of Dr. Morlock.
I would like to thank Dr. Saifuddin Ahmed for his excellent teaching and guidance. I learned
the skills of survey data analysis during the courses he taught which I used for my
dissertation data analysis. Taking his two courses on survey data analysis taught me the
technical skills of how to approach large population data sets and writing the Stata commands
to run my analysis. I thank him for the efforts he took to help us understand in class the
essentials of survey data analysis and the need to make unbiased inferences.
I would like to thank Dr. Lawrence Moulton for reviewing my doctoral dissertation in great
detail and helping me refine its content and analysis. I have gained immensely from his keen
observation and great understanding of statistical analysis and vaccine research. I look

xi
forward to learning continually from him. I would like to thank Dr. Daniel Salmon for
helping me better understand my research topic and improve the validity of my results. I so
much appreciate the advice and support I received from Dr. Jill Marsteller during the final
phase of my dissertation writing. I am grateful to her for asking me to write my personal
reflection of the DrPH journey and what I have learned in the past five years. She encouraged
me to reflect on my strengths and limitations as a researcher and what I want to continue
learning as a professional.
I would like to acknowledge my colleague Russell Shinohara for listening patiently to my
every idea and for helping me put into writing my thoughts in the language of statistics. I
would like to thank the staff at the “biostat clinic” offered by the Department of Biostatistics
at Hopkins for helping me write the Stata commands to run my analysis. I would also thank
my DrPH fellow students Babak Mohit, Rosemary Nabaweesi and Anuli Ajene for their
support and encouragement in preparing my thesis proposal. I am so thankful to Dr. Lilly
Engineer for her guidance navigating me through the logistics and preparing me mentally for
the challenges of undertaking all my exams and final defense. Her suggestions and comments
have helped me improve my thesis and stay on time with my timeline. I would like to thank
Dr. Kevin Frick and Dr. David Bishai for their time and insight in helping me develop my
thesis proposal and being on my oral exam committee. I would like to acknowledge Dr.
James Tonascia and Dr. Albert Wu for allocating the time to be my alternate committee
members.
I would like to thank the faculty and staff of the Johns Hopkins Bloomberg School of Public
Health who have made it possible for me to learn from their knowledge and to be supported
in the logistics of undertaking this endeavor.

xii
I am grateful to the United States Education Foundation Pakistan and the Fulbright
Fellowship for supporting my full tuition and stipend for my Masters and Doctoral studies at
the Johns Hopkins University for six years. I am also grateful to the Department of Health
Policy and Management for supporting my tuition during my final year and my final defense.
I would also like to thank the International Institute of Education, USA, for the logistic
support they provided me during my Fulbright Fellowship. I thank DHS Macro International
for providing the Pakistan Demographic and Health Survey Data sets for the years 2006 and
1990 for use in the analysis of my dissertation.
I am grateful to all my family members who have supported me during my DrPH and helped
me bring this dissertation to completion.
I want to dedicate my dissertation to my Godfather and paternal uncle, Quadratullah
Jamaldini who has loved me unconditionally and has always aspired for me to attain the
highest academic accolades. I am happy that I have been able to fulfill his dreams for me and
want to continue my personal and professional growth to become the person he wants me to
be.
I want to thank my mother Saira Jangul and father Noorullah Khan who have inspired in me
the love for books and given me the opportunities to grow to my potential. They have
supported me all my life and their belief in me has always been my source of strength.
Whatever I have achieved today is because of them and the sacrifices they have made to
provide my brother and me a loving and nurturing home.
To my brother go my deepest thanks for being there for me and listening to me for hours with
encouragement and support.
I am so blessed to have two most wonderful daughters Laila Noor Khan and Nida Noor
Khan; they are the joy of our life. My daughters have endured a lot in my pursuit of higher

xiii
education, they were relocated from our native country to come to the United States, had to
stay at after school programs and live with a “student mom” who always had work to do. But
they have turned out to be great kids who have excelled academically and are gifted in the
arts. I am also thankful for our baby son Tayyab Mohammad Khan for bringing joy to our
lives after being born a few months before my final defense.
To my husband, Imran—you have been my companion, teacher and resource person past,
present and future. I don’t know how I could have come this far professionally and completed
my dissertation without you, but I always pray that I don’t have to do anything without you.

xiv
Personal reflection: undertaking the DrPH journey
Reflecting on the five years journey in pursuing my doctoral degree in Health Care
Management and Leadership has provided me with insights about me as a researcher, my
strengths and weaknesses and why I decided to enroll in the program. I joined the doctoral
program to understand and be able to plan, manage and lead health organizations and
eventually health systems. At the end of my program I feel my training at Hopkins has given
me the necessary skills and now it is time for me to use these in my professional life. I realize
that my strengths lie in my paying attention to detail, understanding an issue and solving it in
total to achieve meaningful results. I also have come to realize that I need to learn to delegate
tasks and components of work to the experts in the given field.
As I think and reflect on my research journey and the five years I have spent at Hopkins, I
have realized that a thesis is a journey that one should not embark on alone, and one has to
seek as much input and help as one can from faculty and fellow researchers. I have gained the
most understanding about my topic and research methods through my discussions with my
program and schoolfellows and the faculty at Hopkins.
On a more personal level I have also realized that I have to listen to my body as often as I
listen to my heart. Two years ago I started having severe body aches and a lack of will to do
routine tasks. Even getting out of the bed each morning was becoming a challenge. I just
kept on telling myself that this was just because I was being lazy and stressed with working
on a thesis. After suffering for more than a year I visited my gynecologist, suspecting a
premature menopause. I was wrong in my diagnosis: I was not stressed from work nor had
premature menopause but was suffering from Hypothyroidism. I started on thyroxin and was
amazed at how my body responded to it; now I no longer think I am lazy. I think this is what
I would like to share with my fellow doctoral students: we must listen to our bodies, seek
help and don't assume we are lazy.

xv
I. ABSTRACT III
II. COMMITTEE OF FINAL THESIS READERS VII
III. ACKNOWLEDGMENTS IX
IV. LIST OF TABLES XVIII
V. LIST OF FIGURES XXI
CHAPTER 1: INTRODUCTION 1
Problem Statement 2 Pakistan Expanded Program of Immunization 4 Pakistan country context 6 Public health significance 7
Conceptual Framework 9
CHAPTER 2: LITERATURE REVIEW 19
Overview of the global immunization coverage 20
Global Expanded Program on Immunization 24
Expanded Program on Immunization (EPI) Pakistan: A Review 24 Government of Pakistan health policies 25 Budgetary allocation for the EPI 27 Funding sources and donors for EPI Pakistan 28
Factors associated with initiation of immunization schedule (low, middle and high income countries) 31
Factors associated with completion of immunization schedule 31
Challenges facing the Expanded Program on Immunizations - Pakistan 35
Timeliness of immunization 38
Success stories of vaccine/immunization programs 39
Validity of the measures of immunization status 43 Validity of maternal/personal recall 43 Validity of household held immunization records 45
CHAPTER 3: METHODS 48
Specific aims 49
Research Hypotheses 49
The research hypothesis for each specific aim includes the following: 49

xvi
Description of the source of study data 49 Demographic and Health Survey 49
Description of the study instrument and its development 58
Study Population 59
Analytic methods 60 Data cleaning 60 Creation of data set 61 Creation of variables 61 The contextual level variables 64 Individual level characteristics 66
Types of analyses performed 67
Specific Aim I 69 Research question 69 Research Hypothesis 69 Statistical analysis 70 Sample size and power calculation 70
Specific Aim II 72 Research question 72 Hypothesis 72 Statistical analysis 73 Sample size and Power calculation: 74
Specific Aim III 75 Research question 75 Research Hypothesis 75 Statistical analysis 76
Predictors of an immunization card retention 77
Human subjects issues 78
CHAPTER 4: RESULTS 81
Specific aim 1 82 Descriptive analysis 82 Unadjusted analysis: vaccination initiation 84 Adjusted analysis: vaccination initiation 88
Specific aim 2 103 Descriptive analysis 103 Unadjusted analysis: vaccination completion 105 Adjusted analysis: Vaccination completion 108

xvii
Specific aim 3 124 Descriptive analysis 124 Unadjusted analysis: Up to Date vaccination 125 Adjusted analysis: Up To Date vaccination 126
Predictors of immunization card retention 136
CHAPTER 5: DISCUSSION 144 Immunization card retention 152
REFERENCES 163
ADDITIONAL TABLES 171
CURRICULUM VITAE 176

xviii
IV. LIST OF TABLES TABLE 1: COMPONENTS OF THE FRAMEWORK AND VARIABLES PROPOSED FOR ANALYSIS ............................. 12 TABLE 2: FRAMEWORK COMPONENTS AND VARIABLES OF INTEREST CAPTURED BY SOURCE OF INFORMATION
.............................................................................................................................................................. 13 TABLE 3 ROUTINE IMMUNIZATION SCHEDULE FOR CHILDREN IN EPI-PAKISTAN, 2012 ................................ 30 TABLE 4. NUMBER OF HOUSEHOLDS SELECTED, AND INTERVIEWS CONDUCTED FOR THE PDHS 2006-07
(NUMBERS BELOW ARE FOR HOUSEHOLDS THAT WERE AVAILABLE FOR INTERVIEW) ............................ 52 TABLE 5 NUMBERS OF PRIMARY SAMPLING UNITS AND HOUSEHOLDS COVERED, ELIGIBLE WOMEN AND
HUSBANDS INTERVIEWED IN THE FOUR PROVINCES PDHS 1990-91 (NUMBERS BELOW ARE FOR
HOUSEHOLDS THAT WERE AVAILABLE FOR INTERVIEW) ........................................................................ 55 TABLE 6 SURVEY SAMPLE SIZE FOR RURAL AREAS 1990-91 ......................................................................... 57 TABLE 7 DESCRIPTION OF CODING PROCEDURES FOR DEPENDENT VARIABLES USED FOR ANALYSIS OF THE
PDHS DATA .......................................................................................................................................... 63 TABLE 8: DEFINITION OF OUTCOME VARIABLES USED FOR ANALYSIS ........................................................... 79 TABLE 9 CHARACTERISTICS OF CHILDREN 12 TO 23 MONTHS OF AGE IN THE PAKISTAN DEMOGRAPHIC AND
HEALTH SURVEY (PDHS) 2006 ............................................................................................................ 89 TABLE 10 CHARACTERISTICS OF CHILDREN 12 TO 23 MONTHS OF AGE IN THE PAKISTAN DEMOGRAPHIC AND
HEALTH SURVEY (PDHS) 1990 ............................................................................................................ 91 TABLE 11 CHARACTERISTICS OF CHILDREN 12 TO 23 MONTHS OF AGE IN THE PAKISTAN DEMOGRAPHIC AND
HEALTH SURVEY (PDHS) 1990 ............................................................................................................ 93 TABLE 12: ODDS RATIOS FOR INDIVIDUAL AND CONTEXTUAL CHARACTERISTICS ASSOCIATED WITH THE
RECEIPT OF THE FIRST DOSE OF DTP VACCINE AMONG CHILDREN AGED 12 TO 23 MONTHS, USING
LOGISTIC REGRESSION ANALYSIS, PAKISTAN DEMOGRAPHIC AND HEALTH SURVEY 2006 .................... 95 TABLE 13: ODDS RATIOS FOR INDIVIDUAL AND CONTEXTUAL CHARACTERISTICS ASSOCIATED WITH RECEIPT
OF THE FIRST DOSE OF DTP VACCINE AMONG CHILDREN AGED 12 TO 23 MONTHS, USING LOGISTIC
REGRESSION ANALYSIS, PAKISTAN DEMOGRAPHIC AND HEALTH SURVEY 1990 ................................... 97 TABLE 14: ADJUSTED ODDS RATIOS OF THE FULL MODEL FOR CONTEXTUAL AND INDIVIDUAL LEVEL
VARIABLES ASSOCIATED WITH THE RECEIPT OF THE FIRST DOSE OF DTP VACCINE AMONG CHILDREN AGED 12 TO 23 MONTHS, USING LOGISTIC REGRESSION ANALYSIS, PAKISTAN DEMOGRAPHIC AND
HEALTH SURVEY 2006 .......................................................................................................................... 99 TABLE 15: DESCRIBING THE ADJUSTED ODDS RATIO OF REDUCED MODEL FOR CONTEXTUAL AND INDIVIDUAL
LEVEL VARIABLES OF POPULATION ASSOCIATED WITH THE RECEIPT OF FIRST DOSE OF DTP VACCINE IN CHILDREN AGED 12 TO 23MONTHS OLD USING LOGISTIC REGRESSION ANALYSIS, PAKISTAN
DEMOGRAPHIC AND HEALTH SURVEY 2006 ........................................................................................ 100 TABLE 16 DESCRIBING THE ADJUSTED ODDS RATIO OF FINAL MODEL FOR CONTEXTUAL AND INDIVIDUAL
LEVEL VARIABLES OF POPULATION ASSOCIATED WITH THE RECEIPT OF FIRST DOSE OF DTP VACCINE IN CHILDREN AGED 12 TO 23MONTHS OLD USING LOGISTIC REGRESSION ANALYSIS, PAKISTAN
DEMOGRAPHIC AND HEALTH SURVEY 2006 ........................................................................................ 101 TABLE 17: ADJUSTED ODDS RATIOS FOR INITIATION OF IMMUNIZATION AMONG CHILDREN 12 TO 23 MONTHS
OF AGE, USING LOGISTIC REGRESSION ANALYSIS IN THE PAKISTAN DEMOGRAPHIC AND HEALTH
SURVEY 1990 ...................................................................................................................................... 102 TABLE 18: SAMPLE CHARACTERISTICS OF THOSE WHO RECEIVED THE FIRST DOSE OF DTP VACCINE AMONG
CHILDREN 12 TO 23 MONTHS OF AGE IN THE PAKISTAN DEMOGRAPHIC AND HEALTH SURVEY (PDHS)
2006 .................................................................................................................................................... 110 TABLE 19: CHARACTERISTICS OF CHILDREN WHO RECEIVED AND DID NOT RECEIVE THE THIRD DOSE OF DTP
VACCINE AMONG CHILDREN 12 TO 23 MONTHS OF AGE WHO RECEIVED THE FIRST DOSE OF DTP
VACCINE IN THE PAKISTAN DEMOGRAPHIC AND HEALTH SURVEY (PDHS) 2006 ............................... 112

xix
TABLE 20: CHARACTERISTICS OF CHILDREN 12 TO 23 MONTHS AGE WHO RECEIVED THE THIRD DOSE OF DTP
VACCINE IN THE PAKISTAN DEMOGRAPHIC AND HEALTH SURVEY (PDHS) 1990 ............................... 114 TABLE 21: CHARACTERISTICS OF CHILDREN WHO RECEIVED AND DID NOT RECEIVE THE THIRD DOSE OF DTP
VACCINE AMONG CHILDREN 12 TO 23 MONTHS OF AGE WHO RECEIVED THE FIRST DOSE OF DTP
VACCINE IN THE PAKISTAN DEMOGRAPHIC AND HEALTH SURVEY (PDHS) 1990 ............................... 116 TABLE 22: UNADJUSTED ODDS RATIOS USING LOGISTIC REGRESSION ANALYSIS FOR INDIVIDUAL AND
CONTEXTUAL CHARACTERISTICS ASSOCIATED WITH RECEIPT OF THE THIRD DOSE OF DTP VACCINE AMONG CHILDREN AGED 12 TO 23 MONTHS WHO RECEIVED THE FIRST DOSE OF DTP VACCINE, PAKISTAN DEMOGRAPHIC AND HEALTH SURVEY 2006 ....................................................................... 118
TABLE 23: UNADJUSTED ODDS RATIOS USING LOGISTIC REGRESSION ANALYSIS FOR INDIVIDUAL AND CONTEXTUAL CHARACTERISTICS ASSOCIATED WITH RECEIPT OF THE THIRD DOSE OF DTP VACCINE
AMONG CHILDREN AGED 12 TO 23 MONTHS WHO RECEIVED THE FIRST DOSE OF DTP VACCINE, PAKISTAN DEMOGRAPHIC AND HEALTH SURVEY 1990 ....................................................................... 120
TABLE 24: ADJUSTED ODDS RATIOS USING LOGISTIC REGRESSION ANALYSIS FOR INDIVIDUAL AND CONTEXTUAL CHARACTERISTICS ASSOCIATED WITH RECEIPT OF THE THIRD DOSE OF DTP VACCINE AMONG CHILDREN AGED 12 TO 23 MONTHS WHO RECEIVED THE FIRST DOSE OF DTP VACCINE, PAKISTAN DEMOGRAPHIC AND HEALTH SURVEY 2006 ....................................................................... 122
TABLE 25: ADJUSTED ODDS RATIOS USING LOGISTIC REGRESSION ANALYSIS FOR INDIVIDUAL AND
CONTEXTUAL CHARACTERISTICS ASSOCIATED WITH RECEIPT OF THE THIRD DOSE OF DTP VACCINE AMONG CHILDREN AGED 12 TO 23 MONTHS WHO RECEIVED THE FIRST DOSE OF DTP VACCINE, PAKISTAN DEMOGRAPHIC AND HEALTH SURVEY 1990 ....................................................................... 123
TABLE 26 UTD IMMUNIZATION STATUS FOR INDIVIDUAL VACCINES AMONG CHILDREN 36-52 WEEKS OF AGE, 2006 PDHS ......................................................................................................................................... 128
TABLE 27 CHARACTERISTICS OF CHILDREN 36-52 WEEKS OF AGE AND UTD IMMUNIZATION STATUS, 2006, PAKISTAN DHS ................................................................................................................................... 129
TABLE 28: UNADJUSTED ANALYSIS USING LOGISTIC REGRESSION OF INDIVIDUAL AND CONTEXTUAL FACTORS ASSOCIATED WITH UP TO DATE IMMUNIZATION AMONG CHILDREN 36-52 WEEKS OF AGE IN PAKISTAN
(PDHS 2006) ...................................................................................................................................... 131 TABLE 29: ADJUSTED ANALYSIS OF INDIVIDUAL AND CONTEXTUAL FACTORS, EXCLUDING IMMUNIZATION
CARD FROM ANALYSIS, ASSOCIATION WITH UP TO DATE IMMUNIZATION IN CHILDREN IN PAKISTAN
(PDHS 2006) ...................................................................................................................................... 133 TABLE 30: ADJUSTED ANALYSIS OF INDIVIDUAL AND CONTEXTUAL FACTORS, INCLUDING IMMUNIZATION
CARD, ASSOCIATION WITH UP TO DATE IMMUNIZATION IN CHILDREN IN PAKISTAN (PDHS 2006) ...... 134 TABLE 31: SELECTED SOCIO-ECONOMIC CHARACTERISTICS BY POSSESSION OF AN IMMUNIZATION CARD FOR
CHILDREN 11-60 MONTHS IN THE PAKISTAN DEMOGRAPHIC HEALTH SURVEY 2006 ........................... 139 TABLE 32: CONFIRMATION OF VACCINATION INITIATION (DPT1) BY SOURCES BY SOCIO-ECONOMIC FACTORS
FOR CHILDREN 11-60 MONTHS IN THE DHS IN PAKISTAN 2006 ........................................................... 140 TABLE 33: CONFIRMATION OF VACCINATION COMPLETION (DPT3) BY SOURCES AND SOCIO-ECONOMIC
FACTORS FOR CHILDREN 11-60 MONTHS IN THE DHS IN PAKISTAN 2006 ............................................ 141 TABLE 34: UNADJUSTED ODDS RATIOS AND 95% CONFIDENCE INTERVALS FROM LOGISTIC REGRESSION FOR
THE ASSOCIATIONS BETWEEN SOCIO-ECONOMIC FACTORS AND POSSESSION OF AN IMMUNIZATION CARD
FOR CHILDREN 11-60 MONTHS IN THE PDHS 2006 .............................................................................. 142 TABLE 35: ADJUSTED ODDS RATIOS AND 95% CONFIDENCE INTERVALS FROM LOGISTIC REGRESSION
ANALYSIS FOR THE ASSOCIATIONS BETWEEN SOCIO-ECONOMIC FACTORS AND POSSESSION OF AN
IMMUNIZATION CARD FOR CHILDREN 11-60 MONTHS IN THE PDHS 2006 ........................................... 143 TABLE 36 ADJUSTED ODDS RATIOS FOR INDIVIDUAL AND CONTEXTUAL CHARACTERISTICS OF POPULATION
WITH THE RECEIPT OF THIRD DOSE OF DTP VACCINE HAVING RECEIVED FIRST DOSE OF DTP VACCINE IN

xx
CHILDREN AGED 12 TO 23MONTHS OLD USING LOGISTIC REGRESSION ANALYSIS, PAKISTAN
DEMOGRAPHIC AND HEALTH SURVEY 2006 (FULL MODEL) ................................................................ 171 TABLE 37 ADJUSTED ODDS RATIOS FOR INDIVIDUAL AND CONTEXTUAL CHARACTERISTICS OF POPULATION
WITH THE RECEIPT OF THIRD DOSE OF DTP VACCINE HAVING RECEIVED FIRST DOSE OF DTP VACCINE IN
CHILDREN AGED 12 TO 23MONTHS OLD USING LOGISTIC REGRESSION ANALYSIS, PAKISTAN
DEMOGRAPHIC AND HEALTH SURVEY 2006 (REDUCED MODEL) ......................................................... 172 TABLE 38: ADJUSTED ASSOCIATION OF INDIVIDUAL AND CONTEXTUAL LEVEL FACTORS WITH POSSESSION OF
A VACCINATION (HEALTH) CARD AS A RECORD OF VACCINATION HISTORY IN CHILDREN IN PAKISTAN
DEMOGRAPHIC HEALTH SURVEY, 2006-07 ......................................................................................... 173

xxi
V. LIST OF FIGURES FIGURE 1 PERCENTAGE OF CHILDREN AGE 12-23 MONTHS WHO ARE FULLY IMMUNIZED, BY BACKGROUND
CHARACTERISTICS, PDHS 2006-07 ......................................................................................................... 5 FIGURE 2 TRENDS IN VACCINE COVERAGE, PERCENTAGE OF CHILDREN AGE 12-23 MONTHS WHO RECEIVED
BCG AND DTP VACCINE, 1991 – 2007, PAKISTAN .................................................................................. 5 FIGURE 3 ADAPTED FROM ANDERSEN & ADAY “BEHAVIOR MODEL AND ACCESS TO HEALTH CARE”
FRAMEWORK ........................................................................................................................................... 9 FIGURE 4 GLOBAL COVERAGE OF DTP3 VACCINE AND THE REPORTED CASES OF DIPHTHERIA ...................... 21 FIGURE 5. DHS 2006-07 SURVEY DESIGN AND NUMBER OF HOUSEHOLDS AND ELIGIBLE WOMEN
INTERVIEWED ........................................................................................................................................ 51

1
Chapter 1: Introduction

2
Problem Statement
In Pakistan, 88% of the children initiate the immunization schedule when they receive the first
dose of Bacille Calmette Guerin (BCG) vaccine and 81% complete the entire schedule according
to the Pakistan Social and Living Standards Measurement (PSLM) Survey 2010 – 2011.
However, this coverage is far from uniform: in the Southwest province of Balochistan, 63% of
the children initiate the immunization schedule but only half of the children complete the
schedule. This discrepancy is further highlighted in the Pakistan Demographic and Health Survey
(PDHS) 2006-07 which reported that almost 29% of the children under five years of age in the
remote province of Balochistan did not receive any vaccine. According to the PDHS 2006-07,
the gap in full immunization, defined as having received BCG vaccine, three doses each of
Diphtheria-Purtussis-Tetanus vaccine (DTP) and Oral Polio Vaccine (OPV), is more marked in
the rural areas compared to urban areas with 44% and 54% respectively having full coverage
across all the four provinces of Pakistan. This gap is also seen across the socio-economic divide
with 64% in the highest wealth quintiles and 26% in the lowest wealth quintiles having full
coverage, and by gender with 44% and 50% for girls and boys fully vaccinated (Figure 1). A
similar discrepancy was reported by the PDHS 1990-91, which showed national immunization
coverage to be at 35% and full immunization for children up to 12 months of age at 22%.
According to the PDHS 1990-91 the breakdown of percentages of children 12 – 23 months of age
and fully immunized at the time of the interview in the four provinces was 38.6% for Punjab,
37.6% for Khyber Pakhtunkhwa (KPT), 25.3% for Sindh and 17.8% for Balochistan. The number
of children never vaccinated was 28.3% at the national level and 57.2% for the province of
Balochistan (Abdul Razzaque Rukanuddin, K. Zaki Hasan 1992).
The World Health Organization (WHO) recommends immunization coverage of 90% at the
national level and at least 80% coverage at the sub-national level for every district. (Anonymous;
WHO Department of Immunization, Vaccines and Biologicals, UNICEF Programme Division,

3
Health Section 2005) But even with the current efforts, 11 out of 142 districts in Pakistan have
50% or less coverage for the third dose of Diphtheria – Tetanus – Pertussis (DTP3) vaccine
(World Health Organization December, 2010). The increase in vaccination coverage has been
slow over the past two decades and the trends for vaccination completion are equally
discouraging. Between 1990-91 and 2006 – 07 eight surveys have collected data on
immunization coverage and completion on a national level in Pakistan. The results for national
coverage of Bacille Calmette Guerin (BCG) and completion of the three doses of DTP from these
eight surveys are presented in Figure 2. Due to the differences in survey methodologies and
questionnaire design of these surveys any comparison of results would need to take these
differences into account. The results from some of these surveys have biased findings; for
example, the Pakistan Integrated Household Survey (PIHS) 2001-02 presented the number of
children who received oral polio 1 compared to oral polio 2 as 68% and 91% respectively.
Similarly the Pakistan Social and Living Standards Measurement Survey (PSLM) 2004-05 shows
no dropout between the DTP first and third dose. These findings contradict the accepted pattern
of vaccine dose completion and dropout rates (Anonymous).
The gap in immunization completion is a waste of resources and results in the suffering of
children in the presence of an immunization program. The immunization program in Pakistan
needs innovative and sustained efforts to close the gap between immunization initiation and
completion as well as timely completion for all children across all the four provinces, gender and
socio-economic divides. An understanding of the factors associated with vaccination initiation
and completion is important for program improvement efforts to ensure not only universal
coverage but that each and every child completes the immunization schedule in a timely and
complete manner.

4
Pakistan Expanded Program of Immunization
The Expanded Program of Immunization (EPI) for Pakistan provides vaccination against 9
vaccine preventable diseases to 1.5 million children annually. According to the EPI schedule
every child must receive a single dose of Bacille Calmette Guerin (BCG) and a dose of Hepatitis
B vaccines at birth; four doses of Oral Polio Vaccine (OPV 0,1,2,3) given at birth and at six, ten
and fourteen months of age; three doses of Pentavalent vaccine, Diphtheria – Tetanus – Pertussis
– Hepatitis B – Haemophilus Influenza type B (1,2,3) given at 6, 10 and 14 weeks; and
Pneumococcal Conjugate Vaccine (PCV) administered at the same time as the Pentavalent. A
single dose of measles vaccine is given at nine months of age followed by a booster dose at 15
months of age (World Health Organization December, 2010). The EPI Pakistan’s aim is to attain
full immunization against the nine vaccine preventable diseases in 80% of the districts by 2012
with the schedule to be completed by 11 months of age (Government of Pakistan 01, 2011).

5
Figure 1 Percentage of children age 12-23 months who are fully immunized, by background characteristics, PDHS 2006-07
Source: Pakistan DHS 2006-07 Report
Figure 2 Trends in vaccine coverage, percentage of children age 12-23 months who received BCG and DTP vaccine, 1991 – 2007, Pakistan
Pakistan Demographic and Health Survey (PDHS), Pakistan Integrated Household Survey (PIHS), Pakistan Social and Living Measurements Survey
(PSLM), Expanded Program for Immunization (EPI)
0
10
20
30
40
50
60
70
80
90
PDHS 1990-91
PIHS 1995-96
PIHS 1996-97
PIHS 1998-99
PIHS 2001-02
PSLM 2004-05
EPI 2006
PDHS 2006-07
BCG
DPT 1
DPT 2
DPT 3

6
Pakistan country context
The total population of Pakistan is 170 million and 14.5% of the population is under-five years of
age (Government of Pakistan 2011). At a population growth rate of 1.9, 4 million births are
estimated annually. Pakistan is a low-income country with a per capita GDP of 1,010 USD
(United Nations Statistics Division 12, 2010) and 32.6% of the population lives below the
Pakistan poverty line (The World Bank 01, 2011). The government is ever pressed for increasing
funding in the public sector including health; however the annual budget allocation for health has
been only 0.3 – 0.6% of the GDP for the past several decades. The public health services are the
only source of providing vaccines for millions of children. Health programs like prevention of
HIV/AIDS, child malnourishment prevention along with the EPI are either partially or fully
funded by international donors. The distribution of resources and development programs in the
country are based on the political affiliation of an area with the ruling government and not on
empirical evidence or needs assessment. The political instability and mismanagement of
resources has chronically affected large areas of the country. Many areas with difficult
mountainous and dessert terrain have remained underdeveloped due to geographical isolation
from economic and administrative centers at provincial and national levels. Historical budgeting
is employed in the country for the allocation of resources and development in all sectors
particularly health, education and social amenities. All this has led to weak infrastructure and low
human development, resulting in poor health indicators. This is also highlighted by the PDHS
2006-07, which shows that regions with the highest malnourishment and lowest maternal
education have the lowest immunization rates. The high dropout rate for multi-dose vaccines like
DTP 1-3 is a challenge for the EPI program as documented in the two Pakistan demographic and
health surveys for the years 2006-07 and 1990-91.
Several studies in Pakistan have highlighted that household level poverty and lack of education
lead to poor health outcomes including low immunization levels especially in rural areas

7
(Mitchell et al. 2009, S7). Similarly, communities living in poverty and without adequate
education end up with poor health outcomes. There are marked differences in the distribution of
resources even within rural areas. Therefore rural areas in some regions of the country fare far
worse in health than rural areas with better resources and human development indicators.
Pakistan is trying to achieve the Millennium Development Goal (MDG 4, target 4 A) to reduce its
under five mortality by two thirds by 2015. Currently the under- five mortality in Pakistan is at 94
deaths per 1,000 live births per year, which represents a decline compared to the rates in 1990 but
the rate has remained stagnant since 2003. Vaccination is an important approach in reducing
child mortality (Jamil et al. 1999, 49-58). The DTP and measles vaccines avert an estimated 2.5
million deaths globally among all age groups each year (WHO Department of Immunization,
Vaccines and Biologicals 2010). It is estimated that annually in Pakistan vaccination averts
100,000 deaths due to measles, 70,000 cases of neonatal tetanus and 20, 000 cases of paralytic
poliomyelitis {{432 National Institute of Population Studies (NIPS), Macro International Inc
2008;}}. Pakistan recently introduced two new vaccines, Haemophilus influenzae type B (Hib) in
2008 and pneumococcal conjugate vaccine in 2012. The vaccine against Rota virus diarrhea is
planned for introduction in 2013. The addition of these new vaccines is estimated to reduce child
mortality by 15% (WHO EMRO 2013). Child mortality and morbidity can be reduced even
further with an increase in the vaccination coverage and promoting timely vaccination
completion. Timely completion of the vaccination schedule is crucial to attain maximum benefit
from the intervention especially among the young (Akmatov et al. 2008, 3805-3811) and to
prevent disease outbreaks (Luman et al. 2002, 935-939).
Public health significance
The factors associated with immunization completion and children never vaccinated have been
extensively documented in the peer-reviewed literature but there are few studies that specifically
look at factors associated with vaccination initiation. Several studies in Pakistan have been

8
conducted in the urban, semi-urban (Usman et al. 2010, 140-147) and rural areas (Cockcroft et al.
2009, S4; Shaikh et al. 2010, 806-810) to analyze the factors associated with vaccination
completion rates in the country. But none of the studies have used a nationally representative
dataset for their analysis nor have they assessed the factors associated with vaccination initiation
and up to date immunization. Studies have assessed vaccination completion and child never
vaccinated with the individual level characteristics such as sex of child, maternal education and
household wealth; and contextual level characteristics such as health system structure, poverty
levels and illiteracy levels. However, there is a lack of literature analyzing a cohort of children
who have initiated the vaccination schedule but failed to complete it. There are many examples
from developing countries of successful implementation of immunization programs in which 90%
or higher immunization coverage and completion rates have been achieved. With all the wealth of
information available for immunization program improvement, Pakistan has not been able to
attain universal coverage and high immunization completion in all four provinces of the country.
There is a need to understand the association of factors in the Pakistani context and identify
population subgroups that have high immunization coverage and completion despite the
individual and contextual odds against them.
Pakistan DHS 2006-07 is the most recent survey, has the largest sample size, and is the most
nationally representative survey that covers both the rural and urban areas in the country. This
data set is selected also because we want to be able to make a comparison with the PDHS 1990-
91 dataset. Comparing the magnitude and direction of the change in associations of the individual
and contextual level characteristics with immunization initiation, completion and UTD status
between the PHDS 2006-07 and 1990-91 datasets will enable us to identify variables most
malleable to change. The comparisons will also help identify which provinces are improving the
immunization status of children, how communities in urban and rural places of residence are
valuing childhood immunization and which population subgroups among the poorest, poor and
middle quintiles have improved or declined in immunization completion over the time period.

9
Figure 3 Adapted from Andersen & Aday “Behavior model and access to health care” Framework
Conceptual Framework
To understand the relationship between the availability of the vaccination services (supply by the
health care system) and the active utilization of the vaccination services (demand for vaccines by
parents), four frameworks were identified, including: i) Mosley and Chen (Mosley and Chen
2003, 140-145); ii) Conceptual Framework for Social Determinants of Health (Solar and Irwin
2007); iii) Conceptual Framework for Health Research System (Pang et al. 2003, 815-820) and
iv) Andersen & Aday “behavior model and access to health care” framework (Andersen 1995, 1-
10). These frameworks were evaluated for their relevance to the study objectives and simplicity
of use. Based on the criteria, the Andersen & Aday framework was selected to assess the
immunization coverage in Pakistan. It identifies the determinants of a health outcome as a series
of variables incorporating the 1) environment, 2) population characteristics and 3) health behavior
of the population under investigation (Figure 3). According to the authors the components of the
framework interact at different levels directly and/or through a series of interconnected
associations. The health care system can be an independent predictor of health status and

10
consumer satisfaction and also interact with population characteristics. Whereas population
predisposing characteristics can act as direct as well as intermediate predictors of health
outcomes. The health status of a population can be an enabling resource as healthy people use
more health services and the perceived health status can directly determine personal health
practices and use of health services. Three components of the framework are not modeled
because variables from the PDHS data set were not available to enable modeling with accuracy.
We assume unknown risk across all levels for these three left out components. The components
not included in modeling are i) population need, both perceived and prescribed, for immunization
services, ii) personal health practices of the population and iii) perceived health outcomes.
Consumer satisfaction with public health services for the treatment of a sick child (fever, diarrhea
and pneumonia) is collected by the PDHS 2006-07 but not for immunization services. The
components of the framework are described below and the variables proposed for use are given in
Table 1.
Environment: The framework presents the environment which includes the 1) health care system
and the 2) general external environment in which the study population lives. The general external
environment can also include the political, social and economic factors and events that shape the
movement of individuals and communities as well as uptake of services by them.
Population Characteristics: According to the framework several factors influence and
determine the uptake of health services by a population which are: 1) predisposing characteristics
of the population like the socioeconomic characteristics, 2) enabling resources available to the
population to access medical care/services and 3) need for health services by the population. The
population’s need for health care services are both i) perceived needs by the population and ii)
prescribed need by health care providers. The perceived health care needs are formed by the
health education and messages disseminated to the population and their awareness regarding a

11
health condition. The prescribed need for health care services is directed by health providers’
education, training, health protocols and policies.
Health behavior: The framework addresses health behaviors of a population by investigating: 1)
personal health practices and 2) use of health services. The former includes variables like diet,
exercise and self-care and the later involves use of formal health care services.
Outcomes: According to the framework three different outcomes can be evaluated through health
services research, including: 1) perceived health status; 2) evaluated health status; and 3) patient
satisfaction. The outcome for my research will be an evaluated health status identified as
vaccination status and the DTP vaccine schedule initiation and completion among children 12 –
23 months of age and UTD among children 36-52 weeks of age in Pakistan. I propose to use
these outcomes as these have been documented in the PDHS both by observing the vaccination
card and the verbal confirmation by mothers.
Analytic limitations of the data set: The DHS data are specifically from a cross sectional survey
to record health and demographic distributions of the population and less emphasis is placed on
the health systems related data. The DHS also specifically collects data on maternal and child
health but it does not elaborate on the knowledge, attitudes and practices (KAP) of the parents
regarding immunizations, and collects little or no data on the quality of care of the public health
system providing the immunization services. As several variables identified by the conceptual
framework were not available in the PDHS data set their association could not be evaluated with
the health outcome.
12
Table 1: Components of the Framework and variables proposed for analysis
Environment
Health care system
Distance to a health center (functioning basic health unit/maternal and child health center/government dispensary) Designated number of immunization service centers in the district Presence of a Lady Health Worker (LHW) in the village Visit by LHW Catchment area of the BHU/immunization service Number of immunization staff in the district
External environment
Percentage of educated women in the district Motorized public transport Geographic location rural/urban
Population Characteristics
Predisposing Characteristics
Socio-economic status of the family (wealth index) Years of schooling of mother Years of schooling of father Age of mother Gender of child Birth order of child Received health messages on TV/radio Number of household members Number of children under five
Enabling Resources
Mother able to decide the use of health services when child is ill Travel time to immunization services Regular source of care Child vaccination card seen
Health Behavior
Use of health care services
Use of antenatal services by mother
Outcome Evaluated health outcome
DTP1 vaccination rate, DTP3 vaccination completion rate, up to date immunization status
Patient satisfaction
Mother’s satisfaction with care provider during a sick child visit to a public health facility

Table 2: Framework components and variables of interest captured by source of information
Framework Component
Interview question Variable type Source of information Question Number in PDHS 2006-07 survey
Environment
Health care system
Availability of immunization services
Designated number of immunization service centers in the enumeration block/village by the government/NGO
Continuous, Count health plan document
Distance to a health center: functioning basic health unit, maternal and child health center, government dispensary)
Asked from the center of the largest village. How far is the following facility from here? Distance measured in kilometers (KM)
Community questionnaire 301
1) functioning BHU Continuous, KM Community questionnaire
2) functioning MCH Continuous, KM Community questionnaire

14
Framework Component Interview question Variable type Source of information Question Number in PDHS 2006-07 survey
3) functioning government dispensary
Continuous, KM Community questionnaire
4) rural health center Continuous, KM Community questionnaire
Presence of a Lady Health Worker (LHW) in the village
Is there a lady health worker in the village?
Yes/No , Categorical Community questionnaire 109
Visit by LHW Does the LHW make house visits on a regular basis?
Yes/No , Categorical Community questionnaire 111
Immunization services by LHW
What services LHW provides
Categorical Community questionnaire 110
Catchment area of the BHU/immunization services
Number of estimated children 0-5 years in the catchment area of BHU
Continuous health plan document
Number of immunization staff in the district
Total number of immunization staff designated in the district
Continuous health plan document
External Environment Percentage of educated women in the district
Total percentage of educated women
Continuous Education document
Motorized public transport
Distance to motorized public transport
Continuous, KM Community questionnaire 201

15
Framework Component Interview question Variable type Source of information Question Number in PDHS 2006-07 survey
Geographic location rural/urban
Identification Categorical, Large city/ small city/ town/ rural
Women’s questionnaire
Population Characteristics
Predisposing Characteristics
Socio-economic status of the family (wealth index)
Calculated wealth index
Long Household questionnaire
Age of mother How old are you? Continuous, Age in years
Exact age of mother In what month and year were you born?
Month/ Year
Years of schooling of mother
Have you ever attended school?
Categorical, Yes/No Women's questionnaire 112
What was the highest class you have completed?
Continuous, class 1-16 Women's questionnaire 113
Mother able to read Read this sentence Categorical, Cannot read at all/Can read only parts of sentence/ Can read whole sentence/ No card with required language/ Blind or visually impaired
Women's questionnaire 115
Years of schooling of father
Did your husband ever attend school?
Categorical, Yes/No Women's questionnaire 703
What was the highest class he completed?
Continuous, class 1-16 Women's questionnaire 704

16
Framework Component Interview question Variable type Source of information Question Number in PDHS 2006-07 survey
Gender of child Categorical, Boy/girl Women's questionnaire
Birth order of child
Received health messages on TV/radio
In the last month have you heard a message about family planning on radio or TV?
Categorical, Radio: Yes/No, TV: Yes/No
Women's questionnaire 327
What messages did it (radio/TV) convey to you?
Categorical, 11 categories, Maternal and child health/ other
Women's questionnaire 329
Number of household members
Continuous
Number of children under five
Continuous
Vaccination card seen Does the child have a vaccination card?
Categorical, Yes: seen/ Yes: not seen/ No
Women's questionnaire 504
Ever had vaccination card
Did you ever have a vaccination card for child?
Categorical, Yes/ No Women's questionnaire 505
Ever received vaccine: Children with vaccination card
Has the child received any vaccines that are not recorded on this vaccination card, including those during national immunization day campaign?
Categorical, Yes/ No/Do not know
Women's questionnaire 507

17
Framework Component Interview question Variable type Source of information Question Number in PDHS 2006-07 survey
Ever received vaccine, children without vaccination card
Did child ever receive any vaccine to prevent him/her from getting disease, including vaccinations received in a national immunization campaign?
Categorical, Yes/No/Don’t Know
Women's questionnaire 508
Enabling Resources
Mother able to decide the use of health services when child is ill
Who mainly takes the care seeking (other) decisions in the household? (question asked related to illness of child/baby)
Categorical, Husband/Mother/Mother in law/ father/ father in law/ grandmother/ grandfather/ uncle/ other/ don't know
Women's questionnaire/ Decision making mechanism and help seeking
935
Who decided the care should be sought outside home?
Categorical, Husband/Mother/Mother in law/ father/ father in law/ grandmother/ grandfather/ uncle/ other/ don't know
Women's questionnaire/ Decision making mechanism and help seeking
939
Travel time to health services
How far is the nearest health facility from your house? (regarding usual sources of care if child is ill)
Continuous, KM Women's questionnaire/ Decision making mechanism and help seeking
942
How do you commute to the nearest health facility
Categorical, Taxi/Bus/Rickshaw/motorbike/walking/other/don't know
Women's questionnaire/ Decision making mechanism and help seeking
943

18
Framework Component Interview question Variable type Source of information Question Number in PDHS 2006-07 survey
How much is the transportation cost to the nearest health facility?
Continuous, Rupees
Use of antenatal services by mother
The first time (for the latest birth) you went for antenatal care did you go because you had a problem or just for a check-up?
Categorical, For problem/ For check-up only
Women's questionnaire 409
How many times did you receive antenatal care during this (latest birth) pregnancy?
Continuous, number of time/don't know
Women's questionnaire 412
Health Behavior Number of antenatal visits for last birth
How many times did you receive antenatal care during this pregnancy (latest) ?
Continuous women's questionnaire 412
Outcome Evaluated Health Status DTP 3 completion DTP1 Up to date
Recorded from vaccination card/ verbal confirmation by mother
Categorical, Noted/not noted , Yes/ No
Women's questionnaire 506 and 509 E & F

Chapter 2: Literature Review

20
Overview of the global immunization coverage
The WHO and its member states’ drive to attain universal coverage of childhood immunizaiton
and the establishment of national immunization programs in the 1980s helped DTP3 coverage to
increase and peak in the 1990s (Figure 4). The differences in coverage between national official
figures and WHO/UNICEF estimates are more likely to be due to reporting formats, especially by
populous countries like China and India (WHO Department of Immunization, Vaccines and
Biologicals 2010). Qestions have been raised regarding the official reporting of immunization
data suggesting that official records are higher than the actual coverage (Lim et al. 2008, 2031-
2046). This concern has been addressed via dialogue on several scientific platforms (Bishai 2008,
2004-2005).
The selection of the outcome indicator for the assessment of immunization programs varies from
study to study, with the choice being made according to the organizational and study objectives.
The WHO recommends DTP3 completion as a measure to evaluate national immunization
programs. The DTP “immunization coverage rate” (number of doses of DTP 1 administered to
the target population / total estimated target population*100) is considered as a measure of
assessing the access or supply of immunization services. The “dropout rates DTP1 to DTP 3”
(DTP3 minus DTP1/ DTP1*100) is a measure of assessing the utilization or demand of
immunization services. In a community having a proportion of children who are identified as
“fully vaccinated” (a child who has received the recommended vaccines directed by the specific
national immunization program) indicates a functional health care system that has capacity to
provide services and follow up. It also indicates some weakness in the system for not reaching the
entire population. Whereas having a large proportion of children who are identified as “never
vaccinated” indicates a complete system failure requiring an immediate change in policy and
resource allocation (Pande and Yazbeck 2003, 2075-2088). The WHO in collaboration with
UNICEF in 2002 launched the initiative Reach Every District (RED) to increase the DTP3

21
vaccine coverage rate to 90% at the national level and 80% in all districts by 2010. The RED
initiative identifies five operational components to reach its goal. The five coponents of the RED
strategy are: 1) Effective planning and management of resources: ensuring
effective management of human, financial and material resources at every governing level. 2)
Reaching all target populations: reach out to previously under-served, unreached communities in
giving support and access to services. 3) Supportive supervision: providing local staff with on-
site training by supervisors. 4) Monitoring for action:
promoting the use of data for action through utilization of data quality self-
assessment tools at all governing levels. 5) Linking services with communities: linking
communities with
health services, through regular meetings between communities and health staff. In 2009 WHO
recommended that every district in a country make a “Micro-planning strategy to increase
immunization coverage” and routinely collects information on the percentage of districts in a
country with a plan (Figure 4).
Figure 4 Global coverage of DTP3 vaccine and the reported cases of Diphtheria

22
The differences in immunization coverage across socio-economic strata (Williams et al. 1995,
439-446) gender, geographic location (Williams et al. 1995, 439-446; Gore et al. 1999, 1011-
1027) and ethnic divides (Som et al. 2010, 406-412) are almost universal, as seen in high, middle
and low income countries (Rosenthal et al. 2004, e296-302). Immunization coverage and
vaccination completion rates are comparatively higher for families with high income (Cui and
Gofin 2007, 664-671) and high maternal education (Phukan, Barman, and Mahanta 2009, 249-
252) (Torun and Bakirci 2006, 125) compared to low income families and those living in
poverty, which have the lowest rates (Minh Thang et al. 2007, 41-58). The male child is better
cared for than a female child. Urban areas have better health facilities, immunization coverage
and vaccination completion rates compared to rural areas (Pande and Yazbeck 2003, 2075-2088).
Indigenous minorities and migrant populations have low immunization coverage rates (Groom et
al. 2008, 938-944) and overall poor health status compared to the general population. (Bondy et
al. 2009, 169-175)
A systemic review of the literature from low and middle income countries to identify the risk
factors for a child being unvaccinated or under-vaccinated has been done by Dietz et-al (Vance
Dietz 2009). They identified and calculated the percentages of different variables identified by
various studies as significant predictors of a child being un-vaccinated and under-vaccinated.
They identified four overarching themes from across 209 studies. The general themes were
categorized as: i) family characteristics, ii) immunization system, iii) communication and
information and iv) parental attitudes and knowledge. Immunization systems issues were
identified by the majority of studies as the most important predictor of a child being incompletely
vaccinated. Within the immunization system category, proximity to a vaccination center was most
significant followed by missed opportunities (not having a vaccination card, vaccinator absent,
and wrong contradiction). The other health system factors related to children being incompletely
vaccinated were shortage of supplies and limited availability of reproductive health services.

23
Parental knowledge and unfavorable attitudes towards vaccines was the major risk factor for a
child never being immunized. Parental lack of knowledge about immunization, and fear or
misconceptions of vaccines were the two main association observed by the study. Low motivation
among caregivers, religious/traditional beliefs against vaccines and gender bias were among the
other common findings observed under the heading of parental attitudes and knowledge. Risk
factors related to communication and information included lack of exposure to media/radio,
miscommunication by health workers and lack of community ownership of the EPI program.
Family characteristics which have been identified as risk factors for a child being unvaccinated or
not fully immunized include low maternal education followed by low-socioeconomic status and
living in a large household, number of siblings ≥5 and belonging to a migrant or minority group.
We can also categorize various factors affecting vaccination uptake into supply and demand
factors. Population characteristics like socio-economic status, maternal education, birth order and
gender of child, parental behavior of accepting or refusing immunization (Salmon et al. 2009, 17-
23), and household decisions for spending on health (Andersson et al. 2005, 72) creates the
demand for health services.
The health care system setup and the general external environment in which the populations live
affect the access or supply of these services. Health care system and general environmental
characteristics of the area greatly affect the immunization completion among children (Sia et al.
2007, 201-206). Children who live in a district with adequate staff for immunization, whose
mothers use antenatal services and those children visited by health workers have better
vaccination completion rates than children who do not have these advantages (Sia et al. 2009,
416). Literature from developing counties has also identified less tangible health systems factors
like leadership and commitment of district health officers to predict increases in coverage at the
district level (Haddad et al. 2009, S15), and poor communication and unprofessional attitudes of
the health care providers as factors that discourage parents from seeking immunization services

24
for their children (Sanou et al. 2009, S10). Institutional delivery and use of ante-natal services by
mothers (Sia et al. 2009, 416; Antai 2009, 181) have also been identified as significant predictors
of increased immunization coverage among children.
Global Expanded Program on Immunization
The World Health Organization undertook the initiative to control the small pox epidemic in 1966
and by 1980 the disease was eradicated. Building on the success of the small pox eradication, the
initiative to immunize children was undertaken. In 1974 the Expanded Program on Immunization
was launched through the World Health Assembly resolution (resolution WHA27.57). At that
point in time, globally less than five percent of the children up to one year of age were
immunized against six diseases , including polio, diphtheria, tuberculosis, Pertussis (whooping
cough), measles and tetanus. The technical processes of surveillance, preventive measures, and
human resource networks created during vaccination campaigns to contain the small pox
epidemic laid the foundation for the EPI program.
The present day WHO immunization service delivery program has developed extensively and
extends into global immunization strategies, financing, goals and policies. The program provides
training initiatives and materials, vaccine management logistic support and conducts
comprehensive multi-year planning to assist national EPI programs globally. The immunization
delivery is provided through EPI centers, health facilities and school based programs. Numerous
complementary programs to support the larger EPI goals include the Reach Every District (RED)
strategy and Project Optimize (WHO Immunization Service Delivery 2013).
Expanded Program on Immunization (EPI) Pakistan: A Review
The Expanded Program of Immunization (EPI) for Pakistan was initiated in 1978 and currently
provides vaccination against 9 vaccine preventable diseases to 1.5 million children annually.
According to the EPI schedule every child must receive a single dose of Bacille Calmette Guerin
(BCG) and a dose of Hepatitis B at birth, four doses of Oral Polio Vaccine (OPV 0,1,2,3) given at

25
birth and at six, ten and fourteen months of age, three doses of Pentavalent vaccine, Diphtheria –
Tetanus – Pertussis – Hepatitis B – Haemophilus Influenza type B (1,2,3) given at 6, 10 and 14
weeks and Pneumococcal Vaccine (also given along the Pentavalent vaccine schedule at 6, 10
and 14 weeks). A single dose of measles vaccine is given at nine months of age followed by a
boaster dose at 15 months of age (World Health Organization December, 2010). The EPI
Pakistan’s aim is to attain full immunization against the nine vaccine preventable diseases in 80%
of the districts by 2012 with the schedule to be completed by 11 months of age (Government of
Pakistan 01, 2011). Supplementary immunization activities (SIA) are also conducted in which a
child receives all doses of vaccines offered irrespective of his/her immunization status. Since
1994, in addition to the routine schedule, special immunization days are conducted to give oral
polio vaccine to children up to five years of age as part of the global Polio eradication initiative.
The EPI Pakistan recently added two new vaccines to its routine schedule, Haemophilus
Influenza type B was introduced in November 2008 and Pneumococcal conjugate vaccine was
added to the schedule in September 2012. The program introduced Rotavirus vaccine in 2013.
The EPI Pakistan has set the objectives to eliminate neo-natal tetanus and Measles by 2015
(WHO EMRO 2013). According to the PDHS survey a child is considered as fully immunized if
he/she receives a single dose of BCG, four doses of OPV and three doses of DTP vaccine.
Government of Pakistan health policies
The 1973 constitution of Pakistan mandates universal health coverage to the population and
provision of preventive health services to every Pakistani national. Pakistan came into existence
on August 14, 1947 and in 1960 the first Five-Year-Plan by the Planning Commission of Pakistan
was released which addressed the health needs of the country. Since 1990, the Planning
Commission has replaced the five-year plans with annual plans, which also address the health
planning needs. Since 1990, three national health policies have been announced in 1990, 1997
and 2011 and the fourth one is in progress. The Planning Commission of Pakistan annual plan for

26
2012-13 does not provide any strategic plan of increasing vaccination coverage and completion
rates and provides information only on the allocation of the federal funds for the program. There
is not much of a difference in the content regarding immunization between the years 2011-12 and
2012-13 Government of Pakistan (GoP) annual plans (Planning Commission: Government of
Pakistan 2012).
Health policy in Pakistan, similar to other sectors like water, sanitation, education, women and
youth etc., has suffered from disowner-ship by policy makers and implementers alike. The health
policy formulation has been reduced to mere formality without vigorous follow through and
accountability (Masoud 2011).
In 2011 the 18th amendment to the 1973 constitution was made which in addition to other
changes, pronounced provincial autonomy with health planning, financing and delivery devolved
to provincial governments (Nuri, Hanif, and Khan 2011). Under the new changes the federal
ministry of health was abolished but all the major national health programs, like EPI, HIV&
AIDS prevention, and the National Tuberculosis Prevention Program were to function as vertical
programs and maintain their autonomy with provincial divisions working in each of the four
provinces. In 2013 the GoP created the federal ministry of Public Health, which also oversees the
vertical programs supported by donor agencies, but not the EPI program.
In the health policy and planning documents released by GoP, iImproving the vaccination
coverage rates and reducing dropout rates have been addressed on the policy agenda of the
Government of Pakistan for several years in a row. But this has been without effective ground
implementation as evident that Pakistan is still one of the three polio endemic regions in the
world.. In 2009 the government mandated that it would eradicate Polio by 2010 but the disease is
still not controlled. The government’s policy to deliver routine immunization, door to door,
through the lady health workers (LHW) never materialized. Currently the LHW program is

27
challenged by lack of funds, uneven deployment of workers and performance in different districts
in the country. Currently the LHW are deployed to deliver polio vaccines only during national
immunization days.
The Expanded program on immunization (EPI) Pakistan was a special cell working under the
federal ministry of health but after the 2011 devolution mandated by the 18th amendment it has
been transformed into an autonomous body. It’s program objectives are set by the organization
and are mandated by the WHO and UNICEF guidelines.
A functional national vaccine advisory committee and proactive technical advisory groups are
strategic in ensuring success for childhood immunization programs (The National Vaccine
Advisory Committee. 1999, 363-370). A growing number of countries in the developed and
developing world have fully functional national technical advisory groups (TAGs) on
immunization policy and introduction of new vaccines for the respective countries (Blau et al.
2012, 2588-2593; Cho 2012, 1-5; John 2010, A88-90) but Pakistan still lacks a formally
recognized and functional immunization national technical advisory group. Pakistan’s neighbor
India established its National TAG India in 2001 and in Pakistan the first ever TAG on Polio
eradication commenced its activities only in August of 2012.
Budgetary allocation for the EPI
In the year 2000 the total cost for the EPI program was about $24 million/annum of which 44%
went for salaries and only 33% for vaccines and syringes. The federal and provincial
governments contribute 68% of all expenditures on routine EPI but only 43% of non-salary costs.
In 1997 expenditures on EPI represented about 4% of all public expenditures on health.
Pakistan has introduced two new vaccines, Hib B in 2008 and PCV in 2012, in the routine
immunization program and introduced Rotavirus vaccine in 2013 with financial assistance from
Global Alliance for Vaccine and Immunizations (GAVI.) Economic and sensitivity analysis of
the introduction of the three vaccines has shown it to be cost-effective. However introduction of

28
new vaccines in the routine immunization program without financial assistance from GAVI
would result in taking up 40% of the EPI budget and 15% of the national health budget. These
pose major challenges for the national government which must increase funding for procuring
new vaccines, and therefore results in continued dependence on external funding sources (Brenzel
et al. 2011).
Funding sources and donors for EPI Pakistan
The Government of Pakistan (GoP) through its Social Action Plan (SAP), Phases I and II has
taken the initiative to increase public spending in health and social welfare. As of 2003 GoP
was providing 18.7 million of the 31.8 total EPI budget and international donors funded the
remaining 13.1 million. Vaccines provided by the EPI are shown in

29
Table 3). The key supporters of the EPI Pakistan are WHO and UNICEF; they support the
program through technical assistance and procurement of vaccines. The major financial
supporter of the program is GAVI through its Vaccine Fund, additional financial support is
provided by Japan International Cooperation Agency (JICA), World Bank, Center for
Disease Control (CDC), Rotary International and Department for International Development
UK (DFID) (Federal EPI/CDD Cell 2003).

30
Table 3 Routine Immunization Schedule for Children in EPI-Pakistan, 2012
Age Antigen Dose Site of administration
At Birth BCG 0.05ml Intradermaly on right upper arm
OPV 0 2 drops Oral
Hepatitis –B 0.5ml Intramuscular injection on antero-
lateral side of left thigh
6 weeks Pentavalent -I 0.5ml Intramuscular injection on antero-
lateral side of right thigh
OPV-I 2 drops Oral
10 weeks Pentavalent-II 0.5ml Intramuscular injection on antero-
lateral side of right thigh
OPV-II 2 drops Oral
14 weeks Pentavalent-III 0.5ml Intramuscular injection on antero-
lateral side of right thigh
OPV-III 2drops oral
6 weeks Pneumococcal 0.5ml Intramuscular injection on antero-
lateral side of left thigh
10 weeks Pneumococcal 0.5ml Intramuscular injection on antero-
lateral side of left thigh
14 weeks Pneumococcal 0.5ml Intramuscular injection on antero-
lateral side of left thigh
9 months Measles-I 0.5ml Subcutaneous injection on left upper
arm 15 months Measles-II 0.5ml
Pentavalent includes DTP+HepB+Hib
If child is seen between 12-15 months 2nd dose of measles is given

31
Factors associated with initiation of immunization schedule (low, middle and high income countries)
The majority of studies have reported the determinants of vaccination completion and very few, if
any, have specifically looked at factors associated with vaccination initiation.
Factors associated with completion of immunization schedule
Maternal education: The importance of mother’s education and attending institutions of higher
learning cannot be over emphasized in facilitating better health outcomes for themselves and their
children (Sanou et al. 2009, S10). In low and middle income countries maternal education is a
stronger predictor of immunization coverage for children than higher economic status of the
household (Waters et al. 2004, 668-675). Analysis conducted using the Cameroon DHS and large
scale studies in Bangladesh show that maternal education facilitates complete immunization only
when the mother has attended formal education beyond the primary level (Jamil et al. 1999, 49-
58; Waters et al. 2004, 668-675). Education improves mothers’ understanding of the basis of
disease as well as their comprehending health messages more effectively. Knowledge transfer
regarding importance of immunization through mass media and health care providers plays a key
role in improving immunization and the education of mothers facilitates this transfer (Bondy et al.
2009, 169-175).
Sex of Child: In low and middle-income countries the female child is often discriminated against
at birth. The preference for sons results in the female child being malnourished, with low
educational attainment as well as poor health outcomes including immunization. The culture and
social values, especially in South East Asian countries, result in the female child being 30-40%
less likely to complete immunization compared to a male child (Jamil et al. 1999, 49-58; Pande
and Yazbeck 2003, 2075-2088).
Socio-economic status of the household: Households in the lower wealth quintiles have poorer
health outcomes compared to households in higher wealth quintiles and this is a global

32
phenomenon across a spectrum of health outcomes. The same holds for immunization completion
of children, observed universally (Sia et al. 2007, 201-206) and in Pakistan (Usman et al. 2010,
140-147; Shaikh et al. 2010, 806-810).
Age at receiving first dose of DTP (1) vaccine: Age at first contact with the immunization
services is a strong predictor of the vaccine completion in Pakistan (Usman et al. 2010, 140-147).
This is because families who are aware of the importance of the vaccination of the child will
bring in the child early and are thus more likely to complete the schedule in a timely manner.
Use of maternal health services: An emerging predictor of vaccination completeness is the
culture of vaccination that arises from the constant interaction of the population with the health
care system. Mothers’ use of antenatal services and assisted delivery also increases the
vaccination completeness among their children (Sanou et al. 2009, S10). Use of ante-natal
services by the mothers and opinions about the health center even in volatile situations, like
facing food insecurities, facilitate vaccination completion (Sullivan et al. 2010, 53-59).
Communication and message dissemination: Health care providers’ communication skills and
behavior, mass media campaigns and behavior change material affect the uptake as well as
completion of immunization services. In Burkina Faso communication problems were identified
by 66.8% of the parents as a major concern that prevented them from participating in
immunization activities. Ineffective communication skills of health providers and their
discriminating behavior, especially in rural areas, result in parental misguidance and thus
incomplete vaccination of their children. Frequent and comprehensive communication is a
significant factor in increasing the vaccination completion rate but the health workers are also
challenged to provide it during immunization sessions. The reasons indicated by the health
workers are that they have to not only provide the vaccine but also document the information in
registers and health cards which bars them from giving time for communication. It is important
for funding and provider agencies to allocate funds for additional human resources to provide

33
effective communication for immunization activities. (Sanou et al. 2009, S10). Similar results
were observed in Bangladesh: mothers’ lack of understanding of key immunization details like
timing, multiple doses, spacing and benefits of full immunization was in part due to poor
communication of messages to mothers. The information provided during health education
campaigns, Information—Education—Communication (IEC) materials and communication by
service providers inadequately reach socio-economically deprived mothers who actually need it
the most (Jamil et al. 1999, 49-58). The behavior of the health teams and their interaction with the
population, especially the role played by the leadership, are emerging variables being investigated
to predict immunization completion among children (Sia et al. 2007, 201-206).
Parental understanding of the diseases prevented by vaccines and the reasons for children falling
sick even after vaccination also improve the vaccination coverage and completion in the absence
of societal mistrust of immunization programs (Dugas et al. 2009, S9-698X-9-S1-S9). It is very
important to provide the exact information about the diseases that are prevented by routine EPI
vaccines, as parents have also stated Malaria as a vaccine preventable disease. This can lead to a
false sense of security and disappointment when fully vaccinated children fall sick with diseases
not covered by the EPI vaccines. Knowledge about the importance of vaccination is a significant
determinant of complete vaccination rates: parents who are illiterate but had this information had
children with higher vaccination completion rates.
Health systems related factors
Performance and ownership of the immunization program: In Cameroon the districts that had
monthly supervisory visits by the immunization program supervisory staff had higher
immunization completion rates compared to districts that were not visited on a monthly basis
(Waters et al. 2004, 668-675). Home visits by vaccination staff and communication of health
messages through providers may also improve vaccination completion rates. (Oyo-Ita et al. 2011,

34
CD008145). The systematic review done by Rainey et al. has identified 838 reasons for under-
vaccinated children. Among these, 45% were related to the health care system (Rainey et al.
2011, 8215-8221).
Immunization card: The importance of the immunization card cannot be over emphasized as
studies have pointed out that children who had immunization cards were more likely to complete
their vaccination schedules (Waters et al. 2004, 668-675). In the United States among medically
underserved populations, the children of parents who had vaccination record cards were more
likely to be UTD at three months of age (Rosenthal et al. 2004, e296-302). A redesigned
vaccination card with a plastic jacket and a holder to hang it, coupled with educating mothers,
improved the DPT3 completion rates in a cohort of children in Pakistan (Usman et al. 2010).
Community level determinants like child place of residence and having an immunization card are
strong predictors of immunization in addition to individual level determinants like mother’s
ideation towards immunization, (knowledge of disease prevented by vaccines and perceived
social approval of immunization). (Babalola 2009, 550-558).
Access: Physical access to vaccination services is a significant factor in determining vaccination
initiation and completion and has been reported by numerous researchers across the globe. The
household distance from a vaccination center and availability of immunization services have been
cited by various researchers as statistically significant factors. There are marked differentials in
immunization coverage and completion rates across the rural-urban divide and for various
geographically challenging regions like mountainous areas and deserts.
Factors associated with refusal or never vaccinated
The factors associated with children never being vaccinated are in turn related to inequity in
health status and include poverty, being among the minorities and belonging to rural areas. These
variables associated with inequity interact with one another, e.g poor minorities and poor rural

35
children and further worsen the situation for these children. Mother’s education at the secondary
level and higher has shown again and again to protect against non-immunization and the children
of mothers with no education, even in socialist countries like Vietnam, show a high rate of no
immunization. Individual factors like sex of child and birth order of the child are associated with
incomplete vaccination but are not often reported for children never vaccinated (Minh Thang et
al. 2007, 41-58). Parental knowledge and attitudes are the major risk factor for a child never
being immunized. The systemic review by Dietz et al. has identified parental lack of knowledge
about immunization as a major observed associated factor, followed by fear or misconception of
vaccines. Low motivation among caregivers, religious/traditional beliefs against vaccines and
gender bias were among the other common findings observed for children never being vaccinated
(Vance Dietz 2009).
The health systems level factors associated with children never vaccinated also include
unavailability of health centers and the low quality of services provided, such as the number of
days the center is open and provides vaccine.
Challenges facing the Expanded Program on Immunizations - Pakistan
Mistrust of vaccines amidst the polio epidemic: The current conflict in the Northern areas of
Pakistan between government forces and the Taliban has spilled over to major cities in the form
of acts of terror against civilians and social services. The Taliban’s mistrust of the immunization
program as an instrument to infiltrate and spy on their ranks has resulted not only in children
being deprived of vaccine protection but also resulted in the targeted killing of immunization
staff. In December 2012 five female workers, administering polio vaccine during supplementary
immunization days, were shot dead in the metropolitan city of Karachi. In January 2013 another
attack on aid workers by the Taliban left 6 female health workers and a male doctor dead just 75
miles from the national capital Islamabad. The Taliban militants have used the polio
immunization program as a hostage to negotiate their demands over several instances and in April

36
2013 announced their “conditional support of the program” but the mistrust against vaccines still
lingers among the residents of the communities (Sherazi 2013).
In areas of low vaccine coverage parental refusal or suspicion of vaccines are cited but it is
important to understand low coverage in the absence of active refusal. In-depth ethnographic
studies among low educated rural communities in Burkina Faso show that the low uptake of
vaccination is affected by both the parental perceptions of disease and how vaccines may prevent
diseases. Engaging household members like grandmothers, fathers and heads of households in
addition to mothers, regarding the vaccination of the child results in greater acceptance and better
completion of immunization schedules (Dugas et al. 2009). The EPI information campaign has
not so far been able to promote dialogue with caregivers of children to encourage timely
vaccination and initiation. A study in Lasbella district, Balochistan has reported that there are
positive parental attitudes towards vaccines even though only 50% of the children in the study
population were vaccinated against measles. Increasing the discussion with mothers and families
results in better acceptance and uptake of immunization services (Mitchell et al. 2009, S7).
Physical access of vaccination services, especially among geographically dispersed populations,
poses another major challenge in reaching all children and promoting the uptake of timely and
complete vaccination.
Slow response to epidemics: According to the WHO figures, the number of reported cases of
measles in Pakistan rose from 4000 in 2011 to 14, 000 in 2012. In the most populous province of
Pakistan, Punjab, 129 measles related deaths were reported during January to April 2013. Measles
vaccination coverage is low in the country and parental attitudes have been blamed, but the 2012-
13 epidemic was attributed mainly to the lack of available Measles vaccines. In the southern part
of Punjab where the 2012-13 epidemic started, it was reported that in the region entire pockets of
the population were without measles vaccine coverage (Galpin 2013). It is common practice in
Pakistan to dismiss concerned officials in the event of media outrage over a breakdown of public

37
services without addressing the underlying faulty mechanisms that lead to disasters and
epidemics.
Lack of vital registries: Reporting biases in vaccination coverage rates in many countries
including Pakistan result in the over estimation of the vaccination coverage rates. The reporting
biases can result from workers reporting vaccinating larger numbers of children to meet the
program projections, and the program using number of doses distributed as a proxy measure for
the number of children vaccinated while ignoring the wastage rates that take place in the cold
chain. Because central records rely on district records, it becomes hard to obtain an accurate
measure of vaccination coverage rates. In Pakistan the vaccination coverage rates in densely
populated areas are based on projections of the population growth and may not take into account
the Total Fertility Rate (TFR,) and the death rates that change the denominator; this practice
introduces error in the reporting of the coverage rates (Bos and Batson 2000).
Maintaining financial sustainability: Historical budgeting instead of needs based budgeting is
prevalent in the Pakistan health care system and is also seen among various developing countries
(Lagarde, Haines, and Palmer 2009, CD008137). This practice is among the major challenges
facing the immunization program in Pakistan. During 1991-95 withdrawal of donor support for
the EPI program resulted in a reduction of the immunization coverage levels from 86% to 47%.
Inadequately trained EPI staff, districts not prioritizing health and diversion of resources away
from health are among the key challenges facing the immunization program. The current levels of
coverage are supported by the combined efforts of the donor community, Government of Pakistan
and GAVI support for new and underused vaccines (Federal EPI/CDD Cell 2003).
Among many low and middle-income countries, including Pakistan, public service budgeting is
based on historical and instrumentalist (relying on preset formula for resource allocations)
methods of resource allocation in the absence of mechanisms incorporating measures of needs
and systematic needs assessment. As long as this method is employed, the health care system

38
will be slow in responding to the growing needs of the population, including the provision of
adequate immunization services.
Timeliness of immunization
It is important that children complete their recommended immunizations by the first year of life
as infant deaths due to infectious diseases contribute to the bulk of under-five mortality. Timely
completion of the vaccination schedule is crucial to attaining maximum benefit from the
intervention, especially among the young, (Akmatov et al. 2008, 3805-3811) and to prevent
disease outbreaks (Luman et al. 2002, 935-939).
In Burkina Faso timeliness was highest for the vaccines given at birth, namely BCG, and was
lowest for vaccines given in late infancy, mainly for DTP3 and measles, and this pattern was
more pronounced in rural areas (Ouédraogo et al. 2013, 45-56). Even in developed countries like
the United States, strict adherence to the immunization schedule may be low: only 28.3% of the
children in a managed care initiative were found to be up-to-date with their immunization status.
Children of younger mothers, belonging to low-income households and those not having a public
provider were less likely to be up-to-date (Cotter et al. 2002). A study by Luman et.al assessed
vaccination delays among US children and found that 1 in 3 children under 2 years of were
under-vaccinated for more than 6 months. Unmarried mothers and those without a college degree,
having more than 2 children, being non-Hispanic or black, and having more than one provider
were all associated with children more likely to be under-vaccinated for their ages. The standard
measures of vaccination coverage mask the risk children face during the period of under-
vaccination, and may delay the timely corrective actions to be implemented (Luman et al. 2005,
1367-1374; Luman et al. 2005, 1204-1211). Research studies from South Africa have identified
lack of immunization timeliness among children in poor areas compared to well off areas and for
vaccines given in older ages (Fadnes et al. 2011, 404-2458-11-404). The researchers used
Kaplan-Meier time-to-event analysis to calculate coverage and timeliness of 8 vaccines provided

39
to children up to two years of age by the routine immunization program of South Africa.
Vaccination timeliness is not routinely measured even in the majority of developed countries; a
study from Australia has also identified vaccination timeliness to be low among indigenous
population children less than 12 months compared to non-indigenous children (Hull and McIntyre
2006, 4403-4408). An analysis of DHS data from 45 low and middle-income countries using
survival analysis and devising an index combining coverage and timeliness show that the median
of the delays was from 2.3 weeks for BCG, 2.4 weeks for DTP1, 2.7 weeks for Measles and 6.2
weeks for DTP3 vaccine. In 12 countries with the longest delays 25% of the children were
delayed more than 10 weeks for BCG, 8 weeks for DTP1, 11 weeks for Measles and 19 weeks for
DTP3. The median of the national coverage rate at the recommended 12 weeks time frame was
only at 57%, but at 12 months it increased to 88%, fulfilling the WHO recommendations (Clark
and Sanderson 2009, 1543-1549). An immunization measure based on timeliness of
administration, calculated as an absolute score and assessing the relative differences among
subgroups, allows for better monitoring of the immunization status of children and timely
interventions (Glauber 2003, e39-45).
Success stories of vaccine/immunization programs
The reasons for under-vaccination differ from non-vaccination among children and any solutions
to address the two outcomes should address the specific causes of under-vaccination and non-
vaccination. Under-vaccination and non-vaccination due to limitations set by the health care
system can be remedied by improving out-reach services, ensuring regular supply of vaccines and
training the immunization staff for better program management. In instances where under-
vaccination and non-vaccination is due to parental attitudes and knowledge towards vaccines a
more tailored approach within the local context is needed (Rainey et al. 2011, 8215-8221).
In Pakistan a food/medicine voucher program was shown to be effective in improving up-to-date
immunization by two fold among children up to 18 weeks of age. The socio-behavioral changes

40
take a longer time to take effect but an incentives based approach has the potential of improving
the timeliness and completion of the immunization schedule (Chandir et al. 2010, 3473-3478).
Conditional cash transfers provide financial incentives to mothers for enrolling and keeping their
children in school, seeking antenatal care, making well child visits and completing routine
immunization. The World Bank discussion paper on innovative ways to improve vaccination
rates has shown that conditional cash transfers in Mexico and Nicaragua have been instrumental
in improving vaccination coverage and completion rates among children (Barham, Brenzel, and
Maluccio 2007).
A systemic review of the approaches to improving immunization coverage and completion rates
among children report that these can be categorized into four strategies: 1) bringing immunization
services closer to communities, 2) increasing demand for vaccines through information
dissemination, 3) changing practices in fixed sites and 4) introducing innovation for quality
management (Ryman, Diet, and Cairns 2008).
According to Ryman et.al in their review paper on methods of improving immunization rates in
low and middle income countries, interventions to bring immunizations closer to the communities
consisted of reaching out to the communities by increasing outreach, provision of vaccines and
dissemination of material through schools, visiting homes to identify and refer un-vaccinated
children, increasing times vaccinations are offered and the number of vaccination centers, active
mobilization of community men and women to keep track of children in need of immunization,
and encouraging community members to complete vaccination of their children.
Information dissemination to increase vaccination was carried out through the routine channels of
the mass media and more interactive methods of creating community resource rooms for families
to visit. Information dissemination was also carried out through non-health related social
programs like micro-credit programs encouraging women to vaccinate their children.

41
Changing practices at fixed health center sites promoted practices like inquiring about the
vaccination status of all admitted children and ensuring they are up-to-date, setting up the
vaccination room closer to the doctors’ consultation room and using vaccination reminder stickers
to reduce drop-out rates among children.
Innovative management practices to improve vaccination rates among children by various
programs have been carried out such as introducing modern reporting systems, providing
program planners with up to date information about the catchment area and target population,
giving food incentives, training lower cadre health providers to administer vaccines in low
performing clinics and use of community information data to develop specific interventions for
the area.
Most interventions to improve vaccination rates reported by scientific papers are usually not
designed as randomized controlled intervention studies in the first place. Therefore it is difficult
to tease apart overall improvement of services in an area from the effects of a single intervention.
Also any intervention to improve routine immunization will need to produce multifaceted
improvement in vaccination coverage, timeliness and completion.
A Cochrane review evaluating interventions in low and middle-income countries to improve
vaccination identified 6 studies with robust scientific methods and reported their findings. They
identified key interventions as 1) facility based health education, 2) combination of facility based
health education and redesigned card, 3) evidence based discussions, 4) information campaigns
and 5) village based immunization discussions. Although the quality of scientific evidence for
each of the interventions is from low to moderate, there have been reported increases. According
to the reviewers, home visits and health education may also improve vaccination. An earlier
Cochrane review has shown parental reminders for vaccination to be effective in improving

42
immunization coverage and completion but there is a lack of technologies in low and middle-
income countries to support such a reminder system (Oyo-Ita et al. 2011, CD008145).
Cell phone based vaccine reminders to improve vaccination timeliness and completion have been
received and implemented enthusiastically in high-income, low and middle-income countries
(LMIC). Parental willingness to enroll in receiving vaccine reminders is also encouraging among
high and LMIC countries (Diallo et al. 2012, 291-295; Clark et al. 2011, e1100-5). However, the
results of the effectiveness of this intervention to improve completion and timeliness are still
under investigation, especially in LMICs.
A study conducted in rural western Kenya to improve routine immunization schedule timeliness
employed a cell phone based reminder text message and a conditional cash transfer for mothers
on completing their child’s vaccine doses on time. The intervention aimed at creating the demand
for vaccines through sending mothers reminders and giving them an incentive to respond in a
timely manner. Infants 0-3 weeks of age whose mothers had cell phones and were willing to
participate were enrolled in the study. The results were encouraging as 90% of the children
received DTP1 (scheduled at 6 weeks of age) and 86% of the children received DTP2 (scheduled
at 10 weeks of age) in a timely manner, within a 4 weeks window period. The study showed the
feasibility of scaling the intervention and parental acceptance of the intervention in addition to
improving timeliness (Wakadha et al. 2013, 987-993).
In a study conducted in a Midwestern metropolitan area in Kansas, United States, a cell phone
based vaccine reminder system was evaluated and showed a 20-30% increase in the timeliness of
the vaccine schedule. The major issue with the use of mobile phone reminders is that low income
parents frequently report loss of service, mainly due to payment delays, thus losing access to
timely messages. Low technology strategies such as sending automated postal and electronic
mail, or calling land-lines in cases where cell phone service is lost, may not be present to back-up

43
the intervention. There also are technological limitations to integrating the medical records with
the cell phone service; therefore reminders cannot be created ahead of time plus each reminder
has to be hand created (Ahlers-Schmidt et al. 2012, 5305-5309).
Validity of the measures of immunization status
The outcome variable of our analysis, immunization status of children, was recorded/verified
during the PDHS data collection in two ways: 1) noting from the immunization card the vaccines
a child had received (date vaccine was administered written on the card or administered vaccine
marked/ticked on the card) and 2) in the absence of the health/immunization card at the time of
the interview (immunization card never issued, mother was not able to produce it, no longer had
immunization card) the status was confirmed by the mother’s report, following the standard
practice for household surveys. We have taken into consideration the validity of the outcome
measure in our analysis in order to be able to correctly interpret the results and to be able to make
sound policy recommendations. To better understand the validity of our outcome measure, we
have reviewed the literature reporting on accuracy of maternal recall and immunization card in
confirming the immunization status of children during household surveys from low and middle-
income countries. The validity of maternal recall and confirmation from the immunization card is
discussed below as reported by the published literature.
Validity of maternal/personal recall
Demographic and health surveys carried out in developing countries, especially in South Asia,
rely on maternal recall for confirmation of immunization status and evaluation studies of DHS
data report maternal recall to be accurate and reliable for confirmation of childhood immunization
status (Brown et al. 2002). Researchers have also evaluated validity of maternal recall by
comparing maternal recall with the vaccination card (Valadez J and Weld H 1992, 120-122), and
more recently in KwaZulu-Natal with provider facilities based records and have reported
maternal recall to be comparable to the written record. Analysis of DHS data from 45 developing

44
countries by Murray et al,, using probit models with sample selection (after adjusting for survey
design effects) to reflect the number of valid vaccinations ,has also reported maternal recall to be
accurate and reliable (Murray et al. 2003, 1022-1027).
The sensitivity of self-report of public health interventions is associated with community
knowledge and coverage; the higher the coverage of an intervention, the higher is the sensitivity
of self-report for that intervention. A study from rural China (low middle-income country)
reporting on the validity of women’s self-report reports that the overall validity is high for self-
reported coverage for DPT vaccine and measles vaccine (Liu et al. 2013). Comparing facility
based records to personal recall in urban Bangladesh, Salimuzzaman et.al have reported that
accuracy of maternal recall increases with increasing maternal education, economic status and
age (Khan and Khan 2012).
There is a substantial amount of literature from the developing world that supports the validity of
maternal recall in accurately identifying the vaccination status of children; however, one has to be
mindful of possible biases as the validity of maternal recall varies with different vaccines.
Mothers may be able to recall with 97% accuracy the BCG vaccine of a child as reported by Babu
et al. (Babu et al. 2010) since this is the first dose in the schedule and there is a resulting scar on
the left upper arm to remind mothers. But it may not be easy for parents to accurately confirm if
their child is fully vaccinated or has received a specific vaccine in a multi-dose schedule. For
multiple dose vaccines, with the increasing number of vaccines in the immunization schedule and
with the increasing age of the child the accuracy of maternal/parental recall becomes susceptible
to biases. The majority of the studies in the developing countries assessing the validity of
maternal recall have calculated its accuracy by comparing recall to the household held
immunization records as there are no provider based health records to be used as the gold
standard. Lumen et al., presenting their findings from the Commonwealth of Northern Mariana
Islands, a low/middle income country, report recall to have less than 50% specificity (Luman,

45
Ryman, and Sablan 2009, 2534-2539) when compared to the provider based health
records/electronic health records for estimating immunization coverage. According to them,
mothers/parents recall overestimates coverage when they were asked if they considered their
children to be fully immunized. There are fewer studies from low-middle income countries
reporting comparison of recall to medical provider records. According to the systematic review
by Miles et Al., four studies comparing recall to facility based medical records show that
maternal/parental recall tends to overestimate the immunization status of their children. (Miles et
al. 2013, 1560-1568).
Validity of household held immunization records
The household held immunization record or immunization card is regarded as more accurate
compared to maternal recall when assessing immunization status of a child, especially during
household surveys. Studies assessing the accuracy of maternal recall have compared it to the
immunization card to calculate the validity of recall. There is a limited number of studies from
developing countries reporting the accuracy of the household held immunization card; the
majority of these studies are from developed countries. Household held immunization records are
also susceptible to biases as parents may forget to bring the card to the vaccination center during
visits for immunization or the facility staff my fail to enter the administered vaccines in the card.
The only study from a low/middle income country reporting results that compare household held
immunization records to facility based records states that vaccination coverage estimated by
household held card among 2, 4 and 6 years olds was 35-50% lower than coverage based on
medical records. This study by Luman et Al., carried out in Northern Mariana Islands, reports that
compared to medical records, the immunization card underestimates coverage.
Reviewing papers from one middle income and fifteen high-income countries comparing
household held immunization records to provider records, Miles et al. report that coverage based
on immunization cards tends to underestimate true coverage by a median of 13 percentage points.

46
The combined median validity measures of coverage based on immunization cards from 16
papers had 84% specificity and 77% sensitivity (Miles et al. 2013, 1560-1568).
There is only one study from a developing country reporting the combined sensitivity of
household held immunization cards and recall. When compared together, the combined
information from card and recall or household sources, has less than 60% sensitivity to estimate
true coverage as calculated from medical records (Luman, Ryman, and Sablan 2009, 2534-2539).
Assessing measles conjugate vaccine (MCV1) coverage among a cohort of children in
Bangladesh, Hayford et al. used six measures, collecting information from a household held
immunization card, maternal recall, EPI records and serum markers to arrive at unbiased
estimates of coverage. The study used the card+ recall as the gold standard and calculated
prevalence ratios for MCV1 coverage to adjust for differences among indicators. They report
maternal recall to give MCV1 coverage estimates 7.7% higher than the gold standard (card +
recall). After accounting for sero-conversion rates and the assay sensitivity and specificity
provided by the manufacturer they found non-significant differences in coverage calculated
separately from maternal report/recall and coverage calculated by serum indicators when
compared to the combined measure of card and recall. They recommend using card+recall as a
gold standard in the absence of provider based medical records and vaccine registries and
advocate for establishment of electronic medical records for childhood immunization (Hayford et
al. 2013, 1211-2458-13-1211).
In our analysis we have used the combined measure of card and maternal recall to create our
outcome variable for all the three objectives. In the PDHS immunization status was confirmed by
the card whenever available and only in its absence was maternal recall used to confirm
immunization status. The survey questionnaire does not provide for recording the immunization
status by both sources so the concordance between maternal recall and card confirmed
immunization status couldn’t be calculated for the PDHS data sets. In areas of high card

47
retention rates, like Bangladesh (83%), maternal recall has high concordance with the
immunization card. But in our study sample card retention was low; in PDHS 2006 only 13% of
the mothers were able to show the card at the time of the interview. We have used the combined
measure of card and maternal recall to confirm immunization status for two reasons: 1) to be able
to have an adequate sample size and 2) in the absence of medical records, card+recall is regarded
as the best available data source to increase accuracy and completeness (Hayford et al. 2013,
1211-2458-13-1211). The provider based records are susceptible to biases when these are
introduced for the first time as not all facilities are fully prepared to adopt electronic medical
records and differences in coding may add to the biases of arriving at accurate estimates. But in
the long run, provider based records are the most reliable and should be regarded as the gold
standard.

48
Chapter 3: Methods

49
Specific aims
The specific aims of this study are:
• To evaluate the association of individual and contextual level factors with immunization
initiation among children 12-23 months of age in Pakistan by analyzing the PDHS 2006-
07 and PDHS 1990-91 datasets.
• To evaluate the association of individual and contextual level factors with immunization
completion among children 12-23 months of age in Pakistan by analyzing the PDHS
2006-07 and PDHS 1990-91 datasets.
• To evaluate the association of individual and contextual level factors with up to date
(UTD) immunization among children 36 – 52 weeks of age in Pakistan using the 2006-07
Pakistan Demographic and Health Survey (PDHS) data analysis results.
Research Hypotheses
The research hypothesis for each specific aim includes the following:
Specific Aim 1: Contextual level variables, more than individual level variables, are likely to be
associated with immunization initiation among children 12-23 months of age in Pakistan.
Specific Aim 2: Contextual level variables, more than individual level variables, are likely to be
associated with immunization completion among children 12-23 months of age in Pakistan.
Specific Aim 3: Contextual level variables, more than individual level variables, are likely to be
associated with up to date (UTD) immunization status among children 36 – 52 weeks of age in
Pakistan.
Description of the source of study data
Demographic and Health Survey
The Demographic and Health Survey (DHS) evolved out of the world fertility surveys and
contraceptive use prevalence surveys that were conducted in the 1970s and 1980s. The earlier

50
DHS versions primarily collected data on reproductive and child health with a focus on fertility
trends, contraceptive use and nutritional status of mothers and children in developing countries.
The DHS questionnaire, design and field implementation techniques undergo constant quality
improvement and to date, the Phase 1 module (implemented in 1984-89) has evolved into the
current Phase 6 modules (being implemented during 2008-2013). The Phase 6, core DHS
questionnaire modules collect data on a wide range of maternal and child health topics including
knowledge, attitudes and practices (KAP) regarding maternal and child health, population
experience with and quality of reproductive and child health services and population health
decision making. Additional modules on special topics like HIV and AIDS, Malaria and
domestic violence are also included in the questionnaire according to specific data needs of
countries. Since 1984, 230 nationally representative DHS household surveys have been
conducted in more than 80 countries.
The surveys are conducted by Measure DHS, a USAID funded entity, and the country team.
Measure DHS provides the standard procedures, methodologies, and manuals to guide the survey
process and the country team supports the logistics and manpower needed to carry out the survey.
In Pakistan the National Institute of Population Studies, a Government of Pakistan (GOP) entity,
provided financial assistance in terms of in-kind contribution of government staff time, office
space, and logistical support and Macro International provided financial and technical assistance
for the survey through the MEASURE DHS program.
The DHS survey is responsive to the data needs of the host countries, U.S. Agency for
International Development, as well as researchers interested in understanding adult and child
health issues. Since 1984, 1117 articles using DHS data have been published in over 200 journals
but there are no publications assessing how DHS results are used by local policy makers for
decision making. (Short Fabic, Choi, and Bird 2012, 604-612)

51
Pakistan Demographic and Health Survey
The first Pakistan Demographic and Health Survey was conducted in 1990-91 and the second in
2006-07. In the 2006-7 PDHS additional information was collected to derive national estimates
of maternal and infant mortality and child health. The implementing partners were the Ministry of
Population and Welfare, National Institute of Population studies, Macro International, USAID,
WHO and UNICEF. The PDHS 2006-07 and 1990-91 datasets have been obtained from the DHS
Measure web site by a formal request. The data are in the public domain but the individual study
participants cannot be identified.
Figure 5. DHS 2006-07 Survey Design and Number of Households and Eligible Women Interviewed
Pakistan Demographic and Health Survey 2006-07

52
A cross-sectional, nationally representative demographic and health survey was conducted in
2006-07 to address the monitoring and evaluation of maternal and child health and family
planning programs in Pakistan (Figure 5). The survey also aimed to derive national estimates for
maternal and child mortality and for this a sample of 100,000 households was set.
Table 4. Number of households selected, and interviews conducted for the PDHS 2006-07 (numbers below are for households that were available for interview)
Residence Total
Total Urban Major City Other Urban Rural
Households Selected 40,827 21,297 19,530 61,210 102,037
Total Households
interviewed 37,909 19,729 18,180 57,532 95,441
Short Questionnaire 34,223 17,822 16,401 51,963 86,186
Long Questionnaire 3,686 1,907 1,779 5,569 9,255
Eligible Women
Interviewed 3,830 1,929 1,901 6,193 10,023

53
The survey employed a two-stage stratified, random sampling design. In the first stage 1000
sample points (clusters) were selected with probability proportional to size (population) from
across Pakistan. The sampling frame for the rural areas consisted of 50,588 villages/mouzas/deh
as numerated according to the 1998 national population census. The sampling frame for the urban
areas was 26,800 enumeration blocks and each consisted of 200-250 households. The population
of major cities (population more than 500,000) was stratified into low, middle and high-income
areas and treated as a separate stratum. A total of 610 sampling points/clusters from the rural and
390 sampling points/clusters from the urban areas were selected. Due to political unrest and
community refusal data were not collected from 20 sampling points/clusters in Federally
Administered Tribal Areas (FATA), 4 sampling points/clusters in the province of Baluchistan and
4 sampling points/clusters in Khyber Pakhtunkhwa, the former North West Frontier Province
(NWFP). Data were collected from a total of 972 sampling points/clusters from the four
provinces of Pakistan, excluding the FATA and Federally Administered Northern Areas (FANA).
In the second stage from each cluster (enumeration block/village) 105 households were selected
by random selection and a total of 102,060 households were identified.
From the 105 households selected in the second stage in each cluster 10 houses were randomly
selected for conducting the survey using the women’s questionnaire and long household
questionnaire. This resulted in 9720 households being selected constituting 10% of the total
(102,972 household) sample size. The short questionnaire was to be used to collect information
from the remaining 92,340 households constituting the remaining 90% of the total sample size
(Table 4).
The short questionnaire collected data about basic demographic and household information and to
identify any maternal and child death in the past three years. Any adult in the household was
eligible for interview. The long questionnaire collected detailed information on socio-
demographic characteristics and the women’s questionnaire collected data about maternal and

54
child health including immunization history from ever-married women ages 12-49 years. The
“community questionnaire” was used to collect information in each rural sample point on the
availability of health, education, communication and civic facilities and services.
Pakistan Demographic ad Health Survey 1990-91
The survey in 1990-91 was conducted to collect data on household socio-demographic variables,
men and women’s contraceptive knowledge and use, family size preferences, child health and
vaccination status, reproductive history, education and economic status.
A two stage stratified sampling design with probability proportional to size (population in rural
areas and number of households in urban areas) was adopted. The sampling frame for the urban
areas was enumeration blocks consisting of 200-250 households each based on the 1989 Housing
Establishment Census. The sampling frame for the rural areas was villages according to the 1980
Housing Censes (Table 5).

55
Table 5 Numbers of Primary Sampling Units and Households covered, Eligible Women and Husbands Interviewed in the Four Provinces PDHS 1990-91 (numbers below are for households that were available for interview)
PSU Households Eligible Women
Eligible Husbands
Punjab 155 2598 2207 461
Sindh 110 2071 1798 364
KPT 82 1609 1665 313
Baluchistan 60 915 941 216
Total 407 7193 6611 1354

56
A total of 7420 Primary sampling units (PSU) were taken as the master sample and 8019
households forming the secondary sampling units (SSU) were selected. The selected households
covered 408 primary sampling units (PSU). The number of households (SSU) was fixed and
every 18th household was selected in the urban domains as well as the rural domain of Punjab
province. For the rural domains of the remaining three provinces of Sindh, former NWFP and
Baluchistan 25 SSU were selected from each PSU. A subsample was formed by selecting every
3rd household for interview of eligible husbands of the ever-married women (Table 6).

57
Table 6 Survey Sample Size for Rural Areas 1990-91
Number of Primary Sampling Units and Households covered, Eligible Women and Husbands Interviewed in the Four Provinces PDHS 1990-91 (numbers below are for households that were available for interview)
PSU Households Eligible Women
Eligible Husbands
Punjab 83 1420 1212 249
Sindh 40 904 739 158
KPT 40 910 916 169
Baluchistan 19 357 360 82
Total 182 3591 3227 658

58
Description of the study instrument and its development
The 2006-07 Pakistan Demographic and Health Survey (PDHS) was conducted using the
standard DHS core questionnaire. The core questionnaire consisted of the community
questionnaire, short household questionnaire, long household questionnaire, and ever-married
women’s questionnaire. The household questionnaire collected detailed information on the
household characteristics and basic demographic data on household income, number of family
members etc. The ever-married women’s questionnaire consists of 9 sections and collected
detailed information about the reproductive health information from women. It also collected
information on the last three births of a woman and the health outcomes of these children
including ante-natal care, place of delivery and post-natal care, breastfeeding, nutrition,
respiratory infections, diarrhea and immunizations. Detailed immunization history was collected
including information on age of child and date of receiving specific antigens. However the
reasons for not completing the vaccination schedule and indirect costs associated with seeking
vaccination were not collected. In 2006-07 information was also collected using the modules on
child and maternal death to identify cause of death in this population and arrive at national
estimates for child and maternal mortality.
Study Assessment: According to the PDHS protocol the information for immunization status of
a child was noted from the vaccination record card of a child if it was present and shown to the
interviewer at the time of data collection. Where parents were not able to bring forth the
vaccination record card to show to the interviewer, or the card was lost or was never issued by the
EPI programs the mother’s report of the vaccination was used. If the mother reported that a polio
dose was not given at birth than it was assumed that polio vaccine was given with DTP vaccines.
This approach was used in order to not confuse the mother about the oral polio vaccine dose 0
given at birth with the subsequent doses OPV1-3 given at 6, 10 and 14 weeks along with DTP.

59
Study Population
Inclusion criterion: Children 12-23 months of age were included in the analysis as ideally the EPI
vaccination schedule should be completed by twelve months of age and children up to 23 months
of age are most susceptible to the vaccine preventable infections. The exclusion criterion was set
for children less than 12 months and more than 23 months of age as this is also the criterion used
by the WHO and EPI program for reporting vaccination among children. A subset of children up
to 52 weeks of age or one year was selected to assess the Up to Date (UTD) vaccination status for
objective three. The EPI Pakistan objective is to complete the vaccination schedule by 11 months
of age but to attain an adequate sample size for our analysis we set the criterion for children up to
12 months or 52 weeks of age to assess timeliness of the UTD status.
The DTP vaccine schedule was selected to analyze immunization initiation and completion as
WHO recommends monitoring DTP vaccine status for immunization program evaluations. A
child who had not received any vaccine dose of DTP, BCG and polio at the time of the interview
was labeled as never vaccinated. BCG is a onetime single dose vaccine. Since polio drops can be
given more than the recommended schedule during mass immunization days, polio was not
included in the initiation and completion outcome variables.
Children who received a single dose of BCG, three doses of DTP (1-3) and OPV (1-3) and a
single dose of Measles by 52 weeks of age were identified as Up to Date (UTD) for our analysis.
Definition of Populations for Analysis: Children receiving specified vaccines, all specified
vaccines, and no specified vaccine, according to information on the vaccination card or report by
mother/ respondent.
Specified Vaccine:
1. BCG—Anti-tuberculosis to be received shortly after birth.

60
2. DTP—Triple vaccine for diphtheria, pertussis and tetanus, received in three doses at 6, 10,
and 14 weeks after birth
3. Polio—Received in three doses usually given at same time as DTP, plus an additional dose
at birth in Pakistan and several countries in Asia and Africa.
4. Measles—The recommended age is at 9 months and a booster dose at 15 months of age.
5. Up to date (UTD)—child was given single dose BCG, three doses of DTP, three doses of
polio (excluding. the dose given shortly after birth), and single dose of measles by 52 weeks of
age.
6. No vaccinations—none of the specified vaccinations was given.
Definition of Sub-Group population in different analyses:
1. All children age 12 to 60 months of age captured by the PDHS 2006-07 and 1990-91.
This age group was assessed for retention of household held immunization card.
2. Children between 12 and 23 months of age who received the specified vaccines. Where
the information is present on a vaccination card shown to the interviewer, the date of the
vaccination is used, otherwise as reported by the mother.
3. Children 36-52 weeks of age who received single dose BCG, three doses of DTP, three
doses of polio (excluding. the dose given shortly after birth), and single dose of measles.
The vaccination status recorded from the vaccination card and/or mothers report.
Analytic methods
Data cleaning
In keeping with the standard data cleaning protocols (Van den Broeck et al. 2005, e267) the DHS
data sets are vigorously checked to ensure quality control at several stages of data collection,

61
entry and compilation. Paper based questionnaires from the field are checked for correctness of
how responses were categorized and open-ended responses are recoded as needed. All data from
the paper copy is double data entered into electronic files and cross checked for consistency and
corrective action taken where needed. To identify potential problems, quality control tables on
response rates, age displacements and completeness of data are generated to check for any
inconsistencies. The entered data are checked and corrected for missing data, dates of events and
weights and imputations are carried out as needed (Measure DHS 2013)
Creation of data set
The data set used for analysis was a subset of the PHDS 2006-07 and 1990-91 data. It included
information on all children 12-23 months of age regarding their vaccination status and variables
selected for analysis. The analysis was run separately for the two data sets. This approach was
used because although the survey methodologies and questionnaire design for the PDHS 2006-07
and 1990-91 surveys were the same, the quality of execution was different.
The PDHS 2006-07 data subset file entitled Birth Recode (PKbr52FL) was selected and opened
using Stata 11 version. The PKbr52FL dataset contains information on 27,223 children 0-15 years
of age. From the dataset all children 12-23 months of age were selected. The final dataset
contains information on all 1639 children 12-23 months of age, 1104 children 12-23 months of
age who have received DTP1 and 872 children 12-23 months of age who have received DTP3. It
is a large dataset with several hundred variables, but we focused on a total of 15 variables of
interest.
Creation of variables
Binary and multinomial outcome variables were created in order to examine the study hypotheses
(Table 7). The binary variable, B_DTP1 coded as 0 and 1, represented children who did not
receive the DTP1 vaccine dose coded as 0 and children who received the first dose of DTP
vaccine coded as 1. The children who received the first dose of DTP (DTP1) included children

62
for whom the vaccine date was noted on the health/immunization record card, as reported by the
mother and/or the vaccine was marked on the card as having been given. Children for whom the
data were missing or their mothers reported as “don’t know” were all coded as missing data.
A multinomial variable was also created for vaccination initiation with “No DTP1” coded as 0,
“DTP1 date noted/marked on the card” coded as 1, and “DTP1 reported by the mother” coded as
2. This was done to see if various predictors affected the outcome differently if the children
receiving DTP1 vaccine as noted on the card differed from those reported by the mother.
The binary variable B_DTP3 was coded as 0 for receiving no DTP3 vaccine and 1 for receiving
the DTP3 vaccine dose. The latter category was children among those who received the DTP1
vaccine or initiated the DTP vaccination who continued to complete the schedule. A multinomial
variable was also created, with “No DTP3” coded as 0, “DTP3 date noted/marked on the card”
coded as 1 and “DTP3 reported by the mother” coded as 2. This approach was used to see if
various predictors affected the outcome differently if the children receiving DTP3 vaccine was
noted on the card versus reported by the mother (Table 8).
The binary variable Up to date (UTD) immunization status of a child was coded 0 for a child who
was not up to date and coded 1 for a child who was UTD. A child was considered UTD for
immunization if he/she had received a single dose of BCG, 3 doses of DTP and OPV 1 to 3 and a
single dose of measles vaccine by 52 weeks of age.
63
Table 7 Description of coding procedures for dependent variables used for analysis of the PDHS data
Vaccination Initiation
B_DTP1
Confirmed by noting vaccine date on
card, vaccine marked on card and/or
reported by the mother
Coded 0= did not receive DTP1
Coded 1= received DTP1
M_DTP1
Coded 0= did not receive DTP1
Coded 1= vaccine date noted on card
and/or vaccine marked on the card
Coded 2= reported by the mother
Vaccination Completion
B_DTP3
Confirmed by noting vaccine date on
card, vaccine marked on card and/or
reported by the mother
Coded 0= did not receive DTP3
Coded 1= received DTP3
M_DTP3
Coded 0= did not receive DTP3
Coded 1= vaccine date noted on card
and/or vaccine marked on the card
Coded 2= reported by the mother
BCG Coded 0= did not receive BCG
Coded 1= received BCG
Up to Date (UTD)
Coded 0= did not complete the schedule
Coded 1= received BCG, OPV 1-3, DTP 1-3
and Measles

64
The BCG vaccine is the first vaccine dose in the immunization schedule and is given at birth.
Children born in a health center/hospital are very likely to receive it due to availability and not
because of parental efforts; therefore we did not consider this as an indicator of parental health
seeking behavior. Children born at home and in remote areas without easy access to a health
center may or may not receive the BCG vaccine but for children who do, it shows the parental
attitude towards vaccine acceptance. The Polio vaccine was not selected as an outcome variable
as oral polio drops are often given to children during mass immunization campaigns with
vaccination teams visiting children door to door. As this does not allows us to assess population
health seeking behaviors we did not use it as an outcome.
The contextual level variables
The contextual characteristics such as the level of infrastructure development in an area, the
design and functioning of the health care system and extent to which a community has attained
socio-economic development along with individual characteristics like household wealth and
maternal education and age are hypothesized to predict the health seeking behavior and health
outcomes of a population. The selection of contextual level variables and individual level
variables for explaining the variance in the outcomes, was guided by the study conceptual
framework, work by other researchers and data availability.
Province: The place where a family resides is a strong determinant of preventive health seeking
behavior of the population as each province has a different population density and distribution of
health services. The most populated province of Punjab has a population density of 353 persons/
square km (national average is 164 person/km 2 (Government of Punjab 2013): it has many more
health posts providing services to a larger population. Similarly there are many more schools and
higher education institutions resulting in better educated communities, and several centers of
economic growth where a larger population resides in urban and semi-urban areas with associated
amenities. The province of Baluchistan is the largest in terms of land mass but is also the least

65
populated with a population density of 16 person/Km2 (Pakistan Ministry of Information and
Broadcasting 2006). This situation poses a great challenge to the health care service delivery
system due to a widely distributed population and 70% of the areas being rural areas.
Area of residence: Whether the place of residence is urban or rural profoundly determines the
availability of health services, ease of access to the services and travel requirements that can
affect the parental attitudes towards vaccination, including its timely initiation and completion.
Many urban areas in Pakistan have fewer governmental health posts compared to the rural areas
but with better ease of access like the availability of motorized transport. Similarly parents in
urban areas may be inclined to seek vaccination for their children, as many private schools
require vaccination completion records for admission.
Health card: A child is issued a vaccination record card or “health card” by health care
providers/vaccinators at birth or after receiving the first dose of vaccine. The health card can be a
simple one recording only vaccines administered and it can be a more detailed card that notes the
well child visits and charts the growth and development of the child. In other instances the
mother is issued a pre-natal card, which is used to record the vaccines she has received as well as
those administered to her child. It is made of paper and very prone to tear and damage. The date
for each vaccine received is entered and the date for the next visit may or may not be noted on the
card. The parents are required to take care of it and reproduce it at each vaccination visit. Its
provision to parents is a health system’s related variable and there are numerous reported cases
where the health posts run short of health/immunization cards for months. It also becomes a
population health behavior variable as parents who appreciate the value of timely and complete
immunization are more likely to save it. But parents who do not have structured dwellings and/or
appropriate storage space can easily lose it.

66
Individual level characteristics
Mothers’ education: Mothers who have a higher number of years of education are more likely to
seek better health services for themselves and their children. This is an almost universal finding
across all fields of human behavior research. During our exploratory analysis we used the
variable both as a continuous variable, i.e. number of years of schooling as well as a categorical
variable, coded as no education, primary, secondary and higher. After observing the results of the
bivariate data analysis it was seen that there is no difference in the behavior of mothers with no
education and mothers with primary education; therefore it was re-coded for selection into the
final model as no education or up to the primary level, versus secondary education and higher.
Household wealth index: People belonging to higher wealth quintiles have better means to
access health services as they are secure from wage loss due to time spent visiting health
providers and can spend money for transportation. It is also seen universally that households with
higher wealth seek more health services, including preventive health care and have better health
outcomes. We wanted to explore if household wealth influenced immunization services uptake
differentially by place of residence and province.
The household wealth index was calculated differently for the 1990 and 2006 Pakistan
Demographic Surveys. In 1990 fewer variables measuring household possession of durable goods
were used to calculate the wealth index while in 2006 more variables were used to calculate the
wealth index and it was more precise. But for the purposes of our analysis we assumed that the
household wealth variables were comparable in the two time periods.
Head of household: If the head of the household is a female than the decision making process
may be different than when the head of the household is male. We wanted to explore if this factor
influenced health-seeking behavior in Pakistan and thus it was included among the predictor
variables.

67
Birth Order: The first-born child usually receives preferential treatment and also parents may be
more enthusiastic regarding the health of the child and have more time to devote to care seeking.
But this can also be a limiting factor as many first time parents are not aware of where, when and
how to access health services which can result in a delay of the immunization schedule of the
child.
Sex of child: Differential treatment is observed for girls and boys as the female child is more
likely to suffer from malnourishment and delay in seeking health care if the child is sick. We
wanted to observe if a differential parental behavior is observed for timely completion of
vaccination in Pakistan.
Number of children under five years of age: the first- born child may receive preferential
treatment but it can also result in low immunization as first time mothers are not educated enough
on the need for vaccination. As the birth order of a child increases and number of young children
increase a mother is held back from seeking timely preventive health services, as she has to care
for other siblings who also need attention.
Types of analyses performed
Design based analysis was employed to account for the complex nature of the data due to the
sampling design.
Design based analysis for weighted DHS data
Descriptive analyses were performed to compare the distributions of various variables between
the groups, using appropriate statistical tests: chi-square for categorical variables and t-tests for
continuous variables. The child vaccination status was the dependent variable in the analysis and
maternal, child and household characteristics the correlates, as present in the PDHS 1990-91 and
2006-07 data sets for each child.

68
Logistic regression analysis was used for survey design by the STATA “svy” command to adjust
for the clustering and intra-class correlation effects on the sample. In univariate logistic
regression analyses, unadjusted effects of the potential associated factors with outcome variables
of initiation, completion, and up to date immunization were performed. The independent
associations of the factors were assessed through computation of odds ratios along with the 95%
confidence intervals generated from the parameter estimates. Multivariable analyses were then
performed to examine the associations of independent variables with outcome variables, adjusting
for the confounding effect s of other variables. Independent variables with a p-value of 0.25 and
less based on their unadjusted parameter estimates, or those which the theoretical framework
identified as of importance, were considered for the adjusted regression analyses. The variables
were entered one by one, starting from the most significant variable in the univariate analysis.
The significance of an individual independent variable in the adjusted analyeis was assessed by
its confidence interval for the odds ratio and the Wald’s statistic. Variables not found as having a
significant association (p-value > 0.05) with an outcome, not confounding the relationship of
other variables, or theoretically not important, were subsequently removed from the model. The
overall significance of each model was assessed by the likelihood ratio test. After developing the
final model, plausible interactions among the independent variables were evaluated. Assessment
of the final model for goodness of fit was done through the Hosmer-Lemeshow test. Adjusted
OR’s and their 95% confidence intervals generated from parameter estimates were used for
interpretation of the model.

69
Specific Aim I
Assess individual and contextual determinants of vaccination initiation, defined as receiving
DTP1 vaccine, among children 12-23 months of age in 1990 and 2006 in Pakistan.
Research question
What variables determine the vaccination initiation, defined as receiving DTP1 vaccine, among
children 12-23 months of age in 1990 and 2006 in Pakistan?
Research Hypothesis
Contextual level determinants, more than individual level variables, are likely to be associated
with vaccination initiation, defined as receiving DTP1 vaccine, among children 12-23 months of
age in 1990 and 2006 in Pakistan.
Data Sources: Pakistan Demographic and Health survey data for the years 1990 and 2006. The
file “Children recode”, PKKR21FL.DTA of the1990 survey and PKKR52FL.DTA of the 2006-07
survey were selected for the analysis. The outcome variable was created as a binary variable and
an alternate analysis was also performed whereby the outcome was in the form of a multinomial
variable. The binary variable, B_DTP1, was coded as 0 and 1: children who did not receive the
DTP1 vaccine dose were coded as 0 and children who received the first dose of DTP vaccine
were coded as 1.
The multinomial variable M_DTP1 was coded as 0 for No DTP1, DTP1 date noted/marked on the
card was coded as 1 and DTP1 reported by the mother was coded as 2. This was done to see if
various predictors affected the outcome differently if the children receiving DTP1 vaccine were
confirmed by noting the information from the health/immunization cards or were reported by the
mothers.
Predictor variables included in the analysis were as follows:

70
• “Region” or province the child lived in categorized into Punjab, Khyber Paktunkhwa,
Sindh and Baluchistan.
• “Place of residence” coded as urban and rural
• “Wealth” which consisted of the household wealth index coded as poorest, poor, middle,
rich, and richest
• Sex of the head of household
• “Mother education” coded as no education or primary education, and up to middle and
higher
• Birth order of child
• Sex of child
Statistical analysis
Frequency distributions for the sample were calculated for children who had received DTP1
vaccine verses those who had not received DTP1 as well as the individual and contextual level
characteristics of the population. The results were presented in frequency distribution tables.
Differences in the sample characteristics between children who had received DTP1 vaccine
versus those who did not receive DTP1 vaccine were also calculated and the results presented in
percentages as well as absolute numbers. The analysis was done using a binary logistic regression
for the binary outcome and multinomial logistic regression analysis was performed for the
multinomial outcome.
Sample size and power calculation
The PDHS 2006-07 final data set selected for analysis contains information on immunization
status of 1639 children 12-23 months of age, 1104 children 12-23 months of age who have
received DTP1 and 872 children 12-23 months of age who have received DTP3. The sample size
is adequate and allows with 80% power and alpha set at 0.05 to detect a 5% difference in
immunization rates between two groups of children.

71
The PDHS 1990-91 dataset contains information on immunization status for 1215 children 12-23
months of age, 769 children 12-23 months of age who have received DTP1, 493 children 12-23
months of age who has received DTP3 and 561 children who received Measles vaccine. The
sample size is adequate and allows with 80% power and alpha set at 0.05 to detect a 5%
difference in immunization rates between two groups of children

72
Specific Aim II
Assess individual and contextual determinants of vaccination completion, defined as receiving
DTP3 vaccine, among children 12-23 months of age in 1990 and 2006 in Pakistan.
Research question
What variables determine the vaccination completion, defined as receiving DTP3 vaccine, among
children 12-23 months of age in 1990 and 2006 in Pakistan?
Hypothesis
Contextual level determinants, more than individual level variables, are likely to be associated
with vaccination completion, defined as receiving DTP3 vaccine, among children 12-23 months
of age in 1990 and 2006 in Pakistan.
Data Sources: Pakistan Demographic and Health survey data for the years 1990 and 2006. The
file “Children recode”, PKKR21FL.DTA of the1990 survey and PKKR52FL.DTA of the 2006-07
survey were selected for the analysis.
Outcome Variable: A binary variable B_DTP3 for vaccination completion was created. It was
coded as 0 for children who did not receive the third dose of DTP vaccine and 1 for those
children who received the third dose of DTP vaccine.
The multinomial outcome variable M_DTP3 was created to assess the outcome according to the
way vaccination completion was verified. It was coded as 0 for No DTP3, coded as 1 for DTP3
date noted/marked on the card and as 2 for DTP3 reported by the mother.
Predictor variables
• Contextual level variables: province of residence, place of residence and child having a
vaccination card.

73
• Individual level variables: household wealth index, sex of the head of the household,
maternal education, maternal age, sex of the child, birth order of child and number of
children under five years of age in the household.
Statistical analysis
Descriptive analyses were done to assess the population characteristics and sample distributions
in relation to the outcome and predictor variables. The sample proportions and their SEs and 95%
CIs were examined while assessing the sample distributions.
Missing data: Percentages of missing data were calculated for each of the predictor variables.
The variables with 3-7% missingness were analyzed excluding the missing data. For variables,
which had more than 7% missing data, multiple imputation techniques were employed to correct
for the missing values.
Explanatory analyses were carried out in two steps: Univariate regression analysis was
performed for all the predictor variables and the estimates, p-values, and 95% confidence
intervals noted for each. Adjusted analysis, using binary logistic regression, was used to assess
the associations between children completing the vaccination schedule with maternal, child, and
household characteristics and contextual factors. For the selection of the final model we started
with the full model and noted the estimate, p-value and Mean SE for each variable. Variables that
were statistically insignificant were dropped one at a time. After the removal of each variable the
change in estimate and significance were noted. The model with the highest pseudo R2, and
lowest Mean SE was retained. In addition to the pseudo R2 and Mean SE, stepwise Akaike
Information Criteria (AIC) was also considered to select the most parsimonious model. Some
variables were retained in the final model regardless of the level of significance if they were
considered as important to the conceptual model. Design based analysis was carried out by
specifying in the program that the data were survey data collected through a complex sampling
74
framework, thus accounting for the hierarchical nature of the data as children were nested within
households and households were nested within clusters/PSUs.
To assess the collinearity among the predictor variables the Variance Inflation Factor analysis
(VIF) was carried out. Sets of variables that were not significantly associated with the outcome
variable in the multivariate analysis but were highly significant in the univariate analysis as
indicated by the F-statistic were checked for collinearity. The VIF command in STATA is only
applicable after linear regression. To overcome this limitation the model with the predictor
variables was fit using an alternate outcome (age of mother as a continuous variable) and
followed by the VIF command. The highly collinear predictor variables were identified and
necessary correction was made. All analyses were performed keeping in view the survey design
with stratified cluster sampling by using the svy function in STATA. When setting the command
for design-based analysis, the variables for stratum, primary sampling units and sampling weights
were specified which accounts for the clustering of the survey data. We also assessed the
goodness-of-fit of the model by running appropriate tests using the svylogitgof. The sample size
considerations and power calculations were the same as those performed for Specific Aim I.
Sample size and Power calculation:
The PDHS 2006-07 dataset contains information on immunization status of 1639 children 12-23
months of age, 1104 children 12-23 months of age who have received DTP1 and 872 children 12-
23 months of age who have received DTP3. The sample size is adequate and allows with 80%
power and alpha set at 0.05 to detect a 5% difference immunization rate in two groups of
children.
The PDHS 1990-91 dataset contains information on immunization status on 1215 children 12-23
months of age, 769 children 12-23 months of age who have received DTP1 and 493 children 12-
23 months of age who have received DTP3 and 561 children who received Measles vaccine. The

75
sample size is adequate and allows with 80% power and alpha set at 0.05to detect a 5% difference
in immunization rate in two groups of children
Specific Aim III
Research question
What variables are associated with up to date (UTD) immunization among children 36-52 weeks
of age in Pakistan?
Research Hypothesis
Contextual level variables, more than individual level variables, are likely to be associated with
the status of UTD immunization among children 36 to 52 weeks of age in Pakistan.
Data Sources: Pakistan Demographic and Health survey 2006
Outcome Variable: Up to date (UTD) immunization status of a child. For our analysis a child is
considered UTD for immunization if he/she has received a single dose of BCG, 3 doses of DTP
and OPV 1 to 3 and a single dose of measles vaccine by 52 weeks of age.
Predictor variables: These included the place of residence, province of residence, household
wealth quintile, maternal age, maternal education, birth order of child, sex of child and number of
children under five years of age in the household.
Sample size and power calculations: The PDHS 2006-07 data set selected for the UTD analysis
contains information on immunization status of 775 children, 36-52 weeks of age among whom
544 (70.19%) had not completed the recommended schedule and only 231 (29.81%) had
completed the recommended schedule. The sample size is adequate and allows with 80% power
and alpha set at 0.05to detect a 5% difference in immunization rates between two groups of
children.

76
Statistical analysis
Descriptive analysis was done to assess the population characteristics and sample distributions in
relation to the outcome and predictor variables. The sample proportions and their SEs and 95%
CIs were examined while assessing the sample distributions. For sample characteristics,
percentages and frequencies were calculated.
Missing data: The percentage of missing data was calculated for each predictor variable. The
variables with 3-7% missingness were analyzed, omitting the cases with missing data. For
variables which had more than 7% missing data, multiple imputation techniques were employed
to supply values for the analysis.
Explanatory analysis was carried out in two steps: Univariate regression analysis was performed
for all the predictor variables and the estimate, p-value, and 95% confidence interval noted for
each. Adjusted analyses using binary logistic regression and multinomial logistic regression were
performed to assess the associations between children completing the vaccination schedule and
maternal, child, and household characteristics and contextual factors. For the selection of the final
model we started with the full model and noted the estimate, p-value and Mean SE for each
variable. Variables that were statistically insignificant were dropped one at a time. After the
removal of each variable the change in estimate and significance was noted. The model with the
highest pseudo R2, and lowest Mean SE was retained. In addition to the pseudo R2 and Mean SE,
a stepwise Akaike Information Criteria (AIC) was also used to select the most parsimonious
model. Some variables were retained in the final model regardless of the level of significance due
to their importance in the conceptual model. Design based analysis was carried out by specifying
in the program that the data were survey data from a complex sampling framework, thus
accounting for the hierarchical nature of the data as children were nested within households and
households were nested within clusters/PSUs.

77
To assess the collinearity among the predictor variables the Variance Inflation Factor analysis
(VIF) was carried out. Sets of variables that were not significantly associated with the outcome
variable in the multivariate analysis but were highly significant in the bivariate analysis as
indicated by the F-statistic were checked for collinearity. The VIF command in STATA is only
applicable after linear regression. To overcome this limitation the model with the predictor
variables was fit using an alternate outcome (age of mother as a continuous variable) and
followed by the VIF command. The highly collinear predictor variables were identified and the
necessary correction was done.
Predictors of an immunization card retention
We analyzed the data from the Pakistan demographic and health surveys 1990 and 2006 for
children between the ages of one year and five years. The information on having an immunization
card was available for 4670 and 6371 children from the PDHS 1990 and 2006 surveys
respectively. The information was available for three variables, including when the mothers were
asked if the child had an immunization card, when the information on receipt of DTP1 vaccine
was recorded and when the information on receipt of DTP3 vaccine was recorded. The primary
variable of interest was if the respondents provided information on receipt of vaccine by
presenting the card or the respondent reported that the child received the vaccine in the absence of
the card. Using descriptive statistics while adjusting for the survey design, we compared the
information on basic socio-economic variables with the reporting/presence of an immunization
card. For the analysis of determining the factors associated with retaining a card, the outcome was
defined as a binary variable. Those cases that reported no vaccination were excluded from the
analysis. We looked at the independent effect of socio-economic variables on the immunization
card retention/versus mother’s report only using logistic regression analysis. The analysis was
performed only for the 2006 data. We performed adjusted multivariate analysis for variables that
showed a statistically significant independent effect on immunization card retention. Odds ratios

78
and their respective confidence intervals were calculated to assess the effects of various variables
on immunization card retention. We used chi-square as a test of significance for categorical
variables and means for continuous variables.
Human subjects issues
The PDHS data are publicly available and the identity of individuals cannot be traced. Therefore
an exemption was obtained from the Johns Hopkins Institutional Review Board for ethical
approval of Human Subjects Research (HSR). The institutional exemption letter was granted on
April 15, 2011 and is attached in the appendices.

Table 8: Definition of Outcome Variables used for analysis
Variable Definition Population Base Numerator Denominator Calculation
DTP 1 completion
Children 12-23 months of age who received the first dose of Diphtheria, Pertussis and Tetanus vaccine dose
Children up to five years of age born to mother who slept in the household the night before the interview
Children ages 12-23 months who received DTP1
All children ages 12-23 months
DTP1 completion rate: (numerator/denominator)*
100
DTP 3 completion
Children 12-23 months of age who received the third dose of Diphtheria, Pertussis and Tetanus vaccine dose
Children up to five years of age born to mother who slept in the household the night before the interview
Children ages 12-23 month who received DTP3
All children ages 12-23 months
DTP3 completion rate: (numerator/denominator)*
100
Child UTD
Children 36-52 weeks of age who have received one dose of BCG and Measles vaccine and three doses of DTP and Polio vaccine
Children up to five years of age born to mother who slept in the household the night before the interview
Children ages 36-52 weeks who received single dose of BCG and Measles vaccine and three doses of DTP and Polio vaccine
All children ages 36-52 weeks
UTD rate: (numerator/denominator)*
100

80
Variable Definition Population Base Numerator Denominator Calculation
No vaccine
At the time of interview
Children 12-23 months of age who have not received any vaccine dose at the time
Children up to five years of age born to mother who slept in the household the night before the interview
Children ages 12-23 months received no vaccination
All children ages 12-23 months
No Vaccination: (numerator/denominator)*
100

Chapter 4: Results

82
Specific aim 1
Assess individual and contextual determinants of vaccination initiation, defined as receiving
DTP1 vaccine, among children 12-23 months of age in 1990 and 2006 in Pakistan.
Vaccination initiation
Descriptive analysis
PDHS 2006-07
According to our set criterion 23% of the children 12-23 months of age did not initiate the
vaccination schedule and missed receiving the DTP1 vaccine. The province of Punjab, being the
most densely populated and having the largest population in the country, represented 56.8% of
the sample size and 69% of the total sample was residing in rural areas. The province of
Balochistan represents 6% of the total population of Pakistan and 4.04% of our sample size. The
various wealth quintiles were almost equally represented in the sample. Only a small proportion
of the households (7.3%) had a female as a head of household, whereas the remainders of the
household heads were men. It was alarming to see that 63.38% of the mothers had no education,
15% had up to the primary level and 15.57% had secondary education. Only 6.01% of the
mothers had education above the secondary level and higher. As the age of marriage has
increased in Pakistan, only a small proportion of mothers (3.87%) were in the age group of 15-19
years old whereas half of the mothers were in the age group of 20-29 years. The dilemma of the
missing girl child is also observed in Pakistan as 52.79% of the sample was male and 47.21%
were female children. A quarter of the children, 24.88%, were never issued a
health/immunization card and only 23.74% of the mothers were able to produce the card at the
time of the interview (Table 9).
Characteristics of children who did and did not initiate the vaccine schedule: The highest
percentage of children (37.18%) who did not initiate the vaccination schedule were from the
province of Baluchistan. The percentage of children who did not receive any DTP1 vaccine was

83
similar in the provinces of Sindh and Khyber Pakhtunkhwa at 30.33% and 29.15% respectively.
The best performing province in terms of children initiating the DTP schedule was Punjab, as
82.03% received the DTP1. Among children who were never issued a health/immunization card
76.27% never received the DTP1 vaccine, and among those for whom a card was seen at the time
of the interview 97.74% had initiated the DTP vaccine schedule. The children in the poorest
wealth quintile fared worst as nearly half, 45.78%, never initiated the DTP vaccine schedule. A
similar discrepancy was seen among mothers with no education as 32.2% of children whose
mothers had no education were never vaccinated with DTP1. Children belonging to the youngest
(35.2%) and oldest mothers (42.93%) were more likely than the children of mothers in other age
groups not to initiate the DTP vaccination schedule. It was observed that households headed by a
female had a higher percentage of children vaccinated for DTP1 at 86.1%, compared to
households headed by a male family member at 75.91%.
PDHS 1990-91:
Sample characteristics: In exploratory analysis of the data of the first Pakistan DHS survey it
was observed that among children 12-23 months of age, 36.58% did not initiate the DTP
vaccination schedule (Table 10). A much larger proportion of the sample was selected from the
province of Punjab (63.88%) as it was the most highly populated province in the country and had
a better infrastructure to reach the population. The national rural urban divide of 70/30% was also
observed in the sample as 69.32% and 30.68% was from the rural and urban areas respectively.
The remaining three provinces of Sindh, Khyber Paktunkhwa and Baluchistan were represented
in the sample at 19.9%, 12.84% and 3.37% respectively. In our sample 34.29% of the children
were never issued a health/immunization card and only 27.43% of the mothers were able to
produce the card at the time of the interview.
The various wealth quintiles were almost equally represented in the sample. A much smaller
proportion of the households (4.19% %) were headed by a female and 95.81% were headed by a

84
male family member. Mothers with no education constituted 76.83% of the sample mothers,
10.46% had up to the primary level, and 11.82% had secondary education, while merely 0.89% of
the mothers in the sample had higher education. Adolescent mothers in the age group of 15-19
years constituted only 4.96% of the sample and the majority of the mothers were in the age group
of 20-29 years. The sample contained an equal proportion of male and female children at 49.51%
and 50.49% respectively.
Characteristics of children who did and did not initiate the vaccine schedule: An alarming
61.01% of the children in the province of Baluchistan did not initiate the DTP vaccination
schedule and the percentage of children who did not receive any DTP1 vaccine in the provinces
of Sindh and KPT were at 44.28% and 37.58% respectively (see Table 11). The province of
Punjab fared well as 66.84% of the children initiated the DTP schedule. Among children who
were never issued a health/immunization card 93.06% never received DTP1 vaccine and among
those for whom a card was seen at the time of the interview 97.14% had initiated the DTP
vaccine schedule. The children in the poorest wealth quintile fared worst as more than half,
61.83%, never initiated the DTP vaccine schedule. As social inequity, illiteracy and poverty occur
side by side, 43.83% of mothers with no education never initiated the DTP1 schedule for their
children. Children belonging to the youngest mothers (47.72%) and children belonging to the
oldest mothers (53.16%) were more likely than the children of mothers in other age groups to
have never been vaccinated with the DTP1 vaccine. The households headed by a female and
those headed by a male family member had a similar proportion of children vaccinated for DTP1
at 70.44% and 62.78% respectively.
Unadjusted analysis: vaccination initiation
PDHS 2006
The binary outcome for immunization initiation was defined as children receiving the DTP1
vaccine, coded as 0 for “did not receive DTP1” and 1 for “received DTP1.” Using logistic

85
regression analysis, the binary outcome for immunization initiation was regressed separately
against each of the contextual and individual level variables (see Table 12).
The first contextual level variable was province of residence, coded as Punjab, Sindh, Khyber
Paktunkhwa (KPT) and Baluchistan. Assessing the factors associated with vaccination initiation,
the unadjusted analysis for the 2006 data showed that children in the province of Sindh (OR 0.5;
95% CI 0.34—0.74) and KPT OR 0.53; 95% CI 0.33—0.86) were half as likely as children in
Punjab province to receive DTP1. The children in the province of Baluchistan fared the worse in
the country regarding the vaccination initiation (OR 0.37; 95% CI 0.23—0.6). The second
contextual level variable, “place of residence” was coded as 0 for Urban and 1 for rural. It was
also statistically significant and children in the rural areas were less likely than children in urban
areas to initiate vaccination (OR 0.4; 95% CI 0.29—0.58).
The variable “having health card” was coded with “no card” as 0, “yes seen” as 1, “yes, but not
seen” as 2 and “no longer has card” as 3. Compared to children who were never issued an
immunization/health card (acting as the reference category), children who were issued a card and
it was seen at the time of the interview were very likely to initiate the immunization schedule (OR
139.25; 95% CI 68.2—284.31). Even if the mothers were not able to produce the health card at
the time of the interview, their children did significantly better than children with no card at all
(OR 49.6; 95% CI 28.93—85.02). Even the point estimate and 95% CI for children who no
longer had a card (as the immunization schedule lasts until 9 months of age) was better compared
to children who were never issued a card (OR 28.55; 95% 15.31—53.23).
For the individual level variable “household wealth” the reference category was the Poorest and
compared to them children in the “poor” category did not do much differently, (OR 2.03; 95% CI
1.32—3.12); the children in the “middle” category did comparatively better (OR 3.93; 95% CI
2.35—6.58) than the poorest children. The children in the “rich” (OR 6.34; 95% CI 3.64—11.02),

86
and “richest” (OR 7.89; 95% CI 4.27—14.58) quintiles had much better comparable odds of
initiating vaccination compared to the poorest children.
In the unadjusted analysis mother’s education was coded with “No education” as 0 which was the
reference category. The other categories were coded “primary” as 1, “secondary” as 2 and
“higher” as 3. Compared to children belonging to mothers with no education the odds of children
initiating vaccination for mothers with primary education was 3 times higher (OR 2.9; 95 CI
1.74—4.81). As the education level of the mothers increased to secondary level the odds doubled
(OR 7.5; 95% CI 3.78—14.9) and the odds of children initiating vaccination for children whose
mothers had higher education was 11 times that of children whose mothers had no education (OR
11.04; 95 CI 2.24—54.55). Sex of the child was a significant determinant of initiating
vaccination (ref male, OR 0.72; 95% CI 0.53—0.98); the “birth order” of a child, which was a
continuous variable showed that children with higher birth order had a lower odds of vaccination
initiation or a delay in vaccination initiation (OR 0.88; 95%CI 0.83—0.94).
PDHS 1990
The binary outcome for vaccination initiation was regressed against the contextual and individual
level variables using binary logistic regression. In 1990-91 the children in the province of
Balochistan were less likely to receive DTP1 compared to children in the province of Punjab (OR
0.32; 95% CI 0.18-0.56). Similarly children in the provinces of Sindh (OR 0.62; 95%CI 0.42-
0.91) and KPT (OR 0.82; 95%CI 0.53-1.27) were also less likely to receive DTP1 but the results
were statistically significant only in Sindh . Children in the rural areas were less likely to initiate
immunization compared to children in the urban areas (OR 0.29; 95% CI 0.19-0.43) (See Table
13).
A child who had been issued a health/immunization card was very likely to initiate the
vaccination schedule. Compared to children who were never issued a health/immunization card

87
(reference category), children for whom the card was seen at the time of the interview had odds
that were staggeringly higher (OR 455.53, 95% CI 135.59-1530.46). The odds for children who
were issued a card but mothers were unable to produce it at the time of the interview were still
high (OR 142.14; 95% CI 64.16-314.91), and for children who no longer had the card the odds
were still significant (OR 61.60; 95% CI 15.69-241.87) compared to children who were never
issued a card.
Household wealth was also a significant determinant of children initiating the vaccination
schedule in 1990-91 but the findings were statistically significant for higher wealth quintiles
compared to households in the poorest quintile (reference category). For households in the “poor”
(OR 2.23; 95%CI 1.16-4.15) and middle category (OR 2.23; 95%CI 1.23-4.10) the odds of
immunization initiation were higher than children in the poorest wealth quintile. The households
in the “rich” quintile (OR 3.63; 95% CI 1.93-6.81) and richest quintile (OR 12.75; 95% CI 6.79-
25.05) had considerably higher odds of initiating immunization for children (Table 13).
Among the individual level variables mother’s education was statistically significant for all
categories; children whose mothers had secondary and higher education were 5 times (OR 5.22;
95% CI 2.60-10.51) more likely to initiate vaccination compared to children belonging to mothers
with no education (No education was the reference category). Children belonging to mothers with
primary education had four times the odds of vaccination initiation (OR 4.27; 95% CI 2.31-7.89)
compared to mothers with no education. Among the individual variables sex of household head,
mother’s age, sex of child, birth order of child (measured as a continuous variable), were not
statistically significant. At a p-value of 0.03, the number of children under-five years old was a
significant predictor (Table 13).

88
Adjusted analysis: vaccination initiation
PDHS 2006
A binary logistic regression model was run with all the variables in the model and the only
statistically significant variable was household wealth. As a high correlation of having a health
card with vaccination initiation was observed, this variable was not selected for inclusion into the
adjusted analysis. During model selection it was observed that mothers with no education did not
behave differently from mothers with up to primary education, therefore the two categories were
merged. Similarly households in the poorest wealth quintile did not differ from households in the
poor wealth quintile; therefore the two categories were merged. This resulted in both the variables
being statistically significant. Two variables--household wealth index and maternal education--
were seen as the two main determinants of vaccination initiation in the final model (Tables 14-
16).
PDHS 1990
For further analysis only the variables that were observed to be statistically significant during the
univariate analysis were selected for the adjusted model. In the adjusted model province of
residence was statistically significant for the province of Sindh (Punjab ref, Sindh OR 0.45, 95%
CI 0.30-0.66). Children in Baluchistan were also less likely to initiate vaccination compared to
children in Punjab and the results were statistically significant at 0.01 (OR 0.38; 95% CI 0.20-
0.74). The individual level variable household wealth was statistically significant for households
in all wealth quintiles compared to the poorest category (Poorest ref., Poor OR 2.00; 95% CI
1.05-3.80, Middle OR 2.11; 95% CI 1.09-4.10, Rich OR 3.09; 95% CI 1.63-5.86, Richest OR
10.55; 95% CI 5.17-21.51). Among the individual level variables maternal education was a
statistically significant predictor of vaccination initiation but the results were statically significant
only for the category “primary education” (No Education ref., Primary OR 2.77; 95% CI 1.50—
5.13 and Secondary and Higher OR 1.78; 95%CI 0.78—4.05, p-value 0.17). (Table 17)

89
Table 9 Characteristics of Children 12 to 23 months of Age in the Pakistan Demographic and Health Survey (PDHS) 2006
Proportion SE 95% Confidence Interval Sample
size Received DTP1
No 0.23 0.01 0.20 0.26 Yes 0.77 0.01 0.74 0.80 1493
Province Punjab 0.57 0.01 0.54 0.59 1692
Sindh 0.25 0.01 0.23 0.27 Kyber Patunkhwa 0.14 0.01 0.13 0.16 Balochistan 0.04 0.00 0.03 0.05 Area of residence
urban 0.31 0.01 0.29 0.33 rural 0.69 0.01 0.67 0.71 Wealth Index
1692
Poorest 0.22 0.01 0.19 0.25 Poorer 0.22 0.01 0.19 0.24 Middle 0.19 0.01 0.17 0.21 Richer 0.19 0.01 0.17 0.22 Richest 0.18 0.01 0.15 0.20 Household Head
1692
male 0.93 0.01 0.91 0.95 female 0.07 0.01 0.05 0.09 Mother's Education
1692
No Education 0.63 0.02 0.60 0.67 Primary 0.15 0.01 0.13 0.17 Secondary 0.16 0.01 0.13 0.18 Higher 0.06 0.01 0.05 0.08 Mother's Age
1692
15-19 3.87 0.01 0.03 0.05 20-24 0.25 0.01 0.22 0.28 25-29 0.29 0.01 0.26 0.31 30-34 0.25 0.01 0.22 0.28 35-39 0.12 0.01 0.10 0.14 40-44 0.04 0.01 0.02 0.05 45-49 0.02 0.01 0.01 0.03 Sex of Child
1692
Male 0.53 0.02 0.50 0.56 Female 0.47 0.02 0.44 0.50

90
Table 9 (contd.): Characteristics of Children 12 to 23 months of Age in the Pakistan Demographic and Health Survey (PDHS) 2006
Proportion SE 95% Confidence Interval Sample
size Health Card
1541
No card 0.25 0.02 0.22 0.28 Yes, seen 0.24 0.02 0.21 0.27 Yes, not seen 0.39 0.02 0.35 0.42 No longer has card 0.12 0.01 0.10 0.14 Missing 0.00 0.00 0.00 0.00 Number of Children <5 years in the household
1692
Mean 2.34 0.05 2.24 2.45

91
Table 10 Characteristics of Children 12 to 23 Months of Age in the Pakistan Demographic and Health Survey (PDHS) 1990
Proportion SD 95% Confidence Interval Received DTP1
No 36.58 0.02 32.73 40.41 Yes 62.56 0.02 58.60 66.51
Province Punjab 63.88 0.18 60.28 67.49
Sindh 19.9 0.01 17.30 22.52 Khyber Pakhtunkhwa 12.84 0.01 10.65 15.02 Balochistan 3.37 0.01 1.93 4.82
Area of residence Urban 30.68 0.02 27.39 33.96
Rural 69.32 0.02 66.04 72.61 Wealth Index
0.00
Poorest 16.85 0.02 12.40 21.30 Poor 23.36 0.02 19.31 27.41 Middle 18.79 0.02 15.67 21.91 Rich 21.59 0.02 17.49 25.67 Richest 19.41 0.02 16.45 22.35
Household Head Male 95.81 0.01 93.91 97.71
Female 4.19 0.01 2.29 6.09 Mother's Education
No Education 76.83 0.02 73.33 80.34 Primary 10.46 0.01 8.07 12.84 Secondary 11.82 0.01 9.52 14.11 Higher 0.89 0.00 0.17 1.62

92
Table 10 (contd.): Characteristics of Children 12 to 23 months of Age in the Pakistan Demographic and Health Survey (PDHS) 1990
Proportion SD 95% Confidence Interval Mother's Age
15-19 4.96 0.01 3.42 6.50 20-24 20.08 0.01 17.39 22.77 25-29 33.70 0.02 28.95 38.45 30-34 20.05 0.02 16.56 23.55 35-39 13.39 0.01 10.57 16.20 40-44 5.94 0.01 3.85 8.03 45-49 1.88 0.01 0.83 2.92
Sex of Child Male 49.51 0.02 45.56 53.46
Female 50.49 0.02 46.54 54.44 Health Card
No card 34.29 0.02 30.59 37.99 Yes, seen 27.43 0.02 23.58 31.28 Yes, not seen 34.65 0.02 30.48 38.82 No longer has card 3.62 0.01 2.32 4.93

93
Table 11 Characteristics of Children 12 to 23 months of Age in the Pakistan Demographic and Health Survey (PDHS) 1990
Did not Receive DTP1 Received DTP1
Freq. (%) Freq. (%) Total p-value Province
<0.01
Punjab 138 (33.16) 330 (66.84) 468 Sindh 128 (44.28) 189 (55.72) 317 Khyber Pakhtunkhwa 106 (37.58) 213 (62.42) 319 Balochistan 98 (61.01) 76 (38.99) 174 Area of residence
<0.001
Urban 177 (18.96) 481 (81.04) 658 Rural 293 (44.88) 327 (55.12) 620 Wealth Index
<0.001
Poorest 92 (61.83) 49 (38.17) Poor 102 (42.12) 103 (57.88) Middle 104 (41.98) 152 (58.02) Rich 112 (30.87) 212 (69.13) Richest 60 (11.25) 292 (88.75) Household Head
<0.32
Male 454 (37.22) 770 (62.78) 1224 Female 16 (29.56) 38 (70.44) 54 Mother's Education No education 423 (43.83) 531 (56.17) 954 Primary 24 (15.45) 109 (84.55) 133 Secondary 23 (13.98) 155 (86.02) 178 Higher 0 13 (100) 13 Mother's Age
<0.69
15-19 34 (47.72) 33 (52.28) 67 20-24 99 (32.41) 185 (67.59) 284 25-29 137 (37.23) 267 (62.77) 404 30-34 94 (37.21) 170 (62.79) 264 35-39 64 (35.33) 101 (64.67) 165 40-44 30 (38.44) 40 (61.56) 70 45-49 12 (53.16) 12 (46.84) 24

94
Table 11 (continued): Characteristics of Children 12 to 23 months of Age in the Pakistan Demographic and Health Survey (PDHS) 1990
Did not Receive DTP1 Received DTP1
Freq. (%) Freq. (%) Total p-value Sex of Child
0.6805
Male 226 (35.95) 399 (64.05) 625 Female 244 (37.81) 409 (62.19) 653 Health Card
<0.000
No card 406 (93.06) 23 (6.94) 429 Yes, seen 9 (2.86) 349 (97.14) 358 Yes, not seen 39 (8.6) 395 (91.14) 434 No longer has card 6 (17.88) 40 (82.12) 46

95
Table 12: Odds ratios for individual and contextual characteristics associated with the receipt of the first dose of DTP vaccine among children aged 12 to 23 months, using logistic regression analysis, Pakistan Demographic and Health Survey 2006
Odds Ratio
p-value 95% CI for OR
Province Punjab REF
Sindh 0.50
0.001 0.34 0.74 KPT 0.53
0.011 0.33 0.86
Balochistan 0.37
0 0.23 0.60 Area of residence
Urban REF Rural 0.41
0 0.29 0.58
Wealth Index Poorest REF
Poor 2.03
0.00 1.32 3.12 Middle 3.93
0.00 2.35 6.58
Rich 6.34
0.00 3.64 11.02 Richest 7.89
0.00 4.27 14.58
Household Head Male REF
Female 1.97
0.03 1.07 3.62 Mother's Education
No education REF Primary 2.89
0.00 1.74 4.81
Secondary 7.50
0.00 3.78 14.88 Higher 11.04
0.00 2.24 54.55
Mother's Age 15-19 REF
20-24 1.86
0.11 0.88 3.93 25-29 1.93
0.09 0.91 4.13
30-34 1.98
0.07 0.94 4.15 35-39 1.82
0.14 0.82 4.06
40-44 1.23
0.67 0.47 3.25 45-49 0.72
0.65 0.18 2.96
Mean Age of Mother 0.99
0.58 0.96 1.02
96
Table 12 (contd.) Odds ratios for individual and contextual characteristics of population associated with receipt of first dose of DTP vaccine in children aged 12 to 23months old using logistic regression analysis, Pakistan Demographic and Health Survey 2006
Odds Ratio
p-value 95% CI for OR
Sex of Child Male REF
Female 0.72
0.04 0.53 0.98 Health Card
No card REF Yes, seen 139.25
0.00 68.21 284.31 Yes, not seen 49.59
0.00 28.93 85.02
No longer has card 28.55
0.00 15.31 53.23 Number of Children <5 years in the Household (continuous) 1.02
0.74 0.89 1.18
Birth order of child (continuous) 0.88
0.00 0.83 0.94

97
Table 13: Odds ratios for individual and contextual characteristics associated with receipt of the first dose of DTP vaccine among children aged 12 to 23 months, using logistic regression analysis, Pakistan Demographic and Health Survey 1990
Odds Ratio p-vlaue 95% CI for OR
Province Punjab REF
Sindh 0.62 0.016 0.42 - 0.91
Khyber Pakhtunkhwa 0.82 0.385 0.53 - 1.27
Balochistan 0.32 <0.000 0.18 - 0.56
Area of residence Urban REF
Rural 0.29 <0.000 0.19 - 0.43
Wealth Index Poorest REF
Poor 2.23 0.012 1.16 - 4.15
Middle 2.23 0.009 1.23 - 4.10
Rich 3.63 <0.000 1.93 - 6.81
Richest 12.75 <0.000 6.79 - 25.05
Household Head Male REF
Female 1.412313 0.356 0.68 - 2.95
Mother's Education No education REF
Primary 4.27 <0.000 2.31 - 7.89
Secondary and Higher 5.22 <0.000 2.60 - 10.51
Mother's Age 15-19 REF
20-24 1.9 0.12 0.84 - 4.31
25-29 1.54 0.25 0.74 - 3.22
30-34 1.54 0.26 0.73 - 3.26
35-39 1.67 0.24 0.71 - 3.95
40-44 1.46 0.43 0.56 - 3.79
45-49 0.8 0.74 0.22 - 2.92

98
Table 13 (contd.): Table odds ratios for individual and contextual characteristics of population associated with the receipt of first dose of DTP vaccine in children aged 12 to 23months old using logistic regression analysis, Pakistan Demographic and Health Survey 1990
Odds Ratio
p-value 95% CI for OR
Sex of Child Male REF
Female 0.92
0.68 0.63 - 1.35
Health Card No card REF
Yes, seen 455.53
<0.000 135.6 - 1530.5
Yes, not seen 142.14
<0.000 64.2 - 314.9 No longer has card 61.60
<0.000 15.7 - 241.9
Number of Children <5 years in the Household 1.19
0.033 1.0 - 1.4
Age of Child (months) 1.01
0.73 0.96 - 1.07 Birth order of child (continuous)
0.95
0.076 0.9 - 1.00

99
Table 14: Adjusted odds ratios of the full model for contextual and individual level variables associated with the receipt of the first dose of DTP vaccine among children aged 12 to 23 months, using logistic regression analysis, Pakistan Demographic and Health Survey 2006
Odds Ratio p-value 95% Confidence Interval
Province Punjab REF
Sindh 0.64 0.053 0.41 1.01 KP 0.64 0.06 0.39 1.03 Balochistan 0.58 0.05 0.34 0.99
Place of Residence Urban REF Rural 0.85 <0.45 0.55 1.30
Wealth Index Poorest REF Poorer 1.80 <0.012 1.14 2.85
Middle 2.85 <0.000 1.66 4.88 Richer 3.34 <0.000 1.85 6.03 Richest 2.49 0.017 1.18 5.25
Household Head Male REF Female 1.88 0.048 1.01 3.52
Mother's Education No Education Primary 1.74 0.042 1.02 2.98
Secondary 3.96 <0.000 1.90 8.25 Higher 5.69 0.035 1.13 28.71
Sex of Child Male REF
Female 0.77 <0.12 0.55 1.07 Birth Order of Child (continuous) 0.95 <0.15 0.89 1.02

100
Table 15: Describing the adjusted odds ratio of reduced model for contextual and individual level variables of population associated with the receipt of first dose of DTP vaccine in children aged 12 to 23months old using logistic regression analysis, Pakistan Demographic and Health Survey 2006
Odds Ratio
p-Value 95% Confidence
Province
Lower limit Upper
limit Punjab REF
Sindh 0.65
0.06 0.41 1.01 KP 0.65
0.08 0.40 1.05
Balochistan 0.61
0.07 0.36 1.04 Place of Residence
Urban Rural 0.81
0.34 0.53 1.24
Wealth Index Poorest
Poorer 1.78
0.02 1.12 2.84 Middle 2.87
0.00 1.68 4.91
Rich 3.41
0.00 1.89 6.17 Richest 2.59
0.01 1.21 5.54
Household Head Male REF
Female 1.82
0.06 0.98 3.38 Mother's Education
No Education Primary 1.85
0.03 1.08 3.19
Secondary 4.12
0.00 2.00 8.48 Higher 6.19
0.03 1.22 31.44

101
Table 16 Describing the adjusted odds ratio of final model for contextual and individual level variables of population associated with the receipt of first dose of DTP vaccine in children aged 12 to 23months old using logistic regression analysis, Pakistan Demographic and Health Survey 2006
Odds Ratio
p-Value 95% Confidence Wealth Index
Poorest REF Poorer 1.86
0.01 1.20 2.90 Middle 3.22
0.00 1.92 5.40
Richer 3.94
0.00 2.28 6.80 Richest 2.96
0.00 1.49 5.89
Household Head Gender Male REF Female 1.89
0.05 1.01 3.55
Mother's Education
No Education REF Primary 1.96
0.02 1.14 3.37 Secondary 4.46
0.00 2.16 9.24
Higher 6.58
0.02 1.28 33.85

102
Table 17: Adjusted odds ratios for initiation of immunization among children 12 to 23 months of age, using logistic regression analysis in the Pakistan Demographic and Health Survey 1990
Odds Ratio P>t 95% confidence interval for
OR Maternal Education
No Education REF Primary Education 2.77 0.00 1.50 5.13
Secondary and Higher 1.78 0.17 0.78 4.05 Province of Residence
Punjab REF Sindh 0.45 0.00 0.30 0.66
Khyber Pakhtoonkhwa 0.87 0.54 0.56 1.35 Balochistan 0.38 0.01 0.20 0.74
Wealth Quintiles Poorest REF
Poor 2.00 0.03 1.05 3.80 Middle 2.11 0.03 1.09 4.10 Rich 3.09 0.00 1.63 5.86 Richest 10.55 0.00 5.17 21.51

103
Specific aim 2 Assess individual and contextual determinants of vaccination completion, defined as receiving
DTP3 vaccine, among children 12-23 months of age in 1990 and 2006 in Pakistan.
Vaccination completion
Descriptive analysis
PDHS 2006
Sample characteristics: Among children who completed the DTP1 vaccine (the sample for the
Specific Aim 2 analysis), 61.57% were from Punjab, 22% and 13.21% from Sindh and KPT and
3.22% of the sample was from Balochistan; this distribution is representative of the population
distribution in the country. This distribution of the proportions is reflective of the percentage
distribution for the overall sample. The sample distributions for place of residence, household
wealth quintiles and maternal and child characteristics are also representative of the population
(Table 18).
Sample characteristics for children who did and did not complete the vaccine schedule: The
percentage of children who completed the DTP3 schedule in the sample is the lowest in the
province of Sindh at 71.44% and the highest percentage of children who completed the
vaccination schedule was observed in the province of Punjab at 80.77% (see Table 19). It is also
observed that once the children initiate the vaccination schedule the completion rates are very
similar among provinces. The percentage of children who completed the DTP 3 vaccine in the
provinces of Baluchistan and KPT was at 77.77% and 83.49% respectively. Among children who
were never issued a health/immunization card, half (55.46 %) never completed the DTP3 vaccine
and among those for whom a card was seen at the time of the interview 90.74% had completed
the DTP vaccine schedule. The children in the poorest wealth quintile still fared worst, as 31.66%
never completed the DTP vaccine schedule. Among mothers with no education 27.18% never
completed the DTP3 schedule for their children. Among the age groups of mothers with the

104
highest numbers of observations in our sample, the results for the 20-39 year old mothers were
very similar. Children in households headed by female and male members had similar vaccination
completion rates at 80.68% and 78.82%. A similar result was seen in the vaccination completion
rates for male and female children which were similar at 80.1% and 77.58% (Table 19).
PDHS 1990
Sample characteristics: Among children 12-23 months of age who had initiated the DTP
vaccination schedule 65.98% completed it. The sample distributions according to the province of
residence, place of residence, household characteristics and maternal and child characteristics are
relatively representative of what has been observed for the total 1990 sample (Table 20).
Sample characteristics for children who did and did not complete the vaccine schedule:
The highest percentage of dropouts was seen in the province of Sindh, as 40% of the children did
not receive the DTP3 vaccine. In the 1990-91 sample, the DTP completion rate was similar
between the provinces of Punjab and Baluchistan at 66.08% and 62.68%. One of the explanations
for this can be that in 1990 a majority of the sample in Balochistan was selected from urban areas
and remote districts were not included in the sampling frame. The observations from Baluchistan
were mostly from urban areas where access is not an issue. The percentage of children who did
not receive DTP3 vaccine in the province of KPT was 25.72%. Among children who were never
issued a health/immunization card only 33.31% completed the schedule, but due to a very small
number of observations, 5 in total, we cannot make a reliable estimate. Among children for whom
a card was seen at the time of the interview 84.64% had completed the DTP vaccine schedule.
The distributions of children in the five wealth quintiles were comparable, suggesting that once
parents initiate the immunization schedule they are more likely to continue and complete it.
Children belonging to the youngest mothers had the lowest completion of DTP3 but the
proportion of children completing the schedule was similar for the all other age categories. In

105
1990-91, households headed by a female had a higher proportion of children completing the
schedule at 86.35 compared to those headed by a male at 64.98% (Table 21).
Unadjusted analysis: vaccination completion
PDHS 2006
The binary outcome variable for vaccination completion was coded as 0 for children who “did not
receive DTP3” vaccine and as 1 for children who “received DTP3” vaccine. Binary logistic
regression analysis was run separately for each of the individual and contextual level predictor
variables against the outcome.
Among the contextual level variables, province of residence was statistically significant only for
the province of Sindh (OR 0.60; 95% CI 0.40—0.88) with Punjab as the reference. The odds of a
child completing the third dose of DTP vaccine in Baluchistan (OR 0.83; 95% CI 0.41—1.68)
and Khyber Pakhtunkhwa (OR 1.20; 95% CI 0.71—2.04) were not much different than children
in the province of Punjab and the results were also statistically insignificant. Children in the rural
areas compared to children in urban areas were less likely to complete DTP 3 vaccinations (OR
0.70; 95% CI 0.47—1.06) but the results were not statistically significant, suggesting that this is
not a significant determinant in Pakistan (Table 22).
Completing the DTP3 vaccine dose and having a health card was statistically significant for all
categories of the variable. With reference to children having “no card,” children who had a card
and it was seen at the time of the interview were 12 times more likely to complete the DTP3
vaccine (OR 12.20; 95% CI 5.41—27.52); children who had a card but the mothers were unable
to show it at the time of the interview were 4 times (OR 4.53; 95% CI 2.29—8.97) as likely to
complete DTP3. Even children who no longer had the card were 3 times as likely as children with
no card (OR 3.40; 95% CI 1.51—7.66) to complete the DTP3 vaccination (Table 22).

106
Logistic regression results for household wealth was statistically significant only for households
in the higher two quintiles of wealth for the “rich” (OR 2.57; 95% CI 1.36—4.86) and “richest”
(OR 3.57; 95% CI 1.93—6.59). Compared to children in the poorest wealth quintile, children in
the poor (OR 1.08; 95% CI 0.61—1.91) and middle (OR 1.71; 95% CI 0.96—3.05) quintiles did
not fare very differently (Table 22).
Maternal education was a significant predictor of DTP3 vaccination completion only for children
with mothers who had education above primary level: for mothers with secondary education the
odds were 3 times (OR 3.32; 95% CI 1.78—6.22) and for mothers with higher education the odds
were four times higher (OR 4.67; 95% CI 2.70—8.08). The logistic regression results for mothers
with up to primary education (OR 1.43; 95% CI 0.84—2.45) compared to mothers with no
education were not statistically significant. Other individual level variables like sex of household
head, mother’s age, sex of the child, age of child and birth order of the child were not statistically
significant (Table 22). Age of child (in months) and birth order of the child were coded as
continuous variables.
PDHS 1990
We looked at the factors that are associated with vaccination schedule completion in the same
way as we did for PDHS 2006 (see Table 23). Among the contextual variables, overall province
of residence was not statistically associated with vaccination completion. However, for a child
who resided in the province of Sindh, the odds of completion of the vaccination schedule were
lower compared to being a resident of the province of Punjab (OR: 0.6; 95% CI 0.37 – 0.96).
There was no statistical difference for residence in Khyber Pakhtunkhwa (OR: 1.34; 95% CI 0.65
– 2.73) or Baluchistan (OR: 0.92; 95% CI 0.18 – 4.68) for vaccination schedule completion
compared to the province of Punjab. Children in rural areas had higher odds of completing the
vaccination schedule compared to children in urban areas, although the association was not
statistically significant (OR: 1.37; 95% CI 0.75 – 2.49). The only other contextual level variable

107
significantly associated with vaccination completion was having a health/immunization card that
was seen at the time of the interview.
A similar increasing trend for the wealth index being a predictor of vaccination schedule
completion was found, wherein those in the higher income quintile had higher odds of completing
the vaccination schedule compared to the poorest wealth quintile, although the associations were
not statistically significant (Poor=OR: 0.70; 95% CI 0.30 – 1.62, Middle=OR: 1.05; 95% CI 0.47
– 2.35, Rich=OR: 2.03; 95% CI 0.93 – 4.46, Richest= OR: 2.34; 95% CI 0.98 – 5.56). Although
statistically insignificant, sex of the household head was associated with vaccination schedule
completion. The children from households headed by women were more likely to complete the
vaccination schedule compared to the children from households headed by a male (OR=3.11;
95% CI 0.8 – 12.0). Educational level of the mother was assessed as well for its association with
vaccination schedule completion. We did not find any statistically significant association of
mother’s education with vaccination schedule completion (Primary= OR: 0.82; 95% CI 0.44 –
1.53, secondary=OR: 1.12; 95% CI 0.62 – 2.02, Higher than secondary=OR: 0.76; 95% CI 0.11 –
5.41). Being a female child did not have a statistically significant association with vaccination
schedule completion compared to being a male child (OR=0.84; 95% CI 0.55 – 1.29). Similarly
birth order of the child also did not have an association with completion of the vaccination
schedule of the child (OR=1.12; 95% CI 0.99 – 1.26) (Table 23).
The number of women with education higher than secondary was very small so we merged the
two categories secondary and higher to see if there was a change in the association. Again there
was not a wide difference in the vaccination completion rates between children belonging to
mothers with no education compared to children whose mothers had up to primary education (OR
0.83; 95% CI 0.46—1.50) and the children belonging to mothers with secondary and higher
education (OR 1.36; 95% CI 0.84—2.20), but the results for both the groups was statistically
insignificant. Children belonging to older mothers, 25-35 years, (OR 1.95; 95% CI 1.16—3.29)

108
and above 35 year of age (OR 3.01; 95% CI 1.51—6.00) had higher odds of completing the
vaccination schedule compared to children belonging to mothers less than 25 year of age and the
results for both the groups were statistically significant. Among the individual level variables, sex
of child and birth order of the child was not statistically significant (Table 23).
Adjusted analysis: Vaccination completion
PDHS 2006
In the full binary logistic regression model, only having a vaccination card was statistically
significant among the contextual level characteristics. Children having an immunization card
(confirmed by data collectors) had more than ten times higher odds of vaccination schedule
completion compared to those without a card. Children who had a card but the mothers were not
able to show it at the time of the interview and gave a verbal history of vaccination were
approximately four times more likely to complete the vaccination schedule of their children
compared to those who were not issued an immunization card (“yes, seen” OR 10.6; 95% CI
4.62—24.39, “yes, card not seen” OR 3.88; 95% CI 1.94 - 7.74 and “no longer has card” OR
3.14; 95% CI 1.36 – 7.23). Among the individual level characteristics only mothers’ education
was statistically significant in the full model. For mothers with secondary education, the odds of
their children completing the DPT3 vaccination were two times higher and for mothers with
higher than secondary education the odds of their children completing the DPT3 vaccination were
almost four times higher compared to mothers with no education (“Secondary” OR 2.74; 95% CI
1.51 – 4.97 and “Higher” OR 3.7; 95% CI 2.07 – 6.59). In the final model the only two
statistically significant variables were mother’s education and child having a health card. After
recoding into a categorical variable, mothers’ age also had a significant effect on vaccination
completion. With ten years increase in maternal age, the likelihood of immunization completion
increased by forty percent (Table 24).

109
PDHS 1990
In the adjusted model all the contextual and individual level variables were included for analysis
in the full model and none of them were statistically significant. In the second model the five
categories of household wealth were re-coded into two. The first category included households in
the poorest, poor and middle quintile and the second category included households in the rich and
richest quintile. The individual level variable mothers age was also recoded into three categories
of less than 25, 25-<35 and greater than or equal to 35 years of age. The sex of the household
head and sex of child were also included in the second model. Households in the rich or richest
wealth quintiles had higher odds of vaccination completion compared to middle or lower wealth
quintiles (OR 1.82; 95% CI: 1.24 – 2.68). Sex of head of the household had no effect on
vaccination completion of the child whereas mothers’ age was statistically significantly
associated with vaccination completion. Mothers in the age category of 25 to less than 35 were
more likely to have their child’s vaccination completed compared to those younger than 25 years
of age (OR: 1.9; 95% CI: 1.13 – 3.19). Mothers’ who were 35 years or older were also more
likely to complete the vaccination schedule of their child compared to those mothers who were
twenty-five years of age or younger (OR: 3.3; 95% CI: 1.63 – 6.66) (Table 25).
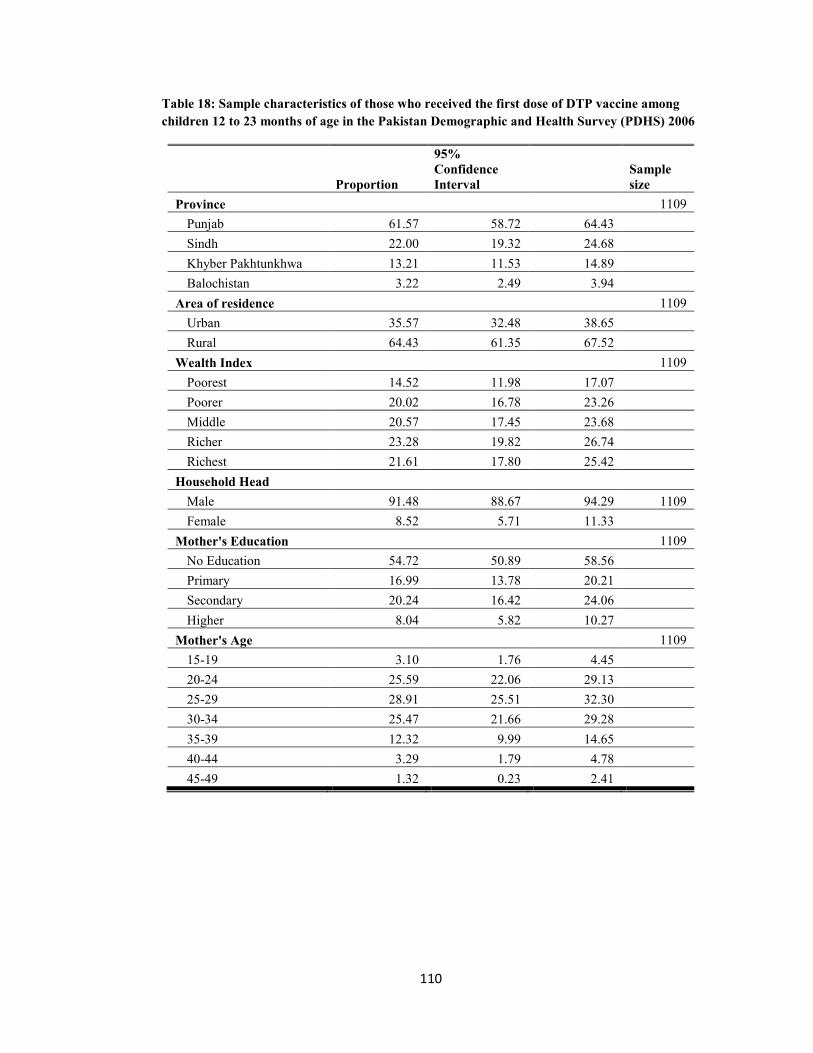
110
Table 18: Sample characteristics of those who received the first dose of DTP vaccine among children 12 to 23 months of age in the Pakistan Demographic and Health Survey (PDHS) 2006
Proportion
95% Confidence Interval
Sample size
Province
1109 Punjab 61.57 58.72 64.43
Sindh 22.00 19.32 24.68 Khyber Pakhtunkhwa 13.21 11.53 14.89 Balochistan 3.22 2.49 3.94 Area of residence
1109
Urban 35.57 32.48 38.65 Rural 64.43 61.35 67.52 Wealth Index
1109
Poorest 14.52 11.98 17.07 Poorer 20.02 16.78 23.26 Middle 20.57 17.45 23.68 Richer 23.28 19.82 26.74 Richest 21.61 17.80 25.42 Household Head
Male 91.48 88.67 94.29 1109 Female 8.52 5.71 11.33
Mother's Education
1109 No Education 54.72 50.89 58.56
Primary 16.99 13.78 20.21 Secondary 20.24 16.42 24.06 Higher 8.04 5.82 10.27 Mother's Age
1109
15-19 3.10 1.76 4.45 20-24 25.59 22.06 29.13 25-29 28.91 25.51 32.30 30-34 25.47 21.66 29.28 35-39 12.32 9.99 14.65 40-44 3.29 1.79 4.78 45-49 1.32 0.23 2.41

111
Table 18 (continued): Sample characteristics of those who received the first dose of DTP vaccine among children 12 to 23 months of age in the Pakistan Demographic and Health Survey (PDHS) 2006
Proportion 95% Confidence Interval
Sample size
Sex of Child
1109 Male 55.38 51.33 59.43
Female 44.62 40.57 48.67 Health Card
1109
No card 7.70 5.64 9.77 Yes, seen 31.08 26.83 35.33 Yes, not seen 46.94 42.46 51.42 No longer has card 14.28 11.49 17.07

112
Table 19: Characteristics of children who received and did not receive the third dose of DTP vaccine among children 12 to 23 months of age who received the first dose of DTP vaccine in the Pakistan Demographic and Health Survey (PDHS) 2006
Did not Receive DTP3
Received DTP3 Total
Sample size p-value
Freq. (%) Freq. (%) Freq
Province
1104 0.0392 Punjab 94 (19.23) 410 (80.77) 504
Sindh 84 (28.56) 208 (71.44) 292 Khyber Pakhtunkhwa 36 (16.51) 182 (83.49) 218 Balochistan 18 (22.23) 72 (77.77) 90 Area of residence
1109 0.0713
Urban 82 (17.4) 367 (82.6) Rural 150 (23.01) 505 (76.99) Wealth Index
1104 0.0001
Poorest 51 (31.66) 117 (68.34) 168 Poorer 63 (30.02) 157 (69.98) 220 Middle 46 (21.33) 186 (78.67) 232 Richer 41 (15.28) 207 (84.72) 248 Richest 31 (11.49) 205 (88.51) 236 Household Head
1104 0.7365
Male 217 (21.18) 807 (78.82) 1024 Female 15 (19.32) 65 (80.68) 80 Mother's Education
1104 0
No education 162 (27.18) 461 (72.82) Primary 37 (20.66) 142 (79.32) Secondary 23 (10.1) 190 (89.9) Higher 10 (7.4) 79 (92.6) Mother's Age
1104 0.4511
15-19 8 (26.73) 32 (73.27) 40 20-24 71 (26.59) 216 (73.41) 287 25-29 64 (18.78) 266 (81.22) 330 30-34 53 (19.49) 204 (80.51) 257 35-39 25 (16.18) 117 (83.82) 142 40-44 9 (24.65) 23 (75.35) 32 45-49 2 (13.09) 14 (86.91) 16

113
Table 19 (contd.): Characteristics of children who received and did not receive the third dose of DTP vaccine among children 12 to 23 months of age who received the first dose of DTP vaccine in the Pakistan Demographic and Health Survey (PDHS) 2006
Did not Receive DTP3
Received DTP3 Total
Sample size p-value
Freq. (%) Freq. (%) Freq
Sex of Child
1104 <0.4426 Male 130 (19.9) 483 (80.1)
Female 102 (22.42) 389 (77.58) Health Card
1109 <0.000
No card 47 (55.46) 37 (44.54) 84 Yes, seen 36 (9.26) 315 (90.74) 351 Yes, not seen 110 (21.57) 403 (78.43) 513 No longer has card 39 (26.79) 117 (73.21) 156 Children <5 years in the household
Mean number of children
2.56

114
Table 20: Characteristics of children 12 to 23 months age who received the Third Dose of DTP vaccine in the Pakistan Demographic and Health Survey (PDHS) 1990
Proportion 95% Confidence Interval Received DTP3
No 34.02 28.78 39.25 Yes 65.98 60.75 71.22
Area of residence Urban 39.56 35.30 43.82
Rural 60.44 56.18 64.70 Household Head
Male 95.29 92.98 97.59 Female 4.71 2.41 7.02
Province Punjab 67.51 63.55 71.47
Sindh 17.65 14.55 20.75 Khyber Pakhtunkhwa 12.75 10.35 15.14 Balochistan 2.09 1.06 3.13
Wealth Index Poorest 9.89 5.90 13.90
Poor 21.45 14.50 28.40 Middle 17.55 13.70 21.40 Rich 23.51 17.40 29.70 Richest 27.59 22.80 32.30
Mother's Education No Education 68.24 63.22 73.27
Primary 14.08 10.70 17.46 Secondary 16.25 12.82 19.67 Higher 14.3 0.41 2.45
Mother's Age 15-19 4.05 2.11 5.99
20-24 21.37 17.59 25.15 25-29 33.45 27.38 39.52 30-34 20.08 15.54 24.62 35-39 13.8 9.95 17.65 40-44 5.85 3.18 8.51 45-49 1.4 0.12 2.69

115
Table 20 (continued): Characteristics of children 12 to 23 months age who received the Third Dose of DTP vaccine in the Pakistan Demographic and Health Survey (PDHS) 1990
Proportion 95% Confidence Interval Sex of Child
Male 50.11 0.03 44.97 55.26 Female 49.88 0.03 44.74 55.03
Health Card No card 37.66 0.01 1.02 6.52
Yes, seen 42.31 0.03 36.32 48.30 Yes, not seen 49.48 0.03 43.27 55.68 No longer has card 4.45 0.01 2.43 6.47
Number of children < 5 years in the household (mean) 2.24 0.06 2.11 2.36

116
Table 21: Characteristics of children who received and did not receive the third dose of DTP vaccine among children 12 to 23 months of age who received the first dose of DTP vaccine in the Pakistan Demographic and Health Survey (PDHS) 1990
Did not Receive DTP3 Received DTP3 Total
Freq. (%) Freq. (%) Freq
Province Punjab 100 (33.92) 220 (66.08) 320
Sindh 73 (40.02) 103 (59.98) 176 Khyber Pakhtunkhwa 51 (25.72) 152 (74.28) 203 Balochistan 23 (37.32) 48 (62.68) 71
Area of residence Urban 141 (35.5) 319 (68.24) 460
Rural 106 (34.02) 204 (64.5) 310 Wealth Index
Poorest 21 (37.29) 24 (62.71) 45 Poor 38 (45.04) 58 (54.96) 96 Middle 57 (36.62) 89 (63.38) 146 Rich 59 (26.86) 143 (73.14) 202 Richest 72 (28.72) 209 (71.28) 281
Household Head Male 241 (35.02) 493 (64.98) 734
Female 6 (13.65) 30 (86.35) 36 Mother's Education
No education 172 (34.57) 336 (65.43) 508 Primary 33 (38.82) 70 (61.18) 103 Secondary 39 (37.64) 108 (72.84) 147 Higher 3 (34.02) 9 (62.36) 12
Mother's Age 15-19 13 (53.47) 18 (46.53) 31
20-24 68 (46.47) 112 (53.53) 180 25-29 81 (33.11) 175 (66.89) 256 30-34 50 (29.33) 109 (70.67) 159 35-39 20 (19.06) 75 (80.94) 95 40-44 10 (31.26) 27 (68.74) 37 45-49 5 (30.2) 7 (69.8) 12

117
Table 21 (contd.): Characteristics of children who received and did not receive the third dose of DTP vaccine among children 12 to 23 months of age who received the first dose of DTP vaccine in the Pakistan Demographic and Health Survey (PDHS) 1990
Did not Receive DTP3 Received DTP3 Total
Sex of Child Male 112 (32.78) 271 (67.22) 383
Female 135 (35.26) 252 (64.74) 387 Health Card
No card 13 (66.69) 5 (33.31) 18 Yes, seen 45 (15.36) 304 (84.64) 349 Yes, not seen 164 (45.96) 199 (54.04) 363 No longer has card 25 (69.86) 14 (30.14) 39
Number of children< 5 years in the household (mean) 2.18 2.27

118
Table 22: Unadjusted odds ratios using logistic regression analysis for individual and contextual characteristics associated with receipt of the third dose of DTP vaccine among children aged 12 to 23 months who received the first dose of DTP vaccine, Pakistan Demographic and Health Survey 2006
Odds Ratio p-value 95% CI for OR Province
Punjab REF. Sindh 0.60 0.01 0.40 0.88
Khyber Pakhtunkhwa 1.20 0.49 0.71 2.04 Balochistan 0.83 0.61 0.41 1.68
Area of residence Urban REF.
Rural 0.70 0.09 0.47 1.06 Wealth Index
Poorest REF. Poorer 1.08 0.79 0.61 1.91
Middle 1.71 0.07 0.96 3.05 Rich 2.57 0.00 1.36 4.86 Richest 3.57 0.00 1.93 6.59
Household Head Male REF.
Female 1.12 0.74 0.57 2.20 Mother's Education
No education REF. Primary 1.43 0.19 0.84 2.45
Secondary 3.32 0.00 1.78 6.22 Higher 4.67 0.00 2.70 8.08
Mother's Age 15-19 REF.
20-24 1.01 0.99 0.29 3.54 25-29 1.58 0.49 0.43 5 30-34 1.51 0.56 0.38 5.93 35-39 1.89 0.33 0.52 6.87 40-44 1.12 0.89 0.23 5.39 45-49 2.42 0.51 0.17 34.50
Mean Age of Mother (years) 1.03 0.11 0.99 1.07

119
Table 22 (contd.): Unadjusted odds ratios using logistic regression analysis for individual and contextual characteristics associated with receipt of the third dose of DTP vaccine among children aged 12 to 23 months who received the first dose of DTP vaccine, Pakistan Demographic and Health Survey 2006
Odds Ratio P<|t| 95% CI for OR
Sex of Child Male REF.
Female 0.86 0.44 0.58 1.27 Health Card
No card REF. Yes, seen 12.20 0.00 5.41 27.52
Yes, not seen 4.53 0.00 2.29 8.97 No longer has card 3.40 0.00 1.51 7.66
Number of Children <5 years in the Household 1.11 0.14 0.97 1.28 Birth order of child 0.97 0.39 0.89 1.04

120
Table 23: Unadjusted odds ratios using logistic regression analysis for individual and contextual characteristics associated with receipt of the third dose of DTP vaccine among children aged 12 to 23 months who received the first dose of DTP vaccine, Pakistan Demographic and Health Survey 1990
Odds Ratio p-value 95% confidence interval Province of residence
Punjab REF - - - Sindh 0.60 0.03 0.37 0.96 Khyber Pukhtunkhwa 1.34 0.43 0.65 2.73 Balochistan 0.92 0.92 0.18 4.68
Area Of residence
- - - Urban REF
Rural 1.37 0.30 0.75 2.49 Wealth Index
Poorest REF - - - Poor 0.70 0.40 0.30 1.62 Middle 1.05 0.90 0.47 2.35 Rich 2.03 0.08 0.93 4.46 Richest 2.34 0.06 0.98 5.56
Sex of Household Head Male
- - - Female 3.11 0.10 0.80 12.00
Highest Education level No Education
- - - Primary 0.82 0.53 0.44 1.53 Secondary 1.12 0.71 0.62 2.02 Higher than secondary 0.76 0.78 0.11 5.41
Sex of Child Male
- - -
Female 0.84 0.43 0.55 1.29 Birth Order 1.12 0.08 0.99 1.26

121
Table 23 (contd.) Unadjusted odds ratios using logistic regression analysis for individual and contextual characteristics associated with receipt of the third dose of DTP vaccine among children aged 12 to 23 months who received the first dose of DTP vaccine, Pakistan Demographic and Health Survey 1990
Odds Ratio
p-value 95% CI
Mother's Education (merged) No education REF
Primary 0.83
0.538 0.46 - 1.50 Secondary and Higher 1.36
0.205 0.84 - 2.20
Mother's Age 15-19 REF
20-24 1.32
0.65 0.6 – 3.1 25-29 2.32
1.77 0.9 – 6.0
30-34 2.77
1.98 1.0 – 7.7 35-39 4.88
2.59 1.5 – 16.4
40-44 2.53
1.59 0.8 – 8.0 45-49 2.66
0.92 0.3 – 21.6
Age categories <25 REF
25-<35 1.95
0.012 1.16 - 3.29 >35 3.01
0.002 1.51 - 6.00
Sex of Child Male REF
Female 0.9
0.617 0.58 - 1.39 Health Card
No card Yes, seen 11.03
3.3 2.7 – 45.6
Yes, not seen 2.35
1.1 0.5 – 11.8 No longer has card 0.86
-0.2 0.1 – 5.1
Number of Children <5 years in the Household 1.07
0.439 0.90 - 1.27

122
Table 24: Adjusted odds ratios using logistic regression analysis for individual and contextual characteristics associated with receipt of the third dose of DTP vaccine among children aged 12 to 23 months who received the first dose of DTP vaccine, Pakistan Demographic and Health Survey 2006
Predictors Odds Ratio p-value
95% Confidence Interval
Mother's Education
No Education/primary REF
Secondary 2.74 0.00 1.51 4.97
Higher 3.70 0.00 2.07 6.59
Mother's Age 1.04 0.02 1.01 1.08
Child's Immunization card
No Card REF
Yes, seen 10.62 0.00 4.62 24.39
Yes, not seen 3.88 0.00 1.94 7.74
No longer have card 3.14 0.01 1.36 7.23

123
Table 25: Adjusted odds ratios using logistic regression analysis for individual and contextual characteristics associated with receipt of the third dose of DTP vaccine among children aged 12 to 23 months who received the first dose of DTP vaccine, Pakistan Demographic and Health Survey 1990
Odds Ratio P-value Lower CI Upper CI Wealth Index
Middle or lower REF - - - Rich or Richest 1.82 0.00 1.24 2.68
Sex Of Household Head Male REF - - -
Female 3.26 0.09 0.85 12.50 Mothers’ Age
Less than 25 years REF - - - 25 - < 35 1.90 0.02 1.13 3.19 >= 35 3.30 0.00 1.63 6.66

124
Specific aim 3 Assess individual and contextual determinants of Up To Date (UTD) immunization status, among
children 52 weeks of age in the 2006-07 PDHS.
Descriptive analysis
A total of 775 children 52 weeks of age were included in the sample after application of the
selection criteria for UTD immunization to the 2006 PDHS (see Table 26). More than half of the
children in our sample (69.16%) had received BCG vaccine and 64.13 % of the children had
received DTP1 vaccine. At 10 weeks of age only half of the children (56%) had received the
second dose of DTP2 vaccine and this went down even further for DTP3 to 46.97% by 14 weeks
of life. The decline in the proportion of children receiving oral polio vaccine 1-3 was similar to
DTP vaccine and was at 82.06 %, 78.97% and 71.48% respectively. The proportion of children
who had received Measles vaccine was half that for BCG vaccine and only 37.68% of our sample
had received the vaccine by 52 weeks of life (Table 27).
The UTD immunization status of children up to 52 weeks of age who lived in urban and rural
areas was not markedly different; the proportion of infants UTD in urban areas was at 36.9% and
in rural areas it was 28%. Similarly the UTD immunization status of the proportion of children in
the four provinces of Punjab, Sindh, Khyber Pakhtumkhwa and Balochistan are comparable at
34%, 22.4%, 32.3% and 33.4% respectively. This pattern highlights the fact that the families of
children who initiate the immunization schedule at the recommended age also complete it
regardless of the province of residence (Table 27).
The UTD immunization status of children belonging to the poorest households was alarmingly
low at 11% and children belonging to poorer households were at 26.3%. Contrary to the previous
observations, the UTD immunization status of the children belonging to households in the middle
and rich wealth quintiles was similar at 37.4% and 39.5% respectively. The highest proportion of
children who were UTD for their immunizations was from the richest households, which is in
125
keeping with what is observed globally. However, what is alarming is that even among this
subgroup, less than half the children (42.3%) were UTD for their immunizations (Table 27).
UTD immunization status was 25.4% among the children who belonged to mothers with no
education and 37% among mothers with up to primary education. It was surprising to note that
among children belonging to mothers with secondary education, only 38.2% were UTD which
was similar to the children of mothers with up to primary education. The UTD immunization
status of children belonging to mothers with higher education was higher at 55%, but still this is
very low when compared to WHO requirements. The proportion of boys UTD for immunization
was higher at 32.8% compared to girls at 28.4% but the difference is not marked (Table 27).
Unadjusted analysis: Up to Date vaccination
For children living in rural areas the odds (OR 0.67; 95% CI 0.38—1.16) of being UTD were
lower compared to children in urban areas but the results were not statistically significant. The
odds of being UTD for children in the provinces of Sindh (OR 0.56; 95% CI 0.33—0.95), Khyber
Pakhtunkhwa (OR 0.93; 0.51—1.67) and Balochistan (OR 0.97; 95% CI 0.53—1.79) were lower
compared to children in the province of Punjab but the results were only significant for the Sindh
province (Table 28).
The most highly significant predictor of children being UTD for immunization was having an
immunization card. Children for whom the immunization card was seen at the time of the
interview had odds of being UTD that were 26 times (OR 26.18; 95% CI 6.33—108.16) higher
than children who never had an immunization card. Similarly for children who had a card but it
was not seen at the time of interview the odds were 15 times (OR 15.82; 95% CI 3.79 – 66.13)
higher and for children who no longer had the card the odds were 9 times (OR 9.32; 95% CI 1.98
– 43.90) higher compared to children with no card (children who were never issued an
immunization card) (Table 28).

126
Children in the richest wealth quintile had 6 times (OR 5.9; 95% CI 2.23-15.57) and children in
the richer quintile had 5 times (OR 5.26; 95% CI 2.12—13.07) higher odds to be UTD compared
to children in the poorest wealth quintile. Children in the middle quintile (OR 4.81; 95% CI
1.81—12.79) and poorer quintile (OR 2.87; 95% CI 1.19—6.91) also had higher odds compared
to poorest children to be UTD (Table 28).
Among individual level factors associated with UTD, maternal education was statistically
significant for children whose mothers had secondary education (OR 1.81; 95% CI 1.05—3.11)
and higher education (OR 3.55; 95% CI 1.52—8.29) compared to children whose mothers had no
education. Sex of the household head, sex of child, number of children less than five years of age
in the household and maternal age were associated at a statistically insignificant level with UTD
status (Table 28).
Adjusted analysis: Up To Date vaccination
The logistic regression model to assess the association of individual and contextual level
variables with UTD immunization was run adjusting for household wealth, maternal education,
having a health/immunization card, province of residence and place of residence (urban/rural).
The only statistically significant predictor was child having a health/immunization card. The
children for whom the card was seen at the time of the interview had 21.63 (OR 21.63; 95% CI
4.92 –94.94) times higher odds to be UTD compared to children who were never issued a health
card. We observed that removing the card from the model resulted in a change for the Odds
ratios, 95% CI and significance of reminder of variables associated with UTD status of children.
Running the model without the card the only statistically significant variables associated with
UTD immunization status of the children were household wealth (Ref category: Poorest, Poorer
OR 2.8; 95% CI 1.2—6.9, Middle OR 4.7; 95%CI 1.8—12.7, Richer OR 5.3; 95%CI 2.1—13.2,
Richest OR 5.5; 95%CI 2.0—14.8) and number of children under-five years of age in the
household (continuous variable, OR 0.5; 95%CI 0.3—0.9). (Table 29) The reduced model

127
including the card was run adjusting for household wealth, maternal education and number of
children under-five years of age in the household and still the only significant determinant was
child having a health/immunization card (Ref. No Card, Yes, Card seen OR 21.2; 95%CI 4.9—
91.8, Yes not seen OR 13.2; 95% CI 3.1—56.9, No longer have card OR 8.0; 95% CI 1.6—39.6)
(Table 29)

128
Table 26 UTD immunization status for individual vaccines among children 36-52 weeks of age, 2006 PDHS
Vaccine Dose (recommended age) Up To Date (UTD)
No
Frequency (%)
Yes
Frequency (%) Missing
BCG (At birth) 160 (20.65) 536 (69.16) 79 (10.19)
Oral Polio Vaccine 1
(6 weeks of age) 67 (8.65) 636 (82.06) 72 (9.29)
DTP 1
(6 weeks of age) 190 (24.52) 497 (64.13) 88 (11.35)
Oral Polio Vaccine 2
(10 weeks of age) 91 (11.74) 612 (78.97) 72 (9.29)
DTP2
(10 weeks of age) 252 (32.52) 434 (56) 89 (11.48)
Oral Polio Vaccine 3
(14 weeks of age) 221 (28.52) 554 (71.48) N/A
DTP 3
(14 weeks of age) 322 (41.55) 364 (46.97) 89 (11.48)
Measles
(36 weeks of age) 411 (53.03) 292 (37.68) 72 (9.29)
Up to Date
(52 weeks) 554 (70.19) 231 (29.81) N/A
Sample size 775

129
Table 27 Characteristics of children 36-52 weeks of age and UTD immunization status, 2006, Pakistan DHS
No Yes
Frequency % Frequency %
Wealth Quintile
Poorest 141 89 21 11
Poorer 131 73.7 44 26.3
Middle 95 62.6 50 37.4
Richer 98 60.5 57 39.5
Richest 79 57.7 59 42.3
Place of residence
Urban 179 63.1 97 36.9
Rural 365 72 134 28
Province of residence
Punjab 218 66 107 34
Sindh 183 77.6 58 22.4
Khyber Pakhtunkhwa 101 67.7 50 32.3
Balochistan 42 66.6 16 33.4
Sex of the Household Head
Male 510 69.8 209 30.2
Female 34 62.9 22 37.1
Maternal Education
No education 388 74.6 126 25.4
Primary 70 63.1 43 37
Secondary 63 61.9 38 38.2
Higher 23 0.45 24 0.55

130
Table 27 (continued) Characteristics of children 36-52 weeks of age and UTD immunization status, 2006, Pakistan DHS
No Yes
Frequency % Frequency %
Mothers' age
15-19 24 75.1 8 24.9
20-24 152 73.5 52 26.6
25-29 177 69.3 77 30.8
30-34 109 70.4 50 31.6
35-39 55 65.5 29 34.5
40-44 16 50 12 50.1
45-49 11 74.3 3 25.7
Sex of the Child
Male 295 67.2 126 32.8
Female 249 71.6 105 28.4
Less than 5 years old children mean (SE) 2.27 (0.08) 2.4 (0.097)
Sample size 775

131
Table 28: Unadjusted analysis using logistic regression of individual and contextual factors associated with Up To Date Immunization among children 36-52 weeks of age in Pakistan (PDHS 2006)
Odds Ratio p-value 95% Confidence Interval for OR
Wealth Quintile
Poorest REF
Poorer 2.87 0.02 1.19 6.91
Middle 4.81 0.00 1.81 12.79
Richer 5.26 0.00 2.12 13.07
Richest 5.90 0.00 2.23 15.57
Place of residence
Urban REF
Rural 0.67 0.15 0.38 1.16
Province of residence
Punjab REF
Sindh 0.56 0.03 0.33 0.95
KPT 0.93 0.80 0.51 1.67
Balochistan 0.97 0.93 0.53 1.79
Sex of the Household Head
Male REF
Female 1.36 0.46 0.60 3.11
Maternal Education
No education REF
Primary 1.72 0.11 0.89 3.33
Secondary 1.81 0.03 1.05 3.11
Higher 3.55 0.00 1.52 8.29

132
Table 28 (continued): Unadjusted analysis using logistic regression of individual and contextual factors associated with Up To Date Immunization among children 36-52 weeks of age in Pakistan (PDHS 2006)
Odds Ratio p-value
95% Confidence
Interval for OR
Sex of the Child
Male REF
Female 0.82 0.40 0.51 1.31
Children less than 5 yrs old 1.08 0.23 0.96 1.21
Age of the mother 1.02 0.18 0.99 1.06
15-19 REF
20-24 1.09 0.91 0.25 4.66
25-29 1.34 0.68 0.33 5.39
30-34 1.39 0.64 0.34 5.70
35-39 1.58 0.55 0.34 7.30
40-44 3.03 0.24 0.47 19.48
45-49 1.04 0.98 0.08 14.39
No Card REF
Yes card seen 26.18 0.000 6.33 108.16
Yes not seen 15.82 0.000 3.79 66.13
No longer has card 9.32 0.005 1.98 43.90
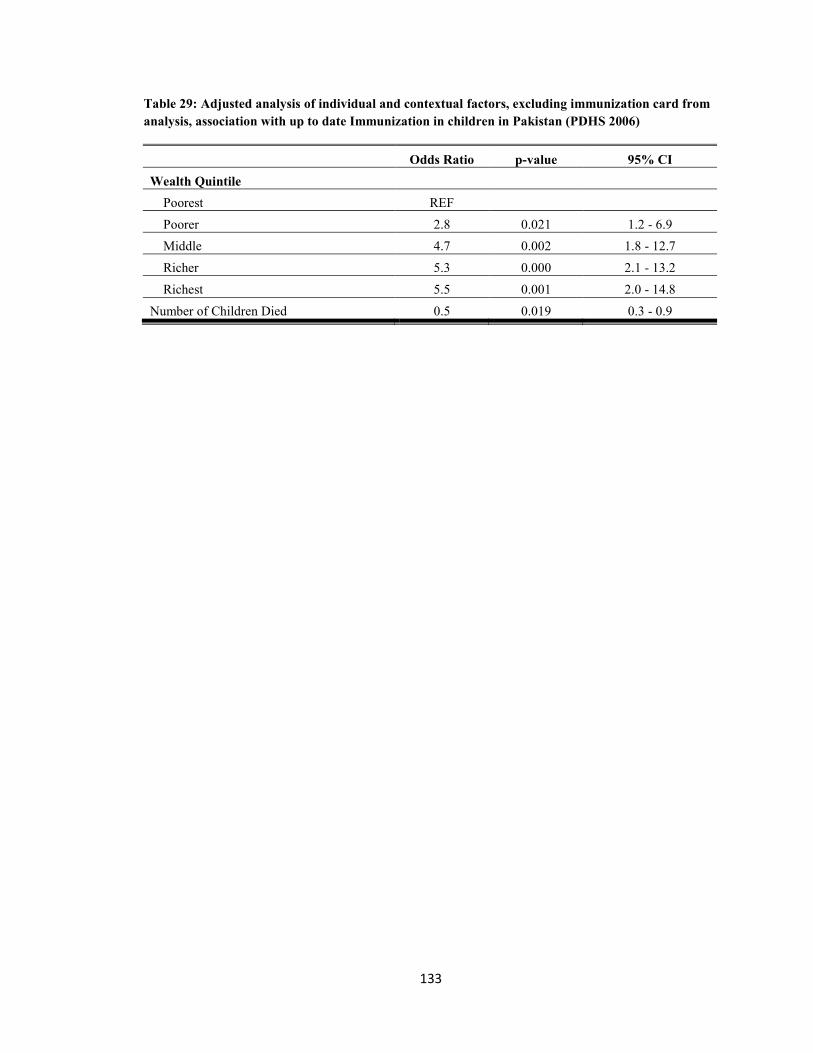
133
Table 29: Adjusted analysis of individual and contextual factors, excluding immunization card from analysis, association with up to date Immunization in children in Pakistan (PDHS 2006)
Odds Ratio p-value 95% CI Wealth Quintile
Poorest REF Poorer 2.8 0.021 1.2 - 6.9
Middle 4.7 0.002 1.8 - 12.7 Richer 5.3 0.000 2.1 - 13.2 Richest 5.5 0.001 2.0 - 14.8
Number of Children Died 0.5 0.019 0.3 - 0.9

134
Table 30: Adjusted analysis of individual and contextual factors, including immunization card, association with up to date Immunization in children in Pakistan (PDHS 2006)
Odd Ratio p-value 95% Confidence Interval
Availability of Immunization card No Card Yes card seen 21.2 0.000 4.9 91.8
Yes not seen 13.2 0.001 3.1 56.9 No longer has card 8.0 0.011 1.6 39.6
Maternal Education No education Primary 0.9 0.846 0.4 2.0
Secondary 1.0 0.951 0.4 2.2 Higher 1.6 0.471 0.4 5.9
Children less than 5 yrs old 1.0 0.785 0.9 1.2 Wealth Quintile
Poorest Poorer 1.7 0.347 0.6 5.0
Middle 2.6 0.117 0.8 8.4 Richer 2.8 0.096 0.8 9.1 Richest 2.0 0.324 0.5 7.9

135

136
Predictors of immunization card retention
The most significant predictor of vaccination initiation, completion and UTD was child being
issued a health/immunization card by the health care system with the odds of the outcome
increasing if mothers were able to show the card at the time of the survey. Due to this finding we
ran a separate analysis with child’s caretaker having an immunization card as an outcome
measure and assessing its association with various predictor variables. Children up to five years
of age (11-60 months of age) were selected from the Pakistan PDHS 2006 data set. Descriptive
analysis was carried out to identify any differences in card being seen at the time of the interview
by province, place of residence and individual socio-economic variables. Unadjusted and adjusted
analyses were carried out using logistic regression analysis to examine the associations of source
of confirmation of immunization status with contextual and individual level variables. The results
of the analyses are presented below.
More than a quarter (27%), of the caretakers of children 11 to 60 months of age reported never
receiving an immunization card in 2006. Among those who reported having a card during the
PDHS 2006, only 19% were able to show it to the survey team at the time of the interview.
Among socio-economic variables, province of residence, area of residence, quintiles of wealth
and mothers’ highest education level showed significant differences for possession of an
immunization card (Table 31).
Confirmation of the DPT1 and DPT3 vaccinations was similarly different across the four
provinces, urban/rural divide and socio-economic status of the parents. For example, among all
children 11 to 60 months of age, 29% in Punjab did not receive any DPT1 vaccine and only 18%
were confirmed receiving the vaccine by card and for 53% of the child vaccine status was
confirmed by maternal recall (Table 31). The percentage of children for whom DTP1 vaccine
status was confirmed in the remaining three provinces was; Sindh 15%, Khyber Pakhtumkhwa
19% and Baluchistan 8%. The same differentials by province, place of residence and socio-

137
economic status of parents were observed for confirmation of vaccination completion by source.
For example, among mothers with no education only 15% were able to confirm the DPT3
immunization status of their children by card and 22% confirmed the completion by personal
recall. The DTP3 vaccination status confirmation by card for children in the highest wealth
quintile was 24% and only 10% for children in the lowest wealth quintile.
Results of the unadjusted logistic regression analysis (see Table 33) indicate that children living
in Khyber Pakhtunkhwa were more likely to be in possession of an immunization card compared
to children in the province of Punjab (OR=1.97; 95% CI: 1.51 – 2.57). Whereas the children in
the province of Balochistan were less likely to have an immunization card compared to children
in the province of Punjab (OR=0.33; 95% CI: 0.2 – 0.53). Children in the province of Sindh were
also had lower odds of possessing the immunization card at the time of interview compared to
children in Punjab. The odds of possession of an immunization card increased with being in a
higher wealth quintile. Households which were in the second wealth quintile had two times
higher odds of to be in the possession of an immunization card compared to those in the lowest
wealth quintile (OR=2.14; 95% CI: 1.4 – 3.2). A similar trend continued for the remaining wealth
quintiles (Table 33).
The mothers’ educational level was also associated with the possession of an immunization card
for the child in the household. Mothers who had primary education as their highest educational
attainment were 18% more likely to have possessed the immunization card for the child compared
to those who had no education (OR=1.18; 95% CI: 0.89 – 1.57). Mothers who had secondary and
higher education were approximately 50% more likely to be in possession of an immunization
card compared to those mothers who did not have any education. We also found that the age of
the child was a significant predictor of possession of an immunization card. If the child was older,
the caretaker was less likely to have an immunization card. For example, children between the

138
ages of 25 and 36 months were 50% less likely to have the immunization card compared to
children between the ages of 12 and 24 months (OR=0.48; 95% CI: 0.37 – 0.62) (Table 33).
On adjusted analysis, the province of residence, wealth quintile and age of the child were found to
be statistically significant factors associated with possession of an immunization card in the
PDHS 2006 (Table 34).

139
Table 31: Selected socio-economic characteristics by possession of an immunization card for children 11-60 months in the Pakistan Demographic Health survey 2006
No card Yes, card seen
Yes, Card not seen
No longer has the card p-value
Province of residence <0.05 Punjab 27% 19% 47% 7% Sindh 42% 15% 39% 3% Khyber Pakhtunkhwa 40% 19% 38% 2% Balochistan 55% 10% 27% 8%
Area of residence <0.05 Urban 18% 22% 54% 6% Rural 40% 16% 38% 6%
Wealth Quintile <0.05 Poorest 51% 12% 29% 8% Poorer 39% 16% 41% 3% Middle 36% 18% 40% 6% Richer 28% 17% 48% 7% Richest 15% 26% 55% 4%
Age of Mother (respondent) 0.0062 15-19 47% 13% 39% 2% 20-24 34% 17% 44% 5% 25-29 32% 20% 41% 6% 30-34 32% 18% 46% 5% 35-39 31% 19% 43% 7% 40-44 35% 13% 47% 4% 45-49 42% 8% 41% 9%
Mothers highest education <0.05 No Education 39% 16% 39% 6% Primary 14% 25% 54% 7% Secondary 12% 22% 60% 6% Higher 1% 22% 78% 0%
Sex of the child 0.1601 Male 32% 18% 44% 6%
Female 34% 18% 42% 6%

140
Table 32: Confirmation of vaccination initiation (DPT1) by sources by socio-economic factors for children 11-60 months in the DHS in Pakistan 2006
Didn't receive DPT1
Confirmed by card
Reported by Mother p-value
Province of residence <0.05 Punjab 29% 18% 53% Sindh 42% 15% 43% Khyber Pakhtunkhwa 41% 19% 40% Balochistan 57% 8% 35%
Area of residence <0.05 Urban 4% 5% 21% Rural 20% 8% 42%
Wealth Quintile <0.05 Poorest 52% 10% 37% Poorer 41% 16% 43% Middle 37% 17% 46% Richer 29% 17% 55% Richest 16% 26% 58%
Age of Mother (respondent) 0.0049 15-19 50% 13% 37% 20-24 33% 17% 50% 25-29 34% 20% 46% 30-34 33% 17% 50% 35-39 31% 18% 51% 40-44 37% 13% 51% 45-49 47% 8% 45%
Mothers highest education <0.05 No Education 41% 16% 44% Primary 14% 24% 62% Secondary 13% 22% 65% Higher 1% 22% 78%
Sex of the child Male 33% 18% 49% 0.1253 Female 35% 17% 47%

141
Table 33: Confirmation of vaccination completion (DPT3) by sources and socio-economic factors for children 11-60 months in the DHS in Pakistan 2006
Province of residence
Did not receive DTP3
Confirmed by card
Reported by Mother p-value
Punjab 53% 18% 29% <0.05 Sindh 68% 13% 18% Khyber Pakhtunkhwa 58% 18% 24% Balochistan 77% 5% 17%
Area of residence Urban 48% 21% 31% <0.05 Rural 63% 14% 23%
Wealth Quintile Poorest 75% 10% 15% <0.05 Poorer 67% 14% 19% Middle 59% 16% 24% Richer 49% 16% 35% Richest 42% 25% 33%
Age of Mother (respondent) 15-19 74% 11% 16% 0.0158 20-24 59% 16% 26% 25-29 55% 18% 26% 30-34 58% 17% 25% 35-39 55% 18% 28% 40-44 63% 12% 25% 45-49 68% 9% 23%
Mothers highest education <0.05 No Education 63% 15% 22%
Primary 43% 22% 35% Secondary 38% 23% 39% Higher 37% 22% 41%
Sex of the child Male 57% 17% 27% Female 59% 16% 25% 0.1871

142
Table 34: Unadjusted odds ratios and 95% confidence intervals from logistic regression for the associations between socio-economic factors and possession of an immunization card for children 11-60 months in the PDHS 2006
Odds ratio p-vlaue 95% confidence Interval
Province of residence Punjab REF - - -
Sindh 0.78 0.053 0.6 1.0 Khyber Pakhtunkhwa 1.97 0.00 1.51 2.57 Balochistan 0.33 0.00 0.2 0.53
Area of residence Urban REF - - -
Rural 0.82 0.12 0.63 1.05 Wealth Quintile
Poorest REF - - - Poorer 2.14 0 1.43 3.21 Middle 2.24 0 1.5 3.33 Richer 2.68 0 1.79 4.03 Richest 2.6 0 1.72 3.94
Age of Respondent mean(SE) 0.98 0.015 0.964 0.996
Mothers highest education No Education REF - - -
Primary 1.18 0.246 0.89 1.57 Secondary 1.51 0.008 1.12 2.06 Higher 1.52 0.017 1.08 2.14
Sex of the child Male REF - - -
Female 0.99 0.94 0.84 1.18
Age of Child 12 - 24 months REF - -
25 - 36 months 0.48 0 0.37 0.62 37 - 48 months 0.32 0 0.25 0.4 49 - 60 months 0.22 0 0.17 0.3

Table 35: Adjusted odds ratios and 95% confidence intervals from logistic regression analysis for the associations between socio-economic factors and possession of an immunization card for children 11-60 months in the PDHS 2006
Odds ratio p-value 95% Confidence Interval
Province of residence
Punjab REF - - - Sindh 0.83 0.178 0.63 1.09 Khyber Pakhtunkhwa 2.09 0.000 1.59 2.76 Balochistan 0.41 0.001 0.25 0.68
Wealth Quintile Poorest REF - - -
Poorer 1.78 0.008 1.16 2.72 Middle 1.96 0.002 1.30 2.97 Richer 2.38 0.000 1.56 3.63 Richest 2.40 0.000 1.57 3.68
Age of Child 12 - 24 months REF - - -
25 - 36 months 0.48 0.000 0.37 0.62 37 - 48 months 0.32 0.000 0.25 0.41 49 - 60 months 0.22 0.000 0.16 0.29

144
Chapter 5: Discussion

145
My research hypotheses required assessing whether contextual level variables were more likely
than individual level variables to predict vaccination initiation, completion and up to date
immunization among children in Pakistan, utilizing the Pakistan Demographic and Health Survey
data for 1990 and 2006. Among all variables, possession of a health/immunization card was the
strongest predictor and had a statistically significant association with all of the three outcomes.
The most significant results from the analyses are summarized and discussed in the following
sections.
Vaccination Initiation: The analysis of the 2006 PDHS showed that, unlike possession of a
health card, other contextual level variables including place of residence (urban and rural) and
province of residence, were not statistically significant predictors of vaccination uptake in the
final model. There were, however, significant differences by province in the unadjusted model
and marginally significant differences (p<0.10) in the full model. In the analysis of the 1990
data, differences by province were significant at the p<0.05 level: children in both Sindh and
Balochistan were less likely to have received DPT1 vaccinations than children in Punjab.
Children in the province of Punjab compared to the other provinces are more likely to initiate
vaccination for several reasons: first, the province is densely populated and therefore it is easier
for a given basic health unit to reach a larger population. Second, social support services like
schools, colleges and roads are available to a larger population, thus improving the education
rates and access to services. Last but not least, the population in Punjab has better economic
opportunities due to better-irrigated cultivatable land, major industry and centers of commerce.
I also looked at the associations of individual level variables with vaccination related outcomes.
Based on my analysis of the PDHS 2006-07, household wealth and maternal education are
statistically significantly associated with vaccination initiation for children aged 12 to 23 months
in Pakistan, after accounting for contextual level characteristics of province and place of
residence (urban or rural). This is in accordance with the trends seen globally (Wiysonge et al.

146
2012, e37905). The reasons for this trend seen globally and in Pakistan can be explained by the
fact that wealthier households are more likely to have better access to health services by virtue of
tending to reside in better served areas as well as having financial resources to spend on health
(Suarez-Castaneda et al. 2013). These areas are also more likely to have better access to civic
services like schools and colleges, thereby increasing the likelihood of communities getting better
education.
Maternal education is a strong predictor of vaccination initiation and this can be explained
partially by the fact that in Pakistan mothers with higher education are more likely to reside in
larger cities, have better economic opportunities and better access to health services. But mothers
with higher education even in rural areas act similarly to their counterparts in urban areas when it
comes to seeking preventive health services for their children. This pattern suggests the
importance of female education in improving the maternal and child health conditions in any
society. However it was observed that in Pakistan, mothers with education up through the primary
level do not behave differently in terms of initiating vaccination for their children compared to
mothers with no education. The difference in behavior due to education is observed only after
mothers have completed secondary or higher education. This observation can be explained by
two factors: first, mothers who complete secondary and higher education have higher degrees of
autonomy of decision making regarding their own health care and that of their children. Second,
communities that emphasize the importance of higher education for girls may also be more
inclined towards seeking better health services for their children.
But the individual effect of education in improving uptake of preventive health services cannot be
over emphasized. As young women acquire more education, their understanding of the scientific
basis of disease and prevention is increased which is translated into seeking better preventive
health services. It also sheds light on the fact that communities which place value in educating
girls and keeping them in school beyond the primary level and have empowered women with

147
decision making capacity regarding maternal and child health have over all better health and
human development indicators. It is unfortunate that the benefits of education have not reached
every community in Pakistan, as more than half of the mothers--in the 2006-07 PDHS sample, a
total of 63.38%--had no education. Only 15% of mothers had through primary and 15.57% had
secondary education. The number of mothers with both secondary and higher education was only
6.01%, indicating the failure of the government to provide education facilities and incentives for
young girls to enroll and remain in schools.
The health care providers issue the health/immunization card for a child at the time of the first
antenatal visit by the mother or when a child first comes into contact with immunization
services/EPI program--ideally at birth--to receive vaccines. Having a health card depends on its
being issued by the health care system and the parental attitudes and practices towards vaccines
and keeping the card in a safe place. This makes having a card both a contextual as well as an
individual level variable/factor. For all my analysis in this thesis I have treated having a card as a
contextual level variable for several reasons. First, because the card is issued by the health care
system, it indicates the inefficiency of the immunization program in areas where it is never
issued. It was observed that a quarter of children (24.88% in our PDHS 2006 sample) were never
issued a health card by the vaccination program. In addition, being issued a health card at birth by
the health care system may modify the behavior of mothers toward promoting immunization
initiation, which further leads to immunization completion. It is important to note that mothers
who were not able to produce the card at the time of the interview, or indicated that the child no
longer had the card still had children with better performance in completing the DTP3 vaccination
compared to children who were never issued a card.
Second, having a health card is treated as a contextual level variable because, as in countries like
the United States, it is mandated by the state to complete childhood immunization for entry into
the public education system. Thus safeguarding the health/immunization card by the parents is a

148
behavior incentivized by the public education system. This exemplifies how systems level policy
by the department of education may modify parental behavior to safeguard the
health/immunization card as well as complete the immunization s schedule of their children
before entry to the public school system.
My thesis research findings may also be explained in accordance with the modified Andersen and
Aday “Behavior model and access to health care,” which was used as the conceptual framework
to guide my analysis. The uptake of the immunization services is determined by the contextual
level determinants like the increase in number of staff and facilities of the Expanded Program of
Immunization reaching a larger proportion of the population. This may explain the increase in the
vaccination services uptake between the time periods of 1990 and 2006. The general environment
in which the families reside also affects the uptake of health services Thus the current situation in
Pakistan which has witnessed an increasing number of violent attacks on vaccination staff may
affect population attitudes towards vaccines. However when the PDHS data was collected in 2006
these hostilities were not seen towards immunization programs so we cannot infer that the general
socio-political unrest was affecting childhood immunization.
The immunization trends and population behaviors toward vaccines in 1990-91 in Pakistan were
not very different from what we observed in the 2006-07 DHS data set. Although in 1990-91 a
larger proportion of children, 36.58%, did not initiate the DTP1 vaccine and 34.29% were never
issued a health/immunization card, the proportion of mothers who were able to produce a card at
the time of the interview (27.43%) was nearly similar to that observed in 2006-07 PDHS (23.74%
observed). In the 16 years time the program has not made adequate efforts to issue an
immunization/health card to every child presenting for vaccination. Also the program has not
been able to change parental attitudes towards safeguarding the immunization records of their
children.

149
The slow pace of development in the country is evident by the female educational attainment
rates. In 1990 the proportion of women with no education was 76.83% compared to the 2006-07
proportion of 63.38%; the gap was reduced by only 13.45%. The gap in primary and secondary
completion has also not changed much. Although primary school enrollment had increased
between 1990-and 2006 a similar increase was not observed for the proportion of young mothers
completing both secondary and higher education (In the 1990-91 PDHS it was at 0.89%). There is
no doubt that the slow progress in increasing secondary and higher education rates is a
compelling finding, requiring the governmental attention for increases in human development
initiatives and funding. But this finding also has bigger health implications. The PDHS1990
survey shows that there was no difference between mothers with no education compared to
mothers with up through primary education regarding the initiation of the vaccination schedule
for their children. This trend is similar to the PDHS 2006-07 findings, again highlighting the
neglect of the Expanded Program of Immunization program in targeting young children enrolled
in primary schools for health behavior change.
The unadjusted analysis of the PDHS 1990 data shows similar associations of the contextual level
determinants with vaccination initiation, as observed in the PDHS 2006 data. The unadjusted
analysis of the individual level determinants with vaccination initiation in 1990 was also similar
to the pattern observed in the PDHS 2006-7 data.
Vaccination Completion and UTD: Having a health card was most significantly associated with
receiving DTP3 after adjusting for individual factors like maternal education and socio-economic
status, sex of child, birth order etc. Although vaccination initiation was associated with socio-
demographic characteristics like household wealth and maternal education, for vaccination
completion these factors were not significant. However, because we selected our sample of
children for this analysis of vaccine completion from those who had already initiated the
schedule, we are by default already adjusting for the population socio-demographic

150
characteristics of household wealth and maternal higher education and the population in our
sample are those who are aware of the vaccination programs and have better access to vaccines.
In the population subgroup,that has already initiated the immunization schedule, the only
significant factor associated with completion is having a health/immunization card. The
importance of a reminder system like having an immunization card cannot be emphasized enough
in facilitating the vaccination completion. In our supplementary analysis we also observed that
the date of the vaccine was noted more frequently for mothers with secondary and higher
education, indicating that the behavior of the vaccine providers may be influenced by the
educational status of their clients.
Parents who initiate the immunization schedule of their children at an early/specified time are
more likely to complete it within the recommended age of one year. It is observed that the
proportion of children who had UTD immunization was similar in the provinces of Balochistan
and Punjab making it, in our analysis, the only comparable indicator between the two provinces.
The two provinces have a totally different socio-demographic composition and health system
setup in terms of access. This finding emphasizes the fact that parents who are informed of the
importance of timely vaccination and initiate the process, behave similarly with follow-up
regardless of the differences in vaccine access and socio-demographic differentials. The
alarmingly low levels of UTD immunization among children strongly suggests that the EPI
should update its program monitoring indicators and not rely solely on BCG, DTP1 and DTP3
coverage among children 12-23 months of age. Using a more stringent criterion of assessing
UTD immunization among children 36-52 weeks of age allows for better assessment of the risk
of infectious diseases to which Pakistani children are exposed.
Vaccine reminders through mobile phone technology have been in the limelight for several years
in several countries and with encouraging results. These reminders have been supplemented with
cash incentives to further improve the timeliness of the immunization schedule in Kenya but the

151
challenges of mobile phone based reminders in developing countries remain. There are
technological limitations in integrating the records of each child receiving their scheduled vaccine
dose and the automatic generation of the reminders for the next vaccine dose. In developing
countries there is also the gender gap of possessing a cell phone even in areas of 100% mobile
phone coverage. Women are 20% less likely to possess a mobile phone handset compared to men.
The third limitation of mobile phone based reminders is that in the developing countries the pre-
paid and non-contracted cell phone service leads to frequent disconnections. Almost 40% of the
parents enrolled in a mobile phone vaccine reminder intervention reported service disconnection
in the year of enrollment in the program {{371 Wakadha,H. 2013;}}. With these limitations it is
important to have an intervention the can give real time reminders to parents, is cost effective and
is health systems oriented. The latter characteristic is equally important as such a reminder system
would allow for the health care system to control for population level selection biases and provide
the service to all members of the community, even the marginalized and those without the means
to afford a cell phone.
The recommendation to have a cell phone alternate reminder system that was guided by the
findings of this research thesis has been awarded a Gates Foundation Grand Challenges
Exploration grant. The grant is funding the development of a time dependent and temperature
independent indicator It is an oil-based dye moving on a membrane and coloring it red as it
moves along, which reaches specified marks at specified time intervals corresponding to the
vaccination schedule to remind parents about the appropriate time to visit the vaccination center
for timely and complete immunization of their children. The indicator will be worn by children on
their ankles attached to a cloth band secured by a locking device. Each band will have a unique
number that will be used to track the timeliness with which children are brought to the center to
complete their vaccine dose.

152
Immunization card retention
Our analysis of the PDHS 2006 shows that geographic location, economic position of the
household, and age of the child are significant factors in determining the retention of an
immunization card at the household level in Pakistan. Vaccination history as recorded in the form
of an immunization card is considered to be a strong predictor of compliance to vaccination in
developed and developing countries. There is a lot of emphasis on improving immunization
services through novel and innovative mechanisms for areas with low vaccination coverage in
developing countries. There is increasing debate regarding having a single digital child health
record for major health interventions. Single digital records will provide information on
acceptance and coverage of different interventions as well as how participation in various
programs improves maternal and child health. The significance of such a system becomes even
more valuable in developing countries, where prioritization of health intervention has to be based
on impact.
We also analyzed the PDHS 1990 data to see if the factors for immunization card retention have
changed over time. We did not conduct logistic regression analysis for the PDHS 1990 due to a
difference in the way this variable was recorded between the two surveys However the univariate
estimates showed a similar pattern for immunization card possession, indicating little change
between the two surveys The overall proportion of households that reported having an
immunization card increased from 1990 to 2006, but overall the pattern of retaining/possession of
an immunization card showed little change after a gap of more than 16 years.. Our results also
show that age of the child is a significant factor in presenting the immunization card at the time of
the survey. The older the children were, the less likely their mothers were to present the
immunization card to the survey teams. This could be due to the fact that while the children have
received the course of the vaccinations, the parents do not keep the vaccination card. This factor
has to be taken into account where the government in Pakistan and other countries like to enforce

153
school entry by immunization record confirmation. If such a policy to is to be implemented to
increase immunization coverage, a well-planned communication plan should be implemented for
the parents by the health care system. It may be important that the schools are involved at an early
stage due to their important role in implementation of immunization card confirmed vaccination
for school entry policy implementation.
Our results also highlight the importance of data recording for other interventions, since there is a
debate if other health interventions should be implemented while the child visits health centers for
immunization. This approach increases the data recording and the records may be required for a
longer time by the health system such as with nutrition interventions. It has been found that
parents were more likely to keep child health records if they were told at the time of the visit to
the health center that they would be needed for follow up visits.
The factors that were found to be statistically significant with possession of an immunization
card, in turn indicate underlying issues with the health care system, and population attitudes
towards immunization. Province of residence does highlight the importance of provincial health
department commitment in undertaking health care delivery. In order to bring change, the
government has to look to health system factors that increase awareness among the population
regarding the importance of immunization both at the province as well as at the country level. A
regular mechanism for immunization assessment beginning from a smallest health administration
unit to the provincial level may have a significant effect in addressing the issue of immunization
initiation and completion.
We conducted an analysis of the Pakistan Demographic and Health Survey data of 1990 and 2006
to assess predictors/barriers to routine immunization for children 12 to 23 months of age in
Pakistan. Our results showed a highly statistical significant association for children who had
retained a card to have a timely vaccination as well as vaccination completion. It is however

154
important, for reasons mentioned above, to understand what are the factors that help families to
retain the vaccination cards. Understanding these factors will be helpful in educating the mothers
and program managers regarding the importance of the retention of cards and complying with
recommended vaccines and health interventions.

155
Policy implications and recommendations
The validity of our outcome measure, immunization status of children, as confirmed by
household held immunization record and maternal recall, is regarded as the gold standard in the
absence of provider based health records (Hayford et al. 2013, 1211-2458-13-1211). The
literature gives us confidence in the interpretation of our results and in making policy
recommendations based on our findings. Our research findings, understanding of the health and
education system in Pakistan and critically reviewing the greater literature have guided our policy
recommendations. We agree with the conclusion that policies, incentives and communication
strategies cannot work in isolation; to reach the WHO recommended 90% coverage and increase
timely vaccination completion rates these three approaches have to be addressed at all levels of
supply and demand, as well as made into national priorities (Shefer et al. 1999, 96-142).
Policy recommendation 1): Expanded Program of Immunization (EPI) efforts should be directed
to reach households in the poorest and poor wealth quintiles: our analysis of the 1990 and 2006
data showed that immunization initiation, completion and UTD status has improved only for
children in the middle wealth quintile between the two time periods. In 2006 children belonging
to the poorest and poor households still fared worst compared to higher income households and
the overall percentages of children in the lower two wealth quintiles completing the third dose of
DPT and UTD were still alarmingly low. The EPI program has yet to reach out to the poorest and
poor households with better access and incentives for vaccination of their children. This is much
needed as disease and under-five mortality is highest among this population. Why households in
the middle wealth quintile have made the most improvement in completing the vaccination status
of their children can be explained by the fact that as more and more people from rural areas are
moving to urban and semi-urban areas for better economic opportunities they are entering the
middle wealth quintile group. Although households belonging to the higher wealth quintiles and
mothers with higher education are individual level characteristics, they also highlight the fact that

156
the health care system is more geared to cater to the needs of the population with better access to
sources of income and human development. The government should increase its efforts to reach
marginal populations with limited financial resources and access to social services like health and
education. Once the health care system reaches the populations with easily accessible
immunization services then even individual in lower wealth quintiles are more likely to receive
the DTP3 vaccine and complete the immunization schedule.
Policy Recommendation 2): Introduce digital immunization records. Our findings show that less
than 20% of the mothers were able to show the household held immunization record of the child
during both the surveys of 1990 and 2006. Almost half of the mothers were not able to show the
paper based immunization record of their children at the time of the interview during the 1990
and 2006 surveys. In light of this finding we recommend that the EPI program should move
towards digital/electronic health and immunization records for all children in Pakistan. This
system requires initial investment but it is the need of the day. With the increase in technology
and its ease of use, this system can be established even in a low-income country like Pakistan.
Paper based health records are prone to being easily damaged and lost and one can propose to
provide families with easily stored and water/tear resistant cards but there are limitations
associated with household held immunization records. A study assessing the validity of
household held immunization records using provider health records as the gold standard in the
Commonwealth of Northern Mariana Islands, a developing region, has found the household held
immunization cards underestimate the true vaccination status of children (Luman, Ryman, and
Sablan 2009, 2534-2539). This is due to the fact that often parents taking their children for
vaccination may forget to take the immunization card with them, thus vital information is not
recorded on the card. The possession of a health card which is seen at the time of interview is a
measure of maternal attitudes and understanding towards the importance of immunization
completion but during our analysis we found that being issued an immunization card by the EPI

157
program is also the single most significant factor predicting vaccination completion. In the
absence of digital electronic records the EPI program must provide waterproof, tear resistant and
easily stored immunization cards to each and every child initiating the vaccination process and if
a card is lost to replace it.
In the time period between 1990 and 2006 there has been no significant change in the proportion
of mothers who were able to show the card at the time of the interview. The EPI and health care
system must direct their efforts to create a social value for mothers/caregivers to save the health
card/immunization record card of a child just as much as reinforcing the importance of
vaccinating their children in a timely and complete manner. Health care providers must inquire
about the immunization status of a child at each encounter they have with their pediatric patients
to reinforce in the communities the importance of immunization in a timely and complete
manner.
Policy recommendation 3): Introduce innovative systems to remind mothers/caregivers for
timely and complete immunization of their children. Analysis of the data showed that household
wealth and maternal education were significantly associated with immunization initiation but
only maternal education and having an immunization card were significantly associated with
completion. Educated mothers may have better understanding of the importance of vaccines but
they also have a better understanding of keeping track of time, through newspapers, calendars
etc., to which the uneducated mothers have limited access. In the 2006 PDHS sample 63.38% of
the mothers had no education, 15% had through the primary level and 15.57% had secondary
education. Only 6.01% of the mothers had education above the secondary level and higher.
Although we did not assess how well these women kept track of dates, we understand that
uneducated women have fewer and less effective means of keeping track of dates. In light of this
finding we propose that there is a need to have an innovative system of reminding
mothers/caregivers of the vaccine due dates to improve immunization completion, especially

158
among women who do not have access to electronic reminder systems like cell phones and who
also lack education and training to consult calendars.
Policy recommendation 4): Introduce in the primary school curriculum the importance of timely
and complete vaccination. Our analysis showed that the beneficial effects of education to improve
vaccination status of children are observed only for mothers with secondary and higher education.
In our analysis mothers with primary education did not behave differently from mothers with no
education. Increasing female literacy is crucial for improving the health of the population,
including reducing infant and under-five mortality. The government has improved its efforts to
increase female enrollment and keep girls in school beyond the primary level but it also needs to
focus on the quality of education provided to these girls. Mothers with primary education do not
behave much differently from mothers with no education regarding preventive health seeking
behavior; therefore while girls are enrolled in primary school every effort should be made to
educate them about health and the benefits of preventive health services. The primary school
curriculum needs to be updated to address the significance of completing the immunization
schedule and needs to impart this valuable lesson when children are in the most impressionable
age. We have not assessed Pakistan’s primary school curriculum regarding the content or
importance of immunization nor are we able to assess from the data if such education has been
imparted to mothers who have secondary level education. Also education may act as a proxy for
socio-economic status and place of residence of the family which limits its assumed causal
relationship with child health outcomes. But it has been seen that education is significantly
associated with immunization even after accounting for individual and contextual level
determinants (Desai and Alva 1998, 71-81).
Policy recommendation 5): Conduct in-depth research to understand factors associated with
parental compliance to timely immunization and card retention. Retaining the immunization card
may predict household behaviors towards immunization and other programs but could be a proxy

159
for socio-economic and health behavior characteristics. Therefore it is very important for the
policy makers and health program implementers to keep in view the factors that predict retention
of a health card per se. The success and/or failure of an effort to introduce innovative approaches
to retain a card by the household heads (mothers) and in turn reduce vaccination dropout rates
would therefore need in-depth understanding of determinants of compliance and retention of a
card.
In addition to the policy recommendations guided by our PDHS 1990 and 2006 data analysis we
also want to propose redrawing the rural/urban divide in Pakistan by introducing an objective
measure of urbanicity; This recommendation is made by our review of the recent literature and is
made in light of the current literature on socio-demographic transitions. In our analysis of the
PDHS data we were not able to validate the rural or urban status of the primary sampling units in
the data set using a composite score for urbanicity or human development. The rural urban divide
in Pakistan is based on an outdated arbitrary system set in the sixties; therefore when making
inferences regarding population behavior on this variable one has to take into account that areas
designated as rural are now growing cities with semi-urban characteristics. Globally and in
Pakistan major demographic transitions are taking place as rural villages are transforming into
small towns and towns are growing into cities and the rural—urban dichotomy is unable to
capture the epidemiological health transitions effectively (Dahly and Adair 2007, 1407-1419).
One way to overcome this limitation is to calculate a validated urbanicity score for rural areas and
then assess health outcomes against this score (Colchero and Bishai 2008, 615-623; Allender et
al. 2010, 297-304). The 2006-07 Pakistan DHS is representative at the national and provincial
levels and the survey collected information on the available civic amenities. This information was
collected only in the rural areas from the largest village in the primary sampling unit. However
the validated urbanicity score for PSUs and rural districts in Pakistan cannot be calculated using
the 2006-07 PDHS for several reasons: 1) There is no way to link the survey data with the district

160
from which it was collected, therefore it cannot be inferred if the village is representative of the
entire district. The PDHS has information on the distance of the village from the district
headquarters but as districts cannot be identified this information cannot be used to infer
population density nor the population size of the village. Because this information is missing
from the PDHS we cannot calculate the urbanicity score of the PSU and know for sure if a given
PSU is still rural, in transition or has been transformed into an urban area. The reason DHS and
population surveys ensure the district and PSU identifiers are not available in the public domain
is to protect the anonymity of the individuals surveyed. An alternate way adopted by major
populations surveys is to introduce the replicate weights into the data set which allows for
analysis at the district and PSU level but the user is unable to link it to the individual is
interviewed in the survey.
Study Limitations and Strengths
1) The demographic and health surveys are primarily descriptive surveys aimed at
estimating population totals and means as opposed to analytical surveys which are used
to derive coefficients from logit and linear models. Therefore the uses of data from
descriptive surveys to arrive at analytical assessment pose challenges that need to be
addressed.
2) The predictor variables included in the analysis are only those variables for which
information is available in the PDH survey. Significant predictor variables like health
care system setup and personnel for delivery of immunizations, population perceptions
regarding immunization and program incentives like food/money for immunization
completion identified during the literature search in scientific publications are not
included for modeling because they are not collected by the PDHS. To address this
limitation we can take variables present in the survey and use them as proxy measures for
variables of interest. Maternal satisfaction with immunization services is not covered in

161
the survey but level of satisfaction with health care provider for a sick child visit is
measured by the PDHS 2006-07. The latter variable can be used as a proxy measure for
the former but this has to be duly acknowledged in the interpretations and presentation of
the results.
3) The differences in sample sizes and time frames (a difference of 16 years) and quality of
execution of the two surveys, PDHS 2006-07 and 1990-91, pose issues for merging the
two data sets. The two data sets were not merged but analyzed separately and the
regression results for the two data sets were compared. This is feasible as the sampling
methodology and survey tool (questionnaire) for the two surveys provides compatibility
that makes comparisons acceptable for the two data sets. However we have to
acknowledge this limitation in arriving at inferences.
4) There have been numerous health programs and several policy changes between the time
periods of 1990-91 and 2006-07. To assess the impact of each policy on immunization
initiation and completion would require collecting data retrospectively which may or may
not be present. Health policies are not implemented uniformly across the country, hence
the inability to ascertain the effect of each at the implementation (and effect) stage poses
a limitation. It is a challenge to find causative associations or direct impacts of the health
initiatives and policy changes on childhood routine immunization schedule completion by
analyzing published reports only. It is only possible to review the published literature
regarding the nature of various policy changes and health initiatives and state what were
the vaccination initiation, completion and UTD rates at each point in time without
making any causative inferences. The unobserved and unreported influences of various
policy changes and health initiatives were not accounted for in the analysis. There are
several non-health related policy changes and program initiatives such as increasing
primary school enrollment for girls and increasing the number of paved roads in the rural
areas that can directly or indirectly affect the health seeking behavior of mothers and the

162
resulting vaccination completion rates. Communities are dynamic and constantly
experience changes in social norms and trends including health-seeking behavior. Our
study has not accounted for the myriad of policy and program changes that have taken
place in Pakistan between the timeframe of 1990 and 2006 regarding health as this task is
not possible through reviewing published literature which comments on the effects of
various policy initiatives. The policy recommendations that come out of our study are
based on the analysis of the PDHS results and the published systematic literature reviews.
5) The Pakistan Demographic and Health Survey 2006 is the largest nationally
representative population survey to date and its results are generalizable to the provincial
level. Our analysis has looked at the association of individual and contextual level
determinants associated with immunization initiation, completion and up to date status of
children in Pakistan. Other published papers have not reported similar research from
Pakistan.
6) The sampling methodology and questionnaire design of the PDHS 1990 and 2006 allows
for comparison of the two time frames.
7) The validity of our outcome indicators, measured by maternal recall and card, is
confirmed by several studies and accepted as the gold standard in the absence of health
care provider records. We have made policy recommendations based on our research
findings and these are achievable in a limited time frame and possible within the
technological and human resources available in Pakistan.

163
References
The national vaccine advisory committee. “Strategies to sustain success in childhood immunizations”. 1999. JAMA: The Journal of the American Medical Association 282 (4) (Jul 28): 363-70.
National Institute Of Population Studies (NIPS) [Pakistan] and macro international inc. 2008. Pakistan demographic and health survey 2006-07. Islamabad, Pakistan: National institute of population studies and macro international inc.
Abdul Razzaque Rukanuddin, K. Zaki Hasan. 1992. Maternal and child health in Pakistan demographic and health survey 1990-91, National Institute of Population Studies and IRD/Macro international inc., 97-109. Islamabad, Pakistan and Columbia, Maryland: National institute of population studies and IRD/Macro international Inc.
Ahlers-Schmidt, C. R., A. K. Chesser, T. Nguyen, J. Brannon, T. A. Hart, K. S. Williams, and R. R. Wittler. 2012. Feasibility of a randomized controlled trial to evaluate text reminders for immunization compliance in kids (TRICKs). Vaccine 30 (36) (Aug 3): 5305-9.
Akmatov, M. K., M. Kretzschmar, A. Kramer, and R. T. Mikolajczyk. 2008. Timeliness of vaccination and its effects on fraction of vaccinated population. Vaccine 26 (31) (Jul 23): 3805-11.
Allender, S., B. Lacey, P. Webster, M. Rayner, M. Deepa, P. Scarborough, C. Arambepola, M. Datta, and V. Mohan. 2010. Level of urbanization and noncommunicable disease risk factors in tamil nadu, india. Bulletin of the World Health Organization 88 (4) (Apr): 297-304.
Andersen, R. M. 1995. Revisiting the behavioral model and access to medical care: Does it matter? Journal of Health and Social Behavior 36 (1) (Mar): 1-10.
Andersson, N., A. Cockcroft, N. Ansari, K. Omer, J. Losos, R. J. Ledogar, P. Tugwell, and B. Shea. 2005. Household cost-benefit equations and sustainable universal childhood immunisation: A randomised cluster controlled trial in south pakistan [ISRCTN12421731]. BMC Public Health 5 (Jun 28): 72.
Antai, D. 2009. Inequitable childhood immunization uptake in nigeria: A multilevel analysis of individual and contextual determinants. BMC Infectious Diseases 9 (Nov 20): 181.
Babalola, S. 2009. Determinants of the uptake of the full dose of diphtheria-pertussis-tetanus vaccines (DPT3) in northern nigeria: A multilevel analysis. Maternal and Child Health Journal 13 (4) (Jul): 550-8.
Babu, G., J. Olsen, S. Jana, S. Nandy, M. Farid, and SM Sadhana. 2010. Evaluation of immunization cards and parental recall against gold standard for evaluating immunization coverage. He Internet Journal of Epidemiology 9 (2).
Barham, T., L. Brenzel, and JA Maluccio. 2007. Beyond 80%: Are there new ways of increasing vaccination coverage? Evaluation of CCT programs in Mexico and Nicaragua. Washington DC: The International Bank for Reconstruction and Development / The World Bank.

164
Bishai, D. M. 2008. Global initiatives in universal childhood immunisation. Lancet 372 (9655) (Dec 13): 2004-5.
Blau, J., P. C. Faye, K. Senouci, S. N. Dagnan, A. Douba, J. T. Saracino, and B. D. Gessner. 2012. Establishment of a national immunization technical advisory group in Cote d’Ivoire: Process and lessons learned. Vaccine 30 (15) (Mar 28): 2588-93.
Bondy, J. N., A. Thind, J. J. Koval, and K. N. Speechley. 2009. Identifying the determinants of childhood immunization in the Philippines. Vaccine 27 (1) (Jan 1): 169-75.
Bos, E., and A. Batson. 2000. Using immunization coverage rates for monitoring health sector performance: Measurement and interpretation issues. Washington DC: HNP; The World Bank.
Brenzel, L., C. Sanderson, V. Galayda, T. Masud, and I. U. Haq. 2011. Cost-effectiveness and financial consequences of new vaccine introduction in Pakistan. Washington DC: The International Bank for Reconstruction and Development / The World Bank, .
Brown, J., Monasch, R., Bicego, G., Burton, A. and Boerma, J. An assessment of the quality of national child immunization coverage estimates in population- based surveys. Measure evaluation. 20022014]. Available from http://www.cpc.unc.edu/measure/publications/wp-02-53.
Chandir, S., A. J. Khan, H. Hussain, H. R. Usman, S. Khowaja, N. A. Halsey, and S. B. Omer. 2010. Effect of food coupon incentives on timely completion of DTP immunization series in children from a low-income area in Karachi, Pakistan: A longitudinal intervention study. Vaccine 28 (19) (Apr 26): 3473-8.
Cho, H. Y. 2012. An overview of the national immunization policy making process: The role of the Korea expert committee on immunization practices. Korean Journal of Pediatrics 55 (1) (Jan): 1-5.
Clark, A., and C. Sanderson. 2009. Timing of children's vaccinations in 45 low-income and middle-income countries: An analysis of survey data. Lancet 373 (9674) (May 2): 1543-9.
Clark, S. J., A. Butchart, A. Kennedy, and K. J. Dombkowski. 2011. Parents' experiences with and preferences for immunization reminder/recall technologies. Pediatrics 128 (5) (Nov): e1100-5.
Cockcroft, A., N. Andersson, K. Omer, N. Ansari, A. Khan, U. U. Chaudhry, and U. Ansari. 2009. One size does not fit all: Local determinants of measles vaccination in four districts of Pakistan. BMC International Health and Human Rights 9 (Suppl 1): S4.
Colchero, M. A., and D. Bishai. 2008. Effect of neighborhood exposures on changes in weight among women in Cebu, Philippines (1983-2002). American Journal of Epidemiology 167 (5) (Mar 1): 615-23.
Cotter, JJ, JD Bramble, VE Bovbjerg, CB Pugh, DK McClish, G. Tipton, and RS Wally. 2002. Timeliness of immunization of children in a medicaid primary care case management managed care program. Journal of National Medical Association 94 (9).
Cui, F. Q., and R. Gofin. 2007. Immunization coverage and its determinants in children aged 12-23 months in Gansu, china. Vaccine 25 (4) (Jan 8): 664-71.

165
Dahly, D. L., and L. S. Adair. 2007. Quantifying the urban environment: A scale measure of urbanicity outperforms the urban-rural dichotomy. Social Science & Medicine (1982) 64 (7) (Apr): 1407-19.
Demographic, Pakistan. Health Survey (PDHS).(2006-07).(National Institute of Population Studies and Macro International Inc.Publication).
Desai, S., and S. Alva. 1998. Maternal education and child health: Is there a strong causal relationship? Demography 35 (1): 71-81.
Diallo, O., M. Schlumberger, C. Sanou, H. Dicko, A. Aplogan, and F. Drabo. 2012. Use of SMS to ask mothers to come to vaccination sessions in bobo-dioulasso. Bulletin De La Societe De Pathologie Exotique (1990) 105 (4) (Oct): 291-5.
Dugas, M., E. Dube, B. Kouyate, A. Sanou, and G. Bibeau. 2009. Portrait of a lengthy vaccination trajectory in burkina faso: From cultural acceptance of vaccines to actual immunization. BMC International Health and Human Rights 9 Suppl 1 (Oct 14): S9,698X-9-S1-S9.
Fadnes, L. T., D. Jackson, I. M. Engebretsen, W. Zembe, D. Sanders, H. Sommerfelt, T. Tylleskar, and PROMISE-EBF Study Group. 2011. Vaccination coverage and timeliness in three south african areas: A prospective study. BMC Public Health 11 (May 27): 404,2458-11-404.
Federal EPI/CDD Cell. 2003. Expanded Programme on Immnunizatoin: Financial sustainability plan 2003-2012. Islamabad: National Institute of Health, Pakistan, .
Galpin, R. 2013. Fighting Pakistan’s measles epidemic. BBC2013.
Glauber, J. H. 2003. The immunization delivery effectiveness assessment score: A better immunization measure? Pediatrics 112 (1 Pt 1) (Jul): e39-45.
Gore, P., S. Madhavan, D. Curry, G. McClung, M. Castiglia, S. A. Rosenbluth, and R. A. Smego. 1999. Predictors of childhood immunization completion in a rural population. Social Science & Medicine (1982) 48 (8) (Apr): 1011-27.
Government of Pakistan. Population census organization. 2011 [cited 01/13/2011 2011]. Available from http://www.census.gov.pk/index.htm.
Expanded program on immunization. 01, 20112011]. Available from http://202.83.164.26/wps/portal/Moh/!ut/p/c0/04_SB8K8xLLM9MSSzPy8xBz9CP0os3h_Nx9_SzcPIwP_MAsDA6MQL3NXtxBvIwNzA_2CbEdFAOW90ZM!/?WCM_GLOBAL_CONTEXT=/wps/wcm/connect/MohCL/ministry/home/sahomegeneral/sageneralright/a_expanded+program+on+immunization.
Government of Punjab. 20132013]. Available from http://www.punjab.gov.pk/?q=search/node/population%20density.
Groom, A. V., M. L. Washington, P. J. Smith, and R. T. Bryan. 2008. Underimmunization of american indian and alaska native children. Pediatrics 121 (5) (May): 938-44.
Haddad, S., A. Bicaba, M. Feletto, E. Taminy, M. Kabore, B. Ouedraogo, G. Contreras, R. Larocque, and P. Fournier. 2009. System-level determinants of immunization coverage

166
disparities among health districts in burkina faso: A multiple case study. BMC International Health and Human Rights 9 Suppl 1 (Oct 14): S15.
Hayford, K. T., M. S. Shomik, H. M. Al-Emran, W. J. Moss, D. Bishai, and O. S. Levine. 2013. Measles vaccination coverage estimates from surveys, clinic records, and immune markers in oral fluid and blood: A population-based cross-sectional study. BMC Public Health 13 (1) (Dec 20): 1211,2458-13-1211.
Hull, B. P., and P. B. McIntyre. 2006. Timeliness of childhood immunisation in australia. Vaccine 24 (20) (May 15): 4403-8.
Jamil, K., A. Bhuiya, K. Streatfield, and N. Chakrabarty. 1999. The immunization programme in bangladesh: Impressive gains in coverage, but gaps remain. Health Policy and Planning 14 (1) (Mar): 49-58.
John, T. J. 2010. India's national technical advisory group on immunisation. Vaccine 28 Suppl 1 (Apr 19): A88-90.
Khan, Adnan, and Ayesha Khan. 2012. Validating measures of immunization coverage: Lessons from international experience. USAID’s Small Grants Program: Synthesizing Evidence for Policy and Action: Bridging the Gap between Knowledge and Results to Improve Health Outcomes, .
Lagarde, M., A. Haines, and N. Palmer. 2009. The impact of conditional cash transfers on health outcomes and use of health services in low and middle income countries. Cochrane Database of Systematic Reviews (Online) (4) (4) (Oct 7): CD008137.
Lim, S. S., D. B. Stein, A. Charrow, and C. J. Murray. 2008. Tracking progress towards universal childhood immunisation and the impact of global initiatives: A systematic analysis of three-dose diphtheria, tetanus, and pertussis immunisation coverage. Lancet 372 (9655) (Dec 13): 2031-46.
Liu, L., M. Li, L. Yang, L. Ju, and B. et al Tan. 2013. Measuring coverage in MNCH: A validation study linking population survey derived coverage to maternal, Newborn, and child health care records in rural china. PloS One.
Luman, E. T., L. E. Barker, M. M. McCauley, and C. Drews-Botsch. 2005. Timeliness of childhood immunizations: A state-specific analysis. American Journal of Public Health 95 (8) (Aug): 1367-74.
Luman, E. T., L. E. Barker, K. M. Shaw, M. M. McCauley, J. W. Buehler, and L. K. Pickering. 2005. Timeliness of childhood vaccinations in the United States: Days undervaccinated and number of vaccines delayed. JAMA : The Journal of the American Medical Association 293 (10) (Mar 9): 1204-11.
Luman, E. T., M. M. McCauley, S. Stokley, S. Y. Chu, and L. K. Pickering. 2002. Timeliness of childhood immunizations. Pediatrics 110 (5) (Nov): 935-9.
Luman, E. T., T. K. Ryman, and M. Sablan. 2009. Estimating vaccination coverage: Validity of household-retained vaccination cards and parental recall. Vaccine 27 (19) (Apr 28): 2534-9.
Masoud, H. 2011. Health policy: What does it mean in Pakistan? Policy actors' perspective. Masters thesis, Umea University Sweden.

167
Measure DHS. Data processing. 2013 [cited 05/29 2013]. Available from http://www.measuredhs.com/data/Data-Processing.cfm.
Miles, M., T. K. Ryman, V. Dietz, E. Zell, and E. T. Luman. 2013. Validity of vaccination cards and parental recall to estimate vaccination coverage: A systematic review of the literature. Vaccine 31 (12) (Mar 15): 1560-8.
Minh Thang, N., I. Bhushan, E. Bloom, and S. Bonu. 2007. Child immunization in Vietnam: Situation and barriers to coverage. Journal of Biosocial Science 39 (1) (Jan): 41-58.
Mitchell, S., N. Andersson, N. M. Ansari, K. Omer, J. L. Soberanis, and A. Cockcroft. 2009. Equity and vaccine uptake: A cross-sectional study of measles vaccination in lasbela district, Pakistan. BMC International Health and Human Rights 9 Suppl 1 (Oct 14): S7.
Mosley, W. H., and L. C. Chen. 2003. An analytical framework for the study of child survival in developing countries. 1984. Bulletin of the World Health Organization 81 (2): 140-5.
Murray, C. J., B. Shengelia, N. Gupta, S. Moussavi, A. Tandon, and M. Thieren. 2003. Validity of reported vaccination coverage in 45 countries. Lancet 362 (9389) (Sep 27): 1022-7.
Nuri, M., M. Hanif, and M. Khan, eds. 2011. Eighteenth amendment revisited. 1st ed. Islamabad, Pakistan: Islamabad Policy Research Institute (IPRI), Hanns SeidelFoundation (HSF) Islamaba.
Ouédraogo, N., M. Kagoné, A. Sié, H. Becher, and O. Müller. 2013. Timeliness and out-of-sequence vaccination among young children in Burkina Faso- analysis of health and demographic surveillance system (HDSS) data. International Journal of Tropical Disease & Health 3 (1): 45-56.
Oyo-Ita, A., C. E. Nwachukwu, C. Oringanje, and M. M. Meremikwu. 2011. Interventions for improving coverage of child immunization in low- and middle-income countries. Cochrane Database of Systematic Reviews (Online) (7):CD008145. doi (7) (Jul 6): CD008145.
Pakistan Ministry of Information and Broadcasting. 20062013]. Available from http://www.infopak.gov.pk/districtpk.aspx.
Pande, R. P., and A. S. Yazbeck. 2003. What's in a country average? Wealth, gender, and regional inequalities in immunization in India. Social Science & Medicine (1982) 57 (11) (Dec): 2075-88.
Pang, T., R. Sadana, S. Hanney, Z. A. Bhutta, A. A. Hyder, and J. Simon. 2003. Knowledge for better health: A conceptual framework and foundation for health research systems. Bulletin of the World Health Organization 81 : 815-20.
Phukan, R. K., M. P. Barman, and J. Mahanta. 2009. Factors associated with immunization coverage of children in Assam, India: Over the first year of life. Journal of Tropical Pediatrics 55 (4) (Aug): 249-52.
Planning Commission: Government of Pakistan. 2012. Health, nutrition and population: Annual plan 2012-13. Islamabad, Pakistan: Planning and Development Sector: Planning Commission, Government of Pakistan, .
Rainey, J. J., M. Watkins, T. K. Ryman, P. Sandhu, A. Bo, and K. Banerjee. 2011. Reasons related to non-vaccination and under-vaccination of children in low and middle income

168
countries: Findings from a systematic review of the published literature, 1999-2009. Vaccine 29 (46) (Oct 26): 8215-21.
Rosenthal, J., L. Rodewald, M. McCauley, S. Berman, M. Irigoyen, M. Sawyer, H. Yusuf, R. Davis, and G. Kalton. 2004. Immunization coverage levels among 19- to 35-month-old children in 4 diverse, medically underserved areas of the United States. Pediatrics 113 (4) (Apr): e296-302.
Ryman, TK, V. Diet, and KL Cairns. 2008. Too little but not too late: Results of a literature review to improve routine immunization programs in developing countries. Health Services Research 8 (134).
Salmon, D. A., M. J. Sotir, W. K. Pan, J. L. Berg, S. B. Omer, S. Stokley, D. J. Hopfensperger, J. P. Davis, and N. A. Halsey. 2009. Parental vaccine refusal in Wisconsin: A case-control study. WMJ : Official Publication of the State Medical Society of Wisconsin 108 (1) (Feb): 17-23.
Sanou, A., S. Simboro, B. Kouyate, M. Dugas, J. Graham, and G. Bibeau. 2009. Assessment of factors associated with complete immunization coverage in children aged 12-23 months: A cross-sectional study in nouna district, burkina faso. BMC International Health and Human Rights 9 Suppl 1 (Oct 14): S10.
Shaikh, S., T. M. Taj, A. Kazi, J. Ahmed, and Z. Fatmi. 2010. Coverage and predictors of vaccination among children of 1-4 years of age in a rural sub-district of Sindh. Journal of the College of Physicians and Surgeons--Pakistan: JCPSP 20 (12) (Dec): 806-10.
Shefer, A., P. Briss, L. Rodewald, R. Bernier, R. Strikas, H. Yusuf, S. Ndiaye, S. Wiliams, M. Pappaioanou, and A. R. Hinman. 1999. Improving immunization coverage rates: An evidence-based review of the literature. Epidemiologic Reviews 21 (1): 96-142.
Sherazi, ZS. 2013. Taliban militants announce "conditional support" for anti-polio drive. Dawn, 04/12/13, 2013.
Short Fabic, M., Y. Choi, and S. Bird. 2012. A systematic review of demographic and health surveys: Data availability and utilization for research. Bulletin of the World Health Organization 90 (8) (Aug 1): 604-12.
Sia, D., P. Fournier, J. F. Kobiane, and B. K. Sondo. 2009. Rates of coverage and determinants of complete vaccination of children in rural areas of burkina faso (1998-2003). BMC Public Health 9 (Nov 17): 416.
Sia, D., J. F. Kobiane, B. K. Sondo, and P. Fournier. 2007. Individual and environmental characteristics associated with immunization of children in rural areas in burkina faso: A multi-level analysis. Sante (Montrouge, France) 17 (4) (Oct-Dec): 201-6.
Solar, O., and A. Irwin. 2007. A conceptual framework for action on the social determinants of health.
Som, S., M. Pal, S. Chakrabarty, and P. Bharati. 2010. Socioeconomic impact on child immunisation in the districts of west bengal, india. Singapore Medical Journal 51 (5) (May): 406-12.

169
Suarez-Castaneda, E., L. Pezzoli, M. Elas, R. Baltrons, E. O. Crespin-Elias, O. A. Pleitez, M. I. de Campos, and M. C. Danovaro-Holliday. 2013. Routine childhood vaccination programme coverage, el salvador, 2011-in search of timeliness. Vaccine (Dec 4).
Sullivan, M. C., A. Tegegn, F. Tessema, S. Galea, and C. Hadley. 2010. Minding the immunization gap: Family characteristics associated with completion rates in rural ethiopia. Journal of Community Health 35 (1) (Feb): 53-9.
The World Bank. Pakistan | data. 01, 2011 [cited 01/27 2011]. Available from http://data.worldbank.org/country/pakistan.
Torun, S. D., and N. Bakirci. 2006. Vaccination coverage and reasons for non-vaccination in a district of istanbul. BMC Public Health 6 (May 5): 125.
United Nations Statistics Division. Indicators on income and economic activity. 12, 2010 [cited 01/27 2011]. Available from http://unstats.un.org/unsd/demographic/products/socind/inc-eco.htm.
Usman, H. R., S. Kristensen, M. H. Rahbar, S. H. Vermund, F. Habib, and E. Chamot. 2010. Determinants of third dose of diphtheria-tetanus-pertussis (DTP) completion among children who received DTP1 at rural immunization centres in pakistan: A cohort study. Tropical Medicine & International Health : TM & IH 15 (1) (Jan): 140-7.
Usman, H. R., M. H. Rahbar, S. Kristensen, S. H. Vermund, R. S. Kirby, F. Habib, and E. Chamot. 2010. Randomized controlled trial to improve childhood immunization adherence in rural pakistan: Redesigned immunization card and maternal education. Tropical Medicine & International Health : TM & IH (Dec 15).
Valadez J, Joseph, and Leisa Weld H. 1992. Maternal recall error of child vaccination status in a developing nation . American Journal of Public Health 82 : 120-2.
Van den Broeck, J., S. A. Cunningham, R. Eeckels, and K. Herbst. 2005. Data cleaning: Detecting, diagnosing, and editing data abnormalities. PLoS Medicine 2 (10) (Oct): e267.
Vance Dietz, "Epidemiology of the Unvaccinated Child: Systematic Review of the Peer-Reviewed Literature" 2009) (accessed 2011).
Wakadha, H., S. Chandir, E. V. Were, A. Rubin, D. Obor, O. S. Levine, D. G. Gibson, F. Odhiambo, K. F. Laserson, and D. R. Feikin. 2013. The feasibility of using mobile-phone based SMS reminders and conditional cash transfers to improve timely immunization in rural kenya. Vaccine 31 (6) (Jan 30): 987-93.
Waters, H. R., L. Dougherty, S. P. Tegang, N. Tran, C. S. Wiysonge, K. Long, N. D. Wolfe, and D. S. Burke. 2004. Coverage and costs of childhood immunizations in cameroon. Bulletin of the World Health Organization 82 (9) (Sep): 668-75.
WHO Department of Immunization, Vaccines and Biologicals. 2010. Global immunization data. , http://www.who.int/immunization_monitoring/Global_Immunization_Data.pdf.
WHO Department of Immunization, Vaccines and Biologicals, UNICEF Programme Division, Health Section. 2005. Global immunization vision and strategy 2006 - 2015. , http://www.who.int/vaccines-documents/DocsPDF05/GIVS_Final_EN.pdf.

170
WHO EMRO. Expanded program on immunization: Pakistan. 2013 [cited 05/29 2013]. Available from http://www.emro.who.int/pak/programmes/expanded-programme-on-immunization.html.
WHO Immunization Service Delivery. Expanded program on immunization. 2013 [cited 06/04 2013]. Available from http://www.who.int/immunization_delivery/en/.
Williams, I. T., J. D. Milton, J. B. Farrell, and N. M. Graham. 1995. Interaction of socioeconomic status and provider practices as predictors of immunization coverage in virginia children. Pediatrics 96 (3 Pt 1) (Sep): 439-46.
Wiysonge, Charles S., Olalekan A. Uthman, Peter M. Ndumbe, and Gregory D. Hussey. 2012. Individual and contextual factors associated with low childhood immunization coverage in sub-saharan africa: A multilevel analysis. PloS One 7 (5): e37905.
World Health Organization. Immunization profile - Pakistan. December, 2010 [cited 01/26 2011]. Available from http://apps.who.int/immunization_monitoring/en/globalsummary/countryprofileresult.cfm?C='pak'.

171
ADDITIONAL TABLES
Table 36 Adjusted odds ratios for individual and contextual characteristics of population with the receipt of third dose of DTP vaccine having received first dose of DTP vaccine in children aged 12 to 23months old using logistic regression analysis, Pakistan Demographic and Health Survey 2006 (Full model)
Predictors Odds Ratio
p-value 95% Confidence Interval
Province of residence Punjab REF.
Sindh 0.72
0.19 0.44 1.18 Khyber Pakhtunkhwa 1.03
0.92 0.56 1.92
Balochistan 1.16
0.72 0.51 2.64 Area of residence
Urban REF. Rural 1.05
0.85 0.61 1.81
Wealth Index Poorest and Poorer REF.
Middle, richer, richest 1.42
0.23 0.80 2.52 Household Head
Male REF. Female 1.08
0.83 0.53 2.22
Mother's Education No Education/primary _Secondary 2.42
0.01 1.30 4.50
Higher 3.26
0.00 1.76 6.02 Mother's Mean age 1.04
0.04 1.00 1.07
Sex of child Male REF
Female 0.85
0.43 0.56 1.28 Child's Immunization card
No Card REF. Yes, seen 9.13
0.00 4.01 ####
Yes, not seen 3.35
0.00 1.67 6.70 No longer have card 2.81
0.02 1.19 6.67

172
Table 37 Adjusted odds ratios for individual and contextual characteristics of population with the receipt of third dose of DTP vaccine having received first dose of DTP vaccine in children aged 12 to 23months old using logistic regression analysis, Pakistan Demographic and Health Survey 2006 (reduced model)
Predictors Odds Ratio
p-value 95% Confidence Interval
Province of residence
Punjab REF
Sindh 0.71
0.15 0.44 1.14
Khyber Pakhtunkhwa 1.05
0.89 0.57 1.93
Balochistan 1.16
0.71 0.52 2.59
Wealth Index
Poorest and Poorer REF
Middle, richer, richest 1.40
0.21 0.83 2.37
Mother's Education
No Education/primary REF
Secondary 2.40
0.01 1.29 4.44
Higher 3.26
0.00 1.77 6.01
Mother's Age
Mean age 1.04
0.04 1.00 1.07
Child's Immunization card
No Card REF
Yes, seen 8.99
0.00 3.86 9.88
Yes, not seen 3.30
0.00 1.63 6.67
No longer have card 2.79
0.02 1.18 6.59

173
Table 38: Adjusted association of individual and contextual level factors with possession of a vaccination (health) card as a record of vaccination history in children in Pakistan Demographic Health Survey, 2006-07
Odds ratio
t p-value
95% Confidence limits
Immunization card
No Card REF
Yes card seen 26.2 4.56 0.000 6.3 – 108.2
Yes not seen 15.8 3.82 0.000 3.8 – 66.1
No longer has card 9.3 2.85 0.005 2.0 – 43.9

Appendix 1: Urbanicity scale components and variables with their corresponding scores
Scale Components Urbanicity Variables Score Population size
1 – 500 1
501 – 1000 2 1001 – 2000 3 2001 – 4000 4 4001 – 6000 5 6001 – 8000 6 8001 – 10000 7 10001 – 15000 8 15001 – 20000 9 ≥ 20000 10 Maximum possible score 10 Population density (person per km2) 1 – 500 1 501 – 1000 2 1001 – 2500 3 2501 – 5000 4 5001 – 7500 5 7501 – 10000 6 10001 – 15000 7 15001 – 30000 8
30001 – 50000 9
≥ 50000 10 Total maximum score 10
Communications Cable television coverage 1 Television service 1 Any landline telephone service 3 Mobile telephone coverage 1 Public call office (PCO) 1 Post office 2 Total possible score 9
Transportation Motorized public transport 2 Non-motorized public transport 1 Total possible score 3 Education Facilities Primary school for boys 2

175
Primary school for girls 2 Secondary school for boys 2 Secondary school for girls 2 Total possible score 8 Health Services
Functioning basic health unit (BHU) 1 Rural health center (RHC) 2 Government dispensary 1
Functioning maternal and child health (MCH) center 1
Private doctor 2 Dispenser or compounder
Family welfare center/source of family planning 1 Hospital 3 Total possible score 11 Markets General store or shop 2 Medical store 1 Bank 5 Total possible score 8

176
Curriculum Vitae

NOOR SABAH RAKHSHANI Johns Hopkins University 3163 Pine Orchard Ln, Apt. 201 Bloomberg School of Public Health Ellicott City, MD 21042, USA Department of Health Policy and Management Cell: +1 443 248 2921 615 N. Wolfe Street E-mail: [email protected] Baltimore, MD 21205, USA [email protected]
EDUCATION
• DrPh November 2013 Health Care Management and Leadership Johns Hopkins University
• Masters in Public Health May 2008 Johns Hopkins University, USA
• MBBS December 1998 Graduate, Medicine and Surgery Balochistan University, Pakistan
WORK EXPERIENCE
• Community Medicine Resident December 2004 – September 2006 Aga Khan University, Pakistan
• HIV/AIDS and STI Prevention Officer October – November 2004 Central Female Prison, Karachi
• Medical Officer (In-Charge) Health Center December 2001—January 2003 Taraqee Trust, Quetta – Pakistan
• Medical Officer April 2001 – November 2001 Quetta Hospital, Pakistan
• Medical Officer March 1999 – March 2000 Sandemen Provincial Hospital, Pakistan
RESEARCH GRANTS
Principal Investigator • Project title: Time-dependent color changing vaccine reminder ankle bands
Grantee: Gates Foundation Grand Challenge Exploration Round 9, Phase I grant Project duration: November 2012-July 2014 Grant amount: USD 100,000
• Project title: Empowering Clients and Sensitizing Providers to Increase Uptake of Maternal and Neonatal Health Care Services: Design of a Social Accountability Model for Implementation in Balochistan, Pakistan Grantee: Research and Advocacy Fund Pakistan Project duration: June 2012- August 2013 Grant amount: GBP 271,290.40

2
RESEARCH EXPERINENCE • World Bank Institute
Concept note, Unnecessary Elective Surgeries and the Movement towards Universal Health Coverage in Middle Income Countries
• Designed Monitoring and Evaluation of Water and Sanitation Program and Survey Analysis for Save the Children (UK) DPR Korea.
• Survey of health care system to assess preparedness for HIV/AIDS in Karachi, Pakistan 2006.
OTHER EXPERIENCE • Consultant: World Bank Institute, Washington DC, USA, September 2011-June 2012
• Health Consultant: Save the Children (UK), DPR Korea, January 2007—April 2007.
• Health Officer: Short Term Contract, UNDP, DPR Korea, November 2006 —December 2006.
RESERCH PAPERS
• Factors associated with Up to Date (UTD) Immunization among children in Pakistan. Paper accepted for poster presentation at The 8th Conference on Global Health and Vaccination Research, Bergen Norway
• Contextual and individual determinants of DPT3 vaccination completion among children 12-23 months in Pakistan. Paper accepted for poster presentation at Academy Health 2012 Annual Research Meeting, Orlando, FL, USA.
• Factors associated with immunization initiation among children in Pakistan. Paper accepted for poster presentation at Academy Health 2012 Annual Research Meeting, Orlando, FL, USA
• A review of social accountability model use in health: the implications for Pakistan (manuscript
in preparation)
• Assessment of utilization and domains of quality in health care in Balochistan: analysis of Demographic health survey Pakistan (manuscript in preparation)
• Elective Surgeries in the Movement towards Universal Health Coverage - a Case Study of the Cesarean Delivery (manuscript submitted for publication)
• MPH Capstone Evaluation of Pakistan health care system preparedness to address the future challenges
• DrPH Thesis Immunization coverage in Pakistan: A comparative analysis of Pakistan demographic health surveys (2006 and 1990) and policy recommendations for future
FELLOWSHIPS AND AWARDS
• Policy Communication Fellow, Population Reference Bureau, Washington D.C, USA, 2011. • Higher Education Commission, Pakistan/ Fulbright Scholarship, 2008—present. • Fulbright Scholar 2007—08.
RESEARCH AND TEACHING INTERESTS
• Research: Strengthening supply and creating demand in health, health equity and leadership. • Teaching: Evidence based decision making by health policy makers.

3
• Frequent contributor to the Population Reference Bureau (PRB) Washington D.C., USA Researcher’s Blog
TEACHING
• Courses supported as teaching assistant at JHU • Quality in Medical Care, 1st terms 2010 and 2011. • Courses supported as teaching assistant at AKU • Epidemiology, WHO Primary Health Care Modules, First and second year medical students.
MISCELLANEOUS INFORMATION
• Programing Proficiency: Stata and TreeAge, MS Office • Languages: Urdu, Farsi (Native) English (Fluent) • Citizenship: Pakistan
REFERENCES
• Professor Laura Morlock (Academic Advisor) Department of Health Policy and Management, Johns Hopkins University Email: [email protected] Phone: 410-955-5315
• Professor Orin Levine
Director Vaccine Delivery, Gates Foundation, Seattle, WA Email: [email protected] Phone: 206-709-3112
• Associate Professor Saifuddin Ahmed
Department of Population, Family and Reproductive Health, Johns Hopkins University Email: [email protected] Phone 410-614-4952