A Response Surface Methodology for Probabilistic Life ... · A Response Surface Methodology for...
14
A Response Surface Methodology for Probabilistic Life Safety Analysis using Advanced Fire Engineering Tools CORNELIUS ALBRECHT, and DIETMAR HOSSER Institute of Building Materials, Concrete Construction, and Fire Protection Division of Fire Protection Engineering Technische Universität Braunschweig Beethovenstrasse 52 38106 Braunschweig, Germany ABSTRACT In the paper, we evaluate the reliability of a successful evacuation using a CFD fire simulation tool and an evacuation model. Obviously, it is not possible to perform Monte Carlo analysis in a reasonable amount of time because of the high computational costs. Hence, we utilize an adaptive response surface method based on moving least squares in order to compute the reliability. To further decrease the necessary number of numerical evaluations, a preceding sensitivity analysis yields information about the variance of the results and the relevance of the input parameters and hence helps to identify a surrogate model of optimal prognosis. The preliminary scan of the random space for the sensitivity analysis can also be used to obtain information about the approximate location of the design point so that further support points can be concentrated in this relevant area. Using this information for the subsequent reliability analysis leads to a faster convergence. The methodology described will be utilized to evaluate the reliability of a typical example in fire protection engineering. KEYWORDS: reliability, risk assessment, performance-based design, egress, life safety, CFD, ASET, RSET. INTRODUCTION Protection of the health and life of the occupants in case of a hostile fire is the main safety objective of Fire Protection Engineering. This objective is achieved by providing for a safe evacuation from the building before the various effects of the fire inflict casualties on the occupants. This requirement of successful evacuation is manifested in nearly all of today's fire codes in countries all over the world. In Germany, this objective is satisfactorily shown by complying with the deemed-to-satisfy prescriptive codes and standards which contain basic material and constructional requirements. Yet, architecture has become increasingly complex during the last decades as advancements in structural engineering as well as material sciences have made it possible to realize such buildings. On many occasions, these advancements have outrun the prescriptive requirements as large atria and other complex geometries cannot be realized in accordance with the codes. In such cases, shortcomings to the requirements are compensated for with so-called performance-based engineering methods as part of a holistic fire safety concept on an individual basis to maintain the required safety level. In a performance-based approach for life safety, the time needed for safe egress, known as required safe egress time (RSET), is compared to the time until untenable conditions are reached within the compartment, known as available safe egress time (ASET). The RSET is usually calculated by evacuation models which exist in different ranges of complexity. The ASET can be obtained by applying performance criteria which account for the various effects of the fire on the occupants, e. g. the height or the optical density or toxic effects of the smokeless lower air layer. The different fire effects are simulated using so- called zone or CFD models using representative fire scenarios and design fires which are derived from values for fire loads, fire spread velocity, heat release rate etc. These values are usually assumed as deterministic, even though they are subjected to major uncertainties. METHODOLOGY As the approach described above is usually applied using deterministic values of an uncertain variable, engineers tend to estimate values on the safe side and thus might end up with overly safe and expensive solutions. The aim of this paper is to compute the reliability of a safe evacuation using a CFD model and a FIRE SAFETY SCIENCE-PROCEEDINGS OF THE TENTH INTERNATIONAL SYMPOSIUM, pp. 1059-1072 COPYRIGHT © 2011 INTERNATIONAL ASSOCIATION FOR FIRE SAFETY SCIENCE / DOI: 10.3801/IAFSS.FSS.10-1059 1059
Transcript of A Response Surface Methodology for Probabilistic Life ... · A Response Surface Methodology for...

A Response Surface Methodology for Probabilistic Life Safety Analysis using Advanced Fire Engineering Tools
CORNELIUS ALBRECHT, and DIETMAR HOSSER Institute of Building Materials, Concrete Construction, and Fire Protection Division of Fire Protection Engineering Technische Universität Braunschweig Beethovenstrasse 52 38106 Braunschweig, Germany
ABSTRACT
In the paper, we evaluate the reliability of a successful evacuation using a CFD fire simulation tool and an evacuation model. Obviously, it is not possible to perform Monte Carlo analysis in a reasonable amount of time because of the high computational costs. Hence, we utilize an adaptive response surface method based on moving least squares in order to compute the reliability. To further decrease the necessary number of numerical evaluations, a preceding sensitivity analysis yields information about the variance of the results and the relevance of the input parameters and hence helps to identify a surrogate model of optimal prognosis. The preliminary scan of the random space for the sensitivity analysis can also be used to obtain information about the approximate location of the design point so that further support points can be concentrated in this relevant area. Using this information for the subsequent reliability analysis leads to a faster convergence. The methodology described will be utilized to evaluate the reliability of a typical example in fire protection engineering.
KEYWORDS: reliability, risk assessment, performance-based design, egress, life safety, CFD, ASET, RSET.
INTRODUCTION
Protection of the health and life of the occupants in case of a hostile fire is the main safety objective of Fire Protection Engineering. This objective is achieved by providing for a safe evacuation from the building before the various effects of the fire inflict casualties on the occupants. This requirement of successful evacuation is manifested in nearly all of today's fire codes in countries all over the world. In Germany, this objective is satisfactorily shown by complying with the deemed-to-satisfy prescriptive codes and standards which contain basic material and constructional requirements. Yet, architecture has become increasingly complex during the last decades as advancements in structural engineering as well as material sciences have made it possible to realize such buildings. On many occasions, these advancements have outrun the prescriptive requirements as large atria and other complex geometries cannot be realized in accordance with the codes. In such cases, shortcomings to the requirements are compensated for with so-called performance-based engineering methods as part of a holistic fire safety concept on an individual basis to maintain the required safety level.
In a performance-based approach for life safety, the time needed for safe egress, known as required safe egress time (RSET), is compared to the time until untenable conditions are reached within the compartment, known as available safe egress time (ASET). The RSET is usually calculated by evacuation models which exist in different ranges of complexity. The ASET can be obtained by applying performance criteria which account for the various effects of the fire on the occupants, e. g. the height or the optical density or toxic effects of the smokeless lower air layer. The different fire effects are simulated using so-called zone or CFD models using representative fire scenarios and design fires which are derived from values for fire loads, fire spread velocity, heat release rate etc. These values are usually assumed as deterministic, even though they are subjected to major uncertainties.
METHODOLOGY
As the approach described above is usually applied using deterministic values of an uncertain variable, engineers tend to estimate values on the safe side and thus might end up with overly safe and expensive solutions. The aim of this paper is to compute the reliability of a safe evacuation using a CFD model and a
FIRE SAFETY SCIENCE-PROCEEDINGS OF THE TENTH INTERNATIONAL SYMPOSIUM, pp. 1059-1072 COPYRIGHT © 2011 INTERNATIONAL ASSOCIATION FOR FIRE SAFETY SCIENCE / DOI: 10.3801/IAFSS.FSS.10-1059
1059

simple evacuation calculation. As a Monte Carlo simulation of a CFD model is not possible due to the high computational costs, a response surface method based on moving least squares was chosen to minimize the number of necessary solver evaluations.
To further decrease the necessary number of numerical evaluations a preceding sensitivity analysis yields information about the variance of the results and the relevance of the input parameters and hence helps to identify a surrogate model of optimal prognosis. The preliminary scan of the random space for the sensitivity analysis can also be used to obtain information about the approximate location of the design point so that further support points can be concentrated in this relevant area. Using this information for the subsequent reliability analysis leads to a faster convergence.
Sensitivity Analysis
In order to perform a sensitivity analysis of the variance of the input vs. the output variables, a preliminary scan of the random hyperspace has to be performed using all random variables considered. The points of the scan can either be chosen randomly or systematically, using common design of experiment (DoE) plans such as the Central Composite design [1]. The input data can then be linked to the corresponding output quantity and simple, global sensitivity analysis can be performed:
Correlation Analysis
A first analysis is performed to identify the significant contributors to explain the output variability. This is done by linear and rank correlation analysis and a subsequent test of the ijt -value against a chosen significance level / 2tα of the Student's distribution. If / 2| |ijt tα> the null hypothesis that there is no significant correlation is rejected in favor of the alternative hypothesis that a significant correlation occurs [2]. This test can mainly be used to identify the significant variables and the occurrence of a linear correlation or a rank correlation if the data is rank transformed [3].
Stepwise Regression
In order to find an optimal surrogate model, also interaction and correlation effects between the input parameters have to be considered in order to find the global contribution to the prediction accuracy of each variable. This is done by considering the adjusted coefficient of determination [2]
2 2 211 (1 ), [0,1]( 1)adj adj
nR R Rn k
−= − − ∈
− + (1)
of a simple linear and/or rank regression model where n is the number of samples and k the number of parameters so that (k + 1) denotes the degrees of freedom. R² is the coefficient of determination usually applied to larger datasets. 2
adjR penalizes for the number of variables when considering smaller datasets (such as a DoE).
The stepwise regression approach by Draper [4] uses this methodology by subsequently adding variables to the regression model and performing a global F-test as described in Ref. [2], looking at the change in the coefficient of determination ( 2
adjRΔ ) [5].
Applying these methods usually yields that a few variables are unimportant as they have no or very little effect on the variance of the output. Hence, for further analysis they can be chosen as a deterministic value by using i.e. the mean value. A variable and thus dimensional reduction of the reliability problem can significantly reduce the number of necessary solver evaluations in the design of experiment scheme. It should be noted that all variables to be removed should also be checked qualitatively before removal as the methods described above only provide a purely mathematical approach.
1060

Reliability Analysis
Surrogate Model
Reliability analysis will be carried out using a surrogate model which is deduced from the support point values of the design of experiment evaluations. Common response surface methods such as by Bucher [6] utilize least square regression to fit a polynomial model in the form
ˆ ˆ ˆ( , )f = = +x β y Hβ ε (2)
to the support points and subsequently uses the analytical equation found in first order reliability method (FORM) to evaluate the failure probabilities. Herein, H is a matrix of n functions and β̂ is a vector of n
free coefficients to be fitted by minimizing the error component ε [7]. β̂ can be found (proof omitted) by
1ˆ ( )T T−=β H H H y . (3)
The downside of this approach is that only global trends can be considered and information at the computationally expensive support points is only approximated. A very high order polynomial meets the interpolation conditions but tends to have an over-fitting effect between the supports [1].
The approach followed herein is a moving least square (MLS) approach which is based on an enhancement of the above concept of least squares by Lancaster and Salkauskas [8] by incorporating location information to increase the accuracy of the approximation. The approach utilizes a weighting of the Eucledian distance of each support point input vector xmi to the input parameters x of the evaluation point so that
( , ) (|| ||),i mi i miw w= −x x x x (4)
All weights are then compiled into a location dependent weighting matrix W(x) which can be introduced into Eq. 3 so that
1ˆ ( ) [ ( ) ] ( )T T−=β x H W x H H W x y . (5)
Unfortunately, this leads to a location dependency of the coefficients β̂ so that no closed-form global equation can be found. A MLS formulation has to be found for every evaluation point.
The weighting function described in Eq. 4 is a radial function which must be greater than zero, symmetric around the support point, and monotonically decreasing. Usually, cubic polynomials [9] or Gaussian curves [4] are utilized, but both do not fulfill the Kronecker-Delta properties
(|| ||)i mi ijw δ− ≈x x (6)
required for interpolation [10].
An approach outlined in Refs. [11,4] uses a nearly interpolating weighting function by introducing
1
(|| ||)(|| ||)
(|| ||)r mi
i mi mr mij
ww
w=
−− =
−∑x x
x xx x
(7)
1061

with
2 2(|| ||) (|| || ) , 1r mi miw ε ε−− = − +x x x x (8)
where ε is a regularization parameter to stabilize the problem numerically. In order to provide near-accurate solutions ε has to be chosen as small as possible, but within machine precision. An ε in the range of 10-5 is usually sufficient [4].
Adaptive Importance Sampling
As described above, the fitted coefficients of an MLS approach are now location dependent and thus no closed-form global expression is available. Hence, Proppe [12] recommends the use of adaptive importance sampling (AIS) instead of FORM. The basic idea is to reduce the variance ˆ
fpσ by introducing a weighting
function hx into a Monte Carlo simulation so that the sampling points are concentrated in the failure domain fΩ . hx is adapted in subsequent iteration steps by only considering the points that fell into the failure domain. Further adaptations of hx lead to a smaller variance and hence better results. AIS is described in detail in [13]. Ibidem, empirical sensitivity factors are derived by looking at the total shift of the mean vector in hx compared to the joint density function fx . The sensitivity of each variable can be regarded as the contribution to the total shift.
Adaptivity
As the reliability evaluation is performed using the surrogate model and not the real (CFD, evacuation) model, some inaccuracies between approximation and model can occur, especially for highly non-linear problems in the regions without close-by support points. Hence, in a next step the support points will be updated around the mean vector from that last adaptation of hx . These support points in the relevant region along with a smaller variance, also provided by hx , yield a very good approximation of the limit state hyper-surface so that usually only a few additional support points are necessary. The advantage of this approach is that all previous evaluations can be re-used in the next step surrogate design so that no “expensive” information is discarded. The local approximation quality in the failure area stays high due to the nearly-fulfilled interpolation conditions.
The difference between the iterations can be used as a convergence criterion. If the change in ,ˆ f ip is less than 2.5 % compared to , 1ˆ f ip − of the previous iteration step, the algorithm is terminated.
APPLICATION TO A FPE PROBLEM
In the following, the described methodology will be applied to a simple, but representative example from fire protection engineering. The main focus of the problem is to evaluate to reliability of a save evacuation from a simplified assembly room. This is usually shown if the RSET is smaller than the ASET so the limit state of the reliability problem can be simply taken as
ASET RSET( )g t t= −x (9)
which a failure domain ( ) 0f gΩ ≡ ≤x . Both times stem from an evacuation model and a CFD simulation, respectively, and will be evaluated with various random variables shown in the following.
Stochastic Model
Evacuation
Human behavior is not only highly subjected to uncertainties but also dependent on various parameters which, again, are dependent on the evacuation model used. Herein, we will use a simplified estimation
1062

method called ‘capacity model’ described in detail in [14]. The model assumes that a door has a certain outflow rate in the unit ‘persons per second per metre door width’. Hence, two important variables are the number of persons and the flow rate. The door width is considered deterministic, as requirements and standards for doors exist. Additional stochastic variables are the run time of the occupants from their starting point to the door and the pre-movement time. The latter denotes the time from the fire start until the occupants start evacuating.
Unfortunately, stochastic models rarely exist in the relevant literature and even deterministic values can be difficult to find. Table 1 shows the stochastic models used herein which are usually based on deterministic sources (given in Table 1) and an educated guess of the occurring variance, where it is usually assumed that the variables have a standard deviation of 10–20 % about the mean. For simplicity, all models are assumed to be normally distributed.
Table 1. Stochastic models and underlying references. All variables are assumed to be normally distributed.
Variable Mean Std. dev. Unit Based on Pre-movement time 60 12 s [15,16] Walking speed 1.2 0.12 m/s [14,15] Number of occupants 300 30 occupants [17,18] Outflow capacity 1.39 0.139 occ./m/s [17,14] Heat release rate 2.5 0.25 MW [19,20,21] Time to 1 MW (tg) 300 50 s [22–34] CO yield 0.1 0.02 g/g [25,26] Soot yield 0.05 0.01 g/g [25,26]
Fire Scenario
Similar difficulties occur finding stochastic models for a fire scenario. A common approach used herein is the so-called t-squared scenario where the heat release rate (HRR) increases quadratically in the fire growth phase. The growth rate is controlled by the time tg which denotes the time of the quadratic increase of the HRR until 1 MW. The growth stops when the maximum HRR is reached and then remains at a steady plateau. This scenario is schematically shown in Fig. 1.
The stochastic variables found in this scenario are the time to reach 1 MW and the HRR. The fire load controls the length of the fire and, therefore, is not relevant to the life safety scenario as that time is usually far greater than 20 minutes in which all evacuation processes of the fire compartment have to be completed [18]. The stochastic models are shown in Table 1.
Two additional parameters included are the yields for soot (ySoot) and carbon monoxide (yCO) which are values from the CFD model FDS [27] to control the smoke generation and the toxicity of the burning material.
Fig. 1. Schematic course of the HRR in the fire scenario.
1063

Thresholds for Untenability
When using performance-based methods for life safety design, thresholds have to be defined in order to establish a tenability limit in the fire simulation (ASET). These thresholds have been widely discussed in the literature such as [25,14,15]. Herein, we will use an optical density threshold of 0.1 m-1 and will also look at the combined cumulative exposure to toxic fire effluents (FED of 0.3). The definitions of these criteria can be found in detail in the literature cited above.
A subject to discussion is usually the location within the fire simulation where the threshold criteria is recorded. Usually this is done by looking at slice files in a height of 2.0 m or 2.5 m to incorporate some safety. If the tenability limit is qualitatively reached in the greater part of the compartment the ASET is set [28]. Herein, we use a less arbitrary strategy which also stabilizes the variance of the results. A volume of multiple CFD cells is chosen spanning about 5 m² and a height between 1.6 m and 2.0 m to account for various heights of the occupants. Subsequently, all cell values of the threshold criterion within the volume are averaged. This smoothes the data, which can be very noisy due to physical and numerical issues, to a certain evaluable level. Additional smoothing can be performed by using a time low pass filter like moving averages [10]. The optical density is recorded centrally in the compartment as people need orientation here. The toxicity levels are recorded near the exits. This is due to the fact that the toxicity levels will be reached later than the visibility threshold [29] and people are expected to be near the exits by then.
The RSET limit from the evacuation simulation is much easier to find and is said to be reached when the last occupant has left the compartment.
Scenario
The compartment considered is a simplified example of a 200 m² rectangular assembly room. In the design scenario, it is assumed that a fast growing (t-squared) fire develops in a bar during a reception with several occupants present. The room is in accordance with the German code for assembly buildings up to 200 m². Rooms larger than 200 m² require a smoke and heat exhaustion (SHE) system, so this example can be regarded as the worst case scenario for compartments smaller than 200 m². The room has two emergency exits on both sides, each with a required width of 1.2 m. The effect of a SHE system on the reliability is discussed later.
Optical Density
As the fire and evacuation simulation are not coupled they can be each regarded as self-contained models. Hence, a design of experiments using the central composite design was carried out independently with five variables for the CFD simulation and with four variables for the evacuation simulation as previously shown Table 1. Central composite design is a radial scan around the mean and is shown in Fig. 2 for two dimensions. The variable h is an arbitrary factor of the standard deviation σ which is chosen according to the estimated failure probability. As the MLS can be unstable in the extrapolated space it is advised to chose h rather large.
In total, 25 simulations had to be carried out for the fire simulation and 25 for the evacuation simulation. As the models are not coupled and no interaction between the simulations is needed, calculations can be carried out simultaneously on multiple machines or a high throughput (HT) cluster.
1064
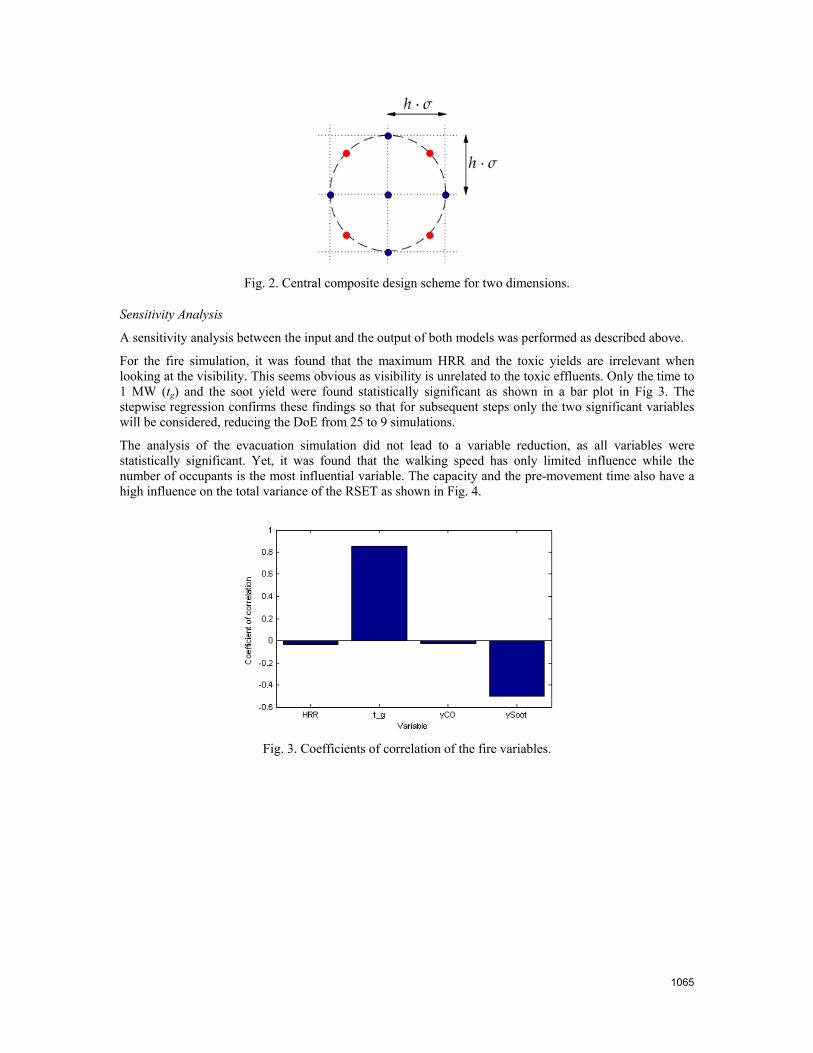
Fig. 2. Central composite design scheme for two dimensions.
Sensitivity Analysis
A sensitivity analysis between the input and the output of both models was performed as described above.
For the fire simulation, it was found that the maximum HRR and the toxic yields are irrelevant when looking at the visibility. This seems obvious as visibility is unrelated to the toxic effluents. Only the time to 1 MW (tg) and the soot yield were found statistically significant as shown in a bar plot in Fig 3. The stepwise regression confirms these findings so that for subsequent steps only the two significant variables will be considered, reducing the DoE from 25 to 9 simulations.
The analysis of the evacuation simulation did not lead to a variable reduction, as all variables were statistically significant. Yet, it was found that the walking speed has only limited influence while the number of occupants is the most influential variable. The capacity and the pre-movement time also have a high influence on the total variance of the RSET as shown in Fig. 4.
Fig. 3. Coefficients of correlation of the fire variables.
1065

Fig. 4. Coefficients of correlation of the evacuation variables.
Reliability Assessment
The surrogate model will be constructed for both fire and evacuation simulation using the response surface formulation described above. Even though a weighting matrix W(x) including all support points has to be constructed for every evaluation point; the assessment is very fast so that a high number of samples can be evaluated with the surrogate also leading to fast convergence of the AIS algorithm.
In a first step, random samples are drawn from the stochastic model using a random or pseudo-random number generator. The parameter sets are then fed into the surrogate to determine the response and subsequently evaluated with the AIS algorithm. Due to the high number of evaluation points on the surrogate and the high failure probability, a second step in AIS is not required in this calculation.
In a second step, a new design of experiments and thus additional support points are evaluated at the new mean and with the decreased variance of the adapted weighting function 2 ( )h x . Subsequently, an updated surrogate is constructed and a reliability analysis is carried out.
This process is repeated until the failure probability stabilizes, meaning that the difference between the current and the previous iteration is less than 2.5 %. The results of the iterations are shown in Table 2.
Table 2. Results of the optical density reliability assessment.
Surrogate # AIS # Error pf 1 1 -- 0.6683 2 1 0.0028 0.6664
Toxicity
All the steps applied for the visibility were repeated for assessment of the failure probabilities when a less conservative toxicity criterion is used instead of the visibility criterion. Usually, visibility criteria are used for life safety design as an optical density of less than 0.1 m-1 implies a very low level of toxic gases [14] and thus can be regarded as a very conservative criterion.
Looking at the toxicity will provide us with information about the implicit level of safety between the two criteria as toxicity thresholds can be regarded as an ultimate limit state. They imply that upon reaching the threshold level, the remaining occupants are in great danger of becoming unconscious and thus are likely be severely harmed or even die in the fire.
In order to reduce the necessary solver runs, the data from the first scan of the random space can be re-used as all variables were included. The data is simply evaluated for the new threshold and then can be analyzed with the methods described and applied above. As the evacuation simulations are not changed and all variables are included, all previously evaluated support points can be included in the analysis to provide a better surrogate accuracy right away.
1066

The sensitivity analysis for the fire simulation with regard to toxicity levels yields that the CO yield becomes relevant for this problem, while the soot yield falls below the significance bounds. This mathematical solution is also physically correct as the soot yield only accounts for smoke production while the CO yield is directly linked to the generation of toxic effluents. Again, the time to 1 MW (tg) is the most significant variable for the problem while the heat release rate can be neglected in this particular problem.
The reliability evaluation is a little more complicated as the AIS algorithm needs several iterations to converge on the first surrogate. Additionally, two surrogate adaptations are needed to converge as the probability of failure is very low in this problem. The iterations are shown in Table 3.
Table 3. Results of the FED reliability assessment.
Surrogate # AIS # Error pf 1 1 -- 2.68 × 10⁻⁷ 1 2 -- 7.55 × 10⁻⁷ 1 3 -- 7.01 × 10⁻⁷ 1 4 -- 6.97 × 10⁻⁷ 2 1 0.30 9.04 × 10⁻⁷ 3 1 0.02 9.22 × 10⁻⁷
In order to verify that the response surface method proposed has properly found the point of the highest probability density in the failure domain and to show the approximation capabilities of MLS, an additional evaluation of the fire and evacuation simulation was performed using the design point location obtained from the last AIS iteration. The fire simulation returned an ASET value of 256.2 s compared to an RSET value by the evacuation software of 254.5 s leading to a deviation from the theoretical design point (ASET = RSET) of only 1.7 s. The approximation values using the last surrogate (but without the design point evaluation) at the design point were 255.6 s for the fire simulation and 254.9 s for the evacuation simulation as shown in Table 4. Hence, it is assumed that the algorithm converged correctly with a very high accuracy of both, approximation accuracy and overall solution.
Table 4. Convergence of the reliability evaluation and the approximation quality.
Model (s) MLS (s) ΔMod.,MLS Evacuation 254.5 254.9 0.2 % Fire 256.2 255.6 0.2 % ΔASET,RSET 0.6 % 0.3 %
The sensitivity analysis based on the shift between the mean vector and the design point for the total problem is shown in Fig. 5 and strongly supports the results of the preceding sensitivity analysis. The most influential parameters for the toxicity evaluation are tg (67 %) and the number of occupants in the room (16 %), accounting for over 80 % of the variability.
Fig. 5. Relative sensitivities of all variables in the toxicity analysis.
1067

Conditional Probabilities
The failure probability found for the optical density seems very high considering a life safety analysis. Yet, the failure probabilities should always be regarded as conditional probabilities, as the hostile fire is not a regular event for a building to be designed for. To compare the safety level against, for example, structural integrity, one has to look at the reference period which for the latter is usually one year. Data given in [19,20] shows that for assembly facilities, the annual fire ignition probability is about 2-2 per year. Also considering a manual intervention of the occupants who control about 50 % of starting fires, the seemingly high failures probabilities per fire are nearly compliant with the usability requirements of [30] when referenced to the one year period as shown in Table 5. The results using the optical density as a criterion are in the same order of magnitude range as the findings of Magnusson et al. [16] who use a layer height threshold of 1.6 m.
Table 5. Comparison between failure probabilities considering the reference period and reliability index for one year.
pf per fire
pf,fi per year
Reliability index βfi
Visibility 0.6664 0.0067 2.5 Toxicity 9.2 × 10⁻⁷ 9.2 × 10⁻⁹ 5.6
The results for the toxicity assessment show that even the conditional probabilities per fire are lower than the ultimate limit state requirements from [30]. Considering the fire frequency and the manual intervention, the annual failure probability is in the range of the ultimate requirements of high risk buildings (βreq = 5.2) such as assembly facilities.
DIRECT CONSIDERATION OF FIRE PROTECTION MEASURES
The analyses above only consider the mentioned scenario using two different assumptions about the threshold criteria. Due to the low numerical costs, the methodology described also enables to perform a full system risk analysis of fire protection systems using event trees, as described in Refs. [31,32]. Previously, the failure probabilities for the various scenarios were based on parametric curves, on assumptions of the distribution of tg or the corresponding α, respectively [16,33].
Usually, the success of a fire protection measure leads to success of the life safety without further consideration, while a failure of all measures leads to failure also without further consideration of the actual scenario. The methodology proposed herein allows the direct consideration of the measures and the scenario using state-of-the-art numerical tools. This will be exemplary applied for a smoke and heat exhaustion system in the following sections.
Impact of a Smoke and Heat Exhaustion System
Herein, we want to show the impact of a smoke and heat exhaustion (SHE) system that is activated by a smoke detector which is located centrally in the fire compartment. The SHE system is modeled as one opening, also centrally located in the compartment with an area of 4 m² which is assumed to be fully available within 10 s after the smoke detector alarm. Conservatively, the stochastic model of the pre-movement time is not updated with the detection times coming from the smoke detector. The results of the SHE system scenario can be seen in Table 6.
Table 6. Results of the optical density reliability assessment with a SHE system installed.
Surrogate # AIS # Error pf 1 1 -- 0.2913 2 1 0.0154 0.2868
The results show that the SHE system decreases the failure probability by a factor of 2.3. This implies that installing a SHE system increases the life safety by a factor of greater than two when performing as
1068

designed. Yet, only considering the SHE system performs as designed might overestimate the level of safety reached as all technical system are subject to possible failure.
Hence, it is assumed that the SHE system has a probability of failure of 10 %. This number is based on Ref. [20] and not only considers that malfunction of the SHE system, but also the failure of the smoke detector, the wiring etc. More detailed analysis on these sub-systems can be performed in analogy to the event tree model but is omitted herein for the sake of simplicity. Further information on detailed modeling of the various fire protection systems can be found, i.e. in Ref. [34].
To consider the possible malfunction of the SHE system in a global risk analysis, an event tree is compiled as shown in Fig. 6. It is found that the total annual probability of the failure of smoke-free egress considering the possible malfunction of an SHE system is 0.0033 compared to 0.0029 if it is considered to always work as designed. Hence, the real benefit of the installation of the SHE system in this particular scenario is a factor of 2.0.
Fig. 6. Event tree for the consideration of malfunction of the SHE system.
Performing sensitivity analysis, the SHE system failure probability was varied (0.05–0.3) to determine the impact on the system failure probability in the given ranges above based on data from Ref. [20]. In this case, the system failure probability ranged from 0.003–0.004. Generalizing, the theoretical range between always performing (pf = 0) and never performing (pf = 1) obviously yields a system failure probability range from 0.0029–0.0067.
Factors for other fire protection measures such as sprinklers, fire detection systems etc. can also be derived by applying the methodology described and subsequently can be compared to find the most effective fire protection measure for the particular case. A consideration of the potential cost allows for a simple and effective cost-benefit analysis. Introducing consequences for the various scenarios derived in the event tree additionally allows for a quantitative risk-analysis as described in Refs. [33,36].
RESULTS AND DISCUSSION
The methodology presented allows for a very fast evaluation of the reliability using complex and numerically expensive computational models such as CFD tools with a very low number of necessary evaluations in comparison to other techniques such as Monte Carlo simulation. The advanced and quasi-interpolating surrogate model allows for a precise approximation of the real limit state hyper-surface without loss of information due to global approximation. This technique also allows for all support points to be included in every iteration and thus will not omit previously evaluated supports in consecutive iterations. It should be noted that the algorithm will work quite well for many models and is even capable of a good representation of complex and noisy limit state hyper-surfaces with the constraint that enough support points are present. The evaluation of support points is mostly limited by the high computational costs.
A fully risk-based evaluation and comparison of fire protection measures as well as the understanding of the whole fire protection system provides a crucial benefit for a more cost-effective and more risk-specific fire safety design. Utilizing state-of-the-art fire and evacuation models provides more accurate information about the life safety. A preceding sensitivity analysis yields valuable information about the variables with
1069

the most severe impact on the limit state and thus allows the designer to find the potentially most appropriate measures.
In conclusion, it should be noted that the results herein are based on very limited available data for the stochastic models and the system components; educated assumptions for some parameter uncertainties, distributions, and component failure probabilities had to be made as detailed data is currently missing. Yet, according to Hubbard [35] estimating distributions is more appropriate than estimating deterministic values, as more information is gained. The high impact of the fire initiation probability can be exploited in order to fulfill reliability requirements [30] as appropriate data is hard to obtain and highly varies. AHJs should be aware of this fact, when assessing probabilistic design proposals.
Correlation between the input variables (i.e. between the yields) was also omitted. Additionally, the t-squared fire scenario was utilized which is known to be rather conservative and toxicity assessment using CFD models is still constricted due to the limits of today’s pyrolysis modeling. Nevertheless, this approach proposes a method to assess probabilities based on complex models with reasonable numerical costs and can be used as a decision aid and optimization tool for future fire safety design.
A general transferability of the results found for the particular scenario herein cannot not be made as the probabilities found are closely connected to the stochastic model, the geometry, and the design fire used. The toxicity reliability is also rather high as the FEDs were recorded near the exits where an inflow of fresh air from the outside is present and might reduce the concentration of toxic effluents.
Additionally, it should be added that the FED model from the FDS simulation software [27] was used instead of the full model described by Purser [14]. The FED model built into FDS omits the consideration of hydrogen cyanide (HCN). HCN is known to have a toxic potential which is approximately 20 times higher than the toxic potential of CO. This also leads to the low failure probabilities. Including HCN will lead to far higher failure probabilities, as it can be seen in Ref. [29].
Yet, the analyses of multiple representative geometries and occupancies can yield some general information on the current safety levels and the most critical input variables and system components. Quantified values for generally acceptable safety levels and the corresponding maximum allowable (system) failure probabilities for probabilistic life safety analysis are still missing, even though first publications on the topic exist [33,36].
In the future, multiple scenarios will have to be investigated to assess the impact of fire protection infrastructure such as fire detection systems or sprinklers. This allows for a complete evaluation of an event tree to identify critical paths based on state-of-the-art models. Additionally, new input data can be incorporated and existing data can be updated with secondary outcomes of the previous simulations. Herein, the times until the smoke detectors alert were recorded and will be used for future considerations of the pre-movement time.
REFERENCES
[1] Forrester, A.I.J., Sobester, A., Keane, A.J., Engineering Design via Surrogate Modelling, John Wiley & Sons Ltd, Chichester, UK, 2008.
[2] Mendenhall, W., Sincich, T., A second course in statistics - Regression Analysis (5th ed.), Prentice-Hall, Inc., Upper Saddle River, NJ, 1996.
[3] Schwieger, V., Nicht-lineare Sensitivitätsanalyse gezeigt an Beispielen zu bewegten Objekten, Verlag der Bayerischen Akademie der Wissenschaften in Kommision beim Verlag C. H. Beck, Stuttgart, 2005.
[4] Most, T. and Bucher, C., (2008) New concepts for moving least squares: An interpolating non-singular weighting function and weighted nodal least squares, Engineering Analysis with Boundary Elements 32(6): 461-470. http://dx.doi.org/10.1016/j.enganabound.2007.10.013
[5] Most, T., Will, J., “Meta-model of Optimal Prognosis - An automatic approach for variable reduction and optimal meta-model selection,” Proceedings of the Weimar Optimization and Stochastic Days 5.0, Dynardo Software and Engineering GmbH, 2008.
1070

[6] Bucher, C., (1990) A fast and efficient response surface approach for structural reliability problems, Structural Safety 7(1): 57-66. http://dx.doi.org/10.1016/0167-4730(90)90012-E
[7] Draper, N., Smith, H., Applied Regression Analysis (3rd ed.), John Wiley & Sons Inc., Hoboken, NJ, 1998.
[8] Lancaster, P., Salkauskas, K., (1981) Surfaces generated by moving least squares methods, Mathematics of Computation 37(155): 141-141. http://dx.doi.org/10.1090/S0025-5718-1981-0616367-1
[9] Kunle. M., Entwicklung und Untersuchung von Moving Least Square Verfahren zur numerischen Simulation hydrodynamischer Gleichungen, Department of Physics, Eberhard-Karls-Universität zu Tübingen, Tübingen, 2001.
[10] Bronstein, I.N., Semendjajew, K.A., Musiol, G., Mühlig, H., Taschenbuch der Mathematik (7th ed.), Wissenschatflicher Verlag Harri Deutsch GmbH, Frankfurt, Germany, 2008.
[11] Bucher, C., Computational Analysis of Randomness in Structural Mechanics, Taylor & Francis Group, London, UK, 2009.
[12] Proppe, C., (2008) Estimation of failure probabilities by local approximation of the limit state function, Structural Safety 30(4): 277-290. http://dx.doi.org/10.1016/j.strusafe.2007.04.001
[13] Bucher, C., (1988) Adaptive sampling — an iterative fast Monte Carlo procedure, Structural Safety 5(2): 119-126. http://dx.doi.org/10.1016/0167-4730(88)90020-3
[14] Purser, D.A., “Toxicity Assessment of Combustion Products,” SFPE Handbook of Fire Protection Engineering (3rd ed.), Fire Protection Association (NFPA), Quincy, MA, 2002.
[15] Tubbs, J.S., Meacham, B., Egress Design Solutions – A guide to Evacuation and Crowd Management Planning, John Wiley & Sons, Inc., Hoboken, NJ, 2007.
[16] Magnusson, S., (1996) Fire safety design based on calculations: Uncertainty analysis and safety verification, Fire Safety Journal 27(4): 305-334. http://dx.doi.org/10.1016/S0379-7112(96)00050-1
[17] IS-Argebau, “MVStättV. Musterverordnung über den Bau und Betrieb von Versammlungsstätten (German Assembly Building Code),” IS-Argebau, Germany, 2005.
[18] Mehl, F., “Richtlinien für die Erstellung und Prüfung von Brandschutzkonzepten,” Praxisseminar Brandschutz bei Sonderbauten, Institut für Baustoffe, Massivbau und Brandschutz, Braunschweig, 2004.
[19] Albrecht, C., Hosser, D., "A risk-informed framework for performance-based structural fire protection according to the Eurocode fire parts," Proceedings of the 12th International Conference on Fire Science and Engineering (InterFlam 9), Interscience Communications, 2010.
[20] British Standards Institution (BSI), “BS7974. Application of fire safety engineering principles to the design of buildings. Code of practice. Part 7: Probabilistic risk assessment,” British Standards Institution (BSI), United Kingdom, 2001.
[21] JCSS, “JCSS Probabilistic Model Code – Part 2: Load models, Section 2.20: Fire,” Joint Committee on Structural Safety, Switzerland, 2001.
[22] Hasofer, A., (2002) Response surface modelling of Monte Carlo fire data, Fire Safety Journal 37(8): 772-784. http://dx.doi.org/10.1016/S0379-7112(02)00028-0
[23] Notarianni, K., The Role of Uncertainty in Improving Fire Protection Regulation, Carnegie Mellon University, Pennsylvania, 2000.
[24] Holborn, P., Nolan, P., and Golt, J., (2004) An analysis of fire sizes, fire growth rates and times between events using data from fire investigations, Fire Safety Journal 39(6): 481-524. http://dx.doi.org/10.1016/j.firesaf.2004.05.002
1071

[25] Bansemer, B., Ein Modell zur szeanrioabhängigen Beurteilung der Rauchgastoxizität, Bergische Universität Wuppertal, Wuppertal, 2004.
[26] Tewarson, A., “Generation of Heat and Gaseous, Liquid, and Solid Products in Fires,” SFPE Handbook of Fire Protection Engineering, Society of Fire Protection Engineers, Quincy, MA, 2008.
[27] McGrattan, K., Hostikka, S., Floyd, J., Baum, H., Rehm, R., Mell, W., McDermott, R., “Fire Dynamics Simulator (Version 5) – Technical Reference Guide,” NIST, Fire Research Division, Gaithersburg, MD, 2009.
[28] Mahlmann, C., “Grundlagen und Beispiele zur Umsetzung leistungsorientierter Brandschutzkonzepte mittels Ingenieurmethoden,” Tagungsband zur 23. Fachtagung Brandschutz – Forschungs und Praxis (Braunschweiger Brandschutztage 2009), Institut für Baustoffe, Massivbau und Brandschutz, Braunschweig, 2009.
[29] Albrecht, C., Hosser, D., “Probabilistic Assessment of Performance Criteria for Egress Design,” Proceedings of the 7th International Probabilistic Workshop, Gelder, Prokse, Vrijling (Eds.), 2009.
[30] GruSiBau, “Zur Festlegung von Sicherheitsanforderungen für bauliche Anlagen,” GruSiBau, Germany, 1981.
[31] Hasofer, A., Beck, V., Bennetts, I., Risk Analysis in Building Fire Safety Engineering, Butterworth-Heinemann (Elsevier Science), Burlington, MA, 2007.
[32] Yung, D., Principles of Fire Risk Assessment in Buildings, John Wiley & Sons, Ltd., West Sussex, UK, 2008.
[33] Tanaka, T., (2009) Risk-Based Selection of Design Fires to ensure an Acceptable Level of Evacuation Safety, Fire Safety Science 9: 49-61. http://dx.doi.org/10.3801/IAFSS.FSS.9-49
[34] Fitzgerald, R.W., Building Fire Performance Analysis, John Wiley & Sons Ltd., Chichester, UK, 2004.
[35] Hubbard, D.W., The Failure of Risk Management: Why It’s Broken and How to fix It, John Wiley & Sons Inc., Hoboken, NJ, 2009.
[36] Tanaka, T., "A study on Risk-based Evacuation Safety Design Method in Fire for Office Buildings," Proceedings of the 12th International Conference on Fire Science and Engineering (InterFlam 9), Interscience Communications, 2010.
1072