A research report by IPPR North For Shropshire Council ...
47
1 Building an economic vision for Shropshire A research report by IPPR North For Shropshire Council November 2016
Transcript of A research report by IPPR North For Shropshire Council ...

1
Building an economic vision for Shropshire
A research report by IPPR North
For
Shropshire Council
November 2016

2
Contents
1. Vision Statement ............................................................................................................................ 3
Background ......................................................................................................................................... 3
The four components for Shropshire’s economic future .................................................................. 4
2. Context ........................................................................................................................................... 5
2.1. Research Context .................................................................................................................... 5
2.1.1. Research Objectives ....................................................................................................... 5
2.1.2. Methodology ...................................................................................................................... 5
2.2. About Shropshire.................................................................................................................... 6
2.2.1. Background ..................................................................................................................... 6
2.2.2. Policy Context ....................................................................................................................... 7
2.2.2. Devolution .................................................................................................................... 11
3. Understanding Shropshire’s economy ........................................................................................ 12
3.1. Overview ............................................................................................................................... 12
3.2. Demography ......................................................................................................................... 13
3.2.1. Demography: Implications ........................................................................................... 15
3.2.2. Attracting and retaining younger people .................................................................... 17
3.3. Growth and productivity ...................................................................................................... 18
3.3.1. Growth and Productivity: Implications ....................................................................... 21
3.4. Labour Market ...................................................................................................................... 22
3.4.1. Labour Market: Implications ........................................................................................ 26
3.5. Sectoral Composition ........................................................................................................... 27
3.5.1. Sectoral Composition: Implications ................................................................................... 29
3.6. Skills ...................................................................................................................................... 31
3.6.1. Skills: Implications .............................................................................................................. 33
3.7. Education .............................................................................................................................. 34
3.7.1. Education: Implications ................................................................................................ 37
4. Developing an economic vision for Shropshire ............................................................................... 39
4.1. Case for Change ......................................................................................................................... 39
4.2. Foundations for Change ............................................................................................................ 40
4.2.1 Place .............................................................................................................................. 41
4.2.2 People ........................................................................................................................... 43
4.2.3 Private Sector ............................................................................................................... 44
4.2.4 Public Services .............................................................................................................. 45

3
1. Vision Statement
A Vision for Shropshire
By 2030 Shropshire can be a world-leading rural economy.
With its dynamic and diverse workforce, cutting-edge capabilities in
agritech and digihealth, and as an area of outstanding natural
beauty, well-connected to the Midlands Engine, there is no good
reason for it not to flourish in post-brexit Britain.
With the right ambition, strategy and leadership, Shropshire will be a
case study in England’s modern industrial strategy.
Background IPPR North was commissioned by Shropshire Council and the University of Chester to develop a new
economic vision for Shropshire’s economy in the future. Our study has involved some new economic
analysis; it has considered some of the existing strategies of Shropshire Council and the Marches
Local Enterprise Partnership; and we have held a series of roundtables with key stakeholders from
around the county.
Our study has identified a series of key opportunities and challenges for economic growth including:
Proportionately high rates of ageing in comparison with neighbouring areas and with
England as a whole, with implications for health and social care costs but opportunities to
unlock the potential of this relatively affluent and active population group through
developments such as digi health;
Relatively low productivity but with a higher employment rate and higher gross disposable
household income compared with surrounding areas;
Good economic linkages with neighbouring areas and a diverse business base but with
significant dependency on agriculture, tourism and manufacturing which have lower
productivity levels than many sectors;
A relatively well-skilled labour force in comparison with neighbouring areas and the UK
average with good school performance but challenges concerning graduate retention and
skill shortages in specific service sectors.
Further details of our analysis are available in a separate report.

4
The four components for Shropshire’s economic future
The vision for Shropshire’s economic future centres on four areas: place, people, private businesses
and public services. Shropshire has unique strengths in each of these areas, but the county also faces
challenges looking towards the future. By building on its strengths and taking concrete steps to
mitigate challenges, citizens, businesses and the public sector can work together to build a
prosperous and sustainable economy that works for the people of Shropshire.
Figure 1: Components of Shropshire's vision
Details of this vision and the subsequent recommendations are set out in a separate report. This
report sets out the background analysis that underpins this vision.

5
2. Context
IPPR North was commissioned by Shropshire Council and the University of Chester to develop a new
economic vision for Shropshire’s economy in the future. Firstly, there was an increasing appetite
within Shropshire, alongside its partners in the Marches LEP area to secure a devolution settlement
from Central Government which would provide the area with greater responsibility for devolved
powers. A key component of the LEP’s offer was to work together to tackle the challenges that
potentially curtail the growth potential of the area.
Secondly, there was a recognition that Shropshire needed to understand its specific role and
economic position within the Marches LEP and beyond so as to be able to inform the work of
economic development and planning in the county and future policy priorities.
Thirdly, as a non-constituent member of the West Midlands Combined Authority (WMCA), there
was some recognition that Shropshire should begin to articulate a vision that could influence the
discourse surrounding West Midlands devolution and the Midlands Engine more broadly.
Discussants were particularly keen that Shropshire’s interests were properly articulated so that they
could be adequately represented in future discussions with WMCA and central Government about
the Northern Gateway, Midlands Connect, the Midlands Engine and similar themes.
2.1. Research Context
2.1.1. Research Objectives
This research has two main objectives:
Facilitate the development of a new economic vision for Shropshire which can be used to
help unlock the potential opportunities of the Government’s devolution agenda
Investigate Shropshire’s ‘economic offer’ within the Marches’ LEP and how this can be
supported through existing policy mechanisms and governance structures.
To investigate these objectives, IPPR North has addressed a number of key questions including:
Strength of Shropshire’s economic offer both now and in the future
Identification of the area’s key vulnerabilities and opportunities
Potential growth sectors for Shropshire longer term
Functional economic geography and relationship with labour markets and industry in
neighbouring towns and cities
2.1.2. Methodology
IPPR North have approached this research by using a 3 stage methodology
Stage 1: Economic Analysis:
There have been a number of recent studies examining the economy both in the Marches LEP and in
Shropshire which have generated substantial amounts of quantitative data. Most recently,
Regeneris have produced a report which refreshes the LEP’s Strategic Economic Plan and Oxford
Economics are in the process of developing a number of future scenarios for Shropshire Council
which will look at the potential opportunities for economic growth longer term. IPPR has taken this

6
available data and working with Shropshire Council have analysed the data in the context of
Shropshire, providing a fresh analysis to inform the Council’s strategy.
Stage 2: Discussion groups:
As well as reviewing the existing quantitative evidence base about Shropshire’s economy, this
research has attempted to generate fresh qualitative data to inform the economic vision for the
future. This has involved a series of discussion groups both within Shropshire Council and with
partners in the voluntary/community and private sector. These discussion groups have focused on
identifying some of the key strengths and weaknesses of the Shropshire economy and the main
opportunities for the future. The findings from these discussion groups have been written up and
key trends identified (see Appendix 1 for a list of consultation events)
Stage 3: Reporting and lecture
Production of a short report to summarise the main findings of the research and putting forward a
proposal, with justification, as to the future economic vision for Shropshire. This will be used by
Shropshire Council to develop a revised economic growth strategy.
As part of the reporting outputs, IPPR North will also deliver a lecture in Shrewsbury. This lecture
will present the findings of this research and the proposed vision for Shropshire.
2.2. About Shropshire
2.2.1. Background
Shropshire has a population of 311,380, (approximately 50% male and female1) and is the largest
inland council in England. The area is mainly rural area with a low density population. There are just
97 people per square km, compared with 353 people per square km in England as a whole (excluding
London). Being rural in character presents Shropshire with a range of distinct challenges for
business which include connectivity to markets, provision of infrastructure such as public transport
and broadband, access to public services and potentially higher energy costs. However, it’s rurality
also means that Shropshire has a high quality environment, including the Shropshire Hills AONB, and
is therefore sought after by tourists and new residents, who are attracted by the area’s heritage and
natural beauty. Figure 1 below provides a map of the Shropshire Council area showing its
relationship with neighbouring authorities.
The administrative area of Shropshire completely encircles the neighbouring authority of Telford and
Wrekin and economic linkages between the two areas are strong, particularly in terms of labour and
housing markets. Telford is a new town, built in the 1960s and home to 86%2 of Telford and Wrekin’s
169,400 residents3
Unlike other parts of the UK, Shropshire does not include a city within its catchment. Shrewsbury is
the largest town and regional centre with a population of approximately 71,000. Beyond this there
is what might be understood as a network of smaller market towns and key centres which range in
1 ONS Mid-Year Population Estimates 2015 2 Telford and Wrekin Local Plan 2016-2031 available from file:///C:/Users/s.longlands/Downloads/A1_Telford_and_Wrekin_Local_Plan_2011_2031___Submission_Version_Low_Res.pdf 3 Telford Fact and Figures available from: http://www.telford.gov.uk/info/20121/facts_and_figures/410/population_characteristics

7
population size from Craven Arms with a population of just over 2,000 to Oswestry with a population
of over 17,000. These smaller towns provide a focus for community and business activity and in
many areas, community organisations, parish councils and businesses are playing an active part in
operating services, previously undertaken by Shropshire Council, for example, the delivery of leisure
and youth services.
Figure 2: Map of Shropshire showing principle roads (in red) AONB (hatched lines) and greenbelt (xx).
Source: Shropshire Council Local Development Framework (2011).
2.2.2. Policy Context
Marches LEP
The Marches Local Enterprise Partnership (LEP) plays a key role in co-ordinating economic
development in the area and incorporates Shropshire, Herefordshire and Telford and Wrekin within
its sub regional geography. In line with national policy, the LEP has developed a Strategic Economic
Plan (SEP)4 for the sub-region and this identifies an overall vision for the Marches LEP area and a
number of key priorities, shown below on table 1:
Table 1: Vision and Strategic priorities of the Marches LEP
4 Available from the LEP website: http://www.marcheslep.org.uk/download/economic_plans/strategic_economic_plan/Marches%20LEP%20SEP%20FINAL310314-2.pdf

8
The Marches LEP Vision
“A strong, diverse and enterprising business base, operating in an exceptional and connected
environment, where the transfer of technology and skills foster innovation, investment and
economic growth.”
The Marches LEP Strategic priorities
Supporting Business: Create an exceptional business support environment for aspiring growth
businesses through access to finance and incentives to innovate. We will promote the Marches as a
business investment location
Physical Infrastructure: Business investment offer with a progressive planning framework and
infrastructure fit for tomorrow’s business needs
Skills Investment: support employers to develop themselves and their workforce and to provide
employment opportunities for young people.
Low carbon economy: Facilitate the transition to a high value, low carbon economy, maximising the
opportunity in new technologies, reducing environmental costs to business and recognising our
environment as an economic asset.
Social inclusion: Support socially excluded and marginalised groups by removing barriers to their
participation in activities that will improve their economic well-being.
The LEP has set a target of creating 70,000 new homes and 40,000 new jobs by 2031 and has
identified six key areas for future intervention as shown in figure 2 below.
Figure 3: Six key areas for future intervention (adapted from the SEP 2014)
Speed up delivery on ready to go land
Speed up housing completions
Invest in infrastructure
Support SMEs and encourage entrepreneurialism
Retain major employers and attract further investment
Create a skills framework to deliver the best people for employment, linked to the Marches Skills Plan

9
The Marches LEP commissioned research to refresh its economic plan in 2015-165 and this work
identified a number of key economic opportunities and strengths across the sub-region:
‘Ready to go land’ (particularly employment land in Telford). Residential developers cited in
the SEP include Barratts, Taylor Wimpey and Persimmon.
Urban ‘powerhouses’ identified as Shrewsbury, Telford and Hereford – which provide a
critical mass of population and business as well as Opportunity towns identified as: Ross on
Wye, Craven Arms, Oswestry and Whitchurch
Strong Business base in marches with key strengths in agriculture, advanced manufacturing,
food and drink and defence as well as the opportunity to develop new ‘centres of
excellence’ in the area, for example, local carbon technologies.
Attractive area for investment – strong enterprise culture, low wages, attractive
environment and a good supply of development land
Well located – adjacent to the West Midlands, Northern Powerhouse and Wales with
potential access to European markets in Ireland.
Higher than average employment rates – particularly in Shropshire where 85% of the
working age population are active compared with 75% in the West Midlands and 78%
nationally.
Central location with good access to national road and rail network
This refresh of the economic evidence base identifies the two ‘central challenges’ for the Marches
economy as:
GVA Challenge - a growing Gross Value Added (GVA) gap, between the Marches sub-region
and the West Midlands and the rest of the UK. This, it is suggested is as a result of below
average skills and under-representation of economic activities which contribute significantly
to GVA
Demographic challenge as a result of an ageing population, to maintain the working age
population which is required to meet projected demand for labour in the future.
West Midlands Combined Authority
The economy of Shropshire is also influenced by its proximity to the Birmingham City Region and to
this end, Shropshire and the Marches LEP are now non-constituent members of the West Midlands
Combined Authority (WMCA). The West Midland’s Combined Authority has identified a number of
priorities in its SEP6
1. New manufacturing economy: harnessing the biggest concentrations of high value
manufacturing businesses in Europe and their supply chains.
2. Creative and digital: further developing the area’s vibrant and flourishing sector.
3. Environmental technologies: securing transformational environmental improvements.
5 Regeneris (2016) The Marches Economic Plan Evidence Refresh Report. A Draft Report by Regeneris Consulting 6 West Midlands Combined Authority SEP available from: https://westmidlandscombinedauthority.org.uk/media/1238/final-making-our-mark.pdf

10
4. Medical and life sciences: enabling the further growth of the medical and life sciences
sector and supporting other businesses to diversify and become part of the sector’s supply
chain.
5. HS2 growth: maximising the benefits of the largest infrastructure project in Europe.
6. Skills for growth and employment for all: ensuring the skills needs of businesses are met
and everybody can benefit from economic growth.
7. Housing: accelerating the delivery of current housing plans to increase the level of house
building to support increased level of growth.
8. Exploiting the economic geography: making the most of the scale and diversity of the West
Midlands’ geography to enable economic growth and community wellbeing throughout the
urban core and rural areas.
The economy of Shropshire is also likely to be influenced significantly by the decision to leave the EU
during the recent Brexit vote7. Whilst the UK Government have pledged to maintain the rate of
agricultural subsidy until 2020, there is uncertainty about what the longer term funding settlement
will be as well as ambiguity about the impact of any withdrawal from the single market, something
highlighted by the Agra Europe8 as a particular concern for the food and drink market as well as the
implications of a curtailing of freedom of movement for the agricultural labour market.
Shropshire’s Economic Strategy 2012
Shropshire’s previous Economic Strategy was published in 2012. The economic vision at this time
was:
‘Shropshire’s Economy is sustainable and businesses are competitive and resilient’9
Where:
People in Shropshire have access to better paid and more secure and satisfying employment,
including self-employment in their local area with a reduction in long term unemployment
Local workforce will possess the skills and knowledge required for work and be able to
access training to gain new skills that match the needs of employers
Shropshire will be recognised as a great place to live, work, invest and visit.
This strategy had a number of key priorities:
Accelerating business growth
Infrastructure for Growth
Stimulating our growth sectors
Our skilled and loyal workforce
Shropshire’s Corporate Strategy
Earlier this year, Shropshire Council has published its corporate strategy which provides
the strategic framework for the Council’s work in the future10. This, in association with the
7 Shropshire voted to leave the EU with a majority of 57% 8 Report available here: https://store.agra-net.com/reports/eu15.html 9 Shropshire Council (2012) Shropshire’s Economic Growth Strategy 10 Available here: http://shropshire.gov.uk/committee-
services/documents/s12604/6%20Appendix%20DRAFT%20SC%20CorpPlan%20July16%20R28%20LR.pdf.

11
financial strategy outlines the Council’s main outcomes and areas of work that are being
taken forward in the coming years. This is based on consultation with the public in
Shropshire including surveys, face to face discussions and discussions via partners. One of
the outcomes from this discussion was the need to generate new income and grow
business. In particular, businesses argued that there were three main factors required for
future economic growth:
Improving broadband connectivity and connecting communities without
broadband
Creating better linkages between businesses and University Centre Shrewsbury
Encouraging further involvement of business in local decision making and ensure that the
council and its partners are working together.
The corporate strategy makes reference to the council’s plans to develop a new economic vision to
‘set the direction for economic growth for years to come’.
Shropshire Local Plan
Another important policy context for economic growth is local planning policy because it is one of
the main mechanisms used by the council to influence local land markets, ie by releasing land for
employment or residential land use.
In 2011, Shropshire published the Core Strategy of their Local Development Framework (LDF) the
principle document setting out the spatial vision for Shropshire until 2026. A Site Allocations and
Management of Development Plan (SAMDev11) was also produced in 2015 which set out the
proposals as to how land should be used (both for employment and residential) up until 2026. This
was found ‘Sound’ following examination by the Planning Inspectorate. However, following the
publication of the National Planning Policy Framework (NPPF) in 2012, like all Councils, Shropshire is
required to update their LDF (now known as the ‘Local Plan’) so that it is compliant with the NPPF.
Currently, a partial review of the Local plan is now under way and expected to publish in 2018. The
SAMDev sets a target of delivering 27,500 new homes by 2026.
2.2.2. Devolution
As well as working with the WMCA, Shropshire, in partnership with its neighbouring authorities has
also been in discussions with the Cities and Local Growth Unit at DCLG about the opportunities for
greater decentralisation to the sub-region. A joint document outlining the asks and offers of the local
authorities was circulated in May 2016 and options for different devolution models and alliances are
currently being discussed.
11 Available here: https://shropshire.gov.uk/media/1900363/SAMDev-Adopted-Plan.pdf

12
3. Understanding Shropshire’s economy
3.1. Overview
In the discussion groups, participants were asked to identify what they believed to be the main
strengths, weaknesses, opportunities and threats to the Shropshire economy now and in the future.
A number of common ideas emerged from each of the discussions and these are summarised in
table 2 below:
Table 2: Summary of strengths, weaknesses, threats and opportunities from the discussion groups
Strengths:
Good quality of life – an attractive place in
which to live
Natural assets - makes the area attractive to
tourists and new residents
Educational resources: University Centre
Shrewsbury and proximity to Harper Adams
University and other FE and HE institutions
External transport links – eg good Rail and
road links to west midlands and Northern
Powerhouse
Influx of professional ‘returners’ to the area
Self-sufficient – e.g. strong local spending
multipliers
Distinctiveness of Shrewsbury compared with
Telford- an attractive location to visit.
Opportunities:
HS2 – potentially a station at Crewe and the
new High speed link between Birmingham and
London may have spin off benefits for
Shropshire
Place making – Using existing sites to develop
new housing/employment opportunities
Tourism – second biggest income earner in
Shropshire but more could be done to ‘sweat’
tourism assets
Being part of the Midlands Engine (WMCA) and
proximity to economic growth of Birmingham –
potential spin offs for Shropshire
Ageing population – opportunities in terms of
new economic markets in health and social care.
Agri-engineering and precision farming – links
with Harper Adams University
Weaknesses
Poor connectivity especially mobile signal and
superfast broadband
Poor internal transport infrastructure –
particularly roads and public transport
provision leading to high dependency on
private car, especially to access
employment/training
Lack of ‘shovel ready’ development land and
resistance to new housing
Lack of resources within public services and
unwillingness to invest
Fragmented public sector footprint - perceived
lack of co-operation between Shropshire and
Telford and Wrekin Councils & lack of co-
terminosity with other public services
Lack of awareness of Shropshire’s ‘offer’ both
for visitors and potential residents ‘England’s
best kept secret’
Threats
Outmigration of younger people from the area,
lack of a ‘future’ for younger people. Risk to the
labour market
Unwillingness of Council to invest – risk averse
in context of austerity
Potential costs of an ageing population which
may put pressure on public finances
Skills mismatch between skills employers want
and those provided by colleges
Lack of specific skills, e.g. engineering
Housing affordability – particularly for younger
people and proliferation of second homes –
pushing house prices up
Risk of becoming simply a dormitory area for
West Midlands – although this may bring some
advantages
Perception that Council is not –‘pro-business’

13
Lack of active marketing and promotion to
potential investors.
Small businesses in smaller towns find it
difficult to expand due to viability challenges12.
Challenge of expansion – can be difficult for
some businesses particularly in smaller towns
This summary of strengths, weaknesses, opportunities and threats provides a good overview of
some of the main themes that characterise Shropshire’s economic potential, both now and in the
future.
Participants in the discussion groups also identified a number of challenges, specific to Shropshire
Council, which they felt were holding back the area’s, as yet untapped, economic potential. The
most common themes to emerge included:
Lack of purpose and direction: A feeling, particularly among business that the council lacked
a clear sense of direction in terms of its economic and spatial strategies. This created
uncertainty for local business
Planning system can be unresponsive and unpredictable, particularly for business
customers
Behind the curve: compared with other areas, there is a strongly held perception that
Shropshire lags behind other areas in terms of its attitude to business and future growth
Failure to get behind existing Shropshire’s existing economic sectors, eg participants
suggested that there was often a lack of support for sectors such as tourism, food and drink
industry and agriculture
Ways of working –There was a feeling expressed by many participants that the council’s
approach to economic development could be more visible and that projects are done to
rather than with local business.
Whilst there was acknowledgement that the role of the Council has been severely curtailed by
Central Government Budget constraints, tackling these negative perceptions of the Council’s current
work must be a pre-requisite to ensure that future interventions are effective.
The remainder of this section focuses on giving detailed descriptions of Shropshire’s demography,
growth prospects, connectivity, labour market, sectoral composition, education and skills.
3.2. Demography
Identified as a central challenge in the recent Regeneris report13, demographic change emerged as a
challenge for Shropshire, particularly during the discussion groups.
In general terms, the population of Shropshire has increased by 26,900 or 9%14 since the 2001
census although future forecasts suggest future population numbers, whilst continuing to grow, may
increase at a lower rate. The recent increase in the Shropshire’s population cannot be explained by
an increase in the birth-rate. Whilst the birth-rate did increase in Shropshire between 2002 and
12 Where the cost of building or extending business premises exceeds the potential sale price, therefore making it difficult to secure finance. 13A refresh of the evidence for the LEP 14 Data taken from Regeneris (2016) page 16
14
201015, this was not significant enough to explain the overall increase in population. Migration
figures for Shropshire, shown on figure 5, suggest that there is a high proportion of internal
migration into the area which is higher than outmigration which may help to explain the overall
increase in population16.
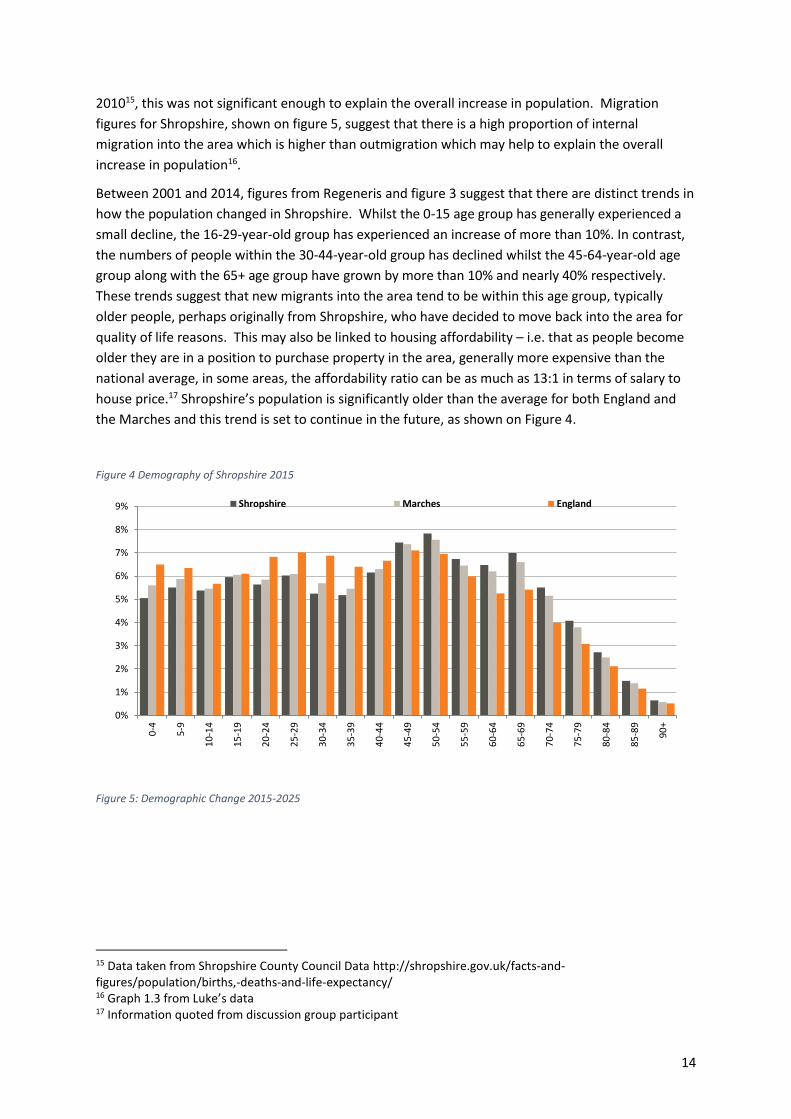
Between 2001 and 2014, figures from Regeneris and figure 3 suggest that there are distinct trends in
how the population changed in Shropshire. Whilst the 0-15 age group has generally experienced a
small decline, the 16-29-year-old group has experienced an increase of more than 10%. In contrast,
the numbers of people within the 30-44-year-old group has declined whilst the 45-64-year-old age
group along with the 65+ age group have grown by more than 10% and nearly 40% respectively.
These trends suggest that new migrants into the area tend to be within this age group, typically
older people, perhaps originally from Shropshire, who have decided to move back into the area for
quality of life reasons. This may also be linked to housing affordability – i.e. that as people become
older they are in a position to purchase property in the area, generally more expensive than the
national average, in some areas, the affordability ratio can be as much as 13:1 in terms of salary to
house price.17 Shropshire’s population is significantly older than the average for both England and
the Marches and this trend is set to continue in the future, as shown on Figure 4.
Figure 4 Demography of Shropshire 2015
Figure 5: Demographic Change 2015-2025
15 Data taken from Shropshire County Council Data http://shropshire.gov.uk/facts-and-figures/population/births,-deaths-and-life-expectancy/ 16 Graph 1.3 from Luke’s data 17 Information quoted from discussion group participant
0%
1%
2%
3%
4%
5%
6%
7%
8%
9%
0-4
5-9
10
-14
15
-19
20
-24
25
-29
30
-34
35
-39
40
-44
45
-49
50
-54
55
-59
60
-64
65
-69
70
-74
75
-79
80
-84
85
-89
90
+
Shropshire Marches England

15
Figure 6: Migration and internal migration - forecast until 2025
3.2.1. Demography: Implications
As highlighted in the LEP’s review of evidence, demographic change does present a significant
challenge for the economy, particularly in Shropshire where the rate of ageing is marginally higher
than the Marches as a whole. The main economic implications of an ageing population is the
potential impact on the labour market, particularly as demand for labour in some sectors may
continue to rise leading to skills shortages. In addition, another common concern is the impact and
potential cost of ageing to public services what is known as the ‘old age support ratio’ which
measures the number of people of working age per person of pension age. A decrease in the ratio
of working age people to older people potentially means that there is greater dependency of older
people upon those of working age. Figures for the old age dependency ratio in Shropshire, i.e. the
-40%
-20%
0%
20%
40%
60%
80%
100%
0-4
5-9
10
-14
15
-19
20
-24
25
-29
30
-34
35
-39
40
-44
45
-49
50
-54
55
-59
60
-64
65
-69
70
-74
75
-79
80
-84
85
-89
90
+
All
ages
Shropshire Marches England

16
number of people of working-age population to every pensioner is set to decrease significantly from
2.3 in 2016 to 1.8 in 203718
However, as highlighted by IPPR North in a forthcoming report19 whilst there are clear challenges of
ageing from the perspective of public services, this demographic change is often presented in an
unnecessarily dramatic way, what one author calls ‘problem laden scenarios’20. Harper argues that
ageing has come to be seen as a problem because of the particular way in which labour markets
have evolved where retirement is used as a regulating mechanism to manage throughput within the
working age population. In recent years there has been a much greater emphasis placed on the
opportunities that ageing presents, for example:
Spending power and new markets: An increase in consumption and purchasing power
amongst older people. Evidence21 suggests that older people in developed societies are
significant users of goods and services, particularly health and social care. Subsequently,
ageing can be seen as a way of supporting existing markets and developing new ones.
Social benefits: The opportunity to extend working lives and rethink how systems of
retirement operate which may in turn have positive social benefits such as a decrease in
poor health, loneliness and an increase in social participation.
During the discussion groups, some of these opportunities were identified by participants, in
particular there was a feeling that Shropshire needed to think differently about ageing, as one
participant suggested, ‘how do we leverage this [ageing’] to best effect?’. A number of themes
emerged from these discussions.
1. Older people and volunteering: There was recognition that older people tended to play an
important part in local volunteering and unpaid care within the area, a role that, whilst
difficult to monetise in terms of cashable benefits, nevertheless was important because of
the way that it supported civil society and in addition, public service delivery at a time when
resources are increasingly limited. In the UK as a whole, figures suggest that the unpaid
undertaken by older people could account for as much as £34bn per annum22. Given that
Shropshire has a higher proportion of older people than the UK average, the level of both
demand and unpaid care is likely to be significant.
2. New market opportunities: participants during the discussions were also keen to explore
how the opportunity of ageing could help develop new economic markets for future growth.
Of particular interest was whether it could stimulate the health and social care sector in the
area. Participants noted that there is evidence that the market in Shropshire is responding
to the demand from older people for particular products and serviced, for example, in
18 Data from http://www.neighbourhood.statistics.gov.uk/HTMLDocs/dvc235/index.html 19 Round (forthcoming) Extending Working Lives. IPPR North 20 Harper, Sarah, (2006) Ageing Societies: myths, challenges and opportunities, Hodder Arnold 21 Lee R, Mason A and Cotlear D (2010), Some Economic Consequences of Global Aging. World Bank Health,
Nutrition and Population (HNP) Discussion Paper. Washington DC: World Bank & Lee R and Mason A (eds), (2011), Population Aging and the Generational Economy: A global perspective, Cheltenham: Edward Elgar. 22 Cox E, Baker R and Henderson G (2014), Silver Cities: Realising the potential of our growing older population. Institute for Public Policy Research.

17
recent years, prominent developers such as McCarthy and Stone, who specialise in building
retirement homes and assisted living properties have invested significantly in Shrewsbury
and the surrounding area. Reference was also made to University Centre Shrewsbury which
is offering students course in topics such as health and exercise which may have direct
applications to supporting the area’s health and social care economy. Indeed national
research suggests that older people have high levels of disposable income and view
retirement as a time of leisure and tend to spend significant amounts of their income on
health and social care23. This potential has also been recognised by government who argue
that the growing rise in health and life sciences as an economic sector is in part driven by an
ageing demographic.
3. Using education to keep older people active: Some participants also suggested that more
could be done to enable older people to keep active in the community, not only through
volunteering and social interaction but through education and that there may be
opportunities to develop this through University Centre Shrewsbury and through
mechanisms such as the University of the Third Age. By keeping older people active, this
may reduce the costs of long term social and health care services.
3.2.2. Attracting and retaining younger people
Whilst recognising the need to harness the potential opportunities of an ageing population, there
was also an appetite within the discussion groups for measures to attract and retain younger people
in the area. Feedback from the discussion groups suggested that Shropshire did not have a clear
‘offer’ for young people including
Lack of affordable housing
Poor quality transport infrastructure to access employment and training
Lack of vitality, e.g. an absence of student orientated services and products
Lack of information provided to young people about local employment opportunities
including apprenticeships and graduate level vacancies.
Shropshire was thought to have a good education and skills offer for young people including local
schools, colleges, University Centre Shrewsbury and Harper Adams University, all of which were seen
as key opportunities. However, there was a general feeling that more could be done to connect this
provision more effectively with the needs of local employers. It was also suggested that by working
in partnership with local employers, more could be done to incentivise young people to stay in the
area, particularly those with qualifications in sectors where labour demand is high, for example,
support with housing and transport costs.
Summary of key findings:
Shropshire’s population is ageing at a faster rate than the UK average with potential
implications for health and social care costs
Younger people tend to move away when they leave home or graduate but may return in
later years, attracted by the high quality of life
23 Lee R and Mason A (eds), (2011), Population Aging and the Generational Economy: A global perspective,
Cheltenham: Edward Elgar.
18
An ageing population can provide potentially important social and economic benefits to
Shropshire but there is a need to think differently to realise these benefits.
There is evidence that the market is beginning to respond to the market opportunities of
older people in the area.
Migration from other regions may become increasingly important for Shropshire to
support the labour market.
3.3. Growth and productivity
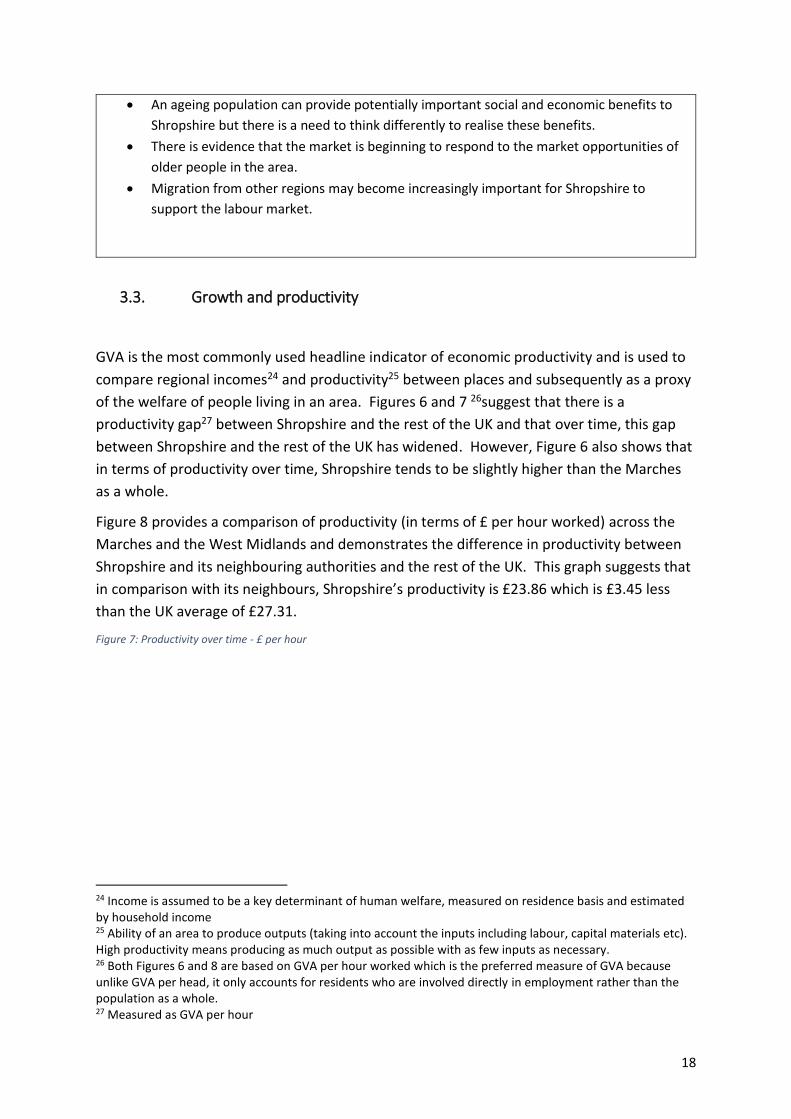
GVA is the most commonly used headline indicator of economic productivity and is used to
compare regional incomes24 and productivity25 between places and subsequently as a proxy
of the welfare of people living in an area. Figures 6 and 7 26suggest that there is a
productivity gap27 between Shropshire and the rest of the UK and that over time, this gap
between Shropshire and the rest of the UK has widened. However, Figure 6 also shows that
in terms of productivity over time, Shropshire tends to be slightly higher than the Marches
as a whole.
Figure 8 provides a comparison of productivity (in terms of £ per hour worked) across the
Marches and the West Midlands and demonstrates the difference in productivity between
Shropshire and its neighbouring authorities and the rest of the UK. This graph suggests that
in comparison with its neighbours, Shropshire’s productivity is £23.86 which is £3.45 less
than the UK average of £27.31.
Figure 7: Productivity over time - £ per hour
24 Income is assumed to be a key determinant of human welfare, measured on residence basis and estimated by household income 25 Ability of an area to produce outputs (taking into account the inputs including labour, capital materials etc). High productivity means producing as much output as possible with as few inputs as necessary. 26 Both Figures 6 and 8 are based on GVA per hour worked which is the preferred measure of GVA because unlike GVA per head, it only accounts for residents who are involved directly in employment rather than the population as a whole. 27 Measured as GVA per hour

19
Figure 8 Economic Output (GVA) over time - benchmarked, 2004-2014
Figure 9: The Productivity gap in 2015 (£ per hour worked)
£15.00
£17.00
£19.00
£21.00
£23.00
£25.00
£27.00
£29.00
2004 2005 2006 2007 2008 2009 2010 2011 2012 2013 2014
UK Shropshire CC Marches Linear (UK) Linear (Shropshire CC) Linear (Marches)

20
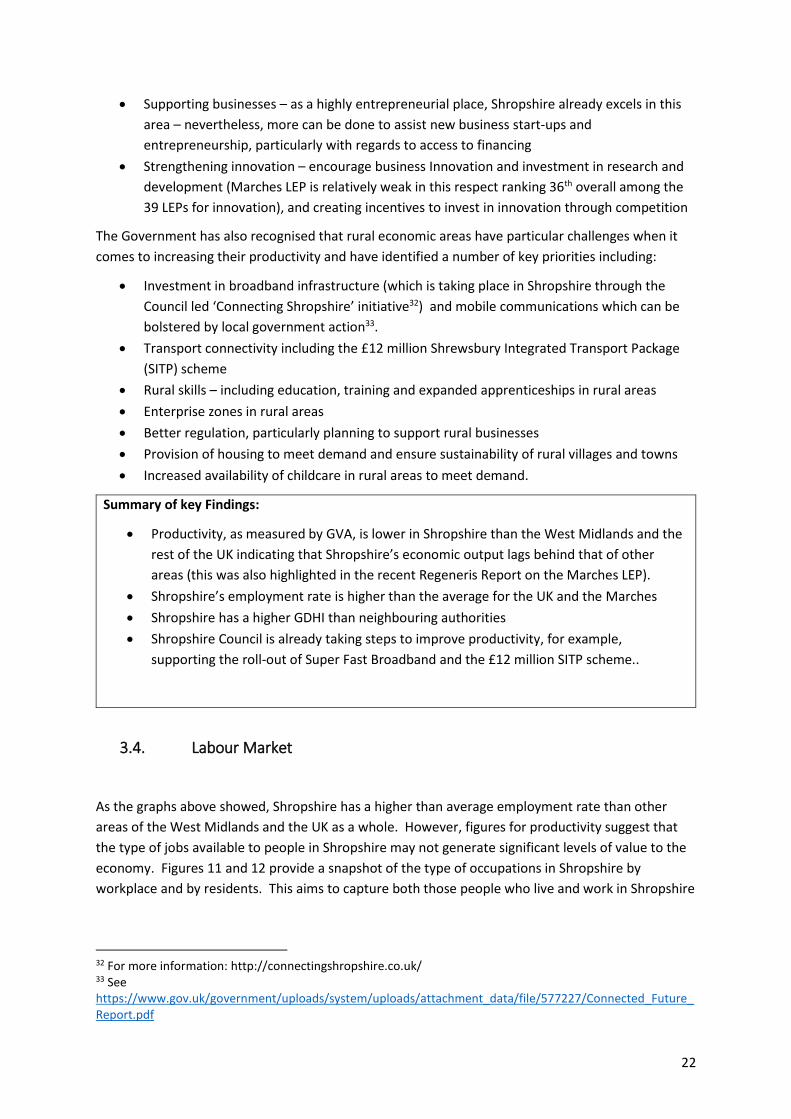
However, the employment rate in Shropshire is higher than the average for the Marches,
the West Midlands and the rest of the UK28 and unemployment levels in Shropshire (3.3%)
are generally lower than both the West Midlands (5.8%) and UK average (5.2%)29. Indeed,
figures since 2014, Shropshire’s employment rate has been consistently higher than the UK
average as shown on figure 9. So whilst the West Midlands and the UK have higher levels of
productivity than Shropshire, Shropshire tends to have higher levels of employment. This
suggests that jobs in Shropshire may generate less value for the economy because of the
types of sectors in which they are based, for example, jobs in traditional agriculture may be
worth less in terms of the value they generate for the economy, than manufacturing.
Figure 10: Employment rate for Shropshire, Marches and the UK over time.
Whilst GVA per head is a useful indicator of an area’s economy, Gross Disposable Household Income
(GDHI) can provide a more balanced indicator of welfare because it represents the amount of money
available to households in an area after taxes, national insurance and pension contributions have
been deducted. GDHI for Shropshire and the surrounding area compared with the UK is shown on
Figure 10. This indicates that whilst Shropshire lags behind in terms of GVA per hour worked, in
comparison with the Marches, Telford and Wrekin and the West Midlands, residents tend to have
higher household incomes. This might be explained by the high number of older and retired people
28 Based on figure 6.1 from Regeneris Refresh Report Page 80 29 Figures taken from NOMIS (January – December 2015)
64.0
66.0
68.0
70.0
72.0
74.0
76.0
78.0
80.0
82.0
2004 2005 2006 2007 2008 2009 2010 2011 2012 2013 2014 2015
SHROPSHIRE UK MARCHES

21
who may have higher levels of disposable income than other areas with a younger age profile. In
addition, the high level of people employed by the public sector in Shropshire might also explain why
levels of average income are high as these tend to be well paid, secure jobs with good terms and
conditions, providing employees with a high degree of financial security.
Figure 11: GDHI for Shropshire
3.3.1. Growth and Productivity: Implications
Because of their concentrations of people, capital and business, urban areas tend to make the
largest contribution to GVA. However, the overall contribution of rural areas is not insignificant,
approximately 17% in 201430. The figures from Shropshire shows that whilst its GVA is lower, the
area does provide a high level of employment for its residents which means it does not have some of
the challenges experienced by neighbouring authorities such as higher than average levels of young
people not in education or training (NEET). However, because it is used as a proxy lower levels of
GVA are thought to imply that levels of human welfare in an area will be lower and that levels of
business efficiency could be improved to increase productivity. There is though a trade-off between
increasing GVA and levels of employment, because one of the ways in which a business will become
more efficient will be to shed labour which inevitably may mean job losses.
There are a number of ways in which GVA can be strengthened including31:
Investment in people – higher levels of qualifications and skills development can strongly
influence productivity
Investment in place – by business in machinery, equipment and buildings which enables
greater efficiency and higher quality output. This investment can also be supported by
government intervention where viability or funding gaps exist.
30 Figures from https://www.gov.uk/government/uploads/system/uploads/attachment_data/file/539045/Productivity_2014_data_finalv2.pdf 31 Dunnell, L. (2009) Measuring regional economic performance, Economic and Labour Market Review, Vol 3, No. 1.
10,000
11,000
12,000
13,000
14,000
15,000
16,000
17,000
18,000
19,000
2004 2005 2006 2007 2008 2009 2010 2011 2012 2013 20142
United Kingdom West Midlands Marches
Herefordshire, County of Telford and Wrekin Shropshire CC
22
Supporting businesses – as a highly entrepreneurial place, Shropshire already excels in this
area – nevertheless, more can be done to assist new business start-ups and
entrepreneurship, particularly with regards to access to financing
Strengthening innovation – encourage business Innovation and investment in research and
development (Marches LEP is relatively weak in this respect ranking 36th overall among the
39 LEPs for innovation), and creating incentives to invest in innovation through competition
The Government has also recognised that rural economic areas have particular challenges when it
comes to increasing their productivity and have identified a number of key priorities including:
Investment in broadband infrastructure (which is taking place in Shropshire through the
Council led ‘Connecting Shropshire’ initiative32) and mobile communications which can be
bolstered by local government action33.
Transport connectivity including the £12 million Shrewsbury Integrated Transport Package
(SITP) scheme
Rural skills – including education, training and expanded apprenticeships in rural areas
Enterprise zones in rural areas
Better regulation, particularly planning to support rural businesses
Provision of housing to meet demand and ensure sustainability of rural villages and towns
Increased availability of childcare in rural areas to meet demand.
Summary of key Findings:
Productivity, as measured by GVA, is lower in Shropshire than the West Midlands and the
rest of the UK indicating that Shropshire’s economic output lags behind that of other
areas (this was also highlighted in the recent Regeneris Report on the Marches LEP).
Shropshire’s employment rate is higher than the average for the UK and the Marches
Shropshire has a higher GDHI than neighbouring authorities
Shropshire Council is already taking steps to improve productivity, for example,
supporting the roll-out of Super Fast Broadband and the £12 million SITP scheme..
3.4. Labour Market
As the graphs above showed, Shropshire has a higher than average employment rate than other
areas of the West Midlands and the UK as a whole. However, figures for productivity suggest that
the type of jobs available to people in Shropshire may not generate significant levels of value to the
economy. Figures 11 and 12 provide a snapshot of the type of occupations in Shropshire by
workplace and by residents. This aims to capture both those people who live and work in Shropshire
32 For more information: http://connectingshropshire.co.uk/ 33 See https://www.gov.uk/government/uploads/system/uploads/attachment_data/file/577227/Connected_Future_Report.pdf

23
whilst also considering those people who travel into Shropshire for employment. Figure 13
summarises the main difference between workplace and residents for Shropshire.
The main trends from these graphs indicate that Shropshire has less people working in professional
occupations (including health, education, business, public service professionals as well as senior
professionals within research, science and engineering) than the UK average, but more people
working in skilled trades occupations (which includes skilled occupations in agriculture, textiles,
metalwork and electrics). In addition, Shropshire tends to have more people working in what are
known as ‘elementary occupations’ which includes low skilled jobs in agriculture, factory processing
and construction as well as service based jobs such as cleaning, security, storage and sales.
However, when workplace occupations are compared with resident’s occupations, as on Figure 13,
the trends are somewhat different, indicating that the residents of Shropshire are more likely to be
working in professional, managerial and associate technical occupations compared with occupants in
Shropshire based workplaces suggesting that these people commute outwards of the area to
employment in other areas. Subsequently, this impact of commuting for work helps to indicate why
levels of household income are high in Shropshire. This is further borne out by figures for travel to
work patterns in the sub-region which indicate that whilst the majority of residents work in
Shropshire, approximately 30% travel outside to other areas for employment, most notably to
Telford and Wrekin (7%) and other areas (8%). These figures are summarised in Table 2. Table 2
also indicates that a substantial proportion of workers commute from Telford and Wrekin into
Shropshire. These figures back up the suggestion in some of the discussion groups that the economy
of Shropshire and Telford and Wrekin are closely related and that many people choose to live in
Telford and Wrekin but work in Shropshire, because housing is more affordable. In addition, Telford
and Wrekin have a number of key employers, for example HMRC, Heinz and Siemens.
These graphs also indicate the high proportion of people working in the caring and leisure
professions (more than 10%) perhaps an indicator of the growing market for these services given the
area’s ageing population.

24
Figure 12: Occupation snapshot – by workplace in Shropshire, The Marches and the UK 2015
Figure 13: Occupation snapshot - residents of Shropshire, The Marches and the UK 2015
Figure 14: Workplace versus Residents - type of employment 2015
0%
5%
10%
15%
20%
25%
Man
ager
s,D
irec
tors
and
Sen
ior
Off
icia
ls
Pro
fess
ion
alO
ccu
pat
ion
s
Ass
oci
ate
Pro
f &
Te
chO
ccu
pat
ion
s
Ad
min
istr
ati
ve a
nd
Secr
etar
ial
Occ
up
atio
ns
Skill
edTr
ades
Occ
up
atio
ns
Car
ing,
Leis
ure
an
dO
ther
Serv
ice…
Sale
s an
dC
ust
om
er
Serv
ice
Occ
up
atio
ns
Pro
cess
,P
lan
t an
dM
ach
ine
Op
erat
ives
Elem
enta
ryo
ccu
pat
ion
s
SHROPSHIRE THE MARCHES UK
0
5,000
10,000
15,000
20,000
25,000
30,000
Man
ager
s,D
irec
tors
and
Sen
ior
Off
icia
ls
Pro
fess
ion
alO
ccu
pat
ion
s
Ass
oci
ate
Pro
f &
Te
chO
ccu
pat
ion
s
Ad
min
istr
ati
ve a
nd
Secr
etar
ial
Occ
up
atio
ns
Skill
edTr
ades
Occ
up
atio
ns
Car
ing,
Leis
ure
an
dO
ther
Serv
ice…
Sale
s an
dC
ust
om
er
Serv
ice
Occ
up
atio
ns
Pro
cess
,P
lan
t an
dM
ach
ine
Op
erat
ives
Elem
enta
ryo
ccu
pat
ion
s
WORKPLACE RESIDENTS

25
Table 3: Travel to work patterns in Shropshire
WORKPLACE OF
RESIDENTS
N %
Shropshire 82,151 70.4%
Telford and Wrekin 8,185 7.0%
Powys 3,135 2.7%
Wrexham 2,700 2.3%
Herefordshire, County of 1,278 1.1%
Wolverhampton 1,085 0.9%
South Staffordshire 1,015 0.9%
Cheshire East 871 0.7%
Dudley 658 0.6%
Newcastle-under-Lyme 647 0.6%
Other 9,700 8.3%
TOTAL 111,425 100.0%
In common with the Marches LEP, Shropshire has a
high proportion of self-employment (12% compared
with the UK and West Midlands average of 10% and
9% respectively)34. The majority of self-employment
is in construction, agriculture and banking finance and insurance. This mirrors the national trends
for self-employment which has risen sharply since 2010 with 40% of the growth in UK employment
down to the rise in self-employment and people are self-employed are more likely to be older and
male35.
Figure 15: Self-employment as a per cent of all employed in that industry
34 ONS Population Estimates 2014 35 Hatfield (2015) Self Employment in Europe. IPPR. Available here: http://www.ippr.org/files/publications/pdf/self-employment-Europe_Jan2015.pdf?noredirect=1
RESIDENCY OF
WORKERS
N %
Shropshire 82,151 70.4%
Telford and Wrekin 11,105 9.5%
Wolverhampton 2,346 2.0%
Wrexham 2,192 1.9%
Powys 1,838 1.6%
Birmingham 1,312 1.1%
Herefordshire, County of 1,173 1.0%
Dudley 1,143 1.0%
Cheshire East 1,115 1.0%
Wyre Forest 1,037 0.9%
Other 11,294 9.7%
Total 116,706 100.0%

26
3.4.1. Labour Market: Implications
The trends within the Shropshire Labour market demonstrate the interconnected nature of
Shropshire’s economy with other areas of the Marches LEPs, particularly Telford and Wrekin and the
wider WMCA region. These trends also imply that residents of Shropshire are in higher paid
employment than those who commute into Shropshire from other areas.
Whilst self-employment is often cited as an example of an entrepreneurial culture and providing
people with a flexible and responsive labour market, there is also evidence that the rise in self-
employment may be down to a lack of alternative employment choices and can also involve greater
job insecurity as people in self-employment may not have access to the terms and conditions as
employees, for example, time off for sickness, maternity/paternity leave and pension provision.
Summary of key findings:
A high percentage of Shropshire residents, work in Professional occupations (17%) with a
further 10% employed as managers, Directors and Senior Officials. However, the figures
are lower for occupation by workforce, suggesting that some residents commute to other
areas for employment
A high percentage of employees in Shropshire work in Skilled trade occupations, reflecting
the area’s sectoral strengths in agriculture, advanced manufacturing and the food and
drink industry.
Shropshire has a high percentage of people working in elementary occupations (14%)
both by workplace and by resident.
The figures indicate a close economic relationship between Shropshire and Telford and
Wrekin in terms of commuting patterns.
Shropshire has a high percentage of self-employment particularly in skilled trades and
mangers/professionals but this is not necessarily an indicator of an entrepreneurial or
highly-productive workforce.
0% 10% 20% 30% 40% 50% 60%
A Agricuture & fishing
B,D,E Energy & water
C Manufacturing
F Construction
G,I Distribution, hotels & restaurants
H,J Transport & Communication
K-N Banking finance & insurance etc.
O-Q Public admin education & health
R-U Other services
ALL
MARCHES
SHROPSHIRE
UK

27
3.5. Sectoral Composition
Shropshire’s economic base is characterised by small businesses; 77% of the County’s 14,000
enterprises have four or fewer employees. Figures from NOMIS 2015 confirm that 90% of
businesses employ four or fewer employees compared with 88% in the West Midlands as a whole.
In addition, the county is home to one of the largest concentrations of self-employment in the UK.
While agriculture is still an important part of Shropshire’s economy, in terms of jobs, manufacturing
plays an important role providing 10% of employment in the county. The majority of other jobs in
the area are provided through a service based economy including significant levels of employment in
financial and business services (12%), wholesale and retail (19%) and tourism (8%). However, the
public sector is still a major employer providing 32% of jobs in the area. Table 4 below provides a
sectoral breakdown of the Shropshire economy in 2016 by GVA and employment and the forecast
change until 202636.
Table 4: Overview of employment and GVA by sector in Shropshire and change 2006-2036
This table shows the importance of particular sectors for employment in Shropshire at the current
time namely:
Manufacturing (13.5%)
Construction (12%)
Wholesale/retail trade (24%)
Accommodation and food services (11%)
Education – strongly influenced by public sector (13.5%)
Human health and social work activities - strongly influenced by public sector (21.5%)
36 Based on Oxford Economics data for Shropshire Council, January 2016
Employment by
sector 2016
Employment by
sector 2026 % Change
GVA by sector
2016
GVA per sector
2026
Change
£ms
Wholesale/retai l trade; repair of motor vehicles/cycles 23.9 24.5 0.6 865 1101 236
Human health and socia l work activi ties 21.5 22.5 1.0 593 726 133
Manufacturing 13.5 12.5 -1.0 656 772 116
Education 13.4 13.5 0.1 423 464 41
Construction 12.2 13.6 1.4 500 621 121
Accommodation and food service activi ties 10.6 11.2 0.6 223 283 60
Profess ional , scienti fic and technica l activi ties 8.5 9.7 1.2 295 424 129
Publ ic adminis tration and defence; socia l securi ty 7.2 6.8 -0.4 333 343 10
Transportation and s torage 6.3 6.6 0.3 263 326 63
Agriculture, forestry and fi shing 5.9 5.3 -0.6 204 221 17
Financia l and insurance activi ties 1.2 1.1 -0.1 70 89 19
Mining and quarrying 0.3 0.2 -0.1 46 49 3
Water supply; sewerage, waste management 1.3 1.2 -0.1 112 140 28
Electrici ty, gas , s team and a ir conditioning supply 0.6 0.5 -0.1 150 195 45
Information and communication 3.4 3.7 0.3 206 290 84
Real estate activi ties 2.6 2.8 0.2 829 1046 217
Adminis trative and support service activi ties 6.4 7.3 0.9 208 294 86
Arts , enterta inment and recreation 4.4 5.0 0.6 63 79 16
Other service activities 4.4 4.8 0.4 137 160 23

28
Figures 16 and 17 illustrates the degree to which particular business sectors are concentrated in
Shropshire using a location quotient. Figure 14 shows the level of specialisation as measured by its
importance for employment which shows how many jobs are generated per sector in Shropshire and
its concentration compared with the figures nationally. Whereas Figure 15 shows the level of
specialisation as measured by output GVA. This shows how much economic value each sector
produces in Shropshire and its concentration compared with the national economic profile. Both
graphs highlight the importance of particular industries in the Shropshire Economy and how this
importance varies both by GVA and employment. They indicate that compared with the national
context, Shropshire’s economy is characterised by particular industries including agriculture, utilities,
construction, manufacturing, accommodation and food and mining/quarrying. However it also
indicates how these specialisms vary based in terms of employment and GVA output, for example,
manufacturing generates more economic value in terms of GVA rather than employment.
Figure 16: Specialisation - as measured by location quotients for employment (where 1 = same concentration as nationally)
Figure 17: Specialisation as measured by location quotients in output GVA (where 1 = same
concentration of GVA as nationally)
0.0
0.5
1.0
1.5
2.0
2.5
3.0
3.5
4.0
Agr
icu
ltu
re, f
ore
stry
an
dfi
shin
g
Wat
er s
up
ply
; sew
erag
e,w
aste
man
agem
ent
and
…
Co
nst
ruct
ion
Man
ufa
ctu
rin
g
Hu
man
hea
lth
an
d s
oci
alw
ork
act
ivit
ies
Pu
blic
ad
min
istr
atio
n a
nd
def
ence
; co
mp
uls
ory
…
Min
ing
and
qu
arry
ing
Rea
l est
ate
acti
viti
es
Elec
tric
ity,
gas
, ste
am a
nd
air
con
dit
ion
ing
sup
ply
Wh
ole
sale
an
d r
etai
l tra
de
;re
pai
r o
f m
oto
r ve
hic
les…
Acc
om
mo
dat
ion
an
d f
oo
dse
rvic
e ac
tivi
ties
Oth
er s
ervi
ce a
ctiv
itie
s
Edu
cati
on
Art
s, e
nte
rtai
nm
ent
and
recr
eati
on
Tota
l
Tran
spo
rtat
ion
an
d s
tora
ge
Pro
fess
ion
al, s
cien
tifi
c an
dte
chn
ical
act
ivit
ies
Info
rmat
ion
an
dco
mm
un
icat
ion
Ad
min
istr
ativ
e an
d s
up
po
rtse
rvic
e ac
tivi
ties
Fin
anci
al a
nd
insu
ran
ceac
tivi
ties

29
Figures 14 and 15 indicates the importance of particular sectors for Shropshire’s economy but also
the types of industry that are unlikely to thrive in the area, for example, finance, information and
communication as well as professional, scientific and technical activities. Again this was explained
during the discussions with local businesses who argued that most professional services based in the
area, tended to be ‘secondary’ or back office, unless serving a particular sector in the Shropshire
area or wider Marches/West Midlands area.
3.5.1. Sectoral Composition: Implications
Shropshire has relatively diverse sectoral composition with key strengths in a number of sectors,
particularly manufacturing, agriculture and tourism. These strengths are reflected in location
quotients for the area demonstrating that compared with the national average, Shropshire has much
higher than average concentrations of these sectors in its area. However, the data discussed in this
section also illustrates Shropshire’s sectoral strengths in education, human health and social work,
construction and the wholesale/retail trade. Although it is worth noting that many of these will have
direct links into the supply chains of other sectors, e.g. the wholesale and retail trade includes the
retail of farm machinery and agricultural raw materials. Table 5 below attempts to summarise the
main features of Shropshire’s main economic sectors
Table 5: An overview of the main growth trends for Shropshire's economic sectors
Opportunities: Future growth sectors for both
GVA and employment
Significant Shropshire sectors which are
growing by GVA (more than £100m+) and by
employment (0.5% +)
Wholesale/retail trade/repair of motors
Human health and social work
Professional, Scientific and technical
activities
Construction
Consolidation: Growth in GVA but not
employment
Significant Shropshire sectors (£100m + in
2016) which are due to grow by GVA but
decline in terms of employment:
Manufacturing
Public administration/defence/social
security
Agriculture
0.00.51.01.52.02.53.03.54.04.55.0
Agr
icu
ltu
re, f
ore
stry
an
dfi
shin
g
Elec
tric
ity,
gas
, ste
am a
nd
air
con
dit
ion
ing
sup
ply
Min
ing
and
qu
arry
ing
Wat
er s
up
ply
; sew
erag
e,w
aste
man
agem
ent
and
…
Hu
man
hea
lth
an
d s
oci
alw
ork
act
ivit
ies
Co
nst
ruct
ion
Acc
om
mo
dat
ion
an
d f
oo
dse
rvic
e ac
tivi
ties
Pu
blic
ad
min
istr
atio
n a
nd
def
ence
; co
mp
uls
ory
…
Wh
ole
sale
an
d r
etai
l tra
de
;re
pai
r o
f m
oto
r ve
hic
les…
Rea
l est
ate
acti
viti
es
Edu
cati
on
Man
ufa
ctu
rin
g
Tota
l
Tran
spo
rtat
ion
an
d s
tora
ge
Oth
er s
ervi
ce a
ctiv
itie
s
Art
s, e
nte
rtai
nm
ent
and
recr
eati
on
Ad
min
istr
ativ
e an
d s
up
po
rtse
rvic
e ac
tivi
ties
Pro
fess
ion
al, s
cien
tifi
c an
dte
chn
ical
act
ivit
ies
Info
rmat
ion
an
dco
mm
un
icat
ion
Fin
anci
al a
nd
insu
ran
ceac
tivi
ties

30
Real Estate activities Tourism - accommodation and food
service activities
Enabling: sectors which support economy and
may experience low to modest growth in
employment/GVA
Education
Information and communication
Financial and insurance activities
Administrative and support service
activities
Arts entertainment and recreation
Transportation and storage
Decline: Insignificant Shropshire sectors with
projected low or negative growth in both GVA
and employment
Electricity, gas, steam and air
conditioning
Mining and quarrying
Water supply, sewerage, waste
management
This table suggests a way of thinking about and prioritising Shropshire’s economic sectors longer
term. It suggests that particular focus should be placed on those sectors which have future growth
potential – both in terms of GVA and employment. However, at the same time, it is important that
those sectors which are already significant in Shropshire, for example agriculture and tourism should
not be ignored but the strategy should be to support these existing strengths in order to enable
them more productive both in terms of GVA and employment, longer term.
In addition, there are other sectors, for example, the Low carbon Environmental Goods and Services
Sector (LCEGS) which, whilst not highlighted in these tables are increasingly important in areas like
Shropshire. A report produced for the Marches LEP37 suggested that the LCEGS sector in the
Marches and Worcestershire LEP areas was of significant value, approximately 2.3bn and employing
around 17,300 people. In addition, the report suggested that this sector was expected to grow by
around £1bn in the Marches and Worcestershire from 2013/14 to 2019/20. The same report
suggested that Shropshire had particular strengths in waste management, environmental
consultancy, energy management and alternative fuel vehicles, and that the sector was supported
by the presence of other land based industries and educational services, particularly Harper Adams
who have expertise in anaerobic digestion as well as University Centre Shrewsbury where general
science degrees are offered including biotechnology and biochemistry.
Summary of key findings
Shropshire’s economy is characterised by small businesses and a diverse business base.
Whilst agriculture, manufacturing and defence are key existing sectors for Shropshire,
their contribution to job creation in the future may be limited
The focus of future interventions must be to create the conditions whereby potential
growth sectors such as health and social care and LCEGS sector are enabled to grow whilst
at the same time, consolidating the area’s strengths in tourism, agriculture and
37 Innovas Consulting Ltd (2015) Evaluation of the Environmental and Low Carbon Sector in the Marches and Worcestershire LEP areas

31
manufacturing that already employ a substantial number of Shropshire residents and
where there are opportunities for niche specialisms such as biotech and biochemistry.
3.6. Skills Figures 17 and 19 give an indication of Shropshire’s skills profile which, compared to both regional
and national averages, is very good. Shropshire has a higher proportion of highly qualified people
than regional averages, and has a much lower proportion of unqualified people than both the region
and the country. The county outperforms the West Midlands by a fairly substantial margin in the
proportion of individuals 16-64 who have NVQ4+ (35.6%), and has recently overtaken the UK as a
whole in the proportion of people 16-64 who have at least NVQ2+ (75.2%). Shropshire has a much
lower proportion of individuals with no qualifications than both the UK and the West Midlands
(6.3%).
Figure 18 % NVQ4+
Figure 19 % No Qualifications
0.0
5.0
10.0
15.0
20.0
25.0
30.0
35.0
40.0
2004 2005 2006 2007 2008 2009 2010 2011 2012 2013 2014 2015
SHROPSHIRE UK WEST MIDLANDS
0.0
2.0
4.0
6.0
8.0
10.0
12.0
14.0
16.0
18.0
20.0
2004 2005 2006 2007 2008 2009 2010 2011 2012 2013 2014 2015
SHROPSHIRE UK WEST MIDLANDS
32
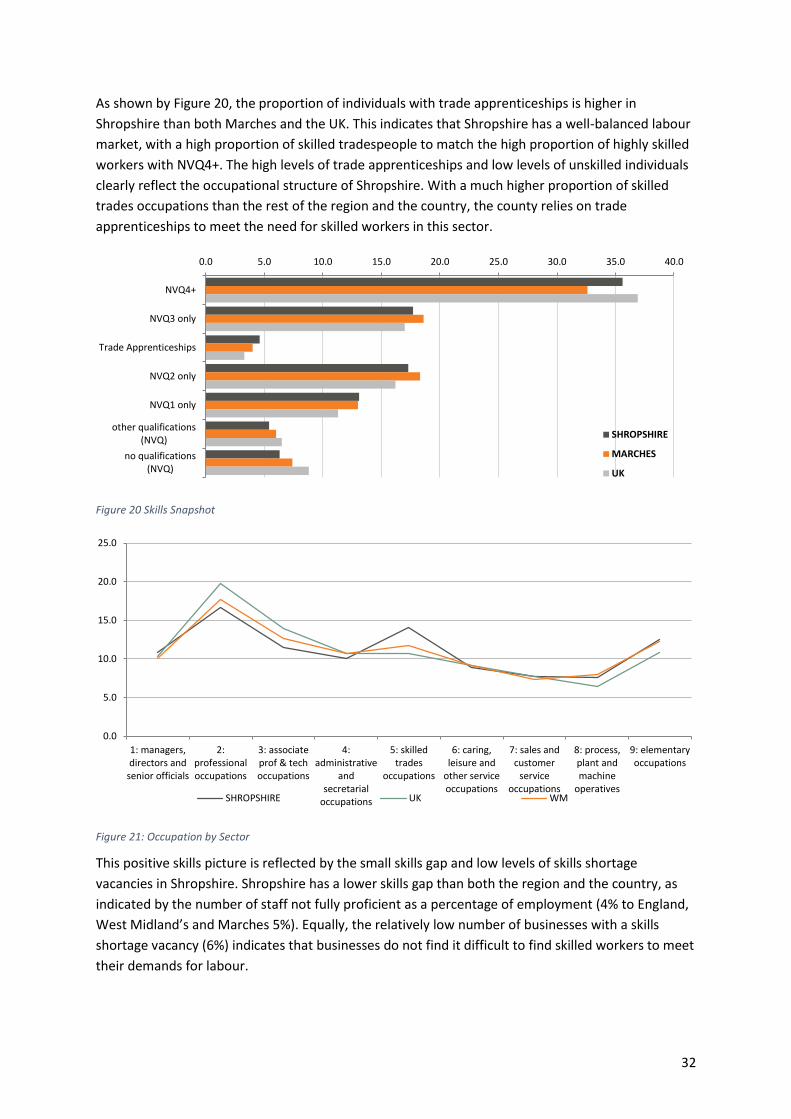
As shown by Figure 20, the proportion of individuals with trade apprenticeships is higher in
Shropshire than both Marches and the UK. This indicates that Shropshire has a well-balanced labour
market, with a high proportion of skilled tradespeople to match the high proportion of highly skilled
workers with NVQ4+. The high levels of trade apprenticeships and low levels of unskilled individuals
clearly reflect the occupational structure of Shropshire. With a much higher proportion of skilled
trades occupations than the rest of the region and the country, the county relies on trade
apprenticeships to meet the need for skilled workers in this sector.
Figure 20 Skills Snapshot
Figure 21: Occupation by Sector
This positive skills picture is reflected by the small skills gap and low levels of skills shortage
vacancies in Shropshire. Shropshire has a lower skills gap than both the region and the country, as
indicated by the number of staff not fully proficient as a percentage of employment (4% to England,
West Midland’s and Marches 5%). Equally, the relatively low number of businesses with a skills
shortage vacancy (6%) indicates that businesses do not find it difficult to find skilled workers to meet
their demands for labour.
0.0 5.0 10.0 15.0 20.0 25.0 30.0 35.0 40.0
NVQ4+
NVQ3 only
Trade Apprenticeships
NVQ2 only
NVQ1 only
other qualifications(NVQ)
no qualifications(NVQ)
SHROPSHIRE
MARCHES
UK
0.0
5.0
10.0
15.0
20.0
25.0
1: managers,directors and
senior officials
2:professionaloccupations
3: associateprof & techoccupations
4:administrative
andsecretarial
occupations
5: skilledtrades
occupations
6: caring,leisure and
other serviceoccupations
7: sales andcustomer
serviceoccupations
8: process,plant andmachine
operatives
9: elementaryoccupations
SHROPSHIRE UK WM

33
There are, however, 9% businesses that have at least one hard to fill vacancy, higher than the
proportion of businesses that face this problem in the UK as a whole. Figure 23 gives an indication of
why this might be the case. Whilst the overall skills gap for the county may be low, the skills gaps
that do exist are concentrated in one area: service-intensive vacancies. Specifically, Shropshire has a
very high proportion of vacancies for ‘caring, leisure and other services staff’, and for ‘sales and
customer services staff’. In fact, the proportion of vacancies in caring and leisure (27.5%) is over
double that of the UK as a whole (17.6%), and the proportion of vacancies in sales and customer
service staff (26.2%) is over triple the national average for this sector (7.2%).
Figure 22: Skills Gaps and SSVs
Figure 23 Vacancies by Skill Type
3.6.1. Skills: Implications
The graphs above paint a very positive picture of Shropshire’s skills profile. The county outperforms
regional and national averages for skills levels in a number of areas, and businesses do not struggle
with skills gaps and long-term hard to fill vacancies in the same way that they do in other parts of
the country. This indicates that Shropshire is clearly getting a lot right in terms of aligning the supply
0 2 4 6 8 10
Shropshire
The Marches
West Midlands
UK
Number of staff not fully proficient as a % of employment
Have an SSV
At least one H2F vacancy
0
5
10
15
20
25
30
35
40
45
50
% of vacancies thatare high-skill
vacancies
% of vacancies thatare middle-skill
vacancies
% of vacancies thatare service-intensive
vacancies
% of vacancies thatare Labour-intensive
vacancies
Shropshire UK

34
of and demand for labour. The high proportion of trade apprenticeships is a particularly positive
indicator; the availability of high-quality apprenticeships, particularly in areas characterised by high
levels of demand for labour-intensive positions, is a key bellwether of the health of the employment
market.
However, this positive picture masks some core blockages in Shropshire’s labour market. Firstly,
there are a high proportion of businesses that have at least one hard to fill vacancy, even if the
overall number of hard to fill vacancies is low. This is because these vacancies are concentrated in
the service sector. The proportion of vacancies in caring, leisure, sales and customer services is
particularly high – together, these sectors account for over 50% of all of the vacancies in Shropshire.
This is undoubtedly at least partly the result of Shropshire’s unique demographic profile; the large
elderly population gives rise to higher levels of demand for carers and other related services. This is
a well-recognised problem for the country in general, but Shropshire faces a particularly acute
challenge finding enough care workers to provide for its elderly population. This situation will only
be exacerbated by the likely fall in inward migration due to the vote to leave the EU (given the high
proportion of care workers that were born outside of the UK). Finding enough care workers to meet
demand should be seen as a strategic priority for Shropshire moving forward.
The large number of vacancies in retail and customer services indicates that training in Shropshire is
skewed towards some sectors at the expense of others. Because of Shropshire’s relatively high skills
levels, and because of the progress it has made in encouraging the take up of trade apprenticeships,
both high-skill, medium-skill and labour-intensive vacancies are relatively easy to fill. However, this
has come at the expense of any focus on care, leisure, sales and customer services training. Moving
forward, Shropshire will need to rebalance its skills profile by placing a greater emphasis on training
for these sectors and by encouraging its citizens to choose careers in these areas.
The high proportion of older people could be an asset in this area. Older people, with lots of time
and experience in the workplace, can be leveraged to meet skills gaps in the service sector. The
flexible nature of work in this area, in particular the high proportion of zero-hour contracts, is often
quite appealing to this demographic who want to fit part-time work around other activities.
Moreover, the emotional and personal nature of the work is often particularly appealing to elderly
people who suffer disproportionately from loneliness and social isolation.
3.7. Education
Shropshire’s education picture is currently fairly mixed. On the one hand, in terms of general
education outcomes, particularly pre-KS5, Shropshire does well. As indicated by Figure 24, at Early
Years level, a critical stage of development which plays a role in determining outcomes for the rest
of the life course, Shropshire outperforms both the West Midlands and the UK by a substantial
margin. Shropshire’s attainment gap between the bottom 20% pupils and the average is also lower
than that for the West Midland’s and the country as a whole.

35
Figure 24: Early Years Outcomes
Shropshire performs below UK national averages and on par with the West Midlands region in terms
of children reaching expected standards at KS2. However, this does not reflect Shropshire’s
performance in previous years, which has been consistently above national averages; the drop-off in
2016 may reflect issues with the new assessment framework which was implemented in that year.
However, by the time students reach KS4, outcomes have improved again. By this point, the average
attainment 8 score per pupil for young people in Shropshire is 50.5, significantly higher than the
scores for the West Midlands (49.1) and England as a whole (48.2).
Figure 25: KS2-4 Outcomes
The proportion of students going on to education, employment or training destinations at KS4 is also
fairly good. 93% students go on to EET, the same as the figure for the West Midlands, and 1% lower
than that for the UK. Of these, 45% go to Sixth Form, 43% to an FE college and 7% to an
apprenticeship. Compared to the UK and the West Midlands, more students go to FE colleges and
apprenticeships than go to Sixth Form. In the UK as a whole, 52% students go on to Sixth form,
0.0 10.0 20.0 30.0 40.0 50.0 60.0 70.0 80.0
Shrops
WM
UK
% attainment gap %GLD % ELD
45 46 47 48 49 50 51 52 53 54
Shrops
WM
UK
KS2-4 Outcomes
Average attainment 8 score per pupil KS2: Expected standard

36
whilst 41% go to FE colleges and 6% to apprenticeships. The proportion of disadvantaged students
going on to EET is the same for Shropshire, the West Midlands and the UK.
Figure 26: KS4 Destinations
This smaller number of students who go on to education at KS5 level in Shropshire achieve poorer
outcomes in almost all qualification types. At A level, only 7% achieve 3 A*-A grades, compared to
8.9% in the West Midlands and 12.9% for the UK, and only 13% achieve 3 AAB+, compared to 16.4%
for the West Midlands and 21.6% for the UK. Moreover, the average point score across all
qualifications is 30.27 in Shropshire, compared to 30.76 in the West Midlands, and 32.23 in the UK as
a whole. However, whilst Shropshire’s academic students do not perform as well as those in the
country as a whole, those students undertaking technical qualifications score substantially better.
Tech level students in Shropshire achieve an average total point score of 32.48, compared to 30.42
in the West Midlands and 30.83 in the country as a whole.
Figure 27: KS5 Outcomes
Destinations for school leavers at KS5 broadly reflect these trends. The overall proportion of
Shropshire’s students entering an education, employment or training destination, at 88%, is lower
0 20 40 60 80 100
% KS4 to EET
Apprenticeship
FE college
6th form
% KS4 Disadv to EET
UK WM Shrops
0 5 10 15 20 25 30 35
Shrops
WM
UK
APS/entry all quals % 3 AAB+ % 3A*-A

37
than national and regional averages of 90%. Of these, the proportion entering higher education is
low, at 58% compared to 62% in the West Midlands and 59% nationally. However, 8% enter an
apprenticeship, compared to 6% in the West Midlands and the country. The proportion of
disadvantaged students is also lower, at 82% compared to 84% in the West Midlands and 86% in the
UK.
Figure 28: KS5 Destinations
3.7.1. Education: Implications
The education picture for Shropshire is mixed. At Early Years level, Shropshire performs well, with
high ELD and GLD scores, as well as a low attainment gap. At KS4 outcomes are also good, with a
high proportion of students achieving good GCSE grades. However, at KS2 and KS5 students perform
worse than both national and regional averages; the low scores on KS5 qualifications are particularly
concerning.
On the one hand, the drop of at KS2 is likely to reflect the changes to the assessment system rather
than a fall in quality, especially given the strong performance at this level over time. On the other
hand, the sharp drop in attainment after KS4 is concerning and has implications for the quality of
education at this level. As the data on early years and GCSEs is not comparable year on year, it is
difficult to determine whether or not the variations in outcomes at each stage reflect individual
cohort differences, or improvements/deteriorations in teaching quality.
The data does, however, paint a picture of the differential focus of education in Shropshire as
compared to the rest of the region and the nation. Whilst the numbers of KS4 students entering EET
are broadly similar across Shropshire and the UK, KS4 leavers in Shropshire are much more likely to
go on to apprenticeships than in the rest of the UK, and they are also more likely to attend FE
colleges. Similarly, at KS5 Shropshire’s students do substantially better than average in technical
qualifications, and many more of them go on to enter apprenticeships. This indicates that the county
has been successful in redirecting students with non-academic abilities towards different forms of
education and training. These results are mirrored in Shropshire’s skills profile above, which shows
that it has adequately aligned demand for and supply of workers in skilled-trades occupations
through high levels of apprenticeship training.
0 20 40 60 80 100
% KS5 to EET
Apprenticeship
FE College
HE institution
% KS5 Disadv to EET
UK WM Shrops

38
Summary of key findings
Shropshire has a relatively well-skilled labour force in comparison with neighbouring areas and the
UK average together with above average school performance and good Early Years outcomes.
Although A-level results are below average, Shropshire has a higher proportion of students entering
technical education and apprenticeships where their results are very good.
There appears to be strong alignment between skills provision and labour demand in high-skilled
sectors with high levels of trade apprenticeships and a relatively low level of skills shortages and
small skills gap.
Shropshire has acute skills shortages in specific service-intensive sectors including caring, leisure,
sales and customer services which is clearly linked to its ageing population.

39
4. Developing an economic vision for Shropshire
4.1. Case for Change
During the discussion groups, participants were asked to outline their views on what a future vision
for Shropshire might look like? This was done by considering what Shropshire’s economy would be
like if the status quo was maintained, i.e. if no interventions were made to influence the direction of
the current Shropshire economy. Figure 17 highlights two scenarios for Shropshire’s future, one in
which the status quo is maintained and the other in which transformative change is implemented.
Participants were then asked to consider what an alternative vision for the future economy of
Shropshire might look like if action was taken to intervene. Figure 18 below provides a summary of
common themes to emerge from these discussions:
Figure 29: Future scenarios for Shropshire

40
4.2. Foundations for Change Based on the feedback from participants within the discussion groups, a new economic vision for
Shropshire will focus on four strategic areas: Place, People, the Private Sector and Public Services.
Within each of these themes, Shropshire has some unique core strengths; the strategy will focus on
developing these core strengths in order to meet the challenges and opportunities that the county
will face in the future.
1. Place: Shropshire is a highly attractive destination for national and international capital.
Shropshire’s residents are connected to one another, to public services and to employment
through wide-ranging broadband connectivity and world-class infrastructure. And
Shropshire is known for a high quality of life and excellent leisure offer for the West
Midlands conurbation and beyond. Communities are resilient, with high levels of social
capital and fully-utilised community assets.
2. People: Shropshire’s young people are supported to develop the right skills in order to find
fulfilling employment. The county provides world-class training and support services to help
create a productive and working-age population. Older people are supported to live
fulfilling, independent lives, helping others and giving back to their communities.
3. Private Sector: Small and medium-sized enterprises are supported to start-up, grow and
take off in an entrepreneurial and business-friendly environment. Business leaders work
with the public sector to drive economic growth and employment. Shropshire’s core
industries are supported to grow by the facilitating environment put in place by the council,
which is known as ‘open-for-business’.
4. Public Services: Shropshire’s people are supported to start well, live well and age well by
public services that put people first, whilst supporting Shropshire’s economic objectives of
growth, productivity and employment.
Figure 30: Components of Shropshire's vision

41
4.2.1 Place
Vision
Shropshire is a highly attractive destination for national and international capital. Shropshire’s
residents are connected to one another, to public services and to employment through wide-ranging
broadband connectivity and world-class infrastructure. And Shropshire is known for a high quality of
life and excellent leisure offer for the West Midlands conurbation and beyond. Communities are
resilient, with high levels of social capital and fully-utilised community assets.
Priorities
Enhancing connectivity, through increased broadband access and improved transport
infrastructure, for the whole of Shropshire
Ensuring the provision of enough high-quality, affordable housing for all of Shropshire’s
residents with an efficient and strategic approach to planning with a focus on a small
number of strategic development sites
Promoting Shropshire’s natural beauty while garnering a reputation for sustainable
economic development
A focus on asset-based community development targeted in key locations
Actions
Develop a comprehensive investment strategy for Shropshire. This should leverage funding
raised from a variety of sources to make Shropshire a highly attractive destination for
national and international investment. This will include the following specific measures:

42
o Making a stronger case for connectivity investment in better transport, superfast
broadband and enhanced mobile phone coverage where appropriate using local
resources to lever in wider public and private investment.
o Invest in future infrastructure to support future growth including maintaining
support for Connecting Shropshire and continuing to argue for greater investment in
mobile coverage. Continue to support the development of transport infrastructure,
including strategic freight corridors, by working with partners in the Marches LEP,
the WMCA and the Midlands Engine.
o Show greater leadership by challenging the widely held trope that Shropshire is a
place where there is ‘stagnation of ambition’ by fighting for investment in
Shropshire’s economy including working with the Marches LEP to secure a
settlement for European funding post Brexit, and working with UKTI to promote
Shropshire’s economic assets and services.
Housing development
o Use the Council’s ability to allocate land for development to encourage and support
the development of new housing where objectively assessed need exists38 and to
challenge housebuilders to build out consented sites. This housing should aim to
provide a high quality of living for new residents and should ensure that adequate
provision is made for starter and affordable accommodation, particularly to attract
younger people and families into the area.
o Identify strategic sites for development in the area and work with partners to
realise the potential of these areas to create high quality residential and
employment sites to support future growth, for example, Clive Barracks, Tern Hill39.
o Other key development sites could include Mile End Oswestry, Ironbridge Power
Station and the Riverside Centre, Shrewsbury.
Promoting Shropshire’s natural beauty while garnering a reputation for sustainable
economic development.
o Develop a diverse partnership between public and private sectors to drive a more
coherent marketing strategy for Shropshire including its AONB, food and drink offer,
as well as linkages to neighbouring Wales. This should build on recent recognition in
the media and focus on increasing private sector investment in the area.
o Where possible, planning should promote high standards of environmental quality
and efficiency in the development of new homes to help support the market for
LCEGS in Shropshire, particularly on sites such as Clive Barracks which are in public
ownership.
o Re-frame the way in which Shropshire’s environmental assets are understood so
that they are seen as resources, rather than constraints, assets rather than barriers
to growth. This is an approach which has been used by other councils40 and links to
university ambitions to become a centre of excellence for environmental sciences,
38 The Council have just published their Objectively Assessed Local Housing Need Report http://shropshire.gov.uk/media/2101729/Shropshire-Council-FOAHN-2016-.pdf 39 This is currently owned by the Ministry of Defence (MOD) but is being closed as part of the MOD’s rationalisation programme. This 69-acre site could potentially provide an opportunity for Shropshire Council to create a high quality (although not necessarily high cost) new community to complement the nearby village of Stoke-on-Tern and the work of the Stoke-on-Tern Neighbourhood Plan. 40 for example, Cambridge City Council in its Local Plan identifies the River Cam, the city’s green space and the green belt as ‘environmental assets’ which play a key economic role in supporting the high quality of life that the city enjoys and which in turn attracts investment, students and visitors to the area.

43
technology and management. This can include the opportunity for Shropshire to
deliver economic returns for future growth, for example, it is thought that there may
be potential in carbon offsetting for areas like Shropshire whereby companies can
relocate to offset environmental costs.
Build on the asset-based community development approach being developed with health
partners in a small number of neighbourhoods where there are high levels of deprivation
that have a wider impact on economic development and public services .
4.2.2 People
Vision
Shropshire’s young people are supported to develop the right skills in order to find fulfilling
employment in Shropshire and it neighbouring areas. The county provides world-class training and
support services to help create a productive working-age population. Older people are supported to
live fulfilling, independent lives, helping others and giving back to their communities.
Priorities
Providing young people with the right education for them that gets them ready for work,
with a particular focus on digital skills
A strong skills offer to support all segments of the workforce
A training offer to support people back into employment
Stop seeing ageing in Shropshire as a problem, and start seeing it as an opportunity
Actions
Work with the LEP to put together a detailed Shropshire skills strategy, which maps the
current and future skills gap and indicates how these will be filled.
o Work with schools and FE colleges to implement the findings of this strategy, so as
to ensure that young people leaving school and colleges are work ready, and have
skills that align with the needs of Shropshire’s businesses.
o Continue to work with schools and colleges to implement evidence-based
interventions to enhance employability – for example, providing for young people
to interact with business leaders and gain some experience of working life prior to
entering the workforce is a proven to enhance work readiness.
o Leverage the opportunities provided by the apprenticeships levy to develop an
Apprenticeships Action Plan to build on current strengths in this regard.
o To work with Central Government and other partners on devolution deals which
ensure that Shropshire gets extensive powers to determine its own skills policy, and
resources for doing so.
This strategy should include detailed recommendations on tackling the skills gaps for caring,
leisure, retail and customer services industries input from health, the VCS sector and
private companies.
o This should involve leveraging centres of excellence to build a workforce of 21st
century carers, as well as a schools/college-based programme to encourage more
young people to enter the care sector.
o However, older people should also be leveraged to fill this gap. Any skills strategy
should involve reaching out to older people and encouraging them to take up part

44
time employment in areas such as caring and retail, helping to combat social
isolation alongside the skills gap.
Encourage young people to stay in Shropshire.
o Work with local business to develop an information pack for graduates from
University Centre Shrewsbury, Harper Adams and the Shrewsbury College which
provides information about current opportunities with local employers as has been
developed in other areas, for example, Warwick41.
o Consider developing a package of targeted financial support for graduates in
partnership with local employers, for example, help with housing and transport
costs.
o The previous recommendations should go some way to convincing young people in
Shropshire that there are opportunities available to them within the county. This
should be combined with a strong housebuilding offer (see below) and a
sophisticated marketing strategy to keep more young people in the county.
4.2.3 Private Sector
Vision
Small and medium-sized enterprises are supported to start-up, grow and take off in an
entrepreneurial and business-friendly environment. Business leaders work with the public sector to
drive economic growth and employment. Shropshire’s core industries are supported to grow by the
facilitating environment put in place by the council, which is known as being ‘open-for-business’.
Priorities
Supporting SMEs to start-up and grow by ensuring access to finance
Closer working with the private sector by demonstrating that the council is ‘open-for-
business’
Working with the Marches LEP, WMCA and other neighbouring authorities to deliver
integrated development and devolution plans
Provide a facilitative environment for Shropshire’s core industries
Actions
Agri-Tech
o Support potential growth opportunities in creating an agri-tech cluster through
making a shift into agricultural engineering and precision farming.
o Working with neighbouring Harper Adams University to develop a world-leading
agri-tech cluster with a particular focus on attracting and supporting cutting edge,
spin-out businesses from the university with clear linkages with existing agri-
business.
o There are strong synergies between advanced manufacturing and the potential of
agri-tech which could be further harnessed through joint working with the Marches
LEP, WMCA and neighbouring local authorities such as Telford and Wrekin.
41 Warwick District Council Graduate Retention Policy: http://www.warwickdc.gov.uk/downloads/download/5/graduate_retentionhttp://www.warwickdc.gov.uk/downloads/download/5/graduate_retention

45
o Work with the UKTI lead on Agri-tech to support the development of the sector in
the future.
Food, Drink and Tourism
o Capitalise on Shropshire’s food and drink sector to support higher value tourism.
Shropshire has a buoyant food and drink industry which has the potential to
complement the tourism market in the area. Participants suggested that Shropshire
Council could adopt a more active approach to promoting local food and drink
providers in the area, through scaling-out events such as the range of food and drink
festivals held around the county.. This is an approach that has been developed
successfully by other authorities in rural areas, for example, North Yorkshire Council
and Rydale District Council have developed a Food Enterprise Zone which aims to
attract investment and boost the local supply chain.
o Support the LEP to build a coherent marketing strategy for Shropshire – many
participants argued that Shropshire was still a relatively unknown destination for
tourism, what some called ‘England’s best kept secret’. The council should work with
the LEP to co-ordinate Shropshire’s tourism economy and support initiatives to
better market the area and its visitor attractions.
Health, Social Care and Biotech
o Use the provision of University Centre Shrewsbury to develop a centre of excellence
in the provision of health and social care sector in Shropshire, specialising
particularly in delivery of health and social care services to rural areas not least
through digital health innovation.
o Identify and support a small number of niche clusters for example through biotech
and biochemistry spin-outs from University Centre Shrewsbury.
Devolution
o Working more closely with the Marches LEP, the West Midlands Combined Authority
and other neighbouring authorities to develop joined-up economic development
and devolution plans that support cross-boundary benefits without fear of
disadvantage or political recrimination.
4.2.4 Public Services
Vision
Shropshire’s people are supported to start well, live well and age well by public services that put
people first, whilst supporting Shropshire’s economic objectives of growth, productivity and
employment.
Priorities
Provide high-quality education and skills services, from early years through to secondary
education, to ensure more young people leave school excited and enabled for the world of
work.
Work with health, universities and the private and voluntary sector to deliver an innovative,
integrated offer for adult social care.
Develop a training offer as part of the Work and Health programme that helps the county to
meet many of its skills shortages.

46
Actions
Channel investment into Early Years, where the evidence suggests that there is the greatest
return in investment in terms of future development.
o Build upon the strong links between Children’s Centres and primary schools, to
ensure an excellent transition as children start in reception. This will also ensure that
schools are able to plan ahead in terms of devoting resources to providing in-depth
support for those that enter primary school with complex needs.
o Make use of the extensive research that has been conducted in this area to
implement the most efficient evidence-based ways of working. Promoting good
social and emotional development amongst children is critical for improving
attainment across the life course – evidence-based interventions based on
attachment theory, such as Signs of Safety should be a key part of the toolkit in this
area.
Set out a vision, in consultation with health colleagues and in line with STP negotiations, to
improve integration between health and social care, to increase older people’s
independence, reduce the strain on adult’s social care and the health sector and allow older
people to get more involved in their communities.
o Using the University Centre Shrewsbury to develop a centre of excellence for health
and social care provision in rural areas, pioneering the latest techniques and working
with older people themselves to push the boundaries of co-production in adult
social care.
o A technology and digital strategy should be a key part of this programme of change,
as this will allow services to operate more efficiently whilst ensuring a high standard
of care is provided. Hampshire County Council, which faced many similar issues to
Shropshire in this area, has pioneered the use of new technologies in social care.
Develop a pioneering approach to the new Work and Health Programme with multi-agency
teams and specialist advisors developing a clear ‘case for investment’ for individuals and
cohorts leading to a ‘whatever works’ approach to support provision.
o The council should develop a multi-agency task-and-finish group to explore best
practice in employment support and refresh the current approach in the county.

47
Appendix 1:
List of consultation events undertaken
Roundtable discussion with Senior Officers, Shropshire Council (including representatives
from planning, health, housing, transport and economic development)
Roundtable discussion with members of the Economic Growth Scrutiny Committee
Roundtable discussion with Shropshire Business Board
Roundtable discussion with Shropshire Council Cabinet
Roundtable discussion with External Partners (including representatives from business,
health and education)
Series of face-to-face and telephone discussions with other consultees including:
o University Centre, Shrewsbury
o Harper Adams University
o Shrewsbury Business Improvement District
o Local businesses