A Recreational Boating Characterization For Tampa...
16
Introduction Background Boating is a key element in Florida’s coastal lifestyle and growth phenomena. Florida currently ranks third in the nation in recreational boat registrations, with more than 900,000 pleasure boats registered or titled, according to the Florida Division of Highway Safety and Motor Vehicles Vessel Registrations 2003 database. This represents approximately one boat for every 17 residents. More importantly, with over 22 million estimated participants, Florida is ranked the number one destination for marine recreation including saltwater boating with an estimated 4.3 million participants in the United States (Leeworthy and Wiley, 2001). The ever-increasing number of boaters and the diversity of recreational boating activities that now take place within Florida’s coastal bays, estuaries, and waterways have had positive economic but negative environmental consequences (Leston, 2002; Antonini, Fann and Roat, 1999). Florida’s coastal counties face a major planning dilemma; how to balance growth in boating and associated coastal development with conservation and management of estuarine resources. As demand for use of Florida’s waterways increases, so does the need for enhanced public access, public safety, and environmental protection. There is, however, little information available to resource managers and planners that describes the preferences and patterns of the boating community. This study builds upon previous work conducted in the Charlotte Harbor boating region (Sidman and Flamm, 2001) by refining the questionnaire design, developing a sample selection method to target specific boater-groups, and implementing a mail survey to characterize boater preferences, activities, and water-use patterns for the high-use boating region that includes Tampa and Sarasota Bays. Information obtained from this study will enhance resource management and planning applications and contribute to educational products that can improve boating experiences and encourage resource stewardship. This report documents the data collection, compilation, and analysis of a mail survey to characterize recreational boating in Tampa and Sarasota Bays. It presents (1) the questionnaire and related correspondence; (2) the sample design and results of the mail-out; (3) a GIS density analysis that depicts the spatial distribution and clustering of trip information reported by survey respondents; (4) a density analysis of spatial boating patterns by user group, activity, draft, and boat type; and (5) a set of descriptive statistics that characterize boating groups, activities, and perceived problems, solutions to problems, and information requests. Study Goal and Objectives This project’s goal was to characterize the preferences, activities, and water-use patterns of boaters on the basis of trip origin type (i.e., marina wet-slip, dry storage facility, ramp, or private dock) and geographic sub-region (i.e., Tampa Bay or Sarasota Bay). Specific objectives included (1) developing a survey instrument and accompanying correspondence; (2) identifying target boater groups by trip departure type; (3) implementing a mail survey of 1
Transcript of A Recreational Boating Characterization For Tampa...

Introduction
Background Boating is a key element in Florida’s coastal lifestyle and growth phenomena. Florida
currently ranks third in the nation in recreational boat registrations, with more than 900,000 pleasure boats registered or titled, according to the Florida Division of Highway Safety and Motor Vehicles Vessel Registrations 2003 database. This represents approximately one boat for every 17 residents. More importantly, with over 22 million estimated participants, Florida is ranked the number one destination for marine recreation including saltwater boating with an estimated 4.3 million participants in the United States (Leeworthy and Wiley, 2001). The ever-increasing number of boaters and the diversity of recreational boating activities that now take place within Florida’s coastal bays, estuaries, and waterways have had positive economic but negative environmental consequences (Leston, 2002; Antonini, Fann and Roat, 1999). Florida’s coastal counties face a major planning dilemma; how to balance growth in boating and associated coastal development with conservation and management of estuarine resources.
As demand for use of Florida’s waterways increases, so does the need for enhanced public access, public safety, and environmental protection. There is, however, little information available to resource managers and planners that describes the preferences and patterns of the boating community. This study builds upon previous work conducted in the Charlotte Harbor boating region (Sidman and Flamm, 2001) by refining the questionnaire design, developing a sample selection method to target specific boater-groups, and implementing a mail survey to characterize boater preferences, activities, and water-use patterns for the high-use boating region that includes Tampa and Sarasota Bays. Information obtained from this study will enhance resource management and planning applications and contribute to educational products that can improve boating experiences and encourage resource stewardship.
This report documents the data collection, compilation, and analysis of a mail survey to characterize recreational boating in Tampa and Sarasota Bays. It presents (1) the questionnaire and related correspondence; (2) the sample design and results of the mail-out; (3) a GIS density analysis that depicts the spatial distribution and clustering of trip information reported by survey respondents; (4) a density analysis of spatial boating patterns by user group, activity, draft, and boat type; and (5) a set of descriptive statistics that characterize boating groups, activities, and perceived problems, solutions to problems, and information requests.
Study Goal and Objectives This project’s goal was to characterize the preferences, activities, and water-use patterns of boaters on the basis of trip origin type (i.e., marina wet-slip, dry storage facility, ramp, or private dock) and geographic sub-region (i.e., Tampa Bay or Sarasota Bay). Specific objectives included (1) developing a survey instrument and accompanying correspondence; (2) identifying target boater groups by trip departure type; (3) implementing a mail survey of
1

a random sample of target boater groups; (4) constructing spatial databases that identified trip departure sites, destinations, travel routes, and congested areas; and (5) developing a database structure to link boater activities, preferences, and trip-profiles to the spatial databases. Study Region
The Tampa and Sarasota Bay study region extends approximately 60 miles from Anclote Key in the north to Big Sarasota Pass in the south, in Pinellas, Hillsborough, Sarasota, and Manatee counties (Figure 1). Recreational boaters are attracted to this region by its many barrier islands and protected waters that provide excellent opportunities for small-craft fishing, nature viewing, and picnicking/socializing along barrier island beaches and exposed sand spits (Figure 2). The study region comprised roughly 550 square miles of interior bay waters that includes the Manatee River, and 500 square offshore miles to account for the many trips to artificial reefs in the Gulf of Mexico.
An estimated 125,000 pleasure boats are currently registered in the study region (Table 1), an 87 percent increase, on average, since 1980 (Florida Bureau of Economic and Business Research, 1980; Florida Department of Highway Safety and Motor Vehicles, Vessel Title Registration System Database, 2004). This number does not include the many thousands of vessels brought into this region each year by visitors.
Table 1. Registered Pleasure Boats by County: Sarasota and Tampa Bay Regions.
Region County 1980 2004 % Increase Sarasota 12,893 22,654 100 Sarasota Bay Manatee 8,835 18,857 113 Hillsborough 28,009 43,745 56 Tampa Bay Pinellas 28,186 49,859 77
2

Figure 1. Tampa and Sarasota Bay Study Areas.
3

Figure 2. Popular Boating Destinations.
4

Mail Survey
Survey Instrument
The mail survey is an established method for acquiring spatial and behavioral information from the perspective of the boating community (Antonini, Zobler, Sheftall, Stevely and Sidman, 1994; Antonini, West, Sidman and Swett, 2000; Falk, Graefe, Drogin, Confer, and Chandler. 1992; West 1982). A mail survey distributed to a randomly selected group is preferred over focus interviews with experts or convenience sampling (e.g., interviews at launch ramps), because it is proven to capture a wider and more representative cross-section of a population (Dillman, 1978; 1991). This is especially true of a boater population that is known to be diverse in terms of activities and/or characteristics (Sidman, Antonini, Sauers, Jones, and West, 2000). In addition to reducing the potential for sample bias, a mail survey offers greater flexibility to obtain both spatial and behavioral information than methods of strict observation such as aerial surveys (Sidman and Flamm, 2001).
The survey questionnaire developed for this study was patterned after similar, previous studies (Falk et al., 1992; Sidman and Flamm, 2001; West, 1982;) and was designed to (1) capture spatial information regarding trip departure sites, favorite boating destinations, intervening travel routes, and congested areas; (2) characterize boaters with respect to types of vessels owned and used, activity preferences, and the timing, frequency and duration of their recreational outings; and; (3) identify problems, solutions to problems, and information needs from the perspective of the boating community (see Appendix A for the survey instrument and associated correspondence).
The survey instrument was a two-sided 17 X 22 inch questionnaire that folded in quarters to 8.5 X 11 inches. The questionnaire contained a map (1:160,000 scale; 1 inch is about 2.5 miles) of the Tampa Bay and Sarasota Bay region on one side, and a series of questions on the reverse. Questions were divided into the following five topical areas:
1. Description of primary and secondary vessels 2. Description of last two pleasure boating trips 3. Description of favorite boating destinations and activities 4. Description of survey respondent 5. Questions to identify perceived problems, solutions to problems, and information
needs. The following associated correspondence was included with each mailed questionnaire.
1. A cover letter explaining the study 2. A Florida Sea Grant publication entitled “A Tackle Box Guide to Fish in Southwest
Florida” 3. A 4 X 6 card (postage paid return) that will allow each survey recipient to receive the
latest edition of a Boaters’ Guide to Tampa Bay 4. A Florida Sea Grant Boater Product Fact Sheet 5. A postage paid return envelope with postal permit indicia 6. A mailing envelope that included return address and postage permit indicia
5

A beta-version of the survey instrument was mailed to 12 individuals identified through the local Sarasota Bay and Tampa Bay Power and Sailing Squadrons who agreed to review and complete the questionnaire. Reviewer comments and suggestions were used to improve the content of the questionnaire.
The questionnaire asked survey recipients to mark, on the map, the location of the trip
departure site, travel routes, favorite destinations, and congested areas associated with their last two pleasure boating trips. Complementary questions allowed recipients to characterize their last two trips according to vessel type, the departure date and time, and time spent on the water. In addition, recipients were asked the number of days per month that they take “typical” trips and the primary activities that they engaged in while at a particular destination. They were also asked to identify and rank reasons for selecting departure sites, travel routes, and favorite destinations. Finally, a series of open-ended questions addressed problems, needed improvements, and the kinds of information that would enhance recreational boating experiences. Sample Design The sample design was developed to acquire group-specific information that can be used to compare and contrast use-patterns among four discrete boater populations that actively use the Tampa and Sarasota Bay region: Users of (1) marina wet slips, (2) dry storage facilities, (3) public ramps, and (4) private docks. The sampling design allowed for the acquisition of independent random samples for each of the four boating populations defined above. Each boater sample was further stratified by geographic sub-region (e.g., Tampa Bay or Sarasota Bay).
This sample design was developed in response to the demonstrated need for group-specific boater information. For example, spatially explicit boater information is necessary to satisfy important elements of local manatee protection plans that recommend an analysis of boating patterns and an assessment of marine facility uses, needs, and infrastructure siting (Sarasota County Manatee Protection Plan, 2003). In addition, a recent study by Riley and Stead (1999) concluded that certain boater-groups (e.g., users of commercial marina and storage facilities) shoulder an unwarranted regulatory burden for environmental impacts. Riley and Stead argue that single family docks and boat ramps represent over 90% of the boat traffic and are associated with the greatest amount of non-compliance and manatee mortality. The authors argue that policies and regulations such as speed zones and restrictions on the expansion of existing commercial boating facilities or the construction of new commercial boating facilities are, therefore, misdirected by improperly targeting user-groups least responsible for environmental impacts. Riley and Stead highlight the importance of differentiating between user-groups, boat composition, and waterway access type - defined as trip departure origins in this study - in the analyses of traffic generation and subsequent environmental impacts. Their analysis was limited, however, in its ability to quantitatively link resource pressure and impacts to specific user-groups. This was due, in part, to the inadequacy of their data to fully and objectively capture use profiles of discrete boater groups.
6

Sample Size Determination The sample size required for each of the four boater-groups is a function of the desired confidence interval and confidence level. Given a total population of finite size, N, a tolerable error amount, e, and a desired confidence level as specified by the normal random variate, z, the required sample size, n, for estimating a population proportion, p, is determined by: n = N z2 p(1-p)
(N-1)e2 + z2 p(1-p) A minimum sample size of 384 was required for each of the four boater-groups, based on a tolerable error of +- .05 and a confidence level of 95 percent (z = 1.96). This sample size was considered adequate, at the stated error and confidence level, for a population that is finite and does not exceed 2,000,000 (McCall, 1982). A gross sample of 2,000 boaters for each of the four categories was targeted to ensure obtaining 384 returns for each boater-group. This ratio assumes a return rate of approximately 20 percent, based on return rates from previous surveys of southwest Florida boaters (Antonini et al., 1994, 2000; Sidman and Flamm, 2001). Sample Selection
Vessel and boat trailer registration numbers collected at area marinas and boat ramps were used to obtain names and mailing addresses from the State’s Vessel Title Registration System (VTRS), maintained by the Florida Division of Highway Safety and Motor Vehicles (DHSMV) for the marina wet slip, marina dry storage facility, and ramp samples. The names and addresses of owners of documented vessels were obtained from the United States Coast Guard Documented Vessel database that is available on-line. Names and mailing addresses for waterfront parcel owners obtained from County tax records were compared to the VTRS to identify the dock sample (i.e., those waterfront parcel owners who also owned a boat). Marina Sample
Florida Sea Grant personnel logged the vessel registration number or the vessel name and hailing port of 5,317 vessels at a sample of 75 marinas in Sarasota, Manatee, Hillsborough, and Pinellas counties during April and May 2003 (Figure 3; Appendix B). Access to wet-slips and/or dry-storage facilities was denied at an additional 19 marinas (Appendix B). A total of 3,075 and 2,242 vessels were surveyed in marina wet-slips and in dry-storage facilities, respectively. Vessel registration numbers recorded from 3,894 boats were matched with VTRS records to obtain the names and mailing addresses of boaters who keep their vessels in marina wet-slips or in dry-storage facilities. In addition, the vessel name and hailing port of 1,423 documented vessels were also obtained and used to identify owner names and addresses from the United States Coast Guard documented vessel database, available on-line.
In many instances, a bow number or a name and hailing port match could not be established with the VTRS or United States Coast Guard databases. Furthermore, name and
7
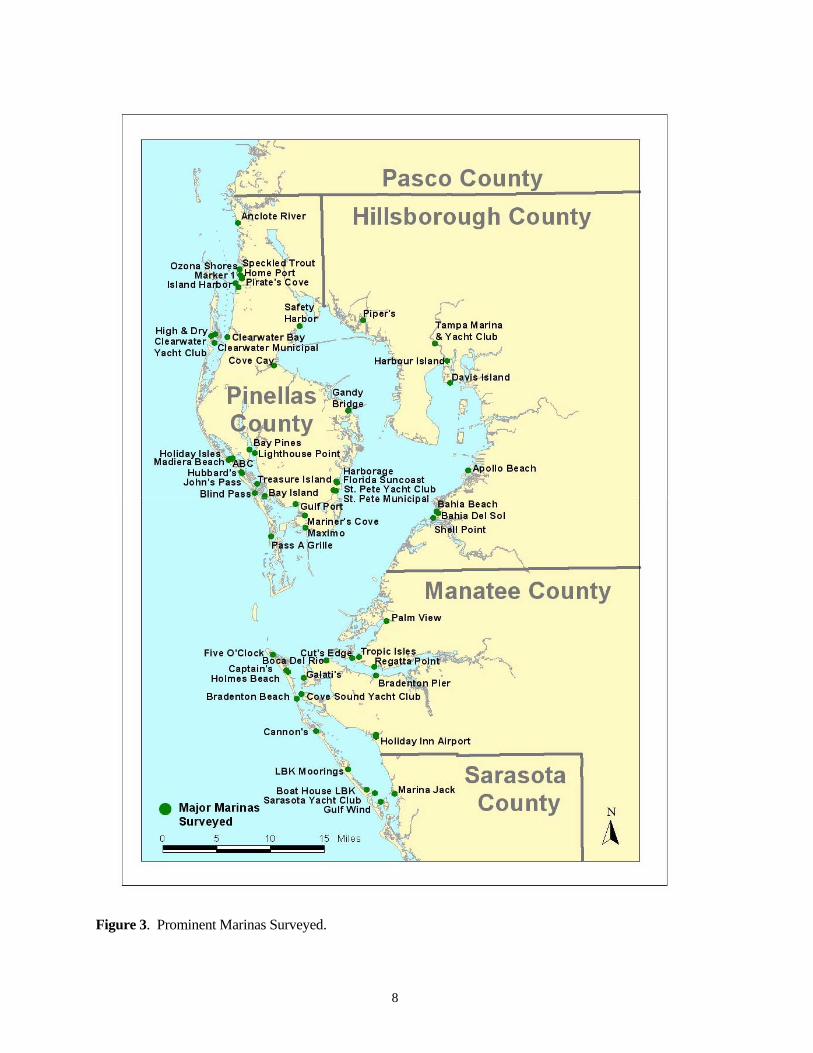
Figure 3. Prominent Marinas Surveyed.
8

mailing information for a number of VTRS bow number matches was unavailable (e.g., many individuals request that their personal information not be made public). Notwithstanding, the number of surveyed vessels was sufficient to select a sample of 1,000 marina wet-slip and 1,000 dry-storage users for Tampa Bay. This target sample size was not met for the Sarasota Bay region. Sarasota Bay marina wet-slip and dry-storage boater samples were smaller, due, in part, to the comparatively small number of these facilities in the area. However, the Sarasota Bay wet slip (N = 587), and dry storage facility (N = 505) samples are considered proportionate to the Tampa Bay samples, given the relative differences in the number of boating facilities and registered boaters between the two regions. Ramp Sample
During 2003 - 2004, FWRI field crews periodically visited 19 Tampa Bay ramps and logged the registration tag numbers from 1,991 vessel trailers (Figure 4; Appendix B). During June 2003, a complementary survey at 10 popular Sarasota Bay ramps by FSG personnel (Appendix B) yielded information on 1,733 boat trailers. Vessel trailer registration numbers were compared to the VTRS database to provide names and mailing addresses for the Tampa Bay (N = 1000) and Sarasota Bay (N = 722) ramp samples. Again, the Sarasota Bay sample is smaller than that for Tampa Bay, but is considered proportionate, given the relative differences in the number of ramps and registered boaters between the two regions.
Residential Dock Sample
A sample of dock owners (e.g., single-family and condominium residences) was selected by matching the mailing address in the VTRS to the address of waterfront parcel owners identified from Sarasota, Manatee, and Hillsborough county property tax records. Shoreline data were used to select waterfront parcels, within a GIS, for Sarasota, Manatee, and Hillsborough counties. Tax assessor’s information, which included the owner’s name and mailing address, was linked to each waterfront parcel. The Pinellas County tax assessor provided pre-selected waterfront parcel information in a non-spatial format: ASCII tab delimited. The Pinellas County parcel identification number included section, township, and range information, which was sorted and used to select an even geographic distribution of waterfront parcel owners.
The owner’s name, street number, street name, and zip code obtained from county tax records were combined and compressed (i.e., no spaces) into one concatenated field. A similar compression procedure was undertaken for VTRS owner name, address, and zip code fields. Compressed name and address information for all waterfront parcels was then linked to the corresponding compressed VTRS information to identify matches. Such matches made certain that only those waterfront parcel owners who also owned a currently registered boat were sampled (Figure 5). Matching records were then sorted by parcel centroid latitude and longitude, and by section, township, and range for Pinellas county, to ensure that a spatially even distribution of dock owners - 500 in each of the four counties - was sampled throughout both Tampa Bay and Sarasota Bay regions (Figure 6). A program stepped through matched records for each County and selected every nth record, up to N = 500, depending upon the total number of matches per county. For example, the program would select every 4th record for a county with 2000 tax assessor/VTRS address matches.
9

Figure 4. Public Boat Ramps Surveyed.
10
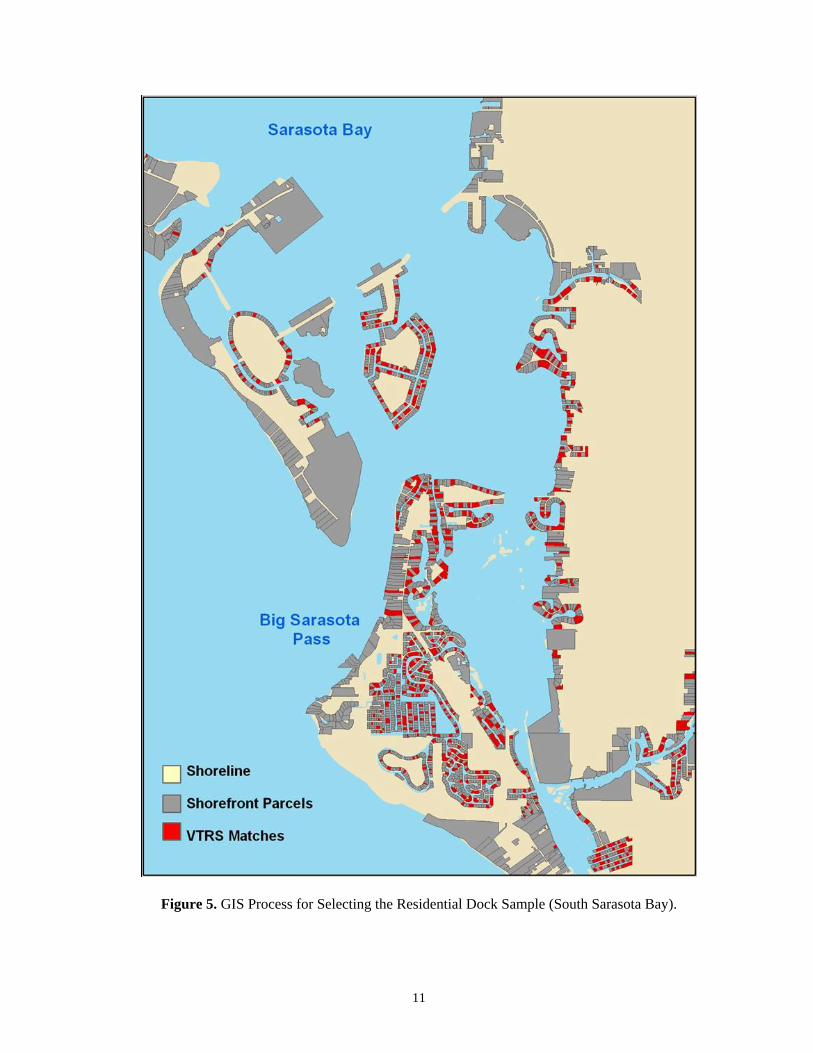
Figure 5. GIS Process for Selecting the Residential Dock Sample (South Sarasota Bay).
11

Figure 6. Residential Dock Sample.
12

Survey Return Breakdown
A breakdown of survey mail-outs and returns is presented by boater-group (i.e., marina wet, marina dry, ramp, and dock) and geographic sub-region (i.e., Tampa Bay and Sarasota Bay) in Table 2. In the table, ‘gross’ refers to the total number of surveys that were mailed; ‘net’ adjusts the ‘gross’ mailed-out calculation to account for names and addresses that could not be validated by the U.S. Postal Service, and for surveys returned by the U.S. Postal Service as undeliverable; and ‘return’ stands for the number of questionnaires that were completed and returned by survey respondents. The targeted gross sample of 2000 (e.g., Table 2: Sarasota Bay gross plus Tampa Bay gross) was not achieved for some boater groups (e.g., Sarasota Bay marina wet, marina dry, and ramp categories) due to the comparatively small number of ramps, marinas, and boat storage facilities in the Sarasota Bay area. Nonetheless, the number of returned surveys still exceeded the target number of 384 for each boater-group.
Thirty-six addresses could not be validated; 192 questionnaires were returned by the U.S. Postal Service as undeliverable; and 1,908 individuals completed and returned a questionnaire. This translated to an overall return rate of 29%. More importantly, a proportionate survey return ratio exceeding 20%, or 384 returns, was maintained for each boater-group. A supplemental mailing of letters to remind survey recipients to complete and return questionnaires was, therefore, deemed unnecessary.
Table 2. Survey Mailings and Returns by Boater-Group and Geographic Region.
Sarasota Bay Surveys Tampa Bay Surveys Boater-Group
Gross Net Returned Gross Net Returned
Total*
Surveys
Returned
% Returned
1. Marina (Wet) 586 561 177 1000 961 295 472 32
2. Marina (Dry) 505 486 133 1000 976 256 389 27
3. Public Ramp 722 670 170 1000 952 269 439 27
4. Private Dock 1000 984 329 1000 995 279 608 31
TOTALS 2813 2701 809 4000 3884 1099 1908 AVG = 29
13

GIS Database Development
Spatial Database Design
Questionnaire recipients were asked to mark the start and end point of their last two pleasure boating excursions and trace their entire travel routes on a map, as well as to identify their favorite boating destinations and annotate the map with the primary activities that they engaged in while at a particular destination. Data collected from 1,798 surveys were digitized into the ESRI ArcView geographic information system (GIS). Spatial information was either not reported by survey respondents or could not be interpreted from 110 of the returned surveys. This translated to a sample of 3,508 travel routes, 3,508 trip departure sites, 5,212 favorite boating destinations, and 1,635 areas of perceived congestion.
Spatial information was digitized ‘on-screen’ using a 1:24,000 scale shoreline and the positions of marinas, ramps, navigation aids, and artificial reefs, as background themes, to enhance the accuracy of digitized data. Trip departure sites and congested spots were digitized as point features with each record coded with the survey control number and the trip number (i.e., first or second trip). Favorite destinations were digitized as point features and were coded with the survey control number, the trip number (i.e., first or second trip), and the activities that a respondent engaged in at each favorite destination. Travel routes were digitized as line features with the following attribute information coded: Survey control number, trip number (i.e, first or second trip), round trip (or one way); if round trip, then the same route out and back, and whether or not the trip extended beyond the study area.
The database structure allowed information from survey questions to be ‘linked’ to digitized spatial information by the use of the survey control number (ID), which uniquely identified spatial and attribute information provided by each survey respondent. The selection and display of favorite destination point data within the GIS is illustrated in Figure7. A close-up of the southern Tampa Bay boating region is displayed in the GIS view. Red dots represent departure sites identified by survey respondents; green dots represent favorite destinations; yellow dots represent a sub-set of favorite destinations where survey respondents reported that they like to “nature view.” The ‘Select by Attributes’ window - upper left corner of Figure 7 - illustrates a GIS database query that selects and displays those favorite destination points that are associated with nature viewing (e.g., NV = “Y”). The ‘Selected Attributes of Destinations’ window - lower left corner of Figure 7 - displays all ‘linked’ database records in yellow. These records share the same survey control number (ID) that meet the query criterion of nature viewing (NV). As can be seen in the resulting GIS view, Egmont Key is a prime reported destination for nature viewing.
Reported travel routes within the southern Tampa Bay boating region are displayed in Figure 8. The mass of pink lines represent travel routes digitized from returned surveys; red and green dots illustrate departure sites and favorite destinations, respectively. The blue lines depicted in the GIS view represent two travel routes that have been selected for display. The corresponding database records that are ‘linked’ to the two travel routes via the survey control number ID are highlighted blue in the ‘Attributes of Routes’ database window - lower left of Figure 8.
14

Figure 7. Example of GIS Attribute Query and Display: Nature Viewing Spots.
15

Figure 8. Example of GIS Attribute Query and Display: Reported Travel Routes.
16