A Real Study-Based Modeling of Stochastic Behavior of ...A Real Study-Based Modeling of Stochastic...
10
Proceedings of the International Conference on Industrial Engineering and Operations Management Pilsen, Czech Republic, July 23-26, 2019 © IEOM Society International A Real Study-Based Modeling of Stochastic Behavior of Traffic Crash Counts Using Penalized Poisson-GzLM Abdelmagid Hammuda Qatar Transportation and Traffic Safety Center (QTTSC), Qatar University, Doha – Qatar Department of Mechanical and Industrial Engineering, College of Engineering, Qatar University P.O. Box 2713, Doha, Qatar Shaligram Pokharel, Khalifa N. Al-Khalifa Department of Mechanical and Industrial Engineering College of Engineering, Qatar University P.O. Box 2713, Doha, Qatar [email protected] Abstract Data-based prediction models for vehicular crash counts are in high demand by transport and traffic authorities in Qatar. The road crash models based on in-depth data are important for developing efficient road safety analysis and auditing. The collection of such data is often expensive or even not possible. This work outlines the process through which the penalized maximum likelihood-based Poisson regression is applied to model the vehicular crash as a function of several categories of driving licenses issued in Qatar during the period 2007-2012. A real case study from Qatar is introduced and analyzed. Keywords Road Crash Models, Penalized regression, Road Safety, Generalized Poisson Regression. 1. Introduction Prediction models for road crash counts are critical to all aspects of transport and traffic studies. Such models are crucial for developing and directing traffic and safety programs. These days, several regression-based approaches are available for shaping the relationship between vehicular crash counts with one or mode of contributory crash factors such as traffic flow, vehicular traffic volume, and road geometry. However, since road crash counts are nonnegative integers, regression models based on discrete distributions are preferable. Among the wide variety of discrete distributions, the Poisson distribution is the most popular for modeling roads crash counts such as the vehicular crash rate (VCR) and fatality (VCF). The collinearity is a problem that may arise in count regression analysis. The collinearity occurs when two or more of the model predictors are linearly related to each other. One issue associated with the collinearity is that significance of the correlated variables on the response variable might not be rightly estimated. The generalized linear models (GzLMs) are popularly used models in statistic when the response variable fails to satisfy the normality assumption. The GLM is a general form of the linear regression. Modeling road crash count with GzLM regression is common in literature (pls. see, e.g., McCullagh & Nelder (1997), Sellers & Shmueli (2010), Tortum et al. (2012), Razzaghi et al. (2013), Zha et al. (2014), Abdur Rouf et al. (2018), Ghadban et al. (2018-a), and Abdella et al. (2019-a), (2019-b)). The two well-known techniques for estimating the coefficients of the GzLM are the weighted least squares and the maximum likelihood estimation. The maximum likelihood is the most preferable method adopted by researchers. Many of statistical computer packages use the maximum likelihood estimation as the default method. However, the maximum likelihood estimates usually experience serious instability because of the collinearity between model predictors. To reach better estimates, one might replace the conventional maximum likelihood estimation by its penalized scheme. The penalized maximum likelihood estimation is formed by adding a 1910
Transcript of A Real Study-Based Modeling of Stochastic Behavior of ...A Real Study-Based Modeling of Stochastic...
Proceedings of the International Conference on Industrial Engineering and Operations Management Pilsen, Czech Republic, July 23-26, 2019
© IEOM Society International
A Real Study-Based Modeling of Stochastic Behavior of Traffic Crash Counts Using Penalized Poisson-GzLM
Abdelmagid Hammuda Qatar Transportation and Traffic Safety Center (QTTSC), Qatar University, Doha – Qatar
Department of Mechanical and Industrial Engineering, College of Engineering, Qatar University P.O. Box 2713, Doha, Qatar
Shaligram Pokharel, Khalifa N. Al-Khalifa Department of Mechanical and Industrial Engineering
College of Engineering, Qatar University P.O. Box 2713, Doha, Qatar
Abstract
Data-based prediction models for vehicular crash counts are in high demand by transport and traffic authorities in Qatar. The road crash models based on in-depth data are important for developing efficient road safety analysis and auditing. The collection of such data is often expensive or even not possible. This work outlines the process through which the penalized maximum likelihood-based Poisson regression is applied to model the vehicular crash as a function of several categories of driving licenses issued in Qatar during the period 2007-2012. A real case study from Qatar is introduced and analyzed.
Keywords Road Crash Models, Penalized regression, Road Safety, Generalized Poisson Regression.
1. Introduction
Prediction models for road crash counts are critical to all aspects of transport and traffic studies. Such models are crucial for developing and directing traffic and safety programs. These days, several regression-based approaches are available for shaping the relationship between vehicular crash counts with one or mode of contributory crash factors such as traffic flow, vehicular traffic volume, and road geometry. However, since road crash counts are nonnegative integers, regression models based on discrete distributions are preferable. Among the wide variety of discrete distributions, the Poisson distribution is the most popular for modeling roads crash counts such as the vehicular crash rate (VCR) and fatality (VCF).
The collinearity is a problem that may arise in count regression analysis. The collinearity occurs when two or more of the model predictors are linearly related to each other. One issue associated with the collinearity is that significance of the correlated variables on the response variable might not be rightly estimated.
The generalized linear models (GzLMs) are popularly used models in statistic when the response variable fails to satisfy the normality assumption. The GLM is a general form of the linear regression. Modeling road crash count with GzLM regression is common in literature (pls. see, e.g., McCullagh & Nelder (1997), Sellers & Shmueli (2010), Tortum et al. (2012), Razzaghi et al. (2013), Zha et al. (2014), Abdur Rouf et al. (2018), Ghadban et al. (2018-a), and Abdella et al. (2019-a), (2019-b)). The two well-known techniques for estimating the coefficients of the GzLM are the weighted least squares and the maximum likelihood estimation. The maximum likelihood is the most preferable method adopted by researchers. Many of statistical computer packages use the maximum likelihood estimation as the default method. However, the maximum likelihood estimates usually experience serious instability because of the collinearity between model predictors. To reach better estimates, one might replace the conventional maximum likelihood estimation by its penalized scheme. The penalized maximum likelihood estimation is formed by adding a
1910
Proceedings of the International Conference on Industrial Engineering and Operations Management Pilsen, Czech Republic, July 23-26, 2019
© IEOM Society International
penalty function to the GzLM estimates in the standard maximum likelihood function. However, the mostly applied penalty functions in practice are the least absolute shrinkage and selection operator (LASSO) and the ridge penalization. The purpose of the shrinkage is to prevent overfitting arising due to the collinearity between the model predictors. Both of these penalty functions can shrink the regression parameters towards zero values. Only the LASSO penalty can shrink the regression coefficients to exact zeros. This feature makes the LASSO-based regression the most known name in high-dimensional applications in which only factors that significantly affect the road crash rate are of interest. For further reading, see Tibshirani (1996 and 1997), Hoerl & Kennard (1970), and Verweij & Van Houwelingen (1994), and Ghadban et al. (2018-b).
Qatar has shown considerable concern about the road safety issue in recent years, resulting in a substantial reduction in road crash rate and fatalities. On 13 Jan 2013, the National Traffic Safety Committee (NTSC) has launched the National Road Safety Strategy, NRSS (2013-2022), as an ambitious step towards safe and efficient transport and traffic networks in Qatar. The NRSS consist of a series of road safety action plans to translate the vision and targets of the NTSC into a series of practical initiatives (http://www.ashghal.gov.qa/en/Services/Lists/Services). Beside the NRSS, several other strategic plans already exist in Qatar; for instance, the Travel Demand Management and the Sustainable and Active Transportation. However, the need for the crash prediction models in Qatar has become more imperious since the actual implementation of the NRSS (2013-2022). Such models are, for sure, useful to provide data-driven techniques for supporting the NTSC in overseeing the progress in the achievement of the road safety plan listed under the NRSS (Al-Hammadi et al. 2018).
These days, there is a notable trend in applied and theoretical research studies relevant to road safety in Qatar. Our study is a continuation of such a research trend. In this work, we outline the process through which the penalized maximum likelihood estimation is applied to the Poisson-GzLM regressions for developing road crash models in Qatar. This study was carried out by using real-world crash data from Qatar during the period 2009 to 2013.
The rest of this paper is organized as follows: Section 2 shows the descriptive analysis of the crash data in Qatar. Section 3 illustrates the procedures of testing the dispersion and measuring the collinearity level in the crash data. Section 4 shows an illustrative example of modeling traffic crash counts. Section 5 reports the conclusions.
2. The Crash Dataset Analysis
The rapid growth in the traffic volume in Qatar over the last ten years has accelerated the pace of research works relevant to road safety. According to the website of the Qatar Transportation and Traffic Safety Center (QTTSC), housed and managed by the College of Engineering - Qatar University, the total number of registered vehicles increased in Qatar from 130,000 in 1996 to around 1,000,000 in 2014. Also, the number of driving licenses increased from 26,000 in 1996 to 688,000 in 2014. This type of growth may have been considered as some of the factors leading to higher vehicular crash rate in Qatar. In this work, we apply the penalization-based regression to model the relationship between the motor vehicle crashes (MVCs) and five types of driving license issued during the period 2009-2013. Our crash dataset contains 58 observations representing the number of road crashes as the response variable and the log-transformation of five types of driving licenses as explanatory variables. The driving license is classified in terms of Motorcycle (M), Construction Equipment (CE), Trucks (T), Light-Vehicle-Male (LVM) and Light-Vehicle-Female (LVF). In order to investigate the effect of the population growth in the road crash rates “population density” is also considered as another contributory crash factor.
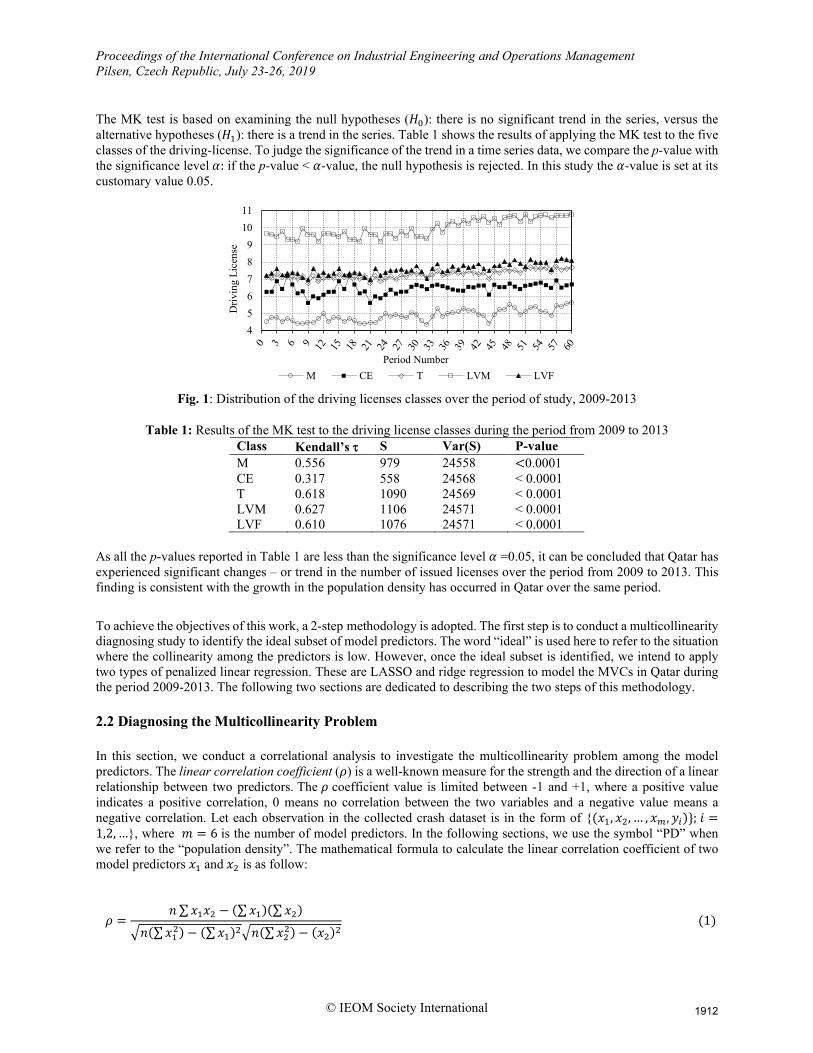
2.1 Analyzing trend and pattern Data obtained for 2009-2013, as shown from Figure 1, shows that all the five categories of the driving licenses have revealed a non-stable profile of changes. To confirm this finding, we use the Mann-Kendall (MK) test (Mann 1945, Kendall 1975). The MK test is a popular non-parametric test for investigating trends in a time series dataset, see, e.g., Kardara & Kondakis (1997) and Ofori et al. (2012). Unlike the traditional regression analysis techniques, the MK test is insensitive to the distributional assumptions making it highly recommended when there is uncertainty about the normality assumption.
1911
Proceedings of the International Conference on Industrial Engineering and Operations Management Pilsen, Czech Republic, July 23-26, 2019
© IEOM Society International
The MK test is based on examining the null hypotheses (𝐻𝐻0): there is no significant trend in the series, versus the alternative hypotheses (𝐻𝐻1): there is a trend in the series. Table 1 shows the results of applying the MK test to the five classes of the driving-license. To judge the significance of the trend in a time series data, we compare the p-value with the significance level 𝛼𝛼: if the p-value < 𝛼𝛼-value, the null hypothesis is rejected. In this study the 𝛼𝛼-value is set at its customary value 0.05.
Fig. 1: Distribution of the driving licenses classes over the period of study, 2009-2013
Table 1: Results of the MK test to the driving license classes during the period from 2009 to 2013 Class Kendall’s τ S Var(S) P-value M 0.556 979 24558 <0.0001 CE 0.317 558 24568 < 0.0001 T 0.618 1090 24569 < 0.0001 LVM 0.627 1106 24571 < 0.0001 LVF 0.610 1076 24571 < 0.0001
As all the p-values reported in Table 1 are less than the significance level 𝛼𝛼 =0.05, it can be concluded that Qatar has experienced significant changes – or trend in the number of issued licenses over the period from 2009 to 2013. This finding is consistent with the growth in the population density has occurred in Qatar over the same period.
To achieve the objectives of this work, a 2-step methodology is adopted. The first step is to conduct a multicollinearity diagnosing study to identify the ideal subset of model predictors. The word “ideal” is used here to refer to the situation where the collinearity among the predictors is low. However, once the ideal subset is identified, we intend to apply two types of penalized linear regression. These are LASSO and ridge regression to model the MVCs in Qatar during the period 2009-2013. The following two sections are dedicated to describing the two steps of this methodology.
2.2 Diagnosing the Multicollinearity Problem In this section, we conduct a correlational analysis to investigate the multicollinearity problem among the model predictors. The linear correlation coefficient (𝜌𝜌) is a well-known measure for the strength and the direction of a linear relationship between two predictors. The 𝜌𝜌 coefficient value is limited between -1 and +1, where a positive value indicates a positive correlation, 0 means no correlation between the two variables and a negative value means a negative correlation. Let each observation in the collected crash dataset is in the form of {(𝑥𝑥1, 𝑥𝑥2, … , 𝑥𝑥𝑚𝑚, 𝑦𝑦𝑖𝑖)}; 𝑖𝑖 =1,2, …}, where 𝑚𝑚 = 6 is the number of model predictors. In the following sections, we use the symbol “PD” when we refer to the “population density”. The mathematical formula to calculate the linear correlation coefficient of two model predictors 𝑥𝑥1 and 𝑥𝑥2 is as follow:
𝜌𝜌 =𝑛𝑛∑𝑥𝑥1𝑥𝑥2 − (∑𝑥𝑥1)(∑𝑥𝑥2)
�𝑛𝑛(∑𝑥𝑥12) − (∑𝑥𝑥1)2�𝑛𝑛(∑𝑥𝑥22) − (𝑥𝑥2)2 (1)
456789
1011
Driv
ing
Lice
nse
Period NumberM CE T LVM LVF
1912

Proceedings of the International Conference on Industrial Engineering and Operations Management Pilsen, Czech Republic, July 23-26, 2019
© IEOM Society International
where 𝑛𝑛 is the number of observation sets. We used the formula above to estimate the 𝜌𝜌 values of all possible pairs of the driving license classes (𝑖𝑖 ≠ 𝑗𝑗) and the population density. The correlation matrix is developed and reported as below:
M CE T LVM LVF PD M − 0.439 0.802 0.758 0.854 0.841 CE 0.439 − 0.662 0.335 0.505 0.419 T 0.802 0.662 − 0.829 0.886 0.851
LVM 0.758 0.335 0.829 − 0.771 0.857 LVF 0.854 0.505 0.886 0.771 − 0.855 PD 0.841 0.419 0.851 0.857 0.855 −
The above matrix reveals high correlation levels between several pairs of the model predictors (highlighted cells). To further quantify the severity of the multicollinearity problem in our model, we apply two more simple approaches. These are the Variance Inflation Factor (VIF) and Tolerance (T). The VIF measures the impact of the collinearity on the standard error of the regression estimates. There is no specific bound for the VIF value for judging about the multicollinearity problem. However, it is conventional in the literature to use that VIF≥10 as an indication for the presence of undesirable multicollinearity among the model predictors; see Belsley et al. (1980). If the predictor 𝑥𝑥𝑖𝑖 is highly correlated with the remaining predictors, its VIF value will be very large. Under the variable selection-based regression context, predictors with large VIF values are often excluded from the regression model. The value of the VIF indicator of the 𝑖𝑖𝑡𝑡ℎ a predictor can be estimated as follow:
VIF𝑖𝑖 =1
(1 − 𝑅𝑅𝑖𝑖2); 𝑖𝑖 = 1,2, … …𝑝𝑝 (2)
where 𝑅𝑅𝑖𝑖2 is the coefficient of determination when the predictor 𝑥𝑥𝑖𝑖 is regressed on the other predictors, and 𝑝𝑝 is the number of model predictors.
The tolerance measures the amount of information that the predictor 𝑥𝑥𝑖𝑖 can deliver under a particular level of collinearity. Tolerance takes high values as the collinearity increases (max =1). If the predictor 𝑥𝑥𝑖𝑖 has no correlation (𝑹𝑹𝑖𝑖2=0) with the other (𝑝𝑝-1) predictors, then the T is equal to 1. The value of the T indicator of the 𝑖𝑖𝑡𝑡ℎ predictor is estimated as follow:
T𝑖𝑖 =1
VIF𝑖𝑖× 100; 𝑖𝑖 = 1,2, … … 𝑝𝑝 (3)
In this section, we apply the standard Poisson regression using the natural log-link function to estimate the VIF and T values. To achieve this, we used the MINITAB software and reported the results in Table 2. For further clarification, the same results are graphically shown in Figure 1. As mentioned earlier, there is no formal threshold for the VIF and T values for determining the multicollinearity problem. For not losing generality, we decided to exclude all predictors having VIF≥10. In accordance with that, the truck driving license factor is removed from the model. However, this finding was expected since this predictor revealed high correlation levels with all of the other model predictors.
Table 2: The results of the VIF and T calculation for model predictors
Predictor Statistics 𝑹𝑹𝑖𝑖2% VIF T% 𝑹𝑹2% AIC
M 78.7 4.67 21.4
85.5 6270
CE 57.6 2.36 42.3 T 91.3 11.5 8.62
LVM 81.1 5.31 18.8 LVF 85.6 6.96 14.3 PD 85.4 6.85 14.5
1913

Proceedings of the International Conference on Industrial Engineering and Operations Management Pilsen, Czech Republic, July 23-26, 2019
© IEOM Society International
Fig. 1 Plotting the VIF and T indicators for the model predictors
Another motivation for excluding the truck driving license is the relatively small value of the tolerance associated with this predictor (T=8.60%). Strictly speaking, adding this predictor to our model will not provide much information about the variability in the MVCs in Qatar. The VIF and T values will change after one or more predictors are excluded from the model. For such a reason, we recalculate the new VIF and T values for the new set of predictors; see Table 3 and Figure 2.
Table 3: the VIF and T values after excluding the Truck-Driving license from the model
Predictor Statistics 𝑹𝑹𝑖𝑖2% VIF T% 𝑹𝑹2% AIC
M 78.5 4.66 21.4
85.5 6281 CE 25.3 1.34 74.6
LVM 75.0 4.00 25.0 LVF 81.9 5.53 18.0 PD 82.0 5.56 17.9
Table 3 shows that all of the VIF values of the new set of predictors fall below the threshold (VIF≥10). Moreover, the T values of all the predictors in the new model have increased especially the CE and LVM predictors. That, for sure, would provide a better chance to accommodate a large share of the variability around the MVCs count. Table 3 also shows that the reduction in the collinearity level between the model predictors was accompanied by a slight increase in the AIC values.
Fig. 2 Plotting the VIF and T values after excluding the Truck-Driving license from the model
3. Penalized Regression-based Techniques
02468101214
05
1015202530354045
M CE T LVM LVF PDTo
lera
nce
Model Predictor
T VIF
Variance Inflaction
VIF=10
0
2
4
6
8
10
12
0102030405060708090
100
M CE LVM LVF PD
Tole
ranc
e
Model Predictor
T VIF
Variance Inflaction
VIF=10
1914

Proceedings of the International Conference on Industrial Engineering and Operations Management Pilsen, Czech Republic, July 23-26, 2019
© IEOM Society International
Penalized regression techniques for coefficient estimation of GzLM, especially Ridge regression by Hoerl and Kennard (1970) and LASSO regression by Tibshirani (1996), have received a considerable concern over the recent years. The classical linear model expressing a continuous response variable (𝑦𝑦𝑖𝑖) as a linear function of one or more of model predictors (𝑥𝑥’s) is as follows: 𝑦𝑦𝑖𝑖 = 𝛽𝛽0 + 𝛽𝛽1𝑥𝑥𝑖𝑖1 + ⋯+ 𝛽𝛽𝑝𝑝𝑥𝑥𝑖𝑖𝑝𝑝 + 𝜀𝜀𝑖𝑖 𝑖𝑖 = 1,2, … (4)
where 𝑥𝑥𝑖𝑖𝑖𝑖 ∈ ℝ𝑛𝑛 is the 𝑖𝑖𝑡𝑡ℎ observation of the 𝑗𝑗𝑡𝑡ℎ model predictor. The values 𝛽𝛽𝑖𝑖 are the coefficients of the model predictors in the model. The error term 𝜀𝜀 is usually assumed to have a normal distribution.
In the generalized linear models (GzLMs) the error term is allowed to have a distribution other than the normal distribution. In the GzLM formulation, the response variable y is related to the model predictors through a link function. Examples of link functions include the log, logit, and probit. Several regression techniques using the GzLM formulation are available in the literature, for instance, the simple linear regression, logistic regression, and Poisson regression. The Poisson probability distribution is probably the most commonly used for modeling road safety measures including crash and fatality counts (Lord & Persaud, 2000; Lord et al., 2008; Miaou & Lord (2003); Sellers & Shmueli, 2010; Lord & Mannering, 2010; Kokonendji, 2014; Paraskevi et al., 2015, Abdella et al. (2017)). The probability density function of the Poisson distribution is as follows:
𝑓𝑓(𝑦𝑦𝑖𝑖) = 𝑒𝑒−𝜇𝜇𝑖𝑖𝜇𝜇𝑖𝑖𝑦𝑦𝑖𝑖𝑦𝑦𝑖𝑖!
; 𝑦𝑦𝑖𝑖 = 1,2, … (5)
where 𝜇𝜇𝑖𝑖 is the rate of event occurrence and 𝑒𝑒 is the base of the natural logarithm. The conditional expectation of the response variable (𝑦𝑦) following the Poisson probability distribution is
𝜇𝜇𝑦𝑦\𝑥𝑥 = 𝐸𝐸�𝑦𝑦\𝑥𝑥1, 𝑥𝑥2, … , 𝑥𝑥𝑝𝑝� = 𝑒𝑒𝛽𝛽0+𝛽𝛽1𝑥𝑥1+⋯+𝛽𝛽𝑝𝑝𝑥𝑥𝑝𝑝 (6)
The model in Equation (5) may be replaced by the following:
log (𝜇𝜇𝑦𝑦\𝑥𝑥) = log�𝐸𝐸�𝑦𝑦\𝑥𝑥1, 𝑥𝑥2, … , 𝑥𝑥𝑝𝑝�� = 𝛽𝛽0 + 𝛽𝛽1𝑥𝑥1 + ⋯+ 𝛽𝛽𝑝𝑝𝑥𝑥𝑝𝑝 (7)
There are two popular techniques used for estimating the coefficients of the GzLM shown in Equation (6). These techniques are namely known as the weighted least squares (WLS) and the maximum likelihood (ML). Several versions of the likelihood estimation are available in the literature, such as quasi-likelihood, composite likelihood, and pseudo-likelihood. However, the maximum likelihood is preferable over the WLS because the asymptotic variance is significantly small. Let 𝜇𝜇𝑖𝑖 = exp(𝑿𝑿𝒊𝒊𝜷𝜷), the log-likelihood function of Equation (6) is given as:
𝑙𝑙(𝝁𝝁;𝒚𝒚) = ∑ exp (𝑛𝑛𝑖𝑖=1 𝑿𝑿𝑖𝑖𝜷𝜷) + ∑ 𝑦𝑦𝑖𝑖log(exp(𝑿𝑿𝒊𝒊𝜷𝜷))𝑛𝑛
𝑖𝑖=1 +𝑙𝑙𝑙𝑙𝑙𝑙(∏ 𝑦𝑦𝑖𝑖!𝑛𝑛𝑖𝑖=1 ) (8)
where 𝑿𝑿𝒊𝒊 is a 𝑛𝑛 × (𝑝𝑝 + 1) design matrix and 𝜷𝜷 is a (𝑝𝑝 + 1) × 1 vector of the coefficients estimates of the GzLM in (6). 4. Modeling the Traffic Crash Counts In this section, we compare the prediction accuracy of the penalized Poisson GLM with its counterpart the classical Poisson GLM. For a fair comparison, these models will be fitted to the same dataset. This paper uses the R Software available provided by Goeman (2016) and available at https://cran.r-project.org. The classical Poisson GLM generalized regression can be obtained by setting the ridge parameter (𝜆𝜆) at zero. The K-cross-validation is a one of the optimization techniques for the tuning parameter of the penalized regression analysis. However, in this section, we conduct an analytical study using the “penalized” package by Goeman (2016) to investigate the performance of the Penalized-Poisson GLM in predicting the traffic crash counts under several values of the parameter K. More specifically, four different values of K={2,5,10,20} were suggested. Table 4 reports the fitting results (regression coefficients) under the suggested range of K.
1915

Proceedings of the International Conference on Industrial Engineering and Operations Management Pilsen, Czech Republic, July 23-26, 2019
© IEOM Society International
Table 4: Comparison of regression coefficients
Parameter
Regression Model Penalized Poisson GLM Classical
Poisson GLM
K 2 5 10 20
β�0 5.26 5.52 5.34 5.51 5.127 β�M 0.001 0.029 0.018 0.00 -0.007 β�CE 0.137 0.131 0.134 0.131 0.139
β�LVM 0.164 0.163 0.163 0.163 0.164
β�LVF 0.206 0.172 0.185 0.174 0.214
β�PD 0.034 0.027 0.028 0.027 0.043
Figure 3 shows the distribution of the regression coefficients of the penalized Poisson GLM and the classical Poisson models. As can be seen from Figure 3, the four different K folders provide different regression coefficients. When K=5, the BM and the BPD coefficient have similar values.
Fig. 3 Plotting the regression coefficients versus the number of folders used in the Cross-Validation
Several methods are available to examine the normality assumption of residuals of the regression models, i.e., 𝑒𝑒𝑖𝑖~𝑁𝑁(𝜇𝜇,𝜎𝜎2). The histogram is the most widely used. The histogram is often used to check whether the residuals are skewed or the dataset includes some outliers. The histogram plots of the residual deviance when k=2 and 20 are shown in Figures 4 and 5. These figures show an approximately normal distribution of the residuals produced by the K=2 and K=20.
Fig. 4 The histogram plot for the deviance residuals of when the number of folders k=2
0
0.05
0.1
0.15
0.2
0.25
0 5 10 15 20
Reg
ress
ion
Coi
ffice
nt V
alue
Number of folders, K
BM BCE BLVM BLVF BPD
1916

Proceedings of the International Conference on Industrial Engineering and Operations Management Pilsen, Czech Republic, July 23-26, 2019
© IEOM Society International
Fig. 5 The histogram plot for the deviance residuals of when the number of folders k=20
5. Conclusions and Remarks
This paper examines the effectiveness of the penalized Poisson GLM in modeling the traffic road counts. The real-world example illustrated that the penalization regression would provide accurate prediction models comparing with its counterparts Poisson regression model. To specify the value of the penalization parameter 𝜆𝜆, we applied the penalized likelihood estimation under the K-fold cross-validation proposed by Goeman (2016). One limitation associated with the application of the cross-validation is the case of a small traffic dataset in which the estimate of the penalization parameter 𝜆𝜆 becomes accurate. One way to overcome this limitation is the usage of the leave-one-out (LOO) cross-validation. References Abdella G. M., Kim J., Al-Khalifa, K. N, and Hamouda, A. M. S, Penalized Conway-Maxwell-Poisson regression for
modeling dispersed discrete data: The case study of motor vehicle crash frequency. Safety Science, 120, 157-163, 2019.
Abdella G. M., Al-Khalifa, K. N, Maha, T., and Hamouda, A. M. S., Modeling Trends in Road Crash Frequency in Qatar State. International Journal of Operational Research (IJOR), 34(4), 507-523, 2019.
Abdella, G.M., Alhajyaseen, W., Al-Khalifa, N.K., Hamouda, S.A., 2016. Usage of nonlinear regression for modeling the behavior of motor vehicle crash fatality (MVF) rate. In: The Proceedings of the International Conference on Industrial Engineering and Operations Management, Rabat, Morocco, April 11–13, 2017, pp. 1827–1834.
Abdur Rouf, K.B., Abdella, G.M., Al-Khalifa, N.K., Alhajyaseen, W., 2018. Ridge penalization-based generalized linear model (GzLM) for predicting risky-driving index. In: The Proceedings of the International Conference on Industrial Engineering and Operations Management, Washington DC, USA, September 27–29, 2018, pp. 1462–1473.
AL-Hammadi A. A., Albaker A. A., Al-Fakhroo J. A. Abdella G.M., Al-Khalifa K.N., Optimizing National Resource Usage through the Integration of University Shuttle Service with the Public Rail: The Case Study in Qatar University. The Proceedings of the International Conference on Industrial Engineering and Operations Management, Bandung, Indonesia, 2457-2471, 2018.
Belsley, D.A., Kuh, E. and Welsch, R.E., Regression Diagnostics. Identifying Influential Data and Sources of Collinearity. New York: John Wiley & Sons, 1980.
Ghadban, N. R., Abdella, G. M., Alhajyaseen, W., Al-Khalifa, N. K., Hamouda, A. M., & Abdur-Rouf, K. B. (2017). A Real Case-Based Study Exploring Influence of Human Age and Gender on Drivers’ Behavior and Traffic Safety. In N. A. Stanton (Ed.), Advances in Human Aspects of Transportation. AHFE 2017. Advances in Intelligent Systems and Computing, vol 597 (pp. 807–816). California: Springer International Publishing.
Ghadban N.R., Abdella G.M., Al-Khalifa K.N., Alhajyaseen, W., Analyzing the Impact of Human Characteristics on the Comprehensibility of Road Traffic Signs. The Proceedings of the International Conference on Industrial Engineering and Operations Management, Bandung, Indonesia, 2210-2219, 2018-b.
Goeman, J. J., L1 penalized estimation in the cox proportional hazards model. Biometrical Journal, 52, 70-84, 2010. Hoerl, A. E., and Kennard, R. W., Ridge regression: biased estimation for non- orthogonal problems. Technometrics,
12, 55-67, 1970.
1917

Proceedings of the International Conference on Industrial Engineering and Operations Management Pilsen, Czech Republic, July 23-26, 2019
© IEOM Society International
Kardara, M. and Kondakis, X., Road Traffic Accidents in Greece: Recent Trends (1981-1991), European Journal of Epidemiology, vol. 13, no. 7, pp. 765-770, 1997.
Kendall, M. G., Rank Correlation Methods, 4th ed., Charles Griffin: London, 1975. Kokonendji, C. C., Over- and underdispersion models, methods and applications of statistics in clinical trials:
planning, analysis, and inferential methods. Published by John Wiley and Sons, Inc., 2014. Lord, D., and Mannering, F., The statistical analysis of crash-frequency data: a review and assessment of
methodological alternatives. Transportation Research Part A, 44, 291–305, 2010. Lord, D., and Persaud, B.N., Accident prediction models with and without trend: application of the generalized
estimating equation procedure. Transportation Research Record 1717, 102-108, 2000. Lord, D., Guikema, S. D., and Geedipally, S. R., Application of the Conway–Maxwell–Poisson generalized linear
model for analyzing motor vehicle crashes. Accident Analysis and Prevention, 40, 1123-1134, 2008. Mann, H. B., Non-parametric test against trend, Econometrica, 13, 245-259, 1945. McCullagh, P., and Nelder, J. A. Generalized Linear Models, 2nd edition. Chapman & Hall/CRC, London. R0727836,
1997. Miaou, S. P., and Lord, D., Modelling traffic crash-flow relationships for intersections: dispersion parameter,
functional form, functional form, and Bayes versus empirical Bayes methods. Transportation Research Record Journal of the Transportation Research Board, 1840, 31-40, 2003.
Ofori, T., Ackah B., and Ephraim, L., Statistical Models for Forecasting Road Accident Injuries in Ghana, International Journal of Research in Environmental Science and Technology , vol. 2, no. 4, pp. 143-149, 2012.
Paraskevi, M., Quddus M. A., David, P., and Andrew, H., Exploring the factors affecting motorway accident severity in England using the generalized ordered logistic regression model. Journal of Safety Research, 55, 89-97, 2015.
Razzaghi, A. Bahrampour, Baneshi, M.R., and Zolala, F., Assessment of Trend and Seasonality in Road Accident Data: An Iranian Case Study. Health Policy and Management, vol. 1, no. 1, pp. 51-55, 2013.
Sellers, K. F., and Shmueli, G., A flexible regression model for count data. Annual Applied Statistic, 4, 943–961, 2010. Tibshirani R., Regression Shrinkage and Selection via the Lasso. Journal of the Royal Statistical Society B, 58, 267–
288, 1996. Tibshirani R., The Lasso Method for Variable Selection in the Cox Model. Statistics in Medicine, 16, 385–395, 1997. Tortum, A., Codur, MK., Kilinc, B., Modeling Traffic Accidents in Turkey Using Regression Analysis. Journal of the
Institute of Science and Technology, 2012 Verweij, P. J. M., and Van Houwelingen, J. C., Penalized likelihood in cox regression. Statistics in Medicine, 13,
2427-2436, 1994. Zha, L., Lord, D. and Zou, Y., The Poisson Inverse Gaussian (PIG) Generalized Linear Regression Model for
Analyzing Motor Vehicle Crash Data. Journal of Transportation Safety & Security, pp. 18-35, 2014 Biographies Abdelmagid M. Hammuda is a Professor in Mechanical and Industrial Engineering Department. He was recently the Dean of College of Engineering, Qatar University. He is an active member of a number of International Scientific Committees, professional societies, and standards boards. Dr. Hamouda is a fellow of the Royal Society of Art (FRSA), a senior member of the Institute of Industrial and Systems Engineering (IISE), a member of the Institute of Highway Transportation, UK, and a member of the American Society for Engineering Education (ASEE). Dr. Hamouda has published over 400 articles, of which over 200 are in well-reputed international journals. He has several patents and has edited several conference proceedings. He is currently managing research funds worth over US$4,000,000. He serves on the editorial board of a number of international journals. He and his coworkers have received a number of prestigious awards. Dr. Hamouda was selected by the Organization of Islamic Countries (OIC) as one of the Top 200 scientists within the OIC. In 2010, he was honored with the Takreem Scientific and Technological Achievement Award, one of the highest awards in the Arab world. Also, he won the Qatar University Merit Award for the years 2010 and 2014. Recently, he won the Qatar University Research Excellence Award 2016. Shaligram Pokharel is a Professor of Industrial and Systems Engineering program at the Department of Mechanical and Industrial Engineering, in Qatar University. Shaligram earned B.E (Hons) in Mechanical Engineering from the Regional Engineering College, Kashmir, India and Masters and PhD in Systems Design Engineering from the
1918

Proceedings of the International Conference on Industrial Engineering and Operations Management Pilsen, Czech Republic, July 23-26, 2019
© IEOM Society International
University of Waterloo, Canada. Shaligram has obtained more than US$ 2,000,000 research grant in various areas of engineering management. He has published more than 100 papers in journals and conferences. Khalifa N. Al-Khalifa is currently the President of College of North Atlantic, Qatar. He is also full Professor in the Industrial Engineering, Mechanical and Industrial Engineering Department, Qatar University. He was awarded his Ph.D. degree in Manufacturing Engineering, University of Birmingham, UK. His research interests focus on Total Quality Management and Quality and Reliability Engineering. He has published over 40 technical publications related to his research interest. Dr. Al-Khalifa is the chair of ASQ Doha-Qatar Local Member Community, and a member of Qatari engineering society. Currently he is managing research funds worth over USD $5,000,000. He is also a supervisor to a number of postdoctoral fellows and Ph.D. and Masters students.
1919