A quantitative approach to innovation ... - infomediation.net
65
A quantitative approach to innovation in agricultural value chains: evidence from Kenyan horticulture Aarti Krishnan, University of Manchester, [email protected] Christopher Foster, University of Sheffield, [email protected] This is a pre-publication version of an article published in the European Journal of Development Research. Abstract In less developed countries such as Kenya trade is increasingly occurring through, and employment is found within, global and local value chains. Yet, although innovation is widely recognised as crucial for development, the endogenous relationship between small-scale innovations and participation in global value chains (GVCs) has yet to be explored sufficiently. This endogeneity is highlighted using the 3L’s of labels, linkages and learnings as key overlapping factors that affect both the processes of innovation as well as GVC participation. Drawing on a survey of 320 fresh fruit farmers and 55 interviews in Kenya, we develop a novel method to quantify small-scale agricultural innovations, which are categorised into two overarching types. The first formal, emanate from meeting standard requirements; the second, informal, evolve from local contexts and are less codified. We find that GVC farmers perform more formal innovations, while local farmers perform similar levels of informal innovation to GVC farmers.
Transcript of A quantitative approach to innovation ... - infomediation.net

A quantitative approach to innovation in agricultural value chains:
evidence from Kenyan horticulture
Aarti Krishnan, University of Manchester, [email protected]
Christopher Foster, University of Sheffield, [email protected]
This is a pre-publication version of an article published in the European Journal of
Development Research.
Abstract
In less developed countries such as Kenya trade is increasingly occurring through, and
employment is found within, global and local value chains. Yet, although innovation is widely
recognised as crucial for development, the endogenous relationship between small-scale
innovations and participation in global value chains (GVCs) has yet to be explored sufficiently.
This endogeneity is highlighted using the 3L’s of labels, linkages and learnings as key
overlapping factors that affect both the processes of innovation as well as GVC participation.
Drawing on a survey of 320 fresh fruit farmers and 55 interviews in Kenya, we develop a novel
method to quantify small-scale agricultural innovations, which are categorised into two
overarching types. The first formal, emanate from meeting standard requirements; the second,
informal, evolve from local contexts and are less codified. We find that GVC farmers perform
more formal innovations, while local farmers perform similar levels of informal innovation to
GVC farmers.

1. Introduction
Global value chains (GVCs), the inter-firm linkages involved in production from raw
material supply through to final retail, are increasingly recognised as the architecture
of the global economy (Gereffi et al., 2005). Such GVCs are coordinated by global lead
firms, often from the global North, who govern such trade relationships. Standards
are recognised as crucial in global value chains. Yet those suppliers who are unable to
cope with these standards tend to get marginalized (Nadvi, 2008). A significant body
of research has explored the development possibilities for Southern farms and firms
from integrating into GVCs.
More recently, domestic and regional markets and value chains have expanded in the
global South, often coordinated by Southern lead firms and new public and private
standards. Thus, research has begun to explore the governance and development
outcomes that arise from such chains (Horner and Nadvi, 2017). Although such outlets
provide farmers with options to diversify, such end markets, also demand acquisition
of new skills to comply with southern standards. Thus, an increased possibility of
marginalization from supplying Southern lead firms also arises (Pickles et al., 2016).
Parallel to trends around integration into the global economy, the importance of
innovation has been increasingly recognised. In largely separate discussions to that on
value chains, research has explored the opportunities and challenges for innovation
in the global South. A strict definition of innovation based on “new to the world
innovations” is unsuited to developing countries (Lall, 1987; Viotti, 2002). Yet, with

lower cost technologies, techniques and the growing presence of ICT, there is potential
for wider-understood innovation at all stages of production, across a diverse set of
actors (Kaplinsky et al., 2009).
Yet until recently, although both are recognised as important, the relationship
between participating in GVCs and innovation has rarely been explored (Lundvall et
al. 2014). Recent research which has begun to explore this relationship (e.g. Lundvall
et al., 2014, Parrilli et al., 2013, Pietrobelli and Rabellotti, 2011) has suggested that it is
non-linear and endogenous. As we will explore, changing market dynamics are
mandating innovation. While “national innovation systems”, involving the key actors,
institutions and linkages related to innovation within a national context are often
focused on, it is important to consider global networks as a key source of knowledge
and technology for innovation. From a value chain perspective, the consideration of
innovation can help provide deeper insights into the variety of activities associated
with participating in global trade.
This paper focuses on small-scale innovations, which are characterised by adaptation,
novel incremental change or technology appropriation. Small-scale innovations are
comparable in scale to frugal innovations (Prabhu and Jain, 2015). Although frugal
innovations rely on aligning priorities of lead firms with grassroot actors to create
win/win solutions (Knorringa et al., 2016), with asymmetric power relations within
value chains, and diverging priorities of lead firms (Krauss and Krishnan 2016),
collaborative relationships are often not possible. This is exacerbated by the fact that

some arguments in favour of frugal innovations have tended to position small-scale
innovation as relatively spontaneous and self-guided by entrepreneurs. Thus, in this
study we look at innovation as small-scale, which allows for fleshing out the
underlying processes of absorption, and adaptation and diffusion (Berdegué et al.,
2008). We have little knowledge of when and under what conditions small-scale
innovation more readily occurs, potentially limiting our ability to transfer studies of
innovation and development into coherent evidence-driven policy advice. In this
paper, using a relational framework thereby helps nuance frugal innovation, making
it more inclusive and broadening the remit of how we understand frugal innovation.
The aim is to develop a quantitative framework to explore the links between value chains and
small-scale innovation in an agricultural context. Even with a revived emphasis on
industrialisation, the agricultural sector is crucial in many countries, especially in the
global South, and also acts as a key food supplier to the global North (Neilson and
Pritchard 2009). Equally, given that agriculture tends to include a higher proportion
of low-income and precarious workers, the sector is crucial for more inclusive
development. This work uses a mixed-method approach by drawing on an empirical
survey of 320 fresh fruit (avocado and mango) farmers and 55 interviews in Meru and
Murang’a counties in Kenya to quantify aspects of small-scale agricultural innovation.
We take farmers as an entry point into the global value chain, and unpack the key
characteristics of the innovations that they perform and the varied factors that
promote innovation. However, with the growing importance of domestic markets, we

econometrically analyse farmer innovations in local value chains, and how they
compared with those in global value chains, demonstrating heterogeneity across
different chains. To our knowledge, this is one of the first studies that attempts to
measure small-scale innovation and explicate the endogenous relationship it has with
global and local value chains.
The remainder of the paper is set out as follows. Firstly, we introduce the literature on
changing perspectives on small-scale innovation, highlighting how participating in a
particular value chain alters the processes of how small-scale innovation is achieved
and identifying what we call the 3L’s - learning, labels and linkages - that help drive
small-scale innovation. In section 3, we outline the novel research approach we
developed and used to quantify innovation. We outline details of the sampling and
analysis in section 4. In section 5 we highlight core findings, and the econometric
results in section 6, followed by linking the results to broader debates and policy
implications in Section 7.
2. Small-scale innovations, value chains and the 3L framework
Value chains and small-scale innovations can be seen as co-evolving. Indeed,
Pietrobelli and Rabelotti (2011 p.1261) argued that ”the relationship between GVC and
IS [innovation systems] is nonlinear and endogenous, and mutually affecting”. While
the seminal research of Morrison et al. (2008) and Pietrobelli and Rabellotti (2011) has
focused on manufacturing industries, studying innovation of lead firms and large

suppliers in GVCs, our research attempts to unravel this co-evolutionary and
endogenous process in the agricultural sector, focusing on farmers. This is one of the
first studies to our knowledge that systematically unpacks this relationship across
farmers in global and local value chains.
When studying the agricultural sector, some important contextual factors need to be
noted. Studies of innovation, especially related to agriculture, have moved away from
conceptualising innovation as one-time disruptive change to focusing more on
indigenous knowledge and incremental changes. Indeed, a growing literature
emphasises the importance of small-scale innovation in key practices and products in
agriculture in developing countries (e.g. Spielman, 2005, Knickel et al., 2009). This
means that small-scale innovation is centred on developing incremental innovations
that enable meeting prescribed standards. Small-scale innovations have been explored
within a number of sub-fields such as inclusive-, frugal-, jugaad-, grassroots- and
responsible-innovation. For example, instead of investing in an expensive greenhouse,
farmers build make-shift greenhouses with nets and sticks in rural Kenya.
Much literature on innovation has centred on technology absorption as a key aspect
of development (Lall and Pietrobelli, 2002, Bell, 2006). As new technologies and
techniques emerge, actors in the global South need to build know-how to allow for
effective diffusion of that innovation into local practices. This active ‘process of
adaptation’ and change is key to the successful circulation of innovations. That is to
say, farmers inherently innovate when they are mandated to use new technologies, or

follow complex processes in order to continue their livelihoods. This is akin to the
conclusions of Pietrobelli and Rabellotti (2011:1267) who found that LDC firms
innovate based on their participation in GVCs as they have to prescribe to complex
standards and requirements, and that developing efficient IS systems reduces the
complexity of the requirement. This is the starting point which we use when
developing the first genre of small-scale innovation linked to farmers in value chains-
which we call ‘formal innovations’ which are linked to how value chains are governed
i.e. be it through standards or labels, or codes of conduct, which involve a range of
complex transactions, and which are codified to different degrees by lead firms and
other actors within the value chain. Innovation here is more actively undertaken as
farmers look to adhere to requirements and norms in order to access specific global
markets (Korzun et al. 2014). For example, farmers may use and adapt rainwater
harvesting techniques as part of achieving environmental standards. They may also
incorporate new seed varieties into their farming cycles to ensure their produce can
be sold into global markets.
Furthermore, it is increasingly untenable to describe innovative activities as solely
coming from prescriptive requirements within GVCs. Innovative activities are also
likely to include not only explicit innovations passed through the GVC but also
incremental, indigenous, inclusive, frugal and small-scale innovations based upon
tacit learning, and adaptation to local conditions and needs, that are not necessarily
linked into standards within value chains (STEPS Centre, 2010, Foster and Heeks

2013). Small-scale innovation has often been seen as a relatively spontaneous or
informal ‘second order innovation’ as part of seeking “alternatives in the event of
disruption” (Knickel et al. 2009: 134). For farmers, for example, small improvements
in waste water storage to promote biodiversity on their farms or novel modes of crop
management are arguably as important to their livelihoods as disruptive
mechanisation technologies (Raina, 2009). Other examples have been documented
where equipment is adapted or modified to fit with local needs such as in the case of
adapting small-scale milling devices to fit with local crop varieties (Manyati, 2014,
Abrol & Gupta, 2014). Thus, these types of innovations have higher degrees of local
interpretation and tacit knowledge and are classified as ‘informal innovations’.
This broader perspective of drivers and facilitators of small scale innovations also
provides an important basis for extending frugal innovation literature. Frugal
innovations are characterized as low cost, good enough innovations which better
consider the needs of the poor (Knorringa et al. 2016, Radjou & Prabhu 2014, Zeschky
et al. 2011). Typically large firms are seen as key enablers of innovation but a model
of polycentric innovation also includes actors who develop locally appropriate
innovations (Beers et al. 2014).
In this perspective, however, emphasis on grassroots innovations tends to focus on
the ‘informal innovation’ activities of adapting innovations to particular contexts, yet
without substantial consideration of more ‘formal innovation’ and contested activities
related to the relations between polycentric innovators (Foster & Heeks 2014). Aligned

with this critique, definitions of frugal innovation often forefront product innovation
(Knorringa et al. 2016, Pesa 2015) over process, organisational and business model
innovation. This product focus may underplay some of the potentially more contested
and power laden aspects of innovation that relate to the relationships between these
innovators. If, as Knorringa (2016) argues, it is still unclear whether frugal innovations
lead to capitalist exploitation or ‘inclusive innovation’, then this paper can begin to
unpack the links between production relationships and inclusive innovation through
this study of agriculture. This paper attempts to develop a novel process to measure
small-scale, formal and informal innovation as explicated in detail in section 3 and
empirically explored in section 5.
In order to explore the endogenous links between innovations and value chains, we
build on recent work in this vein (Morrisson et al., 2008, Pietrobelli and Rabellotti,
2011) to isolate three critical aspects relating to small-scale innovations, which we refer
to as 3 “L’s”- labels, linkages and learning. Each of the 3L’s are closely linked to both
innovations as well as value chains and thus are key underlying factors that are
instrumental in elucidating the processes through which farmers in GVCs and LVCs
innovate and how these are co-evolutionary in nature.
The first are ‘labels’, which could be standards or certifications which are ‘expert
systems’ that are employed by lead firms or governments to ensure a certain quality
(product and/or process) has been reached (Nadvi 2008, Ponte and Ewert 2009, Evers
et al., 2014). Various research has shown that standards act as entry barriers for

farmers in GVCs and can cause marginalization (e.g. Tallontire et al., 2011), especially
because they comprise of a series of complex control points such as traceability, post
and pre-harvest measures. For instance, a study by Okello et al. (2011) showed that six
control points linked to shifting to safer pesticide, pesticide storage, traceability,
pesticide disposal pits, charcoal coolers and grading sheds, were prime causes for
Kenyan farmers’ exclusion from high value vegetable chains exporting to Europe.
Furthermore, the growing importance of standards within regional and local markets
also suggests marginalisation processes may emerge similar to those that have
emerged from selling into the global North (Pickles et al., 2016, Krishnan, 2017).
In terms of linkages, value chains and innovation system institutions are also quite
different in agriculture (compared to manufacturing) as they move away from
traditional state actors and institutions such as R&D and universities towards a wider
set of local intermediaries, community groups and extension officers (Raina, 2009,
STEPS Centre, 2010). Thus, when studying innovation from a farmer perspective in
value chains, linkages are defined as the relationships (or ties) between dyads in a
network of actors, be they individual (at varying scales) or organizational (Gereffi
1999, Henderson et al., 2002). In this paper, we move away from the governance
typology of markets, captive, relational, modular and hierarchy as discussed by
Gereffi et al. (2005) and focus on backward (input suppliers) and forward (with
buyers) linkages, because we are unpacking mico-linkages across horticulture only.
These relationships can be strong, i.e. high quality and dense, or weak and sparse
(Granovetter, 1973, Gulati, 1995). Furthermore, such relationships can also involve
trust, which is related to the longevity and the strength of the tie (Uzzi, 1996). By using
Ponte and Sturgeon’s (2014) scale of micro-linkages i.e. dyadic relationships, we make
the farmer the reference point of the analysis, and map all the dyadic relations
accordingly.
Learning forms an integral part of innovation and its diffusion. Innovation system
literature has looked at learning, in terms of both the introduction of physical
technologies as well as the social technologies to produce, at the scale of the ‘nation’
(Nelson, 2004) as well as the region. From this interpretation, it is argued that all
places have their own “national trajectories of innovativeness, technology orientation
and learning” and thus “each nation, less or highly developed, has some kind of
National Innovation System1, no matter if working well or not” (Fromhold-Eisebeth
2007:219). Thus, when overlaying this with value chains and looking at it from the
reference point of the farmer, we can nuance and extend learning- to the level of the
farmer.
Within value chain literature a key source of learning comes through direct transfer
or knowledge spillovers linked to the networks which firms and other relevant actors
are linked into (Parrilli et al. 2013, Pietrobelli and Rabellotti 2011). This suggests that
how GVCs operate in terms of knowledge, technology and learning is a key
consideration in innovation. A particularly good example of this literature is the
insightful framework developed by Pietrobelli and Rabellotti (ibid). Drawing on the

classic typology of GVC governance, they discuss and illustrate how different modes
of learning in the value chain (via. standards, imitation, knowledge spillovers, face-
to-face) vary across value chain governance (ibid).
We define ‘learning’ as a process of acquisition, accumulation and appropriation of
tacit and explicit knowledge (Ernst and Kim 2002, Gertler 2003). Tacit knowledge,
drawing from the work of Michael Polanyi, relates to experiential knowledge and lies
in ‘imperfectly accessible conscious thought’ (Nelson and Winter, 1982:79) namely
intuition and perceptive abilities (Polanyi, 1966). It is distinct from explicit knowledge
which can be coded, meaning knowledge can be structured into identifiable rules and
relationships that can be communicated and articulated easily (Kogut and Zander,
1993) and this knowledge is alienable from the code writer. Popper (1972) indicated
that codified knowledge can be abstracted and stored in the objective world, and
shared and understood through faceless communication.
However, codification can never be complete as some knowledge remains sticky in a
local context, thus limiting the efficiency of transferring knowledge (Gertler, 2003).
This raises issues about the codification process, and therefore if codes do not leave
room for interpretation (and in extension slight ambiguity), they create an inertia in
knowledge production (Ancori et al., 2000; Kogut and Zander, 1992). To prevent
inertia in knowledge creation, accumulating tacit and explicit knowledge is critical
(ibid). Thus, for formal small-scale innovations to be performed efficiently, they have
to be adapted or repurposed in line with the specific contexts of innovators (Cozzens

and Sutz, 2012, Kaplinsky et al., 2009). Thus, we look at learning as a continuum,
wherein tacit are those forms of knowledge that are accumulated by the self, be it
through personal experience or ‘purely’ cognitive abilities; while explicit forms of
learning is accrued through direct transfer, learning by seeing, imitation and learning-
by-doing which position themselves at various points in the continuum. Therefore, in
this paper we consider explicit knowledge overlaps to varying degrees with tacit
knowledge but still falls within the realm of ‘explicit’ as it has some level of
codification, whilst only ‘purely’ personal experiences or conscious thought are
classified as tacit.
In sum, small-scale innovation can be complex and multi-faceted. It relates to
potentially both ‘informal’ or ‘adaptive’ processes and more ‘formal’ technologies
diffused in the value chain. Furthermore, it may be driven by linkages and learnings
which differ within value chains. The 3L framework of learning, labels (certifications)
and linkages (backward and forward) aims to highlight key ‘processes’ that impact
participation in GVCs as well as performing small-scale innovations. Thus, the 3L’s
are clearly driving factors that impact innovation and its implementation, along with
value chains. However, before we delve into the different factors that bring out the co-
constituted and endogenous relationship between value chains and innovation, we
first need to outline a novel procedure to measure and aggregate innovation – the task
of the next section.
3. Measuring small-scale innovation

To date, there have been few attempts at measuring small-scale innovations, with
most studies relying on qualitative methods (George et al., 2012) while quantitative
measurements have been adopted more for disruptive innovations (Cozzens and Sutz,
2012, Zanello et al., 2015). Some have indirectly attempted to measure innovation in
developing countries, by using proxies such as capacity, technological capabilities,
human capital or infrastructure (World Bank 2010). However, such studies have
primarily explored innovation in Northern contexts, and there is a risk that the
variables chosen may be less applicable in Southern countries.
We measure innovation drawing on the innovation system literature, particularly the
so-called ‘wider’ perspective on innovation and learning (Lundvall, 1992). In this
perspective, small-scale innovation emerges as a cumulative outcome from multiple
activities in a sector. Innovation is measured in four steps and depicted in Figure I:
Level 1: The first level (the bottom most rung of the figure) identifies specific
tasks we call innovation activities. These include the different small-scale
innovations that are performed by farmers such as building makeshift
greenhouses during rainy seasons or calibrating pesticide application tools to
reduce wastage of pesticides and thus reduce overall costs. These activities are
elicited through in-depth interviews with farmers and other relevant actors in
the chain.
Level 2: The next level up we aggregate inter-related innovation activities into
specific innovation components. For instance, if farmers are performing

innovation activities related to water conservation for instance, be it making
furrows, hand dug wells, roof top rain water harvesting, filling water tanks,
which are incremental and related, they are all grouped under a specific
innovation component. This helps unpack the key type of motivation or
pressure related to each innovation activity. We use a version of principal
component analysis to do this, which is explained in the subsequent
paragraphs. These innovation components can be performed by both LVC and
GVC farmers.
Level 3: However, there can be multiple categories of innovation components
as overall motivations for performing innovations can vary significantly. To
explicate motivations that are linked to performing innovations linked to
participation in value chains, we further aggregate the innovation components
to form a the third level of innovation types. Thus, innovation components are
categorized into formal and informal innovations. We achieve this by once
again using a principal component analysis on innovation components to
collapse the data into these two innovation types.
The two main innovation types are: 1). Innovation from external pressures or
those that are relatively exogenous to the farmer, which we refer to as ‘formal’;
2). Local or more indigenous and adaptive forms of innovation that are
‘informal’. This division reflects our previous discussion on the structural
differences of innovation in agriculture. It is important to note that these are by

no means representative of all the types of possible innovations, but are
designed to explore different ends of the innovation spectrum.
Level 4: Finally, it is possible to aggregate the innovation types up further to
form an overarching measure of innovation, seen as a cumulative outcome
from multiple innovation types. This can provide a measurement for innovation
within a sector, for instance in our case fresh fruits. In a sense, this overarching
measure can be used as a tool to compare across sectors to understand the
complexity of innovations.
While determining sector wide innovativeness is useful, this paper stops at level three, the
innovation types, as it endeavours to nuance the structural differences of innovation in
agriculture for farmers in GVCs and LVCs. It should be noted that each innovation activity
is not necessarily equal in terms of the level and difficulty of innovation. Small scale
adaptations are likely easier to learn and use, whilst large scale disruptive activities
require greater resources and learning. Nevertheless, overall innovation is seen as the
cumulative effect of small scale innovations over time that can cause more disruptive
effects (Gault, 2010). In this study, we unpack innovations in accordance with the
innovation types. This measure of innovation is fluid and the levels can be increased
or decreased depending on the granularity of analysis required and the quality of data
available.
To measure formal and informal innovation as the cumulation of innovation
components and activities, we use polychoric principal component analysis

(Kolenikov and Angeles 2004). Polychoric principal component analysis (PCA), is a
common process of aggregation as it primarily reduces the number of dimensions (in
our case innovation activities and components) and creates principal components that
extract the most information from all the variables. Generally, the first principal
component is used as a proxy for the common information contained in the variables
corresponding to each innovation type. The results were then rescaled between the
value 0 and 1, where 0 is the lowest level of formal/ informal innovation and 1 the
highest.
In order to operationalise the innovation measures, we compare innovation activities
amongst farmers participating in global value chains (GVC) versus those in local value
chains (LVC). By doing this we are able to gauge the heterogeneous differences for
farmers across these different chains. It also provides us with a basis for broad
understanding of the three “L’s” that were outlined in section 2.
4. Research strategy
It is important to note that there are clear systematic differences between farmers
supplying into GVCs versus LVCs. Therefore, how GVC farmers innovate is also
likely to differ from LVC farmers, especially if participation in GVCs is determined by
very similar factors. We cannot assume uniform impacts across farmers, as it conceals
interaction between value chain choice and other factors influencing innovations,
leading to inaccurate conclusions. Since farmers self-select into value chains, it is likely
that the coefficient that explains impact of GVC participation on formal/informal

innovations may be biased. More so when some GVC farmers may be more efficient
and perform more formal innovations anyway, and thus the innovation effect may be
overestimated. To correct for this, it is possible to use a Heckman selection model but
this model which still assumes that the innovation function would differ only by a
constant term between GVC farmers and non-GVC farmers. However, in reality the
interaction may be more systematic, as some of the variables may affect both
participation and innovation. Maertens and Swinnen (2009) have used propensity
score matching, which helps unpack some systematic differences but only based on
observables. In our model, we claim that unobservable factors simultaneously
influence farmers’ participation in GVCs and innovation, such as intrinsic ability,
motivation to be stewards, care for their farmlands, individual skills. The switching
regression (Maddala, 1983) helps account for this. Using an endogenous switching
regression model treats each value chain as a regime and allows for structural
differences between farmers innovating in global versus local value chains. Similar
methods have been used by Rao and Qaim (2011) when studying structural
differences in incomes and participation across farmers selling into regional
supermarkets and traditional chains.
We fit a model where participation in a value chain is a binary choice decision made
by farmers, who try to maximize profits (or utility). Utility is determined by a set of
variables Z, which influence farmer capability, learning and costs (e.g. standards)
linked to adjusting to new value chains i.e. the ‘3L’ variables along with control
variables. However, these variables, Z, may also impact the innovation processes of

farmers as well. Thus, decisions for farmers to participate in a GVC or LVC market
occur through comparison of expected utility for GVC participation *
gI against
expected utility of LVC *
lI . So only when * *
g lI I will the benefits of participating in a
GVC outweigh the constraints.*
gI and *
lI are latent variables, only actual participation
in a GVC is observed ‘I’ ; with 1I if* *
g lI I and 0I if * *
g lI I . Thus, participating
in a GVC is represented as:
I Z v (1)
here, is a vector of parameters, v is error term with 0 mean and variance 2 . As
farmers have heterogeneous characteristics, some farmers self-select into GVCs while
others enter into LVCs.
Since it is possible that performing innovations are also possibly influenced by similar
factors, it is possible to hypothesize that GVC participation leads to increased
innovation performance and adoption. Thus, a simple model would entail:
y X I u (2)
Where y is innovation type index, X is a vector of 3L variables of interest and controls,
and I is the participation dummy. The coefficient y captures impact of GVC
participation on formal and informal innovation types.
Since we posit that there are systematic differences across GVC farmers and LVC
farmers, i.e. in terms of the 3L’s and the performance of formal and informal

innovations, this econometric model discussed in Maddala (1986) treats each type of
value chain as a regime shifter i.e. moving from participating in a GVC as regime 1 to
an LVC as regime 2, which is represented as follows:
*
,
,
,
g g g
l l l
y X u
y X u
I Z v
(3)
Where gy and ly represent innovation type index for GVC and LVC farmers. *I is a
latent variable determining which regime applies (forming the selection equation). g
and l are parameters which will be estimated. Even though variables in vector X and
Z overlap, proper identification requires that at least one variable in Z not appear in
X. gu , lu and v are residuals that are contemporaneously correlated- i.e. jointly
normally distributed with mean 0.
gy is only observed for the subsample of GVC farmers and ly for the LVC farmers,
only iy is totally observed which is defined as:
*
*
0
0
g
i
l
y if Iy
y if I
and
*
*
0
0 0
I if II
if I
(4)
The covariance matrix of equation 3 is as follows:
2
2
2
g gl gv
gl l lv
gv lv
(5)

Where var( gu )=2
g and var( lu )= 2
l , var(v )= 2 , cov( gu , lu )= gl , cov( gu ,v )= gv and
cov( lu , v )= lv . The variance of v is set to 1, since is estimable up to a scale factor
(Rao and Qaim 2010). Also, gl =0, since gy and ly cannot be observed together.
However, there is a need to account for unobserved factors along with observable
systemic differences. If unobserved factors are significant, then the error terms of the
regime equation and the selection equation will be correlated, suggesting endogeneity
exists. Thus if gv = lv =0 then there is exogenous switching, but it either gv or lv are
non-zero then there is endogenous switching (Maddala, 1986). The significance of the
correlation coefficients between gu and v is gv , computed as gv
g v
; and between
lu and v is lv , computed as lv
l v
(Lokshin and Sajaia, 2004), are tested. This will
suggest that both GVC participation and innovation types are endogenous and could
be affected by each other. By using the correlations, we can calculate the expected
values of the truncated error terms as:
( )( | 1) ( | ) ,
( )g g gv gv g
ZE u I E u v Z
Z
(6)
( )( | 0) ( | )
1 ( )l l gv lv l
ZE u I E u v Z
Z
(7)
Where is probability density and is cumulative density function of standard
normal distribution. These densities form g and l , which are the Inverse Mills Ratios
(IMR) evaluated at Z .

If a correlation between equation (6) and (7) exists, a two-stage model can be
calculated. The IMR can be calculated from the first stage probit and then included in
equation (3).
An alternate to this is a more efficient method that uses a full information maximum
likelihood (FIML) procedure, which jointly estimates the selection and regime
equations following Lokshin and Sajaia (2004). The co-efficients g and l in
equation (3) measure the marginal effects on covariates on innovations unconditional
on farmers in GVCs or LVCs. However, since there are covariates similar in X and Z,
the coefficients can be used to estimate conditional effects, so as to measure direct
effect of mean on gy and the other part is indirect effect from VC participation as a
result of correlation between unobserved components of gy and I. We use this FIML
procedure in this paper, while using the 2 steps as a check for robustness.
We complement the results of this quantitative analysis with interviews, both as a
form of triangulation and to enrich the results. The data used in this study emerges
from survey research of 579 horticultural farmers growing peas, mango and avocado
collected February 2015-April 2015, conducted as part of a wider project exploring the
activities of small-scale farmers in Kenya. The survey instrument was constructed
from knowledge built on interviews (during October 2014-Dec 2014), with farmers
selling into global and local markets, county governments, brokers, Kenyan export
companies, Horticultural Crops Directorate, Kenyan horticulture business
associations and NGOs; and was piloted in Jan2015.

A multi- stage sampling procedure was conducted to compare across global and local
farmers. To determine whether farmers participated in global or local chains, the
survey recorded all the markets farmers participated in. If they sold more than half
their crop produce to a specific buyer they were classified as being in that chain. At
the outset, a sampling frame was developed by collating data across multiple sources
in the global (e.g. HCD traceability lists, Kenyan Export company lists) and local value
chain (e.g. county government officials, area officers, snowball sampling through
community members) to create a sampling universe. From the universe the data was
stratified by county to identify hotspots of farmer density i.e. the main county
(Murang’a, Meru) where most Avocado and Mango farmers were located. From each
county- lists, farmers were picked at random (without replacement), while ensuring
that each farmer sampled sells into a specific end market. To correct for oversampling
we followed Deaton (1997), where sampling weights were calculated as the inverse
inclusion probabilities. These inverse inclusion probabilities were calculated at two
stages. The first stage involved weighting the sampling areas (counties) by total
number of farmers (to ensure that a proportional sample is selected) and the second
calculating a conditional probability (given a specific county) that the farmer selected
is either on the export or local list. From the 579 farmers surveyed, a subset of 320
farmers growing avocados and mangoes were selected.
5. Results: The Kenyan case

In Kenya, the high value fresh fruit and vegetable (FFV) sector has grown annually at
a rate of 10-12% in the last decade to emerge as one of the foremost foreign exchange
earners in the agricultural sector (Krishnan, 2017). Demand for FFV is continuously
growing, both on the export and regional front, as evidenced by an increase of over
30% in area under horticultural crops between 2000-2013 (HCDA, 2016).
The most prominent export fruits are mangos and avocados, which make up over 80%
of all fruit exports from the country, with almost 40% of mangoes and 60% of all
avocados exported (authors' calculations based on HCDA, 2016). The production
process of both these tree crops are similar and thus comparable. Farmers were
sampled from Meru (47% of total sample) and Murang’a county (53% of sample).
Murang’a was selected as it is the largest exporter of avocados in the country and the
third largest for Mangoes (HCDA, 2016), while Meru is a major supplier of mangoes
(ibid).
5.1 GVC and LVC farmer characteristics
Table I outlines the characteristics of GVC (n = 132) and LVC (n = 188) farmers. It shows
that, on average, farmers sold over 80% of their produce into a single value chain
suggesting that whilst diversification was present, it was possible to clearly
differentiate between these two value chains. GVC farmers appeared to be selling to
their current buyers for approximately 6 years, with local farmers selling to buyers on
average 8 years. However, interview results suggested that the length of time of
participating in a specific chain did not necessarily encourage trust as many GVC

farmers feared overdue payments and high rejection from buyers (Interview: #7k #8k).
GVC farmers had almost double the rejections of LVC farmers, highlighting the
stringency of standards in global chains.
Another way this paper measures trust is through the existence of written contracts.
The data reveals that about 51% of GVC farmers had written contracts, while the
remaining had oral (relied on word of mouth) or none; starkly different to the LVC
case where less than 1% had written contracts. Many GVC farmers interviewed
claimed that a contract gave their work more legitimacy and they would have a stable
market to sell their produce to (Interview: Farmer 4k,9k). We used an asset index as a
proxy for incomei. The results were scaled between 0 and 1, with 0 suggesting no assets
and 1 the most assets. As can be seen, GVC farmers held slightly higher assets than
those in LVC, although the difference was perhaps not as pronounced as one might
expect. Dannenberg and Lakes (2013), for example, postulated that farmers who use
ICT have higher chances of participation in a GVC and innovate more.
GVC farmers also tended to be better organized into farmer groups compared to LVC
farmers. The reason for the relatively high organization of GVC farmers was
attributed to the need to sell specific volumes to global buyers that were mentioned
within contracts. Moreover, such a formation was reported to reduce the overall costs
of logistics for lead firms, as well as to facilitate the disbursement of knowledge within
farmer groups.
5.2 Small-scale formal and informal innovations

Drawing on the approach to measure innovation outlined in section 3, we highlight
the innovation activities which form the basis of the measurements. Table II and Table
III outline the innovation activities and components used to construct the “formal”
and “informal” innovation types respectively. In line with the literature review that
positions innovation as an incremental process of change and learning, the lists of
activities include both novel activities undertaken by farmers, as well as imitative and
contextual adaptations. The tables also highlight the responses amongst farmers
participating in GVC and LVC. The results indicate that GVC farmers tend to perform
innovation activities that are more formal (technical) compared to LVC farmers, while
both groups of farmers perform informal activities to relatively similar levels.
Formal innovation indicates the importance to GVC farmers of the requirements
related to irrigation processes and waste management. These are selected because
interviews with farmers indicated that buyers were most concerned about issues
relating to irrigation and waste management, and thus farmers had to perform
considerable innovations to meet buyer criteria. Furthermore, waste management and
irrigation processes are encoded within international standards such as GlobalGAP,
and need to be adhered to in order to receive certifications. In contrast, informal
innovations are more bottom up and adaptive in nature; and the differences are less
striking in magnitude. For instance, innovation activities 3.4 and 4.4, related to
preparing for unseasonal rains and conserving water, are performed to very similar
magnitudes by both LVC and GVC farmers. Interviews with GVC and LVC farmers

elucidated that they had to adapt to climate variability and extremes as it would
impact the quality of the crop, cause higher rejection levels and reduce their income.
Thus, farmers innovated to prevent loss of livelihoods (Interview: Farmers #2k, #4k).
We then aggregated innovation activity to innovation component level, using the
principal component method discussed above. Table IV, shows the aggregated results
of each innovation type by GVC and LVC farmer. The values are scaled between 0 and
1. The findings clearly re-iterate what has been discussed that GVC farmers perform
more formal and informal innovations, which are indeed significantly different from
LVC farmers. However, the magnitude of difference is quite stark for formal
innovations, while much less in the case of informal. The results of the t-test further
re-enforce that there are significant differences between GVC and LVC farmer formal
innovations and informal innovations.
The 3L’s of value chains and innovation
In this section, we explore the three “L’s” – labels, linkage and learning related to value
chains and innovation. In this research, the two main types of standards that we
explore are GlobalGAP, which is an international food safety standard, used by over
90% of FFV exporters from Kenya (GlobalGAP, 2016); and the Kenyan Horticultural
Crops Directorate Code of Conduct, which set up its first code of conduct as a
memorandum of understanding between the buyer and the seller in 1995. The HCD
and business associations together attempted to develop local standards that included
indigenous practices, however this failed because these local standards were ‘good

enough’ or ‘benchmarked’ against international certification, which made Kenya less
competitive within export markets (Tallontire et al., 2011). Thus, by 2010, this standard
evolved into a stripped-down version of GlobalGAP. Thus local codes seem to evolve
from international standards rather than from local indigenous interpretations. In
terms of labels, Table V identifies that only 18.6% of LVC farmers adhere to standards
while almost 65% of GVC farmers are currently GlobalGAP certified. Indeed, in
interviews, many of the remaining 35% of GVC farmers follow requirements of
GlobalGAP even though they are not certified by it.
Linkages are aggregated into backward and forward linkages of network
relationships. In the survey farmers were asked to rank the quality of their
relationships as strong, weak or intermediate (between strong and weak). The ties
were proxied by the frequency and timeliness of help they received from input
suppliers and buyers and if it engendered trust. Farmers were asked if they had access
to all inputs and information relating to standards from other actors in the value chain
and whether they trusted the individuals they received inputs from and sold to.
Appendix 1 provides a breakdown of the linkages. The findings are represented as an
index value scaled between 0 and 1, where values closer to 0 are closer to overarching
weak relationships/linkages, while 1 are strong relationships, and the values closer to
the mean would be considered intermediateI. The average index value of GVC farmers
(0.625) is higher than LVC farmers (0.433) and, according to t-tests, these values are
significantly different from each other, suggesting that GVC farmers have more

supportive and helpful relationships overall compared to LVC farmers. This implies
that GVC farmers with stronger linkages could potentially perform more complex
formal innovations than LVC farmers. Informal innovations, being adaptive
processes, would not necessarily require as strong linkages.
The 3rd ‘L’ learning, shown in Table VI, clearly shows that GVC farmers have higher
explicit learning and are thus able to perform formal innovations. The interviews
indicated that this was because they had to comply with certification requirements
and thus are more likely to actively seek or be provided support by virtue of
participating in a GVC. This type of motivation and support is less readily available
for LVC farmers and hence we see a higher percentage of them adopting more tacit
modes of learning. However, in the case of informal innovations, tacit learning is far
higher than explicit learning. We can attribute this to the fact that contextual
uncertainties including climate and livelihood risks often require incremental
innovations which are not prescribed within training or standards.
Our survey allowed us to dig deeper into the modes of learning in table VI. Imitation
for formal innovations is significantly different between GVC and local farmers. This
suggests that GVC farmers tend to imitate more because they perform more complex
requirements than LVC farmers. In comparison, informal innovations are self-driven,
and therefore imitation is helpful here. It appears that GVC farmers tend to imitate
best practices more than LVC farmers. Learning through face-to-face interactions to
perform formal innovations is much higher for GVC farmers as their linkages are

stronger and denser. Whilst direct transfer for local farmers is rare, local farmers
reported that agricultural extension officers and NGOs did not provide them with any
training or demonstrations. When considering informal innovations, direct face to face
learning was found to be almost non-existent. This is consistent with our definition,
suggesting that these innovations grow out of tacit knowledge, and that explicit
knowledge does not necessarily promote informal innovations as much.
These findings on learning mechanisms highlight the key underlying characteristics
of the different innovation types across distinct value chains. Formal innovations are
closely linked to GVCs, and thus tend to be most likely to occur amongst more
connected GVC farmers and through more direct and organised modes of learning.
Informal innovations are less formally specified, and appear to be important across all
farmers. An important note to mention is that we find that learning and linkages are
intrinsically related and cannot be easily separated. Therefore, we will attempt to
interact the terms in order to get a nuanced understanding of the effects of learning and
linkages. The last 3 rows in table VI depict the interacted terms of linkages with tacit
and explicit knowledge. The t-test results indicate that there are significant differences
between GVC farmer linkages and tacit/explicit knowledge when performing formal
and informal innovations. Thus, in the econometric models presented in the next
section, we unpack in greater depth why the tacit learning and linkages, as well as
explicit learning and linkages, terms vary across farmers.

This section has elucidated the systematic differences between GVC and LVC farmers,
suggesting that GVC farmers tend to innovate more, have more explicit forms of
learning, stronger linkages, adhere to labels and are endowed with more productive
assets compared to LVC farmers. The next section will quantitatively examine how
performing formal and informal innovations differs across farmers in GVCs and LVCs
and to what extent the 3L’s impact these innovation types.
6 The dynamic relationship between value chain participation and
innovation: Estimation results
The descriptive analysis in the previous sections reveals that there are significant
differences across farmers who are in GVCs and LVCs in terms of performing formal
and informal innovations. To analyse the ‘extent’ of these differences, we deconstruct
the relationship between innovation and value chain participation, using the
endogenous switching regression model as discussed in section 3. Appendix 2
provides a summary of the key variable used in the regression. As shown in Table VII,
two separate endogenous switching regression models were run which are discussed
in the following sections.
6.1 Value chain participation and formal innovations
Determinants of participation in GVCs (selection equation Model 1)
The results of the section equation (determinants of participation in a GVC) are briefly
explained in this section. The regression results are displayed in table VIII. Column
(3) and (4) are the co-efficient and standard errors for model 1, while column (1) and

(2) is an independent probit which is a robustness test for the selection equation in
model 1. Before interpreting the results, we check for endogeneity of the duration
variable. We believe that the longer farmers participate in a chain, the higher the
probability of continuing to participate as exporters would know them better. Thus,
there might be potentially endogeneity, which would lead to a bias in the coefficient
estimate. Following the two-stage approach developed by Rivers and Vuong (1988)
and detailed in Wooldridge (2002) we find that duration is exogenous.
Farmers who have stronger linkages and use more tacit and explicit forms of learning
are more likely to participate in a GVC. These findings were supported by interviews
with farmers where export oriented farmers’ actively nurture relationships with other
network actors. Adhering to a certification appears to have a significant and positive
effect on continuing to participate in a GVC. Thus, clearly the 3Ls are jointly significant
in driving participation in a GVC.
The asset index, has a positive and significant effect on being able to continue to
participate in a GVC. These results are in line with several studies which show that
capitalized farmers are more likely to be able to participate in GVCs (e.g. Hernandez
et al., 2007). Having a contract seems to have a positive and significant effect on
farmers’ ability to continue to participate in a GVC. Many GVC farmers reported that
having a written contract gave them a ‘sense of security’ and was crucial to ‘guarantee’
that their produce would be purchased.

The data showed the results for being a member of a farmer group as insignificant in
shaping participation in a GVC. While some farmer groups or communities elect
public relations heads, who help maintain good relationships with export firms
(Interview: Farmers #1k #3k), being part of one did not automatically lead to
participation in a GVC. Interviews suggested that farmer groups did not provide
equal assistance to all its members, leading to infighting. Group members frequently
cited the lack of trustworthiness engendered by leaders as a critical issue. This reduced
cohesiveness leads to low collective efficiency, especially in terms of bargaining for
better terms of contracts or prices.
Formal Innovations in GVCs and LVCs: Outcome equation Model 1
The results in
Table IX explain the formal innovation types for farmers participating in GVCs and
LVCs. To properly identify the model (discussed in section 3), two variables in the
probit (duration and having a written contract) are excluded from this regression, as
these variables did not affect the innovation measure directlyii. To compare the results
of this model, we also ran two-stage estimation (with IMR as explained in section 4,
equation 6 and 7)3. The coefficient estimates were in a similar range, but the FIML
provides more efficient estimates. The results indicate that there are structural
differences in how farmers perform formal innovations across value chains and
further shows that the 3L’s are the most significant factors that determine innovation
types and value chain participation.
Certifications have a positive and significant effect on the levels of innovation amongst
GVC farmers. Achieving standards is likely one that requires both significant
incremental small-scale innovations, as well as possibly more disruptive ones. The
importance of innovating was explained by one GVC farmer:
“These certifications are costly… I have to be creative in how to make them work for me
with lower costs… no one tells you how you can achieve it being creative, they all expect
big changes like suddenly using drip irrigation... but I don’t have the money but need
to achieve the same results as my friends who use drip… so I build furrows, and use
sprinklers which are cheaper but almost as effective” (Farmer: #6k)
It is interesting to note that the HCD Code of Conduct that is followed by some local
farmers, has a significantly negative relationship with formal innovations. This means

that achieving a local standard does not promote innovation, thus questioning the
extent to which local standards encourage local development.
The interaction of tacit learning and linkages has a positive and significant effect for
GVC farmers and promotes performing formal innovations. For GVC farmers, the
links between tacit learning and formal innovation relate to the ways that innovation
often requires “tweaking” in local contexts in order to be appropriate. One example
found in wider discussions related to farmers involves adopting new pesticides in the
right quantities. In this case, tacit learning was essential for ensuring that the
maximum residue limit on export quality mangoes and avocados was not
contravened. Thus, in this case tacit learning impacted the extent to which the produce
was safe for export to EU. While tacit knowledge was important, the use of it was quite
contested in GVCs, especially when farmers were asked to rely on ‘expert systems’
and perform requirements a ‘specific way’ that would ensure meeting global buyer
requirements. Thus, the magnitude of effect of tacit knowledge and related linkages
is far less than explicit knowledge and the requisite linkages.
For local farmers, the linkages and tacit knowledge variable was not significant in
engendering formal innovations for several reasons. Interviews with local farmers
suggested that they did not have to prescribe to stringent standards and never felt the
‘need’ to perform such innovations, while some also claimed that even if they did try
to innovate to add something ‘extra’ to the crop, it would not necessarily be
remunerated.

Explicit learning and the related linkages are positive and significant and abet increase
in performing formal innovations across both GVC and LVC farmers. Direct transfers
of knowledge are facilitated through trainings and workshops. Interviews with local
farmers suggested that they benefitted greatly from spillover knowledge they
received via other GVC farmers, as well as attending demonstrations that GVC
farmers would hold on their land. This meant that in many ways GVC farmers were
able to spread their knowledge even if through weaker ties, and cause overall benefit
in stimulating local formal innovations. This suggests a slow and gradual absorption
of new incremental practices trickling down across value chains and building
livelihood resilience for local farmers.
The asset index appears to be positive and significant for LVC farmers to perform
formal innovations. This is because local farmers have weak linkages and far less
explicit knowledge compared to GVC farmers. Therefore, they have to rely
significantly on their own ‘capital’ that can substitute for the lack of support. Several
LVC farmers also stated that asset indexes were used as a measure to make up for the
relative lack of infrastructural facilities in Kenya.
Rejection levels appear to be positive and significant forces that push GVC farmers to
perform more formal innovations. We show in Table I that almost 15% of the crop is
rejected per farmer, which causes significant income losses, as one GVC farmer
explained:

“Buyers reject my crop and do not tell me why… So this time I did changed [adapted]
growing practice to what I used to follow before [indigenous methods] and now they
reject less...” Farmer: #7k)
This points towards the importance of local context in formal innovations, occurring
through bottom up change.
Farmer groups appear to be positive and significant in relation to LVC farmers’ formal
innovations. This means that being a member of a farmer group abets innovation and
suggest that local groups are more inclusive. These results are starkly opposite to the
GVC-related farmer groups which seem to be ineffective and exclusionary in terms of
innovation, because of the lack of sharing of knowledge within the group and the dis-
trust in members.
The lower part of table IX reports estimates for the covariance terms. The likelihood
ratio test for joint independence of the selection and innovation equations is
significant (12.77), suggesting that there is dependence between the equations, and
highlighting that endogeneity exists. This model was able to control for this through the
specification. Furthermore, since ρeg<ρlv and is significant (following Trost 1981), it
implies that GVC farmers perform more formal innovations than even if they participated in
LVCs. Thus, they are more efficient farmers because of their experience of participating
in a GVC. This re-enforces the links between GVCs and innovation.
6.2 Value chain participation and informal innovations
Determinants of global value chain participation: Selection equation model 2

The results for the selection equation in model 2 are presented in table X below. These
variables are similar to the selection equation in model 1. The only difference is in the
variables of tacit and explicit learning which are assigned values according to
knowledge learnt doing informal innovations, while in model 1, these values were
linked to formal innovations.
The results indicate that the interaction variables of tacit learning and related linkages
and explicit learning and linkages are significant and positive. Since the results are
similar to model 1, we do not repeat them.
Informal innovations and value chains: outcome equation model 2
Results in Table XI (outcome regression) show that certifications have a positive and
statistically significant effect on both GVC and LVC farmers performing informal
innovations. It denotes that international certifications and local codes of conduct
(standards) are able to promote farmers’ ability to perform informal innovations that
could impact their crops. This is interesting as it shows that even though international
certifications and HCD codes of conduct concentrate on export related good practices,
they can potentially still promote bottom-up innovations.
The interaction terms of tacit and explicit learning mechanisms and linkages appear
to be positive and significant factors that affect informal innovations across GVC and
LVC farmers. Many researchers have qualitatively discussed the importance of tacit
learning (e.g. Gereffi et al., 2005, Peitrobelli and Rabelotti, 2011), while many
quantitative studies have focused primarily on explicit (e.g. Okello et al., 2011). Our

research suggests both are critical, especially because the effects of tacit-linkages and
explicit-linkages have similar magnitude of coefficients. The importance of tacit
knowledge signifies that explicit knowledge alone is not comprehensive enough for
farmers. This insinuates that knowledge is indeed sticky, and highlights the need for
bottom-up knowledge to promote not only informal but formal innovations.
We are able to empirically show that farmers in GVCs and LVCs perform formal and
informal innovations differently because the 3L’s effect each of them in different ways.
Overarchingly, the 3L’s are important because they are crucial factors that show the
endogenous relationship between value chains and innovations.
Farmer groups have a contradictory effect on informal innovation in GVCs and LVCs
compared to formal innovation. It seems that being part of a farmer group has a
significantly negative effect on informal innovations for both GVC and LVC farmers.
For LVC farmers this means that learning tacitly seems to be driving performance of
informal innovations and collective learning through groups is not very helpful. For
GVC farmers it reveals that being part of a farmer group has a negative effect on
performing any kind of innovation. Thus, farmer groups need to be revamped
significantly in order to attain collective efficiency. There is indeed a need to re-think
what it means for farmer organization and the role it plays in promoting innovations.
The asset index has a positive and significant effect on informal innovations
performed by LVC farmers. With low levels of explicit support and poor forward

linkages, the importance of maintaining and accumulating assets for LVC farmers is
crucial for them to be able to continue to sell into local markets.
7 Discussion and conclusion
This paper seeks to build on recent work which explores the endogenous link between
participating in value chains and innovation. In that context, we distinctively measure
small-scale innovations in the agricultural sector, thus integrating a range of different
innovative activities into a single measure. We develop two small-scale innovation
types: formal, those linked to standards; and informal which are harder to codify and
embedded in local contexts.
In considering the relationship between innovation and value chain participation, we
consider the 3Ls – labels, learning and linkages to be crucial. The results suggest that
adhering to labels increases the possibility of formally innovating, and thus raises
interesting questions related to using standards as mechanisms to promote different
forms of innovation and development. We find that farmers involved in GVCs are
more likely to be involved in formal type innovation compared with those involved
in local value chains, although some farmers focused on local markets are involved in
formal innovations. For farmers focused on local markets, the evidence of some
involved in formal innovations suggest a potential presence of ‘entrepreneurial’
farmers who, even without GVC linkages, are able to tactically absorb new practices
and skills. Further work could look into the processes by which these ‘entrepreneurial’
farmers grow and what measure can make such activity more widespread.

Learning and linkages are the other two key factors that suggest an endogenous
relationship. The introduction of the notions of explicit learning and tacit learning
have highlighted the varying nature of learning across farmers and value chains. In
the GVC case, most innovation occurs due to direct transfers of explicit knowledge
linked to value chain participation. However, in our research we found that
community-related linkages also played a crucial role in supporting not only farmers
in GVCs but also LVCs. Thus, the footprints of often narrow training schemes are not
solely responsible in prompting innovations, as knowledge spillovers and leakages
appear to be trickling down to local farmers, building their overall capacity. Results
around indirect explicit and tacit transfer also pose questions around the ‘quality of
learning’ and whether spreading knowledge in less formal ways enables quicker
conversion from explicit to tacit.
Having found formal innovation to be more prominent for GVC farmers, it is
noticeable that informal innovation was observed across both GVC and LVC farmers.
These findings highlight the importance of a range of small-scale, adaptive practices
that have evolved locally, and which indicate new potential directions for policy and
civil society action to support resilience building amongst farmers. Such informal
innovations should not be assumed to ‘simply diffuse’, especially because of the
difficulty in codification and reliance on tacit knowledge. The inability to perform
informal innovations can cause loss of crop yields and quality and thus reduce sales
of crops to both global and local buyers, impinging on income. This can potentially

cause spillover effects onto how formal innovations are performed. Further research
could explore how informal innovation might be better disseminated, improved and
learned from so as to maximise its efficacy of local contexts and for pro-poor growth.
Having focused on small-scale innovation that is adaptive and incremental, this
research also provides some insights for existing literature on frugal innovation.
Epistemologically, much of the literature on frugal innovations focuses on top-down
relationships that are driven by lead firms and which, in an endeavour to be more
inclusive, attempt to forge interactive and polycentric relationships with local actors
(Knorringa et al., 2016). Overall, the idea of collaborative growth is entrenched
(Radjou and Prabhu, 2014). However, such collaborative processes are difficult to
achieve in GVCs due to skewed power asymmetries, and the lack of involvement of
farmers in setting standards. Thus, powerful actors ‘govern’ GVCs, while farmers only
experience ‘governance’, which often leads to contested relationships (Nielson and
Pritchard 2009). Another crucial point to highlight for frugal innovation is the link to
product innovations. However, farmers in Kenya have to perform several process
innovations which are informal and tacit in nature. These aspects are still to be
included within the remit of frugal innovations and highlight a broad set of activities
responding to changing local contexts (such as climatic shocks) as well as mitigating
against demands of GVC relationships (such as standards and diffusion of
problematic top-down innovation). Some of these aspects are less explored in frugal
innovation, which positions small-scale innovation less within ‘inclusive’ processes

and more in terms of a new frontier of challenges and risk for farmers as diffusion of
novel requirements and innovations make ever greater demands on them. Thus this
paper, by giving agency to the farmer, contributes to the growing debate around “who
innovation should be for” and “what does innovation mean for the poor”.
Given the novelty of seeking to measure innovation within agro-value chains, there is
scope for further research pursuing this agenda. The decisions on selecting what
innovations to include in the farmer survey was a difficult task. The consideration of
a wider range of innovation can improve the efficacy of the innovation measure. The
endogenous link suggests that it is possible to consider both agricultural and
innovation linked policy. These findings highlight the role of local innovation
ecosystems in helping to support a move of farmers into international markets by
focusing on the 3L’s. Thus, policymakers have an opportunity to be able to help
mutually address both value chain inclusiveness together with innovation through
focusing on overlapping factors. At the same time, they need to be aware of the
potential downsides of innovation which may, in some cases, incorporate farmers into
unstable and subservient relationships with global markets and be less impactful in
the long run.
NOTES
1Since the farmers were sampled from similar regions and have similar assets, they can be
assumed to report relatively comparable strength and weakness of relationships.

2 Broadly a national innovation system refers to the flow of technology and knowledge within
a national state or embedded in a nation, by a network of institutions, which abet diffusion
and uptake of innovations.
3 Income data attained in the survey was not cross-validated. Asset indexes have been used in
several studies (e.g. Carter and Barett 2006) as an alternative to income.
4 Results are not shown due to space constraints
5 GVC participation is correlated with duration 0.2688 (sig 0.000) and with contracts 0.2593
(sig 0.000), while formal innovation is correlated with duration 0.0588 (sig 0.3004) and
contracts 0.0692 (sig=0.200. Falsification tests also suggest removing both variables.
ACKNOWLEDGEMENTS
The authors would like to acknowledge the support from Peter Knorringa, Kate
Meagher, Khalid Nadvi, Kunal Sen and Rory Horner for their comments on earlier
drafts of this paper.
References
Abrol, D. & Gupta, A. (2014) Understanding the Diffusion Modes of Grassroots
Innovations in India: A Study of Honey Bee Network Supported Innovators. African
Journal of Science, Technology, Innovation and Development, 6(6), pp. 541–552.

Ancori, B., Bureth, A., & Cohendet, P. (2000). The economics of knowledge: the
debate about codification and tacit knowledge. Industrial and Corporate
Change, 9(2), 255–287.
Beers, C. van, Knorringa, P. & Leliveld, A. (2014) Frugal Innovation in
Africa: Towards a Research Agenda. Paper presented at: 14th EADI General
Conference, Bonn, Germany, 23rd Jun.
Bell, M. (2006) ‘Time and technological learning in industrialising countries: how long
does it take? How fast is it moving (if at all)?’, International Journal of Technology
Management, 36(1–3): 25–39.
Berdegué, J. A., Biénabe, E. and Peppelenbos, L. (2008) ‘Keys to inclusion of small-
scale producers in dynamic markets-Innovative practice in connecting small-scale
producers with dynamic markets’. IIED.
Cozzens, S. and Sutz, J. (2012) ‘Innovation in informal settings: a research agenda’,
IDRC, Ottawa, Canada, pp. 1–53.
Dannenberg, P. and Lakes, T. (2013) ‘The use of mobile phones by Kenyan export-
orientated small-scale farmers: insights from fruit and vegetable farming in the Mt.
Kenya region’, Economia agro-alimentare. FrancoAngeli Editore.
Ernst, D. and Kim, L. (2002) ‘Global production networks, knowledge diffusion, and
local capability formation’, Research Policy, 31(8): 1417–1429.
Evers, B. J., Amoding, F. and Krishnan, A. (2014) ‘Social and economic upgrading in
floriculture global value chains: flowers and cuttings GVCs in Uganda’. Capturing the
Gains working paper: 39
Foster, C. and Heeks, R. (2013) ‘Conceptualising inclusive innovation: Modifying
systems of innovation frameworks to understand diffusion of new technology to low-

income consumers’, The European Journal of Development Research. Springer, 25(3):
333–355.
Foster, C. & Heeks, R. (2014) Nurturing User–Producer Interaction: Inclusive
Innovation Flows in a Low-Income Mobile Phone Market. Innovation and
Development, 4(2), 221–237.
Gault, F. (2010) Innovation strategies for a global economy: Development,
implementation, measurement and management. IDRC.
George, G., McGahan, A. M. and Prabhu, J. (2012) ‘Innovation for inclusive growth:
Towards a theoretical framework and a research agenda’, Journal of management
studies, 49(4): 661–683.
Gereffi, G. (1999) ‘International trade and industrial upgrading in the apparel
commodity chain’, Journal of international economics, 48(1): 37–70.
Gereffi, G., Humphrey, J. and Sturgeon, T. (2005) ‘The governance of global value
chains’, Review of international political economy. Taylor & Francis, 12(1): 78–104.
Gertler, M. S. (2003) ‘Tacit knowledge and the economic geography of context, or the
undefinable tacitness of being (there)’, Journal of economic geography, 3(1): 75–99.
Granovetter, M. S. (1973) ‘The strength of weak ties’, American journal of sociology, 78(6):
1360–1380.
Gulati, R. (1995) ‘Does familiarity breed trust? The implications of repeated ties for
contractual choice in alliances’, Academy of management journal, 38(1): 85–112.
HCDA (2016) Horticulture Validated Report 2015. Nairobi. Available at:
http://www.agricultureauthority.go.ke/wp-content/uploads/2016/05/Horticulture-
Validated-Report-2014-Final-copy.pdf.

Henderson, J., J., Dicken, P., Hess, M., Coe, N. and Yeung, H.W.C., (2002) ‘Global
production networks and the analysis of economic development’, Review of
international political economy, 9(3): 436–464.
Hernández, R., Reardon, T. and Berdegué, J. (2007) ‘Supermarkets, wholesalers, and
tomato growers in Guatemala’, Agricultural Economics 36(3): 281–290.
Horner, R. and Nadvi, K. (2017) ‘Global value chains and the rise of the Global South:
Unpacking 21st century polycentric trade’, Global Networks, Forthcoming.
Kaplinsky, R. et al. (2009) ‘Below the radar: what does innovation in emerging
economies have to offer other low-income economies?’, International Journal of
Technology Management & Sustainable Development. Intellect, 8(3): 177–197.
Knickel, K. et al. (2009) ‘Towards a better conceptual framework for innovation
processes in agriculture and rural development: from linear models to systemic
approaches’, Journal of Agricultural Education and Extension, 15(2):131–146.
Knorringa, P. et al. (2016) ‘Frugal innovation and development: aides or adversaries?’,
The European Journal of Development Research. Springer, 28(2): 143–153.
Kogut, B., & Zander, U. (1992). Knowledge of the firm, combinative capabilities, and
the replication of technology. Organization Science, 3(3), 383–397.
Kolenikov, S. and Angeles, G. (2009) ‘Socioeconomic status measurement with
discrete proxy variables: Is principal component analysis a reliable answer?’, Review
of Income and Wealth, 55(1): 128–165.
Korzun, M., Adekunle, B. & Filson, G.C. (2014) Innovation and Agricultural Exports:
The Case of Sub-Saharan Africa. African Journal of Science, Technology, Innovation and
Development, 6(6), pp. 499–510.

Krauss, J. and Krishnan, A. (2016) Global decisions and local realities: priorities and
producers’ upgrading opportunities in agricultural global production networks. 7.
Geneva. Available at: https://unfss.files.wordpress.com/2013/02/discussion-
paper_unfss_krausskrishnan_dec2016.pdf.
Krishnan, A. (2017) ‘The Origin and Expansion of Regional Value Chains: The Case of
Kenyan Horticulture’, Global Networks. doi: 10.1111/glob.12162.
Lall, S. (1987). Learning to industrialize: the acquisition of technological capability by
India. Springer.
Lall, S and Pietrobelli, C (2002) ‘Failing to Compete: Technology Development and
Technology Systems in Africa. Cheltenham, Edward Elgar: Oxford University Press.
Lokshin, M. and Sajaia, Z. (2004) ‘Maximum likelihood estimation of endogenous
switching regression models’, Stata Journal, 4: 282–289.
Lundvall, B.-Å. (2010) National systems of innovation: Toward a theory of innovation
and interactive learning. Anthem Press.
Lundvall, B.-Å. and Lema, R. (2014) ‘Growth and structural change in Africa:
development strategies for the learning economy’, The Learning Economy and the
Economics of Hope, p. 327.
Manyati, T. (2014) Agro-Based Technological Innovation: A Critical Analysis of the
Determinants of Innovation in the Informal Sector in Harare, Zimbabwe. African
Journal of Science, Technology, Innovation and Development, 6(6), pp. 553–561.
Morrison, A., Pietrobelli, C. and Rabellotti, R. (2008) ‘Global value chains and
technological capabilities: a framework to study learning and innovation in
developing countries’, Oxford development studies, 36(1): 39–58.
Nadvi, K. (2008) ‘Global standards, global governance and the organization of global
value chains’, Journal of economic geography. Oxford Univ Press, 8(3): 323–343.

Nelson, R. (2004) ‘The challenge of building an effective innovation system for catch-
up’, Oxford Development Studies, 32(3): 365–374.
Nelson, R. R., and Winter, S. G. (1982). The Schumpeterian tradeoff revisited. The
American Economic Review, 72(1), 114–132.
Okello, J. J., Kirui, O., Njiraini, G.W. and Gitonga, Z., (2011) ‘Drivers of use of
information and communication technologies by farm households: The case of
smallholder farmers in Kenya’, Journal of Agricultural Science, 4(2): 111.
Parrilli, M. D., Nadvi, K. and Yeung, H. W. (2013) ‘Local and regional development in
global value chains, production networks and innovation networks: A comparative
review and the challenges for future research’, European Planning Studies. Taylor &
Francis, 21(7): 967–988.
Pesa, I. (2015) Homegrown or Imported?: Frugal Innovation and Local Economic
Development in Zambia. Southern African Journal of Policy and Development, 2, p. 15-25.
Pickles, J., Barrientos, S. and Knorringa, P. (2016) ‘New end markets, supermarket
expansion and shifting social standards’, Environment and Planning A. SAGE
Publications Sage UK: London, England, 48(7): 1284–1301.
Ponte, S. and Ewert, J. (2009) ‘Which way is “up” in upgrading? Trajectories of change
in the value chain for South African wine’, World Development. 37(10): 1637–1650.
Ponte, S. and Sturgeon, T. (2014) ‘Explaining governance in global value chains: A
modular theory-building effort’, Review of International Political Economy. 21(1):
195–223.
Polanyi, M. (1966). The logic of tacit inference. Philosophy, 41(155), 1–18
Popper, K. R. (1972). Objective knowledge: An evolutionary approach.
Prabhu, J. and Jain, S. (2015) ‘Innovation and entrepreneurship in India:
Understanding jugaad’, Asia Pacific Journal of Management. Springer, 32(4): 843–868.

Raina, R. S. Joseph, K., Haribabu, E. and Kumar, R. (2009) ‘Agricultural innovation
systems and the coevolution of exclusion in India’, Systems of Innovation for Inclusive
Development Project.
Radjou, N. and Prabhu, J. (2014) Frugal Innovation: How to do More with Less.
London: Profile Books
Rao, E. J. O. and Qaim, M. (2011) ‘Supermarkets, farm household income, and poverty:
insights from Kenya’, World Development, 39(5): 784–796.
Spielman, D. J. (2005) Innovation systems perspectives on developing-country
agriculture: A critical review. International food policy research institute (IFPRI).
International service for national agricultural research (ISNAR) division: Rome, Italy
STEPS Centre (2010) Innovation, Sustainability, Development: A New Manifesto,
STEPS Centre, Brighton, UK.
Tallontire, A., Opondo, M., Nelson, V., and Martin, A. (2011) ‘Beyond the vertical?
Using value chains and governance as a framework to analyse private standards
initiatives in agri-food chains’, Agriculture and human values. Springer, 28(3): 427–
441.
Uzzi, B. (1996) ‘The sources and consequences of embeddedness for the economic
performance of organizations: The network effect’, American sociological review. pp.
674–698.
Viotti, E. B. (2002) ‘National learning systems: a new approach on technological
change in late industrializing economies and evidences from the cases of Brazil and
South Korea’, Technological Forecasting and Social Change. Elsevier, 69(7): 653–680.
World Bank (2010) Innovation Policy: A Guide for Developing Countries. World bank:
Washington

Zanello, G. et al. (2016) ‘The creation and diffusion of innovation in developing
countries: A systematic literature review’, Journal of Economic Surveys. Wiley Online
Library, 30(5): 884–912.
Zeschky, M., Widenmayer, B. & Gassmann, O. (2011) Frugal Innovation in Emerging
Markets. Research-Technology Management, 54(4), pp. 38–45.

TABLES AND FIGURES
Figure I: Measuring innovativeness (a) Simple measure, (b) Measure using multiple
innovation types
Source: Authors’ construction

Table I: Descriptives and differences between farmers by chain participation
Variable Category Variables GVC (n=132) LVC (n=188)
Mean SD Mean SD
Value chain participation
% sold to current main buyer(s) 83.84* 1.30 86.83 1.02
% sold to second buyer 12.46* 0.887 9.35 0.760
Controls Sex (% male in each VC) 78.03** 3.619 68.08 3.463
Farmer group (1= yes, % of each VC) 71.21*** 4.034 31.91 3.43
Alternate activity (% of each VC) 84.84** 1.87 90.95 1.669
Asset Indexa (value) 0.281 0.019 0.182 0.015
Duration sold to most recent buyer(years) 5.80*** 0.28 7.92 0.36
Rejection levels (%) 19.46*** 0.49 10.23 0.27
Contracts: Written (% by VC) 51.51*** 0.43 0.53 0.16
*Mean value is significantly different from local farmers at 10% level
** Mean value is significantly different from local farmers at 5% level
*** Mean value are significantly different from local farmers at 1% level a Calculated using PCA, used as a proxy for income, as income data was not validated. The asset index includes, years of education, land size, owning mobile, internet, computer,
electricity, various modes of transport, TV, radio, house type, access to paved roads

54
Table II: Innovation type- Formal
Innovation Activity
(component 1 and 2)
Formal Innovations GVC
n=132
LVC
n=188
Innovation component 1 Waste management
Innovation activity 1.1 Do you dispose of chemical and inorganic wastes
through modes of incineration?
4.62 21.43
Innovation activity 1.2 Do you dispose of chemical and inorganic wastes
through pits away from land?
43.85 41.76
Innovation activity 1.3 Do you dispose of chemical and inorganic wastes
through collection points by community initiated
projects, municipality or exporters?
45.38 28.02
Innovation activity 1.4 Do you dispose of chemical and inorganic wastes
through community initiated septic tanks?
3.08 0.00
Innovation component 2 Irrigation mode
Innovation activity 2.1 Do you build natural furrows/ boreholes to irrigate
crops?
4.62 22.53
Innovation activity 2.2 Do you install sprinklers to irrigate crops? 8.46 36.81
Innovation activity 2.3 Do you use boreholes/furrows and sprinklers to
irrigate crops?
44.62 31.32
Innovation activity 2.4 Do you switch between drip and natural to irrigate
crops?
42.31 7.69
Source: Authors’ construction

55
Table III: Innovation type - Informal
Innovation Activity
(component 3 and 4)
Informal incremental innovations GVC
n=132
LVC
n=188
Innovation component 3 Climate Variability
Innovation activity 3.1 During unseasonal rains/ floods do you diversify
to other livelihoods?
46.15 60.33
Innovation activity 3.2 During unseasonal rains/ floods do you dig pads,
ditches, terraces?
0.77 1.10
Innovation activity 3.3 During unseasonal rains/ floods do you create a
makeshift greenhouse?
24.62 19.78
Innovation activity 3.4 During unseasonal rains/ floods are you able to
do a combination of at least 2?
16.92 12.75
Innovation component 4 Water Conservation
Innovation activity 4.1 Do you conserve water by making small or large
water pads, ditches or trenches?
0.77 8.79
Innovation activity 4.2 Do you conserve water by buying water tanks
and storing rainwater?
0.77 3.08
Innovation activity 4.3 Do you conserve water by setting up roof top
catchments?
45.38 29.34
Innovation activity 4.4 Do you conserve water by performing at least 2 of
these?
40.77 34.07
Source: Authors’ construction

56
Table IV: General differences in Innovation type index of GVC and LVC farmers Innovation Type GVC farmer
N=132
LVC farmer
N=188
Ttest
Formal 0.529***
(0.017)
0.351
(0.008)
-10.34
Informal (Adaptive) 0.638**
(0.019)
0.521
(0.016)
-4.32
T test results:
*Mean value is significantly different from local farmers at 10% level ; ** Mean value is significantly different from local
farmers at 5% level; *** Mean value are significantly different from local farmers at 1% level
Values in brackets are standard errors

57
Table V: General differences of labels and linkage between GVC and LVC farmers
Farmer chain GVC farmer
N=132 LVC farmer
N=188
Labels or certifications (1=dummy) (%) 63.63*** 18.61
Linkage Index1 (value between 0 and 1) 0.625***
(0.012)
0.433
(0.011) T test results: *Mean value is significantly different from local farmers at 10% level ; ** Mean value is significantly different
from local farmers at 5% level; *** Mean value are significantly different from local farmers at 1% level
Values in brackets are standard errors a=please see appendix 1 for backward and forward linkage breakdown

58
Table VI: Learning in value chains
Learning mechanisms
(% share by farmer chain)
Formal innovations
Informal innovations
Farmer chain GVC LVC GVC LVC
Tacit (average share by farmer category)
A) Through own cognition 30.60*** 57.26 72.29* 80.11
(1.08) (0.90) (1.32) (0.89)
Explicit (average share by farmer category)
B) Imitation 9.35** 10.31 4.32** 2.63
(0.27) (0.34) (0.45) (0.36)
C) Knowledge leakage (through community, friends) 6.73* 16.26 16.77*** 12.83
(0.36) (0.42) (1.44) (0.42)
D) Direct transfer, face to face interactions 52.87*** 16.17 6.20 4.39
(1.32) (1.04) (0.05) (0.03)
Total Explicit (B+C+D) (% share by farmer category) 62.95*** 42.74 27.29*** 19.85
(1.80) (1.50) (1.12) (0.63)
Interaction terms
Tacit* linkages 24.85***
(0.95)
T=-5.48
17.90
(0.82)
32.21**
(2.65)
T=-2.73
18.04
(1.06)
Explicit*linkages 25.12***
(1.53)
T=12.41
6.39
(0.71)
11.15***
(1.81)
T=-4.31
2.88
(0.62)
T test results: *Mean value is significantly different from local farmers at 10% level; ** Mean value is significantly different
from local farmers at 5% level; *** Mean value are significantly different from local farmers at 1% level
Values in brackets are standard errors

59
Table VII: Endogenous switching regression models
Dependent variable
in models
Selection equation
(jointly estimated probit)
Outcome equation
(FIML)
Model 1 Participating in a GVC Formal innovation type
Model 2 Participating in a GVC Informal innovation type
Source: Authors’ construction
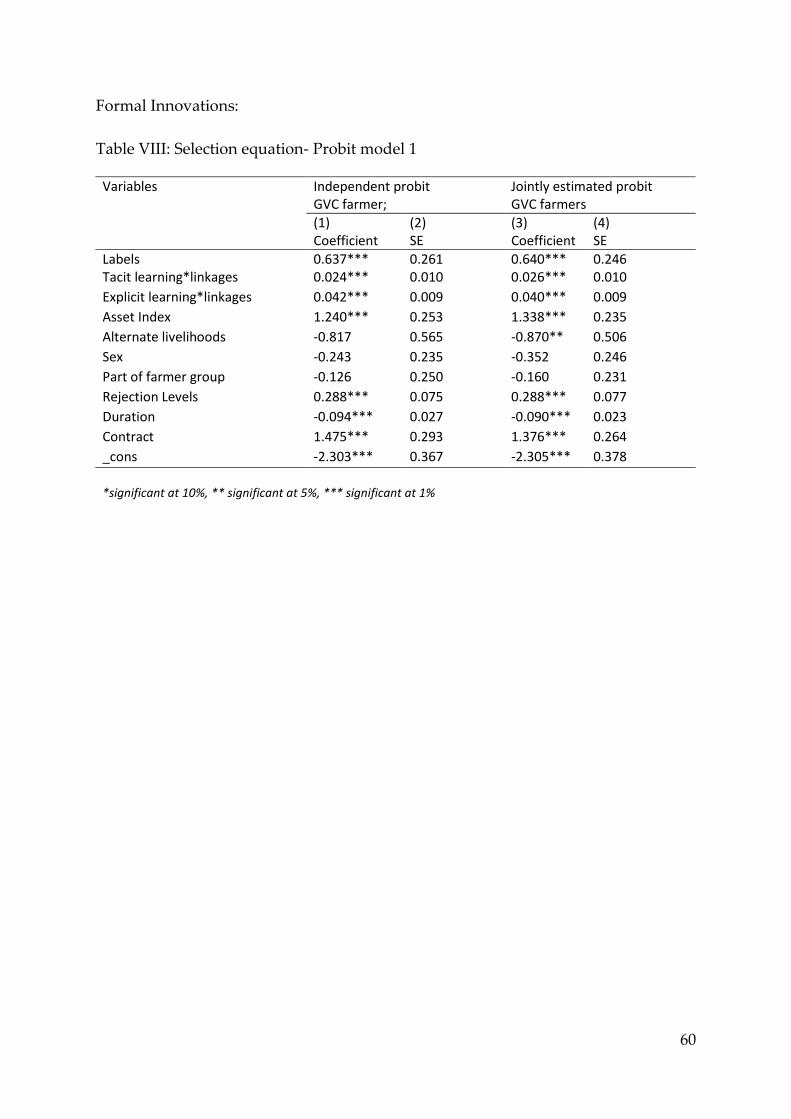
60
Formal Innovations:
Table VIII: Selection equation- Probit model 1
Variables Independent probit GVC farmer;
Jointly estimated probit GVC farmers
(1) Coefficient
(2) SE
(3) Coefficient
(4) SE
Labels 0.637*** 0.261 0.640*** 0.246 Tacit learning*linkages 0.024*** 0.010 0.026*** 0.010
Explicit learning*linkages 0.042*** 0.009 0.040*** 0.009
Asset Index 1.240*** 0.253 1.338*** 0.235
Alternate livelihoods -0.817 0.565 -0.870** 0.506
Sex -0.243 0.235 -0.352 0.246
Part of farmer group -0.126 0.250 -0.160 0.231
Rejection Levels 0.288*** 0.075 0.288*** 0.077
Duration -0.094*** 0.027 -0.090*** 0.023
Contract 1.475*** 0.293 1.376*** 0.264
_cons -2.303*** 0.367 -2.305*** 0.378
*significant at 10%, ** significant at 5%, *** significant at 1%

61
Table IX: Full information maximum likelihood parameters for formal innovations
***
Significance at 1% level
** Significance at 5% level
* Significance at 10% level
Variables Formal GVC Formal: LVC
(1) Coefficient
(2) SE
(3) Coefficient
(4) SE
Labels 0.100*** 0.021 -0.044*** 0.022 Tacit learning*linkages 0.003*** 0.001 -0.001 0.001 Explicit learning*linkages 0.007*** 0.001 0.005*** 0.001 Asset Index -0.006 0.025 0.075*** 0.026 Alternate livelihoods -0.021 0.041 0.016 0.041 Sex -0.005 0.022 0.009 0.016 Part of farmer group 0.017 0.021 -0.036** 0.017 Rejection Levels -0.013** 0.007 0.005 0.006 _cons 0.273*** 0.049 0.347*** 0.021 ln σg -2.263*** 0.067 Ρgv -0.463** 0.199 ln σl -2.251*** 0.057 Ρlv 0.732** 0.115 Likelihood ratio test of independent equations ꭕ2
12.77***
Number of observations 320 Log-likelihood 201.29 Wald chi2(13) 260.95***

62
Informal innovations:
Table X: Selection equation - probit model 2
Variables Independent probit GVC farmer;
Jointly estimated probit GVC farmers
(1) Coefficient
(2) SE
(3) Coefficient
(4) SE
Labels 0.945*** 0.232 0.629*** 0.217 Tacit learning*linkages 0.028*** 0.007 0.044*** 0.007
Explicit learning*linkages 0.028*** 0.008 0.031*** 0.008
Asset Index 1.241*** 0.256 1.033*** 0.229
Alternate livelihoods -0.510 0.547 -0.162 0.482
Sex -0.123 0.228 -0.185 0.221
Part of farmer group -0.098 0.251 0.013 0.207
Rejection Levels 0.349*** 0.078 0.301*** 0.070
Duration -0.105*** 0.027 -0.060** 0.028
Contract 1.385*** 0.276 0.800*** 0.284
_cons -2.280*** 0.346 -2.658*** 0.355
*significant at 10%, ** significant at 5%, *** significant at 1%

63
Table XI: Full information maximum likelihood parameters for informal innovations
Significance at 1% level
** Significance at 5% level
* Significance at 10% level
Variables Informal: GVC Informal: LVC
(1) Coefficient
(2) SE
(3) Coefficient
(4) SE
Labels 0.057* 0.033 0.015 0.041 Tacit learning*linkages 0.003*** 0.001 0.011*** 0.001 Explicit learning*linkages 0.005*** 0.001 0.012*** 0.002 Asset Index -0.066* 0.040 -0.026 0.057 Alternate livelihoods -0.079 0.070 0.106* 0.064 Sex -0.006 0.037 -0.040 0.025 Part of farmer group -0.058** 0.034 -0.050* 0.026 Rejection Levels -0.010 0.011 -0.005 0.012 _cons 0.663*** 0.072 0.330*** 0.038 ln σg -1.668*** 0.074 Ρgv -0.934** 0.061 ln σl -1.865*** 0.055 Ρlv 0.055 0.515 Likelihood ratio test of independent equations ꭕ2
15.40***
Number of observations 320 Log-likelihood 49.57 Wald chi2(13) 57.77***

64
Appendix 1: Linkages - Breakdown of relationships
Actors Relationship of farmer with actors GVC LVC
Seed suppliers 0= Weak (% of each farmer category) 2.68 0.41
1=Intermediate (% of each farmer category) 63.6 50
2=Strong (% of each farmer category) 33.72 49.59
Agro-vets 0= Weak (% of each farmer category) 4.6 7.41
1=Intermediate (% of each farmer category) 51.72 62.3
2=Strong (% of each farmer category) 43.68 29.59
Local Credit givers 0= Weak (% of each farmer category) 3.45 0.00
1=Intermediate (% of each farmer category) 90.42 88.21
2=Strong (% of each farmer category) 6.13 11.79
Extension officers 0= Weak (% of each farmer category) 12.2 44.83
1=Intermediate (% of each farmer category) 47.56 36.78
2=Strong (% of each farmer category) 40.24 18.39
Main buyers
(exporters for GVC
farmers and local
buyers for LVC)
0= Weak (% of each farmer category) 19.51 54.39
1=Intermediate (% of each farmer category) 44.31 24.72
2=Strong (% of each farmer category) 33.74 20.88
Brokers 0= Weak (% of each farmer category) 31.42 19.51
1=Intermediate (% of each farmer category) 50.57 36.99
2=Strong (% of each farmer category) 14.56 8.54

65
Appendix 2: Summary of variables used in regression
i ii
Variables Variable explanation Stage 1 regression
Stage 2 regression
Labels Having a local code of conduct or international certification dummy; values in %
Yes
Yes
Tacit learning*linkages
Interaction of total share of tacit learning with index of backward/forward linkages
Yes
Yes
Explicit learning*linkages
Interaction of total share of explicit learning with index of backward/forward linkages
Yes
Yes
Asset Index Index of assets possessed before participation in current chain
Yes
Yes
Alternate livelihoods
Other livelihoods possessed dummy; values in %
Yes
Yes
Sex male dummy; values in % Yes
Yes
Part of farmer group
Membership if farmer group dummy; values in %
Yes
Yes
Rejection Levels Dummy for if they have rejections; values in %
Yes
Yes
Duration Number of years in specific chain Yes
No
Contract Dummy if they have a contract with main buyer
Yes
No
Dependent variables
Binary variable GVC farmer or not
Index of formal innovations; Index of informal innovations