A quantitative mass spectrometry-based approach …...ARTICLE A quantitative mass spectrometry-based...
13
ARTICLE A quantitative mass spectrometry-based approach to monitor the dynamics of endogenous chromatin- associated protein complexes Evangelia K. Papachristou 1 , Kamal Kishore 1 , Andrew N. Holding 1 , Kate Harvey 2 , Theodoros I. Roumeliotis 3 , Chandra Sekhar Reddy Chilamakuri 1 , Soleilmane Omarjee 1 , Kee Ming Chia 2 , Alex Swarbrick 2,4 , Elgene Lim 2,4 , Florian Markowetz 1 , Matthew Eldridge 1 , Rasmus Siersbaek 1 , Clive S. D’Santos 1 & Jason S. Carroll 1 Understanding the dynamics of endogenous protein–protein interactions in complex net- works is pivotal in deciphering disease mechanisms. To enable the in-depth analysis of protein interactions in chromatin-associated protein complexes, we have previously devel- oped a method termed RIME (Rapid Immunoprecipitation Mass spectrometry of Endogenous proteins). Here, we present a quantitative multiplexed method (qPLEX-RIME), which inte- grates RIME with isobaric labelling and tribrid mass spectrometry for the study of protein interactome dynamics in a quantitative fashion with increased sensitivity. Using the qPLEX- RIME method, we delineate the temporal changes of the Estrogen Receptor alpha (ERα) interactome in breast cancer cells treated with 4-hydroxytamoxifen. Furthermore, we identify endogenous ERα-associated proteins in human Patient-Derived Xenograft tumours and in primary human breast cancer clinical tissue. Our results demonstrate that the combination of RIME with isobaric labelling offers a powerful tool for the in-depth and quantitative char- acterisation of protein interactome dynamics, which is applicable to clinical samples. DOI: 10.1038/s41467-018-04619-5 OPEN 1 Cancer Research UK Cambridge Institute, University of Cambridge, Robinson Way, Cambridge CB2 0RE, UK. 2 Garvan Institute of Medical Research, Darlinghurst, Sydney NSW 2010, Australia. 3 Wellcome Trust Sanger Institute, Wellcome Genome Campus, Cambridge CB10 1SA, UK. 4 St Vincent’s Clinical School, UNSW, Sydney NSW 2052, Australia. These authors contributed equally: Kamal Kishore, Andrew N. Holding. Correspondence and requests for materials should be addressed to R.S. (email: [email protected]) or to C.S.D’S. (email: Clive.D'[email protected]) or to J.S.C. (email: [email protected]) NATURE COMMUNICATIONS | (2018)9:2311 | DOI: 10.1038/s41467-018-04619-5 | www.nature.com/naturecommunications 1 1234567890():,;
Transcript of A quantitative mass spectrometry-based approach …...ARTICLE A quantitative mass spectrometry-based...
ARTICLE
A quantitative mass spectrometry-based approachto monitor the dynamics of endogenous chromatin-associated protein complexesEvangelia K. Papachristou 1, Kamal Kishore1, Andrew N. Holding1, Kate Harvey2, Theodoros I. Roumeliotis3,
Chandra Sekhar Reddy Chilamakuri1, Soleilmane Omarjee1, Kee Ming Chia2, Alex Swarbrick2,4, Elgene Lim2,4,
Florian Markowetz 1, Matthew Eldridge1, Rasmus Siersbaek1, Clive S. D’Santos1 & Jason S. Carroll1
Understanding the dynamics of endogenous protein–protein interactions in complex net-
works is pivotal in deciphering disease mechanisms. To enable the in-depth analysis of
protein interactions in chromatin-associated protein complexes, we have previously devel-
oped a method termed RIME (Rapid Immunoprecipitation Mass spectrometry of Endogenous
proteins). Here, we present a quantitative multiplexed method (qPLEX-RIME), which inte-
grates RIME with isobaric labelling and tribrid mass spectrometry for the study of protein
interactome dynamics in a quantitative fashion with increased sensitivity. Using the qPLEX-
RIME method, we delineate the temporal changes of the Estrogen Receptor alpha (ERα)interactome in breast cancer cells treated with 4-hydroxytamoxifen. Furthermore, we identify
endogenous ERα-associated proteins in human Patient-Derived Xenograft tumours and in
primary human breast cancer clinical tissue. Our results demonstrate that the combination of
RIME with isobaric labelling offers a powerful tool for the in-depth and quantitative char-
acterisation of protein interactome dynamics, which is applicable to clinical samples.
DOI: 10.1038/s41467-018-04619-5 OPEN
1 Cancer Research UK Cambridge Institute, University of Cambridge, Robinson Way, Cambridge CB2 0RE, UK. 2 Garvan Institute of Medical Research,Darlinghurst, Sydney NSW 2010, Australia. 3Wellcome Trust Sanger Institute, Wellcome Genome Campus, Cambridge CB10 1SA, UK. 4 St Vincent’s ClinicalSchool, UNSW, Sydney NSW 2052, Australia. These authors contributed equally: Kamal Kishore, Andrew N. Holding. Correspondence and requests formaterials should be addressed to R.S. (email: [email protected]) or to C.S.D’S. (email: Clive.D'[email protected])or to J.S.C. (email: [email protected])
NATURE COMMUNICATIONS | (2018) 9:2311 | DOI: 10.1038/s41467-018-04619-5 |www.nature.com/naturecommunications 1
1234
5678
90():,;
Deciphering the role and the organisation of dynamicallyregulated protein networks is critical for the accuratemolecular characterisation of biological systems1. Over
the last decade, the advancements made in mass spectrometry-based proteomics have enabled the rapid analysis of complexprotein samples obtained from co-immunoprecipitation assays,providing a powerful tool for the study of protein interactionsand protein complexes2. In this regard, the first systematic effortsto generate human protein interactome maps using yeast two-hybrid3–5 have been recently complemented by studies utilisinglarge-scale Affinity Purification followed by Mass Spectrometryanalysis (AP-MS)6,7. Additionally, the integration of AP-MS withquantitative approaches has enabled the study of stoichiometricchanges in protein complexes8. More recently, the use of chemicalcrosslinking combined with mass spectrometry has providedinformation about endogenous protein assemblies in a proteome-wide scale9.
Gene regulation relies on the coordinated action of transcrip-tion factors and co-regulator complexes that control transcrip-tional activation at promoters or enhancers. To gain insight intothe complex interactions between such regulators, the combina-tion of Chromatin Immunoprecipitation (ChIP) with massspectrometry has been used to study the composition ofchromatin-associated complexes10–12. In line with this strategywe have previously developed RIME (Rapid ImmunoprecipitationMass spectrometry of Endogenous proteins)13, a method whichhas several advantages for the analysis of protein interactomes14.RIME provides a sensitive and rapid approach for the identifi-cation of protein complexes from low amounts of startingmaterial and importantly involves purification of endogenousprotein, rather than the use of exogenous tagged approaches.In the present study, we have established a modified RIME
assay to monitor the dynamics of chromatin-associated com-plexes using a quantitative multiplexed workflow (quantitativeMultiplexed Rapid Immunoprecipitation Mass spectrometry ofEndogenous proteins or qPLEX-RIME). Specifically, we combineRIME with isobaric labelling using Tandem Mass Tags (TMT-10plex)15,16, peptide fractionation and MultiNotch MS3 analy-sis17. This combination allows the simultaneous analysis ofmultiple conditions and biological replicates with high sensitivityin a single experiment. Additionally, we have developed a dataanalysis workflow termed quantitative Multiplexed analyzer(qPLEXanalyzer) that permits statistical analysis of the quanti-tative interactome data and the identification of differentialinteractions.As a proof-of-concept, we apply the qPLEX-RIME method to
discover the temporal changes of Estrogen Receptor alpha (ERα)interactors in breast cancer cells treated with 4-hydroxytamoxifen(OHT) and to identify the ERα interactome in human patient-derived xenograft (PDX) tumours and in human breast cancertissues. Our data demonstrate that the qPLEX-RIME methodcombines multiplexity with quantitative accuracy and increasedsensitivity, to enable the in-depth characterisation of dynamicchanges in chromatin-associated protein complexes in vitro andin vivo.
ResultsThe qPLEX-RIME workflow. The qPLEX-RIME approachcombines the RIME method13,14 with multiplex TMT chemicalisobaric labelling15,16 to study the dynamics of chromatin-associated protein complexes. The workflow starts with a two-step fixation procedure using disuccinimidyl glutarate (DSG) andformaldehyde (FA) that has been previously applied in combi-nation with ChIP assays to capture transient interactions moreefficiently12,18. A specific antibody against the target protein is
used for immunoprecipitation, followed by proteolysis, TMT-10plex peptide labelling and fractionation. The main steps of theqPLEX-RIME method are shown in Fig. 1. The main utility of theqPLEX-RIME method is the quantification of changes in thecomposition of protein complexes in response to cell perturbationand/or in variable genomic backgrounds (e.g. different cell linesor mutated conditions) using multiple biological replicates in asingle experiment. Also proteins that are significantly and speci-fically associated with the bait protein can be discovered in thesame analysis using appropriate negative controls, such as IgGpull-downs. For the downstream data analysis, we have developeda comprehensive bioinformatics workflow (qPLEXanalyzer) thatincludes data processing, visualisation, normalisation and differ-ential statistics . In addition to the qPLEXanalyzer R package, thecomplete qPLEX-RIME and full proteome data sets of this workare included in the qPLEXdata R package. Both packages can befound at (https://doi.org/10.5281/zenodo.1237825) and a detaileddescription of the pipeline and the applications is provided inSupplementary Notes 1 and 2.
Characterisation of the ERα interactome in MCF7 cells. Wefirst applied qPLEX-RIME to assess whether we could successfullyidentify the ERα interactome in asynchronous MCF7 breastcancer cells. To this end, we performed ERα qPLEX-RIME pull-downs in five independent biological replicates. An equal numberof matched IgG control samples were prepared. In this experi-ment we used single crosslinking with FA, to permit a compar-ison with previously published approaches13. In addition to theqPLEX-RIME, we included a standard non-quantitative ERαRIME experiment with matched IgG controls (SupplementaryData 1).The qPLEX-RIME raw data processing quantified 2955
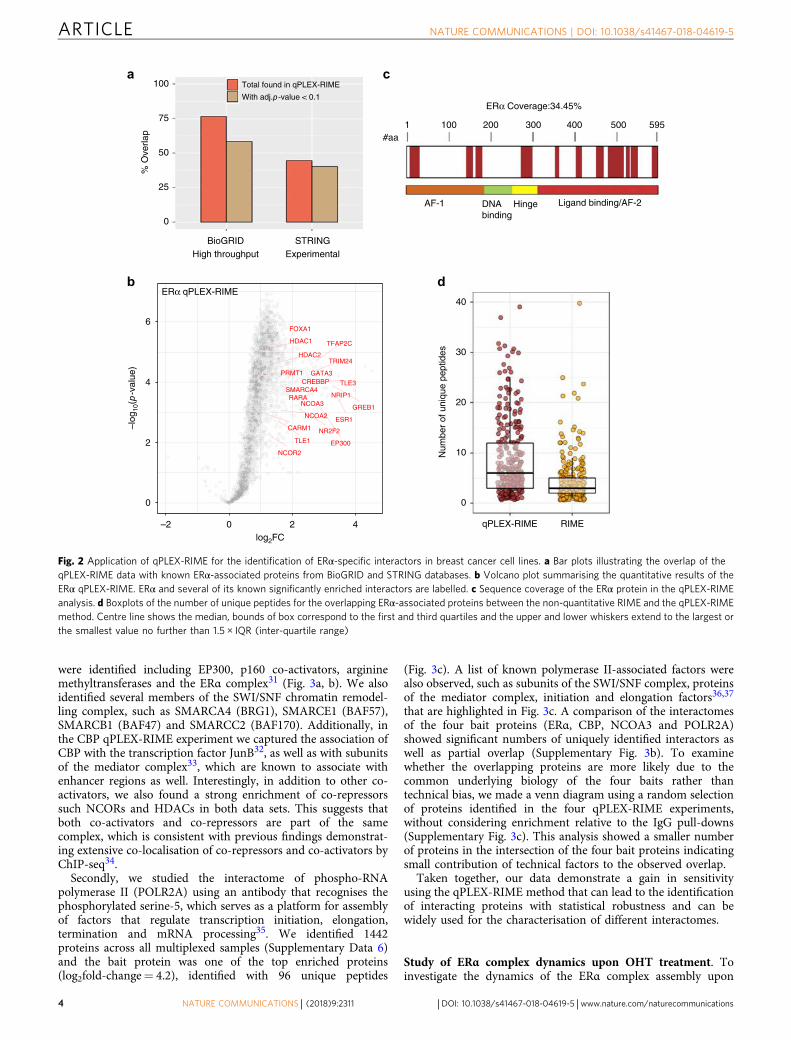
proteins across the multiplexed set of all positive and negativesamples at peptide false discovery rate (FDR) <1% (Supplemen-tary Data 2). To test the efficiency of the method in capturing andquantifying previously described ERα-associated proteins, wecompiled a list of known ERα interactors from BioGRID19 andSTRING20 resources. For BioGRID, we used only a subset of 386proteins identified by high-throughput assays that are similar tothe approach used here and for STRING we used onlyexperimental associations (383 proteins, score > 200). Note-worthy, only 37 proteins were common between the tworeference subsets. The qPLEX-RIME method identified 295(76%) and 171 (45%) of the known ERα-associated proteinsfrom BioGRID and STRING, respectively, of which 225 (58%)and 154 (40%) showed positive enrichment at adj. p-value < 0.1(Limma moderated t-test) (Fig. 2a). Specifically, we found knownco-regulators (e.g. EP300, NCOA3, CBP, NRIP1, TRIM24,GREB1, RARα, NCOR2 and HDACs13,21–25), ERα-associatedpioneer factors (e.g. FOXA126 and AP-2γ27), and putative pioneerfactors (e.g. GATA-328) with significant enrichment in the ERαsamples (Fig. 2b).
ERα was one of the most significantly enriched proteinsidentified with 19 unique peptides (Fig. 2c), which is consistentwith previously published ERα RIME experiments14. A compar-ison between the non-quantitative RIME and the qPLEX-RIMEdata showed that 302 of the 323 (93%) proteins identified asERα-specific in the non-quantitative ERα-RIME pull-downanalysis were also identified by qPLEX-RIME with significantenrichment over the IgG controls (mean fold-change of 2.5).Notably, the application of qPLEX-RIME achieved overall betterpeptide coverage for the overlapping ERα-associated proteinscompared to the non-quantitative RIME method (Fig. 2d).Additionally, qPLEX-RIME identified 124 more known BioGRIDand STRING interactors compared to the non-quantitative RIME
ARTICLE NATURE COMMUNICATIONS | DOI: 10.1038/s41467-018-04619-5
2 NATURE COMMUNICATIONS | (2018) 9:2311 | DOI: 10.1038/s41467-018-04619-5 | www.nature.com/naturecommunications

analysis (175 proteins > 2-fold and adj. p-value < 0.01 (Limmamoderated t-test) in qPLEX-RIME versus 51 proteins in non-quantitative RIME). Importantly, using the qPLEX-RIME weidentified a number of novel ERα-associated candidate proteins.We validated the interactions of CBX3 (HP1γ), NIPBL andFOXK1 with ERα, using Proximity Ligation Assay (PLA)29
(Supplementary Fig. 1a). A GFP negative control was used tomoninor for non-specific interactions (Supplementary Fig. 1b).Treatment of the MCF7 cells with the Selective ERα Degrader(SERD) Fulvestrant30 (Supplementary Fig. 2) disrupted the aboveinteractions demonstrating the specificity of the PLA assay andvalidating the interactors discovered by qPLEX-RIME (Supple-mentary Fig. 1a and c).To test whether our quantitative pipeline can be widely used to
study interactors of different bait proteins, we performed qPLEX-RIME experiments on three additional factors following the sameexperimental design as above. For these and all subsequent
experiments described in this study, we adopted the doublecrosslinking approach as a comparison between single and doublecrosslinking for ERα qPLEX-RIME data showed that the latterincreases the pull-down efficiency of known and previouslyvalidated ERα interactors, including FOXA1, NR2F2 and NCOR2(Supplementary Fig. 3a and Supplementary Data 3).
Firstly, the qPLEX-RIME method was applied to explore theinteractome of CBP (CREB-binding protein) and NCOA3 (SRC-3); two well-characterised co-activators of nuclear receptors31.We identified 1437 and 1135 proteins for CBP and NCOA3,respectively, in the two multiplexed sets of bait and IgG pull-downs at peptide FDR < 1% (Supplementary Data 4 and 5). Bothbait proteins were highly enriched in the target pull-downscompared to the IgG controls (CBP:log2fold-change= 3.2 andNCOA3:log2fold-change= 3.39) with a high number of uniquepeptides (44 unique peptides for CBP and 36 unique peptides forNCOA3) (Fig. 3a, b). Known interactors of CBP and NCOA3
Cell line 1 Cell line 2 Cell line 3 WT Mutant
t1
t2+vehicle
a
b
c
d
e
f
+drug
DSG
Condition B
Immunoprecipitation
Condition A
Bait
On bead trypsin digestion/TMT-10plex peptide labelling and pooling
Bait
Non-specific Enriched qPLEXanalyzer
log2FCm/zm/z
lgG
lgG
TM
T S
/N
TM
T S
/N
–log
10 (p-
valu
e)
AA
B
B
On cartridge high-pH fractionation
LC-MS (Synchronous precursor selection, MS3)
Data processing and statistical analysis
Control IgG
FormaldehydeDouble cross-linking
Enrichnuclei/Sonicate
t3
Time (h)
Fig. 1 The qPLEX-RIME workflow. Proteins in treated and un-treated cell cultures at different time points or in variable genomic backgrounds (e.g. differentcell lines or mutated conditions) are double-crosslinked and cell nuclei are isolated and sonicated (a, b). Target protein complexes are immunoprecipitatedand subjected to on-bead trypsin digestion (c, d). The generated peptides are labelled using different TMT reagents and pooled in a single mixture, which isfractionated using Reversed-Phase cartridges (d). Peptide fractions are analysed with the MultiNotch MS3 method (e) followed by data processing andstatistical analysis using novel analytic suite (qPLEXanalyzer) (f)
NATURE COMMUNICATIONS | DOI: 10.1038/s41467-018-04619-5 ARTICLE
NATURE COMMUNICATIONS | (2018) 9:2311 | DOI: 10.1038/s41467-018-04619-5 |www.nature.com/naturecommunications 3
were identified including EP300, p160 co-activators, argininemethyltransferases and the ERα complex31 (Fig. 3a, b). We alsoidentified several members of the SWI/SNF chromatin remodel-ling complex, such as SMARCA4 (BRG1), SMARCE1 (BAF57),SMARCB1 (BAF47) and SMARCC2 (BAF170). Additionally, inthe CBP qPLEX-RIME experiment we captured the association ofCBP with the transcription factor JunB32, as well as with subunitsof the mediator complex33, which are known to associate withenhancer regions as well. Interestingly, in addition to other co-activators, we also found a strong enrichment of co-repressorssuch NCORs and HDACs in both data sets. This suggests thatboth co-activators and co-repressors are part of the samecomplex, which is consistent with previous findings demonstrat-ing extensive co-localisation of co-repressors and co-activators byChIP-seq34.
Secondly, we studied the interactome of phospho-RNApolymerase II (POLR2A) using an antibody that recognises thephosphorylated serine-5, which serves as a platform for assemblyof factors that regulate transcription initiation, elongation,termination and mRNA processing35. We identified 1442proteins across all multiplexed samples (Supplementary Data 6)and the bait protein was one of the top enriched proteins(log2fold-change= 4.2), identified with 96 unique peptides
(Fig. 3c). A list of known polymerase II-associated factors werealso observed, such as subunits of the SWI/SNF complex, proteinsof the mediator complex, initiation and elongation factors36,37
that are highlighted in Fig. 3c. A comparison of the interactomesof the four bait proteins (ERα, CBP, NCOA3 and POLR2A)showed significant numbers of uniquely identified interactors aswell as partial overlap (Supplementary Fig. 3b). To examinewhether the overlapping proteins are more likely due to thecommon underlying biology of the four baits rather thantechnical bias, we made a venn diagram using a random selectionof proteins identified in the four qPLEX-RIME experiments,without considering enrichment relative to the IgG pull-downs(Supplementary Fig. 3c). This analysis showed a smaller numberof proteins in the intersection of the four bait proteins indicatingsmall contribution of technical factors to the observed overlap.Taken together, our data demonstrate a gain in sensitivity
using the qPLEX-RIME method that can lead to the identificationof interacting proteins with statistical robustness and can bewidely used for the characterisation of different interactomes.
Study of ERα complex dynamics upon OHT treatment. Toinvestigate the dynamics of the ERα complex assembly upon
ERα Coverage:34.45%
1 100 200 300 400 500 595
DNAbinding
#aa
AF-1 Hinge Ligand binding/AF-2
a
d
c100
% O
verla
p
STRINGExperimental
0
25
50
75
BioGRIDHigh throughput
Total found in qPLEX-RIME
With adj.p -value < 0.1
b
qPLEX-RIME
10
0
20
30
40
RIME
Num
ber
of u
niqu
e pe
ptid
es
0
2
4
6
–2 0 2 4log2FC
–log
10(p
-val
ue)
ERα qPLEX-RIME
ESR1
GREB1
TLE3
NRIP1NCOA3
EP300
TFAP2C
TRIM24
CREBBPGATA3
RARA
NR2F2
FOXA1
NCOA2
TLE1
NCOR2
HDAC2
HDAC1
SMARCA4
CARM1
PRMT1
Fig. 2 Application of qPLEX-RIME for the identification of ERα-specific interactors in breast cancer cell lines. a Bar plots illustrating the overlap of theqPLEX-RIME data with known ERα-associated proteins from BioGRID and STRING databases. b Volcano plot summarising the quantitative results of theERα qPLEX-RIME. ERα and several of its known significantly enriched interactors are labelled. c Sequence coverage of the ERα protein in the qPLEX-RIMEanalysis. d Boxplots of the number of unique peptides for the overlapping ERα-associated proteins between the non-quantitative RIME and the qPLEX-RIMEmethod. Centre line shows the median, bounds of box correspond to the first and third quartiles and the upper and lower whiskers extend to the largest orthe smallest value no further than 1.5 × IQR (inter-quartile range)
ARTICLE NATURE COMMUNICATIONS | DOI: 10.1038/s41467-018-04619-5
4 NATURE COMMUNICATIONS | (2018) 9:2311 | DOI: 10.1038/s41467-018-04619-5 | www.nature.com/naturecommunications

treatment with the Selective Estrogen Receptor Modulator(SERM) 4-hydroxytamoxifen (OHT), we performed threeqPLEX-RIME experiments (3 × 10plex) using independentlyprepared biological replicates. MCF7 cells were crosslinked aftertreatment with 100 nM OHT for 2 h, 6 h and 24 h or after 24 h ofvehicle (ethanol) treatment. Two biological replicates of eachcondition were included in each experiment, resulting in a total ofsix replicates per time point. Additionally, MCF7 cells weretreated with OHT or ethanol and crosslinked after 24 h treatmentin each experiment to be used for control IgG pull-downs, toenable discrimination of non-specific binding.To confirm that the drug treatment was successful, we
performed RNA-seq analysis of six biological replicates usingmatched OHT treated samples. The mRNA data revealedtranscriptional repression of a number of known ERα targetgenes at 6 h and 24 h, confirming the response to the drugtreatment. Specifically, at 24 h treatment the expression of PGR,PDZK1, TFF1, AREG, PKIB, SIAH2, MYB, HEY2, FOS, GREB1and TFF338–43 was significantly inhibited compared to the vehicletreatment (log2Fold-Change <−0.5, adj. p-value < 0.05, Limmamoderated t-test) (Supplementary Fig. 4a and SupplementaryData 7).MultiNotch MS3 analysis of the qPLEX-RIME samples
quantified 1105 proteins (FDR < 1%) across all three replicateexperiments. Of these, 412 proteins were significantly enriched inERα pull-downs compared to IgG samples (log2Fold-Change > 1,adj. p-value < 0.01, Limma moderated t-test) (SupplementaryData 8). Total ERα levels changed upon OHT treatment(Supplementary Fig. 4b), indicating that altered levels of antigenmay influence the amount of purified proteins. Our data showedthat this resulted in a significant dependency of the quantified
proteins on the amount of ERα pulled down (SupplementaryFig. 5a). To correct for this effect, we applied a linear regressionapproach15,44 using the ERα profile as the independent variableand the profile of any other protein as the dependent variable.The advantage of this approach is that proteins with strongdependency on the target protein are subjected to significantcorrection, whereas proteins with small dependency on the targetprotein are only slightly corrected. Two such examples, of knownERα interactors before and after correction are shown inSupplementary Fig. 5b. Finally, using the quantification valuescorrected for the abundance of ERα, we found 249 specificproteins with altered profile in the interactome in at least onetime point (|log2Fold-Change| > 0.5, adj. p-value < 0.05, Limmamoderated t-test) allowing for a comprehensive mapping of thedynamic organisation of the ERα complex in response to OHTtreatment.
Dissociation and recruitment of co-factors upon OHTtreatment. We next interrogated the significant changes observedin the ERα interactome at each time point during OHT-mediatedgrowth inhibition. After 2 h treatment with OHT, a significantloss of 12 proteins was observed including known ERα co-acti-vators, such as NCOA3 (AIB1/SRC-3) and CREBBP (CBP)(Fig. 4a). These proteins have been associated with histoneacetylation and activation of gene transcription23,45 and their lossin the ERα interactome upon OHT treatment is consistent withprevious studies showing that OHT binding blocks access of co-activators46. We also observed a significant loss of the interactionbetween ERα and NRIP1 (RIP140) protein. NRIP1 can act as acorepressor or as a coactivator47 with previous evidence
PRMT1
JUNB
SMARCA4
FOXA1
HDAC2SMARCE1
ESR1TFAP2C
NCOR2
HDAC1
NCOA3SMARCC2
CREBBP
EP300
PBX1NCOR1
CARM1
NCOA1
NCOA2
RARA
SMARCC1
MED17
MED24
GATA3
0
5
10
15
1 410 820 1220 1630 2040 2442 1 240 480 710 950 1190 1424 1 330 660 990 1310 1640 1970
–2 0 2 4
log2FC
–log
10(p
-val
ue)
log2FC
SMARCE1 EP300
FOXA1
NCOA3
CREBBP
PRMT1
SMARCA4
ESR1SMARCC2
HDAC1NCOR2 NCOR1
TFAP2CCARM1
GATA3HDAC2RARA
0
5
10
15
–2 0 2 4
–log
10(p
-val
ue)
SUPT5HSUPT6H
POLR2APOLR2CPOLR2B
POLR2GMED14
POLR2D
MED8
GTF2I
CDK9
GTF2E2MED17
GTF2BSMARCA5MED20
TAF7SMARCE1MED12MED1
MED6
MED24
MED26
SMARCC2
SMARCA4
MED22
MED29
0
5
10
15
20
–2 0 2 4 6
log2FC
–log
10(p
-val
ue)
NCOA3 Coverage:36.73% POLR2A Coverage:52.49% CREBBP Coverage:24.45% a b c
Fig. 3 Application of qPLEX-RIME in CREBBP, NCOA3 and POLR2A. a Peptide sequence coverage of the CREBBP (CBP) protein in the qPLEX-RIME analysis(top panel). The volcano plot summarises the quantitative results of the CBP qPLEX-RIME and several of its known interactors are highlighted in red font(bottom panel). b Peptide sequence coverage of the NCOA3 protein in the qPLEX-RIME analysis (top panel). The volcano plot summarises the quantitativeresults of the NCOA3 qPLEX-RIME and several of its known interactors are highlighted in red font (bottom panel). c Peptide sequence coverage of thephospho-polymerase II (POLR2A) protein in the qPLEX-RIME analysis (top panel). The volcano plot summarises the quantitative results of the POLR2AqPLEX-RIME and several of its known interactors are highlighted in red font (bottom panel)
NATURE COMMUNICATIONS | DOI: 10.1038/s41467-018-04619-5 ARTICLE
NATURE COMMUNICATIONS | (2018) 9:2311 | DOI: 10.1038/s41467-018-04619-5 |www.nature.com/naturecommunications 5
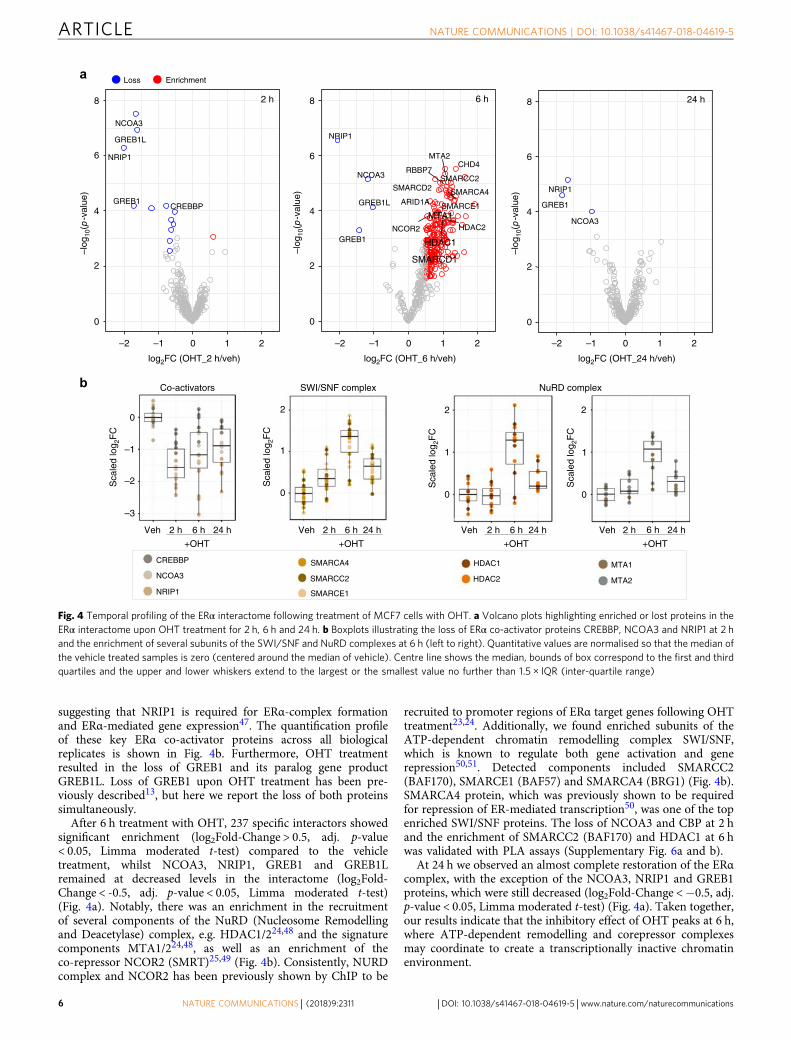
suggesting that NRIP1 is required for ERα-complex formationand ERα-mediated gene expression47. The quantification profileof these key ERα co-activator proteins across all biologicalreplicates is shown in Fig. 4b. Furthermore, OHT treatmentresulted in the loss of GREB1 and its paralog gene productGREB1L. Loss of GREB1 upon OHT treatment has been pre-viously described13, but here we report the loss of both proteinssimultaneously.After 6 h treatment with OHT, 237 specific interactors showed
significant enrichment (log2Fold-Change > 0.5, adj. p-value< 0.05, Limma moderated t-test) compared to the vehicletreatment, whilst NCOA3, NRIP1, GREB1 and GREB1Lremained at decreased levels in the interactome (log2Fold-Change < -0.5, adj. p-value < 0.05, Limma moderated t-test)(Fig. 4a). Notably, there was an enrichment in the recruitmentof several components of the NuRD (Nucleosome Remodellingand Deacetylase) complex, e.g. HDAC1/224,48 and the signaturecomponents MTA1/224,48, as well as an enrichment of theco-repressor NCOR2 (SMRT)25,49 (Fig. 4b). Consistently, NURDcomplex and NCOR2 has been previously shown by ChIP to be
recruited to promoter regions of ERα target genes following OHTtreatment23,24. Additionally, we found enriched subunits of theATP-dependent chromatin remodelling complex SWI/SNF,which is known to regulate both gene activation and generepression50,51. Detected components included SMARCC2(BAF170), SMARCE1 (BAF57) and SMARCA4 (BRG1) (Fig. 4b).SMARCA4 protein, which was previously shown to be requiredfor repression of ER-mediated transcription50, was one of the topenriched SWI/SNF proteins. The loss of NCOA3 and CBP at 2 hand the enrichment of SMARCC2 (BAF170) and HDAC1 at 6 hwas validated with PLA assays (Supplementary Fig. 6a and b).
At 24 h we observed an almost complete restoration of the ERαcomplex, with the exception of the NCOA3, NRIP1 and GREB1proteins, which were still decreased (log2Fold-Change <−0.5, adj.p-value < 0.05, Limma moderated t-test) (Fig. 4a). Taken together,our results indicate that the inhibitory effect of OHT peaks at 6 h,where ATP-dependent remodelling and corepressor complexesmay coordinate to create a transcriptionally inactive chromatinenvironment.
NRIP1
GREB1
NCOA3
GREB1L
CREBBP
0
2
4
6
8
–2 –1 0 1 2
–log
10(p
-val
ue)
log2FC (OHT_2 h/veh)
NRIP1
GREB1
NCOA3
NCOR2
ARID1A
MTA1
SMARCD1
SMARCD2
HDAC1
RBBP7
MTA2
HDAC2
SMARCE1
SMARCA4
SMARCC2
CHD4
GREB1L
0
2
4
6
8
–2 –1 0 1 2
–log
10(p
-val
ue) NRIP1
GREB1
NCOA3
0
2
4
6
8
–2 –1 0 1 2
–log
10(p
-val
ue)
log2FC (OHT_6 h/veh) log2FC (OHT_24 h/veh)
a
2 h 6 h 24 h
EnrichmentLoss
CREBBP
NCOA3
NRIP1
Veh 2 h 6 h 24 h
+OHT
0
–1
–2
–3
Veh 2 h 6 h 24 h
+OHT
0
1
2
SMARCA4
SMARCC2
SMARCE1
HDAC1
HDAC2
Veh 2 h 6 h 24 h
+OHT
2
1
0
MTA1
MTA2
0
1
2
b Co-activators SWI/SNF complex NuRD complex
Sca
led
log 2
FC
Sca
led
log 2
FC
Sca
led
log 2
FC
Sca
led
log 2
FC
Veh 2 h 6 h 24 h
+OHT
Fig. 4 Temporal profiling of the ERα interactome following treatment of MCF7 cells with OHT. a Volcano plots highlighting enriched or lost proteins in theERα interactome upon OHT treatment for 2 h, 6 h and 24 h. b Boxplots illustrating the loss of ERα co-activator proteins CREBBP, NCOA3 and NRIP1 at 2 hand the enrichment of several subunits of the SWI/SNF and NuRD complexes at 6 h (left to right). Quantitative values are normalised so that the median ofthe vehicle treated samples is zero (centered around the median of vehicle). Centre line shows the median, bounds of box correspond to the first and thirdquartiles and the upper and lower whiskers extend to the largest or the smallest value no further than 1.5 × IQR (inter-quartile range)
ARTICLE NATURE COMMUNICATIONS | DOI: 10.1038/s41467-018-04619-5
6 NATURE COMMUNICATIONS | (2018) 9:2311 | DOI: 10.1038/s41467-018-04619-5 | www.nature.com/naturecommunications

Identification of net changes in the ERα complex. Our datasuggest that treatment of MCF7 cells with OHT triggers sig-nificant changes in the composition of ERα interactome. Toassess whether the changes identified by the qPLEX-RIME ana-lysis are specific changes in interactions or result from changes intotal protein levels, we performed timecourse whole proteomequantification in matched samples under the same conditions(vehicle, 2 h, 6 h and 24 h, four biological replicates each) (Sup-plementary Data 9). We confirmed the OHT up-regulation ofERα protein levels (log2Fold-Change: 2 h 0.21, 6 h 0.5 and 24 h 1),which was not due to an increase in gene transcription. This isconsistent with previous reports demonstrating increased ERαstability in the presence of OHT52. A comparison between theqPLEX-RIME results and the total proteome data confirmed thatthe changes detected in the ERα complex upon OHT treatmentrepresent changes in protein recruitment as the respective totalprotein and mRNA levels remained unchanged (Fig. 5a). GREB1was the only ERα interactor with decreased mRNA and totalprotein levels at 24 h treatment. This is consistent with GREB1being an ERα target gene13,43 and explains the decreased asso-ciation between ERα and GREB1 at this late time point.
Downstream k-means clustering of the most variable proteins(adj. p-value < 0.05, Limma moderated t-test) across the threetime points in the total proteome, identified clusters of up- anddownregulated proteins (Fig. 5b). Gene Set Enrichment Analysisof the clusters, performed in Perseus software53, displayed anoverrepresentation of genes related to estrogen response andtamoxifen resistance (Fig. 5c). Our findings also revealed thedownregulation of proteins involved in cell cycle54 (Supplemen-tary Fig. 7a), in line with the antiproliferative effects of OHT24.Overall, significant changes in gene expression were observedalready at 6 h coinciding with pronounced changes in the ERαinteractome. As expected, the most significant changes in the totalproteome were observed at the later time point (24 h). Theseresults confirm that shuffling of ERα-associated proteins is nottypically due to global changes in protein levels. The low mRNA-to-protein correlation at 2 h and 6 h and the respective strongcorrelation at 24 h are shown in Supplementary Fig. 7b and c. Weconclude that our qPLEX-RIME data in combination with thetotal proteome measurements delineate both the local molecularevents in the ER interactome and the associated downstreamglobal effects.
a b
c
log 2
FC
log 2
FC
log 2
FC
(R
el. t
o ve
h)lo
g 2F
C (
Rel
. to
veh)
log 2
FC
(R
el. t
o ve
h)
–log
10 (
Ben
j.Hoc
h.F
DR
)
0.8
0.4
0.0
2 6Time (h)Time (h)
Time (h)
Time (h)
Protein Cluster2: downregulated
242 6 24
242 6
GREB1
2 6
GREB1
24 1.8 1.9 2.0
Enrichment factor
2.1
Time (h)
2 6 24
qPLEX-RIME Cluster1:upregulated
1
2
0
–1
–2
2
1
0
–1
–2
2mRNA 10
DUTERTRE_ESTRADIOL_RESPONSE_24HR_UP
DUTERTRE_ESTRADIOL_RESPONSE_24HR_DNOverlap(proteins)
30
20
40
50
8
MASSARWEH_TAMOXIFEN_RESISTANCE_U
MASSARWEH_TAMOXIFEN_RESISTANCE_DN
MASSARWEH_RESPONSE_TO_ESTRADIOL
BENPORATH_CYCLING_GENES
6 P
4
2
1
0
–1
–2
0
–1
–2
Fig. 5 Comparison of qPLEX-RIME data with total proteome analysis and RNA-seq data. a Line plots of the significantly enriched or lost proteins in theqPLEX-RIME data (top panel), their respective profiles in the total proteome analysis (middle panel) and in the RNA-seq analysis (bottom panel). b Lineplots representing two k-means clusters of down- and upregulated proteins identified in total proteome analysis (top 10% most variable proteins with atleast one significant change, adj. p-value < 0.05). c Gene set enrichment analysis for the down- and upregulated protein clusters
NATURE COMMUNICATIONS | DOI: 10.1038/s41467-018-04619-5 ARTICLE
NATURE COMMUNICATIONS | (2018) 9:2311 | DOI: 10.1038/s41467-018-04619-5 |www.nature.com/naturecommunications 7
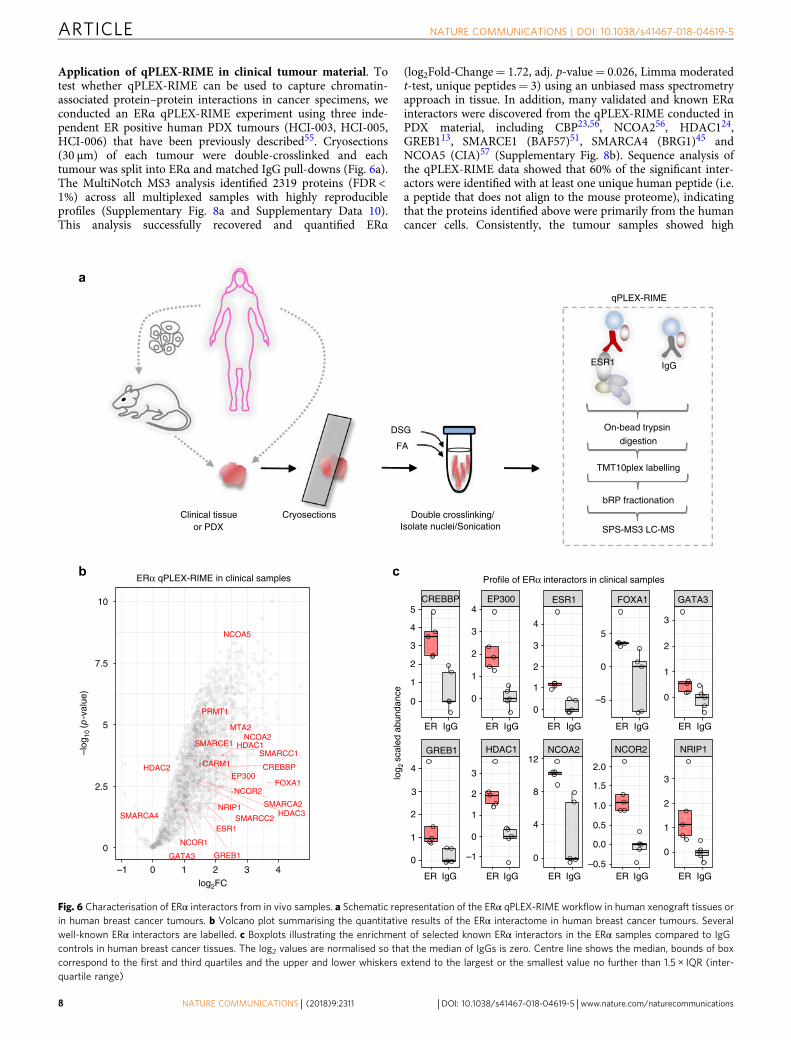
Application of qPLEX-RIME in clinical tumour material. Totest whether qPLEX-RIME can be used to capture chromatin-associated protein–protein interactions in cancer specimens, weconducted an ERα qPLEX-RIME experiment using three inde-pendent ER positive human PDX tumours (HCI-003, HCI-005,HCI-006) that have been previously described55. Cryosections(30 µm) of each tumour were double-crosslinked and eachtumour was split into ERα and matched IgG pull-downs (Fig. 6a).The MultiNotch MS3 analysis identified 2319 proteins (FDR <1%) across all multiplexed samples with highly reproducibleprofiles (Supplementary Fig. 8a and Supplementary Data 10).This analysis successfully recovered and quantified ERα
(log2Fold-Change= 1.72, adj. p-value= 0.026, Limma moderatedt-test, unique peptides= 3) using an unbiased mass spectrometryapproach in tissue. In addition, many validated and known ERαinteractors were discovered from the qPLEX-RIME conducted inPDX material, including CBP23,56, NCOA256, HDAC124,GREB113, SMARCE1 (BAF57)51, SMARCA4 (BRG1)45 andNCOA5 (CIA)57 (Supplementary Fig. 8b). Sequence analysis ofthe qPLEX-RIME data showed that 60% of the significant inter-actors were identified with at least one unique human peptide (i.e.a peptide that does not align to the mouse proteome), indicatingthat the proteins identified above were primarily from the humancancer cells. Consistently, the tumour samples showed high
a
b
Clinical tissueor PDX
Cryosections Double crosslinking/Isolate nuclei/Sonication
IgG
qPLEX-RIME
On-bead trypsin
digestion
TMT10plex labelling
bRP fractionation
SPS-MS3 LC-MS
DSG
FA
ESR1
cERα qPLEX-RIME in clinical samples Profile of ERα interactors in clinical samples
GREB1
ESR1
NCOA5
PRMT1
NCOR2
NCOR1
SMARCE1
GATA3
HDAC1
EP300
SMARCC2
FOXA1
NCOA2MTA2
CREBBP
SMARCC1CARM1
HDAC3SMARCA2NRIP1
HDAC2
SMARCA4
0
2.5
5
7.5
10
–1 0 1 2 3 4log2FC
–log
10 (p
-val
ue)
GREB1 HDAC1 NCOA2 NCOR2 NRIP1
CREBBP EP300 ESR1 FOXA1 GATA3
ER IgG ER IgG ER IgG ER IgG ER IgG
ER IgG ER IgG ER IgG ER IgG ER IgG
0
1
2
3
0
1
2
3
–5
0
5
–0.5
0.0
0.5
1.0
1.5
2.0
0
1
2
3
4
0
4
8
12
0
1
2
3
4
–1
0
1
2
3
0
1
2
3
4
5
0
1
2
3
4
log 2
sca
led
abun
danc
e
Fig. 6 Characterisation of ERα interactors from in vivo samples. a Schematic representation of the ERα qPLEX-RIME workflow in human xenograft tissues orin human breast cancer tumours. b Volcano plot summarising the quantitative results of the ERα interactome in human breast cancer tumours. Severalwell-known ERα interactors are labelled. c Boxplots illustrating the enrichment of selected known ERα interactors in the ERα samples compared to IgGcontrols in human breast cancer tissues. The log2 values are normalised so that the median of IgGs is zero. Centre line shows the median, bounds of boxcorrespond to the first and third quartiles and the upper and lower whiskers extend to the largest or the smallest value no further than 1.5 × IQR (inter-quartile range)
ARTICLE NATURE COMMUNICATIONS | DOI: 10.1038/s41467-018-04619-5
8 NATURE COMMUNICATIONS | (2018) 9:2311 | DOI: 10.1038/s41467-018-04619-5 | www.nature.com/naturecommunications
cellularity and positive staining for human ERα exclusively in thecancer cells and not in the stroma (Supplementary Fig. 8c ).Prompted by the successful application of qPLEX-RIME in
PDX tumours we sought to test the sensitivity of our method inhuman cancer clinical tissues, collected from surgery. To this end,we performed an ERα qPLEX-RIME experiment in fiveindependent human breast cancer tumours (ERα positive, PRpositive, Her2 negative and Grade2/Grade3). Approximately60 sections (30 µm) were obtained per sample, which weredouble-crosslinked and split for ERα and matched IgG pull-downs(Fig. 6a). The analysis successfully recovered ERα with excellentcoverage (17 unique peptides), as well as 2191 proteins (FDR <1%) that were quantified in all samples combined (SupplementaryData 11). These included well-described ERα interactors such asFOXA1, GATA3, GREB1, EP300, CBP, HDACs, NCORs andNCOA2 and subunits of the SWI/SNF complex (Fig. 6b). Theenrichment of several ERα interactors in the bait samplescompared to IgG control samples is illustrated in Fig. 6c.Our data highlights the method’s sensitivity and ability to
identify endogenous protein networks from heterogeneoushuman tumour samples. Importantly, we report the identificationof interactors from human tumour tissue material in an unbiasedmanner.
DiscussionHere, we describe qPLEX-RIME, a proteomic method whichenables comprehensive mapping of endogenous protein inter-actomes with high sensitivity and statistical robustness. TheqPLEX-RIME approach integrates the well-established RIMEimmunoprecipitation method with advanced high-resolutionquantitative multiplexed mass spectrometry analysis. Themethod can be utilised to discriminate enriched bona fide bindingpartners from contaminant proteins and to delineate thedynamics of chromatin-associated protein complexes with in-depth protein detection, reproducible quantification andincreased sample throughput. The filtering criteria for theprioritisation of the best candidates depend on the type ofexperiment and the biological question. For bait proteins wherevery little is known about their interactome, we recommend theuse of more stringent specificity criteria in terms of enrichmentfold-change, p-value and number of unique peptides in combi-nation with additional filtering based on functional annotations.When the focus is on the dynamic changes of interactomes, theprioritisation of the candidates mostly relies on their robustquantitative profiling across different conditions.The multiplexed analysis of our pipeline eliminates the need to
compare multiple data obtained by individual LC-MS runs,thereby increasing the quantification coverage in very low abun-dant protein interactors that are stochastically captured betweenindependent replicate runs58. The ability to combine the labelledpeptides derived from multiple samples increased the sensitivity ofthe method and enabled the characterisation of the ERα inter-actome in clinical tumours. Whilst interactors have previouslybeen detected from clinical material, this required targeted massspectrometry-based approaches and has not been done in anunbiased manner before13. Additionally, the use of isobariclabelling resolves the difficulties encountered with cell lines thatare not compatible with stable-isotope labelled culture media andprovides a means for quantitative analysis for clinical samples thatare not amenable to in vivo isotopic labelling techniques.Importantly, our isobaric-labelling data demonstrated highreproducibility with previously published SILAC data13 (Supple-mentary Fig. 7d), confirming the accurate quantification obtainedby the MultiNotch MS3 level mass spectrometry analysis.
Here, we focused on ERα, the major driving transcriptionfactor in luminal breast cancer56, which can be targeted bytamoxifen, a drug used for the treatment of ER+ breast cancer59.Although many ERα interactors involved in ER-mediated geneexpression have been discovered23,45 our knowledge about theirrelevance at the tissue level and the impact of tamoxifen on theirglobal association with ERα remains limited. The quantitativedata obtained by the qPLEX-RIME experiments has provided uswith a list of ERα-associated proteins with significant enrichmentover the IgG samples. These include transient, indirect or weakinteractions, as it is known that ERα associates with a number ofdifferent co-activators rapidly in a cyclic fashion23,45. As such thefinal readout of the crosslinking-based qPLEX-RIME methodrepresents the sum of these interactions. Among these, we vali-dated the interactions between ERα and three proteins; namelyCBX3, NIPBL and FOXK1. CBX3 protein is a member of the HP1protein family, a group of proteins that have been implicated ingene regulation, DNA replication and nuclear architecture60,whereas NIPBL is a core subunit of the highly conserved proteincomplex cohesin that has an important role in chromatin struc-ture, gene expression, and DNA repair61. The transcription factorFOXK1 belongs to the forkhead family and has an important rolein tumorogenesis62,63. These findings demonstrate that the gainin sensitivity obtained by qPLEX-RIME can reveal novel ERαinteractors. Collectively, we identified a compendium of 253proteins with consistent presence in all MCF7 data sets (Fig. 7).Importantly, our data show that the vast majority of these ERα-associated proteins (83%) can now be studied either in PDX or inhuman clinical tissues validating the relevance of these factorsin vivo. Additionally, our qPLEX-RIME data on three additionalfactors, the CREBBP, NCOA3 and the phosphorylated form ofPOLR2A, highlight the wide applicability of our pipeline.The application of qPLEX-RIME targeting ERα at multiple
time points after OHT treatment, revealed a dynamic change inERα co-regulators following drug treatment recapitulating andexpanding the existing knowledge of OHT mechanism. After 2 hOHT treatment, we observed a loss of important transcriptionalco-activators, such as NCOA3 and CBP, whereas at 6 h weobserved enrichment on the recruitment of two well-conservedchromatin remodelling complexes, namely the NuRD and theSWI/SNF complex. This coincided with the enrichment of thebasal corepressor NCOR2, which assists in the recruitment ofHDAC proteins64. At the latest time point of 24 h, we observed arestoration of the ERα complex, which may be linked to the half-life of OHT. The exceptions were NRIP1, GREB1 and NCOA3.Interestingly, NCOA3 is amplified in breast cancer22 and itsexpression levels have been associated with the effectiveness oftamoxifen treatment65. Further, ChIP-seq analysis has revealedthat a number of binding sites of NCOA3 are associated withgenes with a predictive value for breast cancer patient outcome56,supporting an important role of this co-regulator in tamoxifenresponse.Our timecourse data indicate a switch between activation and
repression of transcription in response to OHT treatment. Thistransition engages a two-step process with the immediate loss ofco-activators, followed by the recruitment of co-repressors andATP-chromatin remodelling complexes that may act coopera-tively or in a sequential manner to accomplish transcriptionalrepression. The integration of qPLEX-RIME data with globalprotein and mRNA analysis provides a comprehensive view of theactivity of a transcription-associated complex over time. A pro-posed model of OHT mechanism is depicted in SupplementaryFig. 9.The qPLEX-RIME method can be used to monitor any
dynamic changes of interest and importantly can be applied toclinical samples to study tumour evolution, treatment response or
NATURE COMMUNICATIONS | DOI: 10.1038/s41467-018-04619-5 ARTICLE
NATURE COMMUNICATIONS | (2018) 9:2311 | DOI: 10.1038/s41467-018-04619-5 |www.nature.com/naturecommunications 9

numerous other biological and clinical questions. It provides arobust tool for the quantitative analysis of complexes that can beapplied to generate comprehensive endogenous protein–proteininteraction maps.
MethodsCell lines and cell treatments. ERα-expressing MCF7 breast cancer cells werecultured in Dulbecco’s Modified Eagle Medium DMEM (Gibco, Thermo Scientific,Leicestershire, UK, ref. 41965-239). Media was supplemented with 10% foetalbovine serum (FBS), 50 U/ml penicillin, 50 μg/ml streptomycin and 2 mML-glutamine. MCF7 cells were obtained from ATCC and they were tested formycoplasma contamination. Also, the MCF7 cells were genotyped by short-tandemrepeat genetic profiling using the PowerPlex_16HS_Cell Line panel and analysedusing Applied Biosystems Gene Mapper ID v3.2.1 software by the external providerGenetica DNA Laboratories (LabCorp Specialty Testing Group). For the celltreatments, 4-Hydroxytamoxifen (Sigma-Aldrich, #HG278) or Fulvestrant (Sell-eckchem, #S1191) were used at final concentration 100 nM.
Whole cell lysate preparation and western blot analysis. Cell pellets werereconstituted in 100 μl RIPA buffer (Thermo Scientific, #89901) that was supple-mented with protease inhibitors (Roche). 25 μg protein from each sample wasloaded on the gel (Invitrogen 4–12%) and the Precision Plus, ProteinTM dualcolour Standards Protein molecular weight marker (Bio-Rad, #161-0974) was usedfor the determination of protein sizes. The proteins were transferred onto anitrocellulose membrane using the iBlot® 2 Dry Blotting System (Invitrogen) fol-lowed by one hour blocking using Odyssey® Blocking Buffer (Li-Cor,927-40000). The membrane was immunoblotted with ERα antibody (Novocastra#6045332, 1:100) and beta-actin (Cell signalling #4970, 1:1000). Detection of theER was achieved using the IRDye® 800 CW Goat anti-Mouse (926-32210, Li-CorBiosciences) diluted to 1:5000, while the loading control was detected using theIRDye 680LT Goat anti-Rabbit (926-68071, Li-Cor Biosciences) diluted to 1:15000.All antibodies were diluted in Odyssey Buffer contained 0.1% Tween. Supple-mentary Fig. 10 shows the uncropped scan of the blot.
RNA-seq analysis. Cells were washed twice with cold Phosphate buffered saline(PBS) and harvested using 350 μl of lysis buffer (RLT). Total RNA was extractedusing the RNeasy® kit (Qiagen, #74106) according to the manufacturer’s instruc-tions. The extracted RNA was quantified using a NanoDrop® ND-1000
Spectrophotometer (Thermo Scientific). For the library preparation, the IlluminaTruSeq Stranded mRNA Library Prep Kit High Throughput was used according tothe manufacturer’s instructions and two lanes of 50 bp single-end reads were runon HiSeq 4000. Reads were aligned to the human genome version GRCh37.75using TopHat v2.1.066. Read counts were obtained using feature Counts function inSubread v1.5.267 and read counts were normalised and tested for differential geneexpression using the DESeq2 workflow68. Multiple testing correction was appliedusing the Benjamini–Hochberg method.
RIME analysis. MCF7 cells (2 × 10⁶) were grown in complete media. The mediawas replaced with PBS containing 1% FA (Thermo #28908) and crosslinked for 10min. For the double crosslinking cells were incubated in PBS containing 2 mMDSG (disuccinimidyl glutarate- Santa Cruz Biotechnology, #sc-285455A) for 20min followed by incubation in 1% FA for 10 min. Crosslinking was quenched byadding glycine to a final concentration of 0.1 M. For the performance of RIMEexperiments, 50 μl of Dynabeads® Protein A (Invitrogen) and 5 μg of specificantibody were used for each sample. The antibodies used were: Rabbit polyclonalERα antibody (Santa Cruz, sc-543), rabbit polyclonal SRC3 antibody (Bethyllaboratories, A300-347A), rabbit polyclonal CBP antibody (Diagenode,C15410224), rabbit polyclonal RNA polymerase II (phospho S5) antibody (Abcam,ab5131) and rabbit IgG antibody (Santa Cruz, sc-2027 or Abcam, ab171870). Fornuclear extraction the cell pellet was resuspended in LB1 buffer (50 mM HEPES-KOH (pH 7.5), 140 mM NaCl, 1 mM EDTA, 10% glycerol, 0.5% NP-40 and 0.25%Triton X-100) followed by rotation mixing for 10 min at 4 °C. Then, nuclei werepelleted and resuspended in LB2 buffer (10 mM Tris-HCL (pH 8.0), 200 mM NaCl,1 mM EDTA and 0.5 mM EGTA) and rotated at 4 °C for 5 min. The samples wereresuspended in LB3 buffer (10 mM Tris-HCl (pH 8), 100 mM NaCl, 1 mM EDTA,0.5 mM EGTA, 0.1% Na-deoxycholate and 0.5% N-lauroylsarcosine). Chromatinwas sheared by sonication (Diagenode) to produce DNA fragments of 100–1,000bp. The bead-bound antibody and chromatin were incubated overnight at 4 oC.The next day the beads were washed 10 times with 1 ml ice-cold RIPA buffer andtwice with 500 μl 100 mM AMBIC (ammonium bicarbonate).
Proximity ligation assay. Cells were fixed and permeabilised by the addition ofice-cold methanol (−20 °C) for 3 min followed by three washing steps with coldPBS. PLA was carried out according to manufacturer’s instructions (Sigma Aldrich,#DUO92007). The following primary antibodies were used for the PLA assay: ERα(Santa Cruz, sc-543 or sc-8002, 1:250) HP1γ (Santa Cruz, sc-365085, 1:400), NIPBL(Santa Cruz, sc-374625, 1:200), FOXK1 (Santa Cruz, sc-373810, 1:200), GFP
TLE3PIAS3
TFAP2CXRCC1 TRPS1
NRIP1RPA1
PIN1
SUMO3CREBBP
PXNEP300FKBP4
HAT1
HSP90AB1
LDB1NR2F6
TNRC18
TRIM33OGT
NAP1L4
ZNF217GATA3
RBBP7
CTBP2TRIM24BAG4
HTATSF1CARM1
HSP90AA1
ANXA4
GABARAPL2
ZBTB7ADNAJB11
ZBTB1
PNKP
DNAJA1CDC37
ZKSCAN1DNAJB1
TP53BP1UBE2I
AES
BCL9L
GREB1
NBR1
TRIM25
FOXA1GOPC
NR2F2
ESR1NCOA3
RXRAZMYM2CTBP1
NCOR2SMARCA4
MSI2
FUS
UPF1
PRMT1HDAC2 PSME3
DROSHA
RARA
CEBPB
SF3B4
HNRNPA1HNRPDL
ZC3H4
PABPC1
HNRNPC
DHX9RBM4HNRNPK
HNRNPUHNRNPH3
NONO
EWSR1SRSF9
TAF15TNPO2SNRPD3
CPNE3
ZNF207
TIAL1
HNRNPH1
TIA1
CSRP1
SNRPC
CPSF7
HSPA8
KHDRBS1
RBMXCHERP
PTBP1
SRRT PCBP1SRSF6
HNRNPH2HNRNPA2B1
RALYU2AF2
SRSF2
SF1NUDT21
HNRNPAB
SNRPA
HNRNPFHNRNPM CIRBP
FUBP3
SRSF5SNRPD2
FAM120A
ZFR
GTF3C4
ZNF282ESRP1
RBM14
HNRNPUL2
AKAP8L
ESRP2
RAVER1
HNRNPDSMN1
HNRNPL
MATR3
HEATR2
RBM12B
ZNF326
ZC3H7B
RXRBPOGZ
ZNF687 PARN
ELMSAN1
MAD1L1
ADNP
DPF2
TBCB
TUBA1C
WDR82
ELAVL1
CELF1
NMD3
MYEF2
GSE1WDR5
RNF114HMG20BKEAP1
SMARCE1
YLPM1
FUBP1WDR33
GRHL2DDX17
CPSF1RBM3
KHSRP
CSTF1
SNRNP70
SRSF10
PSPC1
SYNCRIP
KPNA1
SFPQ
TET2
PFN1
CPSF6
SMARCD2
DIDO1
CHD4
ZMYND8MTA2
COPB2SUMO1SQSTM1
DRG1DNAJA2
SUMO2
NAPA
PRKAR1AARF5
PHPT1
OSTF1
AP1M1
NUMA1
CACYBP
DYNLL2
SAFB
SAFB2HNRNPA3
IGBP1
DAZAP1
EIF4A1DDX20
GRB2STIP1
SRSF1
AKAP8HNRNPUL1
HNRNPR
HNRNPA0
NUDT16L1
SUGP2
RBM10TRIP6
MYO5CGOLGA1
TONSL
TRIM28 FKBP5
NEDD8DYNLL1
MCM2
RBM12PKMSRSF7
DDX5
SNRPFSNRPD1
SERPINH1CSDE1
RBM25
LGALS3
SRP9
Fig. 7 Most frequently enriched ERα interactors. STRING network of 253 ERα interactors identified consistently across all the qPLEX-RIME analysesperformed in MCF7 cells. The font size increases proportionally to the average fold-change enrichment of these proteins across all the ERα samplescompare to IgG controls
ARTICLE NATURE COMMUNICATIONS | DOI: 10.1038/s41467-018-04619-5
10 NATURE COMMUNICATIONS | (2018) 9:2311 | DOI: 10.1038/s41467-018-04619-5 | www.nature.com/naturecommunications

(Abcam, ab1218, 1:200), NCOA3 (Bethyl Laboratories, A300-347A, 1:200), CBP(Bethyl Laboratories, A300-363A, 1:200), BAF170 (Santa Cruz, sc-17838, 1:200),HDAC1 (Santa Cruz, sc-81598, 1:200) and the incubation on the coverslips wasperformed for 1 h at 37 °C. For the single PLA recognition experiment two ERαantibodies (Santa Cruz, sc-543, 1:800 and Invitrogen, MA5-13191, 1:1200) wereused in combination. The secondary proximity probes (Sigma Aldrich, Rabbit-PLUS, #DUO92002 and Mouse-MINUS, #DUO92004) were incubated for 1 h at37 °C. The Leica DFC340FX microscope was used and images were captured withLeica Imaging software. DAPI and PLA fluorescence were captured at high reso-lution for a total of 8 separate observation fields. Cell numeration and PLAlabelling were carried out using Image J software. Cells and red PLA dots werecounted using the ‘Analyze Particles’ function. For each condition at least 200 cellswere imaged and analysed. Then, the average value of number of spots per nucleuswas calculated. All statistical analyses were carried out by performing Student’s t-test.
Immunofluorescence. Cells were fixed and permeabilised with ice-cold (−20 °C)methanol for 3 min and after fixation cells were blocked in PBS-5 % (w/v) BovineSerum Albumin (BSA) (Sigma-Aldrich) for 30 min at room temperature. Theprimary ERα antibody (Santa Cruz, sc-543, 1:250) was diluted in blocking solution(PBS-5 % (w/v) BSA) and incubated on coverslips for 1 h at 37 °C. Afterwards, thecoverslips were washed four times in washing buffer (PBS-0.5% Tween). Secondaryantibody conjugated to Alexa Fluor 488 (Invitrogen, #A-21206, 1:500) was dilutedin blocking solution and incubated on coverslips for 1 h at 37 °C in the dark.Coverslips were then washed again three times in washing buffer and once in PBS.
PDX propagation and tissue collection. Viably frozen PDX tumour tissue waspropagated in immune-compromised mice. Briefly, 1 mm3 tumour pieces wereimplanted into the 4th mammary pad of NSG mice. All mice were supplementedwith estrogen, using silastic E2 pellets (made in-house) inserted into the dorsalscruff. Twice weekly standard monitoring and tumour measurement was con-ducted. Once tumours reached appropriate size, ~1000 mm3, mice were sacrificedby cervical dislocation under deep, isoflurane-induced anaesthesia. The tumourswere resected, diced and processed by either snap freezing in liquid nitrogen, fixingin 10% neutral buffered formalin solution for subsequent paraffin embedding,embedding in OCT, or viably freezing in FCS supplemented with 5% DMSO.
Sample preparation of clinical tumour material. Clinical samples were cryo-sectioned in 30 µm slices using the Leica CM 3050 S cryostat. Tissue sections werefixed in a two-step procedure by adding 2 mM DSG for 25 min. In the samesuspension of tissue sections, 1% FA was added for another 20 min withoutremoval of the DSG. Crosslinking was quenched by the addition of glycine to afinal concentration of 0.25M. Samples were centrifuged for 3 min at 2500 g and thesupernatant was discarded. Tissue pellets were washed twice with cold PBS andresuspended in 6 ml LB3 buffer (10 mM Tris-HCl (pH 8), 100 mM NaCl, 1 mMEDTA, 0.5 mM EGTA, 0.1% Na-deoxycholate, and 0.5% N-lauroylsarcosine), fol-lowed by tip sonication for 12–20 cycles (30 s on, 1 min off) depending on thetumour size. The downstream processing was performed as described above (seeRIME method section) and the tissue samples were separated in two parts for theperformance of ERα and IgG RIME pull-down assays. Patient and patient-derivedtissues used in this work were collected under protocol X13-0133,HREC/13/RPAH/187. HREC approval was obtained through the SLHD (SydneyLocal Health District) Ethics Committee ((Royal Prince Alfred Hospital) zone), andsite-specific approvals were obtained for all additional sites. Written consent wasobtained from all patients prior to collection of tissue and clinical data stored in ade-identified manner, following pre-approved protocols. All animal procedureswere carried out in accordance to relevant national and international guidelinesand animal protocols approved by the Garvan/St Vincent’s Animal Ethics Com-mittee (Animal ethics number 15/10).
Immunohistochemistry. FFPE blocks from PDX tumours were sectioned at 4 µmonto Superfrost Plus slides. Immunohistochemistry was carried out using the LeicaBond Autostainer. Sections underwent dewaxing, heat induced antigen retrieval(Leica reagent ER2, 30 mins), and primary and secondary antibody incubations,using ERα antibody (ab108398, Abcam, 1:500) and the EnVision+ Rabbit sec-ondary system, respectively. Sections were counterstained with haematoxylin.
Trypsin digestion and TMT labelling. A volume of 10 μL trypsin solution (15 ng/μl) (Pierce) in 100 mM AMBIC was added to the beads followed by overnightincubation at 37 °C. A second digestion step was performed the next day for 4 h.After proteolysis the tubes were placed on a magnet and the supernatant solutionwas collected after acidification by the addition of 2 μl 5% formic acid. Theresultant peptides were cleaned with the Ultra-Micro C18 Spin Columns (HarvardApparatus) according to manufacturer’s instructions. The peptide samples weredried with speedvac, reconstituted in 100 μl 0.1 M TEAB (triethylammoniumbicarbonate) and labelled using the TMT-10plex reagents (Thermo Fisher) with arandomised design. The peptide mixture was fractionated with Reversed-Phasecartridges at high pH (Pierce #84868). Nine fractions were collected using differentelution solutions in the range of 5–50% ACN.
For the total proteome analysis 200 μl of 0.1 M TEAB, 0.1% SDS buffer wasadded to each cell pellet followed by probe sonication and boiling at 95 °C. Proteinconcentration was estimated with Bradford assay (BIO-RAD-Quick start)according to manufacturer’s instructions. For each sample, 90 μg of total proteinwere reduced for 1 h at 60 °C by the addition of 2 μL 50 mM tris-2-carboxyethylphosphine (TCEP, Sigma). Cysteines were blocked for 10 min on the bench withthe addition of 1 μL 200 mM methyl methanethiosulfonate (MMTS, Sigma). Forpeptide generation, trypsin (Pierce #90058) solution was added at ratio protein/trypsin ~30:1 for overnight digestion at 37 °C. The next day peptides were allowedto react with the TMT-10plex reagents (Thermo Scientific) for one hour. Thereaction was quenched with 8 μL of 5% hydroxylamine (Thermo Scientific) and thelabelled samples were mixed and dried with speedvac concentrator. The TMT mixwas reconstituted and fractionated on a Dionex Ultimate 3000 system at high pHusing the X-Bridge C18 column (3.5 μm 2.1 × 150 mm, Waters) with 1% gradient.UV signal was recorded at 280 and 215 nm and fractions were collected in a peakdependent manner.
LC-MS analysis. Peptide fractions were analysed on a Dionex Ultimate 3000UHPLC system coupled with the nano-ESI Fusion Lumos (Thermo Scientific).Samples were loaded on the Acclaim PepMap 100, 100 μm× 2 cm C18, 5 μm, 100 Ȧtrapping column with the ulPickUp injection method using the loading pump at 5μL/min flow rate for 10 min. For the peptide separation the EASY-Spray analyticalcolumn 75 μm× 25 cm, C18, 2 μm, 100 Ȧ column was used for multi-step gradientelution. Mobile phase (A) was composed of 2% acetonitrile, 0.1% formic acid andmobile phase (B) was composed of 80% acetonitrile, 0.1% formic acid. The elutionmethod at flow rate 300 nL/min included the following: for 95 min gradient up to45% (B), for 5 min gradient up to 95% (B), for 8 min isocratic 95% (B), for 2 mindown to 5% (B), for 10 min isocratic equilibration 5% (B) at 40 °C. For the clinicalsample analysis, a longer gradient separation was used as follows: for 160 mingradient up to 40% (B), for 10 min gradient up to 95% (B), for 8 min isocratic 95%(B), for 2 min down to 5% (B), and for 10 min isocratic equilibration 5% (B). TheLumos was operated in a data-dependent mode for both MS2 and SPS-MS3methods. The full scans were performed in the Orbitrap in the range of 380–1500m/z at 120 K resolution. The MS2 scans were performed in the ion trap withcollision energy 35%. Peptides were isolated in the quadrupole with isolationwindow 0.7 Th. The 10 most intense fragments were selected for SynchronousPrecursor Selection (SPS) HCD-MS3 analysis with MS2 isolation window 2.0 Th.The HCD collision energy was set at 55% and the detection was performed withOrbitrap resolution 60k and in scan range 110–400m/z.
Data processing and interpretation. The collected CID tandem mass spectrawere processed with the SequestHT search engine on the Proteome Discoverer2.1 software for peptide and protein identifications. The node for SequestHTincluded the following parameters: Precursor Mass Tolerance 20 ppm, FragmentMass Tolerance 0.5 Da, Dynamic Modifications were Oxidation of M (+15.995Da), Deamidation of N, Q (+0.984 Da) and Static Modifications were TMT6plex atany N-Terminus, K (+229.163 Da) for the quantitative data. Methylthio at C(+45.988) was included for the total proteome data. The Reporter Ion Quantifiernode included a TMT 6plex (Thermo Scientific Instruments) QuantificationMethod, for MS3 scan events, HCD activation type, integration window tolerance20 ppm and integration method Most Confident Centroid. The consensus work-flow included S/N calculation for TMT intensities and the level of confidence forpeptide identifications was estimated using the Percolator node with decoy data-base search. Strict FDR was set at q-value < 0.01.
Bioinformatics Analysis. We developed an R package (qPLEXanalyzer) to per-form downstream data analysis. All analyses were performed using only uniquepeptides identified with high confidence (peptide FDR < 1%) across all experi-ments. Peptide-level signal-to-noise (S/N) TMT values were corrected for equalloading across samples using different normalisation approaches based upon theexperiment type. For the regression-based correction, unique peptides wereaggregated and proteins identified in all the experiments were kept for furtheranalysis. The normalisation on the bait protein level was carried out at protein levelusing log2 row-mean scaled values. To filter-out non-specific proteins, a limma-based differential analysis was performed comparing ER and IgG control samples.In the regression analysis, the ERα profile was used as the independent variable (x)and the profile of any other protein as the dependent variable (y) excluding the IgGcontrols. The residuals of the y= ax+ b linear model represent the proteinquantification profiles that are not driven by ERα amount in the pull-down. Moredetails on the normalisation methods used can be found in Supplementary Note 2.The identification of differentially bound proteins was carried out using the limma-based analysis. A multiple testing correction was applied on p-value using theBenjamini–Hochberg method to control the FDR.
Code availability. The qPLEXanalyzer and qPLEXdata R packages are available at(https://doi.org/10.5281/zenodo.1237825). Both pipelines are described in detail inSupplementary Notes 1 and 2.
NATURE COMMUNICATIONS | DOI: 10.1038/s41467-018-04619-5 ARTICLE
NATURE COMMUNICATIONS | (2018) 9:2311 | DOI: 10.1038/s41467-018-04619-5 |www.nature.com/naturecommunications 11
Data availability. RNA-seq data have been deposited in NCBI’s Gene ExpressionOmnibus69 and are accessible through GEO Series accession number GSE104872.The mass spectrometry proteomics data have been deposited to the ProteomeXchangeConsortium via the PRIDE70 partner repository with the data set identifierPXD007968. All other data supporting the findings of this study are available from thecorresponding authors on reasonable request.
Received: 2 November 2017 Accepted: 3 May 2018
References1. Vidal, M., Cusick, M. E. & Barabasi, A. L. Interactome networks and human
disease. Cell 144, 986–998 (2011).2. Ewing, R. M. et al. Large-scale mapping of human protein–protein
interactions by mass spectrometry. Mol. Syst. Biol. 3, 89 (2007).3. Stelzl, U. et al. A human protein–protein interaction network: a resource for
annotating the proteome. Cell 122, 957–968 (2005).4. Rolland, T. et al. A proteome-scale map of the human interactome network.
Cell 159, 1212–1226 (2014).5. Rual, J. F. et al. Towards a proteome-scale map of the human protein–protein
interaction network. Nature 437, 1173–1178 (2005).6. Hein, M. Y. et al. A human interactome in three quantitative dimensions
organized by stoichiometries and abundances. Cell 163, 712–723 (2015).7. Huttlin, E. L. et al. Architecture of the human interactome defines protein
communities and disease networks. Nature 545, 505–509 (2017).8. Collins, B. C. et al. Quantifying protein interaction dynamics by SWATH mass
spectrometry: application to the 14-3-3 system. Nat. Methods 10, 1246–1253(2013).
9. Liu, F., Rijkers, D. T., Post, H. & Heck, A. J. Proteome-wide profiling ofprotein assemblies by cross-linking mass spectrometry. Nat. Methods 12,1179–1184 (2015).
10. Rafiee, M. R., Girardot, C., Sigismondo, G. & Krijgsveld, J. Expanding thecircuitry of pluripotency by selective isolation of chromatin-associatedproteins. Mol. Cell 64, 624–635 (2016).
11. Wierer, M. & Mann, M. Proteomics to study DNA-bound and chromatin-associated gene regulatory complexes. Hum. Mol. Genet. 25, R106–R114(2016).
12. Engelen, E. et al. Proteins that bind regulatory regions identified by histonemodification chromatin immunoprecipitations and mass spectrometry. Nat.Commun. 6, 7155 (2015).
13. Mohammed, H. et al. Endogenous purification reveals GREB1 as a keyestrogen receptor regulatory factor. Cell Rep. 3, 342–349 (2013).
14. Mohammed, H. et al. Rapid immunoprecipitation mass spectrometry ofendogenous proteins (RIME) for analysis of chromatin complexes. Nat.Protoc. 11, 316–326 (2016).
15. Roumeliotis, T. I. et al. Genomic determinants of protein abundance variationin colorectal cancer cells. Cell Rep. 20, 2201–2214 (2017).
16. McAlister, G. C. et al. Increasing the multiplexing capacity of TMTs usingreporter ion isotopologues with isobaric masses. Anal. Chem. 84, 7469–7478(2012).
17. McAlister, G. C. et al. MultiNotch MS3 enables accurate, sensitive, andmultiplexed detection of differential expression across cancer cell lineproteomes. Anal. Chem. 86, 7150–7158 (2014).
18. Nowak, D. E., Tian, B. & Brasier, A. R. Two-step cross-linking method foridentification of NF-kappaB gene network by chromatinimmunoprecipitation. Biotechniques 39, 715–725 (2005).
19. Chatr-Aryamontri, A. et al. The BioGRID interaction database: 2017 update.Nucleic Acids Res. 45, D369–D379 (2017).
20. Szklarczyk, D. et al. The STRING database in 2017: quality-controlledprotein–protein association networks, made broadly accessible. Nucleic AcidsRes. 45, D362–D368 (2017).
21. Tsai, W. W. et al. TRIM24 links a non-canonical histone signature to breastcancer. Nature 468, 927–932 (2010).
22. Anzick, S. L. et al. AIB1, a steroid receptor coactivator amplified in breast andovarian cancer. Science 277, 965–968 (1997).
23. Shang, Y., Hu, X., DiRenzo, J., Lazar, M. A. & Brown, M. Cofactor dynamicsand sufficiency in estrogen receptor-regulated transcription. Cell 103, 843–852(2000).
24. Liu, X. F. & Bagchi, M. K. Recruitment of distinct chromatin-modifyingcomplexes by tamoxifen-complexed estrogen receptor at natural target genepromoters in vivo. J. Biol. Chem. 279, 15050–15058 (2004).
25. Jepsen, K. et al. Combinatorial roles of the nuclear receptor corepressor intranscription and development. Cell 102, 753–763 (2000).
26. Carroll, J. S. et al. Chromosome-wide mapping of estrogen receptor bindingreveals long-range regulation requiring the forkhead protein FoxA1. Cell 122,33–43 (2005).
27. Tan, S. K. et al. AP-2gamma regulates oestrogen receptor-mediated long-range chromatin interaction and gene transcription. EMBO J. 30, 2569–2581(2011).
28. Theodorou, V., Stark, R., Menon, S. & Carroll, J. S. GATA3 acts upstream ofFOXA1 in mediating ESR1 binding by shaping enhancer accessibility. GenomeRes. 23, 12–22 (2013).
29. Soderberg, O. et al. Direct observation of individual endogenous proteincomplexes in situ by proximity ligation. Nat. Methods 3, 995–1000 (2006).
30. Wardell, S. E., Marks, J. R. & McDonnell, D. P. The turnover of estrogenreceptor alpha by the selective estrogen receptor degrader (SERD) fulvestrantis a saturable process that is not required for antagonist efficacy. Biochem.Pharmacol. 82, 122–130 (2011).
31. Lonard, D. M. & O’Malley, B. W. Nuclear receptor coregulators: judges, juries,and executioners of cellular regulation. Mol. Cell 27, 691–700(2007).
32. Bannister, A. J., Oehler, T., Wilhelm, D., Angel, P. & Kouzarides, T.Stimulation of c-Jun activity by CBP: c-Jun residues Ser63/73 are required forCBP induced stimulation in vivo and CBP binding in vitro. Oncogene 11,2509–2514 (1995).
33. Acevedo, M. L. & Kraus, W. L. Mediator and p300/CBP-steroid receptorcoactivator complexes have distinct roles, but function synergistically, duringestrogen receptor alpha-dependent transcription with chromatin templates.Mol. Cell. Biol. 23, 335–348 (2003).
34. Siersbaek, R. et al. Dynamic rewiring of promoter-anchored chromatin loopsduring adipocyte differentiation. Mol. Cell 66, 420–435 e425 (2017).
35. Phatnani, H. P. & Greenleaf, A. L. Phosphorylation and functions of the RNApolymerase II CTD. Genes & Dev. 20, 2922–2936 (2006).
36. Orphanides, G. & Reinberg, D. RNA polymerase II elongation throughchromatin. Nature 407, 471–475 (2000).
37. Hahn, S. Structure and mechanism of the RNA polymerase II transcriptionmachinery. Nat. Struct. Mol. Biol. 11, 394–403 (2004).
38. Frasor, J. et al. Selective estrogen receptor modulators: discrimination ofagonistic versus antagonistic activities by gene expression profiling in breastcancer cells. Cancer Res. 64, 1522–1533 (2004).
39. Frasor, J. et al. Profiling of estrogen up- and down-regulated gene expressionin human breast cancer cells: insights into gene networks and pathwaysunderlying estrogenic control of proliferation and cell phenotype.Endocrinology 144, 4562–4574 (2003).
40. Frasor, J., Danes, J. M., Funk, C. C. & Katzenellenbogen, B. S. Estrogen down-regulation of the corepressor N-CoR: mechanism and implications forestrogen derepression of N-CoR-regulated genes. Proc Natl Acad. Sci. USA102, 13153–13157 (2005).
41. Caliceti, C. et al. 17beta-estradiol enhances signalling mediated by VEGF-A-delta-like ligand 4-notch1 axis in human endothelial cells. PLoS ONE 8,e71440 (2013).
42. May, F. E. & Westley, B. R. Expression of human intestinal trefoil factor inmalignant cells and its regulation by oestrogen in breast cancer cells. J. Pathol.182, 404–413 (1997).
43. Ghosh, M. G., Thompson, D. A. & Weigel, R. J. PDZK1 and GREB1 areestrogen-regulated genes expressed in hormone-responsive breast cancer.Cancer Res. 60, 6367–6375 (2000).
44. McCarthy, D. J., Campbell, K. R., Lun, A. T. & Wills, Q. F. Scater: pre-processing, quality control, normalization and visualization of single-cellRNA-seq data in R. Bioinformatics 33, 1179–1186 (2017).
45. Metivier, R. et al. Estrogen receptor-alpha directs ordered, cyclical, andcombinatorial recruitment of cofactors on a natural target promoter. Cell 115,751–763 (2003).
46. Shiau, A. K. et al. The structural basis of estrogen receptor/coactivatorrecognition and the antagonism of this interaction by tamoxifen. Cell 95,927–937 (1998).
47. Rosell, M. et al. Complex formation and function of estrogen receptor alpha intranscription requires RIP140. Cancer Res. 74, 5469–5479 (2014).
48. Lai, A. Y. & Wade, P. A. Cancer biology and NuRD: a multifaceted chromatinremodelling complex. Nat. Rev. Cancer 11, 588–596 (2011).
49. Chen, J. D. & Evans, R. M. A transcriptional co-repressor that interacts withnuclear hormone receptors. Nature 377, 454 (1995).
50. Zhang, B., Chambers, K. J., Faller, D. V. & Wang, S. Reprogramming of theSWI/SNF complex for co-activation or co-repression in prohibitin-mediatedestrogen receptor regulation. Oncogene 26, 7153–7157 (2007).
51. Belandia, B., Orford, R. L., Hurst, H. C. & Parker, M. G. Targeting of SWI/SNFchromatin remodelling complexes to estrogen-responsive genes. EMBO J. 21,4094–4103 (2002).
52. Wijayaratne, A. L. & McDonnell, D. P. The human estrogen receptor-alpha isa ubiquitinated protein whose stability is affected differentially by agonists,
ARTICLE NATURE COMMUNICATIONS | DOI: 10.1038/s41467-018-04619-5
12 NATURE COMMUNICATIONS | (2018) 9:2311 | DOI: 10.1038/s41467-018-04619-5 | www.nature.com/naturecommunications

antagonists, and selective estrogen receptor modulators. J. Biol. Chem. 276,35684–35692 (2001).
53. Tyanova, S. et al. The Perseus computational platform for comprehensiveanalysis of (prote)omics data. Nat. Methods 13, 731–740 (2016).
54. Whitfield, M. L. et al. Identification of genes periodically expressed in thehuman cell cycle and their expression in tumors. Mol. Biol. Cell. 13,1977–2000 (2002).
55. DeRose, Y. S. et al. Tumor grafts derived from women with breast cancerauthentically reflect tumor pathology, growth, metastasis and diseaseoutcomes. Nat. Med. 17, 1514–1520 (2011).
56. Zwart, W. et al. Oestrogen receptor-co-factor-chromatin specificity in thetranscriptional regulation of breast cancer. EMBO J. 30, 4764–4776 (2011).
57. Sauve, F. et al. CIA, a novel estrogen receptor coactivator with a bifunctionalnuclear receptor interacting determinant. Mol. Cell. Biol. 21, 343–353 (2001).
58. Rauniyar, N. & Yates, J. R. 3rd Isobaric labeling-based relative quantificationin shotgun proteomics. J. Proteome Res. 13, 5293–5309 (2014).
59. Shang, Y. & Brown, M. Molecular determinants for the tissue specificity ofSERMs. Science 295, 2465–2468 (2002).
60. Eissenberg, J. C. & Elgin, S. C. The HP1 protein family: getting a grip onchromatin. Curr. Opin. Genet. Dev. 10, 204–210 (2000).
61. Hill, V. K., Kim, J. S. & Waldman, T. Cohesin mutations in human cancer.Biochim. Biophys. Acta 1866, 1–11 (2016).
62. Katoh, M. & Katoh, M. Identification and characterization of human FOXK1gene in silico. Int. J. Mol. Med. 14, 127–132 (2004).
63. Wu, Y. et al. Oncogene FOXK1 enhances invasion of colorectal carcinoma byinducing epithelial-mesenchymal transition. Oncotarget 7, 51150–51162(2016).
64. Underhill, C., Qutob, M. S., Yee, S. P. & Torchia, J. A novel nuclear receptorcorepressor complex, N-CoR, contains components of the mammalian SWI/SNF complex and the corepressor KAP-1. J. Biol. Chem. 275, 40463–40470(2000).
65. Osborne, C. K. et al. Role of the estrogen receptor coactivator AIB1 (SRC-3)and HER-2/neu in tamoxifen resistance in breast cancer. J. Natl. Cancer Inst.95, 353–361 (2003).
66. Trapnell, C., Pachter, L. & Salzberg, S. L. TopHat: discovering splice junctionswith RNA-Seq. Bioinformatics 25, 1105–1111 (2009).
67. Liao, Y., Smyth, G. K. & Shi, W. The Subread aligner: fast, accurate andscalable read mapping by seed-and-vote. Nucleic Acids Res. 41, e108 (2013).
68. Love, M. I., Huber, W. & Anders, S. Moderated estimation of fold change anddispersion for RNA-seq data with DESeq2. Genome Biol. 15, 550 (2014).
69. Barrett, T. et al. NCBI GEO: archive for functional genomics data sets—update. Nucleic Acids Res. 41, D991–D995 (2013).
70. Vizcaino, J. A. et al. 2016 update of the PRIDE database and its related tools.Nucleic Acids Res. 44, 11033 (2016).
AcknowledgementsThe authors would like to thank the Genomics core, the staff in the Proteomics Coreespecially Valar Nila Roamio Franklin and Carmen Gonzalez Tejedo, the BioinformaticsCore especially Dominique Laurent Couturier and Rory Stark, the Histopathology Coreespecially Jo Arnold and Bev Wilson, the Biorepository Core and the InstrumentationCore facility at Cancer Research UK. We also would like to thank Igor Chernukhin foruploading the RNA-seq data to GEO. The authors would also like to thank Alana Welmfor sharing the PDX models and Elena Provenzano for the evaluation of the IHC
staining. We acknowledge the support of the University of Cambridge and CancerResearch UK. We also would like to acknowledge the National Breast Cancer Foundationof Australia (Grant 14001) and the Personalised Medicine for Breast Cancer Biobank,funded by the Sydney Breast Cancer Foundation, National Health and Medical ResearchCouncil (NHMRC), TransBCR Centre for research excellence in translational breastcancer research and the McMurtrie family. The Fusion Lumos Orbitrap mass spectro-meter was purchased with the support from a Wellcome Trust Multi-user EquipmentGrant (Grant # 108467/Z/15/Z). Parts of this work were funded by CRUK core grant(grant numbers C14303/A17197, A19274) to F.M.; Breast Cancer Now Award (grantnumber 2012NovPR042) to F.M. R.S. is supported by a fellowship from the NovoNordisk Foundation (NNF 14136). J.S.C. is supported by an ERC Consolidator awardand CRUK funding.
Authors ContributionsE.K.P., R.S., C.S.D.S. and J.S.C., conceptualisation; E.K.P., A.N.H., R.S. and C.S.D.S.,methodology; E.K.P., proteomic sample preparation and mass spectrometry; E.K.P., A.N.H. and R.S., RIME experiments; E.K.P., S.O. and R.S., validation assays; E.K.P. and R.S.,in vivo experiments; E.K.P., K.K., A.N.H., T.I.R., M.E., R.S. and C.S.R.C., data analysis;K.K. and M.E., development of qPLEXanalyzer; E.K.P., K.K., A.N.H., F.M., M.E., R.S.,C.S.D.S. and J.S.C., study design; K.H., K.M.C., A.S. and E.L., collection of human clinicalsamples and PDX models; R.S., C.S.D.S. and J.S.C., oversaw all experiments;E.K.P., R.S., C.S.D.S. and J.S.C., writing-original draft; All, writing–review, and editing.
Additional informationSupplementary Information accompanies this paper at https://doi.org/10.1038/s41467-018-04619-5.
Competing interests: The authors declare no competing interests.
Reprints and permission information is available online at http://www.nature.com/reprints
Publisher's note: Springer Nature remains neutral with regard to jurisdictional claims inpublished maps and institutional affiliations.
Open Access This article is licensed under a Creative CommonsAttribution 4.0 International License, which permits use, sharing,
adaptation, distribution and reproduction in any medium or format, as long as you giveappropriate credit to the original author(s) and the source, provide a link to the CreativeCommons license, and indicate if changes were made. The images or other third partymaterial in this article are included in the article’s Creative Commons license, unlessindicated otherwise in a credit line to the material. If material is not included in thearticle’s Creative Commons license and your intended use is not permitted by statutoryregulation or exceeds the permitted use, you will need to obtain permission directly fromthe copyright holder. To view a copy of this license, visit http://creativecommons.org/licenses/by/4.0/.
© The Author(s) 2018
NATURE COMMUNICATIONS | DOI: 10.1038/s41467-018-04619-5 ARTICLE
NATURE COMMUNICATIONS | (2018) 9:2311 | DOI: 10.1038/s41467-018-04619-5 |www.nature.com/naturecommunications 13