A power data driven energy-cost-aware production ... · scheduling method for sustainable...
8
A power data driven energy-cost-aware production scheduling method for sustainable manufacturing at the unit process level Xu Gong, Toon De Pessemier, Wout Joseph, Luc Martens Department of Information Technology Ghent University/iMinds Ghent, Belgium [email protected] Abstract—Nowadays, the energy price is rising. The consciousness of environmental sustainability of governments and customers has been ever increasing. Consequently, manufacturing enterprises are increasingly motivated to reduce the energy cost involved in their production activities. This paper proposes a novel production scheduling method to minimize the energy cost involved in the production at the unit process level. Compared to the emerging energy-conscious production scheduling methods, this method builds the finite state machine based energy model from power data that are measured from the shop floor. By following the formulated mixed integer linear programming model, the power states and changeovers of a unit process can be additionally scheduled, and the potential multiple process idle modes can be optimally selected between two jobs. In addition, the process power consumption behavior can be predicted along with the optimal schedule. This method was demonstrated in an extrusion blow molding process in a Belgian plastic bottle manufacturer. Compared to two conventional schedules, i.e., “as-early-as-possible” and “as-late-as-possible”, the schedule given by the proposed method is able to reduce 21% and 11% of electricity cost for completing the same production task before a due date. Keywords—production scheduling; energy modeling; optimization; sustainable manufacturing; demand response I. INTRODUCTION Currently, the expenditure on energy consumption is no longer ignored by global manufacturing enterprises, with the rising price of fossil fuels and enormous energy consumption in the manufacturing industry. Energy represents the second largest operating cost in many industries [1]. Electricity is extensively used in industry because it can easily be converted into diverse lower energy forms, e.g., light, heat, cooling, compressed air, and mechanical torque. For instance, in a typical Indian caustic-chlorine plant, the electricity cost accounts for almost 60% of the total production cost [2]. The annual electricity bill of an Australian bio-medical product manufacturer exceeds 1 million Australian dollars [3]. Besides, the electricity price is getting volatile, due to the penetration of renewable energy sources into the power grid and the increasing implementation of demand response [4] towards smart grid. This makes it increasingly difficult to have controllable expenditure on electricity consumption. By shifting production loads as many as possible to low-priced periods defined by the demand response and staying idle or even powered off during high-priced periods, factories are able to save the electricity cost, while proactively adjusting their electricity consumption behavior for the purpose of decreasing power demand during peak hours and enhancing the grid’s stability. This is able to further help reducing greenhouse gas (GHG) emissions, since a large number of thermal power plants, which produce high GHG emissions, are usually called on to meet the peak demand, instead of renewable energy, of which the supply is unstable depending on local weather. Therefore, it is of both economic and ecological (“double E”) significance for manufacturing enterprises to gain additional capacity of electricity cost control and optimization. Also, the added value of sustainability will help promote factories of the future (FoF), known as either the German Industry 4.0 or the American Industrial Internet [5]. To this end, production planning and scheduling at the management level is a promising roadmap. Production loads are automatically shifted by following the energy-cost-aware schedule which is assigned on manufacturing machines. Furthermore, through updating the software module of a manufacturing execution system (MES), the energy-cost-aware scheduling has the advantage of a low investment cost for factories, without any need for purchasing extra equipment. Based on the above philosophy, some energy-cost-aware production scheduling approaches can be found in literature [12-18]. Almost all these approaches emerged in the very recent years. They tend to have a simple assumption on the power data that should have been measured from the real machines, processed, analyzed, and input to the scheduling model. This leaves a gap between the scheduling theory and its industrial applicability. To unlock this common assumption, this paper proposes a novel power data driven electricity-cost-aware production scheduling method. Using the finite state machine (FSM), the process energy model is built from power data that are collected experimentally from the shop floor. A mixed integer linear programming (MILP) model is formulated for scheduling, including a joint consideration of jobs, process
Transcript of A power data driven energy-cost-aware production ... · scheduling method for sustainable...

A power data driven energy-cost-aware production
scheduling method for sustainable manufacturing at
the unit process level
Xu Gong, Toon De Pessemier, Wout Joseph, Luc Martens
Department of Information Technology
Ghent University/iMinds
Ghent, Belgium
Abstract—Nowadays, the energy price is rising. The
consciousness of environmental sustainability of governments
and customers has been ever increasing. Consequently,
manufacturing enterprises are increasingly motivated to reduce
the energy cost involved in their production activities. This paper
proposes a novel production scheduling method to minimize the
energy cost involved in the production at the unit process level.
Compared to the emerging energy-conscious production
scheduling methods, this method builds the finite state machine
based energy model from power data that are measured from the
shop floor. By following the formulated mixed integer linear
programming model, the power states and changeovers of a unit
process can be additionally scheduled, and the potential multiple
process idle modes can be optimally selected between two jobs. In
addition, the process power consumption behavior can be
predicted along with the optimal schedule. This method was
demonstrated in an extrusion blow molding process in a Belgian
plastic bottle manufacturer. Compared to two conventional
schedules, i.e., “as-early-as-possible” and “as-late-as-possible”,
the schedule given by the proposed method is able to reduce 21%
and 11% of electricity cost for completing the same production
task before a due date.
Keywords—production scheduling; energy modeling;
optimization; sustainable manufacturing; demand response
I. INTRODUCTION
Currently, the expenditure on energy consumption is no longer ignored by global manufacturing enterprises, with the rising price of fossil fuels and enormous energy consumption in the manufacturing industry. Energy represents the second largest operating cost in many industries [1]. Electricity is extensively used in industry because it can easily be converted into diverse lower energy forms, e.g., light, heat, cooling, compressed air, and mechanical torque. For instance, in a typical Indian caustic-chlorine plant, the electricity cost accounts for almost 60% of the total production cost [2]. The annual electricity bill of an Australian bio-medical product manufacturer exceeds 1 million Australian dollars [3].
Besides, the electricity price is getting volatile, due to the penetration of renewable energy sources into the power grid and the increasing implementation of demand response [4] towards smart grid. This makes it increasingly difficult to have
controllable expenditure on electricity consumption. By shifting production loads as many as possible to low-priced periods defined by the demand response and staying idle or even powered off during high-priced periods, factories are able to save the electricity cost, while proactively adjusting their electricity consumption behavior for the purpose of decreasing power demand during peak hours and enhancing the grid’s stability. This is able to further help reducing greenhouse gas (GHG) emissions, since a large number of thermal power plants, which produce high GHG emissions, are usually called on to meet the peak demand, instead of renewable energy, of which the supply is unstable depending on local weather. Therefore, it is of both economic and ecological (“double E”) significance for manufacturing enterprises to gain additional capacity of electricity cost control and optimization. Also, the added value of sustainability will help promote factories of the future (FoF), known as either the German Industry 4.0 or the American Industrial Internet [5].
To this end, production planning and scheduling at the management level is a promising roadmap. Production loads are automatically shifted by following the energy-cost-aware schedule which is assigned on manufacturing machines. Furthermore, through updating the software module of a manufacturing execution system (MES), the energy-cost-aware scheduling has the advantage of a low investment cost for factories, without any need for purchasing extra equipment.
Based on the above philosophy, some energy-cost-aware production scheduling approaches can be found in literature [12-18]. Almost all these approaches emerged in the very recent years. They tend to have a simple assumption on the power data that should have been measured from the real machines, processed, analyzed, and input to the scheduling model. This leaves a gap between the scheduling theory and its industrial applicability.
To unlock this common assumption, this paper proposes a novel power data driven electricity-cost-aware production scheduling method. Using the finite state machine (FSM), the process energy model is built from power data that are collected experimentally from the shop floor. A mixed integer linear programming (MILP) model is formulated for scheduling, including a joint consideration of jobs, process
changeovers, power states, and idle modes. Metaheuristic optimization techniques, like a genetic algorithm (GA), are proposed to be used for finding an optimal or suboptimal schedule. As a result, production jobs, changeovers, and process power states can all be scheduled. Electricity price peaks are effectively avoided, valleys are highly used, and an optimal process idle mode is selected for the period between two jobs.
II. LITERATURE REVIEW
The literature review was conducted over two domains, i.e.,
industrial energy monitoring and energy-cost-aware
production scheduling. The former provides onsite power data
to the latter, in order to enable the power data driven energy-
cost-aware scheduling method, proposed in this paper.
A. Industrial energy monitoring/metering
Although it is common to see a comprehensive breakdown of energy consumption for the residential and commercial sectors, the industrial energy consumption tends to be lumped together without indicating the percentage of energy consumed by each end user, e.g., space cooling, space heating, lighting, water heating, motors, and pumps [6]. Therefore, energy monitoring/metering plays a vital role in increasing the transparency of energy consumption of production machines. The revealed energy data in more details can not only stimulate concrete measures for enhancing industrial energy efficiency and energy cost effectiveness, but also enable factories to check the quality characteristics of the supplied electricity (e.g., variation in voltage magnitude and frequency). What is more, the authors in [7] point out that automated energy monitoring will enable better communication of manufacturing system demand data to the grid, facilitating a faster implementation of smart grid technologies (e.g., demand response) in factories.
Energy monitoring/metering in factories can have three hierarchal levels: (1) factory, (2) process chain, and (3) unit process [3, 8]. On the factory level, the meter is placed on or near the interface between the electricity supplier and the factory inlet. It is the conventional method to enable electricity billing of the entire factory. On the department level, energy consumption is revealed within a sub-structure, which can be an organizational structure (department), a production line for a specific product, or a storage area. On the unit process level, meters are attached to machines or machine components (e.g., hydraulic systems, ventilation systems, and auxiliary pumps). Consequently, the most energy consumption details can be obtained. This level of details is normally required for energy optimized production planning.
Some energy monitoring systems can be found in literature. A real-time energy management framework is introduced in [9]. Its prototype was implemented in a machining line compromising of 13 multi-operation machines in a major European automotive manufacturer. Average energy used during machine idling was revealed to take up 23% of annual energy consumption. Machine operators are authorized to shut down machines if they think the machine capacity will not be needed for a significant period of time. However, there is no tool to help them make optimal powering-on/off decisions.
An online energy efficiency monitoring system was developed in [10]. It uses a low-cost power sensor to monitor the machine tool’s cutting power in real time besides the energy consumed by an entire machine. As a result, energy efficiency and its related parameters of machine tools, e.g., ready-for-operation time and idle time, can be captured and presented.
What is more, with the emerging development of Internet-of-Things (IoT) technologies (e.g., smart meters and sensors), wireless devices such as RFID and wireless sensor networks are utilized to gather real-time data from the shop floor. Besides energy consumption, the data that can be wirelessly collected are illustrated as machine status, inventory levels, and shipment progress [11]. With regard to industrial energy monitoring, the heterogeneous data are of practical importance to associate energy data in context with production activities.
B. Energy-cost-aware production scheduling
A mixed integer programming (MIP) model for flexible flow shops is formulated in [12] to minimize the peak power required by the entire shop floor. Based on the schedule which is output by the advanced production planning and scheduling (APS) system, it further modifies the start time of all the tasks without resequencing the jobs and the associated machine operations. Consequently, the involved energy cost is implicitly reduced due to the reduction of peak power consumption. A single-machine scheduling model is proposed in [13] to minimize the electricity cost for job processing under volatile electricity price. However, this model cannot assign job sequence, either. A lack of job sequencing function limits the potential of decreasing energy cost through energy-cost-aware production scheduling.
Further research progress can be found in literature to break the limitation on job sequencing. Electricity cost and makespan are jointly minimized by a hybrid flow shop scheduling approach in [14]. The solution is encoded as a permutation of jobs. A list schedule algorithm is used to construct the sequence by artificial ants and generate a complete schedule. Assumed power values for machine job processing and standby mode are involved in the optimization. In [15], multiple speeds are investigated for job processing. A higher speed is assumed to have higher electricity consumption. A weighted sum of energy consumption and total job tardiness is minimized through job sequencing and selecting an appropriate processing speed for each job.
Furthermore, investigation on optimally determining machine idle and off states between jobs can even unlock more potential for energy cost saving via scheduling. An unrelated parallel machine scheduling problem is investigated in [16]. Idling and setup are explicitly defined as machine states, which require to be assigned. A fixed power is assumed for powering off a machine and powering it on later. Energy consumption and total tardiness are jointly minimized. An energy-aware flexible flow shop scheduling model is formulated in [17] to determine whether machine tools should be powered off when staying idle for a certain amount of time. The optimization objective is an optimal tradeoff between energy consumption and makespan. Energy cost is implicitly decreased by energy
1. Energy
monitoring/metering
2. Energy data
integration
3. Energy profile
identification
4. Energy modeling5. Formulation of
scheduling model6. Optimization
Fig. 1. Method of data-driven energy-cost-aware production scheduling
for a unit process
consumption reduction. To further deal with the stochastic events on the shop floor, a rescheduling heuristic is proposed in [18], which keeps the energy-cost-effectiveness of a production schedule upon the occurrence of stochasticity.
Nonetheless, little relevant literature has performed investigation on linking real power data to the scheduling model, which has also been pinpointed by recent literature on industrial energy monitoring [3, 9-11, 19, 20]. Instead, power data are usually assumed with a limited set of machine energy consumption states which are also presumed. Power data play a fundamental role in the whole energy-cost-aware scheduling approach, since the energy consumption and energy cost calculation are all based on them. A lack of power data leads to unknown or incomplete machine energy consumption behavior (e.g., powering on/off and idling), unprecise or even incorrect calculation, and eventually the inefficiency of scheduling. Overall, the ignorance of real power consumption in the scheduling model restricts the applicability of the energy-cost-aware production scheduling approaches.
III. METHOD
The method of power data driven energy-cost-aware production scheduling for a unit process is introduced in this section. In order to fill the gap analyzed in the previous section, it discusses how to couple measured power data to a scheduling model, besides its capability to work with general volatile electricity price structures, to sequence jobs on a single machine, and to assign a specific energy saving mode (i.e., machine idling) for a machine along the production horizon.
A. Overview
The proposed method is presented in Fig. 1. It is composed of 6 sequential steps. In the first step, energy consumption of a unit process/machine is directly measured on the shop floor. This measurement can be either short term, midterm, or long term. A short-term measurement enables a fast reveal of the machine’s energy consumption behavior from several hours up to one day. Usually one type of product/part is processed during this short term. The midterm measurement is conducted from several days to several months. A long-term measurement, i.e., permanent onsite monitoring, facilitates a complete understanding of the machine’s energy consumption along with diverse types of products/parts flowing through the machine. However, a long-term measurement is more expensive from the economic perspective, since energy monitoring facilities (e.g., power meters and sensors) must be purchased, installed, and maintained.
In the second step (see Fig. 1), so as to enable centralized data management in the pyramid plant organization structure, the collected energy data are advised to be integrated into common industrial IT systems, e.g., MES, ERP, APS, and manufacturing resource planning (MRP II). Various data formats can be used for the integration, e.g., XML, CSV (comma-separated values), and JSON (Java script object notation). Besides, MTConnectSM is emerging as a more structured XML-based format for unified communication among sensors, equipment, and other hardware in manufacturing via standardized interface [21].
In the third step (see Fig. 1), a complete process power profile is identified from the measured power data. A power profile can be characterized by a set of power states. Each state has its power consumption and retention time. This can be illustrated as the power profile of a 4kW CO2 laser cutting machine tool [22], which encompasses power states of machine tool startup, laser source startup, production ready, cutting at 3 different power levels, and machine tool shutdown. The power states of a process can be extracted from the collected power data, or identified by clarifying the machine’s operational states which can be got from the machine’s specification or from the machine’s controller (e.g., a programmable logic controller or PLC). Once all the power states are identified, the power and retention time of each state can be statistically obtained based on the collected power data. For instance, the power of each state can be averaged from all the corresponding power samples. Besides, the time study and power study of the in-depth approach, which is proposed in [23], serve as a systematic way to identify a complete power profile. In general, a machine should be operated such that all the power states can be involved during the measurement for ensuring a complete power profile identification.
In the fourth step (see Fig. 1), the identified machine power profile is joint with a state-based energy consumption model. Rationalized transitions are established between these states by case study. A general state-based energy consumption model of a unit process can be found in our former work [22], which includes common states like off, startup, ready (for production), production, standby, and shutdown. This general model was further applied to a surface grinding process and implemented by FSM, which includes within the production state more specific sub-states for this process, i.e., grinding and dressing [22]. The energy consumption behavior of machine changeover and maintenance can be potentially mapped with states defined in the model. For instance, in an extrusion blow molding (EBM) process, the power consumption of a changeover can be modeled by one of the ProheatIdle and PreheatIdle states (see Sect. IV-B). The calculation of energy consumption of a process can be then performed by accumulating the power along with the time-indexed retention and transition of power states.
In the fifth step (see Fig. 1), a MILP model is formulated for the energy consumption model based energy-cost-aware production scheduling. This mathematical formulation will be presented in Sect. III-B. In the sixth step, one of the metaheuristics for optimization, e.g., GA, ant-colony optimization algorithm, and particle swarm optimization algorithm, is implemented by adapting to the MILP model. This is common in literature, because scheduling is
increasingly considered as an optimization problem, and these emerging metaheuristics tend to find optimal or near-optimal solutions within a reasonable time span.
B. Scheduling model
The proposed MILP formulation assigns job sequence and start time, as well as power states to a unit manufacturing process that performs machining operations on products under a volatile electricity price, and selects an optimal idle mode, in order to minimize the involved electricity cost. A changeover exists when the process shifts from one product type to another, which takes time and consumes electricity. Products of the same type are grouped into one job. Two adjacent jobs contain different types of products. The same job due date is set. There is no interdependence among jobs.
The model notation is presented in Table I. The formulated model is an enhanced version based on the one in [24]. The electricity cost of changeovers has been additionally considered. Next to this, optimal selection among multiple machine idle states between jobs has been included for optimization. These enhancements enable the scheduling model to have an extensible integration with a variety of measured/monitored power data of a unit process.
The objective function is described in (1). It assigns the job sequence and job start time, and selects machine idle states between jobs along the time-varied electricity price, such that the involved electricity cost is minimal. The total electricity cost comprises the cost of job processing, the cost of changeovers, and the cost of machine idling between two adjacent jobs. The methods for calculating the three cost parts are described in (2), (3), and (4), respectively. The production state is involved in job processing in (2). The set of sequential states involved in a changeover is considered in (3). In (4), the sets of states for switching to, staying at, and recovering from a standby mode or from the off mode are taken into account. The case where there is no idle period between two jobs is also included, which of course has zero electricity cost. Herein, a standby mode enables a process to keep its power consumption at a level lower than that of production and higher than zero during any given period. An idle mode includes the possibility to stay in a standby mode and to be totally powered off.
In (5) and (6), the current time is mapped to the corresponding electricity pricing time slot. For multiple standby mode, it is constrained in (7) that there must be one and only one idle mode (including the case of no idle duration) between two specific adjacent jobs. As described by (8) and (9), a selection of one idle mode must ensure that there is sufficient accommodating time between the end of the current changeover and the start of the next job.
1
, 1 1min
J JN N
s t i i ii iCJ CC CI
(1)
Subject to:
i i
i i
ETSJ ETJ t
i ts ts pts STSJ t STJCJ EP P t
(2)
i i
i i C
ETSC ETC t
i ts ts sts STSC t STC s SCC EP P t
(3)
TABLE I. MODEL NOTATION
Constant
D Time duration of the electricity pricing slot
sD Time duration of state s
iDC Duration of the ith scheduled changeover
i
jDJ Processing duration for the job with ID j at the ith
scheduling position
DT Due date of all jobs
I Set of job scheduling position {1, 2, …, JN }
J Set of job ID {1, 2, …, JN }
JN Total number of jobs to be scheduled
SN Total number of standby modes of a machine
sP Power of the machine power state s S
S Set of all power states of a machine
CS Set of power states involved in a machine changeover
IS Set of idle modes (standby modes, off, and none)
OS Set of power states involved in switching to, staying at, and recovering from powered-off between jobs
t Basic time step for scheduling
Variable
iCC Electricity cost of the ith scheduled machine changeover
iCI Electricity cost of the ith scheduled machine idling
iCJ Electricity cost of the ith scheduled job processing
tsEP Electricity price on the tsth time slot
iETC End time of the ith scheduled changeover
iETJ End time of the ith scheduled job
iETSC End time in slots of the ith scheduled changeover
iETSJ End time in slots of the ith scheduled job
t
sP Power of the machine power state s at time t (It equals to
sP when the power state at t is s; otherwise zero)
t
pP Power of the machine power state ‘Production’ at time t (It
equals to the power of ‘Production’ when the state at t is
‘Production’; otherwise zero)
iS Set of power states involved in switching to, staying at, and
recovering from the i th idle mode of a machine
i The ith scheduled job position
j Job ID
t Time in t
i Machine idle mode indicator (with a single value instead of
a vector) for following the ith scheduled job
ts Time slot indicator
1 1
1 1
, 1,2, ,
, 1
0, 2
i i
i i i
i i
i i o
STSJ STJ t
i ts ts s i Sts ETSC t ETC s S
STSJ STJ t
ts ts s i Sts ETSC t ETC s S
i S
CI EP P t N
EP P t N
N
(4)
1, [ , ( 1) )
0,ts
if t ts D ts D
otherwise
(5)
/ , , - ,, ss sts t T t T T t DT t DTD (6)
! , , , , :i S S i1 2 N 1 N 2 (7)
Off
Startup
Idle
Preheat
PreheatIdle
Proheat
ProheatIdle
Production
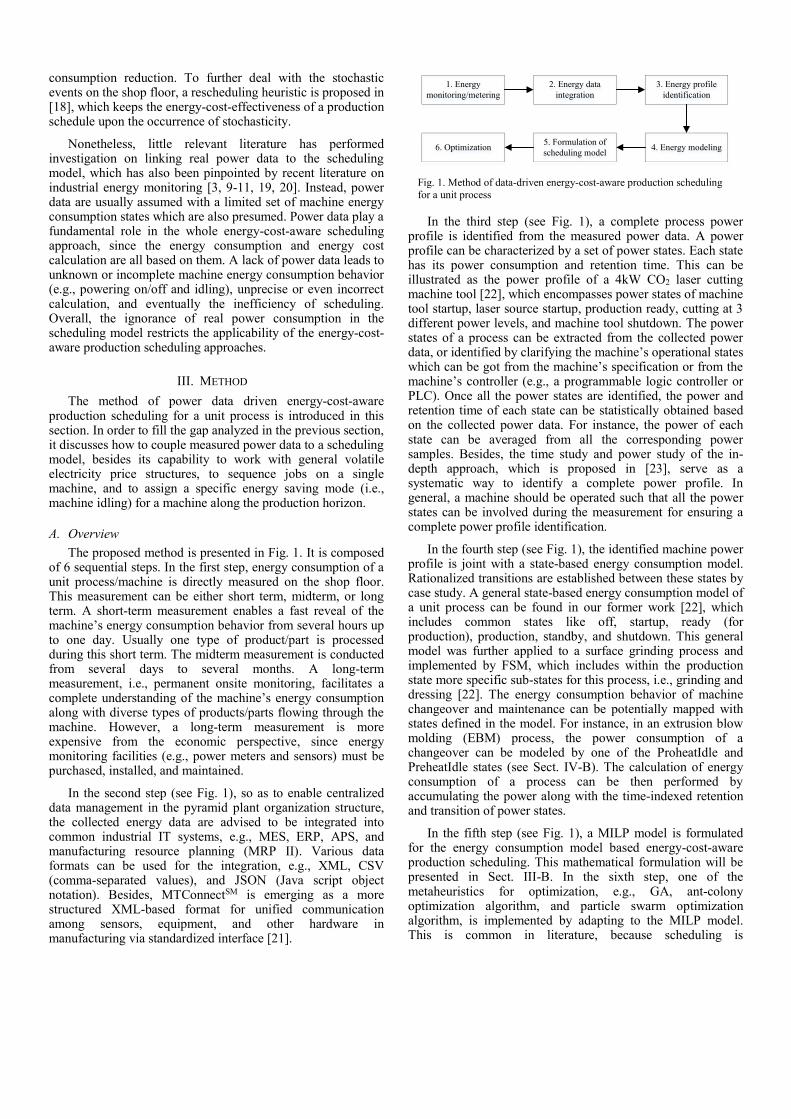
Fig. 2. Power profile identification of the extrusion blow molding process (power-time subfigures from the top to the bottom: main or general power supply of this process, hydraulic system, and extruder)
, , , :i
i S s i 1 is S1 2 N D STJ ETC
(8)
,O
s i 1 i i Ss SD STJ ETC if N 1
(9)
1
1 1 ,jETJ STJ TSU DJ j J (10)
, 2,3, , 1 ,i
i i j JETJ STJ DJ i N j J (11)
,J
J J
N
N N jETJ STJ DJ TSD j J (12)
, 1,2 , 1i i i JETC STC DC i N (13)
, 1,2, , 1i i JETJ STC i N (14)
,i iSTJ ETJ i I (15)
1, 1,2, , 1i i JETC STJ i N (16)
! : ,i I i j j J (17)
, , , , ,t t
s s s s ss SP P P t T T t DT t DT
(18)
0,s
J
T
s NP ETJ TSD DT (19)
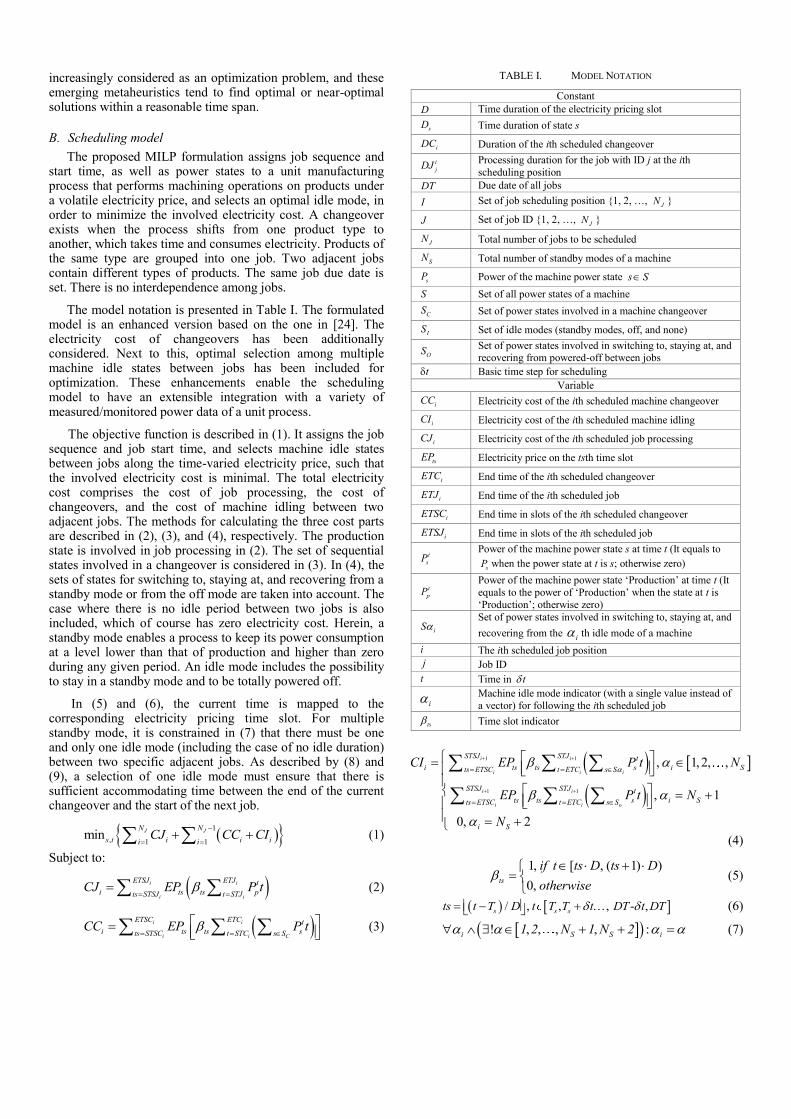
As defined in (10), the end time of the job in the first scheduled position should consider the start time of this job, the duration for powering up the machine to get ready for production, and the job production duration. For jobs scheduled in the middle positions (i.e., all positions except the first and last ones) in (11), the start time and production duration of the job are taken into account. For the job scheduled in the last position in (12), its end time should consider the start time, production duration, and the duration for powering off from production state. For a changeover, its end time is its start time plus its duration, and it must be conducted just following the end of the current job, as defined in (13) and (14), respectively.
Only one job is executed at one time without preemption, as constrained in (15) and (16). All jobs should be scheduled to a unique position, as described in (17). The machine is defined by (18) to have only one state at a time point with constant power consumption. As limited in (19), before starting to process the job in the first scheduling position, the machine is powered off; and the machine is switched to off after completing all the jobs and before the due date.
IV. CASE STUDY
A case study was performed in a plastic bottle manufacturing plant at Flanders, Belgium. One of the 17 EBM processes is going to be extensively investigated for demonstrating the proposed method.
A. Energy monitoring, data integration, and profiling
Through a site survey, the continuous EBM process under investigation was found to comprise of three major electricity consumers, i.e., main system, hydraulic system, and extruder. Fig. 2 presents the whole process. The main system demands
general power supply for the process. This general demand steers a series of energy-intensive operations, e.g., mixing, cutting, grinding, and pushing the input materials (raw plastic granules, color granules, and recycled plastic chips), heating, and melting. The hydraulic system consumes electricity to provision major mechanical movements of the process, e.g., clamping and closing the mold, cutting the parison, moving extruder continuously pushes the melt plastic through a die.
Consequently, three Siemens PAC 3200 power monitors were installed on the three major consumers, respectively. The instantaneous effective power was captured every 30 sec, and stamped with time and other essential information, e.g., power unit, sensor name, and product name. The raw data were in ASCII format, communicated throughout Modbus protocol, and captured by a cabinet with PLC as the data collector. The data collector was connected with a PC via Ethernet, in order to enable data management and visualization. A midterm power measurement campaign was carried out during about one year. A variety of plastic bottles were produced during this measurement period.
Eight power consumption states were identified, jointly by an onsite survey, communication with the machine operator, study on the literature about the EBM process, and investigation on the collected data. They are enumerated as Off, Startup, Idle, Preheat, PreheatIdle, Proheat, ProheatIdle, and Production, as shown in Fig. 2.
More specifically, when it is turned on by an operator, the EBM machine goes through Startup and stays at Idle, followed by Preheat (see Fig. 2) which is also initiated by the operator. The plastic is heated in the barrel until a temperature of 140 °C is reached. The machine will then stay at PreheatIdle and hold the temperature until the operator starts Proheat. Afterwards, the temperature of the plastic will rise to a higher level between 140 °C and 200 °C, depending on the type of bottles to be produced. When the higher temperature is achieved, the machine will stay at ProheatIdle. If the retention time of ProheatIdle surpasses 30 minutes, additional cooling should be activated to avoid a further temperature increment. Once a production command is given, the machine will transition to Production state for producing the scheduled plastic bottles.
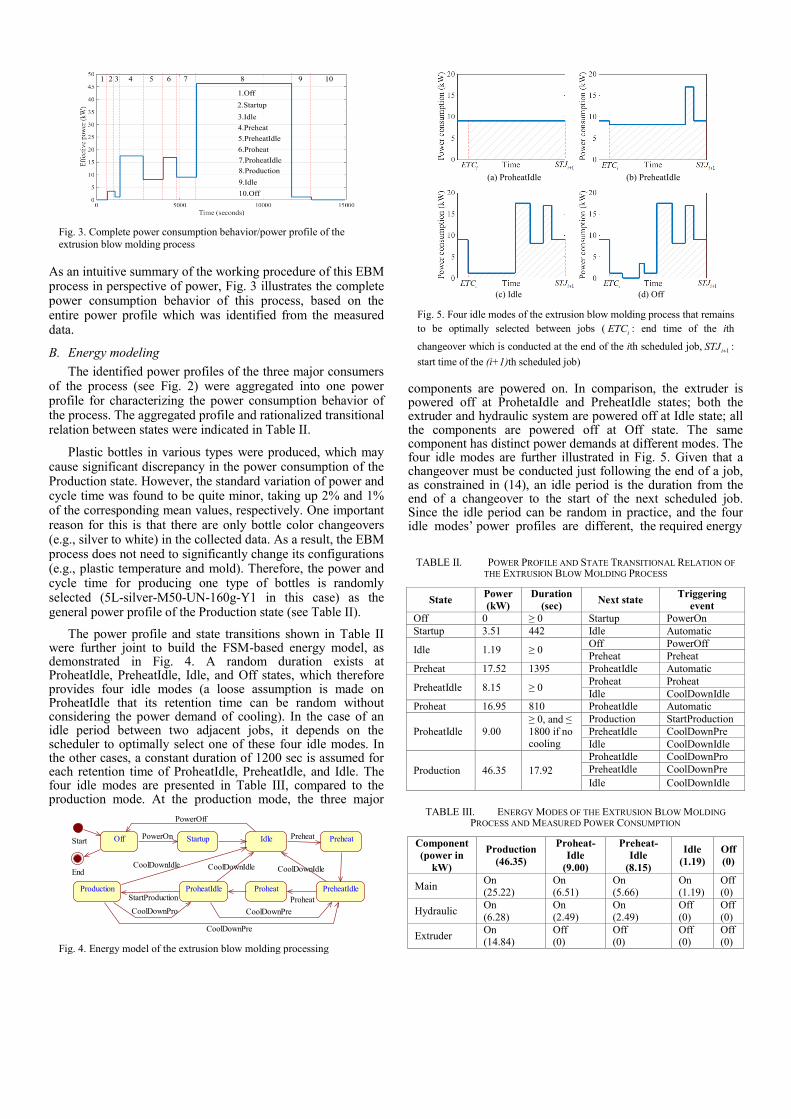
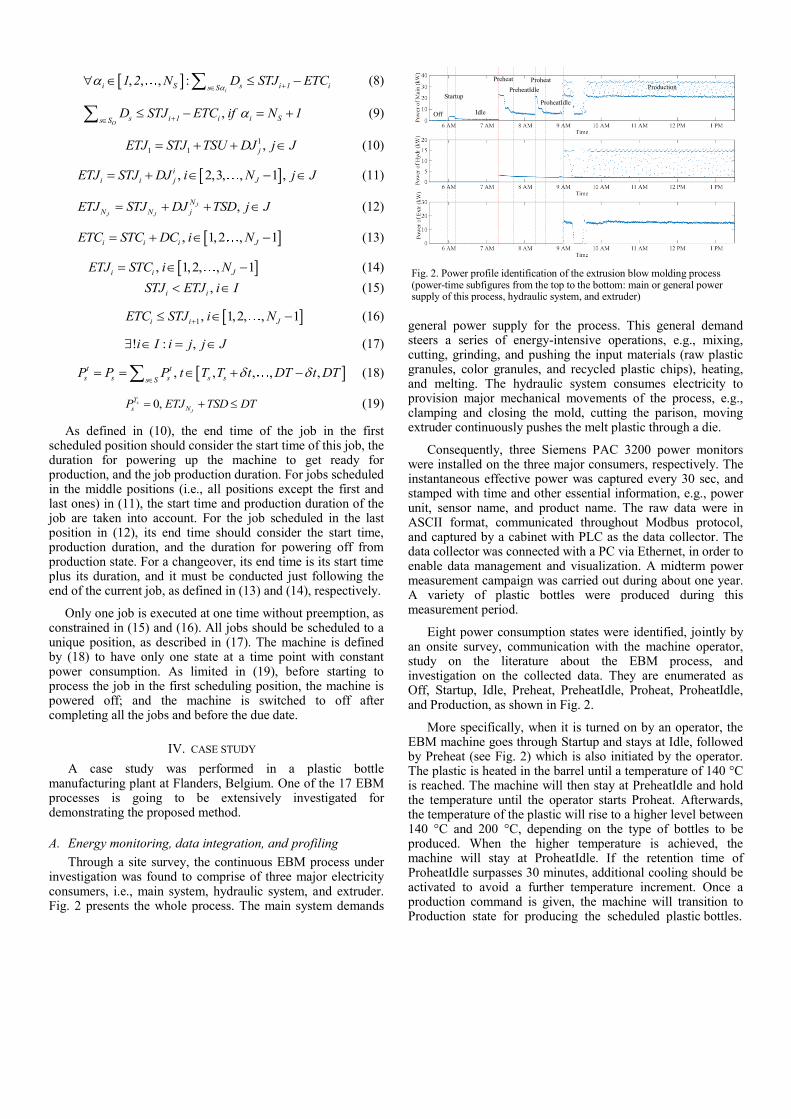
(a) ProheatIdle (b) PreheatIdle
(c) Idle (d) Off
Fig. 5. Four idle modes of the extrusion blow molding process that remains
to be optimally selected between jobs (iETC : end time of the ith
changeover which is conducted at the end of the ith scheduled job,1iSTJ :
start time of the (i+1)th scheduled job)
1.Off
2.Startup
3.Idle
4.Preheat
5.PreheatIdle
6.Proheat
7.ProheatIdle
8.Production
9.Idle
10.Off
1 2 3 4 5 6 7 8 9 10
Fig. 3. Complete power consumption behavior/power profile of the
extrusion blow molding process
Off
End
Start Idle Preheat
PreheatIdleProheatProheatIdleProduction
StartupPowerOn Preheat
Proheat StartProduction
CoolDownPro
CoolDownIdle
PowerOff
CoolDownPre
CoolDownIdle
CoolDownPre
CoolDownIdle
Fig. 4. Energy model of the extrusion blow molding processing
As an intuitive summary of the working procedure of this EBM process in perspective of power, Fig. 3 illustrates the complete power consumption behavior of this process, based on the entire power profile which was identified from the measured data.
B. Energy modeling
The identified power profiles of the three major consumers of the process (see Fig. 2) were aggregated into one power profile for characterizing the power consumption behavior of the process. The aggregated profile and rationalized transitional relation between states were indicated in Table II.
Plastic bottles in various types were produced, which may cause significant discrepancy in the power consumption of the Production state. However, the standard variation of power and cycle time was found to be quite minor, taking up 2% and 1% of the corresponding mean values, respectively. One important reason for this is that there are only bottle color changeovers (e.g., silver to white) in the collected data. As a result, the EBM process does not need to significantly change its configurations (e.g., plastic temperature and mold). Therefore, the power and cycle time for producing one type of bottles is randomly selected (5L-silver-M50-UN-160g-Y1 in this case) as the general power profile of the Production state (see Table II).
The power profile and state transitions shown in Table II were further joint to build the FSM-based energy model, as demonstrated in Fig. 4. A random duration exists at ProheatIdle, PreheatIdle, Idle, and Off states, which therefore provides four idle modes (a loose assumption is made on ProheatIdle that its retention time can be random without considering the power demand of cooling). In the case of an idle period between two adjacent jobs, it depends on the scheduler to optimally select one of these four idle modes. In the other cases, a constant duration of 1200 sec is assumed for each retention time of ProheatIdle, PreheatIdle, and Idle. The four idle modes are presented in Table III, compared to the production mode. At the production mode, the three major
components are powered on. In comparison, the extruder is powered off at ProhetaIdle and PreheatIdle states; both the extruder and hydraulic system are powered off at Idle state; all the components are powered off at Off state. The same component has distinct power demands at different modes. The four idle modes are further illustrated in Fig. 5. Given that a changeover must be conducted just following the end of a job, as constrained in (14), an idle period is the duration from the end of a changeover to the start of the next scheduled job. Since the idle period can be random in practice, and the four idle modes’ power profiles are different, the required energy
TABLE II. POWER PROFILE AND STATE TRANSITIONAL RELATION OF
THE EXTRUSION BLOW MOLDING PROCESS
State Power
(kW)
Duration
(sec) Next state
Triggering
event
Off 0 ≥ 0 Startup PowerOn
Startup 3.51 442 Idle Automatic
Idle 1.19 ≥ 0 Off PowerOff
Preheat Preheat
Preheat 17.52 1395 ProheatIdle Automatic
PreheatIdle 8.15 ≥ 0 Proheat Proheat
Idle CoolDownIdle
Proheat 16.95 810 ProheatIdle Automatic
ProheatIdle 9.00
≥ 0, and ≤
1800 if no cooling
Production StartProduction
PreheatIdle CoolDownPre
Idle CoolDownIdle
Production 46.35 17.92
ProheatIdle CoolDownPro
PreheatIdle CoolDownPre
Idle CoolDownIdle
TABLE III. ENERGY MODES OF THE EXTRUSION BLOW MOLDING
PROCESS AND MEASURED POWER CONSUMPTION
Component
(power in
kW)
Production
(46.35)
Proheat-
Idle
(9.00)
Preheat-
Idle
(8.15)
Idle
(1.19)
Off
(0)
Main On (25.22)
On (6.51)
On (5.66)
On (1.19)
Off (0)
Hydraulic On
(6.28)
On
(2.49)
On
(2.49)
Off
(0)
Off
(0)
Extruder On (14.84)
Off (0)
Off (0)
Off (0)
Off (0)
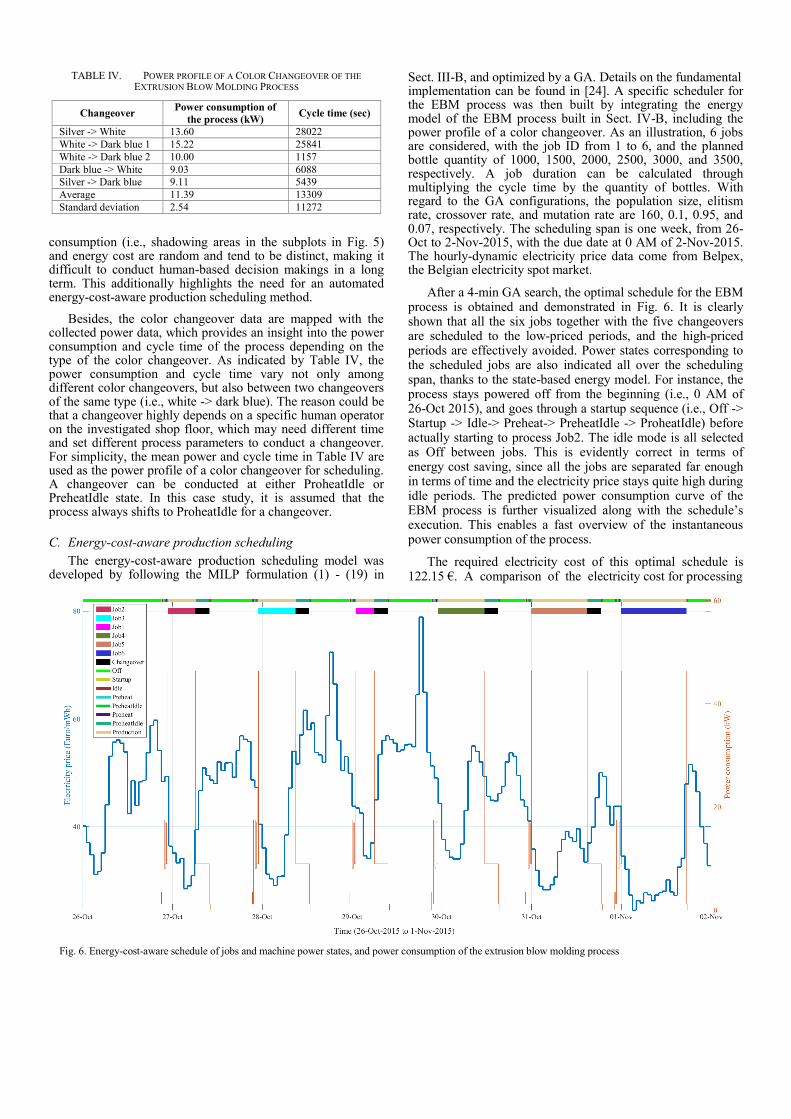
Fig. 6. Energy-cost-aware schedule of jobs and machine power states, and power consumption of the extrusion blow molding process
TABLE IV. POWER PROFILE OF A COLOR CHANGEOVER OF THE
EXTRUSION BLOW MOLDING PROCESS
Changeover Power consumption of
the process (kW) Cycle time (sec)
Silver -> White 13.60 28022
White -> Dark blue 1 15.22 25841
White -> Dark blue 2 10.00 1157
Dark blue -> White 9.03 6088
Silver -> Dark blue 9.11 5439
Average 11.39 13309
Standard deviation 2.54 11272
consumption (i.e., shadowing areas in the subplots in Fig. 5) and energy cost are random and tend to be distinct, making it difficult to conduct human-based decision makings in a long term. This additionally highlights the need for an automated energy-cost-aware production scheduling method.
Besides, the color changeover data are mapped with the collected power data, which provides an insight into the power consumption and cycle time of the process depending on the type of the color changeover. As indicated by Table IV, the power consumption and cycle time vary not only among different color changeovers, but also between two changeovers of the same type (i.e., white -> dark blue). The reason could be that a changeover highly depends on a specific human operator on the investigated shop floor, which may need different time and set different process parameters to conduct a changeover. For simplicity, the mean power and cycle time in Table IV are used as the power profile of a color changeover for scheduling. A changeover can be conducted at either ProheatIdle or PreheatIdle state. In this case study, it is assumed that the process always shifts to ProheatIdle for a changeover.
C. Energy-cost-aware production scheduling
The energy-cost-aware production scheduling model was developed by following the MILP formulation (1) - (19) in
Sect. III-B, and optimized by a GA. Details on the fundamental implementation can be found in [24]. A specific scheduler for the EBM process was then built by integrating the energy model of the EBM process built in Sect. IV-B, including the power profile of a color changeover. As an illustration, 6 jobs are considered, with the job ID from 1 to 6, and the planned bottle quantity of 1000, 1500, 2000, 2500, 3000, and 3500, respectively. A job duration can be calculated through multiplying the cycle time by the quantity of bottles. With regard to the GA configurations, the population size, elitism rate, crossover rate, and mutation rate are 160, 0.1, 0.95, and 0.07, respectively. The scheduling span is one week, from 26-Oct to 2-Nov-2015, with the due date at 0 AM of 2-Nov-2015. The hourly-dynamic electricity price data come from Belpex, the Belgian electricity spot market.
After a 4-min GA search, the optimal schedule for the EBM process is obtained and demonstrated in Fig. 6. It is clearly shown that all the six jobs together with the five changeovers are scheduled to the low-priced periods, and the high-priced periods are effectively avoided. Power states corresponding to the scheduled jobs are also indicated all over the scheduling span, thanks to the state-based energy model. For instance, the process stays powered off from the beginning (i.e., 0 AM of 26-Oct 2015), and goes through a startup sequence (i.e., Off -> Startup -> Idle-> Preheat-> PreheatIdle -> ProheatIdle) before actually starting to process Job2. The idle mode is all selected as Off between jobs. This is evidently correct in terms of energy cost saving, since all the jobs are separated far enough in terms of time and the electricity price stays quite high during idle periods. The predicted power consumption curve of the EBM process is further visualized along with the schedule’s execution. This enables a fast overview of the instantaneous power consumption of the process.
The required electricity cost of this optimal schedule is 122.15 €. A comparison of the electricity cost for processing
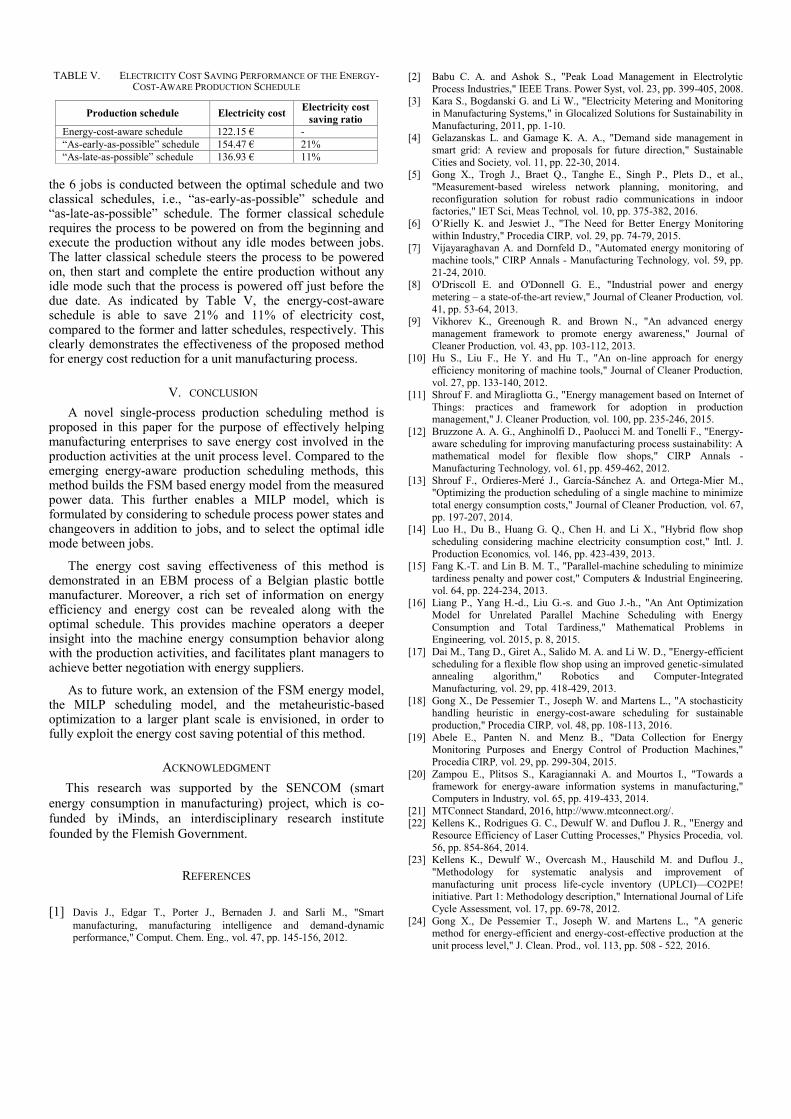
TABLE V. ELECTRICITY COST SAVING PERFORMANCE OF THE ENERGY-COST-AWARE PRODUCTION SCHEDULE
Production schedule Electricity cost Electricity cost
saving ratio
Energy-cost-aware schedule 122.15 € -
“As-early-as-possible” schedule 154.47 € 21%
“As-late-as-possible” schedule 136.93 € 11%
the 6 jobs is conducted between the optimal schedule and two classical schedules, i.e., “as-early-as-possible” schedule and “as-late-as-possible” schedule. The former classical schedule requires the process to be powered on from the beginning and execute the production without any idle modes between jobs. The latter classical schedule steers the process to be powered on, then start and complete the entire production without any idle mode such that the process is powered off just before the due date. As indicated by Table V, the energy-cost-aware schedule is able to save 21% and 11% of electricity cost, compared to the former and latter schedules, respectively. This clearly demonstrates the effectiveness of the proposed method for energy cost reduction for a unit manufacturing process.
V. CONCLUSION
A novel single-process production scheduling method is proposed in this paper for the purpose of effectively helping manufacturing enterprises to save energy cost involved in the production activities at the unit process level. Compared to the emerging energy-aware production scheduling methods, this method builds the FSM based energy model from the measured power data. This further enables a MILP model, which is formulated by considering to schedule process power states and changeovers in addition to jobs, and to select the optimal idle mode between jobs.
The energy cost saving effectiveness of this method is demonstrated in an EBM process of a Belgian plastic bottle manufacturer. Moreover, a rich set of information on energy efficiency and energy cost can be revealed along with the optimal schedule. This provides machine operators a deeper insight into the machine energy consumption behavior along with the production activities, and facilitates plant managers to achieve better negotiation with energy suppliers.
As to future work, an extension of the FSM energy model, the MILP scheduling model, and the metaheuristic-based optimization to a larger plant scale is envisioned, in order to fully exploit the energy cost saving potential of this method.
ACKNOWLEDGMENT
This research was supported by the SENCOM (smart
energy consumption in manufacturing) project, which is co-
funded by iMinds, an interdisciplinary research institute
founded by the Flemish Government.
REFERENCES
[1] Davis J., Edgar T., Porter J., Bernaden J. and Sarli M., "Smart
manufacturing, manufacturing intelligence and demand-dynamic performance," Comput. Chem. Eng., vol. 47, pp. 145-156, 2012.
[2] Babu C. A. and Ashok S., "Peak Load Management in Electrolytic
Process Industries," IEEE Trans. Power Syst, vol. 23, pp. 399-405, 2008. [3] Kara S., Bogdanski G. and Li W., "Electricity Metering and Monitoring
in Manufacturing Systems," in Glocalized Solutions for Sustainability in
Manufacturing, 2011, pp. 1-10. [4] Gelazanskas L. and Gamage K. A. A., "Demand side management in
smart grid: A review and proposals for future direction," Sustainable
Cities and Society, vol. 11, pp. 22-30, 2014. [5] Gong X., Trogh J., Braet Q., Tanghe E., Singh P., Plets D., et al.,
"Measurement-based wireless network planning, monitoring, and
reconfiguration solution for robust radio communications in indoor factories," IET Sci, Meas Technol, vol. 10, pp. 375-382, 2016.
[6] O’Rielly K. and Jeswiet J., "The Need for Better Energy Monitoring
within Industry," Procedia CIRP, vol. 29, pp. 74-79, 2015. [7] Vijayaraghavan A. and Dornfeld D., "Automated energy monitoring of
machine tools," CIRP Annals - Manufacturing Technology, vol. 59, pp.
21-24, 2010. [8] O'Driscoll E. and O'Donnell G. E., "Industrial power and energy
metering – a state-of-the-art review," Journal of Cleaner Production, vol.
41, pp. 53-64, 2013. [9] Vikhorev K., Greenough R. and Brown N., "An advanced energy
management framework to promote energy awareness," Journal of
Cleaner Production, vol. 43, pp. 103-112, 2013. [10] Hu S., Liu F., He Y. and Hu T., "An on-line approach for energy
efficiency monitoring of machine tools," Journal of Cleaner Production,
vol. 27, pp. 133-140, 2012. [11] Shrouf F. and Miragliotta G., "Energy management based on Internet of
Things: practices and framework for adoption in production management," J. Cleaner Production, vol. 100, pp. 235-246, 2015.
[12] Bruzzone A. A. G., Anghinolfi D., Paolucci M. and Tonelli F., "Energy-
aware scheduling for improving manufacturing process sustainability: A mathematical model for flexible flow shops," CIRP Annals -
Manufacturing Technology, vol. 61, pp. 459-462, 2012.
[13] Shrouf F., Ordieres-Meré J., García-Sánchez A. and Ortega-Mier M., "Optimizing the production scheduling of a single machine to minimize
total energy consumption costs," Journal of Cleaner Production, vol. 67,
pp. 197-207, 2014. [14] Luo H., Du B., Huang G. Q., Chen H. and Li X., "Hybrid flow shop
scheduling considering machine electricity consumption cost," Intl. J.
Production Economics, vol. 146, pp. 423-439, 2013. [15] Fang K.-T. and Lin B. M. T., "Parallel-machine scheduling to minimize
tardiness penalty and power cost," Computers & Industrial Engineering,
vol. 64, pp. 224-234, 2013. [16] Liang P., Yang H.-d., Liu G.-s. and Guo J.-h., "An Ant Optimization
Model for Unrelated Parallel Machine Scheduling with Energy
Consumption and Total Tardiness," Mathematical Problems in Engineering, vol. 2015, p. 8, 2015.
[17] Dai M., Tang D., Giret A., Salido M. A. and Li W. D., "Energy-efficient
scheduling for a flexible flow shop using an improved genetic-simulated annealing algorithm," Robotics and Computer-Integrated
Manufacturing, vol. 29, pp. 418-429, 2013.
[18] Gong X., De Pessemier T., Joseph W. and Martens L., "A stochasticity handling heuristic in energy-cost-aware scheduling for sustainable
production," Procedia CIRP, vol. 48, pp. 108-113, 2016.
[19] Abele E., Panten N. and Menz B., "Data Collection for Energy Monitoring Purposes and Energy Control of Production Machines,"
Procedia CIRP, vol. 29, pp. 299-304, 2015.
[20] Zampou E., Plitsos S., Karagiannaki A. and Mourtos I., "Towards a framework for energy-aware information systems in manufacturing,"
Computers in Industry, vol. 65, pp. 419-433, 2014.
[21] MTConnect Standard, 2016, http://www.mtconnect.org/. [22] Kellens K., Rodrigues G. C., Dewulf W. and Duflou J. R., "Energy and
Resource Efficiency of Laser Cutting Processes," Physics Procedia, vol.
56, pp. 854-864, 2014. [23] Kellens K., Dewulf W., Overcash M., Hauschild M. and Duflou J.,
"Methodology for systematic analysis and improvement of
manufacturing unit process life-cycle inventory (UPLCI)—CO2PE! initiative. Part 1: Methodology description," International Journal of Life
Cycle Assessment, vol. 17, pp. 69-78, 2012.
[24] Gong X., De Pessemier T., Joseph W. and Martens L., "A generic method for energy-efficient and energy-cost-effective production at the
unit process level," J. Clean. Prod., vol. 113, pp. 508 - 522, 2016.