A Perpetual Harvest Greenhouse System: Integrating Barn, Biofilter
24
K. Mahmood, D.D. Mann, Q. Zhang, and A. Brule-Babel. “Perpetual Harvest Greenhouse System: Integrating Barn, Biofilter, and Greenhouse”. Agricultural Engineering International: The CIGR EJournal. Manuscript ERG 1310. Vol XI. August, 2009. 1 A Perpetual Harvest Greenhouse System: Integrating Barn, Biofilter and Greenhouse K. Mahmood 1 , D.D. Mann 1 , Q. Zhang 1 & A. Brule-Babel 2 1 University of Manitoba, Department of Biosystems Engineering, E2-376 EITC, Winnipeg, MB R3T 5V6, Canada. Tel: (204) 474-7149; Fax: (204) 474-7512; Email: [email protected] 2 University of Manitoba, Department of Plant Science, Winnipeg, MB R3T 2N2, Canada ABSTRACT A prototype was built to evaluate the performance of an integrated barn-biofilter-greenhouse system. The greenhouse floor in the integrated system consisted of a bed of gravel to store maximum solar energy. A vertical airflow biofilter (3.34 x 3.34 m) was constructed inside a solar energy greenhouse (floor area of 15 x 6.7 m); exhaust air from a barn was passed through the biofilter for odour treatment before being released into the greenhouse. A booster fan was used to provide a steady airflow rate of 1.4 m 3 /s to the biofilter. Data were collected from October 19 to December 6, 2007. The maximum temperature drop along the 15.5 m long, and insulated (R-20) duct carrying the exhaust air from the hog barn to the biofilter was 7° C. The lowest temperature recorded on top of the biofilter surface was 1.3° C when the biofilter booster fan was not working, while the lowest floor temperature was -3° C. On the coldest day in December, when the biofilter booster fan was not in service, the daily average temperature inside the greenhouse was 4.3° C, whereas the outdoor daily average temperature was -25° C. In order to keep the minimum greenhouse temperature at 10° C, the maximum required volumetric flow rate of barn exhaust air at 15° C was 1.60m 3 /s. Maximum hydrogen sulfide (H 2 S) removal efficiency was 55%. The weekly average concentration of carbon dioxide (CO 2 ) inside the greenhouse varied from 841 to 1536 ppm. The system has shown promise at creating an environment suitable for plant growth inside the greenhouse using a waste gas stream from a hog barn to provide both auxiliary heat and enhanced CO 2 levels. Keywords: barn, biofilter, greenhouse, integration 1. INTRODUCTION Currently, the air exhausted from a hog barn is an offensive waste-product. It is offensive because of the odour nuisance; it is a waste-product because the heat energy contained in the air is not used for any purpose. Greenhouse operators need supplemental heating during the winter (Tiwari 2003; Beshada and Zhang 2006). Although solar energy is an attractive substitute for conventional fuels for greenhouse heating (Badescu 2002; Ozturk 2005), previous research on solar energy greenhouses in Manitoba has concluded that solar energy is insufficient to maintain suitable temperatures inside the greenhouse during the night (Beshada et al. 2006). According to the Manitoba Hydro
Transcript of A Perpetual Harvest Greenhouse System: Integrating Barn, Biofilter
K. Mahmood, D.D. Mann, Q. Zhang, and A. Brule-Babel. “Perpetual Harvest Greenhouse System: Integrating Barn, Biofilter, and Greenhouse”. Agricultural Engineering International: The CIGR EJournal. Manuscript ERG 1310. Vol XI. August, 2009.
1
A Perpetual Harvest Greenhouse System: Integrating Barn, Biofilter and Greenhouse
K. Mahmood1, D.D. Mann1, Q. Zhang1 & A. Brule-Babel2
1University of Manitoba, Department of Biosystems Engineering, E2-376 EITC, Winnipeg, MB R3T 5V6, Canada. Tel: (204) 474-7149; Fax: (204) 474-7512;
Email: [email protected] 2University of Manitoba, Department of Plant Science, Winnipeg, MB R3T 2N2, Canada
ABSTRACT
A prototype was built to evaluate the performance of an integrated barn-biofilter-greenhouse system. The greenhouse floor in the integrated system consisted of a bed of gravel to store maximum solar energy. A vertical airflow biofilter (3.34 x 3.34 m) was constructed inside a solar energy greenhouse (floor area of 15 x 6.7 m); exhaust air from a barn was passed through the biofilter for odour treatment before being released into the greenhouse. A booster fan was used to provide a steady airflow rate of 1.4 m3/s to the biofilter. Data were collected from October 19 to December 6, 2007. The maximum temperature drop along the 15.5 m long, and insulated (R-20) duct carrying the exhaust air from the hog barn to the biofilter was 7° C. The lowest temperature recorded on top of the biofilter surface was 1.3° C when the biofilter booster fan was not working, while the lowest floor temperature was -3° C. On the coldest day in December, when the biofilter booster fan was not in service, the daily average temperature inside the greenhouse was 4.3° C, whereas the outdoor daily average temperature was -25° C. In order to keep the minimum greenhouse temperature at 10° C, the maximum required volumetric flow rate of barn exhaust air at 15° C was 1.60m3/s. Maximum hydrogen sulfide (H2S) removal efficiency was 55%. The weekly average concentration of carbon dioxide (CO2) inside the greenhouse varied from 841 to 1536 ppm. The system has shown promise at creating an environment suitable for plant growth inside the greenhouse using a waste gas stream from a hog barn to provide both auxiliary heat and enhanced CO2 levels. Keywords: barn, biofilter, greenhouse, integration
1. INTRODUCTION Currently, the air exhausted from a hog barn is an offensive waste-product. It is offensive because of the odour nuisance; it is a waste-product because the heat energy contained in the air is not used for any purpose. Greenhouse operators need supplemental heating during the winter (Tiwari 2003; Beshada and Zhang 2006). Although solar energy is an attractive substitute for conventional fuels for greenhouse heating (Badescu 2002; Ozturk 2005), previous research on solar energy greenhouses in Manitoba has concluded that solar energy is insufficient to maintain suitable temperatures inside the greenhouse during the night (Beshada et al. 2006). According to the Manitoba Hydro

K. Mahmood, D.D. Mann, Q. Zhang, and A. Brule-Babel. “Perpetual Harvest Greenhouse System: Integrating Barn, Biofilter, and Greenhouse”. Agricultural Engineering International: The CIGR EJournal. Manuscript ERG 1310. Vol XI. August, 2009.
2
statistics, approximately 6.0 x 10⁶ kWh energy was provided to the Manitoba’s greenhouse sector in 2005(Manitoba Hydro 2005). Building a greenhouse next to a hog barn provides an excellent opportunity to use the heat energy in the barn exhaust air to heat the greenhouse, potentially eliminating the need for supplemental heating. However, ducting exhaust air into a greenhouse would create an undesirable work environment. To become acceptable, the odour must be removed from the air stream. The process of biofiltration is known to obtain high levels of odour reduction in livestock facilities (Nicolai and Janni 1998; Burgess et al. 2001; Hartung et al. 2001; Kennes and Viega 2001). It is a biological process that consists of a reactor packed with filter material on which a biolayer containing a suitable microbial population is formed. When a contaminated air stream is diffused in the biofilter, the pollutants (such as CH4, H2S, NH3) in the stream are adsorbed onto the biolayer and biodegraded to simple end-products such as water and carbon dioxide (Janni et al. 1998; Devinny et al. 1999; Chaudhary et al. 2003). Although biofiltration is a proven technology, cold winter temperatures limit the efficiency that can be obtained with an external biofilter. Mann et al. (2002) concluded that exhaust air from a hog barn contained sufficient heat to prevent an uncovered biofilter bed from freezing during ambient temperatures below -20°C. However, the effectiveness of the biofilter was inconsistent. Placing a biofilter inside a greenhouse should, in theory, provide protection from cold weather conditions. In addition to heat, plants also require carbon dioxide (CO2) for the process of photosynthesis. Carbon dioxide is a by-product of the respiration (by pigs) that occurs in the barn, and as mentioned before, CO2 is also one of the major end-products of the biofiltration process. Consequently, air leaving the barn and passing through a biofilter will have elevated levels of CO2 when it enters into the greenhouse environment. Elevated CO2 concentrations are widely expected to enhance the growth and productivity of many greenhouse crops (Kimball 1986; Hinklenton 1988; Allen 1990; Groninger et al. 1996; Schapendonk et al. 2000; Tisserat 2002; Tisserat and Vaughn 2003; Rodgers et al. 2004; Cermak et al. 2005; Phippen et al. 2006). Flowers and vegetable plants show very robust effects of CO2 enrichment by increased photosynthesis, dry weight, plant height, and lateral branching under CO2 enrichment (Mortensen 1987; Campbell et al. 1988). Carbohydrate formed in the leaves is eventually used to sustain the growth of the developing fruits; thus increased yield in crops such as cucumber (Peet and Willits 1987; Willits and Peet 1989), tomato (Slack 1986; Willits and Peet 1989; Reinert et al. 1997), and pepper (Hinklenton 1988) are a common result of CO2 enrichment. Similarly, production time of lettuce and kohlrabi can be reduced by 15 to 25% under an elevated CO2 environment (Wittwer and Robb 1964; Hand et al. 1981). Hand and Soffe (1971) recorded 32 to 72% higher tomato yields after six weeks of harvesting when plants were grown in 1200 ppm CO2. There was only a slight increase in the total tomato fruit set with CO2 enrichment, but the fruit weight under CO2 enrichment was significantly higher (Peet and Willits 1984). Growth and yield responses to enhanced CO2 concentration might also be influenced by a wide range of environmental factors including light and humidity (Mortensen 1992; Wong 1993), nutrient status (Israel et al. 1990), and temperature (Sionit et al. 1987 a,b; Idso et al.

K. Mahmood, D.D. Mann, Q. Zhang, and A. Brule-Babel. “Perpetual Harvest Greenhouse System: Integrating Barn, Biofilter, and Greenhouse”. Agricultural Engineering International: The CIGR EJournal. Manuscript ERG 1310. Vol XI. August, 2009.
3
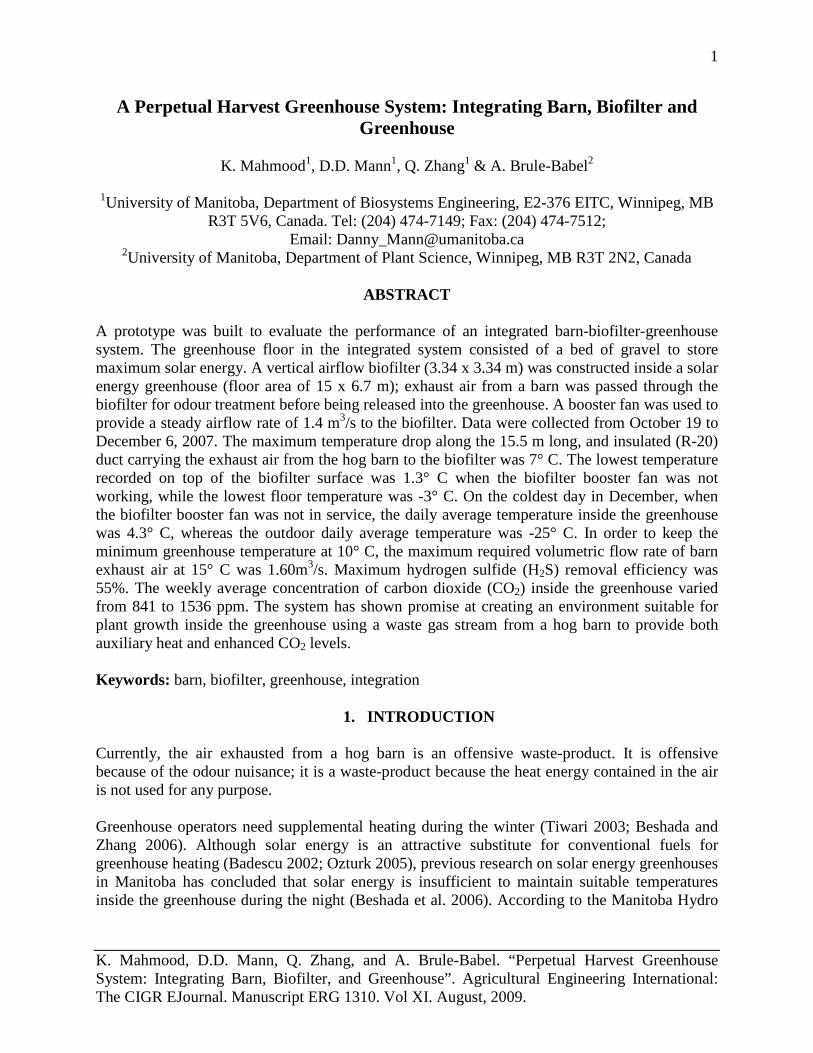
1988). High CO2 levels can reduce the minimum temperature required by a plant to grow and complete its life-cycle. For example, Sionit et al. (1981) showed that okra was unable to complete its life-cycle in normal CO2 at temperatures below 23/17°C (day/night), while okra plants grown in 1000 ppm CO2 at 20/14°C (day/night), matured and produced fruit. The integration of both a biofilter and a greenhouse to a hog barn creates a synergistic system, in which the exhaust air from a hog barn can be used for both nutrients and energy. The present research took place at the University of Manitoba’s Glenlea Research Station (49°N and 97°W). A solar energy greenhouse was built next to a hog barn. An open bed biofilter was constructed inside the greenhouse and an insulated duct carried exhaust air from the barn to the biofilter for odour treatment before introducing it into the greenhouse (Figure 1). The goal was to be able to generate a micro-climate in the headspace above the biofilter that has elevated levels of CO2 and warm temperatures near the roots of the potted plants (i.e., on the biofilter surface). The main objectives of this research were: i) to evaluate the thermal profile of the integrated barn-biofilter-greenhouse system; ii) to measure the H2S reduction as an indicator of biofilter odour removal efficiency; iii) to measure the CO2 concentrations that can be generated by the integrated system; iv) to quantify the sources of both energy release and storage in the integrated system; and v) to develop an equation for calculating the required volumetric flow rate of the exhaust air from the hog barn to maintain the interior of a greenhouse at a desired temperature.
Figure 1. Schematic of the integrated barn-biofilter-greenhouse system.
2. MATERIALS AND METHODS
K. Mahmood, D.D. Mann, Q. Zhang, and A. Brule-Babel. “Perpetual Harvest Greenhouse System: Integrating Barn, Biofilter, and Greenhouse”. Agricultural Engineering International: The CIGR EJournal. Manuscript ERG 1310. Vol XI. August, 2009.
4
2.1 Duct A 15.5 m long and 600 mm inner diameter high density polyethylene (HDPE) pipe, with two 90° bends, was used to carry the exhaust air from a hog barn to the biofilter. The pipe was placed on cinder blocks at a height of about 0.5 m from the ground. Adjustable iron legs were attached to the pipe at different points to provide stable and permanent support. The pipe was wrapped by R-20 fibreglass insulation to minimize heat loss from the air before it reached the biofilter. Chicken wire was used to hold the insulation around the pipe. To protect the fibreglass insulation, it was covered by a double layer of 6-mil polyethylene plastic sheet. 2.2 Biofilter An open bed, vertical airflow biofilter (Figure 2) covering an area of 11 m2 and having a media depth of 610 mm, was fabricated inside the greenhouse using pressure treated plywood. An air plenum was built to provide appropriate airflow to the biofilter. Vinyl mesh netting was placed on top of the air plenum to prevent the biofilter media from falling into the plenum. The biofilter media consisted of woodchips mixed with straw based compost in an 80:20 ratio. Woodchips and compost were obtained from a local supplier (Remier Soils). Airflow rate is an important factor in the design of a biofilter because it determines the length of time that an air stream will be in contact with the biofilter medium (Nicolai and Janni 1998). This is generally referred to as residence time. The true residence time is obtained by multiplying total filter bed volume by the porosity of the filter medium, divided by the airflow rate (Devinny et al. 1999). Because the porosity of the biofilter medium changes over time due to compaction, residence time is often estimated by the empty bed residence time (EBRT) (DeBruyn et al. 2001). The EBRT is defined as the ratio of biofilter volume to airflow rate (Devinny et al. 1999). It has been concluded that a residence time of 5 s is sufficient to achieve 80% odour reduction from swine facilities (Nicolai and Janni 1998). In this study, the biofilter was designed for an EBRT of 3 s to minimize the surface area covered by woodchips because Mahmood and Mann (2008) had previously determined that gravel stored more solar energy than woodchips, which can be used as passive heat storage material. This biofilter was designed for vertical airflow because vertical airflow suits the current configuration in which potted plants can be placed onto the biofilter surface so that the heat energy being harvested from the exhaust air is used to heat the roots of the plants. A booster fan, located at the end of the duct before transition to the biofilter, was used to supply a constant airflow rate of 1.4 m3/s to the biofilter. The air flow rate was measured by using a hotwire anemometer and a cone like hood (240mm x 240mm) (Garlinski 2004), placed at the end of the biofilter transition before it was connected to the biofilter plenum. The hotwire anemometer was placed at the end of the cone to measure the flow rate. The airflow rate readings were taken for three times at the center and sides of the biofilter transition. The speed of the booster fan was adjusted such that the average of these replications at each point was measured to be 1.4m3/s. Irrigation of the biofilter occurred only three times per week at a rate of approximately 0.3 L/s for a period of 20 min. A sprinkler was used to spray water on top of the biofilter media and an irrigation hose was placed at a depth of 0.3 m inside the biofilter media. At the time of data collection, no permanent supply of water was available in the greenhouse. Moisture content of the biofilter media (wet basis) was determined during the course of the experiment using the oven dry method (ASAE 2003). Without a permanent supply of water to the greenhouse,

K. Mahmood, D.D. Mann, Q. Zhang, and A. Brule-Babel. “Perpetual Harvest Greenhouse System: Integrating Barn, Biofilter, and Greenhouse”. Agricultural Engineering International: The CIGR EJournal. Manuscript ERG 1310. Vol XI. August, 2009.
5
moisture content fluctuated from day to day (13 to 38% wb). This fluctuation in moisture contents was mainly because the irrigation of the biofilter was not done on a daily basis.
Figure 2. Schematic of vertical airflow open-bed biofilter in the integrated system. 2.3 Solar energy greenhouse A 15 m long and 6.7 m wide solar energy greenhouse with a gravel floor was built adjacent to a hog barn. The main components of the solar energy greenhouse consisted of steel framing, a plastic cover, bubble insulation (25.4 mm diameter and 6.4 mm deep), a vent, and a solar energy storage north wall (Figure 3). The greenhouse was oriented in the east-west direction to maximize the collection of solar energy. The plastic cover acts as a solar window and enclosed the south side of the greenhouse, while the north wall and a small section of insulated roof formed an enclosure from the north side. The bottom edge of the south side was not sealed to provide a means of escape for the air entering the greenhouse from the barn (Figure 1). The plastic cover was a layer of 6-mil thick polyethylene. Bubble insulation with thermal resistance of R ≤ 2 was placed under the plastic cover to reduce the heat loss during the night. This translucent bubble insulation transmits evenly diffused light throughout the greenhouse. The greenhouse floor was a bed of gravel which acted as thermal heat storage to retain solar energy during the day and radiate it back at night. The north wall, which was filled with riverstone, also acted as a passive heat storage system. The north wall was painted black so that it absorbed maximum solar radiation during the day. The north wall consisted of a 2 mm thick galvanized weathertite siding from the inside, 152 mm of riverstone, 13 mm pressure treated plywood, a 6-mil vapour barrier followed by 152 mm roxul flexibatt® insulation, and 13 mm pressure treated plywood at the outside (Figure 4). The roxul flexibatt® (Roxul Inc., Grand Forks, British Columbia) insulation in the roof and north and side walls provided a thermal resistance of approximately R-22.
North Wall
Booster Fan
Reduced Odour Air
Media Support
Biofilter Wall
Air Plenum Duct Carrying Exhaust of the Barn
Biofilter Media

K. Mahmood, D.D. Mann, Q. Zhang, and A. Brule-Babel. “Perpetual Harvest Greenhouse System: Integrating Barn, Biofilter, and Greenhouse”. Agricultural Engineering International: The CIGR EJournal. Manuscript ERG 1310. Vol XI. August, 2009.
6
Figure 3. Schematic of the side view of the solar energy greenhouse.
A vent was installed on the east wall of the greenhouse. The thermostat of the vent had a set point of 30°C throughout the experiment. The vent opened automatically when the air temperature inside the greenhouse reached 30°C.
Figure 4. Cross-section of the north wall of the solar energy greenhouse.
2.4 Data Recording The duct temperature, biofilter plenum temperature, room temperature, greenhouse floor temperature and north wall surface temperature were recorded every 20 min using T-type thermocouples and a computer-controlled data acquisition system. The outside air temperature, solar radiation, relative humidity, and wind speed were recorded every 30 min by a weather station (Dr. Mario Tenuta, University of Manitoba) located at the Glenlea Research Station. Three thermocouples were installed inside the pipe to study the heat loss along the length of the duct. One thermocouple was placed near the exhaust of the barn and the other two thermocouples were installed at distances of 6.4 and 11 m from the barn exhaust fan.
Gravel (152 mm)
Treated Plywood (13 mm)
Roxul Flexibatt (140 mm)
Galvanized Weathertite Siding (2 mm)
Vapour barrier (6-mil polyethylene)
Insulation
South
Plastic cover Solar radiation
Heat Bubble poly
North roof
Air escaping from the south end
Riverstone filled north wall
Gravel floor

K. Mahmood, D.D. Mann, Q. Zhang, and A. Brule-Babel. “Perpetual Harvest Greenhouse System: Integrating Barn, Biofilter, and Greenhouse”. Agricultural Engineering International: The CIGR EJournal. Manuscript ERG 1310. Vol XI. August, 2009.
7
The temperature inside the plenum of the biofilter was monitored at different points to examine the temperature difference between the odorous stream coming out from the barn and just before it is diffused to the biofilter media for odour treatment. Biofilter surface temperature was also monitored to investigate the possibility of placing potted plants on the biofilter surface to heat the root zone of the plants. The greenhouse floor temperature was recorded near the side walls, north wall, south end, and in the middle of the greenhouse around the biofilter. The inside air temperature was monitored at different locations, specifically, on top of the biofilter at a height of 2.5 m above the ground. Temperature of the north wall was also recorded at three different heights on the inside surface of the wall. 2.5 H2S and CO2 Measurements Hydrogen sulfide is one of the major odorous components in the exhaust from a hog barn. For this research, H2S concentration was used as an indicator of odour treatment of the air stream by the biofilter, and odour level reduction was measured by comparing the hydrogen sulfide (H2S) concentration of the air entering and leaving the biofilter. Hydrogen sulfide (H2S) and carbon dioxide (CO2) concentrations were obtained at different locations inside the solar energy greenhouse (Figure 5). A Jerome Meter (Jerome 631-X Hydrogen Sulfide Analyzer, Arizona Instrument Corporation, Phoenix, AZ) was used to monitor the concentrations of H2S and a VAISALA CO2 probe (VAISALA GMP222 Carbon dioxide probe, Vaisala Oyj, Finland) was used to record the CO2 concentrations.
Figure 5. H2S and CO2 sampling points (“•”) inside the solar energy greenhouse.
The first set of H2S and CO2 samples was collected four weeks after the biofilter became operational. It was expected that this was sufficient time to ensure the development of the microbial community within the biofilter medium (Nicolai and Janni 1998). Samples of H2S and CO2 were measured three times a week for six weeks.
5.75 m
0.5 m
8.75 m
15 m
7.3 m 4.3 m
6.7 m
3.4 m
1.45 m Top View
N
E
1.7 m
1.5 m Biofilter
1.7 m
3.3 m 3.4 m

K. Mahmood, D.D. Mann, Q. Zhang, and A. Brule-Babel. “Perpetual Harvest Greenhouse System: Integrating Barn, Biofilter, and Greenhouse”. Agricultural Engineering International: The CIGR EJournal. Manuscript ERG 1310. Vol XI. August, 2009.
8
2.6 Energy balance calculations The energy balance of the integrated barn-biofilter-greenhouse system included the energy gained from the barn, the solar energy received by the greenhouse, energy lost due to conduction and convection, and energy stored in the greenhouse. Mathematical presentation of the energy balance equation is:
stcvcdinb QQQQQ ++=+ (1)
Where:
=bQ heat gain from the barn (W),
=inQ solar radiation received in greenhouse (W),
=cdQ heat loss due to conduction through the greenhouse envelope (W),
=cvQ heat loss through infiltration (W), and
=stQ heat stored in greenhouse (W).
This calculation was made for the coldest day (November 17) in the data set, when the biofilter booster fan was running, and the air flow rate of barn exhaust air entering in the greenhouse after biofiltration was 1.4m3/s. The heat gain from the barn was calculated as:
bQ = ( )obaa ttCV − (2)
Where:
V = volumetric flow rate of barn exhaust air leaving the biofilter surface (m3/s),
a = air density (kg/m3),
aC = specific heat capacity of air (J/kg °C),
bt = temperature at biofilter surface (°C), and
ot = outside temperature (°C).
The received solar radiation is determined as follows:

K. Mahmood, D.D. Mann, Q. Zhang, and A. Brule-Babel. “Perpetual Harvest Greenhouse System: Integrating Barn, Biofilter, and Greenhouse”. Agricultural Engineering International: The CIGR EJournal. Manuscript ERG 1310. Vol XI. August, 2009.
9
inQ = τ S (3)
Where:
τ = transmissivity of the glazed surface (0.7), and
S = solar radiation (W).
The heat loss due to conduction through the greenhouse envelope, which included the north wall, west wall, east wall, north roof, door, and plastic cover with bubble poly (Table 1, Thermal resistance of North wall, east wall, side wall, and north roof was estimated based on R-22 roxul flexibatt® insulation) was calculated by:
cdQ = ∆ΤRA (4)
Where:
R = overall thermal resistance (m2 °C /W),
A = total surface area of greenhouse envelope (m2), and
∆Τ = temperature difference of inside and outside air (°C)
The overall thermal resistance of the greenhouse was calculated as:
RA =
nw
nw
RA
+ ww
ww
RA
+ sw
sw
RA
+ nr
nr
RA
+ d
d
RA
+ c
c
RA
(5)
Where:
nwA , wwA , swA , nrA , dA , cA = areas of north wall, west wall, south wall, north roof, door, and plastic/bubble poly, respectively (m2), and
nwR , wwR , swR , nrR , dR , cR = thermal resistance of north wall, west wall, south wall,
north roof, door, and plastic with bubble poly, respectively (m2 °C /W).
Table 1. Thermal resistance of greenhouse envelope components
Section Area (m2) Resistance

K. Mahmood, D.D. Mann, Q. Zhang, and A. Brule-Babel. “Perpetual Harvest Greenhouse System: Integrating Barn, Biofilter, and Greenhouse”. Agricultural Engineering International: The CIGR EJournal. Manuscript ERG 1310. Vol XI. August, 2009.
10
(m2 °C /W)
North wall 37 3.87 West wall 20 3.87 East wall 17 3.87 North roof 33 3.87 Door 1.9 0.176 Plastic with bubble poly 118 0.285
The heat loss due to air infiltration was calculated as:
cvQ = ( )oiaa ttCV − (6)
Where:
V = volumetric air exchange rate by infiltration (m3/s), and
it = inside temperature (°C).
The amount of heat stored in the greenhouse ( north wall and gravel floor) was determined as:
stQ = wallQ + floorQ (7)
wallQ = wallwallwall CV wall∆Τ (7a)
gravelQ = gravelgravelgravel CV gravel∆Τ (7b)
Where:
wallQ , gravelQ = heat stored in north wall and gravel floor, respectively (W)
wallV , gravelV = volume of wall and floor, respectively (m3),
wall , gravel = density of wall and floor, respectively (kg/m3),
wallC , gravelC = specific heat capacity of wall and floor, respectively (J/kg °C), and
wall∆Τ , gravel∆Τ = rate of change in wall and floor temperature, respectively (°C /s).
Equation (1) can be rearranged as:

K. Mahmood, D.D. Mann, Q. Zhang, and A. Brule-Babel. “Perpetual Harvest Greenhouse System: Integrating Barn, Biofilter, and Greenhouse”. Agricultural Engineering International: The CIGR EJournal. Manuscript ERG 1310. Vol XI. August, 2009.
11
instcdcvb QQQQQ −+=− (8)
Substituting the values of bQ and cvQ from equations 2 and 6 into equation 8
( )obaa ttCV − - ( )oiaa ttCV − = instcd QQQ −+ (9)
Since the volumetric flow rate of air entering the greenhouse is equal to the volumetric flow rate of air leaving the greenhouse, equation 9 will become:
( )ibaa ttCV − = instcd QQQ −+ (10)
Rearranging equation 10
V = ( )ibaa
instcd
ttCQQQ
−−+
(11)
Equation 11 is used to determine the volumetric flow rate of barn exhaust air entering the greenhouse to maintain the minimum (10°C) inside temperature.
3. RESULTS AND DISCUSSION
3.1 Temperature gradient along the length of the duct The maximum temperature drop before the shutdown of the biofilter booster fan was 1° C. The coldest days (Nov. 24 – Dec. 5) and time (07:00 h) were selected as a worst case scenario to determine the temperature gradient along the length of the duct after the biofilter booster fan was stopped. The temperature decrease along the length of the duct varied between 1 and 7° C. The maximum temperature decrease was recorded on November 29 when the barn exhaust air temperature was measured as 18° C and the air temperature inside the biofilter plenum was recorded as11° C (Figure 6). The outside air temperature on the same day and time was observed as -23° C. However, on the coldest day (Dec. 5) when the outside air temperature was -28° C, the temperature decrease along the length of the duct was only 3°C. More heat was lost on November 29 than December 5 due to convective cooling. The wind speed on November 29 was approximately three times higher than the wind speed observed on December 5.
3.2 Greenhouse temperature profile The temperature inside the greenhouse varied from -3.2°C to 40° C, while the outdoor temperature ranged between -29.9 and 13.4° C. The daily average temperature inside the greenhouse varied from 1.5 to 20.9° C, whereas the outdoor daily average temperature was between -25.0 and 10.4° C (Figure 7).

K. Mahmood, D.D. Mann, Q. Zhang, and A. Brule-Babel. “Perpetual Harvest Greenhouse System: Integrating Barn, Biofilter, and Greenhouse”. Agricultural Engineering International: The CIGR EJournal. Manuscript ERG 1310. Vol XI. August, 2009.
12
-30
-20
-10
0
10
20
30
22-Nov
24-Nov
26-Nov
28-Nov
30-Nov
02-Dec
04-Dec
06-Dec
Date
Tem
pera
ture
(°C)
Barn exhaust air6.4 m from the barn exhaust11 m from the barn exhaustBiofilter plenumOutside air
Figure 6. Temperature profile along the length of the duct at 7:00h of the days.
Indoor temperature was influenced by solar radiation as the lowest daily average indoor temperature occurred on a cloudy day (daily average solar radiation of 120W/m2), not on the day with the lowest daily average outdoor temperature of -25°C with daily average solar radiation of 176 W/m2. The mean indoor and outdoor temperatures were 11.9 and -3.3°C, respectively. On average, the daily average indoor temperature was 15°C higher than the outdoor daily average temperature. Figures 8 and 9 represent the temperature profiles of the greenhouse air and floor at four different times of the day. These times reflect the maximum and minimum recorded temperatures with a possible variation of ±2°C. The minimum and maximum greenhouse floor temperature was recorded as -1.9 and 29.3°C, respectively (Figure 8), whereas the minimum and maximum greenhouse air temperature was measured as -2.0 and 38.4°C, respectively (Figure 9). The sudden drop in greenhouse air and floor temperature from November 21 to November 24 occurred when the biofilter booster fan was turned off. It was necessary to stop the booster fan because it was extracting too much heat from the partially-filled room (< 20 pigs in a room designed for 130 pigs). As a consequence of stopping the booster fan, there was very little air entering the greenhouse through the duct. Air flow rate was not measured, and would have fluctuated throughout the day. The system was designed on the expectation that booster fan would be running constantly. In the absence of positive pressure inside the greenhouse, it is possible that cold air was entering the greenhouse from the south edge.

K. Mahmood, D.D. Mann, Q. Zhang, and A. Brule-Babel. “Perpetual Harvest Greenhouse System: Integrating Barn, Biofilter, and Greenhouse”. Agricultural Engineering International: The CIGR EJournal. Manuscript ERG 1310. Vol XI. August, 2009.
13
-30
-20
-10
0
10
20
30
15-Oct
20-Oct
25-Oct
30-Oct
04-Nov
09-Nov
14-Nov
19-Nov
24-Nov
29-Nov
04-Dec
09-Dec
Date
Tem
pera
ture
(°C
)
0
50
100
150
200
250
300
Sola
r rad
iatio
n (W
/m2 )
Outdoor
Inside
Radiation
Figure 7. Daily average inside, and outdoor temperatures and solar radiation.
Typically the lowest temperature inside the greenhouse was recorded between 01:00 and 07:00 h which shows that bubble insulation was not sufficient to hold the heat inside the greenhouse during the night time. It was also observed that the greenhouse temperature never went below 10° C even when the outside temperature was -10° C before the booster fan shutdown. 3.3 Temperature comparison of biofilter surface and greenhouse floor The minimum and maximum greenhouse floor temperatures shown in Figure 10 were based on greenhouse floor readings at 07:00 and 13:00 h, respectively. The daily average temperature of the biofilter plenum fluctuated between 11.7 and 20.4° C. The minimum and maximum temperatures of the greenhouse floor were a little bit higher than the minimum and maximum temperatures of the biofilter surface when the weather was not too cold. However, the temperature of the biofilter surface never went below 1°C throughout the experiment even when the biofilter booster fan was shut down, suggesting that the biofilter was still getting some heat from the barn.

K. Mahmood, D.D. Mann, Q. Zhang, and A. Brule-Babel. “Perpetual Harvest Greenhouse System: Integrating Barn, Biofilter, and Greenhouse”. Agricultural Engineering International: The CIGR EJournal. Manuscript ERG 1310. Vol XI. August, 2009.
14
-5
0
5
10
15
20
25
30
35
15-Oct
20-Oct
25-Oct
30-Oct
04-Nov
09-Nov
14-Nov
19-Nov
24-Nov
29-Nov
04-Dec
09-Dec
Date
Tem
pera
ture
(°C
) 1:00h7:00h13:00h19:00h
Figure 8. Temperature profile of greenhouse floor at different times of the day.
-5
0
5
10
15
20
25
30
35
40
15-Oct
20-Oct
25-Oct
30-Oct
04-Nov
09-Nov
14-Nov
19-Nov
24-Nov
29-Nov
04-Dec
09-Dec
Date
Tem
pera
ture
(°C
)
1:00h7:00h13:00h19:00h
Figure 9. Temperature profile of the air inside the greenhouse at different times of the day.

K. Mahmood, D.D. Mann, Q. Zhang, and A. Brule-Babel. “Perpetual Harvest Greenhouse System: Integrating Barn, Biofilter, and Greenhouse”. Agricultural Engineering International: The CIGR EJournal. Manuscript ERG 1310. Vol XI. August, 2009.
15
The greenhouse floor temperature varied between -1.9 and 29.3° C. The lowest temperature on the biofilter surface was recorded as 1.3° C. It is considered that the biofilter surface would have higher temperatures if the booster fan had remained in service, as the minimum temperature of the biofilter surface before the shutdown of booster fan was measured as 8°C. Figure 10 shows that minimum and maximum floor temperatures were slightly higher than minimum and maximum temperatures of the biofilter surface when the outside temperature was above -10° C. However, a reversal occured when the outside temperature went below -10° C. This supports the hypothesis of putting the potted plants on top of the biofilter surface for the direct gain of heat energy and CO2 when the outside temperature gets cold (
< −10°C ).
3.4 Hydrogen sulfide reduction The mean hydrogen sulfide (H2S) concentration in the plenum of the biofilter was 0.56 ppm with a standard deviation of 0.2 ppm over the six sampling periods, these values are an average of three replicates at different sampling points (Table 2). The H2S concentration in the barn exhaust can be as high as 0.93 ppm (Zhou 2001). After passing through the biofilter, the mean H2S concentration ranged between 0.15 and 0.39 ppm. Based on the inlet and outlet H2S concentrations, the H2S reduction ranged between 35 and 55% (Table 2). The main reasons for lower H2S removal rates are: i) lower EBRT time (3 s) of biofilter operation (Janni et al. 1998), and ii) inadequate biofilter moisture content (13-38%, wb) necessary for favourable microbial environment and bacterial growth (Devinny et al. 1998).
-5
0
5
10
15
20
25
30
35
15-Oct
20-Oct
25-Oct
30-Oct
04-Nov
09-Nov
14-Nov
19-Nov
24-Nov
29-Nov
04-Dec
09-Dec
Date
Tem
pera
ture
(°C
)
Biofilter surface minBiofilter surface maxPlenum daily averageGreenhouse floor minGreenhouse floor max
Figure 10. Temperature profile of biofilter surface and greenhouse floor.

K. Mahmood, D.D. Mann, Q. Zhang, and A. Brule-Babel. “Perpetual Harvest Greenhouse System: Integrating Barn, Biofilter, and Greenhouse”. Agricultural Engineering International: The CIGR EJournal. Manuscript ERG 1310. Vol XI. August, 2009.
16
3.5 Carbon dioxide environment The mean carbon dioxide (CO2) concentration on the biofilter surface was 1146 ppm with a standard deviation of 304 ppm over the six sampling periods, whereas the mean CO2 concentration in other locations of the solar energy greenhouse was 1151 ppm with a standard deviation of 285 ppm over the six sampling periods, these values are an average of three replicates at different sampling points (Table 3). The main reasons for gradual increase in CO2 concentration in the greenhouse are:
i) As the hogs were growing up, they were producing more CO2, which was adding into the greenhouse environment through biofilter
ii) CO2 is one of the end products of biofiltration. After the biofilter booster fan was shut down, the biofilter was still getting some exhaust air from the hog barn. It is anticipated that flow rate of the exhaust air was less than biofilter booster fan flow rate (1.4 m3/s). This reduced airflow rate had higher proportion of CO2 concentrations in the volume of air as compared to higher air flow rate. The reduced airflow rate also allowed more time for a parcel of air to remain in the biofilter bed which allowed extra time for the microbial environment in the biofilter to complete biooxidation reactions to produce more CO2 concentration.
iii) South end of the greenhouse was not effectively sealed to let the air coming in from the hog barn to escape. But as snow fell, layers of snow piled up at the south end. This reduced the escape of air from the greenhouse and helped in accumulating the CO2 concentration inside the greenhouse. The carbon dioxide concentration in fresh air varies between 300 and 600 ppm. The current threshold limit value (TLV), or maximum level that is considered safe for healthy adults for an eight-hour work day, is 5000 ppm (Robertson 2006).
Table 2. Hydrogen sulfide (H2S) concentrations inside the greenhouse
Sampling week
H2S concentration (ppm) Mean H2S reduction (%)
Inlet Biofilter surface
Solar energy greenhouse
5 0.33 0.15 0.2 55 6 0.7 0.39 0.42 44 7 0.36 0.21 0.22 42 8 0.6 0.39 0.41 35 9 0.68 0.38 0.38 44
10 0.71 0.37 0.38 48 MEAN 0.56 0.32 0.34 45 STDEV 0.2 0.11 0.11

K. Mahmood, D.D. Mann, Q. Zhang, and A. Brule-Babel. “Perpetual Harvest Greenhouse System: Integrating Barn, Biofilter, and Greenhouse”. Agricultural Engineering International: The CIGR EJournal. Manuscript ERG 1310. Vol XI. August, 2009.
17
Table 3. Carbon dioxide (CO2) concentrations inside the greenhouse
Sampling week
CO2 concentration (ppm)
Biofilter surface
Solar energy greenhouse
5 877 941 6 841 841 7 940 953 8 1456 1446 9 1536 1521
10 1223 1201 MEAN 1146 1151 STDEV 304 285
3.6 Solar wall temperature and stored energy The wall surface temperature started to rise at 9:00h and reached the maximum value of 42°C at 13:00h, whereas solar radiation and indoor air temperature peaked at 12:00h, and 13:00h, respectively (Figure 11). The wall surface temperature started to decrease gradually thereafter, and reached the minimum value of 9.6°C just before the sun set. Beshada et al. (2006) concluded that the temperature distribution across a north wall filled with sand at 10, 60, and 100 mm depths was approximately linear. Since the specific heat capacity of riverstone is almost the same as the specific heat capacity of sand, it was assumed that the temperature distribution of a north wall filled with gravel would be the same as the temperature distribution of a north wall filled with sand in Beshada et al.’s study. The temperatures of gravel filled wall for this experiment were calculated based on the graphical presentation of the north wall temperature profile in Beshada et al. (2006).
0
10
20
30
40
50
0 6 12 18 24
Time (h)
Tem
pera
ture
(°C
)
Figure 11 Hourly temperatures recorded at the surface of north wall on November 17, 2008.

K. Mahmood, D.D. Mann, Q. Zhang, and A. Brule-Babel. “Perpetual Harvest Greenhouse System: Integrating Barn, Biofilter, and Greenhouse”. Agricultural Engineering International: The CIGR EJournal. Manuscript ERG 1310. Vol XI. August, 2009.
18
Equation 7a was used to estimate the amount of energy stored in or released from the north wall. The rate of change in wall temperature was calculated as the difference between two consecutive measurements of wall temperature divided by the time interval between the two measurements. Increased wall temperature indicated that energy was stored, whereas a decrease in wall temperature meant that energy was released from the wall to the greenhouse. The values of specific heat capacity and density of riverstone used for the calculations were estimated as 0.840 kJ/kg °C (Cheng et al. 2002), and 1522 kg/m3, respectively (Perry’s Chemical Engineers’ Hand Book 2007). The largest difference of 10.1°C occurred at 11:00h. The wall started to store solar energy as soon as the sun was out at 8:00h (Figure 12). The peak rate of 20.2 kW occurred at 11:00h. This peak rate at 11:00h suggests that the temperature distribution of riverstone at different depths may not be the same as the temperature distribution of sand at different depths in Beshada at al.’s (2005) study. The daily cumulative energy stored in the wall was 65.1 kWh, and the daily energy release was 64.7 kWh. This indicated that almost all the energy stored by the wall during the day was released to the greenhouse in the night (Figure 12).
-25
-15
-5
5
15
25
35
45
0 6 12 18 24
Time (h)
Ener
gy re
leas
ed o
r sto
red
(kW
)
0
50
100
150
200
250
300
Sola
r rad
iatio
n (W
/m2 )Qg
QwallQbiofilterQs
Figure 12. Energy stored (-) in and released (+) by the north wall and gravel, and energy
available from barn, based on the November 17, 2007 readings. 3.7 Gravel temperature and stored energy The research data from Mahmood and Mann (2008) was used to determine the gravel temperature as a function of solar radiation, and inside

K. Mahmood, D.D. Mann, Q. Zhang, and A. Brule-Babel. “Perpetual Harvest Greenhouse System: Integrating Barn, Biofilter, and Greenhouse”. Agricultural Engineering International: The CIGR EJournal. Manuscript ERG 1310. Vol XI. August, 2009.
19
temperature. A regression model (R2 = 0.667) was developed to determine the gravel temperature:
Tg = 6.34 + 0.499Ti– 0.01965Qs (12)
Where:
Tg = gravel temperature (°C),
Ti = inside temperature (°C), and
Qs = solar radiation (W/m2).
The total area of the greenhouse envelope was calculated to be 100.5 m2. Equation 7b was used to calculate the heat stored or released by the gravel floor. The highest temperature of gravel was obtained at 13:00h. The largest difference of 3.46°C occurred at 15:00h. A peak rate of 18.8 kW occurred at 15:00h. According to the regression model, almost all the energy stored by gravel was released at night. 3.8 Energy available from the barn Available barn energy was calculated based on the biofilter airflow rate (1.4 m3/s) and biofilter surface temperature. The barn room connected to the greenhouse was only partially-filled (< 20 pigs in a room designed for 130 pigs). As a consequence, the heat content of the exhaust air was quite low and the biofilter surface temperature was less than the greenhouse temperature throughout the day. Figure 12 shows that no heat energy was available from the barn on November 17, 2007 to maintain the minimum (10°C) greenhouse temperature. In order to obtain heat energy from the barn, the biofilter surface temperature should always be higher than the greenhouse temperature. It was also noted that barn energy would be wasted during the peak sunny hours (1100- 1500h). During that time, solar energy was sufficient to maintain the required temperature inside the greenhouse. Wasted barn energy could be stored as geothermal energy during the daytime, and introduced into the greenhouse during the night hours. 3.9 Required Volumetric Flow Rate of the Barn The main purpose of this calculation was to determine the maximum required volume of barn exhaust leaving the biofilter surface at 15°C to maintain the minimum temperature (10°C) inside the greenhouse.
After substituting the values of cdQ , inQ , stQ , a , aC , bt , and it in equation 11, the maximum volumetric flow rate of barn exhaust air required to maintain the minimum greenhouse temperature (10°C) at night time was calculated to be 1.60 m3/s.
4 CONCLUSIONS
K. Mahmood, D.D. Mann, Q. Zhang, and A. Brule-Babel. “Perpetual Harvest Greenhouse System: Integrating Barn, Biofilter, and Greenhouse”. Agricultural Engineering International: The CIGR EJournal. Manuscript ERG 1310. Vol XI. August, 2009.
20
1.1.The maximum temperature drop along 15.5 m long high density polyethylene pipe (HDPE), insulated by R-20 fibreglass insulation, fluctuated between 1 and 7° C. Wind speed had more influence on the temperature drop than did the outdoor temperature.
1.2.The daily average temperature inside the greenhouse was always above 1.5° C even when the daily average outside temperature went below -25° C. When the biofilter booster fan was in service, the greenhouse temperature never went below 10° C, even though the outside temperature was -10° C.
1.3.Under cold weather conditions, the biofilter surface temperature was higher than the greenhouse floor temperature. Hence, it would be good to put the potted plants on the biofilter surface for maximum heat gain.
1.4.In order to obtain heat energy from the barn, the biofilter surface temperature should be higher than the greenhouse temperature. Sufficient amounts of heat energy from the barn could be stored as active heat energy storage in the floor of the greenhouse during the day time, and can be re circulated to the greenhouse environment during the night hours.
2. The biofilter hydrogen sulfide (H2S) reduction efficiency ranged between 35 and 55%. 3. The mean CO2 concentration inside the greenhouse varied between 877 and 1536 ppm
over the six sampling periods. 4.1.Almost all the energy stored by the north wall during the daytime was released to the
greenhouse in the night time 4.2.According to the regression model, nearly all of the energy absorbed in the gravel during
the daytime was released during the night hours. 5. In order to keep the minimum greenhouse (15m x 6.7m) temperature at 10° C on
November 17, 2007, the maximum required volumetric flow rate of barn exhaust air at a temperature of 15° C is 1.60m3/s.
5 ACKNOWLEDGEMENTS
The authors acknowledge Manitoba Hydro and Manitoba Conservation’s Sustainable Development Innovation Fund (SDIF) for funding this project. We also acknowledge the technical assistance of Dale Bourns, Gerry Woods, Matt McDonald, Robert Lavallee and Perry Klassen in constructing and instrumenting the system.
6 REFERENCES
Allen, L.H. 1990. Plant responses to rising carbon dioxide and potential interaction with air pollutants. Journal of Environmental Quality 19: 15-34.
ASAE Standards. 2003. S358.2. Moisture Measurement. St. Joseph: ASAE.
Badescu, V. 2002. First and second law analysis of a solar assisted heat pump based heating system. Energy Conversion and Management 43: 2539–2552.
Beshada, E., Q. Zhang, and R. Boris. 2006. Winter performance of a solar energy greenhouse in southern Manitoba. Canadian Biosystems Engineering. 48: 5.1-5.8.

K. Mahmood, D.D. Mann, Q. Zhang, and A. Brule-Babel. “Perpetual Harvest Greenhouse System: Integrating Barn, Biofilter, and Greenhouse”. Agricultural Engineering International: The CIGR EJournal. Manuscript ERG 1310. Vol XI. August, 2009.
21
Beshada, E. and Q. Zhang. 2006. Optimizing the design of solar energy greenhouses. Canadian Society for Biological Engineering 06-108.
Burgess, J.E., S.A. Parsons and R.M. Stuetz. 2001. Developments in odour control and waste gas treatment biotechnology: a review, Biotechnology Advances-Elsevier 19: 35–63.
Campbell, W.J., Allen, L.H., Jr, Bowes, G. 1988. Effects of CO2 concentration on rubisco activity, amount, and photosynthesis in soybean leaves. Plant Physiology 88:1310-1316.
Cermak, S.C., T.A. Isbell, J.E. Isbell, G.G. Ackerman, B.A. Lowery and A.B. Deppe. 2005. Batch drying of cuphea seeds. Industrial Crops and Products 21, 354–459.
Chaudhary, D.S., S. Vigneswaran, H.H. Ngo, W.G. Shim and H. Moon. 2003. Biofilter in water and wastewater treatment, Korean Journal of Chemical Engineering. 20(6): 1054–1065.
Cheng, Wen-Hsi, M.S. Chou, W.S. Lee and B.J. Huang 2002. Applications of Low-Temperature
Regenerative Thermal Oxidizers to Treat Volatile Organic Compounds. Journal of Environmental Engineering 128 (4):313-319.
Devinny, J.S., M.A. Deshusses and T.S. Webster. 1999. Biofiltration for Air Pollution Control. Lewis Publishers, NY.
Groninger, J.W., Seiler, J.R., Zedaker, S.M., Berrang, P.C. 1996. Photosynthetic response of loblolly pine and sweetgum seedling stands to elevated carbon dioxide, water stress, and nitrogen level. Canadian Journal for Forest Research 26, 95–102.
Hand, D.W., G. Slack and D.G. Sweeney. 1981. Lettuce crop responses to controlled levels of CO2 enrichment. Reports of the Glasshouse Crops Research Institute, 58.
Hand, D.W. and R.W. Soffe. 1971. Light-modulated temperature control and the response of greenhouse tomatoes to different CO, regimes. Journal of Horticultural Science. 46: 381-396.
Hartung, E., T. Jungbluth and W. Buscher. 2001. Reduction of ammonia and odour emissions from a piggery with biofilters. American Society of Agricultural Engineers 44(1): 113-118.
Hinklenton, P.R. 1988. CO2 enrichment in the greenhouse, principles and practice. Portland, OR, USA. Timber Press.
Idso, S.B., B.A. Kimball, M.G. Anderson and J.R. Mauney. 1987. Effects of atmospheric CO2
enrichment on plant growth: the interactive role of air temperature Agriculture Ecosystems and Environment 20: 1-10.
Israel, D.W., T.W. Rufty and J.D. Cure. 1990. Nitrogen and phosphorus nutritional interactions in a CO2-enriched environment. Journal of Plant Nutrition 13: 1419-1433.

K. Mahmood, D.D. Mann, Q. Zhang, and A. Brule-Babel. “Perpetual Harvest Greenhouse System: Integrating Barn, Biofilter, and Greenhouse”. Agricultural Engineering International: The CIGR EJournal. Manuscript ERG 1310. Vol XI. August, 2009.
22
Janni, A.K., W.J. Maier, T.H. Kuehn, B.B. Bridges, D. Vesley and M.A. Nellis. 1998. Evaluation of biofiltration of air, an innovative air pollution control technology. 880-TRP. Minneapolis, Minnesota: Minnesota Building Research Centre, University of Minesota.
Kennes, C. and M.C. Veiga. 2001. Bioreactors for Waste Gas Treatment. Kluwer Academic Publishers, Dordrecht, The Netherlands 47–98.
Kimball, B.A. 1986. Influence of elevated CO2 on crop yield. In: Enoch, H. Z. & Kimball, B. A. (eds), Carbon Dioxide Enrichment of Greenhouse Crops. Volume II: Physiology, Yield and Economics, Boca Raton, FL, USA. CRC-Press Inc., pp. 105–115.
Mahmood, K. and D.D. Mann. 2008. Potential heat storage in the floor of an integrated barn-biofilter-greenhouse system. International Conference on Agricultural Engineering. Crete, Greece. June, 2008.
Manitoba Hydro 2005. Agriculturel energy distribution. Mann, D.D., J.C. DeBruyn and Q. Zhang. 2002. Design and Evaluation of an open biofilter for
treatment of odour from swine barns during sub-zero ambient temperatures. Canadian Biosystems Engineering 44(6): 21-26.
Mortensen, L.M. 1987. Review: CO2 enrichment in greenhouses. Crop responses. Scientia. Horticulturae 33: 1-25.
Mortensen, L.M. 1992. Effects of ozone concentration on growth of tomato at various light, air humidity and carbon dioxide levels. Scientia Horticulturae 49: 17-24.
Nicolai, R. and K. Janni. 1998. Biofiltration-technology for odour reduction from swine buildings. MN 55108. Minneapolis, Minnesota: Biosystems and Agricultural Engineering Department, University of Minesota.
Ozturk, H.H. 2005. Experimental evaluation of energy and exergy efficiency of a seasonal latent heat storage system for greenhouse heating. Energy Conversion and Management 46: 1523–1542.
Peet, M.M. and D.H. Willits. 1987. Greenhouse CO2 enrichment alternatives: Effects of increasing concentration or duration of enrichment on cucumber yield. Journal of the American Society for Horticultural Science. 112(2):236-241.
Peet, M.M. and D.H. Willits. 1984. CO2 enrichment of greenhouse tomatoes using a closed loop heat storage: Interactions with cultivar and level of nitrogen supply. Scientia Horticulturae 24(1):21-32.
Perry's chemical engineers’ handbook. 7th ed., Edited by Don W. Green; James O. Maloney.
New York: McGraw-Hill, 1997.

K. Mahmood, D.D. Mann, Q. Zhang, and A. Brule-Babel. “Perpetual Harvest Greenhouse System: Integrating Barn, Biofilter, and Greenhouse”. Agricultural Engineering International: The CIGR EJournal. Manuscript ERG 1310. Vol XI. August, 2009.
23
Phippen, W.B., T.A. Isbell and M.E. Phippen. 2006. Total seed oil and fatty acid methyl ester contents of Cuphea accessions. Industrial Crops and Products 24, 52–59.
Reinert, R.A., G. Eason and J. Barton. 1997. Growth and fruiting of tomato as influenced by elevated carbon dioxide and ozone. New Phytologist 137(3): 411-420.
Robertson, D.S. 2006. Health effects of increase in concentration of carbon dioxide in the atmosphere. CURRENT SCIENCE 90(12): 1607-1609.
Rodgers, A., D.J. Allen, P.A. Davey, P.B. Morgan, E.A. Ainswoth, C.J. Bernacchi, G. Cornic, O. Dermody, F.G. Dohleman, E.A. Heaton, J. Mahoney, E.H. Zhu, X-G. Delucia, D. R. Ort and P.S. Long. 2004. Leaf photosynthesis and carbohydrate dynamics of soybeans grown throughout their life-cycle under free-air carbon dioxide enrichment. Plant, Cell and Environment 27, 449–458.
Schapendonk, A.H.C.M., M. van Oijen, P. Dijkstra, C.S. Pot, W.J.R.M. Jordi and G.M. Stoopen. 2000. Effects of elevated CO2 concentration on photosynthetic acclimation and productivity of two potato cultivars grown in open-top chambers. Australian Journal of Plant Physiology 27, 1119–1130.
Slack, G. 1986. CO2 enrichment of tomato crops. . In: Enoch, H. Z. & Kimball, B. A. (eds), Carbon Dioxide Enrichment of Greenhouse Crops. Volume II: Physiology, Yield and Economics, Boca Raton, FL, USA. CRC-Press Inc., pp. 151-163.
Sionit, N., B.R. Strain and E.P. Flint. 1987a. Interaction of temperature and CO2 enrichment on
soybean: growth and dry matter partitioning. Canadian Journal of Plant Science 67: 59-67. Sionit, N., B.R. Strain and E.P. Flint. 1987b. Interaction of temperature and CO2 enrichment on
soybean: photosynthesis and seed yield. Canadian Journal of Plant Science 67: 629-636. Sionit, N., B.R. Strain and H.A. Beckford. 1981. Environmental controls on the growth and yield
of okra 1. effects of temperature and of CO2 enrichment at cool temperature. Crop Science 21: 885-888.
Tisserat, B., 2002. Influence of ultrahigh carbon dioxide levels on growth and orphogenesis of Lamiaceae species in soil. Journal of Herbs, Spices and Medicinal Plants 9, 81–89.
Tisserat, B. and S.F. Vaughn. 2003. Ultrahigh CO2 levels enhance loblolly pine seedling growth, morphogenesis and secondary metabolism. HortScience 38, 1083–1085.
Tiwari, G.N. 2003. Greenhouse technology for controlled environment. India: Narosa Publishing House.
Willits, D.H. and M.M. Peet. 1989. Predicting yield responses to different CO2 enrichment schemes: cucumbers and tomatoes. Agricultural and Forest Meteorology, 44: 275-293.

K. Mahmood, D.D. Mann, Q. Zhang, and A. Brule-Babel. “Perpetual Harvest Greenhouse System: Integrating Barn, Biofilter, and Greenhouse”. Agricultural Engineering International: The CIGR EJournal. Manuscript ERG 1310. Vol XI. August, 2009.
24
Wittwer, S.H. and W.M. Robb. 1964. Carbon dioxide enrichment of greenhouse atmospheres for food production. Economic Botany, 18: 34-56.
Wong, S.C. 1993. Interaction between elevated atmospheric concentration of CO2 and humidity on plant growth: comparison between cotton and radish. Vegetatio 104/105: 112-221.