Robustness of nitrifying biofilter functionality: Role of ...
99
Robustness of nitrifying biofilter functionality: Role of competition between heterotrophic and nitrifying bacteria on ammonium removal efficiency and microbial community structure Maja Fjellstad Knutsen Biotechnology (5 year) Supervisor: Olav Vadstein, IBT Co-supervisor: Ingrid Bakke, IBT Department of Biotechnology and Food Science Submission date: May 2017 Norwegian University of Science and Technology
Transcript of Robustness of nitrifying biofilter functionality: Role of ...

Robustness of nitrifying biofilterfunctionality: Role of competitionbetween heterotrophic and nitrifyingbacteria on ammonium removalefficiency and microbial communitystructure
Maja Fjellstad Knutsen
Biotechnology (5 year)
Supervisor: Olav Vadstein, IBTCo-supervisor: Ingrid Bakke, IBT
Department of Biotechnology and Food Science
Submission date: May 2017
Norwegian University of Science and Technology


I
Acknowledgements
The first person I would like to thank is my supervisor Olav Vadstein for guidance, ideas and
support. I would also like to thank my Co-supervisor Ingrid Bakke for her help and the group
Analysis and Control of Microbial Systems for interesting scientific discussions. Kjell Rune
Johansen from VEAS has also been helpful with my experiments and practical tasks outside
the University. I would also like to thank former department engineer Hege Bransegg for all
practical help in the lab. My classmates have also been important for me and they have shown
me invaluable support. My flat mates also deserve some attention. They have been there for me
and listened to my everyday frustrations and outburst of joy over my master thesis. My parents
and my two older sisters Ann-Mari and Karoline deserve a big thank you. Ann-Mari and
Karoline have been my biggest supporters the last 24 years. You have been amazing!
I am eternally grateful!
Thank you!
Trondheim, May 2017

II

III
Abstract
Removal of ammonium by nitrification in biofilm systems is a common method in wastewater
treatment. The ammonium removal efficiency in the nitrification process is influenced by the
competition between nitrifying bacteria and heterotrophic bacteria in the biofilm, particularly
for space and oxygen. The competition is affected by the ratio of organic carbon (C) to inorganic
nitrogen (N) in the wastewater, since organic carbon gives advantageous conditions for the
heterotrophic bacteria that can outcompete the nitrifying bacteria in the biofilm. The aim for
this master thesis was to improve the knowledge about the competition between nitrifying and
heterotrophic bacteria in the biofilm in order to improve ammonium removal efficiency and
functionality. Experiments were done in two different nitrification biofilm systems.
The first nitrification system investigated was for biofilm carriers in moving bed biofilm
reactors (MBBR) at the Department of Biotechnology. The hypothesis behind the MBBR
experiments was that the biofilm with long-term exposure to organic loading (C/N ratio 1)
would have reduced nitrification robustness and nitrification efficiency because of increased
heterotrophic growth compared to biofilm without long-term exposure to organic loading (C/N
ratio 0). Two MBBR were continuous operating for 2 separate periods of time and different
short-term experiments were done to investigate the differences between the reactors.
The results from the long-term continuous operations were that nitrification activity and
stability, and thus nitrification efficiency, were not decreased after long-term supply of C/N
ratio 1 to the biofilm. Acute organic carbon inhibition experiments showed decreased
nitrification efficiency in the biofilm with long-term exposure to organic loading. Increased
loading rate of organic carbon reduced the nitrification efficiency in both the reactors and
denitrification was observed. Denaturing gradient gel electrophoresis (DGGE) showed a shift
in microbial community structure after increasing the organic carbon concentrations in both
reactors.
The second nitrification system investigated was stationary biofilters consisting of Leca in
Biological Filtration and Oxygenated Reactors (BIOFOR) at Vestfjorden Avløpselskap
(VEAS) wastewater treatment plant in Asker. The hypothesis behind the study of the stationary
nitrification filters consisting of Leca particles was that the automatic washing process of the

IV
biofilters removed high amounts of heterotrophic bacteria from the outer layers of the biofilm,
but not high amounts of the nitrifying bacteria in the inner layers of the biofilm.
The results from the batch oxygen experiments showed that oxygen consumption was 4 %
higher and ammonium consumption rate was 19 % lower in unwashed biofilter compared to
washed biofilter. The difference in ammonium consumption is a strong indication that the
washing process remove heterotrophic bacteria. The DGGE analysis of microbial community
structure showed that the difference between unwashed and washed biofilter was not statically
significant.

V
Abbreviations AOA = Ammonia oxidizing archaea
AOB = Ammonia oxidizing bacteria
AT = adenine-thymine
BCs = Bray Curtis similarity
BIOFOR = Biological Filtration and Oxygenated Reactor
BSA = Bovine Serum Albumin
C = Organ carbon
C/N = Organic carbon / inorganic nitrogen
E0 = Standard reduction potential
EC50 = Half of maximum effective concentration
EDTA = Ethylenediaminetetraacetic acid
EPS = Extracellular polymeric substance
FSA = forward scattered light
GC = guanine-cytosine DGGE = Denaturing gradient gel electrophoresis
DMS= Dimethyl sulfoxide
DO = Dissolved oxygen
DNA = Deoxyribonucleic acid
H = Shannon diversity index
HRT = Hydraulic retention time
J = Jaccard Index
J` = Species evenness
K = Band richness or Species richness
Leca = Lightweight expanded clay aggregates
MBBR = Moving Bed Biofilm Reactor
mM = millimolar
min = Minutes
MVA = Multivariate analysis
N = Inorganic nitrogen
NOB = Nitrite oxidizing bacteria
OTU = Operational taxonomic unit
PCoA =Principal Coordinate Analysis
PCR = Polymerase chain reaction
PEHD = Polyethylene
R1 = Reactor 1 (with continuous C/N ratio 1)
R2 = Reactor 2 (with continuous C/N ratio 0)
RPM = Revolutions per minute
TAN = Total ammonia nitrogen (NH4+ + NH3)
TOC = Total organic carbon
VEAS = Vestfjorden Avløpselskap
v = Volume
VIS = Visible
rRNA = Ribosomal RNA
RNA = Ribonucleic acid
Q = Flow rate

VI
Table of Contents Acknowledgements ................................................................................................................................. I
Abstract ................................................................................................................................................ III
Abbreviations ........................................................................................................................................ V
1. Introduction ................................................................................................................................... 1
1.1 The need for nitrogen removal ................................................................................................ 1
1.2 Nitrification and denitrification ............................................................................................... 2
1.3 Biofilm..................................................................................................................................... 4
1.4 Competition between nitrifying and heterotrophic bacteria .................................................... 5
1.5 Bioreactors for wastewater treatment ...................................................................................... 7
1.5.1 Moving bed biofilm reactors .................................................................................................. 7
1.6 Vestfjorden Avløpselskap wastewater treatment plant ........................................................... 9
2. Aim ................................................................................................................................................ 11
3. Materials and Methods ............................................................................................................... 12
3.1 Principles behind core methods ................................................................................................... 12
3.1.1 DGGE ................................................................................................................................... 12
3.1.2 Flow cytometry ..................................................................................................................... 13
3.2 Medium composition ................................................................................................................... 13
3.3 Experimental set-ups for continuous and batch moving bed biofilm reactors ............................ 14
3.3.1 Long-term experiments in MBBR. ....................................................................................... 16
3.3.2 Short-term organic carbon inhibition experiments ............................................................... 18
3.3.3 Short-term oxygen consumption experiments ...................................................................... 19
3.3.4 Perturbations experiments: increased C/N ratio and increased organic loading to the
continuous reactors ........................................................................................................................ 20
3.4 Experimental set-up from VEAS wastewater treatment plant ..................................................... 20
3.4.1 Sampling for microbial analysis ........................................................................................... 21
3.4.2 Short term batch experiments with Leca .............................................................................. 21
3.5 Analytical methods ...................................................................................................................... 21
3.5.1 Spectrophotometer ................................................................................................................ 22
3.5.2 Analysis of inorganic nitrogen compounds .......................................................................... 22
3.5.3 Organic carbon analysis ....................................................................................................... 23
3.5.4 Flow cytometry ..................................................................................................................... 23
3.6 Microbiological community analysis .......................................................................................... 24
3.6.1 DNA extraction .................................................................................................................... 24
3.6.2 PCR ...................................................................................................................................... 25
3.6.3 DGGE ................................................................................................................................... 26
3.7 Analysis of DGGE data ............................................................................................................... 28

VII
4. Results........................................................................................................................................... 31
4.1 Long-term MBBR experiments ................................................................................................... 31
4.2 Short-term experiments ......................................................................................................... 37
4.2.1 Short-term organic carbon inhibition experiments ............................................................... 37
4.2.2 Short-term oxygen consumption experiments in batch mode .............................................. 40
4.2.3 Organic matter and oxygen consumption experiment with increased C/N ratio .................. 42
4.2.4 Ammonium consumption and oxygen concentrations after increased loading .................... 45
4.2.5 Cell and aggregate counting by flow cytometer ................................................................... 48
4.3. Diversity and structure of microbial communities in MBBR ..................................................... 50
4.3.1 Changes in microbial communities after changes in C/N ratio and loading rate ................. 50
4.3.2 DGGE analysis from the stable nitrification phases and for replicated samples. ................. 55
4.4 VEAS wastewater treatment plant: Competition between nitrifying and heterotrophic bacteria 60
4.4.1 Oxygen consumption experiment at VEAS.......................................................................... 60
4.4.2 DGGE analysis of nitrification biofilter at VEAS ................................................................ 62
5. Discussion ..................................................................................................................................... 67
5.1 Evaluation of selected methods, experimental set-up and instruments ....................................... 67
5.2 MBBR: Competition between nitrifying and heterotrophic bacteria .......................................... 68
5.2.1 Long-term MBBR experiments ............................................................................................ 68
5.2.2 Short-term organic carbon inhibition experiments ............................................................... 73
5.3 VEAS wastewater treatment plant: Competition between nitrifying and heterotrophic
bacteria .............................................................................................................................................. 75
5.4 Future works ................................................................................................................................ 77
6. Conclusions .................................................................................................................................. 79
References ............................................................................................................................................ 81
Appendix A: Experimental details MBBR ........................................................................................... I
Appendix B: Protocol for DNA Isolation ........................................................................................... II
Appendix C: DGGE ............................................................................................................................ III
Appendix D: VEAS .............................................................................................................................. V
Appendix E: Flow cytometer .............................................................................................................. VI

1
1. Introduction
In a microbial community, multiple species compete for the resources. The results of the
resource competition depend on different factors and variables (Hibbing et al., 2010). In an
artificial environment, such as inside a bioreactor for ammonium removal by biofilm growth,
some bacteria are more desirable than others. The bacteria that remove ammonium (nitrifying
bacteria) are essential, while heterotrophic bacteria are less desirable, because of the possible
negative impact on ammonium removal (Zhu and Chen, 2001). There is a resource competition
for space and oxygen between the heterotrophic and nitrifying bacteria in the biofilm (Sharma
and Ahlert, 1977). Organic carbon concentrations (C) can affect this competition and therefore
also the ammonium removal efficiency (Zhu and Chen, 2001, Sharma and Ahlert, 1977).
1.1 The need for nitrogen removal
Nitrogen removal is an important part of modern wastewater treatment (Henze et al., 2001).
Waste from agriculture, aquaculture, industrial and domestic wastewater are potential sources
containing large amounts of inorganic nitrogen (N) that may be released to aquatic systems.
Too high concentrations of inorganic nitrogen, often together with phosphorus, in aquatic
systems may cause eutrophication, acidification and acute toxic environment for aquatic
organisms (Camargo and Alonso, 2006).
Eutrophication can lead to oxygen depletion, and production of harmful toxins from algal
blooms (Camargo and Alonso, 2006). Nitrogen compounds can also be harmful for humans,
and especially infants are vulnerable. High concentrations of nitrite (NO2- ) and nitrate (NO3
-)
can cause methemoglobinemia, a condition that causes decreased oxygen transport in the blood
(Camargo and Alonso, 2006). An increase in human population requires higher food
production. Increased food production will most likely lead to higher release of reactive
nitrogen to the environment (Fields, 2004). The need for nitrogen removal from the
environment will therefore increase (Galloway and Cowling, 2002).
Various processes and techniques are used for removing nitrogen from water (Crab et al., 2007).
Biological treatment of wastewater is a widely used process that utilizes living organisms
(usually bacteria) or products from living organisms for breaking down and transforming

2
unwanted substances in the water. Activated sludge or biofilter (attached growth) are two
biological techniques often used for biological wastewater treatment (Henze et al., 2001).
Moving bed biofilm reactor (MBBR) and Biological Filtration and Oxygenated reactor
(BIOFOR) utilize biofilm growth for biofiltration of wastewater (van Kessel et al., 2010, Wien,
1995). A well-known biological method for removing nitrogen components from municipal
wastewater plants and aquaculture systems is converting ammonia (NH3) or ammonium (NH4+)
to nitrogen gas (N2) by nitrification and denitrification, respectively (Isaacs and Henze, 1995).
1.2 Nitrification and denitrification
Nitrification is the aerobic oxidation of ammonium (NH4+) to nitrate (NO3
-) by ammonia
oxidizing (AOB) and nitrite oxidizing bacteria (NOB). AOB and NOB are called nitrifying
bacteria (nitrifiers) and oxidize ammonium in a two-step process. In the first step AOB oxidize
ammonium to nitrite (NO2-) (Timmons and Ebeling, 2013). Ammonia oxidizing archaea
(AOA) also oxidize ammonium to nitrite and are a central part of the nitrification process (You
et al., 2009). In the second step, NOB oxidize nitrite to nitrate. The second step has lower kinetic
rate than the first step, and in unbalanced systems, this may lead to nitrite accumulation. A
common genus of AOB is Nitrosomonas and of NOB Nitrobacter. Equations (1.1-1.4) show
the two-step oxidation of ammonium to nitrate by Nitrosomonas and Nitrobacter (Timmons
and Ebeling, 2013, Ebeling et al., 2006a). Whether ammonia is protonated or not depends on
the pH of the wastewater. Ammonium (NH4+ ) and ammonia (NH3) exist in an equilibrium (NH3
NH4+) in water and are therefore often calculated and named as one compound (ammonia,
ammonium or total ammonia nitrogen (TAN)) in nitrification equations and calculations
(Timmons and Ebeling, 2013). Complete ammonium oxidation (commamox) in one
microorganism and not separated as for AOB and NOB, was recently confirmed to exist (Costa
et al., 2006, Santoro, 2016).

3
___________________________________________________________________________
Step 1: NH4+ + 1.5 O2 NO2
- + 2H+ + H2O (1.1)
Step 2: NO2- + 0.5 O2 NO3
- (1.2)
Sum step 1 + 2: NH4+ + 2O2 NO3
- + 2H+ + H2O (1.3)
Balanced for 1 mole NH4+: (1.4)
NH4+ + 1.83O2 + 1.97 HCO3
- 0.0244 C5H7NO2 + 0.0976 NO3- + 2.90 H2O + 1.86 CO2
___________________________________________________________________________
Nitrifying bacteria are chemolithoautotrophic and utilize energy from inorganic nitrogen
components and use carbon dioxide (CO2) as carbon source. This is unlike heterotrophic
bacteria (heterotrophs), which utilize organic carbon as energy- and carbon source (Timmons
and Ebeling, 2013). Ammonium and nitrite are weaker electron donors than organic carbon
sources such as acetate (CH3COO-) and glucose (C6H12O6). Oxidation of glucose, acetate,
ammonium and nitrite and associated E0´ (standard reduction potential) values are shown in
Equations (1.5-1.8). Weaker electron donors give lower free energy (ΔG), since E is
proportional with ΔG (Madigian et al., 2012, Helbæk and Kjelstrup, 2009). This results in lower
growth yield for the nitrifying bacteria than the heterotrophic bacteria (Zhu and Chen, 2001,
Madigian et al., 2012). As a consequence, nitrifying bacteria have up to 5 times slower growth
rate than for the heterotrophic bacteria (Grady and Lim, 1980). Factors that are important for
the nitrification process are oxygen concentration, temperature, pH and water quality, where
substrate and oxygen concentration are the two most important factors (Timmons and Ebeling,
2013). Oxygen concentrations below 2 mg/L are limiting for the nitrification process and can
contribute to accumulation of nitrite (Goreau et al., 1980, Painter, 1986).
C6H12O6 + 6O2 6CO2 + 6H2O E0´ 0.82 - (-0,43) = 1.25 (1.5)
CH3COOH + 2O2 2CO2 + 2H2O E0´ 0.82 - (-0.28) = 1.10 (1.6)
NH4+ + 1.5O2 NO2
- + H2O + 2H+ E0´ 0.82 - (+0.43) = 0.48 (1.7)
NO2- + 2H+ + O2
NO3
- + H2O E0
´ 0.82 - (+0.34) = 0.39 (1.8)

4
For removal of high amounts of nitrate in the wastewater, the nitrification process is connected
to the denitrification process in the biological treatment step. Denitrifying bacteria is a large
group of facultative aerobic heterotrophic bacteria and facultative aerobic autotropic bacteria
that stepwise reduce the metabolic end-product (nitrate) from nitrifying bacteria to nitrogen gas.
The denitrification step is either before (pre-denitrification) or after (post-denitrification) the
nitrification step in a wastewater plant. Optimal conditions for denitrifying bacteria are low
oxygen and high organic carbon concentrations (Timmons and Ebeling, 2013). The
heterotrophic denitrification reaction is shown in Equation (1.9) (Bruce and Perry, 2001). An
anaerobic process for removing ammonium and nitrite from wastewater and converting it to
nitrogen gas is carried out by Annamox (anaerobic oxidation of ammonium) bacteria. Annamox
bacteria reduce nitrite and oxidize ammonium to nitrogen gas (Kuenen, 2008). The anammox
reaction is shown in Equation (1.10) (Strous et al., 1998).
5 CH3COO- + 8 NO3- 3H+
10 HCO3- + 4N2 (g) + 4 H2O (1.9)
(1.10)
NH4+ + 1.32 NO2
- + 0.066 CO2 + 0.13 H+ 1.02 N2 + 0.26NO3- + 2.03 H2O + 0.066 CH2O0.5 + N0.5
1.3 Biofilm
Biofilm is a structure attached to a surface consisting of microorganisms and extracellular
polymeric substances (EPS), that has been utilized for wastewater treatment for a long time.
(Flemming et al., 2016, Donlan, 2002). Biofilm consists of several layers, and the structure is
highly heterogeneous. Nutrients and oxygen are transported through water channels by
diffusion to layers further down in the biofilm (Donlan, 2002). Biofilms are not unchangeable,
both the structure and function will change with environmental changes (Flemming et al.,
2016). For example, increased access to nutrients such as nitrogen and carbon contributes to
increased biofilm thickness and a shift in the microbial community structure (Stoodley et al.,
1998, Hu et al., 2009). Gradients of species, nutrients, oxygen and pH exist in the biofilm
(Flemming et al., 2016).
Biofilm is advantageous for microorganisms for several reasons. Biofilm gives good utilization
of extracellular enzymes and effective nutrient sorption from the surroundings. Microorganisms
that are living in a biofilm are better protected from being washed out from a system compared

5
to planktonically living microorganism. Cooperative species exist closely in the biofilm, like
AOB and NOB that have a mutualistic relationship. NOB utilize the metabolic end-product
(nitrite) from AOB (Flemming et al., 2016). Nitrite is toxic for AOB and NOB remove nitrite
from AOB (Cua and Stein, 2011). Some NOB provide ammonium to AOB (Flemming et al.,
2016). A disadvantage of living in a biofilm is limited substrate access for the microorganisms
in the deeper layers, because the organisms in the outermost layers consume substrates faster
than the diffusion rate transports the substrates (Flemming et al., 2016, Madigian et al., 2012).
Oxygen can penetrate to the bottom of the biofilm if the thickness is less than 300 µm
(Pawlowski et al., 2007). Limited diffusion in the deepest layers reduces the growth rate for
microorganisms living there and oxygen is thus often a limiting substrate in the deeper layers
of the biofilm (Flemming et al., 2016, Madigian et al., 2012). Therefore are denitrifying often
found in layers down in the biofilm compared to the nitrifying bacteria and other type of
heterotrophic bacteria (Pawlowski et al., 2007). Substrate diffusion under 100 µm depth in the
biofilm is often incomplete (Rusten et al., 2006).
1.4 Competition between nitrifying and heterotrophic bacteria
Even though heterotrophic and nitrifying bacteria utilize different energy sources, organic
carbon and nitrogen components respectively, there is a resource competition for space, oxygen
and essential substances in the biofilm (Sharma and Ahlert, 1977). In a resource-limited
environment, like inside the biofilm, heterotrophic bacteria can outcompete or overgrow the
nitrifying bacteria (Figueroa and Silverstein, 1992, Cheng and Chen, 1994, Ohashi et al., 1995).
Various factors affect the competition between heterotrophic and nitrifying bacteria. The C/N
ratio, i.e. the ratio between organic carbon and ammonia, is a relevant factor, since high loading
of organic carbon gives advantageous conditions for the heterotrophic bacteria (Zhu and Chen,
2001, Sharma and Ahlert, 1977). Increased C/N ratio can have acute or long-term consequences
for the competition between heterotrophic and nitrifying bacteria in the biofilm. Increased
competition for oxygen can be an acute event, while decrease in nitrifying bacteria populations
can be a long-term consequence (Satoh et al., 2000, Zhu and Chen, 2001, Ohashi et al., 1995).
Changes in C/N ratios can lead to a shift in the microbial community structure of the biofilm,
since heterotrophic bacteria populations will increase at the expense of others species. The
proportion of AOB and NOB will decrease under high C/N ratios, and as a consequence of

6
fewer nitrifying bacteria in the biofilm, the nitrification activity will decline (Ohashi et al.,
1995). Shift in microbial community structure from a large proportion of nitrifying bacteria to
a large proportion of denitrifying bacteria has been shown after C/N ratio was increased (Hu et
al., 2009). If the substrate conditions are changed (C/N ratio drops) and the oxygen
concentration is increased, the nitrifying bacteria will most likely increase in number again
(Almasi et al., 2016).
Acute increase in competition can result in oxygen deficiency. It has been shown that increased
C/N ratios instantly started the competition for oxygen between the heterotrophic bacteria and
the AOB in the outer layers of the biofilm. As a consequence, the AOB were inhibited and the
ammonium removal rate decreased (Satoh et al., 2000). The inhibitory effect organic carbon
has on AOB will decrease with increasing C/N ratio. Increasing organic carbon concentrations
contribute to increasing heterotrophic growth until a maximal growth rate (saturation point) is
reached. Further increase of C/N ratio after the saturation point is reached will only give a minor
increase in inhibition of the nitrification process (Hu et al., 2009). NOB are also negatively
affected of increased C/N ratios, since increased C/N ratios can contribute to low oxygen and
nitrite concentrations inside the biofilm. Nitrite accumulation is often observed, and an
explanation has been that NOB generally have lower affinity towards oxygen than AOB (Hu et
al., 2009).
Even if the inlet in a reactor contains zero organic carbon, heterotrophs can still grow in the
biofilm. Heterotrophic bacteria can utilize organic carbon from dead organisms (Zhu and Chen,
2001). Inhibitory substances for the heterotrophic bacteria are also often inhibitory substances
for the nitrifying bacteria (Gerardi, 2016, Zhu and Chen, 2001). Increased organic loading can
also contribute to nitrogen loss, since high growth of heterotropic bacteria increase the need for
nitrogen for protein syntheis inside the cells (Ebeling et al., 2006b).
Measurements of oxygen concentration over time can give an indication of microbial
population size or microbial growth, since metabolic activity is related to bacteria population
size (Pommerville, 2004). Oxygen consumption for the heterotropic bacteria populations is
often high since hetrotrophic bacteria have higher growth rate and often are higher in number
in the biofilter than nitriying bacteia (Blancheton, 2000, Zhu and Chen, 2001). NOB can also
have increased oxygen consumption after addition of organic carbon sources as acetate, since

7
some NOB are mixotrophic and can utilize acetate as carbon source (Ginestet et al., 1998,
Watson et al., 1989).
1.5 Bioreactors for wastewater treatment
A bioreactor is a biological system in a container or tank where different variables can be
controlled to achieve a favourable active environment and are often used for wastewater
treatment. Temperature, pH, substrate concentration, retention time, oxygen concentration,
pressure, stirring and volume are examples of parameters for controlling the conditions inside
the reactor. Bioreactor systems can be divided into three groups: Batch, fed-batch, and
continuous reactors (Doran, 2012). Hydraulic retention time (HRT) is the average time liquid
spends inside a continuous reactor. HRT is defined by Equation (1.11) where v is the volume
of a reactor and Q is the influent flow rate (Singh et al., 2015).
𝐻𝑅𝑇 = 𝑣
𝑄 (1.11)
HRT can affect the competition between the microorganisms in the biofilm and the
microorganisms living planktonic in the reactor. High HRT is advantageous for planktonic
growth. Short HRT is advantageous for attached bacteria in the biofilm, because planktonic
bacteria will be washed out when HRT is shorter than the generation time. As a consequence,
the microbial communities between planktonic and biofilm are bigger at high HRT than at low
HRT (Caylet et al., 2011).
1.5.1 Moving bed biofilm reactors
A well-known method used in biological wastewater treatment is moving bed biofilm bioreactor
(MBBR). The MBBR system was designed in Norway and is patented by AnoxKaldnes. MBBR
is based on small plastic carriers consisting of polyethylene (PEHD) designed for biofilm
growth. The small plastic carriers are continuously moving inside the reactor. The movements
of the biofilm carriers are created by air bubbles in aerobic systems or a mixer in anaerobic or
anoxic systems (Rusten et al., 2006). An illustration of movements of biofilm carriers is shown
in Figure 1.1.

8
Figure 1.1 An illustration of MBBR technology by using aeration and a mixer for keeping the
biofilm carriers in continuous movement in the reactor. The illustration is taken from Rusten et
al. (2006)
The continuous movements of biofilm carriers from mixing and aeration create turbulence in
the reactor. Turbulence contributes to transport substrates and oxygen into the biofilm, but also
to limit the biofilm thickness. Too thick biofilm prevents diffusion of substrates into the biofilm
and waste out from the biofilm. A thin biofilm is a key factor for optimal functioning of MBBR
technology, since the penetration capabilities of substrates are usually limited in biofilms with
a thickness over 100 µm. To avoid wash out of the biofilm carriers, a filter is located at the
outlet of the reactor. Filling ratio (volume carrier/ volume reactor) should not exceed 70 %
(Rusten et al., 2006). Neither backwashing of the biofilter or return of biomass are necessary in
MBBR (Odegaard et al., 1994). The disadvantage of MBBR is the need of energy for
continuously movement of the carriers (Rusten et al., 2006).
Biofilm carriers from AnoxKaldnes exist in different designs, shapes and sizes. The model K1
is often used in MBBR. K1 (Kaldnes carrier) has a cylindrical form, length of 7 mm, density of
0.95 g/cm3 and a diameter of 10 mm. Biofilm carriers with and without biofilm growth are
shown in Figure 1.2. The outside of the KI is covered by vertical ridges, while on the inside KI
is divided into four identical chambers (Odegaard et al., 2000). The biofilm growth is
significantly higher on the inside of the biofilm carrier, compared to the outside of the biofilm
carrier, as the biofilm on the inside is more protected from external stress sources than biofilm
on the outside. (Rusten et al., 2006).

9
.
Figure 1. 2 K1 biofilm carrier with (b) and without (a) biofilm growth. The illustration is taken
from Herrling et al. (2015)
1.6 Vestfjorden Avløpselskap wastewater treatment plant
Vestfjorden Avløpseskap (VEAS) wastewater treatment plant is an intermunicipal company for
wastewater treatment for 600 000 citizens in Bærum, Oslo and Asker (VEAS, 2016). An
illustration of the wastewater plant is shown in Figure 1.3. VEAS removes nitrogen from the
wastewater by nitrification and denitrification. The wastewater reaches the nitrification step
before the denitrification step. VEAS uses the BIOFOR (Biological Filtration and Oxygenated
Reactor) system that consists of upstream bioreactors with stationary biofilters made from Leca
(lightweight expanded clay aggregates) particles (Wien et al., 1995). The biofilm is growing on
Leca particles (Mao et al., 2008). In the nitrification step, both air and wastewater arrive from
the bottom of the reactors. Leca particles have, beside biofilm attachment, a mechanical
filtration function for removal of suspended solids from the wastewater (Wien et al., 1995,
Wien, 1995). Leca particles have a density of 1.24 g/mL and the diameter varies between 3-5
mm.
The BIOFOR process needs backwashing for proper functioning, since sludge and suspended
solids will accumulate in the reactors over time (Wien, 1995). Every 14 hours, or more
frequently, there is a need for an automatic backflush of the nitrification filters (Mao et al.,
2008). The washing process creates wash water that is transported to the inlet of the plant for
another round through the plant (Wien, 1995). Previous experiments have shown that there are
high heterotrophic activity and high denitrification activity in the nitrification filters (Mao et
al., 2008). There are 6 BIOFOR units with a medium volume of 800 L and with a medium depth

10
of 4,1 m that operate in parallel at VEAS (Wien, 1995). Ammonia concentration that reaches
the biofilter varies between 0.5-2 mM. A considerable amount of organic carbon also reaches
the nitrification filter and the total organic carbon (TOC) in the wastewater varies between 35-
45 mg/L. Average flow (Q) is 160 L/s and average HRT is 25 min in the nitrification filters
(Mao et al., 2008).
Figure 1.3 Illustration of wastewater treatment with nitrification and denitrification step at
VEAS. The illustration is taken from Wien (1995).

11
2. Aim
The aim for this master thesis was to improve the knowledge about the competition between
nitrifying and heterotrophic bacteria in order to improve ammonium removal efficiency and
functionality. For this, two different biofilm systems used for nitrification were studied, MBBR
and BIOFOR, but with the main focus being on the MBBR system.
The hypothesis behind the MBBR experiments at the Department of Biotechnology (NTNU)
was that biofilm with long-term exposure to organic loading (C/N ratio 1) would have reduced
nitrification robustness and nitrification efficiency because of increased competition with
heterotrophic bacteria compared to biofilm without long-term exposure to organic loading (C/N
ratio 0). Decreased nitrification robustness against changes in C/N ratio and organic loading
would influence nitrification efficiency, oxygen consumption and microbial community
compositions in the reactors. The following methods and experiments were used to investigate
the hypothesis:
Long-term and short-term organic carbon exposure experiments
Organic carbon inhibition experiments
Oxygen and organic carbon consumption experiments
Microbial community structure characterization with DGGE
The hypothesis behind the nitrification biofilter experiment in the BIOFOR system at VEAS
was that high amounts of heterotrophic bacteria exist in the outer layers of the biofilm and most
of the nitrifying bacteria exist in the inner layers of the biofilm. An automatic washing process
of the biofilters will therefore remove high amounts of heterotrophic bacteria from the outer
layers of the biofilm and not all of the nitrifying bacteria in the inner layers of biofilm, which
result in stable nitrification due to reduced competitions with heterotrophs. The following
methods and experiments were done on washed and unwashed biofilter to investigate the
hypothesis:
Short-term batch experiments to investigate oxygen consumption and ammonia removal
rate
Microbial community structure characterization with DGGE

12
3. Materials and Methods
3.1 Principles behind core methods
Principles behind the two methods DGGE and flow cytometry are explained briefly in 3.1.1
and 3.1.2 respectively. DGGE was done for analysis of microbial community structure and flow
cytometry was done for cell counting.
3.1.1 DGGE
Denaturing gradient gel electrophoresis (DGGE) is an electrophoresis technique often used for
analysing variations in DNA content in microbial communities. DNA amplification by PCR is
done before DGGE and the 16S rRNA gene from bacteria is used as primer (Green et al., 2010).
The region V3 in the 16S rRNA gene is a highly variable region and nucleotide sequences from
this region is often used in biodiversity analysis (Klammer et al., 2008, Ziembinska-Buczynska
et al., 2014). The universal primers 338F-GC and 518R are primers for the region V3 in 16S
rRNA in E.coli and are often used for PCR before analysis of bacterial communities by DGGE
(Cocolin et al., 2001, Ceuppens et al., 2015).
In traditional agarose gel electrophoresis, DNA fragments are being separated based on the
difference in fragment length as the fragments migrate through the gel to the positive anode
(Lee et al., 2012). In DGGE, DNA fragments are separated based on difference in DNA
sequence as fragments of similar length migrate through the gel (Green et al., 2010). The
DGGE gel consists of polyacrylamide and has an increasing gradient of a denaturing agent
which complete or partially denature double stranded DNA fragments to single stranded DNA
fragments. Formamide and urea are commonly used as denaturing agents in DGGE. Double
stranded DNA fragments with different nucleotide sequence are separated during the migration
through the gel. The difference in the number of hydrogen bonds between the base pairs in the
DNA fragments contributes to the separation. A DNA fragment with a high content of guanine-
cytosine (GC) base pairs will migrate longer through the gel before denaturation than a DNA
fragment with a high content of adenine-thymine (AT) base pairs, since GC bonds are stronger
than AT bonds. DGGE is suitable for analysing multiple samples. After the electrophoresis is
finish, selected DGGE bands may be cut out from the gel and further analysed by sequencing
of 16S rRNA from the samples (Green et al., 2010).

13
The 338G-GC primer has a GC-clamp fastened at the 5`-end of the primer. GC-clamp is a DNA
sequence consisting only of guanine-cytosine base pairs, typically between 30-50 base pairs
long. Primers with GC-clamps transfer GC rich sequence to DNA fragments during PCR. The
result is PCR fragments with greater ability to resist complete denaturation under increasing
concentration of formamide and urea. A GC-clamp contributes to incomplete denaturation of
double stranded DNA. The GC-clamp is therefore important for separation of bands and
formation of the band pattern on the DGGE gel (Sun et al., 2015).
3.1.2 Flow cytometry
Flow cytometer (FCM) is an analytical instrument used to analysing samples containing a high
number of cells. Typical microbiological applications are cell counting and DNA analyses
(Picot et al., 2012). Flow cytometry uses hydrodynamic focusing to individually analyse single
cells. The cells need to be in a working solution before injection into the sheat solution inside
the flow cytometer (Picot et al., 2012). The DNA content in the cells are stained by a fluorescent
dye before the analysis (Darzynkiewicz et al., 2010).
The principle behind hydrodynamic focusing is pressure difference between a sheat solution
with high flow rate and a working solution with slow flow rate (Austin Suthanthiraraj and
Graves, 2013, Kachel et al., 1990). The cells in a working solution are forced by the sheat
solution to migrate towards the centre of the flow channel and further inside a narrow channel.
From passing as a bunch of cells, the cells are forced to pass one by one in the centre of a narrow
flow channel. Excitation wavelengths from one or more lasers hit the cells one by one.
Emissions from stained the cells and scattered light are detected consecutively. The light signals
are translated and analysed by a software program (Picot et al., 2012).
3.2 Medium composition
The medium used for all biofilm experiments, including experiments at VEAS, was made from
macronutrients, micronutrients (stock solution) and MQ-water (Reagent water system,
Millipore Corporation, France). The ammonium concentration in the medium was 100 mg/L
NH4+-N. The amounts of macronutrients used in 1 L medium were 1.00 g NaHCO3, 0.47 g
(NH4)2SO4 and 0.40 g K2HPO4. In the short-term organic carbon inhibition experiments (section

14
4.2.1), the ammonium concentration in the medium was halved from 100 mg/L NH4+-N to 50
mg/L NH4+-N, and 0.236 g/L (NH4)2SO4 was added.
C/N ratios were calculated from mole ratios (C2H3NaO2-C to NH4+-N mole ratio). For C/N ratio
1, 0.293 g/L C2H3NaO was added. For C/N ratio 3, 0.878 g/L C2H3NaO2 was added. 10 mL of
stock solution was added per 1 L of medium. The amounts of micronutrients in 10 mL stock
solution were 2.5 g MgSO4-7H2O, 1.5 g CaCl2-2H2O, 0.2 g FeCl2-4H2O, 0.55 g MnCl2-4H2O,
0.068 g ZnCl2, 0.12 g CoCl-6H2O, 0.12 g NiCl2-6H2O and 2.8 g EDTA.
3.3 Experimental set-ups for continuous and batch moving bed biofilm
reactors
Experiments in lab scale moving bed biofilm reactors (MBBR) were done at Department of
Biotechnology (NTNU). MBBR experiments were divided into long-term experiments
(continuous experiments) and short-term experiments. In the long-term experiment, two MBBR
with different C/N ratio were operated continuously. The reactors will from this point be
referred to as reactor 1 (R1) and reactor 2 (R2). A schematic overview over the experimental
design is shown in Figure 3.1. The short-term experiments were performed in two different
ways; Biofilm carriers were either removed from the continuous operating reactors and
transferred to batch reactors, or the conditions were changed in the long-term reactors and the
consequences of the changes were measured for a limited period.
The MBBR experiments were conducted in two jacketed glass reactors (Schott Duran,
Germany) with volume 0.7 L in the first period and 0.6 L in the second period. Biofilm plastic
carriers (AnoxKaldnes, type K1) were added to a 50 % filling ratio (volume carriers/volume
reactor). Biofilm carriers used in the experiments were given from two nitrification MBBR used
in Environmental Biotechnology (TBT4130) lab course spring 2016. The biofilm carriers were
in 1 month fed with a medium containing 50 mg/L NH4+-N (C/N ratio 0, HRT = 12 hours) in
the lab course.
Poly Stat circulating water bath (Cole Parmer, USA) was used as temperature control in reactor
1, while VWR circulating water bath (VWR International, USA) was used for temperature
control in reactor 2. The water baths were set to 25oC and connected to the jacketed glass
reactors. Silicone stoppers with 8 holes (various diameter) were used as covers. Two separate

15
pH controllers (Bluelab Corporation Ltd., New Zealand) for acid and base were used to regulate
the pH. pH was set to 7.4 and pH probes were connected to the reactors through the silicone
stopper. 0.5 M HCl and 0.5 M NaOH were used for automatically pH adjustment.
Aeration in the reactors was maintained by compressed air and an air stone. The oxygen
concentration was measured by an oxygen electrode (Oxi 3351, WTW, Germany) or a Micro
Fiber Optic Trace Oxygen Transmitter (PreSens, Regensburg, Germany). A magnetic stirrer
and magnet were used for mixing of the medium and the biofilm carriers. Magnetic stirring was
set to 300 rpm. The medium was kept in a 10 L or 20 L polypropylene autoclavable carboy with
a 3 inlets polypropylene cap (Thermo Fisher Scientific, USA). A 0.2 μm membrane filter for
avoiding vacuum and a silicone tubing (8 mm in diameter, VWR) for medium supply were
connected to the cap. The medium (inlet) was pumped to the reactors by using Masterflex easy
load L/S pump (Cole Parmer Instrument Company, USA). The glass reactors were covered by
aluminium foil for avoiding light into the reactors. The outlet was transported from the reactors
to a 25 L waste container by a silicon tubing (25 mm in diameter, VWR). The short-term batch
experiments were carried out with the same equipment as the long-term experiments except
with the medium pump off, unless otherwise is stated in the text.

16
Figure 3.1 Illustration of a continuous MBBR reactor used in the long-term experiments.
3.3.1 Long-term experiments in MBBR.
The difference in nitrification activity and thus ammonium removal efficiency after long-term
exposure to different C/N ratios were investigated in two nitrification MBBR. Experimental
set-ups were identical between the reactors, but medium compositions were different. Biofilm
carriers in reactor 1 (R1) were continuous fed with medium containing sodium acetate as carbon
source (C/N ratio 1). Biofilm carries in reactor 2 (R2) were continuous fed with medium without
an organic carbon source (C/N ratio 0). In the final parts of the long-term experiments medium
composition were identical in both reactors.

17
Long-term MBBR experiments were running during two time periods. The first period (1.
period) was March 2016-Mai 2016 (37 days) and the second period (2. period) was September
2016- February 2017 (152 days). During the summer, the biofilm carriers were stored in a
freezer (-20oC).
In the whole first period and in the second period until day 139, the hydraulic retention time
(HRT) was 13 hours for both reactors. In reactor 1, the C/N ratio was 1 in the first period and 1
in the second period until day 130. In reactor 2, the C/N ratio was 0 in the first period and 0 in
the second period until day 130. For both reactors, the C/N ratio was increased to 3 at day 131
in the second period. On day 139 in the second period, the loading rate to the biofilms was
increased by lowering the HRT to 6.5 hours (i.e. flow rate increased) in both the reactors. The
changes in C/N ratio and loading rate to the long-term continuous experiments were named
perturbations experiments and are explained further in section 3.3.6. The level of ammonium,
nitrite and nitrate were measured every 2-4 days (with few exceptions).
Acetate and oxygen concentrations were measured in selected periods. A schematic overview
over experimental design is shown in Figure 3.2.
Figure 3.2: Schematic overview of experimental variables for reactor 1 (R1) and reactor 2
(R2). HRT (hours) was the same in both reactors in both periods.
2. period ( day 131-152)R1
C/N = 3HRT = 6.5 from day
139
R2
C/N = 3
1. period (day 3-130)
R1
C/N = 1 HRT = 13
R2
C/N = 0
Biofilm carriers stored in -20oC
1. period (37 days)
R1
C/N = 1HRT = 13
R2
C/N = 0

18
Biofilm carriers from long-term continuous experiments were sampled in the first period at day
17, 30, and 37. In the second period, biofilm carries were sampled at day 1,3 43, 55, 95, 104,
118, 125, 127, 130, 137, 145, 148 and 152. Overview of carriers and water samples and short-
term experiments are shown in Figure 3.3.
Figure 3.3 Overview of the biofilm carriers and water samples, experimental conditions and
short-term experiments. Short-term organic carbon inhibition experiments were conducted at
day 37 in the first period and at day 99 in the second period. Short-term oxygen consumption
experiments were conducted at day 89-91 in the second period. The C/N ratio was increased at
day 131 in the second period and the loading rate (increased flow) was increased at day 139 in
the second period.
3.3.2 Short-term organic carbon inhibition experiments
Short-term organic carbon inhibition experiments were carried out in two MBBR in batch
mode. The objective of the experiments was to investigate whether there was any difference in
nitrification activity, and thus nitrification robustness, towards increasing the concentration of
organic carbon between the biofilm carriers in the reactors operating in long-term continuous
experiments. The biofilm carriers in reactor 1 had been continuously fed with medium
containing acetate as the carbon source (C2H3NaO2). Biofilm carriers in reactor 2 had been fed
Time [days]
Biofilm samples
Water samples
Organic carbon
inhibition
experimentOxygen
consumption
experimentFirst period
Second period
Increased C/N
ratio
Increased loading
rate
Start and end

19
with medium without an organic carbon source. 100 mL of carriers were removed from the
long-term MBBR reactors and transferred to two batch reactors at day 37 in the first period and
day 99 in the second period. Both experiments were conducted with aeration, temperature
control and magnetic stirring as in the long-term experiments.
Acetate concentrations in ascending order used at day 37 in the first period were: 0 mM, 3.16
mM, 10 mM, 31.6 mM and 100 mM. At day 99 in the second period the acetate concentrations
used in ascending order were: 0 mM, 10 mM, 31.6 mM, 100 mM, 316 mM and 1000 mM. The
experiments started with 500 mL medium containing 0 mM. Each concentration was monitored
every 30 minutes for 3 hours before replaced by a higher concentration of acetate. The
programme REGTOX: macro Excel dose-response modelling (Vindimian, 2003) was used for
modelling the results of increasing acetate concentrations effect on nitrification activity (dose-
response).
3.3.3 Short-term oxygen consumption experiments
Short term oxygen consumption experiments were carried out in two MBBR in batch mode on
days 89- 90 in the second period to determine whether there were any differences in the oxygen
consumption rate between the biofilm from reactor 1 and reactor 2. Biofilm carriers in reactor
1 had continuously been fed with medium containing sodium acetate as carbon source (C/N
ratio 1). Reactor 2 had been fed with a medium without an organic carbon source (C/N ratio 0).
100 mL biofilm carriers were taken out from the long-term MBBR reactors on day 89-90 in the
second period and transferred to two MBBR batch reactors containing 500 mL medium. The
first experiment was conducted without carbon source in the medium (C/N ratio 0). The second
experiment was conducted with acetate as the carbon source in the medium (C/N ratio 1). The
experiments were conducted with temperature control and magnetic stirring as in long-term
experiments. The amount of dissolved oxygen in the reactors was measured by Micro Fiber
Optic Trace Oxygen Transmitter (PreSens, Regensburg, Germany). Oxygen concentration was
measured every 5 minutes for 6 hours. For control, the ammonium concentration was measured
every 60 minutes for 6 hours for the first batch experiment (C/N ratio 0) and for 5 hours for the
second experiment (C/N ratio 1).

20
3.3.4 Perturbations experiments: increased C/N ratio and increased organic loading to the
continuous reactors
The C/N ratio was increased to 3 on day 131 in the second period in both the continuous reactors
to investigate the response to increased supply of organic carbon for the continuous reactors.
The experiment was carried out in the original long-term glass reactors and the new C/N ratio
was kept throughout the second period (days 139-152) in both the reactors. 1 L of the new
medium (C/N ratio 3) was pumped into two glass beakers in advance. When the experiment
started, the liquid in the reactors was replaced by the new medium (C/N ratio 3) in the glass
beakers. The idea behind this was to attain an accurate starting point for the new C/N ratio. The
ammonium, nitrite, nitrate, organic carbon and oxygen concentrations were measured every 60
minutes for 9 hours. The organic carbon and oxygen concentrations were again measured 24
hours after the beginning of the experiment.
The loading rate was increased (doubled flow rate) at day 139 in the second period to investigate
if there were any differences in the responses to increased loading rate between the continuous
reactors. The HRT was decreased from 13 to 6.5 hours. The experiment was carried out in the
original long-term glass reactors and new loading rate was kept throughout the second period
(days 139-152). The ammonium, nitrite, nitrate and oxygen concentration were measured every
60 minutes for 8 hours. The concentration of organic carbon was measured every 60 minutes
for 4 hours. The ammonium, nitrite, nitrate, and oxygen concentrations were again measured
24 hours after the beginning of the experiment.
3.4 Experimental set-up from VEAS wastewater treatment plant
A short-term batch experiment and sampling for microbial analysis were performed at
Vestfjorden Avløpselskap wastewater treatment plant (VEAS) in Asker to investigate the
competition between heterotrophic bacteria and nitrifying bacteria. The hypothesis behind the
experiments and analysis was that high amounts of heterotrophic bacteria exist in the outer
layers of the biofilm, while most of the nitrifiers exist in the inner layers of the biofilm. An
automatic washing process of Leca biofilters will therefore remove high amounts of
heterotrophic bacteria, while most of the nitrifiers will remain in the biofilm.

21
3.4.1 Sampling for microbial analysis
Samples to microbial analysis were taken before and after a washing process in various
nitrification filters (NF) at VEAS. Samples were taken with a long stick (8 m) with a small
samplings box at the end, by employees at VEAS. Samples from unwashed biofilters were taken
before the washing process started and as long as possible after the last wash. Samples from
washed biofilters and wash water were taken quickly after the washing process was finished.
Samples were rinsed gently with water and stored in a freezer (-20oC). Water samples (wash
water) were taken from the top of the nitrification filters at the end of the washing process and
stored in a freezer (-20oC). A cooling bag with cooling elements was used to transport the
samples from VEAS to NTNU, where the samples were put in a freezer and subsequently
analysed.
3.4.2 Short term batch experiments with Leca
Leca from unwashed and washed filters was rinsed gently and transferred to two 1 L beakers.
Leca was added to a 15 % filling ratio (volume Leca/volume beaker). The nitrogen
concentration in the medium was 100 mg/L NH4+-N, while the C/N ratio was 1. A magnetic
stirrer was used for stirring. In addition, manual stirring of Leca was performed with a spoon
before each sampling. For temperature control, a 10 L bucket was filled with 5 L water (15oC)
and used as a water bath. Water samples for oxygen measurements were taken every 10 minutes
and were put back into the batch after each measurement. The oxygen concentration was
measured with a self-stirring dissolved oxygen sensor (StirrOx, WTW). Samples for ammonia,
nitrite and nitrate analyses were taken every 15 minutes. The average temperature in the
nitrification filters during sampling and the batch experiments was 14.8oC. In the sampling
period, the average total organ carbon (TOC) in the wastewater that reached the filters was 25.6
mg/L, while the average total Kjeldahl nitrogen (TKN) was 27.7 mg N/L.
3.5 Analytical methods
Water samples from the MBBR at the Department of Biotechnology (NTNU) and wash water
from the nitrification filters at VEAS in Asker were taken with a 10 mL syringe (Soft-Ject,
Henke sass wolf, Germany). The water samples were filtered by a 0.45 μm polyethersulfone
membrane syringe filter (VWR International, USA) and transferred to 5 mL glass beaker before
further chemical analysis.

22
3.5.1 Spectrophotometer
For chemical analysis of the water samples, a DR 3900 Benchtop VIS spectrophotometer and
a DR 2800 Portable spectrophotometer were used at the Department of Biotechnology (NTNU)
and at VEAS in Asker, respectively. The wavelength resolution was 1 nm in both
spectrophotometers. Calibration of wavelengths and wavelengths selection was performed
automatically by the instruments. Each cuvette had a label (LCK xxx) and was marked with a
barcode for quick detection of correct analysis programme and measurement. Only original
cuvettes from Hach Lange kit were used for analysis. When the nitrogen concentration in the
water sample exceeded the concentration range in the Hach Lange kits, the samples were diluted
with MQ-water.
3.5.2 Analysis of inorganic nitrogen compounds
The concentration of ammonium, nitrite and nitrate in the water samples were analysed with
Hach Lange kits of high and low concentration range as the concentration varied in the medium
and in the reactors (Table 3.1). For ammonium and nitrite analyses, the filtered sample was
added to the cuvette and the DosiCap (cuvette cap with powder) was turned upside-down and
tightened before the cuvette was shaken repeatedly. For nitrate analysis, the filtered sample and
an extra solution (A LCK 339 or A LCK 340) were added to the cuvette before the cuvette was
inverted several times. After incubation in a specific period of time, the cuvettes were analysed
in the spectrophotometer (Table 3.1).
Ammonium (NH4+) and ammonia (NH3) exist in an equilibrium (NH3 NH4
+), and are
therefore often calculated and named as one compound: total ammonia nitrogen (TAN). In pH
7.4, the largest part of TAN is ammonium, which is why the term ammonium is used further in
this thesis.
Table 3.1 Detailed information about Hach Lange kit cuvettes
Label Test for Range
(mg/L)
Sample
added (mL)
Extra solution
(mL)
Mixing
method
Incubation
time (min)
LCK 304 NH4+-N 0.015-2.0 5 No Shake 15
LCK 303 NH4+-N 2-47 0.2 No Shake 15
LCK 341 NO2-- N 0.05-0.6 2 No Shake 10
LCK 342 NO2-- N 0.6-6.0 0.2 No Shake 10
LCK 339 NO3-- N 0.23-13.5 0.2 A LCK 339 Invert 15
LCK 340 NO3-- N 5-35 0.2 A LCK 340 Invert 15

23
3.5.3 Organic carbon analysis
The concentration of organic acids was measured by an organic acids kit (LCK 365) containing
cuvettes and 4 extra solutions (A, B, C & D). The concentration range of the organic acids kit
was 50-2500 mg/L for CH3COOH and 75-3600 mg/L for C3H7COOH. 0.4 mL of solution A
and 0.4 mL of the water sample were added to the cuvette. The cuvette was inverted repeatedly
and heated in a dry block heater (Grant QBD2, Grant Instruments, Cambridge, UK) at 100oC
for 10 minutes. The cuvette was cooled down to room temperature (18-22oC) before 0.4 mL of
solution B, 0.4 mL of solution C and 2 mL of solution D were added to the cuvette. The cuvette
was inverted repeatedly between every addition of liquid. After incubation (3 minutes), the
cuvette was analysed by the spectrophotometer. Acetic acid (CH3COOH) exist in an
equilibrium with acetate (CH3COO-). The term acetate is used further in this thesis.
3.5.4 Flow cytometry
The number of cells in the water samples from the MBBR were investigated in a flow
cytometer. Water samples from reactor 1 and reactor 2 were taken on days 125, 127, 130, 137,
145, 148 and 152 in the second period. The water samples from day 137, 144, 147 and 150
were taken after the C/N ratio had been increased in both reactors, and for the water samples
from day 144, 147 and 150 the loading rate (decreased HRT) had been increased in both reactors
as well. The samples were fixated shortly (max 30 minutes) after sampling. 990 μL sample and
10 μL Glutaraldehyde (50% in H2O) were added to 2 mL polypropylene Cryo.S cryogenic tubes
(Greiner Bio-One, Frickenhausen, Germany) and gently mixed with a minishaker. Samples
were defrosted, mixed with a minishaker and diluted (1:10 or 1:100) with 0.1x TE-buffer
(Appendix E) to a final volume of 1 mL in flow cytometer plastic tubes. 10000x concentrate of
SYBR green I nucleic acid stain (Life technologies, USA) in DMSO was diluted 1:50 with 0.1x
TE-buffer. 10 μL of the diluted stain solution was added to each sample. The samples were
mixed with a minishaker and incubated for 15 minutes in the dark.
Cell counts were conducted on a BD Accuri C6 flow cytometer (BD Biosciences, San Jose).
The flow rate was controlled by measuring the weight of 2 mL MQ-water in a cytometer tube
before and after a 5 minutes run with a medium flow rate (35 µL/min). The deviation in the
measured flow rate was less than 3 % from the stated flow rate (35 µL/min). Every sample was
run with medium flow rate (35 µL/min) in 3 minutes. An analysis program with automatically
run of samples, shaking of test tubes and washing of the test needle between every sample was

24
chosen. Excitation wavelengths of 488 nm were sent out by a Solid State Blue laser. Green
fluorescence emission within 533 nm from stained bacteria was detected by a optical filter
(FL1). SYBR green I nucleic acid stain has excitation maximum at 497 nm and an emission
peak around 520 nm (ThermoFisher). The threshold for detecting events/cells was set to 2000
μg/sec. Samples with > 1000 countings/µL were reanalysed with a new dilution.
BD Accuri C6 software (Accuri Cytometer, Version 1.0.264.21) was used for analysing the
results. Signals detected from FL1 (optical filter) were plotted against forward scattered lights
(FSA) by the software. FSA are correlated to cell size (Shapiro, 2003). Global gating was used
to investigate the specific areas of interests in every plot. Detected emission under 10-4 was
removed from the results. The results were transferred and further processed in Microsoft Excel.
3.6 Microbiological community analysis
Biofilm carriers from MBBR and Leca particles from VEAS were taken for microbial analyses.
All microbial community analyses were conducted at Department of Biotechnology (NTNU).
3.6.1 DNA extraction
The biofilm carriers were cut into 4 pieces by a scalpel, while the Leca particles were crushed
to smaller pieces by a ceramic mortar. The water samples were transferred to 50 mL syringes
(Soft-Ject, Henke sass wolf, Germany) and filtered with a 0.2 µm syringe tip filter (DynaGard,
Spectrum Laboratories, Inc., Rancho Dominguez) before DNA extraction. DNA was isolated
by Power Soil DNA kit (Mo Bio Laboratories, Inc., Carlsbar). The DNA kit used chemical and
mechanical separation techniques for extraction of DNA, and PowerBEAD tubes for cell lysis
and homogenization of the samples. In several washing steps, organic and inorganic substances
were separated from the DNA. The DNA got attached to a silica filter under high salt
concentration in a spin column, while impurities in several steps flowed through. In the last
step, water was added and DNA was released from the silica filter. Isolated DNA samples were
frozen (-20oC) in collection tubes. The protocol for DNA isolation kit is presented in Appendix
B.

25
3.6.2 PCR
Extracted DNA from microbial samples were amplified with polymerase chain reactions (PCR)
(T100 Thermal Cycler, BIO-RAD, USA). PCR master mix used for DNA amplification was
prepared from 2.5 μL key buffer (10x, VWR), 0.5 μL dNTP mix (10 mM), 0.5 μL MgCl (25
mM, VWR), 0.75 μL Bovine Serum Albumin (BSA) (20 mg/L, BioLabs), 0.125 μL Taq DNA
Polymerase (VWR), 18.125 μL filtered MQ-water, 0.75 μL 338F-gc primer (100 μm, Sigma)
and 0.75 μL 518R primer (100 μL, Sigma). The primer sequences are shown in Table 3.3.
Taq DNA Polymerase was added as the last component in the master mix to avoid degradation
of the enzyme, and the master mix was mixed with a minishaker. The PCR tubes were placed
on a PCR cooling block (Eppendorf, Sigma-Aldrich) and 24 μL of the master mix was added
to each of the PCR tubes. Extracted DNA from microbial samples (DNA templates) were
defrosted in room temperature and mixed with a minishaker. 1μL of each microbial sample
(DNA template) was added to each PCR tube. The PCR tubes (total concentration of 25 μL)
were again mixed with a minishaker. A negative control (without DNA template) was used for
discovering potential contaminations in the components used in the master mix. The
programme (cycle sequence) for PCR is shown in Table 3.2. The denaturation, annealing and
elongation step (marked in Table 3.2) were repeated in 35 cycles in the PCR programme. The
PCR products were stored at 4oC before further analysis.
The result of the DNA amplification (the PCR products) were investigated by agarose gel
electrophoresis. 5 μL PCR products were mixed with 1 μL DNA Loading dye (6x,Thermo
scientific) before the PCR products were loaded into the wells on the agarose gel. 3 μL 1 kb
Plus DNA ladder (0.5 μg/μL, Thermo Scientific) was used to approximately determine the size
of the different DNA fragments on the gel. The DNA fragments were run on the agarose gel in
140 volts for 45 minutes in 1xTAE (Tris-acetate-EDTA) buffer. Pictures were taken of the
agarose gels in UV light (G:box, Syngene, Cambridge) by GeneSnap (SynGene, Cambridge).
1xTAE buffer was made from 40 mL 50xTAE buffer (Appendix C) and 1960 mL MQ-water.
Agarose gel solution was made from 4 g agarose and 400 mL 1xTAE buffer heated to boiling
point in a microwave. Solution was cooled to 65oC before 20 μL Gel Red (10000x in water,
Biotium, Hayward) gel staining for nucleic acid was added. The agarose gel solution was stored
in a heating cabinet at 65oC.

26
Table 3. 2 Programme for PCR run on Thermal cycler
Step Temperature [°C] Time[min] Cycles [numbers]
Pre-warming 95 ∞
Denaturation 95 3
Denaturation 95 0.5 |
35 Annealing 50 0.5 |
Elongation 72 1 |
Elongation 72 30
Cooling 10 ∞
Table 3.3 Primer sequences used in PCR
Primer Sequences
338F-GC 5’-cgcccgccgcgcgcggcgggcggggcgggggcacgggggg actcctacgggaggcagcag-3’
518R 5’-attaccgcggctgctgg-3’
3.6.3 DGGE
Denaturing gradient gel electrophoresis (DGGE) for analysing microbial communities from
PCR products was performed with the PhorU2 DGGE system (Ingeny, Netherlands). All the
equipment used for DGGE was from the PhorU2 system, unless stated otherwise in the text.
0 % and 80 % denaturing acrylamide solutions (Appendix C) were used to create a denaturation
gradient. The denaturing gradient gel was made from distribution of the three solutions: low
denaturing solution (35 % denaturing), high denaturing solution (55% or 60 %) and stacking
gel solutions (0 % denaturing) between two glass plates. The contents of the three solutions are
shown in Table 3.4. 80 % denaturing solution was filtered with a 0.45 μL polyethersulfone
membrane syringe filter (VWR International, USA). TEMED (Sigma-Aldrich) was added as
the last component of the three solutions to avoid premature polymerization, since a mix of
ammonium persulfate (APS, Appendix C) and Tetramethylenediamine (TEMED) in
acrylamide solutions immediately starts polymerization of the solutions.
The denaturing gradient gel was made between two cleaned glass plates fastened with a spacer
inside a gel box. A comb (48 wells) was placed between the glass plates for the wells formation.
A syringe connected to a plastic hose was also placed between the glass plates for distribution
of the gel solutions. High denaturing gel solution (55 % or 60 %) was pumped first between the
glass plates for highest denaturing percent at the end of the gel. Low and high denaturing
solutions were mixed and pumped inside the glass plates. Stacking gel was pumped as the last

27
solution inside the glass plates for formation of 0 % denaturing in the wells (at the beginning
of the gel). The gel stood 2 hours in the fume hood for polymerization. The comb was removed
and the spacer was pushed completely down after the gel was polymerized.
The gel box was immersed in a water bath (60oC) with 17 L 0.5x TAE-buffer (Appendix C).
The voltage was set to 100 V. A recirculation function was turned on for 5 minutes, while the
PCR samples were mixed with a shaker. The wells were stained with loading dye to investigate
the quality of the wells. A mixture of 5 μL loading dye and 4 or 5 μL PCR sample were added
to each well. 5 μL DGGE ladder was used as standard and for separating sets of samples. The
six outermost wells on both sides of the gel were not used because of a high risk for a smiling
effect at the outer edges of the gel. The high voltage function was turned on. The recirculation
function was turned on after 10 minutes. The ampere was checked. Large deviations from 27-
32 mA indicated problems with equipment, buffer solution or current flow through the gel. The
gel was running vertically for 22 hours.
Table 3.4 Solutions used for making denaturing gradient gel.
Solution 0 %
denaturing
acrylamide
solution [mL]
80 %
denaturing
acrylamide
solution [mL]
APS [μL] TEMED [μL]
35 % 13.5 9.5 87 16
55 % 9.5 13.5 87 16
60 % 6 18 87 16
Stacking gel 8 - 40 10
After 22 hours, the gel box was removed from the water bath. The gel was released from the
glass plates and transferred to a plastic sheet. A gel staining solution containing 3 μL SYBR
Gold (Invitrogen), 600 μL 50x TAE-buffer and 30 mL MQ-water was distributed over the gel.
An opaque plastic box was placed over the gel for 1 hour, and every 15 minutes the gel was
gently shaken for achieving a more even distribution of the staining solution. Excess staining
solution was removed with MQ-water after 1 hour. The gel was transferred to a UV plate.
Pictures were taken of the DGGE gels in UV light (G:BOX,Syngene, Cambridge) using the
programme GeneSnap (SynGene, Cambridge).

28
3.7 Analysis of DGGE data
The DGGE images were cropped, reduced from 16-bit to 8-bit and converted to tiff-files in the
ImageJ 1.51j8 software (Rasband, 1997-2012). The band patterns on the DGGE images were
analysed in the Gel2K software (Norland, 2004). Gel2K transformed fluorescence strength in
one lane into densitometric curves, where peaks correspond to the DGGE bands in each sample.
Fluorescence signals from the bands matched the area of each peak. Bands with similar
migration lengths were sorted by the program and were manually put into different band groups.
This resulted in a sample/peak area matrix, which was exported and further processed in
Microsoft Excel. The peak areas were normalized by calculating the fractional peak area for
each peak in a sample. This normalization was done by dividing individual (ni) peak areas by
the sum area of all the peaks (∑ni) in the same lane/sample (Equation 3.1). Diversity analysis
and calculations on the values obtained from band patterns in Gel2K were done using the PAST
3.14 software (Hammer et al., 2001).
p𝑖 = 𝑛𝑖
∑𝑛𝑖 (3.1)
Analyses of diversity of bacterial community data from the DGGE data were performed to
explore similarities and differences in microbial communities in the biofilms and the water
samples from MBBR and BIOFOR. Biological diversity can be divided between alpha- and
beta-diversity. Alpha-diversity describes the diversity in one sample while beta-diversity
describe the diversity between different samples (Whittaker, 1960, Rosenzweig, 1995). Species
richness (K), species evenness (J`), Shannon diversity index (H`) describe alpha-diversities.
Bray-Curtis and Jaccard similarities/dissimilarities can be used to describe beta-diversities
(Pepper et al., 2015).
Species richness (S`) or band richness (K`) is the number of species in a sample or the number
of bands in each lane on the DGGE gel. Species evenness (J`) describe the distribution of the
number of species in a sample (Pepper et al., 2015, Shannon and Weaver, 1949). Species
evenness (EH/S) is calculated by dividing the Shannon diversity index on the number of species
(bands) (Peet, 1975). Shannon diversity index (H`) describes the diversity in a community by
considering both species richness and species evenness. High Shannon index indicates a
community with high species richness and high species evenness (Shannon and Weaver, 1949).
29
The Shannon index in each sample was calculated by Equation 3.3 where pi is the fractional
peak area from each band on the DGGE gel (Pepper et al., 2015, Shannon and Weaver, 1949).
J` = 𝑒𝐻`/K` (3.2)
H` = −Σ piln(pi) (3.3)
Bray Curtis similarity describes the difference between two samples (Bray and Curtis, 1957).
Bray Curtis similarities between the samples were visualized by Principle coordinate analysis
(PCoA) in an ordination scatter plot based on a distance/similarity matrix. Multidimensional
scaling (MDS) is another name for PCoA. PCoA gives eigenvalues (coordinates) and their
associated percentage of variance explained of the distance/similarity matrix. (Anderson, 2005,
Davis, 1986, Podani and Miklos, 2002).
One-way PERMANOVA or Non-Parametric MANOVA tests were performed to test whether
the differences between groups in Bray Curtis similarities were significant (Anderson, 2001).
p-values under 0.005 were considered to be significant (Hammer et al., 2001). One-way
PERMANOVA test based on Jaccard similarity were also performed in PAST. Jaccard index
describes the similarity between two samples or communities by the absence and presence of
species. The index is calculated by dividing the number of shared species between two samples
by the sum of species in both communities (Equation 3.4). The Jaccard index is between 0 (no
common species) and 1 (only shared species) (Pepper et al., 2015, Jaccard, 1908).
𝐽(𝐴, 𝐵) =|𝐴 ∩ 𝐵 |
|𝐴 ∪ 𝐵 | (3.4)
The difference between Bray Curtis similarity and Jaccard similarity is that Jaccard similarity
is based on absence/presence of species, while Bray Curtis similarity also includes the
abundance of species. For example, two microbial communities can have the same species
present (high Jaccard), but with different dominance of species (different Bray Curtis) (Bray
and Curtis, 1957, Jaccard, 1908).
Species richness (K), Busaz and Gibson`s species evenness (J`), and Shannon diversity index
(H`) were calculated for each sample in PAST. One-way PERMANOVA tests based on Bray

30
Curtis or Jaccard similarities were performed in PAST to test if there were statistically
significant differences in community structure and composition between groups of samples.

31
4. Results
4.1 Long-term MBBR experiments
The objective of the long-term experiments in the first and the second period was to investigate
the differences in nitrification activity and thus ammonium removal efficiency between biofilm
carriers operating with different C/N ratios. Adaption and response to changes as increased C/N
ratio and increased organic loading were also investigated (perturbations experiments). Reactor
1 was continuous fed with C/N ratio 1 and reactor 2 was continuous fed with C/N ratio 0. The
perturbation experiments were performed by increasing the C/N ratio and the loading rate
(increased flow rate). From day 131 in the second period, both of the reactors were fed with
C/N ratio 3, and from day 139 in the second period, the loading of C/N ratio was doubled
(increased loading rate) as well. Nitrification activities were calculated as NH4+-N consumption
for AOB and NO3--N production for NOB in order to estimate the difference in the nitrification
activities between AOB and NOB.
The nitrate, nitrite and ammonia concentration in the reactors were measured over 36 days in
the first period (Figure 4.1, Table 4.1). On day 37, the organic inhibition experiment was
performed (section 4.21). The reactors started with biofilm carriers from two nitrification
MBBR that had been operated for some weeks before start-up (Inlet = 50 mg/L NH4+-N, HRT
= 12 hours, C/N ratio 0). From day 11 to day 27 in the first period, the nitrite concentration
elevated in reactor 1 (Figure 4.1 A). The nitrite concentration in reactor 1 increased from
average 0.32 ± 0.14 mg/L NO2--N before day 11 to average 2.53 ± 0.93 mg/L NO2
--N between
day 11 and day 27.
Unstable pumps and worn pump tubings caused unstable flow rate in both reactors (marked in
Figure 4.1). On day 36, reactor 1 had problems with the pump, and therefore reactor 1 was set
on batch conditions for 12 hours. The average ammonium, nitrite and nitrate concentrations are
shown in Table 4.1. The differences in nitrification activities given as NH4+-N consumption and
NO3 --production in reactor 1 and reactor 2 were small in the first period. Both reactors showed
stable nitrification activity over time. The average nitrification activities in the first period were
7.26 ± 1.02 mg NH4+-N/ L h and 7.12 ± 0.97 mg NO3
--N/ L h for reactor 1 and 7.17 ± 0.85 mg
NH4+-N/ L h and 7.43 ± 0.95 mg NO3
--N/ L h for reactor 2 (Table 4.2).

32
The nitrate, nitrite and ammonium concentrations in the reactors were measured over 152 days
in the second period (Figure 4.1, Table 4.1). The reactors started with frozen biofilm carriers
from the first period, and were in batch modus for 24 hours before the pumps were turned on.
Unstable nitrification activities were shown in both reactors during the first half of the
experiment. Also in the second period, different minor problems occurred. On day 24, the
ammonium and nitrite concentrations were high in both reactors because of unstable flow rate
(marked in Figure 4.1), and the reactors were set on batch conditions for 12 hours after this
incidence. On day 24, the aeration source in reactor 2 was turned off by accident, and the
incident resulted in high nitrite and ammonium concentration in reactor 2. On day 69, reactor 1
was finally stable, and at day 77, reactor 2 was finally stable.
The difference in nitrification activity given as NH4+-N/ L h consumption and NO3
-- N/ L h
production, between reactor 1 and reactor 2 was small in the second period (days 3-130). The
average nitrification activities until day 131 with the long-term operating conditions were 7.67
± 0.67 mg NH4+-N/ L h and 7.95 ± 1.13 mg NO3
-N/ L h for reactor 1, while for reactor 2 the
average nitrification activities with the long-term operating conditions until day 131 were 7.95
± 1.13 mg NH4+-N/ L h and 7.94 ± 0. 79 mg NO3
--N (Table 4.2).
After the increase in C/N ratio (day 131) and loading rate (day 139) (perturbation experiments),
bigger differences were observed in the nitrogen concentrations in the reactors and in the
nitrification activities. Both reactors showed some unstable nitrification activities after
increased C/N ratio to 3. Reactor 2 had one short nitrite peak after increased C/N ratio, but
managed to stabilize (Figure 4.1 F). Reactor 1 showed a tendency of nitrite accumulating, but
the nitrite concentrations were lowered again in both reactor after increased loading (Figure 4.1
E-F). Few samplings point and varying nitrogen concentrations gave high standard deviations
in the average nitrogen concentrations, especially for nitrite concentration, after increased C/N
ratio (days 131-138) (Table 4.1).
After increased loading rate, the average nitrification activities for reactor 1 was 12.52 ± 1.75
mg NH4+-N/ L h and 8.75 ± 1.83 mg NO3
--N/L h. Average nitrification activity after increased
loading for reactor 2 was 13.85 ± 1.13 mg NH4+-H/ L h and 11.24 ± 3.13 mg NO3
--N/L (Table
4.2). Varying nitrogen concentrations measured in the reactors gave high standard deviation in
the average nitrogen concentrations after increased loading (days 139-152). The ammonium

33
concentrations increased and the nitrate concentrations decreased in both the reactors when the
loading rate increased (Figure 4.2 E-F) (Table 4.1).
It is possible to observe a gap between nitrification activity given as NH4+-N consumption
(mg/L h) and NO3--N-production (mg/L h) after increased loading rate (days 145-152) for both
the reactors (Figure 4.2 C-D). In the days 145-152, average loss of nitrogen was 20.68 ± 12.70
mg N/L in reactor 1 and average loss of nitrogen was 19.50 ± 15.79 mg N/L for reactor 2.
Nitrification activities given as NH4+-N/ L h consumption were higher than the average
nitrification activities given as NO3-- N production for both the reactors when the loading was
increased, but reactor 2 had a moderate standard deviation at nitrification activity given as NO3-
-N production (Table 4.2 C).
Loss of nitrogen was observed from both the reactors after increased loading rate (Figure 4.E-
F). Average sum of nitrogen compounds (NO3-- N + NH4
+-N + NO2-- N) was 80.88 ± 3.59 mg
N /L in reactor 1 and 80.47 ± 13.26 mg N /L in reactor 2 after increased loading rate (days 139-
152). In the periods before increased organic concentrations to the reactors, loss of nitrogen had
not been observed. Before the perturbation experiments, the average sum of nitrogen
compounds (NO3-- N + NH4
+-N + NO2-- N) in the reactors had been stable around 100 mg N /L
and been in mass balance with the inlet concentrations of nitrogen. Loss of nitrogen was
observed in reactor 1 shortly after increased C/N ratio (section 4.2.3).

34
Figure 4.1 Ammonium (NH4+-N), nitrite (NO2
--N) and nitrate (NO3--N) concentrations in
reactor 1 and reactor 2 in the first period (36 days) and in the second period (152 days). A)
reactor 1 in the first period. B) reactor 2 in the first period. C) reactor 1 in the second period.
D) reactor 2 in in the second period. E) reactor 1 in the second period (days:120-152). F) reactor
2 in the period (days: 120-152). E and F is to increase the resolution during the two perturbation
experiments (days 120-152).

35
Table 4.1 The average ammonium, nitrite and nitrate concentrations (mg N /L) in reactor 1 and
reactor 2 in the first and the second period. Deviation values were excluded from the average
calculations (Appendix A). The second period were divided into the 3 groups: A is before the
two perturbation experiments (days >131). B is after increased C/N ratio and before increased
loading (days 132 -138), and C is after increased loading rate (days >139).
1. Period Reactor 1 Reactor 2
NH4+-N
mg/L
NO2--N
mg/L
NO3--N
mg/L
NH4+-N
mg/L
NO2--N
mg/L
NO3--N
mg/L
Average 0.540 ± 0.22 1.837 ± 1.32 97.95 ± 2.64 0.643 ± 0.11 0.856 ± 0.66 100.8 ± 3.21
2. Period (A) Reactor 1 Reactor 2
NH4+-N
mg/L
NO2--N
mg/L
NO3--N
mg/L
NH4+-N
mg/L
NO2--N
mg/L
NO3--N
mg/L
Average 3.17 ± 6.13 3.37 ± 4.65 92.19 ± 8.66 3.76 ± 3.79 0.57 ± 0.60 97.16 ± 6.92
2. Period (B) Reactor 1 Reactor 2
NH4+-N
mg/L
NO2--N
mg/L
NO3--N
mg/L
NH4+-N
mg/L
NO2--N
mg/L
NO3--N
mg/L
Average 5.02 ± 4.54 13.21 ± 11.41 84.23 ± 8.30 8.72 ± 3.80 11.73 ± 11.96 90.13 ± 30.45
2. Period (C) Reactor 1 Reactor 2
NH4+-N
mg/L
NO2--N
mg/L
NO3--N
mg/L
NH4+-N
mg/L
NO2--N
mg/L
NO3--N
mg/L
Average 21.57 ± 6.40 3.53 ± 2.22 54.60 ± 11.61 13.34 ± 4.56 5.06 ± 2.92 64.59 ± 12.44

36
Figure 4.2 The nitrification activity given as NH4+-N consumption (([NH4
+-N]in - [NH4+-N]out
)/ HRT) and NO3-N production ([NO3--N]in/ HRT) for reactor 1 and 2. A) reactor 1 in the first
period. B) reactor 2 in the first period). C) Reactor 2 in the second period. D) Reactor 2 in
second period. Deviation values were removed from the nitrification activities calculations
(Appendix A).

37
Table 4.2 The average nitrification activity given as NH4+-N consumption (mg/L h) and NO3
-
N production (mg/L h) in reactor 1 and reactor 2 in the first and the second period. Deviation
values were excluded from the average calculations (Appendix A). The second period was
divided into the 3 groups: A is before the two perturbation experiments (days >131), B is after
increased C/N ratio and before increased loading rate (days 131-138), and C is after increased
loading rate (days >139).
1. period Reactor 1 Reactor 2
NH4+-N
mg/L h
NO3--N
mg/L h
NH4+-N
mg/L h
NO3--N
mg/L h
Average 7.26 ± 1.02 7.12 ± 0.97 7.17 ± 0.85 7.43 ± 0.95
2. period (A) Reactor 1 Reactor 2
NH4+-N
mg/L h
NO3--N
mg/L h
NH4+-N
mg/L h
NO3--N
mg/L h
Average 7.67 ± 0.67 7.45 ± 0.77 7.95 ± 1.13 7.94 ± 0.79
2. period ( B) Reactor 1 Reactor 2
NH4+-N
mg/L h
NO3--N
mg/L h
NH4+-N
mg/L h
NO3--N
mg/L h
Average 7.72 ± 0.41 8.03 ± 3.02 7.49 ± 0.13 7.21 ± 2.44
2. period (C) Reactor 1 Reactor 2
NH4+-N
mg/L h
NO3--N
mg/L h
NH4+-N
mg/L h
NO3--N
mg/L h
Average 12.52 ± 1.75 8.75 ± 1.83 13.85 ± 1.13 11.24 ± 3.13
4.2 Short-term experiments
4.2.1 Short-term organic carbon inhibition experiments
The objective of the experiments was to investigate whether there was any difference in acute
organic carbon inhibition of nitrification activity between the biofilm from reactor 1 (with
continuous organic carbon supply) and the biofilm from reactor 2 (without continuous organic
carbon supply). The organic carbon inhibition experiments were performed in two batch
reactors on day 37 in the first period and on day 99 in the second period. The rate of nitrate
accumulation (slope of NO3--N versus time) at 0 mM sodium acetate added was defined as 100
% nitrification activity. Dose response curve and EC50 (effective concentration for 50
inhibition) were calculated using REGTOX based on the nitrate accumulation rates calculated
from data in Figure 4.3.
The difference in nitrate accumulation rate (mg NO3--N/L h) was small on day 37 in the first
period between the biofilm carriers from reactor 1 and reactor 2. Start concentrations of nitrate
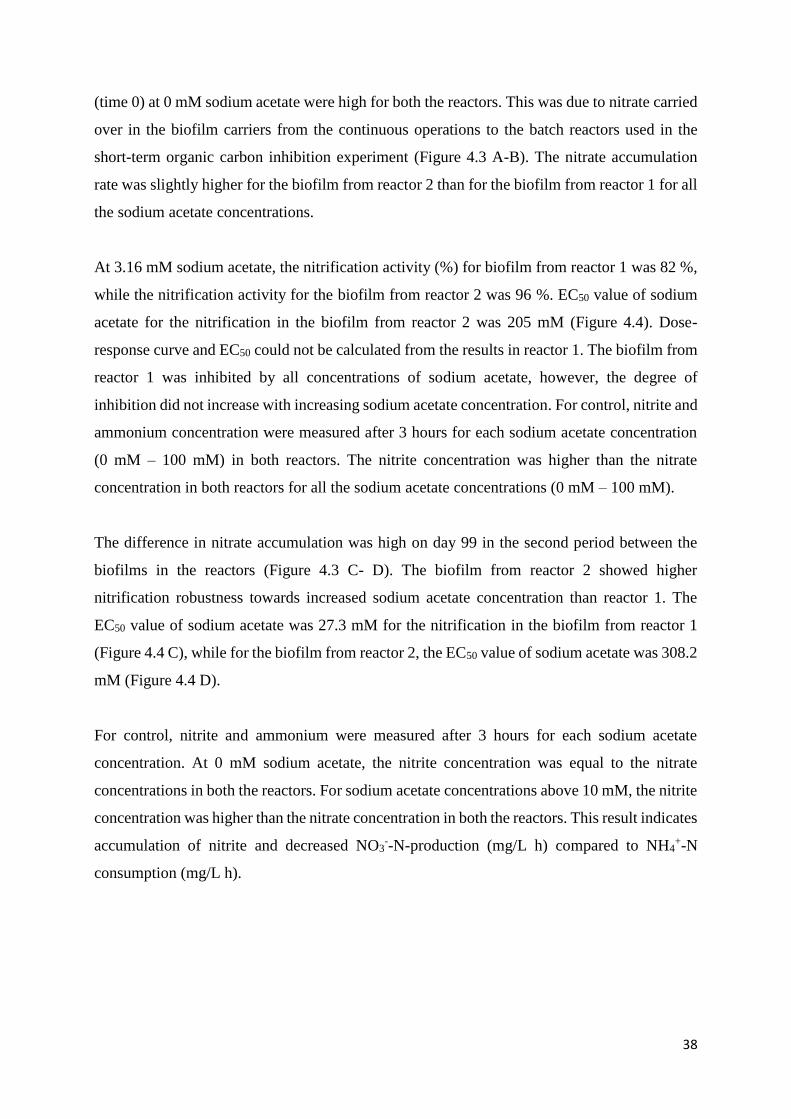
38
(time 0) at 0 mM sodium acetate were high for both the reactors. This was due to nitrate carried
over in the biofilm carriers from the continuous operations to the batch reactors used in the
short-term organic carbon inhibition experiment (Figure 4.3 A-B). The nitrate accumulation
rate was slightly higher for the biofilm from reactor 2 than for the biofilm from reactor 1 for all
the sodium acetate concentrations.
At 3.16 mM sodium acetate, the nitrification activity (%) for biofilm from reactor 1 was 82 %,
while the nitrification activity for the biofilm from reactor 2 was 96 %. EC50 value of sodium
acetate for the nitrification in the biofilm from reactor 2 was 205 mM (Figure 4.4). Dose-
response curve and EC50 could not be calculated from the results in reactor 1. The biofilm from
reactor 1 was inhibited by all concentrations of sodium acetate, however, the degree of
inhibition did not increase with increasing sodium acetate concentration. For control, nitrite and
ammonium concentration were measured after 3 hours for each sodium acetate concentration
(0 mM – 100 mM) in both reactors. The nitrite concentration was higher than the nitrate
concentration in both reactors for all the sodium acetate concentrations (0 mM – 100 mM).
The difference in nitrate accumulation was high on day 99 in the second period between the
biofilms in the reactors (Figure 4.3 C- D). The biofilm from reactor 2 showed higher
nitrification robustness towards increased sodium acetate concentration than reactor 1. The
EC50 value of sodium acetate was 27.3 mM for the nitrification in the biofilm from reactor 1
(Figure 4.4 C), while for the biofilm from reactor 2, the EC50 value of sodium acetate was 308.2
mM (Figure 4.4 D).
For control, nitrite and ammonium were measured after 3 hours for each sodium acetate
concentration. At 0 mM sodium acetate, the nitrite concentration was equal to the nitrate
concentrations in both the reactors. For sodium acetate concentrations above 10 mM, the nitrite
concentration was higher than the nitrate concentration in both the reactors. This result indicates
accumulation of nitrite and decreased NO3--N-production (mg/L h) compared to NH4
+-N
consumption (mg/L h).

39
Figure 4.3 Organic carbon inhibition experiment on biofilm carriers from reactor 1 and reactor
2 on day 37 in the first period (A and B) and on day 99 in the second period (C and D). The
effect on nitrate accumulation due to increasing sodium acetate concentration was investigated.
A) Biofilm carriers from reactor 1 in the first period. B) Biofilm carriers from reactor 2 in the
first period. C) Biofilm carriers from reactor 1 in the second period. D) Biofilm carriers from
reactor 2 in second period.

40
Figure 4.4 Calculated dose-response curves for sodium acetate inhibitory effect on nitrification
activity using REGTOX. 0 mM was set as 100 % nitrification activity. A) Biofilm carriers from
reactor 1 in the first period. Nitrification activity (%) is based on nitrate accumulation rate and
not calculated effect in REGTOX (EC50 not calculated). B) Biofilm carriers from reactor 2 in
the first period (EC50 205 mM). EC25 marked in the figure. C) Biofilm carriers from reactor 1
in second period (EC50 27.3 mM). D) Biofilm carriers from reactor 2 in the second period (EC50
308.2 mM).
4.2.2 Short-term oxygen consumption experiments in batch mode
The objective of the experiments was to investigate whether there was any difference in oxygen
consumption between the biofilm from reactor 1 (continuous C/N ratio 1) and the biofilm from
reactor 2 (continuous C/N ratio 0). The batch experiments were conducted on day 89 with C/N
ratio of 0 and on day 90 with C/N ratio of 1 (Figure 4.5). For control, the changes in the
ammonium concentration were measured (Figure 4.6).

41
Figure 4.5 Oxygen consumption experiments with biofilm carriers from reactor 1 and reactor
2 with C/N ratio of 0 (left) on day 89 and C/N ratio of 1 (right) on day 90 in the second period.
The sudden increase in oxygen concentration for biofilm carriers from reactor 1 in C/N ratio 0
(left) was due to the extra oxygen caused by the sensor loosening from the attached position in
the batch reactor. The experiments were conducted in batch mode.
Figure 4.6 The change in ammonium concentration (NH4+-N) with time in reactor 1 and reactor
2 from the oxygen consuming batch experiment (Figure 4.5) with C/N ratio of 0 (left) on day
89 and C/N ratio of 1 on day 90 (right) in the second period.

42
The results showed higher oxygen consumption rate for the biofilm from reactor 1 than for the
biofilm from reactor 2 during both experiments. The consumption rate was calculated by linear
regression. In the batch experiment with C/N ratio of 0 in the medium, the oxygen consumption
rate was 10 % higher for the biofilm carriers from reactor 1 than reactor 2. The ammonium
consumption rate was 16 % higher for the biofilm carriers from reactor 2 than biofilm carriers
from reactor 1 in the batch experiment with C/N ratio 0. In the batch experiment with C/N ratio
1, the oxygen consumption rate was 23 % higher for the biofilm carriers from reactor 1 than
reactor 2. The ammonium consumption rate was 2 % higher for the biofilm carriers from reactor
2 than for the biofilm carriers from reactor 1 in the batch experiment with C/N ratio of 1 (Figure
4.6).
4.2.3 Organic matter and oxygen consumption experiment with increased C/N ratio
The objective of the experiment was to investigate whether there were any differences in
organic matter (acetate) and oxygen consumption between the reactors after increased C/N
ratio. On day 131 in the second period, the C/N ratio was increased to 3 in the medium for both
the reactors. The organic carbon (Figure 4.7), oxygen (Figure 4.9) and nitrogen (NH4+-N, NO2
-
-N, NO3--N) (Figure 4.8) concentrations were measured for 9 hours after the C/N ratio was
increased to 3 in the reactors. The organic carbon consumption rate was considerably higher in
reactor 1 than reactor 2 the 9 first hours after increased C/N ratio (Figure 4.7). The oxygen
consumption rate was slightly higher in reactor 1 (0.052 mg/L h) compared to reactor 2 (0.042
mg/L h) during these 9 hours after C/N ratio was increased (Figure 4.9). A weak decline in
oxygen concentration was observed in both reactors from day 131 to 152 in the second period
(Figure 4.11).
The experiments showed 13 % higher ammonium consumption rate in reactor 2 compared to
reactor 1 the first 9 hours after increased C/N ratio. Nitrite and nitrate accumulation were higher
in reactor 2 compared to reactor 1. Figure 4.8 showed that considerable amount of nitrogen was
lost from reactor 1 after increased C/N ratio. Therefore, the loss of nitrogen (NH4+-N, NO2
--N,
NO3--N) from the nitrogen budget was calculated (Figure 4.10). The loss of nitrogen increased
as a function of time for reactor 1, while the nitrogen budget in reactor 2 was stable. After 9
hours, the nitrogen loss in reactor 1 was 34.4 %.

43
Figure 4.7 The changes in acetate (CH3COO-) with time after the C/N ratio was increased to 3
on day 131 in the second period for reactor 1 (previous C/N ratio 1) and reactor 2 (previous
C/N ratio 0).
0
100
200
300
400
500
600
700
0 5 10 15 20 25 30
CH
3C
OO
-[m
g/L
]
Time [hours]
Reactor 2
Reactor 1
Figure 4.8 The changes in ammonium (NH4+-N), nitrite (NO2
--N) and nitrate (NO3--N) concentration in
reactor 1 (left) and reactor 2 (right) after the C/N ratio was increased to 3 on day 131 in the second
period.

44
Figure 4.9 The decline in oxygen after the C/N ratio was increased to 3 on day 132 in the
second period for reactor 1 and reactor 2.
Figure 4.10 The sum of nitrogen components (%) calculated from the nitrogen concentrations
in Figure 4.8 after the C/N ratio was increased to 3 at day 131 in the second period for reactor
1 (R1) and reactor 2 (R2). The sum of nitrogen components (%) was calculated from the sum
nitrogen (NH4+-N, NO2
--N, NO3--N) at a specific time divided by the sum nitrogen (NH4
+-N,
NO2--N, NO3
--N) at time 0.
Reactor 2 y = -0.042x + 7.379R² = 0.972
Reactor 1 y = -0.051x + 7.806R² = 0.990
6.9
7
7.1
7.2
7.3
7.4
7.5
7.6
7.7
7.8
7.9
0 2 4 6 8 10
Oxy
gen
[m
g/L
]
Time [hours]
Reactor 1
Reactor 2
Reactor 1 y = -3.351x + 92.194
R² = 0.816
0
20
40
60
80
100
120
0 2 4 6 8 10
Su
m o
f n
itro
gen
com
pon
ents
[%
]
Time [hours]
R1 %R2 %100 %

45
Figure 4.11 The oxygen concentration in reactor 1 and reactor 2 from day 118 to day 152 in
the second period. On day 131, the C/N ratio was increased to 3, while on day 139 the loading
rate of C/N ratio of 3 was doubled.
4.2.4 Ammonium consumption and oxygen concentrations after increased loading
The objective of the experiment was to investigate whether there were any differences in
consumption of ammonium, organic carbon and oxygen between reactor 1 and reactor 2 after
the loading rate (HRT decreased) was doubled at day 139 in the second period. The HRT was
decreased from 13 to 6.5 hours. The nitrate concentration was high in both reactors due to a
combination of water samples taken for DGGE analysis and a low flow rate at day 138. This
resulted in an unbalance in the nitrogen budget and a high nitrate concentration for the reactors
before the experiment started.
The main difference between reactor 1 and reactor 2 after increased loading rate was the
development in ammonium accumulation (Figure 4.12). After 8 hours, the ammonium
concentration was higher in reactor 2 than reactor 1. The ammonium concentration in reactor 2
started to decrease after 6 hours, while the ammonium concentration in reactor 1 was increasing
still after 8 hours. 24 hours after the loading rate was increased, the ammonium concentration
in reactor 1 was 19.00 NH4+-N mg/L, while the ammonium concentration in reactor 2 was 7.29
NH4+-N mg/L.
The nitrite and nitrate concentration showed a similar development after loading rate was
increased (Figure 4.12). The oxygen concentration decreased in both reactors during the first
Reactor 1 y = -0.0261x + 10.735
R² = 0.5003
Reactor 2 y = -0.0256x + 10.731
R² = 0.5363
0
1
2
3
4
5
6
7
8
9
118 128 138 148 158
Oxy
gen
[m
g/L
]
Time [days]
Reactor 1
Reactor 2

46
24 hours (Figure 4.13). Organic carbon concentrations were measured in both reactors in the 4
first hours after increased loading and both the reactors managed to keep the organic
concentrations at the same level as before increased loading rate (< 40 mg CH3COO- /L).
Organic carbon concentrations were measured again 8 hours after the loading rate was
increased and the acetate concentration was higher in reactor 2 (65.1 mg/L) than reactor 1 (22.8
mg/L). However, after a few days and rest of the period, the acetate concentration in reactor 2
was similar with the acetate concentration in reactor 1 (Figure 4.14). The organic carbon
concentration (acetate) was low in both reactors (< 50 mg/L) the rest of the period when the
reactors were running (Figure 4.14). The ammonium concentrations throughout the second
period are shown in Figure 4.15.
Figure 4.12 The changes in ammonium (NH4+-N), nitrite (NO2
--N) and nitrate (NO3--N)
concentration in reactor 1 (left) and reactor 2 (right) after organic loading rate was increased at
day 139 in the second period.
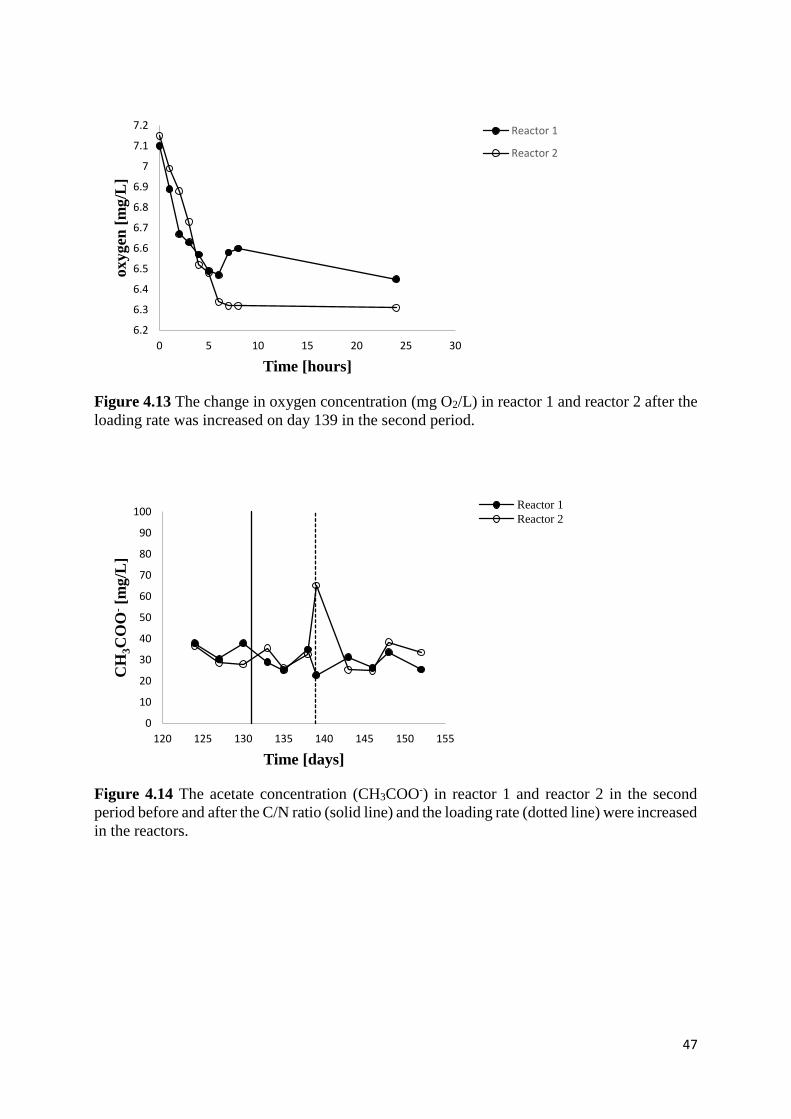
47
Figure 4.13 The change in oxygen concentration (mg O2/L) in reactor 1 and reactor 2 after the
loading rate was increased on day 139 in the second period.
Figure 4.14 The acetate concentration (CH3COO-) in reactor 1 and reactor 2 in the second
period before and after the C/N ratio (solid line) and the loading rate (dotted line) were increased
in the reactors.
6.2
6.3
6.4
6.5
6.6
6.7
6.8
6.9
7
7.1
7.2
0 5 10 15 20 25 30
oxygen
[m
g/L
]
Time [hours]
Reactor 1
Reactor 2
0
10
20
30
40
50
60
70
80
90
100
120 125 130 135 140 145 150 155
CH
3C
OO
-[m
g/L
]
Time [days]
Reactor 1
Reactor 2

48
Figure 4.15 The change in ammonium (NH4
+-N) concentration in the days after the organic
loading rate was increased and until the end of the second period in reactor 1 and reactor 2. The
day the organic loading rate was increased (day 139 in the second period) is set as day 0.
4.2.5 Cell and aggregate counting by flow cytometer
The aim of the cell counting was to investigate the difference in the number of free-living cells
and cell aggregates in water between reactor 1 and reactor 2, and the change in the number of
cells after increasing the C/N ratio and the loading rate.
The flow cytometry plots were divided into two global gates: planktonic cells (P) and cell
aggregates (CA). Cell aggregates were defined as larger cell clusters of living planktonic cells
or cell clusters torn from the biofilm carriers. Gating was based on the identification of
populations based on plotting DNA fluorescence (FL1) versus side scatter (FSC), and an
example of the global gating from day 137 is shown in Figure 4.16. The number of planktonic
cells (Figure 4.17) and cell aggregates (Figure 4.18) before and after the C/N ratio and the
loading rate were increased for reactor 1 and reactor 2 were compared.
Before the C/N ratio and the loading rate was increased, the number of planktonic cells was 22
times higher in reactor 1 than in reactor 2, while the number of cell aggregates was 428 times
higher in reactor 1 than in reactor 2. After the C/N ratio and the loading rate were increased,
the gap between the number of planktonic cells and cell aggregates in reactor 2 was smaller.
Exceptions from the decline in the gap were seen at day 148 for planktonic cells (Figure 4.17)
and on day 152 for cell aggregates/μL (Figure 4.18).
0
5
10
15
20
25
30
35
40
0 2 4 6 8 10
NH
4-N
[m
g/L
]
Time [days]
Reactor 2
Reactor 1

49
Figure 4.16 Global gating used for all samples, indicating gating for planktonic cells (P) and
cell aggregates (CA), based on forward scatter (FSC) and DNA fluorescence (FL1).
Figure 4.17 The changes in cell number (cells/μL) with time (days) for planktonic cells in
reactor 1 and 2. The time the C/N ratio (day 131) and the loading rate (day 139) were increased
are indicated by vertical lines.
0
5000
10000
15000
20000
25000
30000
35000
40000
45000
120 125 130 135 140 145 150 155
[Pla
nk
ton
ic c
ells
/μl]
Time [days]
Reactor 1
Reactor 2
Increased C/N
ratioIncreased
loading rate

50
Figure 4.18 The changes in the number of cell aggregates (aggregates/μL) with time (days) in
reactor 1 and 2. The time the C/N ratio (day 131) and the loading rate (day 139) was increased
are indicated by vertical lines.
4.3. Diversity and structure of microbial communities in MBBR
Two DGGE gels were analysed based on samples taken from reactor 1 and reactor 2 during
first and second period. The objectives of the two DGGE gels analysed were to investigate
changes in diversity and structure of microbial communities on biofilm carriers during different
stable nitrification phases, but also investigate changes after long and short-term exposure to
different C/N ratios and increased loading.
4.3.1 Changes in microbial communities after changes in C/N ratio and loading rate
PCR products from biofilm carriers (C) and water samples (W) from reactor 1 (R1) and reactor
2 (R2) taken before (B) and after (A) the C/N ratio (day 131, second period) and the loading
rate (day 139, second period) was increased, were analysed on DGGE gel 1 (Figure 4.19). 65
bands were identified on the analysed gel. The samples were divided into 8 groups based on
three conditions: type of reactor (R1 or R2), type of sample (biofilm carrier or water) and time
(before or after the C/N ratio and the loading rate was increased). Abbreviations for the 8 groups
are therefore: R1WB, R1WA, R2WB, R2WA, R1CB, R1CA, R2CB, R2CA.
-1000
1000
3000
5000
7000
9000
11000
13000
15000
120 125 130 135 140 145 150 155
[cel
l a
gg
reg
ate
s/μ
L]
Time [days]
Reactor 1
Reactor 2
Increased
C/N ratio
Increased
loading rate

51
Figure 4.19 DGGE gel 1 of samples from biofilm carriers and water from reactor 1 and reactor
2 before and after increased C/N ratio and loading rate. Abbreviations: R1 (reactor 1), R2
(reactor 2), M (marker). Numbers (118-152) represent the day biofilm carriers and water
samples were taken. On day 131, the C/N ratio was increased in the medium and on day 139
the loading rate was increased.
Alpha-diversities were calculated based on the 8 groups (Table 4.3). The band richness ranged
from 26-49, the Shannon Diversity ranged from 2.48-3.46, while the evenness ranged from
0.53-0.73 between the samples (Table 4.3). The variance in band richness within the groups of
water samples was high, especially for water samples taken before increased C/N ratio and
loading rate. The variance in evenness within the 8 groups was though low. The average
Shannon Diversity and the band richness decreased for all the 8 groups after increased C/N ratio
and loading rate. The average band richness and the average Shannon Diversity were higher for
biofilm carriers from reactor 2 than from reactor 1, both before and after increased C/N ratio
and loading rate.
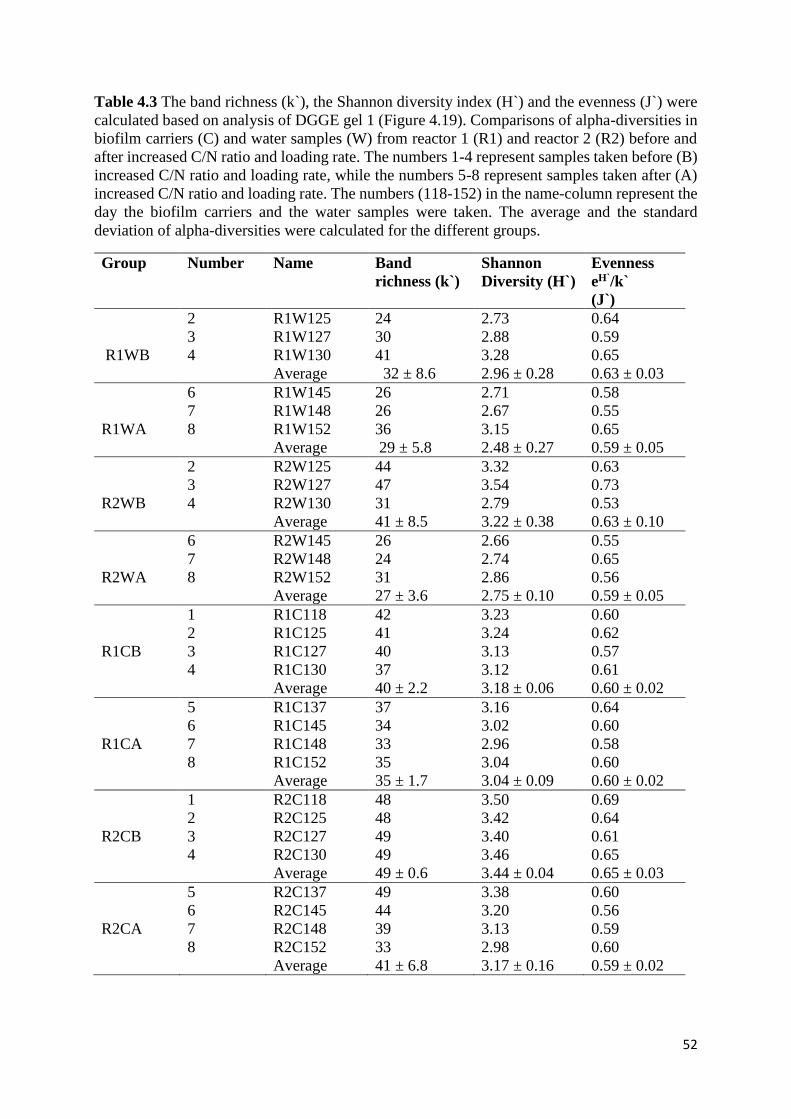
52
Table 4.3 The band richness (k`), the Shannon diversity index (H`) and the evenness (J`) were
calculated based on analysis of DGGE gel 1 (Figure 4.19). Comparisons of alpha-diversities in
biofilm carriers (C) and water samples (W) from reactor 1 (R1) and reactor 2 (R2) before and
after increased C/N ratio and loading rate. The numbers 1-4 represent samples taken before (B)
increased C/N ratio and loading rate, while the numbers 5-8 represent samples taken after (A)
increased C/N ratio and loading rate. The numbers (118-152) in the name-column represent the
day the biofilm carriers and the water samples were taken. The average and the standard
deviation of alpha-diversities were calculated for the different groups.
Group Number Name Band
richness (k`)
Shannon
Diversity (H`)
Evenness
eH`/k` (J`)
2 R1W125 24 2.73 0.64
3 R1W127 30 2.88 0.59
R1WB 4 R1W130 41 3.28 0.65
Average 32 ± 8.6 2.96 ± 0.28 0.63 ± 0.03
6 R1W145 26 2.71 0.58
7 R1W148 26 2.67 0.55
R1WA 8 R1W152 36 3.15 0.65
Average 29 ± 5.8 2.48 ± 0.27 0.59 ± 0.05
2 R2W125 44 3.32 0.63
3 R2W127 47 3.54 0.73
R2WB 4 R2W130 31 2.79 0.53
Average 41 ± 8.5 3.22 ± 0.38 0.63 ± 0.10
6 R2W145 26 2.66 0.55
7 R2W148 24 2.74 0.65
R2WA 8 R2W152 31 2.86 0.56
Average 27 ± 3.6 2.75 ± 0.10 0.59 ± 0.05
1 R1C118 42 3.23 0.60
2 R1C125 41 3.24 0.62
R1CB 3 R1C127 40 3.13 0.57
4 R1C130 37 3.12 0.61
Average 40 ± 2.2 3.18 ± 0.06 0.60 ± 0.02
5 R1C137 37 3.16 0.64
6 R1C145 34 3.02 0.60
R1CA 7 R1C148 33 2.96 0.58
8 R1C152 35 3.04 0.60
Average 35 ± 1.7 3.04 ± 0.09 0.60 ± 0.02
1 R2C118 48 3.50 0.69
2 R2C125 48 3.42 0.64
R2CB 3 R2C127 49 3.40 0.61
4 R2C130 49 3.46 0.65
Average 49 ± 0.6 3.44 ± 0.04 0.65 ± 0.03
5 R2C137 49 3.38 0.60
6 R2C145 44 3.20 0.56
R2CA 7 R2C148 39 3.13 0.59
8 R2C152 33 2.98 0.60
Average 41 ± 6.8 3.17 ± 0.16 0.59 ± 0.02
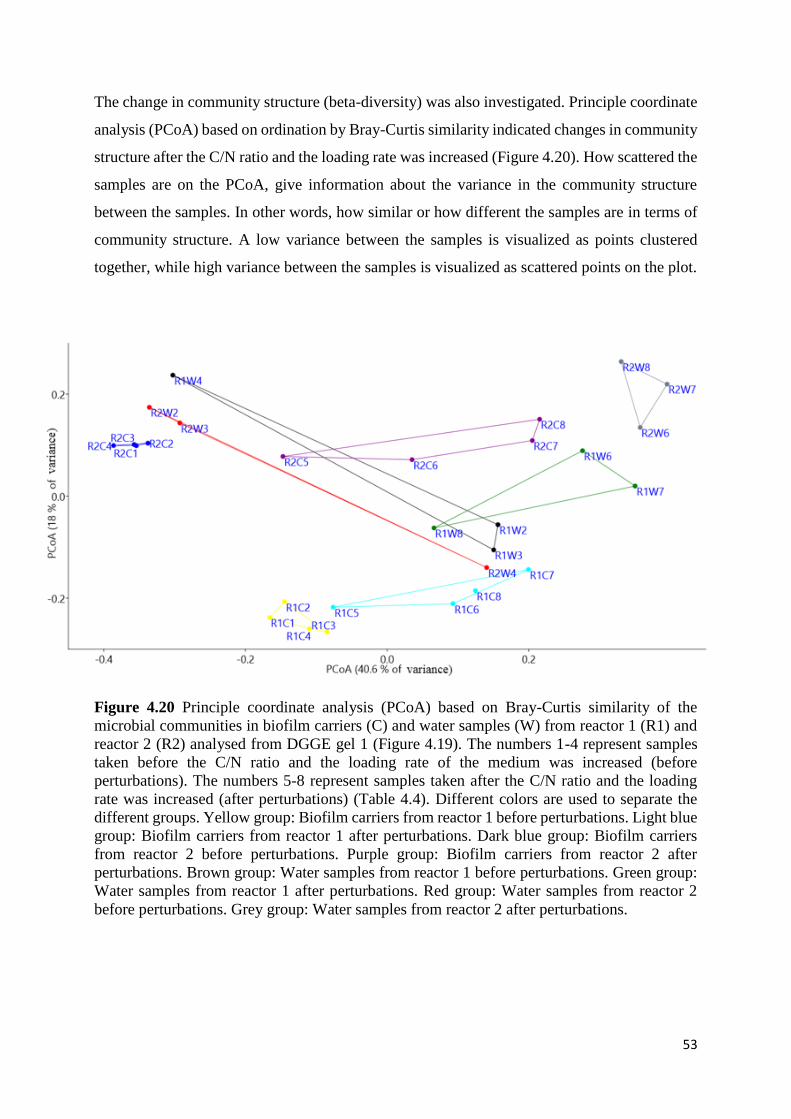
53
The change in community structure (beta-diversity) was also investigated. Principle coordinate
analysis (PCoA) based on ordination by Bray-Curtis similarity indicated changes in community
structure after the C/N ratio and the loading rate was increased (Figure 4.20). How scattered the
samples are on the PCoA, give information about the variance in the community structure
between the samples. In other words, how similar or how different the samples are in terms of
community structure. A low variance between the samples is visualized as points clustered
together, while high variance between the samples is visualized as scattered points on the plot.
Figure 4.20 Principle coordinate analysis (PCoA) based on Bray-Curtis similarity of the
microbial communities in biofilm carriers (C) and water samples (W) from reactor 1 (R1) and
reactor 2 (R2) analysed from DGGE gel 1 (Figure 4.19). The numbers 1-4 represent samples
taken before the C/N ratio and the loading rate of the medium was increased (before
perturbations). The numbers 5-8 represent samples taken after the C/N ratio and the loading
rate was increased (after perturbations) (Table 4.4). Different colors are used to separate the
different groups. Yellow group: Biofilm carriers from reactor 1 before perturbations. Light blue
group: Biofilm carriers from reactor 1 after perturbations. Dark blue group: Biofilm carriers
from reactor 2 before perturbations. Purple group: Biofilm carriers from reactor 2 after
perturbations. Brown group: Water samples from reactor 1 before perturbations. Green group:
Water samples from reactor 1 after perturbations. Red group: Water samples from reactor 2
before perturbations. Grey group: Water samples from reactor 2 after perturbations.

54
PCoA indicated that biofilm carriers from reactor 1 and 2 went through a succession in the
community structure after increased carbon to the biofilm. In the PCoA plot (Figure. 20), the
point representing the biofilm communities moved along the x-axis (explains 40.6 of the
variance) after increased organic carbon concentrations were introduced to the reactors. In
addition, PCoA indicated that biofilm carriers from reactor 1 and 2 were closer in community
structure after increased C/N ratio and loading rate. PCoA also indicated that the variance
between the water samples within the water groups was high, compared to the biofilm samples.
The changes in community structure (beta-diversity) were confirmed by statistical analyses.
The P values (Sequential Bonferroni correlation) from one-way PERMANOVA test based on
Bray Curtis similarity showed a significant difference in community structure between water
samples and biofilm carriers (Figure 4.4). The difference in community structure in biofilm
carriers in reactor 1 and reactor 2 before and after increased C/N ratio was also significant,
however the groups of water samples were not. The P values (Sequential Bonferroni
correlation) from one-way PERMANOVA based on Jaccard similarity indicated a shift in
species inventory after the C/N ratio and the loading rate was increased for the biofilm carriers
in reactor 1 and reactor 2 (Table 4.5). This is based on that the difference between the biofilm
groups before and after the perturbation experiments in Jaccard similarity was significant
difference.
Table 4.4 The results from one-way PERMANOVA based on Bray Curtis similarity with the
groups identified in Figure 4.20. The biofilm carriers (C) and the water samples (W) from
reactor 1 (R1) and reactor 2 (R2) before (B) and after (A) increased C/N ratio and loading rate.
Multiple comparisons of the various groups based on Sequential Bonferroni correlation (P-
value column) and significant difference if P < 0.05.
Comparisons P value F P(same) Total sum of
square
R1WB & R1WA 0.3000 5.321
0.0001 3.921
R2WB & R1WA 0.1010
R1CB & R1CA 0.0262
R2CB & R2CA 0.0272
R1WB & R1CB 0.0287
R2WB & R2CB 0.0281
R1CB & R2CB 0.0282
R1CA & R2CA 0.0288
R1WA & R1CA 0.0278
R2WA & R2CA 0.0313
R2WB & R1WB 0.8990

55
Table 4.5 The results from one-way PERMANOVA test based on Jaccard similarity with the
groups identified in Figure 4.20. The biofilm carriers (C) and the water samples (W) from
reactor 1 (R1) and reactor 2 (R2) before (B) and after (A) increased C/N ratio. Significant
difference if P < 0.05. Multiple comparisons of the various groups based on Sequential
Bonferroni correlation (P-value column).
4.3.2 DGGE analysis from the stable nitrification phases and for replicated samples.
PCR products from biofilm carriers taken in stable phases form both the first and second period
and biofilm carriers taken the same day (replicates) from reactor 1 (R1) and reactor 2 (R2) were
analysed on DGGE gel 2 (Figure 4.21). 80 bands were identified on the analysed gel. The
samples were divided in 8 groups based on type of reactor (R1 or R2) and different phases (A,
B, C and X) (Table 4.6). Phase A is from day 17, 30 and 37 in the first period. Phase B is from
day 99 and 104 in the second period. Phase C is day 125, 127 and 130 in the second period.
Replicates from day 152 in the second period are marked with X. Abbreviations for the 8 groups
are therefore: R1A, R2A, R1B, R1B, R1C, R2C, R1X and R2X.
Comparisons P value F P (same) Total sum of
square
R1WB & R1WA 0.1055 7.599
0.0001 3.096
R2WB & R1WA 0.0961
R1CB & R1CA 0.0262
R2CB & R2CA 0.0272
R1WB & R1CB 0.0287
R2WB & R2CB 0.0281
R1CB & R2CB 0.0282
R1CA & R2CA 0.0288
R1WA & R1CA 0.0278
R2WA & R2CA 0.0313
R2WB & R1WB 0.1994

56
Figure 4.21 DGGE gel 2 of biofilm carriers from reactor 1 and 2 in the first and the second
period. Abbreviations: R1 (reactor 1), R2 (reactor 2), M (marker). The numbers (1-152)
represent the day biofilm carriers were sampled. Replicates sampled on day 152 are marked
with X.
The alpha-diversities were calculated based on the 8 groups (Table 4.6). The band richness
ranged from 25-48, the Shannon Diversity ranged from 2.17-2.38, while the evenness ranged
from 0.21-0.33 (Table 4.6). The standard deviations of the average alpha-diversities in the
groups R1X and R2X (replicates) were small, especially for Shannon diversity and evenness
which had standard deviations varying between 0.004-0.03. The Shannon diversity and the
evenness were similar between the phases A, B and C.

57
Table 4.6 Band richness (k`), Shannon diversity index (H`) and evenness (J`) calculated from
the microbial community data from DGGE gel 2 (Figure 4.21). The diversity date was used to
compare the biofilm carriers obtained from reactor 1 (R1) and 2 (R2) during three stable periods
and for replicates sampled the same day. The average and the standard deviation of alpha-
diversities were calculated for the different groups. The numbers (17-152) in the sample name-
column represent the day the biofilm carriers were sampled. Replicates sampled on day 152 in
the second period are marked with X. Samples from group with A are from the first period.
Samples from group with B, C and X are from the second period.
Group
name
Sample
name
Band
richness (k`)
Shannon
Diversity
(H`)
Evenness
eH`/k` (J`)
R2X4 25 2.09 0.32
R2X R2X3 26 2.15 0.33
R2X2 26 2.15 0.33
R2X1 27 2.16 0.32
Average 26 ± 0.8 2.14 ± 0.03 0.33±0.004
R1X
R1X4 34 2.2 0.27
R1X3 34 2.2 0.27
R1X2 39 2.23 0.24
R1X1 39 2.21 0.23
Average 37 ± 2.9 2.21 ± 0.01 0.25 ± 0.02
R2 130 42 2.22 0.22
R2 127 44 2.22 0.21
R2C R2 125 47 2.35 0.22
Average 44 ± 2.5 2.26 ± 0.08 0.22 ± 0.01
R1 130 43 2.28 0.23
R1 127 38 2.19 0.23
R1C R1 125 44 2.28 0.22
Average 42 ± 3.2 2.25 ± 0.05 0.23 ± 0.01
R2B
R2 104 46 2.27 0.21
R2 99 43 2.36 0.25
Average 45 ± 2.1 2.32 ± 0.06 0.23 ± 0.02
R1 104 48 2.38 0.22
R1B R1 99 45 2.28 0.22
Average 47 ± 2.1 2.33 ± 0.07 0.22±0.004
R2A
R2 37 42 2.26 0.23
R2 30 42 2.27 0.23
R2 17 41 2.31 0.25
Average 42 ± 0.6 2.28 ± 0.03 0.23 ± 0.01
R1A
R1 37 37 2.21 0.25
R1 30 36 2.21 0.25
R1 17 33 2.17 0.26
Average 35 ± 2.1 2.20 ± 0.02 0.25 ± 0.01

58
Changes in community structure (beta-diversity) were also investigated. Ordination by Bray-
Curtis similarity principle coordinate analysis (PCoA) indicated changes in community
structure (Figure 4.22). PCoA indicated larger variance between the samples from the first
period (phase A) than the samples from the second period (phase B and C). In addition, PCoA
indicated small variance between the samples taken the same day (replicates), however, the
variance in community structure between the samples from reactor 1 in the second period (R1C)
was smaller.
Figure 4.22 Principle coordinate analysis (PCoA) based on Bray-Curtis similarity of the
microbial communities on the biofilm carriers from reactor 1 (R1) and 2 (R2) based on data
from the DGGE gel (Figure 4.21). The biofilm carriers were sampled in three different stable
phases (A, B and C). Phase A corresponds to day 17, 30 and 37 in the first period, phase B
corresponds to day 99 and 104 in the second period, while phase C corresponds to day 125, 127
and 130 in the second period. Replicates sampled on day 152 in the second period are marked
with X.
Changes in community structure (beta-diversity) were further investigated by statistical
analysis. P values (Sequential Bonferroni correlation) from one-way PERMANOVA test based
on Bray Curtis similarity showed significant difference in community structure between the
replicate samples from reactor 1 (R1X) and reactor 2 (R2X). The difference in community
structure between biofilm carriers taken in the different stable phases were not statically
significant (Table 4.7). One-way PERMANOVA test from based on Jaccard similarity showed
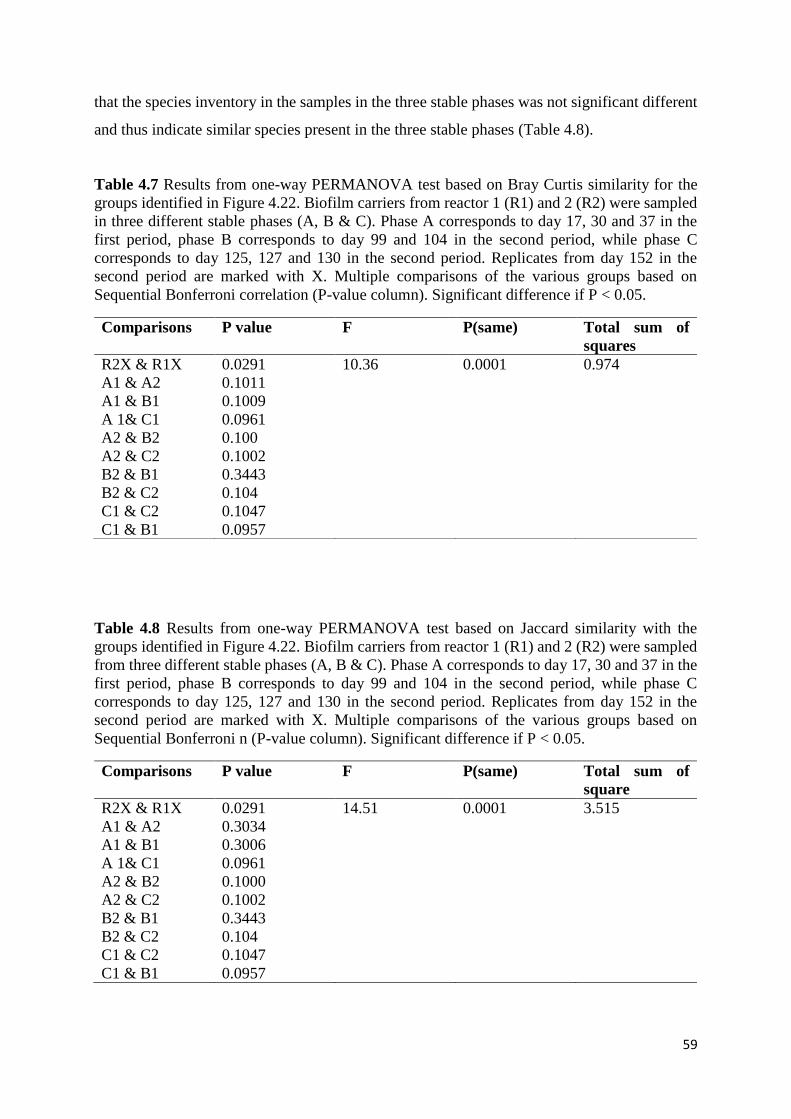
59
that the species inventory in the samples in the three stable phases was not significant different
and thus indicate similar species present in the three stable phases (Table 4.8).
Table 4.7 Results from one-way PERMANOVA test based on Bray Curtis similarity for the
groups identified in Figure 4.22. Biofilm carriers from reactor 1 (R1) and 2 (R2) were sampled
in three different stable phases (A, B & C). Phase A corresponds to day 17, 30 and 37 in the
first period, phase B corresponds to day 99 and 104 in the second period, while phase C
corresponds to day 125, 127 and 130 in the second period. Replicates from day 152 in the
second period are marked with X. Multiple comparisons of the various groups based on
Sequential Bonferroni correlation (P-value column). Significant difference if P < 0.05.
Table 4.8 Results from one-way PERMANOVA test based on Jaccard similarity with the
groups identified in Figure 4.22. Biofilm carriers from reactor 1 (R1) and 2 (R2) were sampled
from three different stable phases (A, B & C). Phase A corresponds to day 17, 30 and 37 in the
first period, phase B corresponds to day 99 and 104 in the second period, while phase C
corresponds to day 125, 127 and 130 in the second period. Replicates from day 152 in the
second period are marked with X. Multiple comparisons of the various groups based on
Sequential Bonferroni n (P-value column). Significant difference if P < 0.05.
Comparisons P value F P(same) Total sum of
squares
R2X & R1X 0.0291 10.36
0.0001 0.974
A1 & A2 0.1011
A1 & B1 0.1009
A 1& C1 0.0961
A2 & B2 0.100
A2 & C2 0.1002
B2 & B1 0.3443
B2 & C2 0.104
C1 & C2 0.1047
C1 & B1 0.0957
Comparisons P value F P(same) Total sum of
square
R2X & R1X 0.0291 14.51
0.0001 3.515
A1 & A2 0.3034
A1 & B1 0.3006
A 1& C1 0.0961
A2 & B2 0.1000
A2 & C2 0.1002
B2 & B1 0.3443
B2 & C2 0.104
C1 & C2 0.1047
C1 & B1 0.0957

60
4.4 VEAS wastewater treatment plant: Competition between nitrifying and
heterotrophic bacteria
The hypothesis behind the experiments at VEAS was that the automatic washing process of
Leca biofilters removed high amounts of heterotrophic bacteria from the outer layers of the
biofilm, and not high amounts of the nitrifying bacteria in the inner layers of the biofilm.
If this was the case, the washing process should promote the stabilisation of the nitrification
process. Oxygen consumption experiments and DGGE analysis were performed to investigate
the hypothesis.
4.4.1 Oxygen consumption experiment at VEAS
The oxygen consumption experiments between washed and unwashed biofilter showed a 4 %
difference in oxygen consumption between the unwashed and washed biofilter (Figure 4.23).
The lines of regression were calculated from the linear regions (5 first samplings points: time
0-4) (Figure 4.23). In the unwashed biofilter, the oxygen consumption rate was 0.252 mg O2/L
min, while in the washed biofilter, the oxygen consumption rate was 0.241 mg O2/L min.
Figure 4.23 The oxygen consumption in the washed and the unwashed biofilter (nitrification
filter 83). The lines of regression were calculated from the linear regions (time: 0-40 min).
Unwashed y = -0.252x + 9.533
R² = 0.999
Washed y = -0.241x + 9.638
R² = 0.997
0
1
2
3
4
5
6
7
8
9
10
0 20 40 60 80 100
Oxygen
[m
g/L
]
Time [min]
Unwashed
Washed

61
The unwashed and washed biofilters showed similar changes in ammonium, nitrite and nitrate
concentration (Figure 4.24), and thus nitrification activity. The nitrite and the nitrate
concentration increased in the beginning of the experiment, but decreased in the final part of
the experiment for both unwashed and washed biofilters. Linear regression was performed on
the ammonium concentration in unwashed and washed biofilters, which showed a 19 %
difference in ammonium consumption rate (Figure 4.24). The ammonium consumption rate was
higher in the washed biofilm (0.077 mg NH4+-N/L min) than in the unwashed biofilm (0.062
mg NH4+-N /L min). When the oxygen concentration was under 1 mg O2 /L, the ammonium
consumption stopped in the washed and the unwashed biofilters. The loss of nitrogen from the
nitrogen budgets (sum of NO3--N + NO2
--N + NH4+-N) from the washed and the unwashed
biofilters increased with time in the oxygen consumption experiment (Figure 4.25). The loss of
nitrogen was higher in washed biofilters than in unwashed biofilters.
Figure 4.24 The change in ammonium (NH4+-N), nitrite (NO2
--N) and nitrate (NO3--N)
concentration with time (minutes) in the washed (left) and the unwashed biofilter (right) from
nitrification filter 83.

62
Figure 2.25 The nitrogen loss (%) as a function of time (min) from washed and unwashed
biofilter from nitrification filter 83 (Table 4.9 C). The nitrogen loss was calculated from the
sum of nitrogen (NO3--N + NO2
--N + NH4+-N) compounds at a specific time divided on the
sum of nitrogen compounds (NO3--N + NO2
--N + NH4+-N) at time 0.
4.4.2 DGGE analysis of nitrification biofilter at VEAS
The objective of DGGE analysis was to investigate if the microbial community structure was
different for washed and unwashed biofilters, as part of testing the hypothesis in section 4.4.
Wash water from the washing process was also analysed. Nitrification filters identification and
sampling times are shown in Table 4.9 and 4.10.
Table 4.9 Sampling details for the first period at VEAS. Nit refers to nitrification filter. Letters
(C-G) represent samples taken from a nitrification filter at the same day.
Date 28.09.2016 28.09.2016 29.09.2016 29.09.2016 30.09.2016
Letter G F E D C
Unwashed
Time
Nit-81
07:00-07:15
Nit-84
09:55-10:00
Nit-83
13:00-13:10
Nit-82
13:30-13:35
Nit-83
07:10-07:15
Washed
Time
Nit-81
07:55-08:07
Nit-84
10:52-11:00
Nit-83
13:40:13:52
Nit-82
14:28-14:37
Nit-83
07:40-07:50
Wash water
Time
Nit-81
07:50
Nit-84
10:15
Nit-83
13:15
Nit-82
13:58
Nit 83
07:37
Unwashed y = 0.062x + 0.387
R² = 0.971
Washed y = 0.077x + 0.809
R² = 0931
0
1
2
3
4
5
6
7
8
9
10
0 20 40 60 80 100 120
Nit
rogen
loss
[%
]
Time [min]
Unwashed
Washed
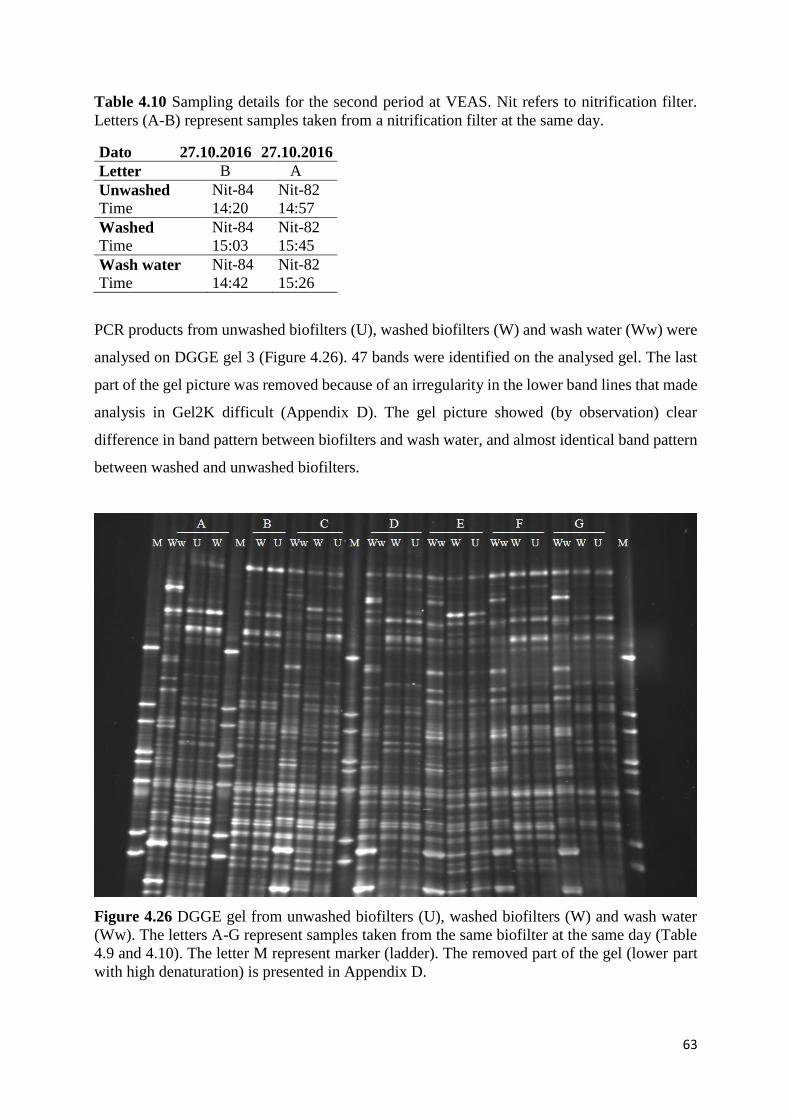
63
Table 4.10 Sampling details for the second period at VEAS. Nit refers to nitrification filter.
Letters (A-B) represent samples taken from a nitrification filter at the same day.
Dato 27.10.2016 27.10.2016
Letter B A
Unwashed Nit-84 Nit-82
Time 14:20 14:57
Washed Nit-84 Nit-82
Time 15:03 15:45
Wash water Nit-84 Nit-82
Time 14:42 15:26
PCR products from unwashed biofilters (U), washed biofilters (W) and wash water (Ww) were
analysed on DGGE gel 3 (Figure 4.26). 47 bands were identified on the analysed gel. The last
part of the gel picture was removed because of an irregularity in the lower band lines that made
analysis in Gel2K difficult (Appendix D). The gel picture showed (by observation) clear
difference in band pattern between biofilters and wash water, and almost identical band pattern
between washed and unwashed biofilters.
Figure 4.26 DGGE gel from unwashed biofilters (U), washed biofilters (W) and wash water
(Ww). The letters A-G represent samples taken from the same biofilter at the same day (Table
4.9 and 4.10). The letter M represent marker (ladder). The removed part of the gel (lower part
with high denaturation) is presented in Appendix D.

64
Alpha-diversities were calculated based on these groups: unwashed biofilters, washed biofilters
and wash water (Table 4.11). The band richness varied between 26-37, the Shannon diversity
varied between 2.84-3.20, while the evenness varied between 0.50-0.75. The average band
richness, the average Shannon diversity and the average evenness were similar for the three
groups (Table 4.11).
Table 4.11 Band richness (k`), Shannon diversity index(H`), evenness (J`) calculated for
unwashed biofilters (U), washed biofilters (W) and wash water (Ww). The letters A-G represent
samples taken from the same biofilter at the same day (explained in table 4.9 and 4.10). The
averages and the standard deviations of alpha-diversities were calculated for the three group.
Group
name
Biofilter
Samples Band
richness
(k`)
Shannon
Diversity
(H`)
Evenness
eH`/k`
(J`)
G U81 26 2.89 0.69
F U84 29 3.02 0.71
E U83 30 3.11 0.75
U D U82 33 3.19 0.74
C U83-2 35 3.18 0.68
B U84-2 33 3.12 0.69
A U82-2 32 3.00 0.63
Average 31 ± 3.0 3.07± 0.11 0.70 ± 0.04
G W81 27 2.95 0.71
F W84 28 2.96 0.69
E W83 29 2.96 0.66
D W82 33 3.16 0.71
W C W83-2 33 3.11 0.68
B W84-3 33 3.08 0.66
A W82-2 30 2.96 0.64
Average 30 ± 2.6 3.02 ± 0.09 0.68 ± 0.03
G Ww81 27 2.93 0.69
F Ww84 29 2.99 0.69
Ww E Ww83 31 3.03 0.66
D Ww82 37 3.20 0.66
C Ww83-2 34 2.84 0.50
A Ww82-2 37 2.96 0.52
Average 33 ± 3.8 2.99± 0.12 0.62 ± 0.09
Changes in community structure (beta-diversity) were also investigated. Ordination by
principle coordinate analysis (PCoA) based on Bray Curtis similarities of microbial community
structure from DGGE gel 3 (Figure 4.26) indicated high variance between the wash water and
the biofilters (both unwashed and washed).

65
Figure 4.27 Principle coordinate analysis (PCoA) based on Bray Curtis similarity calculated
from banding pattern in DGGE gel 3 (Figure 4.26). U represents the samples from unwashed
biofilters (black dots), W represents samples from washed biofilter (red dots) and Ww represent
samples from wash water (blue dots). The numbers 81-84 represent the different nitrification
filters explained in Table 4.9 and 4.10.
PCoA indicated also that the community structure was similar in the unwashed and the washed
biofilters (Figure 4.27). One-way PERMANOVA based on Bray Curtis similarities between the
three groups confirmed this (Table 4.12). P values from multiple comparisons (Sequential
Bonferroni correlation) showed that the difference in community structure between unwashed
and wash biofilter was not significant, whereas the difference in community structure between
the wash water and the biofilters (unwashed and washed) was significant. One-way
PERMANOVA test based on Jaccard similarity showed that the difference in species inventory
between washed and unwashed biofilters was not significant, whereas the species composition
in biofilters and in wash water was significant different (Table 4.13).
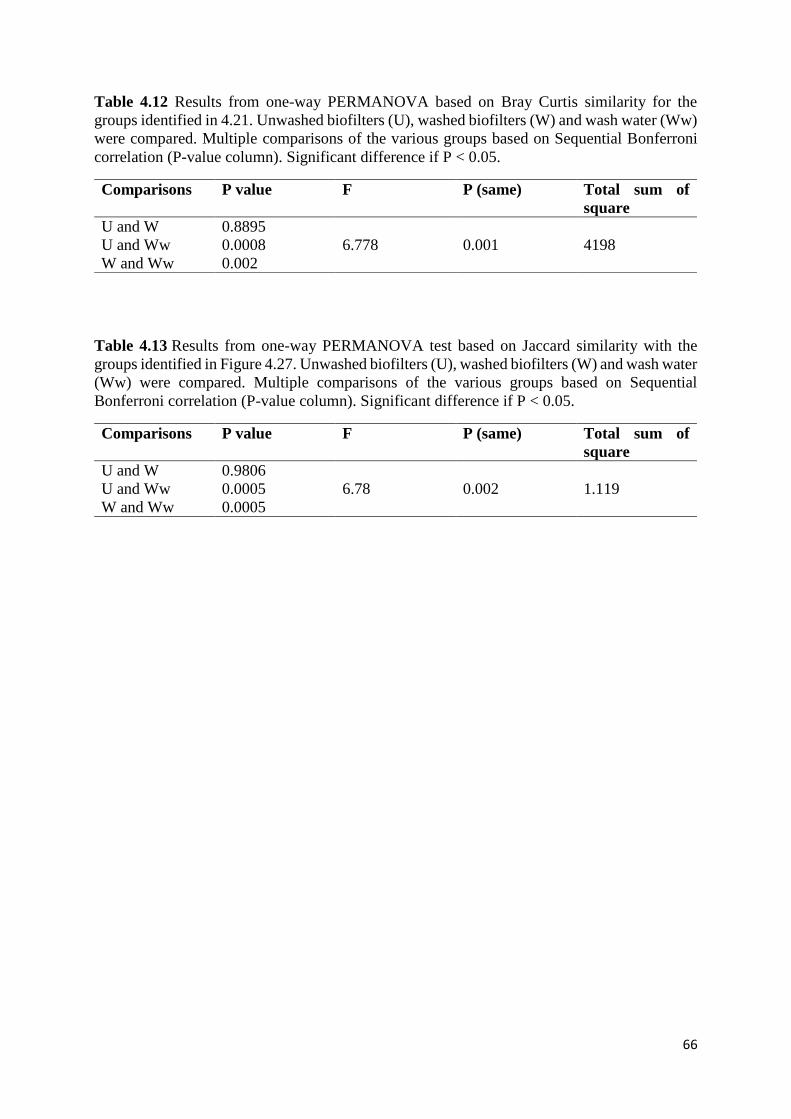
66
Table 4.12 Results from one-way PERMANOVA based on Bray Curtis similarity for the
groups identified in 4.21. Unwashed biofilters (U), washed biofilters (W) and wash water (Ww)
were compared. Multiple comparisons of the various groups based on Sequential Bonferroni
correlation (P-value column). Significant difference if P < 0.05.
Table 4.13 Results from one-way PERMANOVA test based on Jaccard similarity with the
groups identified in Figure 4.27. Unwashed biofilters (U), washed biofilters (W) and wash water
(Ww) were compared. Multiple comparisons of the various groups based on Sequential
Bonferroni correlation (P-value column). Significant difference if P < 0.05.
Comparisons P value F P (same) Total sum of
square
U and W 0.9806
6.78
0.002
1.119 U and Ww 0.0005
W and Ww 0.0005
Comparisons P value F P (same) Total sum of
square
U and W 0.8895
6.778
0.001
4198 U and Ww 0.0008
W and Ww 0.002
67
5. Discussion
The competition between nitrifying and heterotrophic bacteria was investigated in two different
nitrification biofilm systems in order to improve the ammonium removal efficiency and
functionality. The nitrification activity and the microbial community structure in two lab-scale
MBBR at Department of Biotechnology (NTNU) were investigated. In addition, the effect of
organic carbon concentration on the nitrification process was studied. Furthermore, the oxygen
consumption, the ammonium consumption and the microbial community structure in
nitrification biofilters consisting of Leca particles in the BIOFOR system at VEAS were
investigated.
5.1 Evaluation of selected methods, experimental set-up and instruments
Oxygen measurements were only performed in the end of the long-term MBBR experiments
due to lack of an oxygen electrode earlier. Continuous oxygen measurements could have been
interesting for investigation of the development of heterotrophic bacteria over time. In addition,
continuous oxygen measurements with an oxygen electrode would have given a higher
resolution of the difference in the oxygen consumption rate between the washed and unwashed
biofilter in the experiments at VEAS (Figure 4.23). Multiple parallels of the oxygen
consumption batch experiments at VEAS could also have given a better answer on the
difference in ammonium removal efficiency and oxygen consumption between the washed and
the unwashed biofilters.
For long-term MBBR experiments in the future, newer pumps would be an advantageous for
improved accuracy and time saving. The Masterflex easy load L/S pumps used in the long-
terms experiments maintained correct flow rates over longer time periods. However, the main
disadvantages of the Masterflex pumps were abrasion on the plastic tubings and adjustment of
the flow rate. Considerable time was spent on obtaining correct flow rate as the flow rate was
manually adjusted and measured with a stopwatch and a measuring cylinder. The plastic tubings
were replaced every time a new medium was made. Strong abrasion on the pump tubings was
discovered because of inaccuracies in the flow rates. Deviation values caused by the various
problems in the long-term continuous experiments were removed from the calculation of the
averages (Appendix A). Most likely, these problems had minor impact on the results obtained

68
in the present work as the reactors stabilized after the different incident. In addition, the
deviation values were removed from the calculation of the averages in further analyses,
discussion and conclusion.
DGGE was used for analysing the microbial community structure in the biofilm samples from
MBBR and BIOFOR. It has been claimed that species under 1 % of the total community are
rarely shown on the DGGE gel (Eiler et al., 2003). Changes in the number of nitrifying bacteria
or other species in biofilms during increasing C/N ratios can be difficult to detect because of
the high numbers of heterotrophic bacteria. The weakest band detected in the two DGGE gels
from the MBBR experiments (Figure 4.21 and 4.26) was 0.01 % of the total sample. The
weakest gel band detected in the DGGE gel from VEAS (gel 3, Figure 4.26) was 0.04 % of the
total sample. Most likely some of the bands were not properly separated on the gel, however,
this had probably little impact on the result of the microbial community analyses.
5.2 MBBR: Competition between nitrifying and heterotrophic bacteria
5.2.1 Long-term MBBR experiments
Two MBBR with different C/N ratios were continuous operated during two separate periods
(first period: 36 days, second period: 152 days) to investigate the impact of organic carbon on
the nitrification activity and the ammonium removal efficiency in the biofilms. Adaption to
changes such as increased C/N ratio and increased organic loading were also investigated
(perturbation experiments). The difference in nitrification activity between reactor 1
(continuous C/N ratio 1) and reactor 2 (continuous C/N ratio 0) was small in both periods
(Figure 4.2). In the first period (day 3-36), nitrite was accumulating from day 11-27 in reactor
1, whereas in reactor 2, no nitrite accumulation over time was observed. This was the only clear
difference between the reactors in the first period. The accumulation of nitrite in reactor 1
indicated weak inhibition of NOB, most likely because of increased competition with
heterotrophic bacteria. Piculell et al. (2016) observed that thicker biofilms in MBBR most likely
was advantageous for the NOB. Their results indicated that the ratio of NOB to AOB decreased
when the biofilm was thinner than 300 μm. This might explain why not an increase in the nitrite
concentration was seen in the continuous operating reactors in the second period (days 3-130),
as the reactors had been operated for a longer period and the biofilm therefore most likely was
thicker than 300 μm.

69
In the long-term experiments (second period: day 3-130), no clear difference was observed
between reactor 1 and reactor 2 with respect to nitrification activity (Figure 4.2, Table 4.2). A
reduction in nitrification activity was not observed in reactor 1, which had been continuous fed
with a C/N ratio of 1 (Figure 4.2). The results indicate that the nitrifying bacteria were not
hindered by the heterotrophic bacteria in the biofilm in reactor 1, even though the reactor had
been continuously operated for over 100 days. The combination of high HRT (13 hours), high
oxygen concentration in the reactors (Figure 4.11), and high ammonium concentration in the
inlet (100 NH4+-N mg/L) gave most likely the nitrifying bacteria satisfying conditions in both
reactors. Hu et al. (2009) showed that nitrifying and heterotrophic bacteria can grow together
at the same time in a biofilm if the substrate and oxygen concentrations are not limiting. In most
wastewater plants, varying amounts of organic carbon are reaching the nitrification filters, still
the nitrification process works at a satisfactory level most of the time. Hu et al. (2009) and Zhu
and Chen (2001) have investigated the impact of C/N ratios on nitrification, and the studies
have clearly shown that organic carbon has a negative impact on the nitrification process.
Therefore, the results obtained here, demonstrating that reactors with a C/N ratio of 0 and 1
have a similar long-term nitrification activity, are surprising.
The microbial community structure of the biofilms from three different stable nitrification
phases in the first and the second period of the long-term continuous experiments were
investigated in DGGE gel 2 (Figure 4.21). One-way PERMANOVA test based on Bray Curtis
similarity showed that the microbial community structure of biofilms from the different stable
nitrification phases were not significant different (Table 4.7). Furthermore, the alpha-diversity
was similar for the all the stable nitrification phases (Table 4.6). These results indicate that the
microbial community structure in the reactor 1 (C/N ratio 1) and reactor 2 (C/N ratio 0) were
similar and stable, even though the reactors had been operating for two long periods and with
different C/N ratios. The results confirm the findings related to the nitrification activity, which
was similar for reactor 1 and 2 in long-term operations in first and the second period (day 3-
130) (Table 4.2).
A high HRT and a C/N ratio of 1 might have given advantageous conditions for the heterotopic
planktonic bacteria, hence the heterotrophic bacteria in the biofilm may have been fed less
organic carbon than expected. This is another possible explanation for the small difference in
nitrification activity between the reactors. Cell counting by flow cytometer (Figure 4.17)

70
showed a high number of planktonic cells and cell aggregates in reactor 1, which supports the
explanation for the small difference in nitrification activity between the reactors stated above.
The high number of planktonic cells and cell aggregates may also explain the small difference
between the reactors in the first organic carbon inhibition experiment at day 37 in the first period
(Figure 4.3). It is possible that a reduction in the nitrification activity in reactor 1 might have
been discovered if the reactor had been operated for a longer period of time (200-300 days).
Since the long-term continuous experiments (second period: days 3-130) showed small
differences in nitrification activity between the reactors, the biofilms in the reactors were
challenged with higher organic carbon concentrations in two perturbation experiments. The first
perturbation experiment, where the C/N ratio was increased to 3 (day 131-138), showed 13 %
higher ammonium consumption rate in reactor 2 than in reactor 1 for 9 hours after C/N ratio
was increased (Figure 4.8). This result indicates a higher ammonium removal efficiency in
reactor 2 shortly after increased C/N ratio.
Two days after the C/N ratio was increased, the nitrite concentration increased in reactor 2,
however, the reactor managed to stabilize quickly (Figure 4.1 E). Reactor 1 showed a tendency
of nitrite accumulating, but after the loading rate was increased, the nitrite concentration was
lowered in reactor 1 as well. This results may indicate that reactor 2 managed to stabilize
quicker than reactor 1 and thus had higher nitrification robustness. This result indicate that NOB
were inhibited after increased C/N ratio, but that the strong inhibition was short-term. The
difference in average nitrification activity was similar for the reactors after the C/N ratio was
increased, however, there were few sampling points and high standard deviations for the
average nitrogen concentrations (day 131-138).
The acetate consumption rate was considerably higher for the biofilm in reactor 1 than reactor
2 in the 9 hours after the C/N ratio was increased (Figure 4.7). This result is a strong indication
that continuously supply of C/N ratio of 1 for over 130 days had contributed to increased growth
of heterotrophic bacteria in the biofilm from reactor 1 compared to reactor 2. This assumption
is supported by the short-term oxygen consumption in the batch experiment. The oxygen
consumption rate was 23 % higher for the biofilm carrier from reactor 1 than for biofilm carriers
from reactor 2 (second period: days 89-90) (Figure 4.5).

71
High heterotrophic activity after increased C/N ratio to the biofilm can contribute to increased
oxygen competition in the biofilm. This can create anaerobic zones in the deeper layer of the
biofilm, which can be a good environment for denitrifying bacteria. Loss of nitrogen was
observed in reactor 1 the first hours after the C/N ratio was increased to 3, while no nitrogen
loss was seen in reactor 2 in the same period of time (Figure 4.10). Loss of nitrogen indicates
a high number of denitrifying bacteria present in reactor 1 and anaerobic conditions in the
biofilm. These results are corroborating by Hu, Li et al. (2009), who detected increased nitrogen
loss, increased denitrification, lowered ammonia removal rate and a shift in the microbial
community after the C/N ratio to the biofilm was increased.
The development of the organic carbon consumption rate in reactor 2 indicated that even though
no organic carbon was introduced (unlike in most wastewater plants) to reactor 2 before day
131, the response time was short (< 24 hours) before reactor 2 consumed organic carbon equally
to reactor 1 (Figure 4.7). The short response time indicate that heterotrophic bacteria already
were present on the biofilm carriers from reactor 2, and that they most likely have been living
on organic carbon from dead organisms. The oxygen consumption rate was higher in reactor 2
than reactor 1 after the C/N ratio was increased to 3 (Figure 4.9). This supports the dramatically
planktonic cell growth in reactor 2 after the C/N ratio and the organic loading rate were
increased (Figure 4.17). The results showed that previous continuous supply of organic carbon
(as in reactor 2) is not necessary for the biofilm to be able to handle higher amounts of organic
carbon in the wastewater. Gonzalez-Silva et al. (2016) showed by pyrosequencing that the
biofilm communities in three nitrifying MBBR without organic carbon in the medium were
dominated by heterotrophic bacteria. For the three reactors, 71, 57, and 67 % of the sequence
reads representing the biofilm communities were classified as heterotrophic bacteria, and 90 %
of OTUs identified (in the data set) did not represent nitrifying bacteria.
After increased loading rate (second period, days 139-152), the main difference in response
between the reactors was the development of ammonium concentration. Both the reactors
showed varying ammonium concentration in the first days after the loading rate was increased,
but after some days, the average ammonium concentration was increased in both the reactors
compared to average ammonium concentration before the perturbations experiments (Figure
4.1). This is an indication of decreased ammonium removal efficiency in both the reactors. The
nitrifying bacteria did not manage to adjust to the increased loading of nitrogen and removed
nitrogen with the same efficient as before. This is unlike the heterotrophic bacteria, which

72
managed to adapt to the increased loading rate of organic carbon. The organic carbon
concentration remained low in both the reactors throughout the period (Figure 4.14). Increased
ammonium concentration indicate that the growth rate of the nitrifying bacteria was inhibited
by the higher growth rate of heterotrophic bacteria.
At day 145-152, a gap was observed between the nitrification activity calculated from the nitrate
production (NO3--N/L h) and the nitrification activity calculated from the ammonium
consumption (NH4+-N /L h) in both the reactors (Figure 4.2 E-F). The result can be in agreement
with the organic carbon experiments (day 99, 2. Period) (Section 4.2.1), where the final
concentration of nitrite was higher than the final concentration of nitrate after the sodium acetate
concentration was increased. The results indicate that NOB were inhibited more than AOB after
the organic carbon concentration was increased, and that the competition for oxygen
presumably increased in the biofilm. Hu, Li et al. (2009) observed lower nitrate production with
higher C/N ratios, and concluded that NOB utilize oxygen slower than AOB.
Nitrogen loss was observed in both the reactors after loading rate was increased (Figure 4.2 E-
F). This is a strong indication of denitrification activity in the reactors. The degree of inhibition
of NOB can therefore be overestimated based on the nitrification activity calculations.
Denitrifying bacteria consume nitrate in the reactors, and therefore, high amounts of
denitrifying bacteria will contribute to lower nitrate concentration in the reactors, which will
give lower nitrate production values (NO3--N/L h), as were observed in Figure 4.2 E-F. Based
on the nitrification activity calculations after increased loading rate, it cannot be concluded that
NOB were more inhibited than AOB. A conclusion might be that AOB were inhibited by the
higher average ammonium concentration in the reactors after the second perturbation
experiment. This conclusion corresponds with Satoh et al. (2000), who detected that increased
C/N ratio almost immediately started to inhibit AOB in the biofilm due to increased oxygen
competition in the biofilm. The tenedency seen in the two pertubation experiments was
inhibition of NOB shortly after increased C/N ratio and AOB after increased loading.
The difference in nitrification activity was similar between the reactors, also after increased
loading rate, but reactor 2 showed higher variation in nitrification activity given a nitrate
production (NO3--N/L h) (Table 4.2). The ammonium concentrations were lower in reactor 2
than reactor 1 the last days before shut-down of the reactors (Figure 4.15). It is difficult to
conclude that there was a difference between the reactors with respect to nitrification efficiency,

73
stability and response due to variations in the nitrogen concentrations and short operation time
after the loading rate was increased (Figure 4.1). Based on the average calculations and
observations, it seems that reactor 1 was further weakened in nitrogen efficiency compared to
reactor 2, but reactor 2 had higher variation in nitrification activitiy (NO3--N/L h) and higher
ustability in the nitrification process (Figure 4.1, Table 4.2) The main conclusion is that
increased organic loading was negative affecting both the reactors. Furter statistical tests are
needed for significant to determine if reactor 2 handled the pertubations better, and maybe a
longer operation time had been neseccary for cleary see if both reactors manged to stabilize the
nitrfication process and see the difference in nitrification efficiency.
The microbial community structure was investigated before and after the C/N ratio and the
loading rate were increased (perturbation experiments). One-way PERMANOVA test based on
Bray Curtis Similarity showed that biofilm carriers taken before increased C/N ratio were
significantly different in community structure compared to the biofilm carriers taken after the
C/N ratio and the loading rate were increased (Table 4.4). The changes in species inventory
were confirmed by One-Way PERMAMOVA test based on Jaccard similarity (Table 4.5). This
is most likely a result of increased heterotrophic growth, and the result illustrate how fast a
stable microbial community structure can change after the organic carbon concentration is
increased. The average band richness and the Shannon diversity were lowered in the biofilm in
both the reactors after the C/N ratio and the loading rate was increased (Table 4.3). This result
corresponds with Michaud et al. (2006) who found a reduction of taxa richness and diversity
after the C/N ratio was increased in a moving bed biofilm system.
5.2.2 Short-term organic carbon inhibition experiments
The organic carbon inhibition experiment was repeated twice to investigate if there was a
difference in acute organic carbon inhibition of the nitrification activity between the biofilm
from reactor 1 (with continuous organic carbon supply) and the biofilm from reactor 2 (without
continuous organic carbon supply). The difference in nitrate accumulation rate between reactor
1 and reactor 2 was small the first time the experiment was performed (day 37, 1. period) (Figure
4.2). The nitrate accumulation rate was slightly higher in the biofilm from reactor 2 than for the
biofilm from reactor 1 for every concentration of sodium acetate. High degree of inhibition of
nitrate accumulation was not shown for neither of the reactors. The result indicates that the
ammonium removal efficiency in the biofilm from reactor 2 was higher, however, the difference

74
between the nitrate accumulation rates was too small to conclude if there was a difference in
the nitrification robustness. In the second experiment, the organic carbon inhibition of the
nitrification process was greater, which may be explained by thicker biofilms, increased
heterotrophic growth due to longer operations time, and higher organic carbon concentrations
(Figure 4.3).
The maximum organic carbon concentration was increased from 100 mM to 1000 mM the
second time the organic carbon inhibition experiment was performed (day 99, 2. period) (Figure
4.3) EC50 value of sodium acetate for the nitrification activity was 11 times higher for the
biofilm from reactor 2 than the biofilm from reactor 1. This result support the hypothesis that
long-term supply of organic carbon has a negative impact on ammonia removal efficiency. The
nitrification activity was almost completely inhibited in reactor 1 at 1000 mM. Nitrification
robustness against acute toxic concentrations of organic carbon was thus considerably higher
for reactor 2 than for reactor 1. This is based on the fact that the biofilm from reactor 2 managed
to obtain nitrification activity even at an organic carbon concentration as high as 1000 mM.
Similar results have been shown in nitrification MBBR by Henry et al. (2016), where EC50 for
sodium acetate dropped from 274 mM to 15 mM after the biofilm was chronically exposed to
organic carbon. In the study by Henry et al. (2016), heterotrophic growth caused lower
robustness of the nitrification process against acute toxic organic carbon concentrations
compared to the control reactors without continuous organic carbon loading over time.
A relevant comparison between the long-term continuous experiment (Figure 4.1) and the
organic carbon inhibition experiment (Figure 4.3) is the intensity of the organic loading. A C/N
ratio of 1 and 3 is equivalent to 3.57 mM and 10.7 mM sodium acetate, respectively. The organic
loading is coming dropwise in the continuous MBBR and high numbers of heterotrophic
planktonic bacteria are present in the reactors. In the organic carbon inhibition experiments, the
organic loading was added all at once to the biofilm carriers and at the start the medium did not
contain heterotrophic planktonic bacteria that could immediately start consumption of organic
carbon. Therefore, the oxygen competition was probably higher between heterotrophic and
nitrifying bacteria in the biofilm in the organic carbon inhibition experiment. This can be an
explanation for the immediate inhibition of nitrification activity after addition of organic carbon
in the organic carbon inhibition experiments.

75
The summary of the long-term and short-term experiments is that a long-term supply of a C/N
ratio of 1 reduced the nitrification robustness towards acute toxic organic carbon loadings. This
was shown clearly in the short-term organic carbon inhibition experiment. This give a clear
indication of the negative impact increased competition with heterotrophic bacteria has on the
efficiency in the nitrification process. The long-term nitrification stability did not decrease after
long-term supply of a C/N ratio of 1. After the perturbations experiments, the average
nitrification activity did not decrease in the reactors. However, the nitrification efficient did
decrease because the average ammonium concentration was increased in both the reactors after
the loading rate was doubled.
5.3 VEAS wastewater treatment plant: Competition between nitrifying and
heterotrophic bacteria
The objective of the oxygen consumption/nitrification experiment at VEAS and the DGGE
analysis of the microbial communities was to investigate whether the automatic washing
process of nitrification biofilters consisting of Leca removed high amounts of heterotrophic
bacteria from the outer layers of the biofilm, and not high amounts of the nitrifying bacteria in
the inner layers of the biofilm.
The oxygen consumption rate was 4 % higher in the unwashed biofilter than the washed
biofilter, while the ammonium consumption rate was 19 % lower in the unwashed biofilter than
in the washed biofilter. The results indicate that the washing process removed some of the
heterotrophic bacteria as the oxygen consumption decreased and ammonia removal efficiently
increased in the washed biofilter. In addition, these differences indicate that high amounts of
heterotrophic bacteria existed in the biofilm even after the washing process was finished.
However, the 4 % difference in oxygen consumption seemed to increase the oxygen penetration
into the biofilm. The results may also indicate that the nitrification process at VEAS is oxygen
limited, and thus may have room for improvements. The organic carbon concentration in the
wastewater that reached the nitrification filters gave good growth conditions for the
heterotrophic bacteria in the biofilm. High heterotrophic growth might contribute to the
decrease the nitrification efficiency due to increased competition for oxygen in the biofilm, and
the washing process contributed to better oxygen penetration by removing biofilm layers. The
oxygen consumption experiment was performed without parallels, and the differences observed

76
between the washed and the unwashed biofilter may have been considered to be statistically
insignificant if the experiment had been repeated.
The nitrogen budget for the washed and unwashed biofilter showed loss of nitrogen, which
suggest that denitrification takes place in the nitrification reactors (Figure 4.25). Mao et. al
(2008) detected high denitrification activity and heterotrophic activity in the nitrification
biofilters at VEAS. High denitrification and anaerobic activity in the biofilter is a good
explanation for the loss of nitrogen as the nitrite and the nitrate concentration decreased when
the oxygen concentration went under 1 mg O2/L (Figure 4.24). The 19 % inhibition of the
ammonium removal rate in the unwashed biofilter indicates that the nitrification process is
oxygen restriction in the biofilm. Mao et al. (2008) showed that nitrification in the biofilm on
the Leca particles declined strongly when oxygen concentration was low in the batch.
The one-way PERMANOVA test based on Bray Curtis similarity of the microbial community
composition (Table 4.12) showed no significant difference between the washed and the
unwashed biofilter. The P-value from one-way PERMANOVA test based on Jaccard similarity
comparing washed and unwashed biofilter was close to 1, which is a strong indication that
certain species was not removed from the biofilm after the washing process (Table 4.13).
Measurements of alpha-diversities also indicated that the microbial community structure in
washed and unwashed biofilter was similar. Mao et al. (2008) showed that the microbial
community composition (DGGE profil) in three different nitrification filters at VEAS was
similar at all depths of the nitrification filters and between the filters. This support the results
in the present work showing low variance in alpha- and beta diversities between different filters
and between washed and unwashed biofilter.
The results from DGGE, showing that unwashed and washed biofilters were similar, are not
supported by the results from the oxygen consumption experiments.
DGGE and oxygen consumption measurements are not methods with a high degree of accuracy.
The washing process most probably removed only a small fraction of the total biomass in the
stationary biofilter. The amount of biomass (microorganisms) was probably high in the washed
biofilter, and therefore, the oxygen consumption rate will be equally high in the washed
biofilter. DGGE are used for analysing variations in microbial community structure, and if
changes in the microbial community only occur in a small fraction of the total sample, these
changes can be suppressed in the DGGE analysis.

77
The results from the oxygen consumption experiments indicated that the washing process
removed heterotrophic bacteria from the outer layers of the biofilm. Since the microbial
community composition analysis showed no significant difference between unwashed and
washed biofilters, the hypothesis can only be partially confirmed.
To improve ammonium removal efficiency and functionality, the nitrification process should
be favoured. The results obtained from the two systems in the present work indicated that the
ammonium removal efficiency decreased due to the negative impact of the heterotrophic
bacteria. Especially, the competition for oxygen increased when organic carbon reached the
biofilm. Therefore, it is recommended that research in the future focus on removing higher
amounts of organic matter before the nitrification filter, even though the nitrification process
might work at a satisfactory level with current C/N ratios in the wastewater.
5.4 Future works
There is still much more to learn and investigate when it comes to the competition between
nitrifiers and heterotrophs. Partial sequencing of the 16S-rRNA gene would give more detailed
taxonomic information about the microbial communities, and would be a natural next step to
continue the reached conducted in this thesis. Sequencing of 16S rRNA from biofilm samples
was not performed in the present work due to time constrains. Illumina sequencing is an
appropriate method for complete microbial community analysis as it gives genus information
for the organisms present. It will thus be possible to divide the community into heterotrophs,
AOB and NOB, and in that way, get more detailed information on the dynamics of the
communities, especially for the samples from the MBBR under different C/N ratios.
Sequencing of 16S rRNA from the nitrification biofilters at VEAS and measurements of
bacteria concentrations before and after the washing process would probably have given better
results regarding the amounts of heterotrophic bacteria that are removed from the outer layers
of the biofilm during the washing process
In the future, it would have been interesting to perform similar long-term and short-term
experiments in seawater and brackish reactors, and compare the results with those from the
freshwater systems studied in this master thesis. In addition, it would have been interesting to
perform similar short-term experiments in computer controlled reactors for better and more

78
precise metabolic activity measurements of carbon dioxide production and oxygen
consumption under different C/N ratios. Long-term experiments with higher C/N ratios (3, 4 or
5) and regularly sampling of biofilm carriers would also be interesting for monitoring the
change in microbial communities.

79
6. Conclusions
Conclusion from the MBBR experiments:
The following results were obtained:
A C/N ratio of 1 did not affect the nitrification efficiency in the long-term stable
continuous operations.
The biofilm that had been exposed to a C/N ratio of 1 over a longer period of time had
a considerably lower nitrification activity at acute high organic carbon concentrations
compared to the biofilm with a long-term supply of a C/N ratio of 0.
After the C/N ratio was increased to 3, the response time was under 24 hours before the
reactor without previous exposure to organic substrate could consume organic carbon
substrate equally fast as the reactor with previous exposure to organic substrate.
After loading rate of carbon was increased, the nitrification efficiency was decreased in
both the reactors.
Denitrification was observed in both the reactors after loading rate of carbon was
increased as loss of nitrogen (NH4+-N, NO2
--N, NO3--N) was detected in the nitrogen
budgets.
The conclusion based on these results is that the nitrification efficiency was not considerably
reduced after long-term supply of a C/N ratio 1. In acute high organic carbon concentrations,
the nitrification efficiency was reduced, which indicates reduced robustness of the biofilm that
had been long-term exposed to organic carbon). However, higher loading rate of carbon gave
reduction in the nitrification efficiency in both the systems (long-term continuous C/N ratio of
1 and long-term continuous C/N ratio of 0).

80
Conclusions from the nitrification filters in the BIOFOR system at VEAS:
The main results obtained from the nitrification filters at VEAS was:
Compared to unwashed biofilter, the washed biofilter showed a 19 % increase in the
ammonium consumption, and a 4 % reduction in the oxygen consumption.
The differences in biofilm community structure between unwashed and washed filter
were not statistical significant. However, the differences between the wash water and
the biofilters communities were significant.
A 19 % difference in ammonium consumption is a strong indication that the washing process
remove heterotrophic bacteria from the biofilm, however, the microbial community structure
of the washed and unwashed did not indicate the same as the communities was similar.
Therefore, it cannot be concluded that a high number of heterotrophic bacteria are removed
from the nitrification filters after the washing process.
Conclusion for the two different nitrification systems:
The MBBR systems had higher nitrification efficiency and stability with lower C/N ratios. The
washed biofilter had a higher ammonium consumption than the unwashed biofilter, which most
likely consisted of a higher number of heterotrophic bacteria. The results from both the systems
indicate that heterotrophic growth has negative effects on the nitrification process, and how
important it is to avoid organic carbon for an optimal nitrification process and for avoiding high
competition between heterotrophic and nitrifying bacteria.
81
References ALMASI, A., MOUSAVI, S. A., BAHMAN, Z., ZOLFAGHARI, M. R. & ZINATIZADEH, A. A. 2016. Effect of
hydraulic retention time and aeration time on the performance and microbial diversity in an upflow aerobic/anoxic sequential bioreactor. Desalination and Water Treatment, 57, 23589-23596.
ANDERSON, M. J. 2001. A new method for non‐parametric multivariate analysis of variance. Austral ecology, 26, 32-46.
ANDERSON, M. J. 2005. Permutational multivariate analysis of variance. Department of Statistics, University of Auckland, Auckland, 26, 32-46.
AUSTIN SUTHANTHIRARAJ, P. P. & GRAVES, S. W. 2013. Fluidics. Curr Protoc Cytom, Chapter 1, Unit 1 2.
BLANCHETON, J. P. 2000. Developments in recirculation systems for Mediterranean fish species. Aquacultural Engineering, 22, 17-31.
BRAY, J. R. & CURTIS, J. T. 1957. An Ordination of the Upland Forest Communities of Southern Wisconsin. Ecological Monographs, 27, 325-349.
BRUCE, E. R. & PERRY, L. M. 2001. Environmental biotechnology: principles and applications, New York, McGrawHill 400.
CAMARGO, J. A. & ALONSO, A. 2006. Ecological and toxicological effects of inorganic nitrogen pollution in aquatic ecosystems: A global assessment. Environment International, 32, 831-849.
CAYLET, A., ESCUDIÉ, R., GÉVAUDAN, G., HAMELIN, J., BROCKMAN, D. & BERNET, N. 2011. Impact of Hydraulic Retention Time (HRT) on biofilm development: molecular analysis and modelling of microbial competition. https://www.researchgate.net/publication/256427135
CEUPPENS, S., DELBEKE, S., DE CONINCK, D., BOUSSEMAERE, J., BOON, N. & UYTTENDAELE, M. 2015. Characterization of the Bacterial Community Naturally Present on Commercially Grown Basil Leaves: Evaluation of Sample Preparation Prior to Culture-Independent Techniques. Int J Environ Res Public Health, 12, 10171-97.
CHENG, S.-S. & CHEN, W.-C. 1994. Organic carbon supplement influencing performance of biological nitritification in a fluidized bed reactor. Water Science and Technology, 30, 131-142.
COCOLIN, L., MANZANO, M., CANTONI, C. & COMI, G. 2001. Denaturing gradient gel electrophoresis analysis of the 16S rRNA gene V1 region to monitor dynamic changes in the bacterial population during fermentation of Italian sausages. Appl Environ Microbiol, 67, 5113-21.
COSTA, E., PÉREZ, J. & KREFT, J.-U. 2006. Why is metabolic labour divided in nitrification? Trends in microbiology, 14, 213-219.
CRAB, R., AVNIMELECH, Y., DEFOIRDT, T., BOSSIER, P. & VERSTRAETE, W. 2007. Nitrogen removal techniques in aquaculture for a sustainable production. Aquaculture, 270, 1-14.
CUA, L. S. & STEIN, L. Y. 2011. Effects of nitrite on ammonia-oxidizing activity and gene regulation in three ammonia-oxidizing bacteria. FEMS microbiology letters, 319, 169-175.
DARZYNKIEWICZ, Z., HALICKA, H. D. & ZHAO, H. 2010. Analysis of Cellular DNA Content by Flow and Laser Scanning Cytometry. Polyploidization and Cancer, 676, 137-147.
DAVIS, J. C. 1986. Statistics and Data Analysis in Geology, John Wiley & Son. DONLAN, R. M. 2002. Biofilms: Microbial life on surfaces. Emerging Infectious Diseases, 8, 881-890. DORAN, P. M. 2012. Bioprocess Engineering Principles, Elsevier Science. EBELING, J. M., TIMMONS, M. B. & BISOGNI, J. 2006a. Engineering analysis of the stoichiometry of
photoautotrophic, autotrophic, and heterotrophic removal of ammonia–nitrogen in aquaculture systems. Aquaculture, 257, 346-358.
EBELING, J. M., TIMMONS, M. B. & BISOGNI, J. J. 2006b. Engineering analysis of the stoichiometry of photoautotrophic, autotrophic, and heterotrophic removal of ammonia-nitrogen in aquaculture systems. Aquaculture, 257, 346-358.
EILER, A., LANGENHEDER, S., BERTILSSON, S. & TRANVIK, L. J. 2003. Heterotrophic bacterial growth efficiency and community structure at different natural organic carbon concentrations. Applied and Environmental Microbiology, 69, 3701-3709.

82
FIELDS, S. 2004. Global nitrogen - Cycling out of control. Environmental Health Perspectives, 112, A556-A563.
FIGUEROA, L. A. & SILVERSTEIN, J. 1992. The effect of particulate organic matter on biofilm nitrification. Water environment research, 64, 728-733.
FLEMMING, H. C., WINGENDER, J., SZEWZYK, U., STEINBERG, P., RICE, S. A. & KJELLEBERG, S. 2016. Biofilms: an emergent form of bacterial life. Nat Rev Microbiol, 14, 563-75.
GALLOWAY, J. N. & COWLING, E. B. 2002. Reactive nitrogen and the world: 200 years of change. Ambio, 31, 64-71.
GERARDI, M. H. 2016. Operator's Guide to Biological Nutrient Removal (BNR) in the Activated Sludge Process. Operator's Guide to Biological Nutrient Removal. Chemical Publishing Company Inc.
GINESTET, P., AUDIC, J. M., URBAIN, V. V. & BLOCK, J. C. 1998. Estimation of nitrifying bacterial activities by measuring oxygen uptake in the presence of the metabolic inhibitors allylthiourea and azide. Appl Environ Microbiol, 64, 2266-8.
GONZALEZ-SILVA, B. M., JONASSEN, K. R., BAKKE, I., ØSTGAARD, K. & VADSTEIN, O. 2016. Nitrification at different salinities: Biofilm community composition and physiological plasticity. Water research, 95, 48-58.
GOREAU, T. J., KAPLAN, W. A., WOFSY, S. C., MCELROY, M. B., VALOIS, F. W. & WATSON, S. W. 1980. Production of NO2-and N2O by nitrifying bacteria at reduced concentrations of oxygen. Applied and environmental microbiology, 40, 526-532.
GRADY, C. P. L. & LIM, H. C. 1980. Biological Wastewater Treatment: Theory and Applications, New York Marcel Dekker
GREEN, S. J., LEIGH, M. B. & NEUFELD, J. D. 2010. Denaturing Gradient Gel Electrophoresis (DGGE) for Microbial Community Analysis. In: TIMMIS, K. N. (ed.) Handbook of Hydrocarbon and Lipid Microbiology. Berlin, Heidelberg: Springer Berlin Heidelberg.
HAMMER, Ø., HARPER, D. & RYAN, P. 2001. PAST: Paleontological statistics software package for education and data analysis. Palaeontology Electronic 4: 9 pp.
HELBÆK, M. & KJELSTRUP, S. 2009. Fysikalsk kjemi, Bergen, Vigmostad & Bjørke AS. HENRY, I. A., EINBU, A., SVENDSEN, H. F., BAKKE, I. & ØSTGAARD, K. 2016. Inhibition factors in biofilm
N removal systems treating wastes generated by amine based CO 2 capture. International Journal of Greenhouse Gas Control, 45, 200-206.
HENZE, M., HARREMOES, P., JANSEN, J. L. C. & ARVIN, E. 2001. Wastewater treatment : biological and chemical processes Berlin, Springer.
HERRLING, M. P., GUTHAUSEN, G., WAGNER, M., LACKNER, S. & HORN, H. 2015. Determining the flow regime in a biofilm carrier by means of magnetic resonance imaging. Biotechnology and bioengineering, 112, 1023-1032.
HIBBING, M. E., FUQUA, C., PARSEK, M. R. & PETERSON, S. B. 2010. Bacterial competition: surviving and thriving in the microbial jungle. Nature Reviews Microbiology, 8, 15-25.
HU, J., LI, D., LIU, Q., TAO, Y., HE, X., WANG, X., LI, X. & GAO, P. 2009. Effect of organic carbon on nitrification efficiency and community composition of nitrifying biofilms. J Environ Sci (China), 21, 387-94.
ISAACS, S. H. & HENZE, M. 1995. Controlled carbon source addition to an alternating nitrification-denitrification wastewater treatment process including biological P removal. Water Research, 29, 77-89.
JACCARD, P. 1908. Nouvelles recherches sur la distribution florale. Bulletin de la Société vaudoise des sciences naturelles, 44, 223-270.
KACHEL, V., FELLNER-FELDEGG, H. & MENKE, E. 1990. Hydrodynamic properties of flow cytometry instruments. Flow cytometry and sorting. , New York, John Wiley & Sons
KLAMMER, S., KNAPP, B., INSAM, H., DELL'ABATE, M. T. & ROS, M. 2008. Bacterial community patterns and thermal analyses of composts of various origins. Waste Management & Research, 26, 173-187.
KUENEN, J. G. 2008. Anammox bacteria: from discovery to application. Nat Rev Microbiol, 6, 320-6.

83
LEE, P. Y., COSTUMBRADO, J., HSU, C. Y. & KIM, Y. H. 2012. Agarose Gel Electrophoresis for the Separation of DNA Fragments. Jove-Journal of Visualized Experiments.
MADIGIAN, M., MARTINKO, J., STAHL, D. & CLARK, D. 2012. Brock Biology of Microorganisms Boston, Pearson.
MAO, Y., BAKKEN, L. R., ZHAO, L. & FROSTEGÅRD, Å. 2008. Functional robustness and gene pools of a wastewater nitrification reactor: comparison of dispersed and intact biofilms when stressed by low oxygen and low pH. FEMS Microbiology Ecology, 66, 167-180.
MICHAUD, L., BLANCHETON, J.-P., BRUNI, V. & PIEDRAHITA, R. 2006. Effect of particulate organic carbon on heterotrophic bacterial populations and nitrification efficiency in biological filters. Aquacultural Engineering, 34, 224-233.
NORLAND, S. 2004. Gel2K gel analysis software. University of Bergen, Norway. ODEGAARD, H., GISVOLD, B. & STRICKLAND, J. 2000. The influence of carrier size and shape in the
moving bed biofilm process. Water Science and Technology, 41, 383-391. ODEGAARD, H., RUSTEN, B. & WESTRUM, T. 1994. A New Moving-Bed Biofilm Reactor - Applications
and Results. Water Science and Technology, 29, 157-165. OHASHI, A., DE SILVA, D. V., MOBARRY, B., MANEM, J. A., STAHL, D. A. & RITTMANN, B. E. 1995.
Influence of substrate C/N ratio on the structure of multi-species biofilms consisting of nitrifiers and heterotrophs. Water Science and Technology, 32, 75-84.
PAINTER, H. 1986. Nitrification in the treatment of sewage and waste-waters, Washington, D.C : Society for General Microbiology, Oxford IRL Press 185–211.
PAWLOWSKI, L., DUDZINSKA, M. & PAWLOWSKI, A. 2007. Environmental Engineering, London, Taylor & Francis.
PEET, R. K. 1975. Relative diversity indexes. Ecology, 56, 496-498. PEPPER, I. L., GERBA, C. P. & GENTRY, P. J. 2015. Environmental microbiology, San Diego, Calif,
Academic Press. PICOT, J., GUERIN, C. L., KIM, C. L. V. & BOULANGER, C. M. 2012. Flow cytometry: retrospective,
fundamentals and recent instrumentation. Cytotechnology, 64, 109-130. PICULELL, M., WELANDER, P., JÖNSSON, K. & WELANDER, T. 2016. Evaluating the effect of biofilm
thickness on nitrification in moving bed biofilm reactors. Environmental technology, 37, 732-743.
PODANI, J. & MIKLOS, I. 2002. Resemblance coefficients and the horseshoe effect in principal coordinates analysis. Ecology, 83, 3331-3343.
POMMERVILLE, J. C. 2004. Alcamo's fundamentals of microbiology, 7th ed, Sudbury, Mass, Jones and Bartlett.
RASBAND, W. 1997-2012. ImageJ. Bethesda, MD: US National Institutes of Health. imagej.nih.gov/ij/. ROSENZWEIG, M. L. 1995. Species diversity in space and time, Cambridge, Cambridge University Press. RUSTEN, B., EIKEBROKK, B., ULGENES, Y. & LYGREN, E. 2006. Design and operations of the Kaldnes
moving bed biofilm reactors. Aquacultural Engineering, 34, 322-331. SANTORO, M. J. 2016. The do-it-all nitrifiers. Science, 351, 342-343. SATOH, H., OKABE, S., NORIMATSU, N. & WATANABE, Y. 2000. Significance of substrate C/N ratio on
structure and activity of nitrifying biofilms determined by in situ hybridization and the use of microelectrodes. Water science and technology, 41, 317-321.
SHANNON, C. E. & WEAVER, W. 1949. The mathematical theory of communication, Urbana, University of Illinois Press.
SHAPIRO, H. M. 2003. Practical flow cytometry, Hoboken, N.J, Wiley-Liss. SHARMA, B. & AHLERT, R. 1977. Nitrification and nitrogen removal. Water Research, 11, 897-925. SINGH, B., BAUDDH, K. & BUX, F. 2015. Algae and Environmental Sustainability, New Delhi, Springer
India. STOODLEY, P., DODDS, I., BOYLE, J. & LAPPIN‐SCOTT, H. 1998. Influence of hydrodynamics and
nutrients on biofilm structure. Journal of applied microbiology, 85.

84
STROUS, M., HEIJNEN, J., KUENEN, J. G. & JETTEN, M. 1998. The sequencing batch reactor as a powerful tool for the study of slowly growing anaerobic ammonium-oxidizing microorganisms. Applied microbiology and biotechnology, 50, 589-596.
SUN, G., XIAO, J., LU, M., WANG, H., CHEN, X., YU, Y., PAN, Y. & WANG, Y. 2015. Agarose gel purification of PCR products for denaturing gradient gel electrophoresis results in GC-clamp deletion. Appl Biochem Biotechnol, 175, 400-9.
THERMOFISHER. SYBR® Green I Nucleic Acid Gel Stain [Online]. Available: https://tools.thermofisher.com/content/sfs/manuals/mp07567.pdf [Accessed 14.04.2017 2017].
TIMMONS, M. B. & EBELING, J. M. 2013. Recirculating Aquaculture Ithaca, NY Ithaca Publishing Company.
VAN KESSEL, M. A. H. J., HARHANGI, H. R., VAN DE PAS-SCHOONEN, K., VAN DE VOSSENBERG, J., FLIK, G., JETTEN, M. S. M., KLAREN, P. H. M. & DEN CAMP, H. J. M. O. 2010. Biodiversity of N-cycle bacteria in nitrogen removing moving bed biofilters for freshwater recirculating aquaculture systems. Aquaculture, 306, 177-184.
VEAS. 2016. Om VEAS [Online]. Available: http://www.veas.nu/home/om-veas [Accessed 11 dec 2016].
VINDIMIAN, E. 2003. REGTOX: macro ExcelTM for dose-response modelling. WATSON, S. W., BOCK, E., HARMS, H., KOOPS, H.-P. & HOOPER, A. B. 1989. Bergey’s manual of
systematic bacteriology: Nitrifying bacteria, Baltimore, Williams & Wilkins. WHITTAKER, R. H. 1960. Vegetation of the Siskiyou Mountains, Oregon and California. Ecological
Monographs, 30, 279-338. WIEN, A. 1995. 25% reduksjon i utbyggingen av nitrogenrensetrinnet på VEAS etter utvikling av et
optimalt filtermedium i nitrifikasjonstrinnet. VANN, 30, 44-50. WIEN, A., BERG, K. G., KRISTIN GREIFF JOHNSEN, K. G., SAGEBERG, P. & RYRFORS, P. 1995. Erfaringer
med oppstrøms biofilter prosess for nitrogenfjerning ved VEAS – status for utviklingen av VEAS konseptet. VANN, 30, 33-43.
YOU, J., DAS, A., DOLAN, E. M. & HU, Z. Q. 2009. Ammonia-oxidizing archaea involved in nitrogen removal. Water Research, 43, 1801-1809.
ZHU, S. M. & CHEN, S. L. 2001. Effects of organic carbon on nitrification rate in fixed film biofilters. Aquacultural Engineering, 25, 1-11.
ZIEMBINSKA-BUCZYNSKA, A., CEMA, G., KALBARCZYK, M. & ZABCZYNSKI, S. 2014. Application of PCR-DGGE to Study Genotypic Variability of Bacteria Inhabiting Rotating Biological Contactors Treating Synthetic Coke Wastewater. Ochrona Srodowiska, 36, 3-8.

I
Appendix A: Experimental details MBBR
Deviation values caused by the various problems in the long-term continuous experiments were
removed from the average calculations. Days and explanation for the different incidences are
shown in Table A.1-A.2.
Table A.1 Deviation values from 1. Period for reactor 1 (R1) and reactor 2 (R2).
1. period
day Explanation Reactor
3 Unstable flow R2
19 Unstable flow R2
33 Unstable flow R1 & R2
36 Unstable flow R1
Table A.2 Deviation values from 2. Period for reactor 1 (R1) and reactor 2 (R2).
2. period
day Explanation Reactor
3 Not in balance & low flow R1& R2
17 Unstable flow (U F) R1
24 Unstable flow R1 & R2
27 Unstable flow R2
30 Unstable flow R2
43 Oxygen problem and U F R1 & R2
45
48
Continuing oxygen problems
Continuing oxygen problems
R2
R2
63 Curl on the pump tubing R1
118 Low flow R1 & R2
138 Low flow R1 & R2

II
Appendix B: Protocol for DNA Isolation Experienced User Protocol
Please wear gloves at all times
1. To the PowerBead Tubes provided, add 0.25 grams of soil sample.
2. Gently vortex to mix.
3. Check Solution C1. If Solution C1 is precipitated, heat solution to 60oC until dissolved before
use.
4. Add 60 μl of Solution C1 and invert several times or vortex briefly.
5. Secure PowerBead Tubes horizontally using the MO BIO Vortex Adapter tube holder for the
vortex (MO BIO Catalog# 13000-V1-24) or secure tubes horizontally on a flat-bed vortex pad with
tape. Vortex at maximum speed for 10 minutes. Note: If you are using the 24 place Vortex Adapter
for more than 12 preps, increase the vortex time by 5-10 minutes.
6. Make sure the PowerBead Tubes rotate freely in your centrifuge without rubbing. Centrifuge tubes
at 10,000 x g for 30 seconds at room temperature. CAUTION: Be sure not to exceed 10,000 x g
or tubes may break.
7. Transfer the supernatant to a clean 2 mL Collection Tube (provided). Note: Expect between 400
to 500 μl of supernatant. Supernatant may still contain some soil particles.
8. Add 250 μl of Solution C2 and vortex for 5 seconds. Incubate at 4oC for 5 minutes.
9. Centrifuge the tubes at room temperature for 1 minute at 10,000 x g.
10. Avoiding the pellet, transfer up to, but no more than, 600 μl of supernatant to a clean 2 mL
Collection Tube (provided).
11. Add 200 μl of Solution C3 and vortex briefly. Incubate at 4 C for 5 minutes.
12. Centrifuge the tubes at room temperature for 1 minute at 10,000 x g.
13. Avoiding the pellet, transfer up to, but no more than, 750 μl of supernatant into a clean 2 mL
Collection Tube (provided).
14. Shake to mix Solution C4 before use. Add 1200 μl of Solution C4 to the supernatant and vortex
for 5 seconds.
15. Load approximately 675 μl onto a Spin Filter and centrifuge at 10,000 x g for 1 minute at room
temperature. Discard the flow through and add an additional 675 μl of supernatant to the Spin
Filter and centrifuge at 10,000 x g for 1 minute at room temperature. Load the remaining
supernatant onto the Spin Filter and centrifuge at 10,000 x g for 1 minute at room temperature.
Note: A total of three loads for each sample processed are required.
16. Add 500 μl of Solution C5 and centrifuge at room temperature for 30 seconds at 10,000 x g.
17. Discard the flow through.
18. Centrifuge again at room temperature for 1 minute at 10,000 x g.
19. Carefully place spin filter in a clean 2 mL Collection Tube (provided). Avoid splashing any
Solution C5 onto the Spin Filter.
20. Add 100 μl of Solution C6 to the center of the white filter membrane. Alternatively, sterile DNA-
Free PCR Grade Water may be used for elution from the silica Spin Filter membrane at this step
(MO BIO Catalog# 17000-10).
21. Centrifuge at room temperature for 30 seconds at 10,000 x g.
22. Discard the Spin Filter. The DNA in the tube is now ready for any downstream application. No
further steps are required.
We recommend storing DNA frozen (-20oC to -80 oC). Solution C6 contains no EDTA. To
concentrate the DNA see the Hints & Troubleshooting Guide.
Thank you for choosing the PowerSoil® DNA Isolation Kit.
Technical information: Toll free 1-800-606-6246, or 1-760-929-9911 Email: [email protected]
Website: www.mobio.com

III
Appendix C: DGGE
Solutions used in PCR and DGGE are described in Table C1-C7.
Table C.1 1 L 50x TAE-buffer
Chemical Amount pH Start
concentration
Tris base 242 g -
Glacial
acetic acid
57.1 mL - 0.5 M
EDTA 100 mL 8
MQ-water Added to
final
volume: 1 L
-
Table C.2 100 mL 10 % APS.
Chemical Amount
Ammonium persulfate 10 g
MQ-water 100 mL
Table C.3 200 mL deionized formamide.
Chemical Amount
Formamide 200 mL
DOWEX RESINAG 501X8 7.5 g
MQ-water Added to final volume: 200 mL
Table C.4 250 mL 0 % Denaturing acrylamide solution.
Chemical Amount
50x TAE-buffer 2.5 mL
40 % acrylamide
solution
50 mL
MQ-water Added to final
volume: 250 mL
Table C.5 250 mL 80 % Denaturing acrylamide solution.
Chemical Amount

IV
50x TAE-buffer 2.5 mL
40 % acrylamide
solution
50 mL
Deionizied
formamide
80 mL
Urea 84 g
MQ-water Added to final
volume: 250mL

V
Appendix D: VEAS
Complete picture of the DGGE gel 3 analysed in Figure 4.26 is shown in Figure D.1.
Figure D.1 Complete picture of gel 3 (Figure 4.26). White frame indicates the analysed area.

VI
Appendix E: Flow cytometer
For freshwater is 1x Tris-EDTA (TE)-buffer used as working solution (Table E.1)
Table E.1 Working solution (1x TE-buffer) used in analysis with flow cytometer.
Chemical Amount (mL)
H2O 495.5
0.5 EDTA (pH 8.0) 1.0
Tris-HCl (pH 7.5) 2.5
1x TE-buffer and MQ-water were filtrated with syringe filter with 0.2 μm acetate membrane
(VWR International, USA) for avoiding contamination in the working solution.