A Performance Review of 3D TOF Vision Systems in ...cdn.intechweb.org/pdfs/5767.pdf · Vision...
19
7 A Performance Review of 3D TOF Vision Systems in Comparison to Stereo Vision Systems Stephan Hussmann 1 , Thorsten Ringbeck 2 and Bianca Hagebeuker 2 1 Westcoast University of Applied Sciences 2 PMDTechnologies GmbH Germany 1. Introduction The most common and well-known principle of 3D image acquisition is stereo vision (SV). This principle of 3D-image acquisition is already known and used for decades in the research community. The advantage of stereo vision to other range measuring devices such as laser scanners, acoustic or radar sensors is that it achieves high resolution and simultaneous acquisition of the entire range image without energy emission or moving parts. Still, the major disadvantage is the limited Field of View (FOV) and the correspondence problem. To enhance the FOV many techniques are researched such as rotating cameras (Kang et al., 1997; Benosman et al., 1996; Krishnan et al., 1996), increasing the number of the cameras (Kawanishi et al., 1998), and the use of a special optic (Liancheng & Feng, 2005; Lin & Bajcsyg, 2003). Also a combination of 1D-laser scanner and a SV system are proposed to overcome the FOV problem (Cheng et al., 2002). However, these systems are expensive and not easy too synchronize. Due to the correspondence problem algorithms need to be improved to give a lower percentage of false matches as well as better accuracy of depth estimates. Performance of algorithm needs to be evaluated over a broad range of image types in order to test their robustness (Dhond & Aggarwal, 1989). In the past years the modality of Time-of-Flight (TOF) imaging became more and more attractive to a growing research community (Schwarte_a et al., 1997; Schwarte_b et al., 1997). Because of the enormous progress in TOF-vision systems, nowadays 3D matrix cameras can be manufactured und be used for many application such as robotic, automotive, industrial, medical and multimedia applications. Due to the increasing demand of safety requirements in the automotive industry it can be assumed that the TOF-camera market will grow and the unit price of these systems in the mass production will drop down to ca. 100 € (Hussmann & Hess, 2006). For all application areas new accurate and fast algorithms for 3D object recognition and classification are needed. As now commercial 3D-TOF cameras are available at a reasonable price the number of research projects is expected to increase significantly. One early example of using a TOF-camera based on the Photonic-Mixer-Devices (PMD)-Technology for 3D object recognition in TOF data sets are presented in (Hess et al., 2003). In this paper the transition from a general model of the system to specific applications such as intelligent Open Access Database www.i-techonline.com Source: Stereo Vision, Book edited by: Dr. Asim Bhatti, ISBN 978-953-7619-22-0, pp. 372, November 2008, I-Tech, Vienna, Austria www.intechopen.com
Transcript of A Performance Review of 3D TOF Vision Systems in ...cdn.intechweb.org/pdfs/5767.pdf · Vision...

7
A Performance Review of 3D TOF Vision Systems in Comparison to
Stereo Vision Systems
Stephan Hussmann1, Thorsten Ringbeck2 and Bianca Hagebeuker2 1Westcoast University of Applied Sciences
2PMDTechnologies GmbH Germany
1. Introduction
The most common and well-known principle of 3D image acquisition is stereo vision (SV). This principle of 3D-image acquisition is already known and used for decades in the research community. The advantage of stereo vision to other range measuring devices such as laser scanners, acoustic or radar sensors is that it achieves high resolution and simultaneous acquisition of the entire range image without energy emission or moving parts. Still, the major disadvantage is the limited Field of View (FOV) and the correspondence problem. To enhance the FOV many techniques are researched such as rotating cameras (Kang et al., 1997; Benosman et al., 1996; Krishnan et al., 1996), increasing the number of the cameras (Kawanishi et al., 1998), and the use of a special optic (Liancheng & Feng, 2005; Lin & Bajcsyg, 2003). Also a combination of 1D-laser scanner and a SV system are proposed to overcome the FOV problem (Cheng et al., 2002). However, these systems are expensive and not easy too synchronize. Due to the correspondence problem algorithms need to be improved to give a lower percentage of false matches as well as better accuracy of depth estimates. Performance of algorithm needs to be evaluated over a broad range of image types in order to test their robustness (Dhond & Aggarwal, 1989). In the past years the modality of Time-of-Flight (TOF) imaging became more and more attractive to a growing research community (Schwarte_a et al., 1997; Schwarte_b et al., 1997). Because of the enormous progress in TOF-vision systems, nowadays 3D matrix cameras can be manufactured und be used for many application such as robotic, automotive, industrial, medical and multimedia applications. Due to the increasing demand of safety requirements in the automotive industry it can be assumed that the TOF-camera market will grow and the unit price of these systems in the mass production will drop down to ca. 100 € (Hussmann & Hess, 2006). For all application areas new accurate and fast algorithms for 3D object recognition and classification are needed. As now commercial 3D-TOF cameras are available at a reasonable price the number of research projects is expected to increase significantly. One early example of using a TOF-camera based on the Photonic-Mixer-Devices (PMD)-Technology for 3D object recognition in TOF data sets are presented in (Hess et al., 2003). In this paper the transition from a general model of the system to specific applications such as intelligent O
pen
Acc
ess
Dat
abas
e w
ww
.i-te
chon
line.
com
Source: Stereo Vision, Book edited by: Dr. Asim Bhatti, ISBN 978-953-7619-22-0, pp. 372, November 2008, I-Tech, Vienna, Austria
www.intechopen.com

Stereo Vision
104
airbag control and robot assistance in surgery are demonstrated. A more current example in using a PMD-TOF camera on a robot system, highlighting the advantages of TOF- compared to SV-vision systems, is reported in (Hussmann & Liepert, 2007). This chapter is structured as follows. In Section II we expose the issues which motivate a new approach for 3D image acquisition systems. In Section III we derive the equation set needed to design a 3D TOF vision system. In Section IV automotive applications will demonstrate the usability of 3D-TOF vision systems based on the PMD-technology fulfilling the tough target settings in the automotive industry. Concluding remarks will summarize the paper.
2. Comparison of TOF- and SV vision systems
2.1 Working principle
(a) (b)
Fig. 1. Working principle of (a) SV vision systems and (b) TOF vision systems (Hussmann & Hess, 2006)
Common stereo vison systems comprise two perspective cameras with limited FOV. As
shown in Fig. 1 (a) a physical point is taken up in the observed 3D-space by two perspective
cameras. If the corresponding pixel of this point is found in both camera images, the
position can be computed with the help of the triangulation principle. The major problem is
to detect the corresponding pixels as they are required to estimate the range information
correctly (correspondence problem). High processing power and time can be consumed if those
pixels cannot be find easily. Fig. 1 (b) shows the working principle of TOF vision systems.
TOF is an active range system and needs an illumination source. The range information is
measured by emitting a modulated near-infrared light signal and computing the phase of
the received reflected light signal. Using the PMD-Technology the phase calculation is
carried out in each individual pixel of the sensor matrix (Schwarte_a et al., 1997; Schwarte_b
et al., 1997). Hence TOF offers a direct depth data acquisition, whereas SV involves a great
amount of computational power for the same 3D image. However SV systems can be
realized without active illumination.
www.intechopen.com

A Performance Review of 3D TOF Vision Systems in Comparison to Stereo Vision Systems
105
2.2 Image processing chain
(a) (b)
Fig. 2. Functional block diagram of the image processing chain of (a) SV vision systems and (b) TOF vision systems (Hussmann & Hess, 2006)
In Fig. 2 (a) the functional block diagram of the image processing chain of SV systems is shown. Several problems arise during the image processing of the captured object information. Due to the limited aperture angle of the camera optics only a certain part of the environment can be detected (aperture problem). The FOV is usually fixed for one application and cannot be changed easily (FOV problem). The optical projection of the objects on a planar sensor leads to a complete lost of the 3D-information (optical projection problem). Due to the sampling rate of the image sensor the detection of very fast objects is limited (optical sampling problem). The correspondence problem is already explained in the last section and will be described in more detail in the following section. A change in the gray level values of both cameras is not necessarily caused by an object movement. For example illumination changes could also cause gray level changes. Hence the object motion cannot be described by the gray level values changes (divergence problem). At last the allocation problem is stated. The estimated range values of the scene are not evenly distributed due to the correspondence problem.
www.intechopen.com
Stereo Vision
106
TOF vision systems suffer fewer problems as shown in Fig. 2 (b). The FOV problem does not depend on the chosen hardware setup and can be changed by software easily. In the next section more details are provided. The object information is not lost by the optical projection of the objects on a planar sensor. Each pixel of the sensor calculates a range value. A reconstruction of range values based on gray level values does not exist. Hence no correspondence, divergence and allocation problem is given. Only the aperture and sampling problem still exists.
2.3 Field-of-view problem The depth resolution of SV vision systems depends on the chosen optical arrangement of the two cameras which defines the triangle’s angles. TOF systems do not depend on geometrical parameters. They are using an active modulated light source. Two modulation techniques are the most common one, pulsed modulation (Moring et al., 1989) or continuous wave (CW) modulation (Beheim & Fritsch, 1986). In the currently available TOF cameras CW-modulation is used as for this mode extremely high rise and fall times are not required and for this reason a larger variety of light sources are available. Mostly square waves are used, but other waveforms such as sinusoidal waves are suitable modulation signals. Using CW-modulation the phase difference between the sent and received optical signal is measured, rather than directly measuring a light pulse’s turn-around time. As the modulation
frequency fmod is known, the measured phase ϕ0 directly corresponds to the time of flight (Lange, 2000). Equation (1) describes how the range of TOF vision systems can be
determined. The physical constant for the speed of light (3⋅10^8 m/s) is given by c and N represents the ambiguity in range estimation.
...3,2,1,0360360mod2
0 =⎟⎟⎠⎞⎜⎜⎝
⎛ °⋅+°⋅⋅= NwithNf
cR
ϕ (1)
A very common modulation frequency of TOF vision systems is fmod = 20MHz. This leads to a non-ambiguity range (NAR) of 7.5 m as derived in Equation (2). There are two reasons for choosing this modulation frequency. One reason is that no high-power IR-LEDs are available with a higher modulation frequency at a low price tag and the other reason is that the NAR suits most of the indoor and outdoor applications.
5.76^10202
8^103
mod2=⋅⋅
⋅=⋅=f
cNAR m (2)
The FOV of TOF vision systems depend only on the modulation frequency as derived in Equation (1) and (2). A high modulation frequency leads to short measuring range and vice versa.
2.4 Correspondence problem As mentioned before the correspondence problem is a major problem as the range values can only be estimated in image regions with adequate gray level value changes. As a consequence a SV vision system will always have difficulties acquiring 3D information of objects with equal gray level values such as walls, roadways and so forth. Also objects with the same gray level value at different distances are difficult to distinguish. These problems
www.intechopen.com

A Performance Review of 3D TOF Vision Systems in Comparison to Stereo Vision Systems
107
can be compensated with advanced SV algorithms using a lot of processing power compared to TOF vision systems.
(a) (b)
Fig. 3. (a) Gray level value image and (b) TOF range image of two objects with equal gray level values
The images in Fig. 3 are taken with a PhotonICs® PMD 1k-S (64 x 16 Pixel) sensor chip. Fig. 3 (a) shows the gray level values of an object in front of a wall at different distances. Both objects have almost the same gray level values and are very difficult to distinguish. Hence a SV vision system without active lighting, generating shadows, can not estimate the 3D information of the objects due to the correspondence problem. However, a TOF vision system measures the range to the object for each pixel and therefore delivers evenly distributed 3D information as shown in Fig. 3 (b). Hence even a TOF vision system with fewer pixels than a SV vision system can deliver more 3D information when the SV vision system has too many false range matches. This can happen when the captured scenes have too many areas with equal gray level values. The advantage of TOF over a SV vision system is that the TOF ranging technique does not produce incomplete range data (no shadow effects) because illumination and observation directions can be collinear.
3. Design of PMD TOF vision systems
3.1 Range calculation A PMD TOF sensor generates a range output voltage which can be described as follows (Schwarte & Heinol, 1999):
∫ ⋅−⋅=Δ int
0)()()(
TdttmuLTtoptPKLTabU (3)
The range output voltage ΔUab(TL) is determined by the correlation result of the optical echo Popt(t-TL) and the modulation voltage um(t) over the integration time Tint. K is a system constant. State of the art is to use CW modulation with square waves. Hence the modulation voltages can be easily generated digitally with a high accuracy and stability using programmable logic devices (PLDs) such as microcontrollers, complex programmable logic devices (CPLD) or field programmable gate arrays (FPGA). The low-pass characteristic of the IR-LEDs leads to an attenuation of the square waves’ harmonics for larger frequencies. This results in an optical output that gradually looks sinusoidal for frequencies larger than
www.intechopen.com

Stereo Vision
108
5-10 MHz. This has to be taken into account if CW modulation with square waves is used. The modulation voltage um(t) and the optical echo Popt(t-TL) is then given by:
∑∞= −−=∑∞−∞= ⋅−−=
1 )12(
))12sin((4)22/()(
k k
tk
nntrecttmu
ωπππω (4)
and
))sin(()( LTtAaLTtoptP ωω −+⋅=− (5)
Equation (4) shows the square wave signal of the modulation voltage um(t). Using Fourier series we can write an ideal square wave as an infinite series of only odd integer harmonics. Equation (5) shows the sinusoidal signal echo Popt(t-TL) of the IR-LEDs. It is assumed that only the fundamental harmonic is transmitted due to the finite bandwidth of the IR-LEDs. The amplitude a of the optical echo Popt(t-TL) depends on the reflectivity coefficient. In addition the background light is taken into account by adding a constant A. Furthermore it
is assumed that a and A are constant during the capture of one range image. Hence ΔUab(TL) will be different for different amplitudes of the optical echo and will course problems in determining the phase difference between the optical echo Popt(t-TL) and the modulation
signal um(t). The amplitude dependency of the output voltage ΔUab(TL) can be avoided by using a phase-shift algorithm. This algorithm is based on the cross correlation of two
periodical signals which are shifted in phase to each other. The correlation function ϕsg(τ) is defined as follows:
dt
T
Ttgts
TTtgtssg ∫
−+⋅∞→=⊗= 2
2
)()(1
lim)()()( ττϕ (6)
If we deploy equation (6) to our TOF system s(t) and g(t+τ) can be written as
)()( LTtoptPts −= and )()( ττ +=+ tmutg (7)
Then the correlation function ϕsg(τ) of the TOF system can be represented as follow:
dt
T
T k k
tktAa
TTsg ∫
−∑∞= −
+−⋅−+⋅∞→= 2
2
]
1 )12(
))()12sin((4[)]0sin([
1lim)(
τωπϕωτϕ (8)
Only the fundamental harmonic of the modulation voltage and the optical echo have the same frequency. Hence the multiplication of these correlated signals results in a DC component and a sinusoidal component with twice the frequency. All other multiplications result in sinusoidal components. After the integration only the DC component remains. Due to this feature of the PMD sensor all other uncorrelated noise sources such as sun light or modulated light sources are suppressed. The DC component is given by:
)0cos(2
)( τϕπτϕ +⋅⋅= asg (9)
www.intechopen.com
A Performance Review of 3D TOF Vision Systems in Comparison to Stereo Vision Systems
109
LTωϕ =0 and represents the phase difference between the sent and the received signal. If
we now consider equation (9) for example for four different phases τ = 0°, τ = 90°, τ = 180°
and τ = 270°, the correlation result is:
)0cos(2
)0( ϕπϕ ⋅⋅=° asg , )0sin(
2)90( ϕπϕ ⋅⋅−=° a
sg ,
)0cos(2
)180( ϕπϕ ⋅⋅−=° asg and )0sin(
2)270( ϕπϕ ⋅⋅=° a
sg (10)
Now we can calculate the phase difference ϕ0 without any dependency on the received optical echo’s amplitude a.
⎟⎟⎠⎞
⎜⎜⎝⎛
°−°°−°=)180()0(
)90()270(arctan0
sgsg
sgsg
ϕϕϕϕϕ (11)
Equation (8) is equivalent to equation (3), hence equation (11) can be rewritten as:
⎟⎟⎠⎞⎜⎜⎝
⎛°Δ−°Δ°Δ−°Δ=)180()0(
)90()270(arctan0
abUabUabUabUϕ (12)
The range value R can now be calculated by taken into account the non-ambiguity range (NAR) at a given modulation frequency of fmod = 20MHz:
°⋅=360
0ϕ
NARR (13)
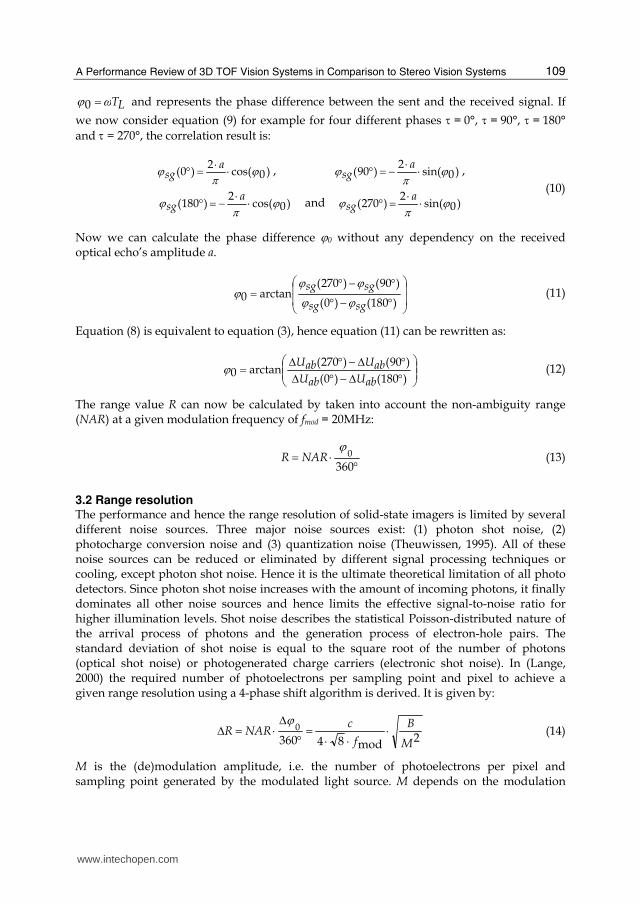
3.2 Range resolution The performance and hence the range resolution of solid-state imagers is limited by several different noise sources. Three major noise sources exist: (1) photon shot noise, (2) photocharge conversion noise and (3) quantization noise (Theuwissen, 1995). All of these noise sources can be reduced or eliminated by different signal processing techniques or cooling, except photon shot noise. Hence it is the ultimate theoretical limitation of all photo detectors. Since photon shot noise increases with the amount of incoming photons, it finally dominates all other noise sources and hence limits the effective signal-to-noise ratio for higher illumination levels. Shot noise describes the statistical Poisson-distributed nature of the arrival process of photons and the generation process of electron-hole pairs. The standard deviation of shot noise is equal to the square root of the number of photons (optical shot noise) or photogenerated charge carriers (electronic shot noise). In (Lange, 2000) the required number of photoelectrons per sampling point and pixel to achieve a given range resolution using a 4-phase shift algorithm is derived. It is given by:
2
mod843600
M
B
f
cNARR ⋅⋅⋅=°
Δ⋅=Δ ϕ (14)
M is the (de)modulation amplitude, i.e. the number of photoelectrons per pixel and sampling point generated by the modulated light source. M depends on the modulation
www.intechopen.com
Stereo Vision
110
depth of the modulated signal and the demodulation contrast of the pixel but also on the optical power of the modulated light source and the target’s distance and reflectivity. B is the Offset or acquired optical mean value, i.e. the number of photoelectrons per pixel and sampling point generated by incoming light of the scene’s background and the mean value of the received modulated light. As in practise only the voltage values at the output stages can be measured, equation (14) has to be reformulated. The conversion process of the optically generated charge into an analogous output voltage is characterized using the sensitivity s. The sensitivity is determined by the size of the conversion capacitance Cint and the amplification of the output stage Aos of the solid-state imager. It is usually specified in terms of volts per electron and is
given by Equation (15), where q is the elementary charge (1.6⋅10^-19 C).
qC
osAs ⋅=
int (15)
Subsequently the output voltage vout of the solid-state imager can be described by Equation (16), where E is the total number of all electrons accumulated in the conversion capacitance. E is the sum of the acquired optical mean value B and the (de)modulation amplitude M.
)( BMsEsoutv +⋅=⋅= (16)
Hence the mean value of vout is related to B and the peak-to-peak value of vout is related to M as given in Equation (17).
Bsoutv ⋅= and MsPPoutv ⋅⋅= 2 (17)
Now we can rewrite Equation (14) by taken into account equation (17):
s
PPoutv
outv
f
cR ⋅⋅⋅⋅=Δ
2mod82
(18)
Looking at equation (18) it can be concluded that a large background brightness, which is
proportional to outv , not only restricts the number of available quantization levels but also
drastically increases the quantum noise of the system. Background illumination can be reduced by measuring in the dark or by using spectral filters that only transmit the spectrum of the modulated light. Furthermore it can be concluded that an increasing active modulation power density, which is proportional to voutPP, leads to a better range resolution. As the active optical power density increases with decreasing distance to the object, the ranging accuracy also increases for smaller distances. This is an important fact for navigation applications, where a high accuracy is often only needed close to the target. Equation (18) can be used to determine the resolution of PMD TOF sensors. The intensity
output voltage abUΣ (see (Schwarte & Heinol, 1999)) of these sensors corresponds to the
total number of all electrons accumulated in the conversion capacitance. Hence abUΣ can
be expressed as:
)( BMsEsabU +⋅=⋅=Σ (19)
www.intechopen.com

A Performance Review of 3D TOF Vision Systems in Comparison to Stereo Vision Systems
111
The modulation amplitude M is related to the absolute value of the range output voltage
abUΔ of the PMD TOF sensor:
MsabU ⋅=Δ |ˆ| (20)
Hence equation (18) can now be reformulated for the use of a PMD TOF sensor:
sabU
abUabU
f
cR ⋅Δ
Δ−Σ⋅⋅⋅=Δ2ˆ
|ˆ|
mod84 (21)
In (Lange, 2000) it is shown that equation (14) can be expanded to include additional noise
scorces such as 1/f-, reset- and thermal noise by adding an additional number of pseudo-
background-electrons Npseudo to B. Theses noise sources are not correlated to the modulation
signal and thus contribute to B rather than M.
2
mod843600
M
pseudoNB
f
cNARR
+⋅⋅⋅=°Δ⋅=Δ ϕ
(22)
The number of pseudo-electrons Npseudo can be obtained by squaring the noise equivalent
number of noise electrons N. These can be determined by measuring vdark and dividing it by
the sensitivity s of the sensor.
2
2 ⎟⎠⎞⎜⎝
⎛==s
darkvNpseudoN (23)
Equation (21) can now be modified to include the additional noise sources. As all electrons
generated in the dark should be taken into account the dark voltage is equivalent with the
intensity output voltage abUΣ of the PMF TOF sensor.
2ˆ
2|)ˆ|(
mod84 abU
darkabUsabUabU
f
cR Δ
Σ+⋅Δ−Σ⋅⋅⋅=Δ (24)
If no background light is present and only the active illumination source is active the highest
range resolution can be achieved. The modulation amplitude M is then equal to the optical
mean value B. Equation (24) can be simplified to:
2
ˆ|ˆ|mod84 ⎟⎟⎠⎞
⎜⎜⎝⎛
ΔΣ+Δ⋅⋅⋅=Δ
abU
darkabU
abU
s
f
cR (25)
The range accuracy, which can only be improved by averaging, is the absolute limit of a
PMD TOF sensor using a 4-phase shift algorithm. The range resolution also depends on the
modulation frequency. The higher the modulation frequency the better is the range
resolution. However the measuring range (FOV) will decrease with increasing modulation
www.intechopen.com
Stereo Vision
112
frequency (see section 2.3). In practice it has shown that increasing the modulation
frequency far above 20 MHz will not increase the range resolution because the power of the
IR-LEDs will decrease at the same time.
4. Automotive applications using PMD TOF vision systems
4.1 Advantages of PMD TOF vision systems for automotive applications As mentioned in the introduction section already, TOF vision systems are found in a variety of applications such as industrial sensor systems, automation, robotics, user interfaces, virtual reality and so forth. However the technically most challenging and interesting application is the automotive industry. An appropriate 3D vision system should be able to recognize dangerous situations foresighted to support the driver in the best possible way to avoid accidents. In the case that an accident can not be avoided the system should at least minimize the injury risk for all passengers. Up to now application-specific sensor units are designed for each particular automotive application. Hence nowadays only pure range measuring systems (long or short range radar, lidar or ultrasonic sensors) or pure opto-electronical 2D camera systems exist in various car assemblies. Increasingly optimized algorithms are developed to fuse the data of different sensor units. This approach is understandable as no system was available to deliver 2D intensity images and range data at the same time. What was missing is a precise, economical, compact, universal sensor technology which can acquire the 3D information (intensity and range information) of a scene in one image capture. Such a technology would deliver the absolute geometrical dimensions of objects without depending on the object surface, - distance, -rotation and -illumination (rotation-, translation- and illumination invariant). SV vision systems were the first to be developed for the automotive industry with the listed disadvantages in section 2. Subsequently the PMD technology was successfully developed which is a TOF vision system with inherent suppression of uncorrelated light signals such as sun light or other modulated light disturbances (Moeller et al., 2005). More advantages of a PMD TOF vision system are the acquisition of the intensity and range data in each pixel without high computational cost and any moving components as well as the monocular setup. All these advantages lead to a compact and economical design of an automotive 3D TOF vision system. This system can immediately acquire the scene objects parameters without high computational power. The typical frame rate of the system is 100 Hz leading to a high constant 3D data flow. A reliable object plausibility check and calculation of the object motion vectors are possible. Hence a reliable scene interpretation for automotive applications is given. The high frame rate is very important for car safety applications to detect high dynamical changes in the traffic even at a high car speed. With such a system the driver can be best possible supported and the injury risk in a non avoidable collision can be minimized by using active safety measures. At the moment several automotive manufacturer are using the PMD technology for many different applications such as smart airbag, driver assistant systems, pre crash systems, stop & go systems, pedestrian safety systems, emergency break systems, gesture recognition systems and so force (Ringbeck et al., 2007; Ringbeck & Hagebeuker, 2007; Buxbaum & Hagebeuker, 2005). Fig. 4 and Fig. 5 show some of the realized systems. In the next section a developed PMD TOF vision system usable for pedestrian detection, stop & go and pre crash application is exemplary presented.
www.intechopen.com

A Performance Review of 3D TOF Vision Systems in Comparison to Stereo Vision Systems
113
Fig. 4. Smart airbag application using a PMD TOF vision systems (Hussmann & Hess, 2006)
Fig. 5. Gesture recognition using a PMD TOF vision systems (Hussmann & Hess, 2006)
www.intechopen.com

Stereo Vision
114
4.2 PMD sensor system for automotive outdoor applications Fig. 6 shows a PMD sensor system for automotive outdoor applications. This ‘A-Muster’ camera is designed to demonstrate solutions for several front view applications such as Stop&Go, PreCrash and Pedestrian Safety. The non-ambiguity range (NAR) of the sensor system is 120 m using a modulation frequency of 6,2 and 7,5 MHz. This range is the maximum possible measuring range if enough illumination power is available. To achieve a measuring range as close as possible to the NAR, additional IR-illumination sources can be implemented inside the head lights to increase the transmitted power. For a typical measurement range of 10 m an illumination source with a power rating of 1 W optical power is placed beside the camera system inside the car as shown in Fig. 6 (c). For a measurement range above 35 m a more powerful illumination source has to put into the front of the car as shown in Fig. 6 (b).
The range resolution for both measurement ranges is ± 10 cm.
IR-Scheinwerfer
PMD-Camera
IR-Headlight (LED Lamp)
PMD-Sensor
PMD-Camera
Fig. 6. Illustration of a PMD TOF vision systems for several automotive outdoor applications (a) ‘A-Muster’ PMD camera and PCB with the PhotonICs® PMD 1k-S (64 x 16 Pixel) (b) IR-LED Headlights (8 W) (c) Internal car setup (PMD camera + 1 W IR-LED illumination source) (d) Schematic of overall car setup options
The PMD camera delivers an evenly distributed range image of the observed scene in front of the car. The field of view of the observed scene depends on the chosen optic and the active illumination source and has to be adapted to match the requirements for the implemented outdoor application (Stop&Go, PreCrash and Pedestrian Safety). Fig. 7 shows the processing chain of the PMD TOF vision system. The pre-processing of the camera’s row data is simple and does not require a powerful processing unit. Only the range
(a) (b)
(c) (d)
www.intechopen.com

A Performance Review of 3D TOF Vision Systems in Comparison to Stereo Vision Systems
115
and intensity values are calculated as derived in section 3. Furthermore the verification and selection of the feasible range values and the illumination control are processed in this stage. A clear range image is the result of this stage. In the next stage object segmentation and detection algorithm determined the objects in front of the car. The implemented software varies depending on the chosen application. The output of this stage results in an object list. The dynamical objects in the observed scene are tracked in the next stage and a decision is made based on the dynamical objects’ position to activate or not activate the actuators. This decision can be confirmed by collected and fused data of other sensor systems.
Fig. 7. Processing chain of the PMF TOF vision system
(a) (b)
Fig. 8. Experimental results of an observed traffic scene with the PMD TOF vision system (a) Range raw data and the resulting object presentations in a virtual 3D space (b) Conventional video image with chronological superimposed object visualization
PMD raw data
Pre-processing
Clear range image
3D image processing
Object list
Scene analysis
Relevant object
Actuator activation
www.intechopen.com

Stereo Vision
116
In the following figures the raw data and the resulting object representations of the PMD
TOF vision system are depicted at different traffic scenarios. The position of the objects is
detected in the 3D space. The position changes are used to determine the motion vectors.
Now the objects can be tracked and identified in the observed traffic scenes. This process is
illustrated in Fig. 8. Three pedestrians are identified as relevant objects and their position are
determined, visualized and tracked.
(a) (b)
(c) (d)
Fig. 9. (a) Range raw data and the resulting object representation of a roller skater (green rectangle in the red circle) after he entered the field of view of the PMD TOF camera (b) Conventional video image with chronological superimposed object visualization of the roller skater (yellow rectangle in the red circle) (c) Range raw data and the resulting object representation of the roller skater at 30 m (green rectangle in the red circle) as well as the tracked way (blue line) (d) Conventional video image with chronological superimposed object visualization of the roller skater (green rectangle in the red circle)
www.intechopen.com

A Performance Review of 3D TOF Vision Systems in Comparison to Stereo Vision Systems
117
Due to the computational efficient and simple processing chain of the PMD TOF vision
system (see Fig. 7), the image processing algorithms are simple and fast. Hence a fast object
tracking is possible. Fig. 9 shows a roller skater who is detected and tracked as a relevant
object over a range of 30 m. The decision if the roller skater is a relevant object is made
straight after he entered the field of view of the PMD TOF camera. This proofs the speed of
the processing chain of the PMD system.
The tracking of relevant objects is not only possible at low car speeds but also at high car
speeds for example on the motorway. Fig. 10 shows the performance of the object tracking
on the motorway of the PMD TOF vision system. It has to be noted that the tracking at 50 m
is successful even when the objects are represented by only a few pixels as shown in
Fig. 10 (b). This accuracy is only possible because every pixel delivers a range value besides
its intensity value. This inherent feature of the PMD TOF vision system distinguishes the
PMD technology from typical SV vision systems.
(a) (b)
Fig. 10. Object tracking on the motorway using the PMD TOF Vision system (a) Range raw data and the resulting object representation of cars on the motorway at different ranges (green rectangles) as well as their tracked ways (blue lines) (b) Conventional chronological video image
5. Conclusion
In this chapter we compared conventional stereo vision systems with time-of-flight vision
system and highlighted the advantages and disadvantages of both systems. The new PMD
technology represents a TOF vision system with many advantages in comparison to
conventional stereo vision systems especially in the automotive industry. The equations
needed for the design of such a system are derived and demonstrate the simplicity of the
www.intechopen.com

Stereo Vision
118
extraction of the range information. A PMD camera delivers absolute geometrical
dimensions of objects without depending on the object surface, - distance, -rotation and –
illumination. Hence PMD TOF vision systems are rotation-, translation- and illumination
invariant.
The major advantage of the PMD technology is the delivery of an evenly distributed range
and intensity images because each pixel calculates a range and intensity value. Hence the
correspondence problem of conventional stereo vision system does not exit. Another
advantage of the PMD technology is that the field-of-view can easily extended by varying
the modulation frequency without any special optical components. However, the range
resolution depends on the chosen modulation frequency. The higher the modulation
frequency the better the resolution and the smaller the measuring range. The range
resolution depends also on the power rating of the used active illumination source.
Furthermore it has been shown that the range data of the 3D-TOF camera is almost
independent on the reflection coefficient of the measured objects if a phase-shift algorithm is
used. The PMD technology has an inherent suppression of uncorrelated light signals such as
sun light or other modulated light disturbances. However if those light sources saturate the
sensor, the range information is lost. More advantages of a PMD technology are the
acquisition of the intensity and range data in each pixel without high computational cost
and any moving components as well as the monocular setup.
All these advantages lead to a compact and economical design of an automotive 3D TOF
vision system with a high frame rate. This vision system can be used for many different
applications such as smart airbag, driver assistant systems, pre crash systems, stop & go
systems, pedestrian safety systems, emergency break systems, gesture recognition systems
and so force. In this chapter experimental results of a PMD TOF vision system for
automotive outdoor applications such as Stop&Go, PreCrash and Pedestrian Safety are
presented and demonstrate that the accuracy of the system is appropriate to fulfil the tough
target settings in the automotive industry.
6. References
Beheim, G. & Fritsch, K. (1986). Range finding using frequency-modulated laser diode,
Applied Optics, 25 (9), pp. 1439-42
Benosman, R., Maniere, T. & Devars, J. (1996). Multidirectional stereovision sensor,
calibration and scene reconstruction, IEEE Int. Conf. on Pattern Recognition, ICPR,
vol.1, pp. 161-5
Buxbaum, B. & Hagebeuker, B. (2005). Dreidimensionale Umfeld-Erfassung, Trade Journal:
"Elektronik automotive", WEKA Publisher House, Issue 5, ISSN 1614-0125, pp. 77-
81
Cheng, S., Tu, D., Li, G. & Yang, J. (2002). Fusing Range and 2-D images in multisensor for
robot vision, IEEE TENCON, pp. 565-568
Dhond, U.R. & Aggarwal, J.K. (1989). Structur from stereo – A review, IEEE Trans. On
Systems, Man and Cybernetics, 19 (6), pp. 1489-1508
Hess, H., Albrecht, M., Grothof, M., Hussmann, S., Oikonomidis, N. & Schwarte, R. (2003).
3D object recognition in TOF data sets, Proc. SPIE, vol. 5086, pp. 221-228
www.intechopen.com
A Performance Review of 3D TOF Vision Systems in Comparison to Stereo Vision Systems
119
Hussmann, S. & Hess, H. (2006). Dreidimensionale Umwelterfassung, Trade Journal:
"Elektronik automotive", WEKA Publisher House, Issue 8, ISSN 1614-0125, pp. 55-
59
Hussmann, S. & Liepert, T. (2007). Robot Vision System based on a 3D-TOF Camera, IMTC
2007, IEEE Proc. of the 24th Int. Conf. on Inst. and Meas. Tec., pp. 1-5
Kang, S.B. & Szeliski, R. (1997). 3-D scene data recovery using omnidirictional multibaseline
stereo, International Journal of Computer Vision, 25 (2), pp. 167-83
Kawanishi, T., Yamazawa, K., Iwasa, H., Takemura, H., & Yokoya, N. (1998). Generation
of high resolution stereo panoramic images by omnidirectional imaging sensor
using hexagonal pyramidal mirrors, Int. Conf. on Pattern Recognition, ICPR, pp.
485-489
Krishnan, A. & Ahuja, N. (1996). Range estimation from focus using a non-frontal imaging
camera, International Journal of Computer Vision, 20 (3), pp. 169-185
Lange, R. (2000). 3D Time-of-flight distance measurement with custom solid-state image
sensors in CMOS/CCD-technology, PhD thesis, Dep. of Electrical Engineering and
Computer Science, University of Siegen, Online publication: http://www.ub.uni-
siegen.de/epub/diss/lange.htm
Liancheng, S. & Feng Z. (2005). Design of a novel stereo vision navigation system for mobile
robots, IEEE Int. Conf. on Robotics and Biomimetics (ROBIO), pp. 611-614
Lin, S.S. & Bajcsy, R. (2003). High resolution catadioptric omni-directional stereo sensor for
robot vision, Int. Conf. On Robotics & Automation, pp. 1694-1699
Moeller T., Kraft H., Frey J., Albrecht M. & Lange R. (2005). Robust 3D Measurement with
PMD Sensors, RIM-Day, ETH Zürich, Online-publication (http:
//www.pmdtec.com/inhalt/download/documents/RIM2005-PMDTec-
Robust3DMeasurements.pdf)
Moring, I., Heikkinen, T., Myllyla, R. & Kilpela, A. (1989). Acquisition of three-
dimensional image data by a scanning laser range finder, Optical Engineering, 28
(8), pp. 897-902
Ringbeck, T. & Hagebeuker, B. (2007). A 3D Time of flight camera for object detection,
Optical 3-D Measurement Techniques, ETH Zürich, Online-publication
(http://www.pmdtec.com/inhalt/download/documents/070513Paper-
PMD.pdf)
Ringbeck, T., Hagebeuker, B., Kraft, H. & Paintner, M. (2007). PMD-basierte 3D-
Optosensoren zur Fahrzeugumfelderfassung, In: Sensoren im Automobil II, Thomas
Tille, pp. 209-222, Expert Verlag GmbH, ISBN: 3816927505
Schwarte_a, R., Xu, Z., Heinol, H., Olk, J. & Buxbaum, B. (1997). New optical four-quadrant
phase-detector integrated into a photogate array for small and precise 3D-cameras,
Proc. SPIE, vol. 3023, pp. 119-128
Schwarte_b, R., Xu, Z., Heinol, H., Olk, J., Klein, R., Buxbaum, B., Fischer, H. & Schulte,
J. (1997). New electro-optical mixing and correlating sensor: facilities and
applications of the photonic mixer device (PMD), Proc. SPIE, vol.3100, pp. 245-
53
www.intechopen.com

Stereo Vision
120
Schwarte, R. & Heinol, HG. (1999). Optical component combines 3D image detection and
mixing, Elektronik, Publisher: WEKA-Fachzeitschriften, Germany, 48(12), pp. 80-
90
Theuwissen, A. (1995). Solid-State Imaging with Charge-Coupled Devices, Kluwer Academic
Publishers, ISBN-13: 978-0792334569
www.intechopen.com

Stereo VisionEdited by Asim Bhatti
ISBN 978-953-7619-22-0Hard cover, 372 pagesPublisher InTechPublished online 01, November, 2008Published in print edition November, 2008
InTech EuropeUniversity Campus STeP Ri Slavka Krautzeka 83/A 51000 Rijeka, Croatia Phone: +385 (51) 770 447 Fax: +385 (51) 686 166www.intechopen.com
InTech ChinaUnit 405, Office Block, Hotel Equatorial Shanghai No.65, Yan An Road (West), Shanghai, 200040, China
Phone: +86-21-62489820 Fax: +86-21-62489821
The book comprehensively covers almost all aspects of stereo vision. In addition reader can find topics fromdefining knowledge gaps to the state of the art algorithms as well as current application trends of stereo visionto the development of intelligent hardware modules and smart cameras. It would not be an exaggeration if thisbook is considered to be one of the most comprehensive books published in reference to the current researchin the field of stereo vision. Research topics covered in this book makes it equally essential and important forstudents and early career researchers as well as senior academics linked with computer vision.
How to referenceIn order to correctly reference this scholarly work, feel free to copy and paste the following:
Stephan Hussmann, Thorsten Ringbeck and Bianca Hagebeuker (2008). A Performance Review of 3D TOFVision Systems in Comparison to Stereo Vision Systems, Stereo Vision, Asim Bhatti (Ed.), ISBN: 978-953-7619-22-0, InTech, Available from:http://www.intechopen.com/books/stereo_vision/a_performance_review_of_3d_tof_vision_systems_in_comparison_to_stereo_vision_systems