A novel channel model for land mobile satellite navigation
7
A novel channel model for land mobile satellite navigation Andreas Lehner, Alexander Steingass, Institute of Communications and Navigation German Aerospace Center (DLR) 1 ABSTRACT In 2002 the German Aerospace Centre (DLR) performed a measurement campaign of the land mobile multipath channel. From this data we derived a channel model that is synthesising the measured channel impulse response. It allows the realistic simulation of the multipath channel by approximating every single reflection. This model includes time variant reflectors approaching and receding in dependency of the azimuth and elevation of the satellite. All the signal processing had been realised independently of the transmitted signal. Therefore the usability for both, navigation systems (GPS as well as GALILEO) and wideband communication systems is given. 2 INTRODUCTION Besides the ionosphere one of the most significant problems to achieve an accurate navigation solution in cities with GPS or GALILEO is the multipath reception. Various channel models do exist for ground to ground communications (e.g. COST 207 for the GSM system). But there is still a lack of knowledge for broadband satellite to earth channels [1]. Therefore the German Aerospace Centre (DLR) performed a measurement campaign in 2002. In this campaign we used a Zeppelin to simulate a satellite transmitting a 100 MHz broadband signal towards earth. To ensure a realistic scenario the signal was transmitted between 1460 and 1560 MHz just nearby the GPS L1 band. This signal was received by a measurement van and was recorded using a regular time grid. The so gathered data was then passed through a super resolution algorithm to detect the single reflections. In a further step we tracked the detected reflections in time and gained a knowledge about the characteristics of any isolated reflection. This includes both Doppler shift and delay of the reflection. On top of this we gained knowledge about the direct path behaviour. 3 DIRECT PATH In an open environment the direct path would be best represented by the line of sight (LOS) transmission of the signal. In an urban environment this LOS signal is often blocked so that the first received path is attenuated and possibly delayed with respect to the LOS. In cities we had been able to identify three major types of obstacles that influence the signal reception. 1. House fronts 2. Trees 3. Lampposts 3.1 The influence of House fronts When the LOS ray is going to be blocked by a house front the signal is obviously affected. Figure 1 shows the vehicle on a track during the measurement driving into the shadow of a building. The x-axis indicates the driven distance from start. At about 3886 m the vehicle is entering the shadowed area. Figure 1: Diffraction by a house front measurement in comparison to the model used
Transcript of A novel channel model for land mobile satellite navigation

A novel channel model for land mobile satellite navigation
Andreas Lehner, Alexander Steingass, Institute of Communications and Navigation
German Aerospace Center (DLR)
1 ABSTRACT In 2002 the German Aerospace Centre (DLR) performed a measurement campaign of the land mobile multipath channel. From this data we derived a channel model that is synthesising the measured channel impulse response. It allows the realistic simulation of the multipath channel by approximating every single reflection. This model includes time variant reflectors approaching and receding in dependency of the azimuth and elevation of the satellite. All the signal processing had been realised independently of the transmitted signal. Therefore the usability for both, navigation systems (GPS as well as GALILEO) and wideband communication systems is given. 2 INTRODUCTION Besides the ionosphere one of the most significant problems to achieve an accurate navigation solution in cities with GPS or GALILEO is the multipath reception. Various channel models do exist for ground to ground communications (e.g. COST 207 for the GSM system). But there is still a lack of knowledge for broadband satellite to earth channels [1]. Therefore the German Aerospace Centre (DLR) performed a measurement campaign in 2002. In this campaign we used a Zeppelin to simulate a satellite transmitting a 100 MHz broadband signal towards earth. To ensure a realistic scenario the signal was transmitted between 1460 and 1560 MHz just nearby the GPS L1 band. This signal was received by a measurement van and was recorded using a regular time grid. The so gathered data was then passed through a super resolution algorithm to detect the single reflections. In a further step we tracked the detected reflections in time and gained a knowledge about the characteristics of any isolated reflection. This includes both Doppler shift and delay of the reflection. On top of this we gained knowledge about the direct path behaviour.
3 DIRECT PATH In an open environment the direct path would be best represented by the line of sight (LOS) transmission of the signal. In an urban environment this LOS signal is often blocked so that the first received path is attenuated and possibly delayed with respect to the LOS. In cities we had been able to identify three major types of obstacles that influence the signal reception.
1. House fronts 2. Trees 3. Lampposts
3.1 The influence of House fronts When the LOS ray is going to be blocked by a house front the signal is obviously affected. Figure 1 shows the vehicle on a track during the measurement driving into the shadow of a building. The x-axis indicates the driven distance from start. At about 3886 m the vehicle is entering the shadowed area.
Figure 1: Diffraction by a house front measurement in comparison to the model used

From this instance on the signal is strongly attenuated. This behaviour is well known from the so called ”Knife Edge Model” [2]. In this model it is assumed that a planar wave is hitting a half sided infinitively large plate. The calculated attenuation from this model is also displayed in Figure 1. From this comparison the similarity of measurement and model is obvious. Therefore the knife edge model is selected to model this effect. This process is motion dependent only. 3.2 The influence of trees As it is shown in Figure 2 the LOS signal can be attenuated by trees. The measured process on the one hand side is dependent on the length of the LOS signal being within the tree, on the other hand side an additional process is visible caused by branches and leafs. In contrast to approaches where branches and leafs are modelled as very complex scatterers [3] we use a combination of an attenuating only cylinder
Figure 2: Signal attenuation by series of trees - comparison of measurement and cylinder model
Figure 3: LOS signal being affected by a lamppost - comparison of measurement and model
modelling the transmission through the tree and a statistical fading process modelling the branches and leafs. This process is motion dependent only. 3.3 The influence of lampposts Surprisingly a lamppost has a strong effect on the LOS signal. Figure 3 shows an example of a lamppost with a diameter D of 20 cm. When passing by such a post the strength of the signal begins to oscillate, goes down quickly in the direct shadow of the post and comes up again oscillating behind. We model a lamppost with a ”double knife edge model” where we assume two overlapping knife edge plates being present. One is reaching from −D/2<x<∞ and the other is reaching from −∞<x<D/2. Both edges are simulated separately and then added coherently. Figure 3 shows the near perfect match of model and measurement. This process is also motion dependent only. 4 REFLECTED SIGNAL In the measurement data many reflections appear in the urban environment [4, 5]. In contrast to ray tracing algorithms [6] we do not model a specific scenery. We assume reflections to be statistically distributed in the x,y,z space and generate them statistically. In order to match the measured statistic we must take a closer look at the echo distribution. 4.1 Influence of the relative angle Let us assume a receiver to be at position RX, a satellite at position S and a reflector at position R. Then the relative azimuth receiving angle α is the angle at the receiver (see Figure 4).
Figure 4: Definition of the angle α. We can see a clear dependency on the relative azimuth angle in the measurement data (Figure 5) with a maximum of the likelihood distribution at α = 180°. For this figure we averaged over all occurring absolute azimuth angles θ by
( )( )( )
( )∑∑
∑=
i i
i
i
ii
i
i
ppp
p
p
α θ
θ
θθα
θθα
α )( (1)
This on the first look astonishing result can be easily understand if one has in mind the very rectangular structure of urban cities. Due to this structure a corner reflector (see Figure 6) occurs very often in cities. The main characteristic of this reflector is that a ray coming from a satellite is being reflected back into the satellite direction in the x-y plane. Its elevation is unchanged. Then it is obvious that it is most likely to receive reflections from the opposite side of the satellite.
Figure 5: Likelihood distribution of the relative azimuth angle α (at 50° elevation).
Figure 6: Corner reflector as it can be often found in cities. 4.2 Geometric occurrence of reflectors Figure 7 shows the likelihood distribution of reflectors in a top view. In this figure the receiver is moving in x-direction only. It can clearly be seen that
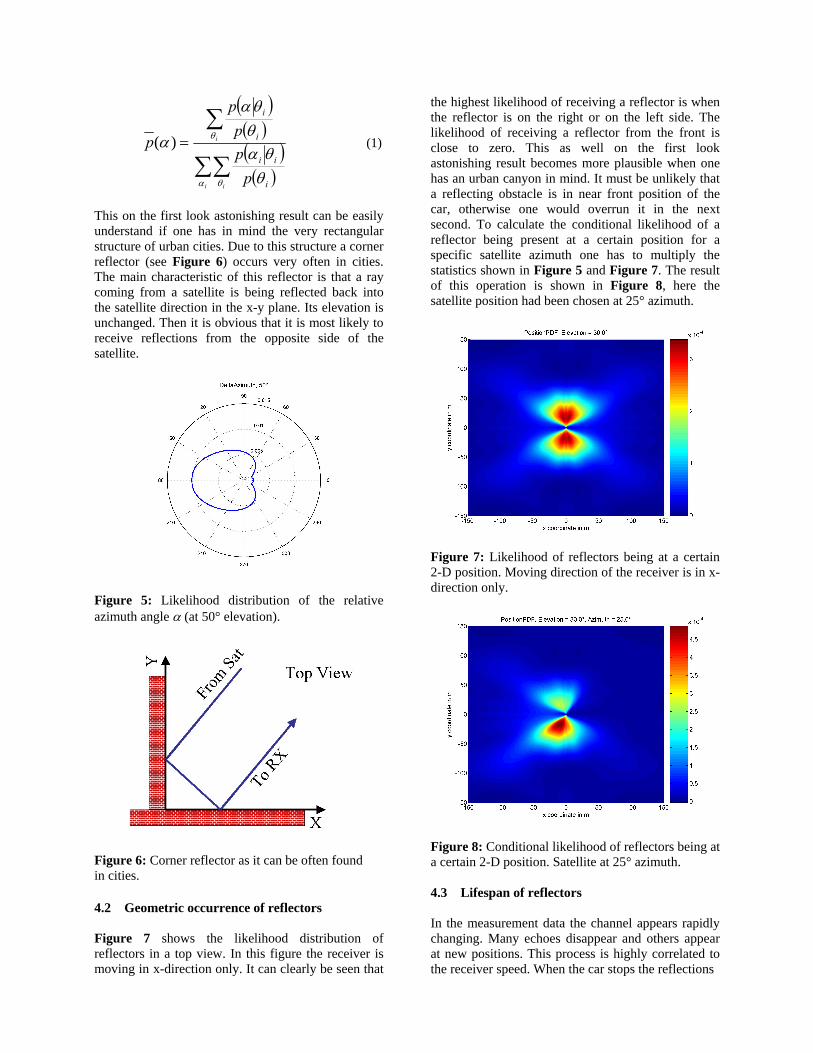
the highest likelihood of receiving a reflector is when the reflector is on the right or on the left side. The likelihood of receiving a reflector from the front is close to zero. This as well on the first look astonishing result becomes more plausible when one has an urban canyon in mind. It must be unlikely that a reflecting obstacle is in near front position of the car, otherwise one would overrun it in the next second. To calculate the conditional likelihood of a reflector being present at a certain position for a specific satellite azimuth one has to multiply the statistics shown in Figure 5 and Figure 7. The result of this operation is shown in Figure 8, here the satellite position had been chosen at 25° azimuth.
Figure 7: Likelihood of reflectors being at a certain 2-D position. Moving direction of the receiver is in x-direction only.
Figure 8: Conditional likelihood of reflectors being at a certain 2-D position. Satellite at 25° azimuth. 4.3 Lifespan of reflectors In the measurement data the channel appears rapidly changing. Many echoes disappear and others appear at new positions. This process is highly correlated to the receiver speed. When the car stops the reflections

Figure 9: Live distance of echoes remain in the scenery. Therefore we defined a life distance of each reflector. This life distance is the distance the receiver is travelling until the echo disappears. Figure 9 shows a histogram of the echo life distances. It can be seen that the life distance of the reflectors is usually well below 1 m. Most reflectors exist along a motion path below 5 m. Therefore the channel is changing rapidly. 4.4 Mean power of reflectors Figure 10 shows the power distribution in dependency of the relative position. Since reflectors in the real world have a given geometrical size of course their distance plays a major role for the mean received power. Having again in mind the urban canyon, it is quite understandable that the most powerful reflections are on the sides of the streets. With increasing distance the mean power of the reflections is decreasing. Beside the mean power map we have derived a power variance map (not shown) to allow a certain variation in this process, like we observed it in the measurements.
Figure 10: Mean power of the reflectors in dependency of their relative position.
4.5 Fading process of reflections When a car drives through an urban environment, the receiver moves through a quasi stationary field radiated by the reflectors. Therefore the receiver recognises a variation of the actual power of the reflector (see also Figure 12). Interesting enough this fading process does not even come to a stop when the car does not move. We assume that the channel is changing for example due to trees in the wind and other cars. Furthermore there was no correlation between this fading process and the receiver speed. Therefore we assume this process to be time dependent only. The typical bandwidth of such a process is in the range of some Hertz. The deepness of the fades is expressed by the Rice factor KRice.
fad
constRice P
PK = (2)
It defines the ratio between the constant power Pconst and the power of the fading process Pfad. Figure 11 shows the distribution of the Rice factor
Figure 11: Rice factor histogram of the fading process. 4.6 Time series characteristic of reflectors Classical channel models like the GSM channel model [7] use time invariant path delays and model the change of the reflector over the time by the assumption that many echoes are received at almost the same path delay and their absolute azimuth is equally distributed. The resulting Doppler spectrum, the so called Jakes spectrum [8], is given by:

⎪⎪⎪
⎩
⎪⎪⎪
⎨
⎧ <∀
⎟⎟⎠
⎞⎜⎜⎝
⎛−=
else
ff
ff
const
fS
DD
D
D
D
0
1)(
max2
max
(3)
This approach is feasible for narrow band systems like GSM but in a wide band system such as GPS/GALILEO we regard the modelling accuracy as insufficient. Figure 12 shows the sliding window Fourier transform of an isolated reflection. There it
Figure 12: Sliding window Fourier transform of an isolated reflection.
Figure 13: Model of an isolated reflector can be seen that the echo is best characterised by a trace in Doppler frequency. Within 1.6 s the Doppler frequency of the reflector changes from +30 Hz to -5 Hz. In the same period the path delay of the reflector changes. The variability of the reflector is clearly dependent on the vehicle speed. Therefore we implemented the channel model using a geometrical reflector representation. This means we initialise a reflector at a randomly chosen position (according to the measured statistics) and pass by with a receiver with the actual speed. Then both, path delay and phase of the reflection can be calculated geometrically. This causes the main process to be motion dependent only. Figure 13 shows how a
single reflector is modelled. In terms of the reflector the artificial scenery generates a continues series of receiver positions according to the actual speed. The receiver is moving only in x-direction. To simulate turns the relative azimuth of the satellite is changed. 4.7 Number of echoes During a drive through a city the number of echoes being received changes. For a navigation receiver that tries to estimate the channel impulse response (super resolution for multipath mitigation) a high number of reflections is a ”high stress scenario”. Other phases with a lower number of echoes are less critical. Besides the mean number of echoes it is therefore very important to exactly model this increasing and decreasing process. A sample of it is shown in Figure 14. Please note the relatively high number of echoes
Figure 14: Number of echoes at the same time during a 15 min drive trough a city. (up to 50) at the same time. We had been able to detect two processes: An extremely narrow band process with high power and a lower powered wide band process. Their combination results in a very good approximation of the process. 5 MODEL The block diagram in Figure 15 gives an overview of the implemented model. The x-coordinate and the relative satellite azimuth are derived from the user speed, user heading and satellite azimuth as explained in section 4.6. This drives the artificial scenery (Figure 16) where house fronts, trees and lampposts affect the direct path. Controlled by a number of echo generator the actual amount of reflections is created in the scenery at positions according to the likelihood distribution. The reflectors power, bandwidth, rice factor and lifespan are taken from the statistics. Their delay and phase is therefore changing according to this statistical parameters and according to the
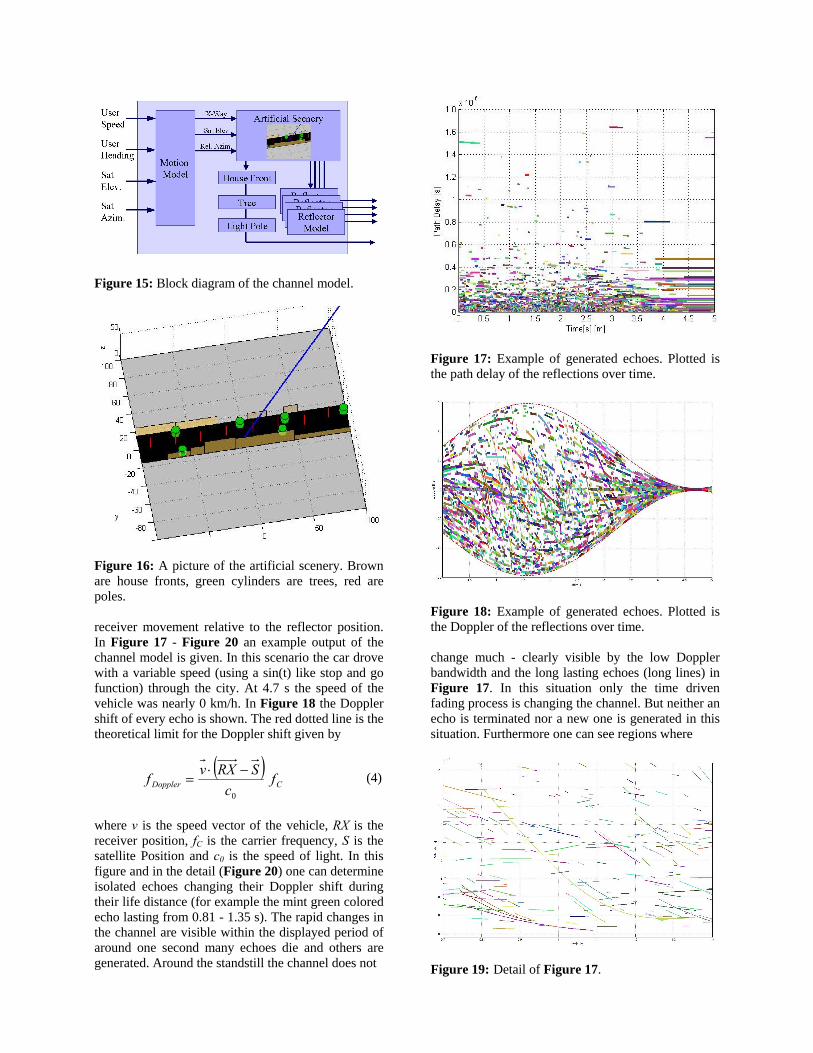
Figure 15: Block diagram of the channel model.
Figure 16: A picture of the artificial scenery. Brown are house fronts, green cylinders are trees, red are poles. receiver movement relative to the reflector position. In Figure 17 - Figure 20 an example output of the channel model is given. In this scenario the car drove with a variable speed (using a sin(t) like stop and go function) through the city. At 4.7 s the speed of the vehicle was nearly 0 km/h. In Figure 18 the Doppler shift of every echo is shown. The red dotted line is the theoretical limit for the Doppler shift given by
( )CDoppler f
cSRXvf
0
−⋅= (4)
where v is the speed vector of the vehicle, RX is the receiver position, fC is the carrier frequency, S is the satellite Position and c0 is the speed of light. In this figure and in the detail (Figure 20) one can determine isolated echoes changing their Doppler shift during their life distance (for example the mint green colored echo lasting from 0.81 - 1.35 s). The rapid changes in the channel are visible within the displayed period of around one second many echoes die and others are generated. Around the standstill the channel does not
Figure 17: Example of generated echoes. Plotted is the path delay of the reflections over time.
Figure 18: Example of generated echoes. Plotted is the Doppler of the reflections over time. change much - clearly visible by the low Doppler bandwidth and the long lasting echoes (long lines) in Figure 17. In this situation only the time driven fading process is changing the channel. But neither an echo is terminated nor a new one is generated in this situation. Furthermore one can see regions where
Figure 19: Detail of Figure 17.
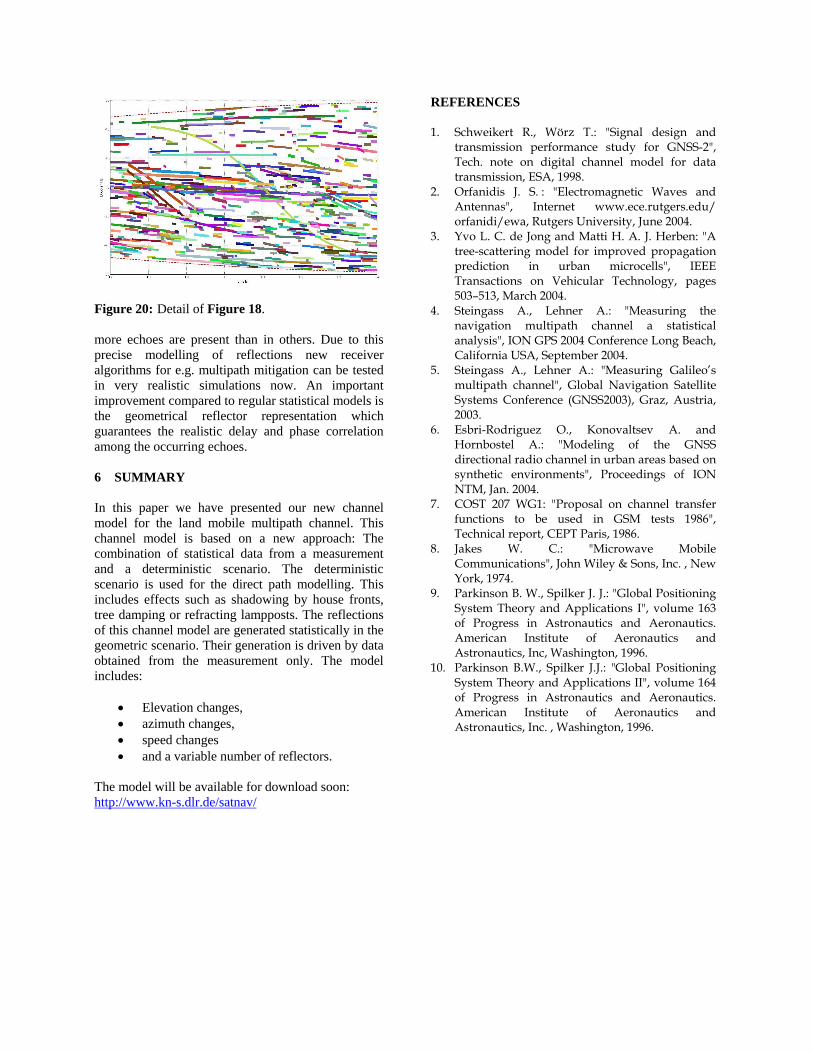
Figure 20: Detail of Figure 18. more echoes are present than in others. Due to this precise modelling of reflections new receiver algorithms for e.g. multipath mitigation can be tested in very realistic simulations now. An important improvement compared to regular statistical models is the geometrical reflector representation which guarantees the realistic delay and phase correlation among the occurring echoes. 6 SUMMARY In this paper we have presented our new channel model for the land mobile multipath channel. This channel model is based on a new approach: The combination of statistical data from a measurement and a deterministic scenario. The deterministic scenario is used for the direct path modelling. This includes effects such as shadowing by house fronts, tree damping or refracting lampposts. The reflections of this channel model are generated statistically in the geometric scenario. Their generation is driven by data obtained from the measurement only. The model includes:
• Elevation changes, • azimuth changes, • speed changes • and a variable number of reflectors.
The model will be available for download soon: http://www.kn-s.dlr.de/satnav/
REFERENCES 1. Schweikert R., Wörz T.: "Signal design and
transmission performance study for GNSS-2", Tech. note on digital channel model for data transmission, ESA, 1998.
2. Orfanidis J. S. : "Electromagnetic Waves and Antennas", Internet www.ece.rutgers.edu/ orfanidi/ewa, Rutgers University, June 2004.
3. Yvo L. C. de Jong and Matti H. A. J. Herben: "A tree-scattering model for improved propagation prediction in urban microcells", IEEE Transactions on Vehicular Technology, pages 503–513, March 2004.
4. Steingass A., Lehner A.: "Measuring the navigation multipath channel a statistical analysis", ION GPS 2004 Conference Long Beach, California USA, September 2004.
5. Steingass A., Lehner A.: "Measuring Galileo’s multipath channel", Global Navigation Satellite Systems Conference (GNSS2003), Graz, Austria, 2003.
6. Esbri-Rodriguez O., Konovaltsev A. and Hornbostel A.: "Modeling of the GNSS directional radio channel in urban areas based on synthetic environments", Proceedings of ION NTM, Jan. 2004.
7. COST 207 WG1: "Proposal on channel transfer functions to be used in GSM tests 1986", Technical report, CEPT Paris, 1986.
8. Jakes W. C.: "Microwave Mobile Communications", John Wiley & Sons, Inc. , New York, 1974.
9. Parkinson B. W., Spilker J. J.: "Global Positioning System Theory and Applications I", volume 163 of Progress in Astronautics and Aeronautics. American Institute of Aeronautics and Astronautics, Inc, Washington, 1996.
10. Parkinson B.W., Spilker J.J.: "Global Positioning System Theory and Applications II", volume 164 of Progress in Astronautics and Aeronautics. American Institute of Aeronautics and Astronautics, Inc. , Washington, 1996.