A 'New Diversity': Race and Ethnicity in the Appalachian … · 2009-06-10 · • “A ‘New...
44
Demographic and Socioeconomic Change in Appalachia A “NEW DIVERSITY”: RACE AND ETHNICITY IN THE APPALACHIAN REGION by Kelvin M. Pollard Population Reference Bureau September 2004
-
Upload
truongkiet -
Category
Documents
-
view
214 -
download
0
Transcript of A 'New Diversity': Race and Ethnicity in the Appalachian … · 2009-06-10 · • “A ‘New...
Demographic and Socioeconomic Change in Appalachia
A “NEW DIVERSITY”: RACE AND ETHNICITY IN THE APPALACHIAN
REGION
by
Kelvin M. Pollard Population Reference Bureau
September 2004

About This Series
“Demographic and Socioeconomic Change in Appalachia” is a series of reports that examine demographic, social, and economic levels and trends in the 13-state Appalachian region. Each report uses data from the decennial censuses of 1990 and 2000, plus supplemental information from other data sources. Current reports in the series include:
• “Appalachia at the Millennium: An Overview of Results from Census 2000,” by Kelvin M. Pollard (June 2003).
• “Housing and Commuting Patterns in Appalachia,” by Mark Mather (March 2004).
• “The Aging of Appalachia,” by John G. Haaga (April 2004). • “Households and Families in Appalachia,” by Mark Mather (May 2004). • “Educational Attainment in Appalachia,” by John G. Haaga (May 2004). • “A ‘New Diversity’: Race and Ethnicity in the Appalachian Region,” by Kelvin
M. Pollard (September 2004). • “Labor Market Performance, Poverty, and Income Inequality in Appalachia,” by
Dan A. Black and Seth G. Sanders (forthcoming).
Additional reports will cover: Migration and Immigration; Population Change and Distribution; and Geographic Concentration of Poverty. You can view and download the reports by visiting either www.prb.org or www.arc.gov. For more information about the series, please contact either Kelvin Pollard of the Population Reference Bureau (202-939-5424, [email protected]) or Gregory Bischak of the Appalachian Regional Commission (202-884-7790, [email protected]). The authors wish to thank the Appalachian Regional Commission for providing the funding for this series. Population Reference Bureau 1875 Connecticut Avenue, NW, Suite 520 Washington, DC 20009-3728 The Population Reference Bureau is the leader in providing timely and objective information on U.S. and international population trends and their implications. Appalachian Regional Commission 1666 Connecticut Avenue, NW, Suite 700 Washington, DC 20009-1068 The Appalachian Regional Commission’s mission is to be an advocate for and partner with the people of Appalachia to create opportunities for self-sustaining economic development and improved quality of life.

A “NEW DIVERSITY”: RACE AND ETHNICITY IN THE APPALACHIAN REGION
Kelvin M. Pollard
Population Reference Bureau
The Appalachian region has long been considered a predominantly white section
of the United States, particularly in comparison with the rest of the country. Yet ever
since the nation’s early origins, nonwhites always have been present in Appalachia. For
starters, there have been the region’s first inhabitants—the myriad American Indian tribal
groups that called the Appalachians home prior to the arrival of the first European settlers
in the 18th century. Appalachia also has long had an African American population—
starting with the presence of slavery in the southern states, where the “peculiar
institution” had already been established. Moreover, antebellum Appalachia had a small
population of free blacks. In the first U.S. census of 1790, the combined population of
slaves and free blacks in Appalachia totaled more than 19,000 (6 percent) of the region’s
total population of 307,000. By 1860, blacks had become 10 percent of Appalachia’s 5.4
million residents.1
But over the past century, numerous developments—the Great Migration of
African Americans to northern U.S. cities after World War I; the overall trend of the
United States from a rural, agrarian society to an urban, industrial one; and the general
out-migration of the Appalachian population to seek better economic opportunities—
have served to isolate Appalachia relative to the rest of the country. By 1990, the
percentage of Appalachia’s total population that was minority had shrunk from its pre-
Civil War levels. The region seemed largely untouched by the rest of the country’s
growing racial and ethnic diversity: About 9 percent of Appalachians (1.9 million
1

persons) were members of minority groups, compared with 25 percent of persons living
outside the region. And of those 1.9 million minority Appalachians, nearly 1.6 million
(84 percent) were non-Hispanic African Americans (see Figure 1).2 Hispanics, who by
1990 had become the region’s second-largest minority group by then, numbered just
137,000—1 percent of all Appalachian residents and 7 percent of Appalachia’s minority
population.
Figure 1 By 1990, minorities’ share of Appalachia’s population remained essentially unchanged from that of the previous century—even as racial and ethnic diversity increased in the rest of the United States. Racial-ethnic distribution of Appalachian and non-Appalachian population, 1990
HNon-Hispanic
Black7%
*Includes non-Hispanic America Source: U.S. Census Bu
.
Since 199
minorities have c
report will look a
concentrations, i
APPALACHIA
Non-Hispanic White91%
Other races *1%
ispanic1%
Hispa10
Non-Hispanic Black12%
n Indians, Asians, and Pacific Islanders.
reau, 1990 census.
0, however, Appalachia has become more dive
onstituted nearly half the region’s population g
t the post-1990 diversity of Appalachia, exami
ts contributing factors, and its breakdown by ra
2
NON-APPALACHIAN U.S
Non-Hispanic White74%
Other races *4%nic
%
rse: as racial and ethnic
rowth through 2000. This
ning its geographic
cial and ethnic minority

group. The study also will analyze how Appalachia’s increased racial and ethnic diversity
affects selected economic and social developments in the region; it concludes with an
examination of the potential implications of these growing trends. Comparisons
examined not only will involve Appalachia and the rest of the United States, but also
areas within the region—its three major subregions, the 13 states that are part of the
official Appalachian region, counties at different levels of economic development, and
urban and rural Appalachia.
Appalachia, the Census, and Racial/Ethnic Categories
The Appalachian Region. Analysts have come to define Appalachia—the area
surrounding the 1,500-mile Appalachian mountain system in eastern North America—
along economic typologies.3 This report uses the regional definition employed by the
Appalachian Regional Commission (ARC), a federal-state government partnership
designed to improve conditions in the Appalachia. The 410-county ARC region covers all
of West Virginia and parts of New York, Pennsylvania, Ohio, Maryland, Virginia, the
Carolinas, Tennessee, Kentucky, Georgia, Alabama, and Mississippi.4
Appalachia has three major subregions. Northern Appalachia contains the
Appalachian counties of New York, Pennsylvania, Maryland, and Ohio as well as 46 of
West Virginia’s 55 counties. Central Appalachia (often known as the region’s core)
includes the Mountaineer State’s nine southernmost counties as well as eastern Kentucky,
Virginia’s southwestern tip, and the northwestern portion of Tennessee’s Appalachian
area. Finally, southern Appalachia includes most of Appalachian Virginia and Tennessee
3
as well as the western Carolinas and the northern parts of Georgia, Alabama, and
Mississippi.5
Appalachia has some areas that are economically depressed and others that are as
advanced economically as the United States average. Recognizing this fact, the ARC has
classified the region into four categories of economic development—Distressed,
Transitional, Competitive, and Attainment.6 The region’s Distressed counties, which are
mostly in central Appalachia, have (a) per capita income no greater that 67 percent of the
national average, and both poverty and unemployment levels at least 150 percent of
United States levels. Counties with poverty rates that are 200 percent of the national
average also fall in the Distressed category. Transitional counties (which constitute most
of geographical Appalachia) are noticeably worse off economically than the nation as a
whole but do not meet all of the criteria necessary to be classified as Distressed. Counties
in the Competitive category have unemployment and poverty rates better than the national
average but per capita incomes of between only 80 percent and 99 percent of the U.S.
midpoint. Finally, Appalachian counties at the Attainment level have reached parity with
the rest of the nation in terms of income, poverty, and unemployment.7
The 2000 Decennial Census. The decennial U.S. census provides a detailed
examination of demographic, social, and economic characteristics for small areas of the
country such as counties and cities. The census—required by the U.S. Constitution to
provide data for congressional apportionment among the states—is also a guide for the
distribution of nearly $200 billion in federal funds. In addition, local officials, business
people, and others in both the public and private sector rely on census data to make
important decisions in such areas as transportation, housing, and economic development.
4

Finally, the results from the 2000 census allow researchers to analyze both the state of the
total U.S. population as well as of various demographic subgroups. These finely detailed
data sets allow users to study small areas individually and in comparative combinations.
Evolution of Racial and Ethnic Categories. The 2000 census was the first that
allowed individuals to categorize themselves as belonging to more than one race.
Although much has been made of this new feature (and there has been much debate about
how best to examine racial and ethnic trends between 1990 and 2000), racial categories
have always been evolving throughout the country’s history. In the first U.S. census of
1790, for example, census takers were instructed to classify free individuals as white or
“other”—the “other” category including American Indians, free African Americans, and
other “nonwhites.” (The 1790 census counted slaves separately.) By 1890, the racial
categories included white, black, several black-white mixed race groups (e.g., mulatto),
American Indian, and two Asian groups (Chinese and Japanese). Data for persons of
Hispanic or Latino origin were not collected until the 1970 census, as Latino immigrants
to the United States were beginning to increase in numbers.8 Thus, racial and ethnic
categories in the United States—indeed, of any society—have always reflected societal
assumptions.
The 1990s: An Era of Increasing Diversity within Appalachia
The 1990s continued the U.S. trend toward increased racial and ethnic diversity—
not only with a growth in the country’s population of specific racial groups, but also with
a marked national increase in multiracial marriages and births. Between 1970 and 2000,
for example, the number of interracial U.S. couples surged from 321,000 to 3.1 million,
5
accounting for 6 percent of the nation’s married couples.9 This latter phenomenon
spurred the Census Bureau to allow 2000 census respondents the option to describe
themselves as belonging to more than one race.
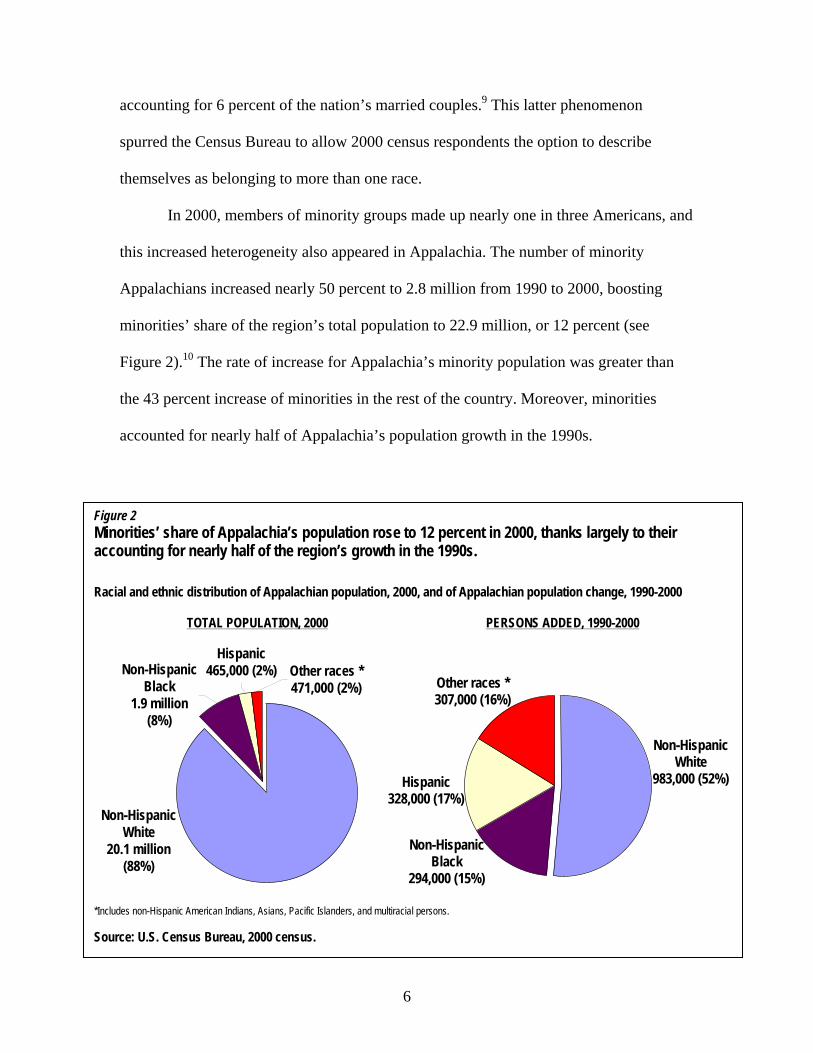
In 2000, members of minority groups made up nearly one in three Americans, and
this increased heterogeneity also appeared in Appalachia. The number of minority
Appalachians increased nearly 50 percent to 2.8 million from 1990 to 2000, boosting
minorities’ share of the region’s total population to 22.9 million, or 12 percent (see
Figure 2).10 The rate of increase for Appalachia’s minority population was greater than
the 43 percent increase of minorities in the rest of the country. Moreover, minorities
accounted for nearly half of Appalachia’s population growth in the 1990s.
Figure 2 Minorities’ share of Appalachia’s population rose to 12 percent in 2000, thanks largely to their accounting for nearly half of the region’s growth in the 1990s. Racial and ethnic distribution of Appalachian population, 2000, and of Appalachian population change, 1990-2000
Non-Hispanic White
20.1 million(88%)
Non-HispaBlack
1.9 millio(8%)
*Includes non-Hispani Source: U.S. Cen
0 0
TOTAL POPULATION, 200Other races * 471,000 (2%)
Hispanic 465,000 (2%)nic
n
Other ra307,000
Hispanic 328,000 (17%)
Non-HispaniBlack
294,000 (15%
c American Indians, Asians, Pacific Islanders, and multiracial persons.
sus Bureau, 2000 census.
6
PERSONS ADDED, 1990-200
Non-Hispanic White
983,000 (52%)
ces * (16%)
c
)
Unlike in the rest of the United States, where Hispanics outnumbered non-
Hispanic blacks for the first time, non-Hispanic African Americans continued to make up
most of Appalachia’s minority population—two-thirds (1.9 million) of the 2.8 million
minority Appalachians.11 Just as in the rest of the country, however, Hispanics fueled
much of the growth in Appalachia’s total—and minority—population. The 328,000
additional persons of Latino origin accounted for one-sixth of the 1.9 million residents
Appalachia added to its population during the 1990s—and more than one-third of the
region’s 929,000 additional minority residents. (By comparison, Appalachia added
294,000 blacks to its population between 1990 and 2000.)
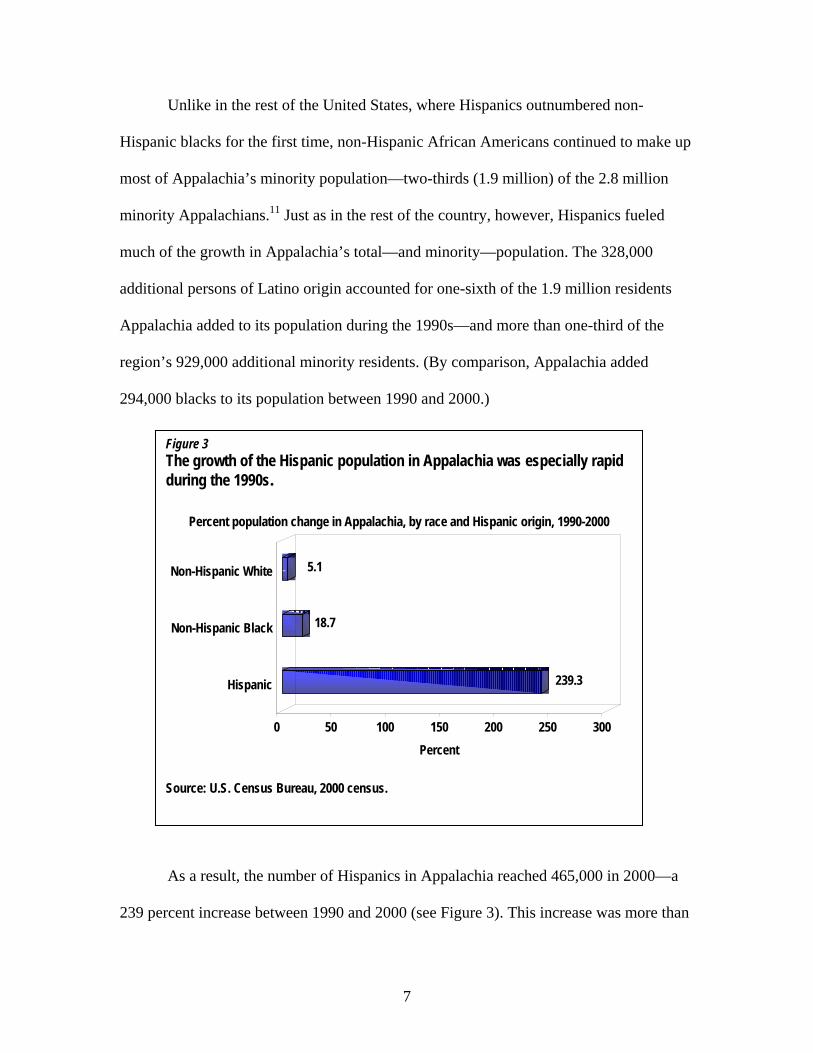
Figure 3 The growth of the Hispanic population in Appalachia was especially rapid during the 1990s.
Percent population change in Appalachia, by race and Hispanic origin, 1990-2000
239.3
18.7
5.1
0 50 100 150 200 250 300Percent
Non-Hispanic White
Non-Hispanic Black
Hispanic
Source: U.S. Census Bureau, 2000 census.
As a result, the number of Hispanics in Appalachia reached 465,000 in 2000—a
239 percent increase between 1990 and 2000 (see Figure 3). This increase was more than
7
10 times the 19 percent growth rate
of the region’s non-Hispanic blacks
and nearly 80 times the 5 percent
growth rate for Appalachia’s white
population. Although the region’s
Latino population in 1990 was tiny,
its high growth rate in the
subsequent decade illustrates the
inroads Hispanics have made in U.S.
areas where their presence
previously had been small.
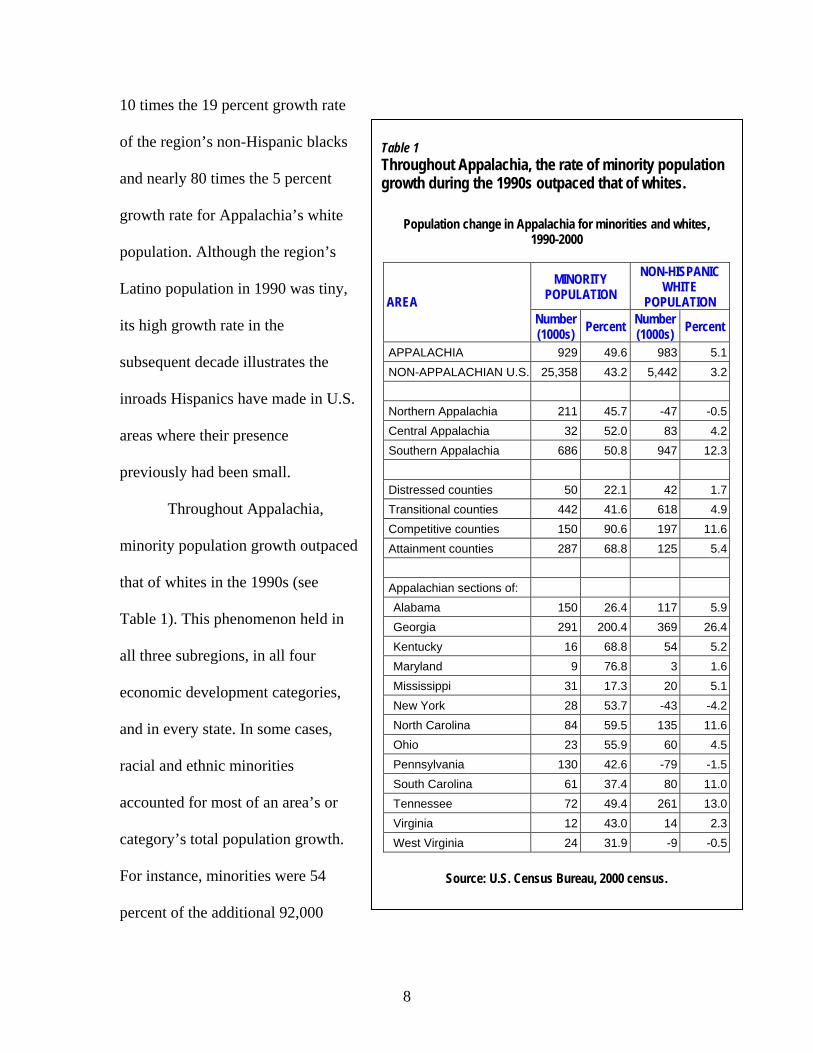
Table 1 Throughout Appalachia, the rate of minority population growth during the 1990s outpaced that of whites.
Population change in Appalachia for minorities and whites, 1990-2000
MINORITY POPULATION
NON-HISPANIC WHITE
POPULATION AREA Number (1000s) Percent Number
(1000s) Percent
APPALACHIA 929 49.6 983 5.1NON-APPALACHIAN U.S. 25,358 43.2 5,442 3.2 Northern Appalachia 211 45.7 -47 -0.5Central Appalachia 32 52.0 83 4.2Southern Appalachia 686 50.8 947 12.3 Distressed counties 50 22.1 42 1.7Transitional counties 442 41.6 618 4.9Competitive counties 150 90.6 197 11.6Attainment counties 287 68.8 125 5.4 Appalachian sections of: Alabama 150 26.4 117 5.9Georgia 291 200.4 369 26.4Kentucky 16 68.8 54 5.2Maryland 9 76.8 3 1.6Mississippi 31 17.3 20 5.1New York 28 53.7 -43 -4.2North Carolina 84 59.5 135 11.6Ohio 23 55.9 60 4.5Pennsylvania 130 42.6 -79 -1.5South Carolina 61 37.4 80 11.0Tennessee 72 49.4 261 13.0Virginia 12 43.0 14 2.3West Virginia 24 31.9 -9 -0.5
Source: U.S. Census Bureau, 2000 census.
Throughout Appalachia,
minority population growth outpaced
that of whites in the 1990s (see
Table 1). This phenomenon held in
all three subregions, in all four
economic development categories,
and in every state. In some cases,
racial and ethnic minorities
accounted for most of an area’s or
category’s total population growth.
For instance, minorities were 54
percent of the additional 92,000
8
residents in the Distressed counties and 70 percent of the 412,000 additional residents in
the Attainment counties. Minorities also comprised 75 percent of the 12,000 persons
western Maryland added to its population in the decade. Indeed, some parts of
Appalachia would have lost population in the 1990s were it not for minority growth. The
211,000 racial and ethnic minorities that northern Appalachia gained between 1990 and
2000, for example, offset the 47,000 whites the subregion had lost during the decade.
Similar scenarios played out in all of West Virginia and in Pennsylvania’s Appalachian
counties. And while southern New York State had about 16,000 fewer residents in 2000
than in 1990, its population loss would had been even greater were it not for the
additional 28,000 minority residents in the Empire State’s Appalachian section.
Despite the growth in the minority population throughout Appalachia, minorities
still make up a tiny share of the population in many areas of the region. Consider this:
Southern Appalachia, with a 19 percent minority population, was home in 2000 to 2
million of the region’s 2.8 million residents who were members of minority groups. By
contrast, 7 percent of northern Appalachians and just 4 percent of central Appalachia’s
residents were minority. The lack of racial and ethnic diversity is also stark among most
Appalachian counties (see Figure 4, page 10). In 2000, minorities were less than 10
percent of the total population in 310 of the region’s 410 counties, and less than 5 percent
in 215 of the counties. (On the other hand, every Appalachian county was at least 1
percent minority in 2000.) Of Appalachia’s 27 counties with minority populations of at
least 30 percent, all but four were in either Alabama or Mississippi. Non-Hispanic
African Americans were the predominant minority group in most of these counties—the
case in 163 of the 195 Appalachian counties that were at least 5 percent minority.
9
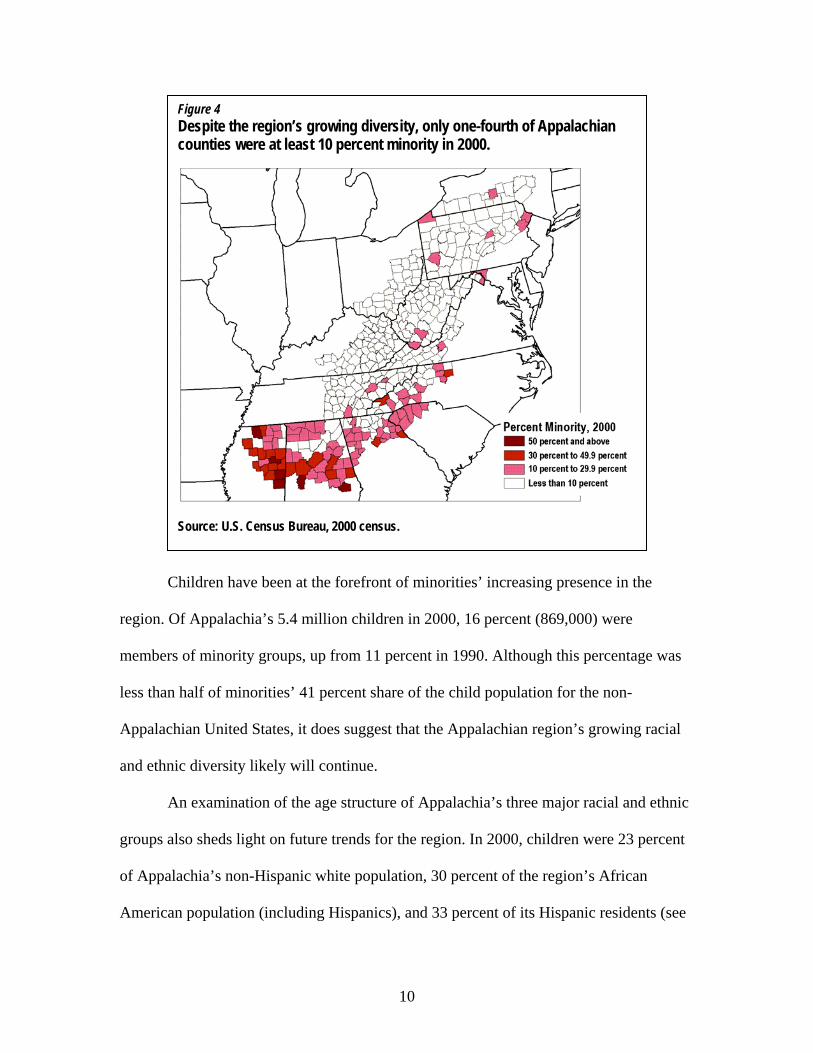
Figure 4 Despite the region’s growing diversity, only one-fourth of Appalachian counties were at least 10 percent minority in 2000.
Source: U.S. Census Bureau, 2000 census.
Children have been at the forefront of minorities’ increasing presence in the
region. Of Appalachia’s 5.4 million children in 2000, 16 percent (869,000) were
members of minority groups, up from 11 percent in 1990. Although this percentage was
less than half of minorities’ 41 percent share of the child population for the non-
Appalachian United States, it does suggest that the Appalachian region’s growing racial
and ethnic diversity likely will continue.
An examination of the age structure of Appalachia’s three major racial and ethnic
groups also sheds light on future trends for the region. In 2000, children were 23 percent
of Appalachia’s non-Hispanic white population, 30 percent of the region’s African
American population (including Hispanics), and 33 percent of its Hispanic residents (see
10

Table 2). At the other end of the age spectrum, one in seven of Appalachia’s whites were
age 65 or older, compared to just one in 11 blacks and one in 33 Hispanics. (Similar
patterns were present in the non-Appalachian United States, with children making up
about one-third of blacks and Hispanics and older persons comprising just one in 12
blacks and one in 20 Hispanics.)
appl
Nea
its L
were
work
any
Table 2 Children and younger workers have been at the forefront of Appalachia’s growing racial and ethnic diversity. Age structure of Appalachian population, by race and ethnicity, 2000
NON-HISPANIC
WHITE AFRICAN
AMERICAN * HISPANIC AREA Number
(1000s) Percent Number (1000s) Percent Number
(1000s) Percent
TOTAL POPULATION 20,092 100.0 1,882 100.0 465 100.0Under age 18 4,557 22.7 565 30.0 153 33.0Ages 18-44 7,523 37.4 803 42.7 249 53.5Ages 45-64 4,943 24.6 347 18.4 49 10.4Age 65 or older 3,070 15.3 167 8.9 14 3.1
*Includes persons of Hispanic origin. NOTE: Subtotals do not necessarily sum to totals due to rounding. Source: U.S. Census Bureau, 2000 census.
But the younger age structure of Appalachia’s minority populations particularly
ies to the region’s working age population—especially residents ages 18 to 44.
rly 43 percent of Appalachia’s black population and an incredibly high 54 percent of
atino residents were of the younger working ages. By contrast, people ages 18 to 44
just 37 percent of the region’s non-Hispanic white population. The share of younger
ing-age persons in the Latino population is particularly remarkable—it, more than
other statistic on Appalachia’s Hispanics, reflects the rapid regional growth in this
11
population during the last decade, particularly since younger working-age adults are most
likely to migrate to a new community.
Fertility, Migration, and Immigration: Accounting for the Rise of Diversity
Natural increase—particularly the higher fertility rates among many racial and
ethnic minorities—has accounted for some of Appalachia’s increasing diversity. During
the 1990s, for example, the total fertility rate (TFR, or the average number of children
women would have during their lifetime under existing fertility rates) was highest in the
United States for Hispanic women, at 2.8 in 1995 and 2.73 in 2000. African American
women had the next highest fertility levels nationally—a TFR of 2.13 in both 1995 and
2000. For women in the other racial groups (non-Hispanic white, Asian, and American
Indian), fertility levels were somewhat lower, with TFRs in the 1.8 to 1.9 range. The total
fertility rate for non-Hispanic white women was 1.78 in 1995 and 1.87 in 2000.12
Even considering the impact of natural increase, however, it has been migration—
particularly domestic migration—that has been the key force for Appalachia’s increasing
diversity. Migration patterns during both 1995 and 2000 illustrate this point. Twenty-
eight percent of Appalachia’s 2.6 million minorities age 5 and older had moved to their
county of residence between 1995 and 2000, compared with 17 percent of non-Hispanic
whites. (Mobility rates for the two groups were closer in the non-Appalachian United
States; 22 percent of minorities and 21 percent of whites had migrated from outside their
residential counties in the late 1990s.) While many Appalachian migrants had moved to
their county of residence from another county within the region, much of this movement
12
suggests an increasing awareness of Appalachian areas as a potential destination for
minority residents.
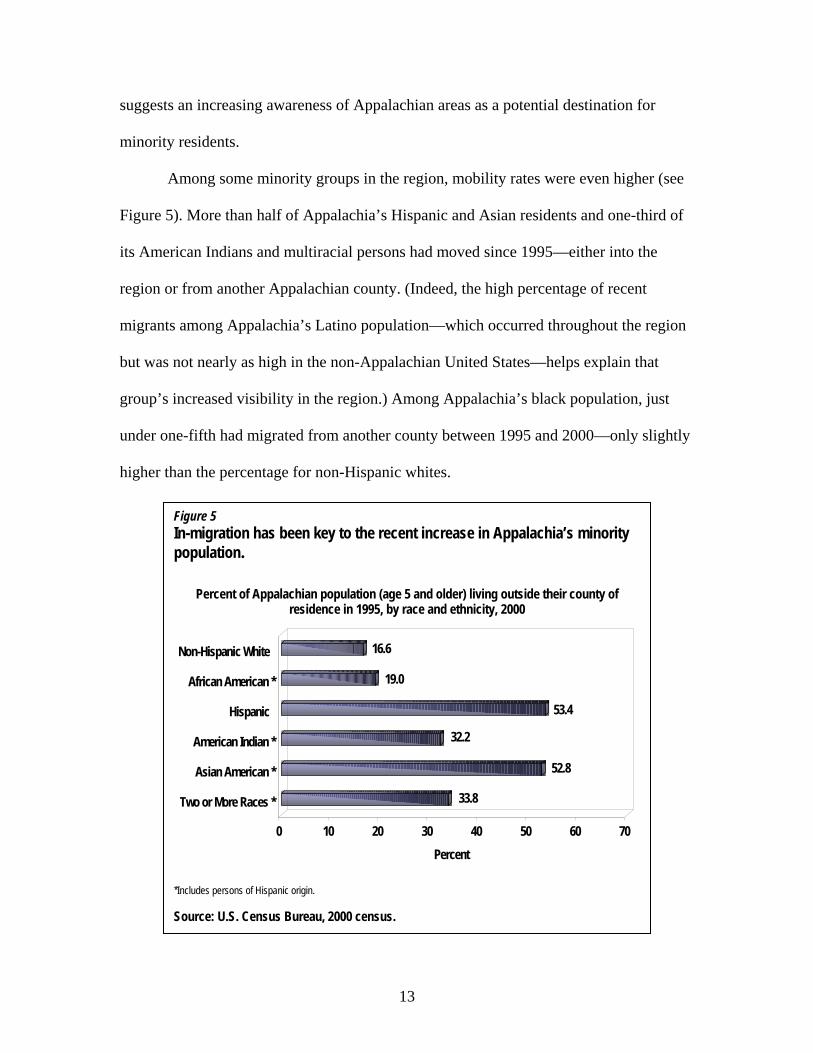
Among some minority groups in the region, mobility rates were even higher (see
Figure 5). More than half of Appalachia’s Hispanic and Asian residents and one-third of
its American Indians and multiracial persons had moved since 1995—either into the
region or from another Appalachian county. (Indeed, the high percentage of recent
migrants among Appalachia’s Latino population—which occurred throughout the region
but was not nearly as high in the non-Appalachian United States—helps explain that
group’s increased visibility in the region.) Among Appalachia’s black population, just
under one-fifth had migrated from another county between 1995 and 2000—only slightly
higher than the percentage for non-Hispanic whites.
Figure 5 In-migration has been key to the recent increase in Appalachia’s minority population.
Percent of Appalachian population (age 5 and older) living outside their county of residence in 1995, by race and ethnicity, 2000
33.8
52.8
32.2
53.4
19.0
16.6
0 10 20 30 40 50 60 7Percent
0
Non-Hispanic White
African American *
Hispanic
American Indian *
Asian American *
Two or More Races *
*Includes persons of Hispanic origin. Source: U.S. Census Bureau, 2000 census.
13
Some parts of the Appalachian region experienced extraordinary county-level
mobility rates among minorities from 1995 to 2000. For example, 53 percent of minority
residents in western Maryland had lived outside their 2000 county of residence in 1995,
as had 48 percent of northern Georgia’s minority population and 45 percent of western
Virginia’s. In 65 Appalachian counties, at least half of minority residents had migrated
from another county between 1995 and 2000. Most of these counties had fewer than
2,500 minority residents in 2000; for example, more than 70 percent of the minority
residents of the eastern Kentucky counties of Wolfe, Lee, and Menifee had lived in
another county in 1995, yet all of these counties still had fewer than 400 minority
residents in 2000. Other Appalachian counties that attracted most of their minority
residents in the late 1990s, however, either were in fast-growing metropolitan areas—
such as the Atlanta-area counties of Forsyth and Gwinnett—or housed major colleges and
universities—for example, Tompkins County, N.Y. (Cornell University and Ithaca
College); Centre County, Pa. (Pennsylvania State University); and Montgomery County,
Va. (Virginia Tech and Radford University).
Immigration—particularly from Latin America and Asia—has had a key impact
on the U.S. population’s composition at the dawn of the 21st century. For example, more
than three-fourths of the country’s 31.1 million foreign-born residents were born in either
Latin America or Asia, with more than half born in Latin America alone. (Natives of
those two world regions were nearly 9 percent of the total U.S. population in 2000.) In
Appalachia, however, immigration—regardless of country or region of origin—has had a
much smaller impact in the 1990s. Just 3 percent (611,000) of Appalachia’s total
population was born outside the United States, and 52 percent of that total had arrived in
14
the country since 1990. Natives of Latin America and Asia accounted for more than
410,000 of all foreign-born Appalachians, and 60 percent of those had arrived in the
country during the 1990s. However, less than 2 percent of all Appalachian residents were
born in these two world regions.
However, natives of Latin America and Asia have become a noticeable presence
in some Appalachian areas: for example, they make up 7 percent of the total population
for northern Georgia, thanks largely to the booming growth in the Atlanta suburbs and
north Georgia resort areas. In fact, the Peach State had seven of the 10 Appalachian
counties in which at least 5 percent of the residents had been born in Asia or Latin
America. Two of the other three such counties—Tompkins County, N.Y. (Cornell
University and Ithaca College) and Forsyth County, N.C. (Wake Forest University)—
housed major universities.
Appalachia’s Racial and Ethnic Groups
Non-Hispanic whites. From the beginnings of the nation’s history, Americans of
European origin have been the most dominant population group. At the beginning of the
20th century, nine in 10 Americans were white.13 As the racial and ethnic composition of
the country became increasingly diverse, however, non-Hispanic whites’ share of the
national population steadily grew. Still, non-Hispanic whites—those who do not identify
with any other racial group—made up nearly seven in 10 Americans at the dawn of the
21st century.
At 20.1 million in 2000 (88 percent of the population), non-Hispanic whites are
an even more dominant presence in the Appalachian region. Appalachia had about
15

983,000 more non-Hispanic whites in 2000 than it did in 1990, slightly more than half the
1.9 million residents the region added during the decade. But whites’ share of the
Appalachian population declined from 91 percent, as the region’s minority population
grew at a much faster rate in the 1990s (50 percent versus 5 percent).
Although Appalachia’s non-Hispanic white population grew more slowly in the
1990s than the region’s total population (9 percent), it did grow faster than the white
population in the rest of the country (3 percent). The white population grew fastest in
southern Appalachia (12 percent); it increased a phenomenal 26 percent in Appalachian
Georgia (thanks largely to the boom in suburban Atlanta). In northern Appalachia, by
contrast, the non-Hispanic white population actually declined slightly (by 47,000, or less
than 1 percent) during the 1990s, although the increase in the area’s minority population
(by 211,000) more than made up for that loss. Such also was the case in West Virginia
and in the Appalachian sections of Pennsylvania. In Appalachian New York State,
however, the increase of nearly 28,000 minority residents between 1990 and 2000 could
not offset the loss of more than 43,000 whites, making for a 2 percent net loss in
residents.
Because non-Hispanic whites are such a large majority of the Appalachian
population, their residency patterns almost match the patterns for all Appalachian
residents. Almost 90 percent of the region’s white population lives in northern or
southern Appalachia; Pennsylvania alone is home to more than 25 percent. Unlike the
pattern with the general Appalachian population, however, northern Appalachia has more
whites than southern Appalachia (9.4 million to 8.6 million). Three-fifths of the region’s
16
total and white populations live in metropolitan areas as defined by the U.S. Office of
Management and Budget (OMB); one-fifth live in areas of at least 1 million.14
Blacks/African Americans. The ancestors of most African Americans have been
in the United States for generations. As a result, blacks have been this country’s largest
single minority group throughout its history. The 2000 census, however, marked a
historic turning point. For the first time, Americans of Hispanic/Latino origin
outnumbered non-Hispanic blacks (35.3 million to 33.9 million). Although the 2000 non-
Hispanic African American population rises to 35.4 million when we include those
persons who indicated in the 2000 census that they were of more than one race, the
imminent status of Hispanics as the nation’s largest minority (fully confirmed with the
release of Census Bureau estimates for 2002 and 2003)15 is one more illustration of the
new realities of race and ethnicity in the United States.
In Appalachia, however, African Americans remain the largest minority group by
a large margin. In 2000, the region’s non-Hispanic blacks numbered nearly 1.9 million—
67 percent of Appalachia’s minority population and 8 percent of all Appalachians. The
inclusion of Latino blacks added 16,000 more people to the region’s black population in
2000, and adding blacks (both Hispanic and non-Hispanic) who marked more than one
race on the 2000 census form increased the black population in Appalachia to just under
2 million. This relatively small addition is because blacks are less likely than other
minority groups to marry non-blacks; just 12 percent of black spouses had a non-black
spouse in 2000.16
Appalachia’s non-Hispanic black population (using the single-race standard)
increased 19 percent between 1990 and 2000—not as fast as the minority population
17

overall, but still faster than the 16 percent increase among African Americans in the rest
of the country. The 294,000 additional black Appalachians represent 32 percent of the
929,000 minorities Appalachia gained during the decade. The African American
population increased just about everywhere in the region—even in areas that suffered
losses of either their total population (southern New York State) or their non-Hispanic
white population (northern Appalachia, West Virginia). Some areas increased their
numbers faster than others, however. For example, Georgia’s Appalachian section added
nearly 90,000 non-Hispanic blacks, a gain of 86 percent. And the black population in
Appalachian Maryland rose 63 percent, increasing the total number of African Americans
in the Old Line State’s westernmost counties from fewer than 9,000 to more than 14,000.
Indeed, 160 of Appalachia’s 410 counties more than doubled their non-Hispanic black
population during the 1990s; 102 of those counties had at least 2,500 non-Hispanic blacks
in 2000.
Just as with the overwhelming majority of the region’s minorities, most black
Appalachians (77 percent as of 2000) live in the region’s southern counties (see Figure 6,
page 19). Of the 119 Appalachian counties with at least 2,500 single-race African
Americans (including Hispanics) in 2000, 82 were in southern Appalachia. In fact,
Alabama alone was home to nearly one-third of the region’s black population; Jefferson
County (Birmingham) had nearly 261,000 black residents in 2000, the most of any single
Appalachian county. Twenty percent of the region’s black population resided in northern
Appalachia, with the vast majority (274,000 of 384,000) living in Pennsylvania. (More
than 159,000 lived in Allegheny County, Pa.—where Pittsburgh is located—alone.) And
central Appalachia was home to only 46,000 African Americans, just 2 percent of the
18
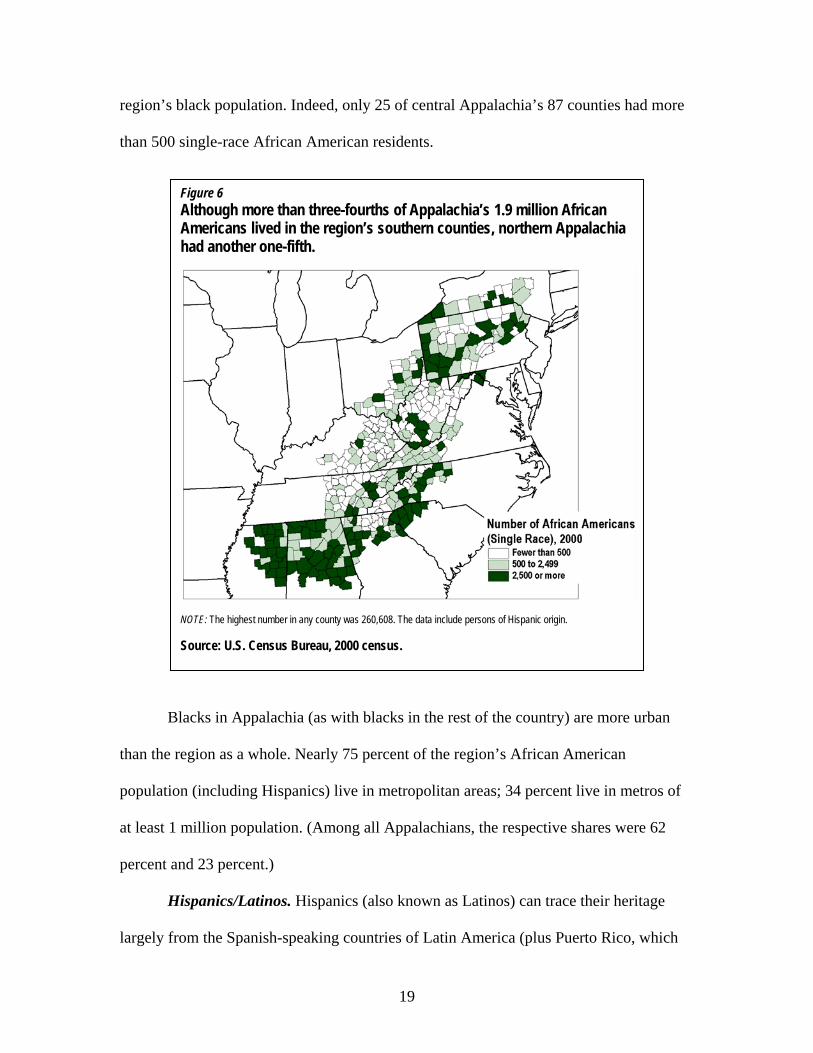
region’s black population. Indeed, only 25 of central Appalachia’s 87 counties had more
than 500 single-race African American residents.
Figure 6 Although more than three-fourths of Appalachia’s 1.9 million African Americans lived in the region’s southern counties, northern Appalachia had another one-fifth.
NOTE: The highest number in any county was 260,608. The data include persons of Hispanic origin. Source: U.S. Census Bureau, 2000 census.
Blacks in Appalachia (as with blacks in the rest of the country) are more urban
than the region as a whole. Nearly 75 percent of the region’s African American
population (including Hispanics) live in metropolitan areas; 34 percent live in metros of
at least 1 million population. (Among all Appalachians, the respective shares were 62
percent and 23 percent.)
Hispanics/Latinos. Hispanics (also known as Latinos) can trace their heritage
largely from the Spanish-speaking countries of Latin America (plus Puerto Rico, which
19

has commonwealth status in the United States). Immigration from Latin America,
coupled with higher fertility among some Latino groups than the U.S. national average,
has helped the U.S. Hispanic population to more than double over the past two decades—
from 14 million in 1980 to 35.3 million in 2000. In fact, the “lead engine” that has fueled
U.S. population growth during the 1990s has been the increase among Latinos. The
additional 13 million Hispanics in the United States between 1990 and 2000 accounted
for nearly half the growth in the national minority population over that period as well as
two-fifths of the overall population growth.
One key aspect of the growth among Hispanics in the 1990s has been the
occurrence of this increase in places with small (or previously small) Hispanic
populations—such as Appalachia. The region’s Latino population in the 1990s soared
from 137,000 in 1990 to 465,000 in 2000, a 239 percent increase. Hispanics accounted
for 17 percent of Appalachia’s population increase during the decade—more than any
other minority group. In several parts of Appalachia, this rate of increase was even
greater: the Latino population nearly quadrupled in large metropolitan areas (at least 1
million population), quintupled in southern Appalachia and in the region’s Attainment
counties, and sextupled in the Appalachian sections of Georgia and North Carolina. (The
Latino population in the Peach State’s Appalachian counties mushroomed from 24,000 in
1990 to 159,000 in 2000.) Although the small base of Appalachia’s 1990 Latino
population accounts for that group’s astronomical population increases by 2000,
Hispanics inarguably have become a more significant segment of the region’s
demographic profile.
20

As with African Americans, the region’s Hispanics were concentrated in southern
Appalachia (see Figure 7). Georgia’s Appalachian counties alone accounted for one-third
of the region’s Latino population in 2000, while Alabama and North Carolina combined
for another one-fourth. (Gwinnett County, Ga., in suburban Atlanta, had more than
64,000 Hispanics—the most of any Appalachian county.) Most of northern Appalachia’s
106,000 Hispanics lived in Pennsylvania. Fewer than 20,000 Hispanics lived in central
Appalachia in 2000, although that did represent an increase of 12,000 from the
subregion’s 1990 Latino total. Still, only eight central Appalachian counties had at least
500 Latino residents. The region’s Hispanic population—again like its black
Figure 7 The geographic concentration of Appalachia’s 465,000 Hispanic residents was similar to that of the region’s black population.
NOTE: The highest number in any county was 64,137. Source: U.S. Census Bureau, 2000 census.
21
population—had a predominately urban character: three in four Appalachian Latinos
lived in metropolitan areas in 2000, and more than half lived in metros of at least 250,000
population.
American Indians and Alaska Natives. Often called “the first Americans”
because of their presence on the North American continent before the arrival of
Europeans and Africans, the American Indian and Alaska Native population consist of
people with a variety of historical experiences. The American Indian population also is
one whose size is very difficult to measure, thanks to the “more than one race” option
allowed in the 2000 census and high rate of exogamy (marrying outside one’s own racial
group) among American Indians. Nearly 70 percent of American Indian spouses in the
United States were married to someone of another race in 2000.
In 2000, Appalachia was home to 60,000 non-Hispanic persons who identified
themselves as American Indians alone. Including Hispanics raises the region’s single-
race American Indian population to 65,000. And when one includes those American
Indians who also identify with another racial group into the mix, the number of American
Indians (including Hispanics) in Appalachia balloons to nearly 153,000—more than
twice the size of the “race alone” population. Even by the most inclusive standard,
however, American Indians remained less than 1 percent of the Appalachian population
in 2000.
Of course, which standard one uses to measure the American Indian population in
Appalachia also changes the growth rate measured for that demographic group during the
1990s. Appalachia’s population of non-Hispanic American Indians grew 31 percent
(14,000 persons) between 1990 and 2000 when the single-race standard was employed.
22

Under the multiple race definition, Appalachia’s American Indian population (including
Hispanics) tripled during the 1990s. Nationwide, American Indians and Alaska Natives
increased their numbers 26 percent or 110 percent, depending on whether the single-race
or multiple-race definition is used.
Southern Appalachia is the locus for the region’s American Indian population,
with 63 percent of Appalachia’s single-race American Indians (including Hispanics) in
2000. Forty percent of these people lived in just two states—Alabama and North Carolina
(see Figure 8). In fact, the Tar Heel State had the only two counties (Swain and Jackson)
with at least 2,500 single-race American Indian residents. (Just 19 other Appalachian
Figure 8 In 2000, more than two-fifths of Appalachia’s American Indian population lived in 21 of the region’s 410 counties. The greatest concentrations were in North Carolina.
NOTE: The highest number in any county was 3,765. The data include persons of Hispanic origin.
Source: U.S. Census Bureau, 2000 census.
23

counties had 500 or more American Indians within their boundaries.) American Indians
(using the single-race standard) were also the most rural of Appalachia’s racial and ethnic
groups—nearly half lived outside metropolitan areas, and more than one-fourth lived
outside either metropolitan or micropolitan areas. Under the multiple race definition,
American Indians are slightly more urban—but not much: 57 percent lived in
metropolitan areas in 2000.
Asian Americans, Native Hawaiians, and Other Pacific Islanders. Asian
Americans arguably make up the most diverse racial and ethnic group, tracing their
origins to nations such as China, Japan, Korea, Vietnam, India, Pakistan, and Thailand—
each with its own linguistic and cultural traditions. Thanks largely to the immigration of
many Asian groups, Asian Americans have recently been the fastest growing group in
terms of population percentage change, nearly tripling their national numbers between
1980 and 2000.
Native Hawaiians and Other Pacific Islanders (NHPIs) similarly trace their origins
to places with diverse traditions—in their case, the islands of the Pacific, including
Hawaii, Guam, and Samoa. Because Native Hawaiians, the largest single Pacific Islander
group, is a native American group, the NHPI population in the United States grew
relatively slowly in the 1980s and 1990s.
Appalachia was home to 201,000 non-Hispanic Asian Americans and 4,700 non-
Hispanic Native Hawaiians/Other Pacific Islanders in 2000 (using the single-race
definition). Including Hispanics bumps the Asian numbers up to 202,000, while
increasing the NHPI population to nearly 6,400. The rate of intermarriage is quite high
for both groups; nationally, 28 percent of Asian spouses and 61 percent of NHPI spouses
24

were married to persons outside their race in 2000.17 Because of intermarriage,
Appalachian Asians and Pacific Islanders who also identified with another race boosted
both groups’ regional 2000 population significantly—to 240,000 Asians and 14,000
Pacific Islanders in the Appalachian region. The combined population of both Asians and
Pacific Islanders (single race) in Appalachia was nearly double the region’s Asian and
Pacific Islander population in 1990.
About 58 percent of Appalachia’s single-race Asian American population
(including Hispanics) lives in southern Appalachia. Georgia alone had 27 percent of the
region’s Asians, while Pennsylvania had another 23 percent (see Figure 9). The influence
of metropolitan Atlanta and Pittsburgh accounts for the high number of Asians in their
Figure 9 Appalachian counties with a noticeable Asian American presence tended to be either in metro areas or home to major universities.
NOTE: The highest number in any county was 42,360. The data include persons of Hispanic origin.
Source: U.S. Census Bureau, 2000 census.
25

respective states. Indeed, 84 percent of Asians in the Appalachian region live in
metropolitan areas—the largest share of any racial or ethnic group. Forty-one percent live
in large metros (areas with at least 1 million population). Many counties that have
sizeable (2,500 or more) Asian American populations are home to major universities.
These counties include many of those cited earlier—Tompkins County, N.Y. and Centre
County, Pa., for example—as well as others such as Broome County, N.Y. (location of
the State University of New York at Binghamton) and Greenville County, S.C. (Furman
University).18
Similarly, more than half of Appalachia’s single-race NHPIs live in southern
Appalachia. Among the states, the largest number of NHPIs lived in Pennsylvania (about
one-fifth). More than two-thirds lived in metropolitan areas, although the greatest number
lived in mid-size metros (between 250,000 and 1 million population).
Multiracial persons. In 2000, 6.8 million Americans (including Hispanics)
identified with more than one race on their census forms; they constituted 3 percent of all
Americans. In Appalachia, the multiracial population (again, including Hispanics)
numbered 219,000—less than 1 percent of the region’s total population.
As was the case nationally, most of the Appalachia’s multiracial population came
from four interracial combinations (see Table 3, page 27). Persons of mixed white and
American Indian heritage were the most common in Appalachia, numbering 69,000 (32
percent) of the multiracial population. More than 48,000 Appalachians (22 percent of the
region’s multiracial population) were both white and African American, and more than
24,000 (11 percent of multiracial persons) identified themselves as both white and Asian
American. The fourth combination concerned persons listing themselves as both white
26
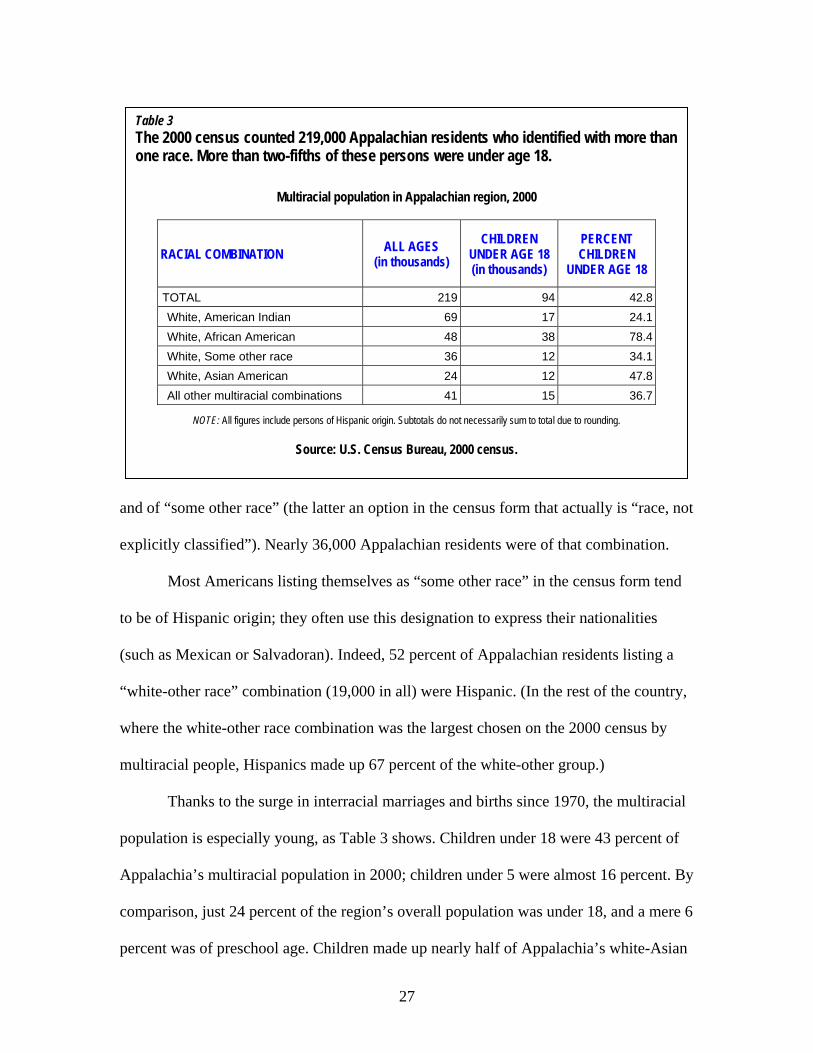
Table 3 The 2000 census counted 219,000 Appalachian residents who identified with more than one race. More than two-fifths of these persons were under age 18.
Multiracial population in Appalachian region, 2000
RACIAL COMBINATION ALL AGES (in thousands)
CHILDREN UNDER AGE 18 (in thousands)
PERCENT CHILDREN
UNDER AGE 18
TOTAL 219 94 42.8 White, American Indian 69 17 24.1 White, African American 48 38 78.4 White, Some other race 36 12 34.1 White, Asian American 24 12 47.8 All other multiracial combinations 41 15 36.7
NOTE: All figures include persons of Hispanic origin. Subtotals do not necessarily sum to total due to rounding.
Source: U.S. Census Bureau, 2000 census.
and of “some other race” (the latter an option in the census form that actually is “race, not
explicitly classified”). Nearly 36,000 Appalachian residents were of that combination.
Most Americans listing themselves as “some other race” in the census form tend
to be of Hispanic origin; they often use this designation to express their nationalities
(such as Mexican or Salvadoran). Indeed, 52 percent of Appalachian residents listing a
“white-other race” combination (19,000 in all) were Hispanic. (In the rest of the country,
where the white-other race combination was the largest chosen on the 2000 census by
multiracial people, Hispanics made up 67 percent of the white-other group.)
Thanks to the surge in interracial marriages and births since 1970, the multiracial
population is especially young, as Table 3 shows. Children under 18 were 43 percent of
Appalachia’s multiracial population in 2000; children under 5 were almost 16 percent. By
comparison, just 24 percent of the region’s overall population was under 18, and a mere 6
percent was of preschool age. Children made up nearly half of Appalachia’s white-Asian
27

population, and more than three-fourths of its residents who listed themselves as both
white and African American. (Among persons identifying with more than one racial
group, the relative proportions were similar outside the region—42 percent of multiracial
persons were under 18, and 14 percent were under age 5.)
For the most part, the same distributional patterns in the multiracial population
held throughout the region, although there were some exceptions. In northern Appalachia,
for example, persons identifying themselves as white and black made up the largest
multiracial combination—26,000, versus 25,000 for persons of white-American Indian
heritage. The white-black combination also was the most populous multiracial group in
the region’s large metropolitan areas. Nearly half of the multiracial persons in
Appalachia’s Distressed counties (and in counties that did not border a metropolitan area)
considered themselves white and American Indian. However, the white-American Indian
combination was only the third largest interracial group in the more urban Attainment
counties (behind both the white-other race and white-African American combinations).
Despite their small numbers, recent trends in interracial relationships, the high
share of children in the multiracial population, and even the very existence of a “more
than one race” option in the 2000 census form all presage a significant change in the way
Appalachians—indeed, all Americans—think about race. Indeed, the above data suggest
that persons identifying with more than one race will become a greater part of the
Appalachian (and the total U.S.) population in future decades.
28
Racial and Ethnic Patterns within Appalachia
Northern, Central, and Southern Appalachia. As has been the case historically,
Appalachia’s minority population remained concentrated in the region’s southern areas as
the 21st century began. Southern Appalachia, in fact, was home to 2 million of the
region’s 2.8 million residents who were members of minority groups; minorities made up
19 percent of the subregion’s 10.7 million residents in 2000. In contrast, just 7 percent of
northern Appalachia’s population of 10 million (673,000) was minority, as was only 4
percent of central Appalachia’s (92,000 out of 2.2 million).
In all three subregions, non-Hispanic African Americans were the largest single
minority group, although blacks were barely half of central Appalachia’s minority
population and less than three-fifths of northern Appalachia’s. (African Americans were
71 percent of the minority population in southern Appalachia.) Hispanics were the second
largest minority in all three subregions, yet persons of more than one race outnumbered
non-Hispanic Asians in northern and central Appalachia.
The rapid growth of Appalachia’s minority population was felt in all three
subregions. The minority population in central and southern Appalachia grew slightly
more than 50 percent in the 1990s; northern Appalachia’s increased 46 percent. As
expected, the Hispanic population grew especially quickly during the decade, particularly
in southern Appalachia, where the Hispanic population quintupled. (Of Appalachia’s
328,000 additional Latino residents, 272,000 of them were in the region’s southern
counties.)
The states. Among the states in the Appalachian region, Alabama’s Appalachian
counties had the largest number of minorities (719,000) as of 2000. Indeed, the
29

Yellowhammer State was the only one in the region where more minorities resided inside
Appalachia than outside it. The Appalachian sections of Georgia and Pennsylvania—
buoyed by the Atlanta and Pittsburgh metro areas, respectively—also had more than
400,000 minority residents each in 2000. (These three states alone accounted for 57
percent of Appalachia’s minority residents.) There were more than 200,000 minorities in
the western Carolinas, East Tennessee, and northeastern Mississippi.
At 34 percent, Mississippi’s Appalachian counties had the highest percentage of
minorities, with the Appalachian sections of Alabama (25 percent), South Carolina (22
percent), and Georgia (20 percent) following. In the Appalachian sections of eight of the
other nine states, minority residents were less than 10 percent of the total population. In
every state with Appalachian and non-Appalachian sections—even in Mississippi and
Alabama—minorities made up a smaller share in the Appalachian portion than in the rest
of the state.19
Non-Hispanic African Americans were the largest single minority group in each
state; they were less than half of the minority population in just Georgia and Kentucky.
With 606,000 black Appalachian residents (nearly one-third of the region’s black
population), Alabama had the largest number. Georgia had Appalachia’s largest number
of Hispanics—159,000, slightly fewer than the 193,000 non-Hispanic blacks who resided
the Peach State’s Appalachian counties. Half of Appalachia’s non-Hispanic Asian
population lived in Georgia and Pennsylvania alone, while Alabama and North Carolina
had the largest numbers of American Indians (single-race). (Alabama and Pennsylvania
had the largest numbers of American Indians who also identified with another race in
2000.) One in five Appalachian residents who were of two or more races lived in
30
Pennsylvania, while more than one in 10 each called Alabama, Georgia, and Tennessee
home.
Although every state increased its minority population, there was much variation
among the states. In northern Georgia, for example, the minority population tripled, while
the Hispanic population increased nearly seven-fold. By contrast, the minority
populations in the Appalachian sections of Mississippi and Alabama increased less than
30 percent—well under the regional average. Hispanic growth exceeded total minority
growth in nearly every state; the number of additional Hispanics exceeded the number of
additional non-Hispanic blacks in seven states (including Georgia, North Carolina, and
West Virginia).
Economic development categories. Nearly two-thirds of Appalachian residents
(14.7 million of 22.9 million) and more than half the region’s minority population (1.5
million of 2.8 million) lived in the region’s Transitional counties. But another one-fourth
of Appalachia’s minority population—704,000—lived in the region’s nine Attainment
counties, which were 22 percent minority as a result—the greatest presence among the
four groups. By contrast, racial and ethnic minorities made up just 10 percent of the
populations in the both the region’s Transitional and Distressed counties. Fourteen
percent of the Competitive county population was minority. That minorities were the
greatest presence (proportionally) in the Attainment counties is likely not a coincidence;
virtually all the counties in this group were in southern Appalachia or in metropolitan
areas. Among all four categories, most minority Appalachians were non-Hispanic black,
with Hispanics the second-largest minority.
31
As with the region’s overall population growth, minority population growth in
Appalachia during the 1990s was greatest in its Competitive and Attainment counties.
Competitive counties collectively increased their minority populations 91 percent
between 1990 and 2000, while Attainment counties added 69 percent. Minority growth
was much slower in the Transitional and Distressed counties (42 percent and 22 percent,
respectively).
As elsewhere, Hispanic growth outpaced that of other minorities—more than
quadrupling in the Competitive and Attainment counties, and more than doubling in the
Transitional and Distressed counties.
Metropolitan and nonmetropolitan Appalachia. In 2000, 2.1 million minority
Appalachian residents (74 percent of the region’s minority population) lived in
metropolitan areas. About 910,000—nearly one-third—lived in metros of at least 1
million population (large metros). By contrast, just 60 percent of the region’s non-
Hispanic whites resided in metros, and just 21 percent called large metros home. As a
result, minorities were nearly 15 percent of the region’s metropolitan population and
close to 18 percent of the population of large metros. Non-Hispanic blacks made up about
two-thirds of the minority residents in large and mid-size Appalachian metros, and about
three-fifths of minorities in small metros (250,000 or fewer persons)—with Hispanics the
second largest minority.
About 430,000 members of minority groups called Appalachia’s micropolitan
areas (the rough equivalent of small-town areas) home, while just 301,000 lived outside
“core-based statistical areas” (CBSAs)—a term the U.S. Office of Management and
Budget uses to describe both metropolitan and micropolitan areas.20 Minorities
32

constituted just 9 percent of the population in Appalachia’s micropolitan areas and 8
percent of the region’s outside-CBSA population. And minorities made up an even
smaller share of the more rural Appalachian counties—just 6 percent of the population of
counties not bordering a metro area and with an urban population of less than 2,500. 21
Between 1990 and 2000, Appalachia’s minority population increased about 50
percent in metropolitan and micropolitan areas, but less than 40 percent outside CBSAs.
The Hispanic Appalachian population more than tripled in most types of areas, and nearly
quadrupled in large metros. In most types of metros, micros, and outside-CBSA areas,
additional Latinos accounted for more of the increase than any other single minority
group. Non-Hispanic blacks held that distinction in large metros such as Atlanta and
Pittsburgh, however.
Race, Ethnicity, and Selected Economic and Social Patterns
Industrial structure. Both white and minority workers in Appalachia were most
likely to be found in the rapidly growing—and diverse—service sector.22 In 2000,
service-related jobs employed 50 percent of the region’s 9.2 million white workers and
52 percent of its 1.1 million minority workers. Throughout the region, minority workers
were more likely to be in the service industries than white ones. For example, about 65
percent of minorities in northern Appalachia worked in the service sector, compared with
53 percent of white workers in the subregion. In the 271 Appalachian counties with
enough African Americans for data to be available, 55 percent of black workers were in
the service sector (see Figure 10, page 34).23 Appalachia’s Hispanic workers, however,
do not seem to be nearly as likely to work in the service industry. Service-sector jobs
33
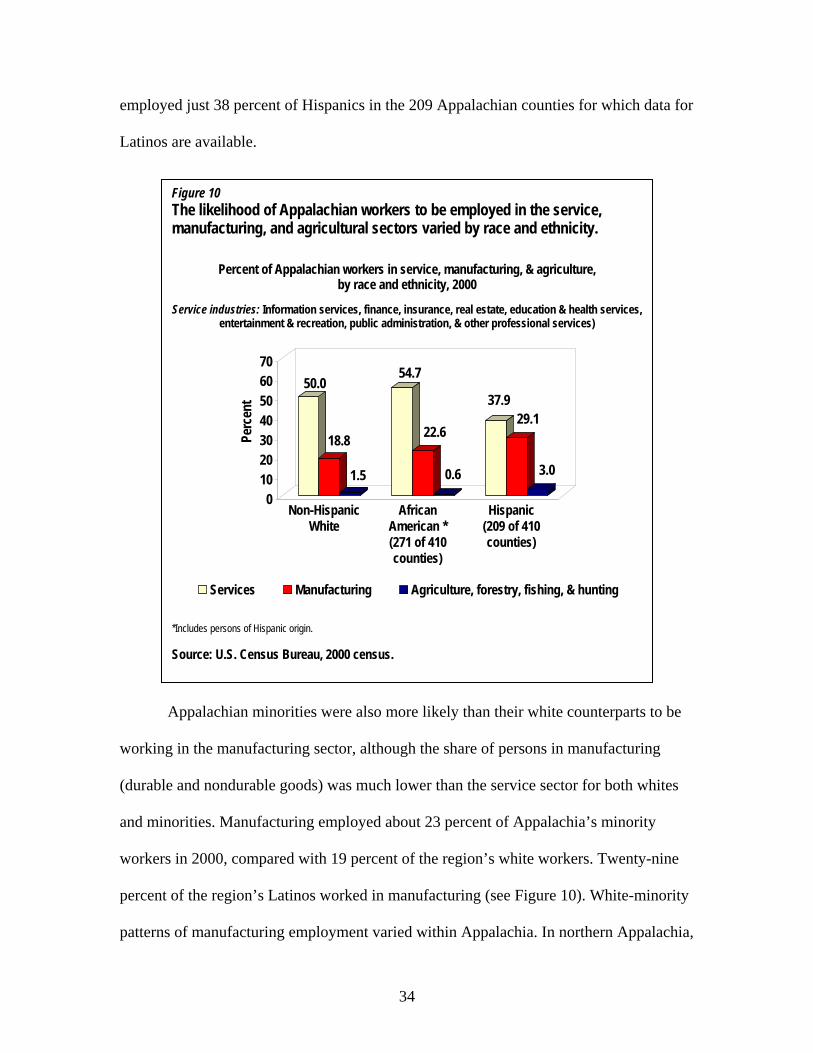
employed just 38 percent of Hispanics in the 209 Appalachian counties for which data for
Latinos are available.
Figure 10 The likelihood of Appalachian workers to be employed in the service, manufacturing, and agricultural sectors varied by race and ethnicity.
Percent of Appalachian workers in service, manufacturing, & agriculture, by race and ethnicity, 2000
Service industries: Information services, finance, insurance, real estate, education & health services,
entertainment & recreation, public administration, & other professional services)
50.0
18.8
1.5
54.7
22.6
0.6
37.929.1
3.0
010203040506070
Perc
ent
Non-HispanicWhite
AfricanAmerican *(271 of 410counties)
Hispanic(209 of 410counties)
Services Manufacturing Agriculture, forestry, fishing, & hunting
*Includes persons of Hispanic origin. Source: U.S. Census Bureau, 2000 census.
Appalachian minorities were also more likely than their white counterparts to be
working in the manufacturing sector, although the share of persons in manufacturing
(durable and nondurable goods) was much lower than the service sector for both whites
and minorities. Manufacturing employed about 23 percent of Appalachia’s minority
workers in 2000, compared with 19 percent of the region’s white workers. Twenty-nine
percent of the region’s Latinos worked in manufacturing (see Figure 10). White-minority
patterns of manufacturing employment varied within Appalachia. In northern Appalachia,
34

for example, whites were more likely than minorities to be in manufacturing (17 percent
to 13 percent), while in the region’s Distressed counties, the gap between whites and
minorities was much larger: 29 percent of minorities in these counties worked in
manufacturing, compared to 16 percent of whites.
Whites were more likely than minorities to work in Appalachia’s extractive
industries (agriculture, forestry, fishing, hunting, and mining), although only 2 percent of
whites were employed in these sectors. Not surprisingly, the larger percentages of
workers in these sectors were in the more rural parts of the region; in central Appalachia,
for example, 6 percent of whites and nearly 5 percent of minorities were in extractive
industries.
More than three-fourths of Appalachia’s white and minority workers (76 percent
and 80 percent, respectively) were employees in private businesses (either for-profit or
non-profit). Government—federal, state, and local—employed another 14 percent of
whites and minorities. As in rest of the country, whites in Appalachia were more likely
than minorities to be self-employed; about 10 percent of white workers in the regions had
their own businesses, compared with nearly 6 percent of minority workers.
Data for counties with available data for Hispanics suggest that Appalachia’s
Latino workers were even more likely to be in the private sector; nearly 88 percent were
employed by private businesses. By contrast, only 6 percent were employed by the
federal, state, or local government—less than half the share for whites and other
minorities. Citizenship requirements for government jobs provide one possible
explanation for this discrepancy. Nationally, only 71 percent of Latinos were U.S.
35
citizens in 2000, compared with 98 percent of non-Hispanic whites and 97 percent of
blacks.
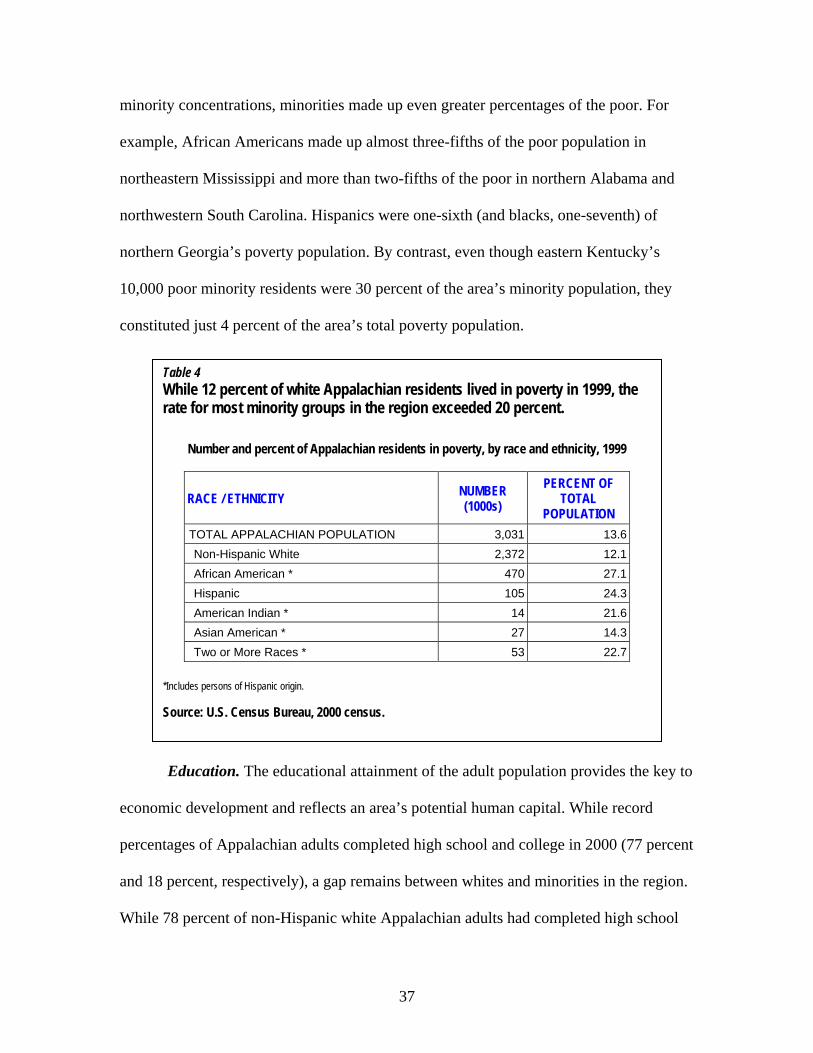
Poverty status. Poor people in Appalachia made up 13.6 percent of the region’s
total population, just over one percentage point higher than the percentage of poor people
in the rest of the United States. But the gap between the two sections widens when
considering both whites and minority residents. About 12 percent of Appalachian whites
and 25 percent of minority Appalachian residents were in poverty in 1999—somewhat
higher than the 8 percent for non-Hispanic whites and 22 percent for minorities
nationally. Indeed, the 2000 census figures show significant racial and ethnic poverty
gaps in Appalachia (see Table 4, page 37). The rates for most minority groups exceeded
20 percent—and reached 27 percent for African Americans (including Hispanics). For
every group except American Indians, poverty levels were higher in Appalachia than in
the rest of the country. Poverty rates for Appalachian minorities as a whole (and for
blacks and Hispanics) exceeded the rates for the region’s whites for all states, subregions,
economic development categories, and metropolitan/micropolitan levels. Of course, the
gaps are wider in some areas than in others. In northwestern South Carolina, 9 percent of
non-Hispanic whites lived in poverty, compared with 24 percent of African Americans
and Latinos. By contrast, the racial-ethnic gap in eastern Kentucky was proportionally
narrower—24 percent for whites, 31 percent for blacks, and 37 percent for Hispanics.
The greater poverty rates among minority groups have yielded interesting patterns
in the region’s poverty population. For example, racial and ethnic minorities make up 12
percent of Appalachian residents, but in 1999, they were 22 percent (659,000) of the
region’s 3 million persons living in poverty. In some Appalachian areas with higher
36
minority concentrations, minorities made up even greater percentages of the poor. For
example, African Americans made up almost three-fifths of the poor population in
northeastern Mississippi and more than two-fifths of the poor in northern Alabama and
northwestern South Carolina. Hispanics were one-sixth (and blacks, one-seventh) of
northern Georgia’s poverty population. By contrast, even though eastern Kentucky’s
10,000 poor minority residents were 30 percent of the area’s minority population, they
constituted just 4 percent of the area’s total poverty population.
Table 4 While 12 percent of white Appalachian residents lived in poverty in 1999, the rate for most minority groups in the region exceeded 20 percent.
Number and percent of Appalachian residents in poverty, by race and ethnicity, 1999
RACE / ETHNICITY NUMBER (1000s)
PERCENT OF TOTAL
POPULATION TOTAL APPALACHIAN POPULATION 3,031 13.6 Non-Hispanic White 2,372 12.1 African American * 470 27.1 Hispanic 105 24.3 American Indian * 14 21.6 Asian American * 27 14.3 Two or More Races * 53 22.7
*Includes persons of Hispanic origin. Source: U.S. Census Bureau, 2000 census.
Education. The educational attainment of the adult population provides the key to
economic development and reflects an area’s potential human capital. While record
percentages of Appalachian adults completed high school and college in 2000 (77 percent
and 18 percent, respectively), a gap remains between whites and minorities in the region.
While 78 percent of non-Hispanic white Appalachian adults had completed high school
37

and 18 percent had finished college, only 69 percent of the region’s minorities had
finished high school, and 16 percent had finished college. Educational attainment rates
also vary among some of Appalachia’s minority groups (see Figure 11). Almost 70
percent of the region’s African Americans had at least a high school diploma in 2000, but
only 12 percent possessed a college degree. Among Appalachia’s Hispanic population,
just 51 percent of adults had finished high school, but 13 percent had a college degree—
better than the national average of 10 percent. And of the region’s small Asian American
population, 83 percent had graduated from high school, while 51 percent had finished
college.
Figure 11 Educational attainment for Appalachian adults reached record levels in 2000. However, high school and college completion rates varied by race and ethnicity. Percent of Appalachian persons age 25 and older completing high school and college,
by race and ethnicity, 2000
77.7
18.0
69.9
12.2
51.4
13.0
0102030405060708090
100
Perc
ent
Non-HispanicWhite
AfricanAmerican *
Hispanic
High school College
*Includes persons of Hispanic origin. Source: U.S. Census Bureau, 2000 census.
38
As with other measures discussed earlier, differences between white and minority
education levels in Appalachia varied within the region. In southern Appalachia, for
example, 77 percent of whites had completed high school and 20 percent had a college
degree. The corresponding rates for southern Appalachian blacks were 69 percent and 13
percent, respectively; among Latinos, 46 percent had high school diplomas and 11
percent had college degrees. Hispanic adults in northern Appalachia compared more
favorably; 69 percent had finished high school in 2000, while 19 percent had a college
degree. (That BA/BS attainment rate actually was greater than the 18 percent rate for
northern Appalachia’s white population.)
Dealing with the New Diversity
During the 1990s, the growing racial and ethnic diversity in the United States also
manifested itself in the Appalachian region. The share of minorities in Appalachia
increased from 9 percent in 1990 to 12 percent in 2000, and nearly half of the residents
added to the Appalachian population were minority. Moreover, the tripling of the
region’s Hispanic population in the 1990s shows the increasing diversity of Appalachia’s
minority population, although African Americans still constituted two-thirds of the
region’s minorities.
Census Bureau estimates from 2002 suggest that the racial and ethnic trends of
the 1990s in Appalachia are continuing.24 Nearly half of Appalachia’s additional 321,000
residents since 2000 have been minority; Latinos alone made up one-fourth of the
additional population. As a result, racial and ethnic minorities—increasingly diverse but
still mostly African American—now account for 13 percent of Appalachia’s population.
39
What are the implications of Appalachia’s growing racial and ethnic diversity?
For starters, the combination of increased migration of minority residents and the higher
fertility of minorities (the latter a result of the younger age structure of many minorities)
will fuel further increases in Appalachia’s minority populations. This greater presence
will in turn challenge decision makers in both the public and private sector to address
integrating minorities into existing communities. As the numbers of blacks, Latinos, and
other minorities continue to grow in Appalachia’s public school system and its work
force, the region’s decision makers will have to address the region’s racial and ethnic
disparities as expressed in social indicators such as poverty and education. As with the
rest of the United States, how Appalachia deals with the new realities of its diversity
ultimately will shape the region’s future for decades to come.
40
REFERENCES
1 John Alexander Williams, Appalachia: A History (Chapel Hill, N.C.: The University of North Carolina Press, 2002): 111, table 2.1. 2 The decennial U.S. census asks separate questions for race and Hispanic origin. As a result, persons of Hispanic origin can be of any racial group. (For example, a person of Puerto Rican ancestry can be both black and Hispanic.) 3 Donald J. Bogue and Calvin L. Beale, Economic Areas of the United States (New York: The Free Press of Glencoe, Inc, 1961): 214-215; Calvin L. Beale, “A Characterization of Types of Metropolitan Areas,” in A Taste of the Country: A Collection of Calvin Beale’s Writings, ed. Peter A. Morrison (University Park, Pa., and London: The Pennsylvania State University Press, 1990): 59-75; and Faqir S. Bagi, Richard J. Reeder, and Samuel D. Calhoun, “Federal Funding’s Unique Role in Appalachia, Rural Development Perspectives 14, no. 1 (May 1999): 14-21. 4 In addition to the 410 counties, the Appalachian region contains eight Virginia cities that are independent of any county authority (that is, they function like counties). For analytical purposes, the Appalachian Regional Commission—following the practice of the U.S. Bureau of Economic Analysis (BEA)—incorporates each independent city within an adjacent county, and this report follows that practice. 5 Appalachian Regional Commission, unpublished data not available on their website. The ARC created the current subregions in 1974 as a result of an analysis of several geographic, economic, and demographic factors. For a detailed analysis of the criteria used to define the three subregions, see Appalachian Regional Commission, “The New Appalachian Subregions and their Development Strategies,” Appalachia, a Journal of the Appalachian Regional Commission 8, no. 1 (September 1974): 11-27. An earlier classification of Appalachia into four subregions is available in Appalachian Regional Commission, “Experiment in Appalachia,” Appalachia, a Journal of the Appalachian Regional Commission 1, no. 1 (September 1967): 3-5. 6 This report uses the ARC’s economic status classifications as of Fiscal Year 2003. 7 Appalachia’s 21Competitive and nine Attainment counties are mostly in southern Appalachia. All but one of the Attainment counties are in metropolitan areas. For more information about the four economic development categories, see Kelvin M. Pollard, “Appalachia at the Millennium: An Overview of Results from Census 2000,” Demographic and Socioeconomic Change in Appalachia (June 2003), accessed online at www.arc.gov/images/reports/census2000/overview/appalachia_census2000.pdf, on June 9, 2004, and at www.prb.org/Template.cfm?Section=PRB&template=/ContentManagement/ContentDisplay.cfm&ContentID=8826, on June 9, 2004. 8 Kelvin M. Pollard and William P. O’Hare, “America’s Racial and Ethnic Minorities,” Population Bulletin 54, no. 3 (September 1999): 8-9, box 1. 9 U.S. Census Bureau, “Census 2000 PHC-T-19. Hispanic Origin and Race of Coupled Households: 2000,” accessed online at www.census.gov/population/cen2000/phc-t19/tab01.pdf, on Sept. 5, 2003; and “Table 1: Race of Wife by Race of Husband: 1960, 1970, 1980, 1991, and 1992,” accessed online at www.census.gov/population/socdemo/race/interractab1.txt, on Sept. 5, 2003. 10 The minority population in 2000 includes all “multiracial” persons—including those non-Hispanic whites who identified with another racial group. 11 Unless otherwise indicated in this report, references to the 2000 population for blacks, American Indians, Asians, and Native Hawaiians/Other Pacific Islanders are for the persons who identified themselves only with their individual racial group.
41

12 Centers for Disease Control, National Center for Health Statistics, “Revised Birth and Fertility Rates for the 1990s and New Rates for Hispanic Populations, 2000 and 2001: United States,” by Brady E. Hamilton, Paul D. Sutton, and Stephanie J. Ventura, National Vital Statistics Report 51, no.12 (Aug. 4, 2003). 13 Pollard and O’Hare, “America’s Racial and Ethnic Minorities”: 3. 14 Metropolitan areas were newly classified by the U.S. Office of Management and Budget in June 2003, following the release of 2000 census data. All discussion of population change and distribution in metropolitan and nonmetropolitan areas, and of their various types, will be based on their 2003 classification status. 15 The July 1, 2003 estimates show that the nation’s Hispanic population was 39.9 million, compared with 35.6 million non-Hispanic blacks (single race) and 37.0 million non-Hispanic blacks (single or multiple race). For more information, see U.S. Census Bureau, “Annual Estimates of the Population by Sex, Race and Hispanic or Latino Origin for the United States: April 1, 2000 to July 1, 2003,” accessed online at eire.census.gov/popest/data/national/tables/NC-EST2003-03.pdf, on June 26, 2004. 16 Census Bureau, “Census 2000 PHC-T-19.” 17 Census Bureau, “Census 2000 PHC-T-19.” 18 Many of these counties also are part of metropolitan areas—often mid-size (between 250,000 and 999,999 population) or smaller. 19 In Maryland, New York, Tennessee, and Virginia, minorities were less than 10 percent of the population within Appalachia and at least 30 percent of the residents in the rest of the state. 20 Micropolitan areas, as defined by the U.S. Office of Management and Budget (OMB), contain urban clusters of between 10,000 and 49,999 population, the county where the urban cluster is located, and any other county with strong economic ties to the main county, as measured by commuting patterns. This report uses all such designations as of June 2003. 21 According to the Census Bureau, the term “urban” refers to the presence of a settlement of at least 2,500 persons. The terms “metropolitan” and “nonmetropolitan,” by contrast, concerns the commuting ties between two counties. Therefore, a county can have an urban population and still be considered nonmetropolitan. 22 This report defines “the service sector” to include information services, finance, insurance, real estate, education, health and social services, entertainment and recreation, food service, public administration, and a host of other services. Persons employed in the service sector work in a variety of occupations—from those requiring college and advanced degrees (such as attorneys, bank managers, and teachers) to jobs requiring relatively few skills and no more than a high school diploma (for example, convenience store clerks, office couriers, and restaurant servers). 23 Public-use, county-level data on industry and class of worker by race are only available from the census’ Summary File 4, which is subject to a population threshold for data. Population, social, economic, and housing characteristics are only available for areas (states, counties, neighborhoods, etc.) with at least 100 persons of a certain population group (such as race, ethnicity, or ancestry) and at least 50 unweighted cases (for the tabulation of sample, or long form, data). In Appalachia, 271 of the region’s 410 counties had data for African Americans; 209 had available statistics for Hispanics. 24 U.S. Census Bureau, “County Population Estimates by Race Alone and Hispanic or Latino Origin: July 1, 2002,” various state files accessed at eire.census.gov/popest/data/counties/CO-EST2002-ASRO-02.php, on Dec. 2, 2003.
42