A Multiparadigm Modeling Investigation of Membrane...
12
Journal of The Electrochemical Society, 163 (2) F59-F70 (2016) F59 A Multiparadigm Modeling Investigation of Membrane Chemical Degradation in PEM Fuel Cells Matias A. Quiroga, a,b,c Kourosh Malek, d,e and Alejandro A. Franco a,b,c, ∗, z a Laboratoire de R´ eactivit´ e et Chimie des Solides (LRCS), Universit´ e de Picardie Jules Verne and CNRS, UMR 7314, Amiens, France b R´ eseau sur le Stockage Electrochimique de l’Energie (RS2E), FR CNRS 3459, France c ALISTORE European Research Institute, 80039 Amiens Cedex, France d Department of Chemistry, Simon Fraser University, Burnaby, British Columbia V5A 1S6, Canada e NRC-EME, Vancouver, British Columbia, Canada We report a multi-paradigm model of the membrane chemical degradation in Polymer Electrolyte Membrane Fuel Cells (PEMFCs), by combining Coarse-Grained Molecular Dynamics (CGMD) and a multiscale cell performance model. CGMD is used to generate structural databases that relate the amount of detached (degraded) ionomer sidechains with the water content and the resulting PEM meso-microporous structure. The multiscale cell performance model describes the electrochemical reactions and transport mechanisms occuring in the electrodes from an on-the-fly coupling between Kinetic Monte Carlo (KMC) sub-models parametrized with Density Functional Theory (DFT) data and (partial differential equations-based) continuum sub-models. Furthermore, the performance model includes a kinetic PEM degradation sub-model which integrates the CGMD database. The cell model also predicts the instantaneous PEM sidechain content and conductivity evolution at each time step. The coupling of these diverse modeling paradigms allows one to describe the feedback between the instantaneous cell performance and the intrinsic membrane degradation processes. This provides detailed insights on the membrane degradation (sidechain detachment as well as water reorganization within the PEM) during cell operation. This novel modeling approach opens interesting perspectives in engineering practice to predict materials degradation and durability as a function of the initial chemical composition and structural properties in electrochemical energy conversion and storage devices. © The Author(s) 2015. Published by ECS. This is an open access article distributed under the terms of the Creative Commons Attribution 4.0 License (CC BY, http://creativecommons.org/licenses/by/4.0/), which permits unrestricted reuse of the work in any medium, provided the original work is properly cited. [DOI: 10.1149/2.0931514jes] All rights reserved. Manuscript submitted June 18, 2015; revised manuscript received September 2, 2015. Published November 10, 2015. From the second half of the twentieth century, Polymer Electrolyte Membrane Fuel Cells (PEMFCs) have attracted much attention due to their potential as a clean power source for vehicles traction. Market introduction of FC vehicles is being recognized of highest priority in many developed countries due to their impact on the reduction of en- ergy consumption and greenhouse gas emissions. However, PEMFC technologies have not yet reached all the requirements to be compet- itive, in particular regarding their high production cost of Membrane Electrode Assemblies and their low durability. Indeed, meso/micro-structural degradation leading to the PEMFC components aging is attributed to several complex physicochemical mechanisms not yet completely understood. The associated compo- nents meso/micro-structural changes translate into irreversible long- term cell power degradation. 1–3 For instance, dissolution and redistri- bution of the catalyst reduces the specific catalyst surface area and the electrochemical activity. The corrosion of the catalyst carbon-support and loss or decrease of the hydrophobicity caused by an alteration of the Polytetrafluoroethylene in Catalyst Layers (CLs), Microporous Layers and Gas Diffusion Layers also affect the water management in the cell and thus the electrochemical performance. Regarding the polymer electrolyte in PEMFCs, a large number of materials has been tested, including sulfonated hydrocarbon poly- mers, phosphoric acid doped polybenzimidazole, polymer-inorganic composite membranes or solid acid membranes. However, the most widely used are still the PerFluoroSulfonated Acid (PFSA) polymers (the so-called Nafion from DuPont, Figure 1). Apart from mechani- cal degradations such as thinning and pinhole formations, 4 chemical and electrochemical degradations can take place in the PFSA-based membranes and in the ionomer inside the CLs. 5 Significant permeation of the reactants across PEM, in particular oxygen from the cathode to the anode, has been often experimentally reported as being the major cause of PEM chemical degradation. 6–8 The formation of hydrogen peroxide (H 2 O 2 ) at the anode CL 9,10 is attributed to the following reaction H 2 + O 2 → H 2 O 2 [1] ∗ Electrochemical Society Active Member. z E-mail: [email protected] Formation of H 2 O 2 may also occur at the cathode CL as part of the Oxygen Reduction Reaction (ORR), O 2 + 2H + + 2e − → H 2 O 2 [2] in particular if Pt-M catalysts are used, with M being a transition metal element. 11 H 2 O 2 is a highly oxidizer reagent which may deteriorate the PEM. Furthermore, PEM degradation leads to an increasing reactants cross- over between the CLs. Young et al. reported that at non-zero current densities a performance decay is observed due to an increase of the PEM resistance, that is, a decrease of the PEM conductivity. 12 As this conductivity is directly related to the side chains presence, it was concluded that the radical reaction responsible of the chemical degra- dation involves not only an attack on the backbone but on the side Figure 1. Representation of our Coarse Grain Nafion model in which the hydrophobic backbone is replaced by a coarse-grained chain of 20 apolar beads (red color) and the entire side chain is replaced by a negatively charged bead (green color). ) unless CC License in place (see abstract). ecsdl.org/site/terms_use address. Redistribution subject to ECS terms of use (see 80.14.247.106 Downloaded on 2015-11-16 to IP
Transcript of A Multiparadigm Modeling Investigation of Membrane...

Journal of The Electrochemical Society, 163 (2) F59-F70 (2016) F59
A Multiparadigm Modeling Investigation of Membrane ChemicalDegradation in PEM Fuel CellsMatias A. Quiroga,a,b,c Kourosh Malek,d,e and Alejandro A. Francoa,b,c,∗,z
aLaboratoire de Reactivite et Chimie des Solides (LRCS), Universite de Picardie Jules Verne and CNRS,UMR 7314, Amiens, FrancebReseau sur le Stockage Electrochimique de l’Energie (RS2E), FR CNRS 3459, FrancecALISTORE European Research Institute, 80039 Amiens Cedex, FrancedDepartment of Chemistry, Simon Fraser University, Burnaby, British Columbia V5A 1S6, CanadaeNRC-EME, Vancouver, British Columbia, Canada
We report a multi-paradigm model of the membrane chemical degradation in Polymer Electrolyte Membrane Fuel Cells (PEMFCs),by combining Coarse-Grained Molecular Dynamics (CGMD) and a multiscale cell performance model. CGMD is used to generatestructural databases that relate the amount of detached (degraded) ionomer sidechains with the water content and the resultingPEM meso-microporous structure. The multiscale cell performance model describes the electrochemical reactions and transportmechanisms occuring in the electrodes from an on-the-fly coupling between Kinetic Monte Carlo (KMC) sub-models parametrizedwith Density Functional Theory (DFT) data and (partial differential equations-based) continuum sub-models. Furthermore, theperformance model includes a kinetic PEM degradation sub-model which integrates the CGMD database. The cell model alsopredicts the instantaneous PEM sidechain content and conductivity evolution at each time step. The coupling of these diverse modelingparadigms allows one to describe the feedback between the instantaneous cell performance and the intrinsic membrane degradationprocesses. This provides detailed insights on the membrane degradation (sidechain detachment as well as water reorganization withinthe PEM) during cell operation. This novel modeling approach opens interesting perspectives in engineering practice to predictmaterials degradation and durability as a function of the initial chemical composition and structural properties in electrochemicalenergy conversion and storage devices.© The Author(s) 2015. Published by ECS. This is an open access article distributed under the terms of the Creative CommonsAttribution 4.0 License (CC BY, http://creativecommons.org/licenses/by/4.0/), which permits unrestricted reuse of the work in anymedium, provided the original work is properly cited. [DOI: 10.1149/2.0931514jes] All rights reserved.
Manuscript submitted June 18, 2015; revised manuscript received September 2, 2015. Published November 10, 2015.
From the second half of the twentieth century, Polymer ElectrolyteMembrane Fuel Cells (PEMFCs) have attracted much attention dueto their potential as a clean power source for vehicles traction. Marketintroduction of FC vehicles is being recognized of highest priority inmany developed countries due to their impact on the reduction of en-ergy consumption and greenhouse gas emissions. However, PEMFCtechnologies have not yet reached all the requirements to be compet-itive, in particular regarding their high production cost of MembraneElectrode Assemblies and their low durability.
Indeed, meso/micro-structural degradation leading to the PEMFCcomponents aging is attributed to several complex physicochemicalmechanisms not yet completely understood. The associated compo-nents meso/micro-structural changes translate into irreversible long-term cell power degradation.1–3 For instance, dissolution and redistri-bution of the catalyst reduces the specific catalyst surface area and theelectrochemical activity. The corrosion of the catalyst carbon-supportand loss or decrease of the hydrophobicity caused by an alterationof the Polytetrafluoroethylene in Catalyst Layers (CLs), MicroporousLayers and Gas Diffusion Layers also affect the water management inthe cell and thus the electrochemical performance.
Regarding the polymer electrolyte in PEMFCs, a large numberof materials has been tested, including sulfonated hydrocarbon poly-mers, phosphoric acid doped polybenzimidazole, polymer-inorganiccomposite membranes or solid acid membranes. However, the mostwidely used are still the PerFluoroSulfonated Acid (PFSA) polymers(the so-called Nafion from DuPont, Figure 1). Apart from mechani-cal degradations such as thinning and pinhole formations,4 chemicaland electrochemical degradations can take place in the PFSA-basedmembranes and in the ionomer inside the CLs.5
Significant permeation of the reactants across PEM, in particularoxygen from the cathode to the anode, has been often experimentallyreported as being the major cause of PEM chemical degradation.6–8
The formation of hydrogen peroxide (H2O2) at the anode CL9,10 isattributed to the following reaction
H2 + O2 → H2O2 [1]
∗Electrochemical Society Active Member.zE-mail: [email protected]
Formation of H2O2 may also occur at the cathode CL as part of theOxygen Reduction Reaction (ORR),
O2 + 2 H+ + 2 e− → H2O2 [2]
in particular if Pt-M catalysts are used, with M being a transition metalelement.11
H2O2 is a highly oxidizer reagent which may deteriorate the PEM.Furthermore, PEM degradation leads to an increasing reactants cross-over between the CLs. Young et al. reported that at non-zero currentdensities a performance decay is observed due to an increase of thePEM resistance, that is, a decrease of the PEM conductivity.12 Asthis conductivity is directly related to the side chains presence, it wasconcluded that the radical reaction responsible of the chemical degra-dation involves not only an attack on the backbone but on the side
Figure 1. Representation of our Coarse Grain Nafion model in which thehydrophobic backbone is replaced by a coarse-grained chain of 20 apolarbeads (red color) and the entire side chain is replaced by a negatively chargedbead (green color).
) unless CC License in place (see abstract). ecsdl.org/site/terms_use address. Redistribution subject to ECS terms of use (see 80.14.247.106Downloaded on 2015-11-16 to IP

F60 Journal of The Electrochemical Society, 163 (2) F59-F70 (2016)
chain as well (mechanism known as side chain unzipping). Other ex-periments demonstrated that in particular Open Circuit Voltage (OCV)conditions are strongly damageable for the PEM.13–15
One of the key factors enhancing the PEM chemical degradationis the presence of Fenton’s ions (for example Fe2+ or Cu2+) in the cellwhich will initiate the decomposition of H2O2 into radicals OH◦ andOOH◦.16–19 The most plausible origins of these ions are the degrada-tion of iron containing end-plates which are used in the PEMFCs, andthe oxidation of the pipes in the reactants management system.20,21
Additionally, some debate still remains about the role of the pre-cipitated Pt (arising from electrochemical dissolution mainly in thecathode CL) on catalyzing the H2O2 decomposition.22,23 Interestingly,some of the PEM degradation products were reported to contaminatethe catalyst and decrease its ORR activity within the CLs.24
Numerous mathematical models have been developed with the aimto understand the large diversity of experimental observations.25 Forinstance, Xie and Hayden originally proposed a continuum kineticmodel describing the chemical degradation of the PEM as functionof the concentrations of radicals OH◦ and OOH◦.26 Their model isbased on the unzipping mechanism where backbone and side chainsare cutted starting from sites containing impurity carboxylic groups.Significant concentrations for these groups have been reported inearlier versions of Nafion.27 The carboxylic acid groups are eitherdirect by-product of the PEM synthesis or the result of reactions ofother contaminants with radical species. This carboxylic acid reactswith the two radicals OH◦ and OOH◦. Carbon dioxide and HF arethen released and the carboxylic acid group is transformed into afluoride acid group which is then hydrolyzed, releasing another HFmolecule and regenerating the carboxylic acid group.28 After eachdegradation step, the PEM backbone loses one carbon atom. Besides,Ishimoto et al. performed density functional theory (DFT) calculationsto understand the chemical degradation mechanism of side chainsby hydroxyl radical attacks.29 The energy profiles from these DFTcalculations have supported the reaction mechanism proposed by Xieand Hayden.26
Chen and Fuller proposed a continuum H2O2 formation modelbased on a CL agglomerate approach.30 They simulated the produc-tion of H2O2 at the anode and at the cathode through chemical andelectrochemical pathways. The H2O2 formation model is coupled toan oxygen permeation model, and validated with experimental data.However the impact of the H2O2 formation on the PEM degradationis not described and thus the cell potential decay over time is notcalculated. Others reported continuum models describing the H2O2
decomposition, the radicals formation and the ionomer degradation,31
but still without predicting the induced cell performance decay overtime. Shah et al. proposed a Continuum Fluid Dynamics (CFD) modelaccounting for the PEM degradation, water transport and thermal man-agement within a pre-existing cell model.32 In their model, they ignorethe side chain unzipping mechanism, which means that a constantconductivity of the PEM is assumed, and thus the effect of the degra-dation on the transport phenomena and the cell performance cannotbe captured.
Additionally, some recent molecular dynamics (MD) works havebeen reported predicting that the presence of ferric ions may affectthe intrinsic PEM proton transport properties.33
We reported the first models aiming at account for the instanta-neous feedback between the PEM chemical degradation and the elec-trochemical and transport processes in a PEMFC.2,34–37 The approachbehind these models treats PFSA PEMs with a structure influencedby humidification, which also impacts the local transport propertiesof mass and charge within the PEM. In order to study the PEM degra-dation, a multi-species transport model is used for protons, water, dis-solved gases, radicals, and ions. This model includes detailed chemicalreaction mechanisms of hydrogen peroxide formation, hydrogen per-oxide decomposition, and radical attack of the PEM. A numericalfeedback between degradation, mesostructure, and performance is es-tablished, allowing predicting the potential decay associated to themembrane degradation process. The mesostructural parameters con-sidered are the PEM average porosity and tortuosity, evolving with
the (degrading) side chains concentration. In our approach the effec-tive porosity is defined macroscopically as the water volume fractionwhich is assumed to be
ε = λ
λ + VNa f ion
VH2 O
[3]
where ε refers to the effective porosity (defined as the water volumefraction), λ to the water content (number of water molecules persulfonic acid group), VNa f ion to the partial molar volume fraction ofPEM and VH2 O to the partial molar volume fraction of water. VNa f ion
is assumed to be related to the PEM equivalent weight through theexpression
VNa f ion = EW
ρdr y= 1(
(1 + sλ)3cside chains
) [4]
where s is the swelling factor of the membrane and cside chains theconcentration of side chains calculated through a kinetic degradationmodel. Then, the variation of the membrane conductivity with theeffective porosity is calculated through the mean field expressionproposed by Choi et al.38,39
gH+ = ε
τ
[F2
RT
(D�
H+ · C�H+ + DG
H+ · CH+ + DEH+ · CH+
)][5]
where the tortuosity toward the proton transport τ is function of theeffective porosity through the Prager’s model.34 Based on our previ-ous approach, Wong and Kjeang recently reported continuum modelspredicting how the cell operation conditions impact the PEM degra-dation kinetics, albeit by disregarding the PEM degradation effects onpotential decay.40,41 Similar remark can be done for a recent work onPEM Water Electrolyzers, also based on our approach.42
Despite the insights provided by these modeling efforts there is stilla lack of modeling approach being able to investigate the influence ofthe chemical degradation kinetics on the meso/micro-structural prop-erties of the PEM at the molecular level. As well, the retroactive im-pact of the PEM meso/microstructure evolution on the instantaneousperformance and durability of a PEMFC as function of the appliedoperation conditions on the cell deserves further investigations.
At the meso/microsopic scale, interactions between molecularcomponents control the processes of structural formation which lead torandom phase-segregated morphologies in PEMs and CLs. Such com-plex processes can be studied by coarse-grained molecular dynamics(CGMD) simulations.43–45 Complex morphologies of the emergingmedia can be related to relevant effective properties that character-ize transport and reaction, using concepts from the theory of randomheterogeneous media. Finally, conditions for durable operation at themacroscopic device level can be defined and balance equations forinvolved species, i.e. electrons, protons, reactant gases and water, canbe established on the basis of fundamental conservation relationships.Thereby full relations between structure, properties and performancecould be established, which in turn would allow to predict architec-tures of materials and operating conditions that optimize fuel celloperation.
A significant number of mesoscale computational approaches havebeen employed to understand the phase-segregated morphology andtransport properties of water-swollen Nafion membranes.46–49 Be-cause of computational limitations, full atomistic models are notable to probe the random morphology of these systems. However, asdemonstrated by these simulations and applications to other randomcomposite media, mesoscale models are computationally feasible tocapture the morphology. For Nafion, most of these simulations sup-port the idea that narrow water-filled channels and irregularly shaped,nanometer-size clusters of ionic head groups and water forms theproton-conducting network that is embedded into the hydrophobicmatrix.
In this paper we report a novel model to analyze PEM degrada-tion and cell performance decay which combines a multi-paradigm,multi-scale cell model with a meso/microstructure resolved PEM
) unless CC License in place (see abstract). ecsdl.org/site/terms_use address. Redistribution subject to ECS terms of use (see 80.14.247.106Downloaded on 2015-11-16 to IP

Journal of The Electrochemical Society, 163 (2) F59-F70 (2016) F61
Figure 2. The numerical methodology implemented for the multi-paradigmcombination of the multi-scale performance model with the CGMD generateddata.
degradation model based on CGMD databases. The technical fea-sibility of the combination between performance cell models andCGMD databases have been already demonstrated by us for describ-ing carbon corrosion in PEMFC CLs.50 To the best of our knowl-edge, we report here the first modeling-based analysis of the PEMmeso/microstructure upon its degradation and continuous feedbackwith the cell performance.
This paper is organized as following. First we present the adoptedmethodology from CGMD simulations and describe the performancemodeling approaches. Then we present structural results and simu-lation results of performance decay for different simulated operationconditions. Thereafter we conclude and indicate further directions tocontinue this work.
Overall Methodology
The implemented overall methodology consists on achieving con-tinuous numerical iterations between a performance model (Perfor-mance model section) and a PEM meso-structural database extractedfrom CGMD simulations (CGMD simulations section), as presentedin Figure 2. At each numerical iteration, the performance model cal-culates the instantaneous cell performance and state variables such asthe ionomer mass loss due to chemical degradation across the PEM.The performance model retrieves changes on the proton conductivityand the ratio of porosity (ε) over the tortuosity (τ) of the PEM hy-drophilic channels from the CGMD-generated database. These struc-tural changes are assumed to be mainly due to chemical degradation,thus, the performance model uses them to correct the mathematicalexpressions of the proton conductivity as well as diffusion of chemi-cal species across the hydrophilic channels of the PEM following thelook-up tables in Equations 6 and 7 here below:
σe f fH+ = � (% SA groups lost) [6]
ε
τ= � (% SA groups lost) [7]
with
Def fi = ε
τD0
i [8]
In return, the performance evolution of the cell and the structuralevolution of the PEM are simultaneously simulated.
As discussed in Introduction section, the mechanism of the chem-ical attack of the polymer is very complex. It may involve both back-bone and side-chain degradation and it is the subject of many debates.Here, we assume that only OH◦ radicals are the responsible agentof the chemical degradation, and that only the side chains are beingattacked. This assumption is consistent with conclusions on mod-ern Nafion obtained by Ghassemzadeh and Holdcroft on the basisof nuclear magnetic resonance (NMR) spectroscopy experiments.51
Indeed, according to the authors, modern Nafion (e.g. Nafion 211)is chemically stabilized for which the concentration of terminal car-boxylic acid groups was decreased to negligible levels52,53 and thusthe backbone remains unaffected by the OH◦ radicals.
CGMD simulations.— The details of the computational approachbased on CGMD simulations are explained elsewhere43–45,50 and isdeveloped in two major steps. In the first step, Nafion chains, waterand hydronium molecules are replaced by corresponding sphericalbeads with predefined sub-nanoscopic length scale. In the second step,parameters of renormalized interaction energies between the distinctbeads are specified.
We consider four main types of spherical beads: polar, nonpolar,apolar, and charged beads.54 Clusters including a total of four watermolecules or three water molecules plus a hydronium ion are repre-sented by polar beads of radius 0.43 nm. The simulation box contained72 coarse-grained Nafion chains each consisting of 20 monomers and20 side chains. Each monomeric unit is represented by two apolarbeads for backbone (red) and one single polar bead (green) for theentire sidechain (including etheric group) as depicted in Figure 1. Weadopted the same coarse graining strategy as in our previous work44
which was also suggested earlier in Ref. 55. A side chain unit has amolecular volume of 0.306 nm, equivalent to the molecular volumeof a four-monomeric unit of polytetrafluoroethylene (PTFE), of size0.325 nm. Thus in our coarse-graining, a monomeric backbone unit,i.e.,–CF2–CF2–CF2–CF2–CF2–CF2–CF2–CF2–, is represented by twobeads and a perfluorinated ether sulfonic sidechain is represented byone single bead. Our coarse-graining strategy requires all beads haveidentical volume set at 0.315 nm3. The selected box size does not im-pact the cell performance since the pore structure remains unchangedfor box volumes larger than 50 × 50 × 50 nm3 and we do not expectsignificant changes in the O2 crossover or in the proton conductivity.
The interactions between non-bonded beads are modeled by theLennard-Jones (LJ) potential
UL J (r ) = 4D0i j
[(ri j
r
)12−
(ri j
r
)6]
[9]
where the effective bead diameter (rij) is 0.43 nm for side-chain,backbone and water beads. The strength of interaction (D0) is limitedto five possible values ranging from weak (1.8 kJ/mol) to strong(5 kJ/mol) beads.54 The electrostatic interactions between chargedbeads are described by the Coulombic interaction
Uel (r ) = qi q j
4πε0εr r[10]
with relative dielectric constant εr = 20 in order to include screening.The effect of solvent is incorporated by changing εr as well as byvarying the degree of dissociation of Nafion side chains. Interactionsbetween chemically bonded beads (in Nafion chains, for example)are modeled by harmonic potentials for the bond length and bondangle
Vbond (r ) = 1
2Kbond (r − r0)2
Vangle(r ) = 1
2Kangle[cos(θ) − cos(θ0)]2
[11]
where the force constants are Kbond = 1250 kJ/mol.nm and Kangle = 25kJ/mol.radian2 respectively. r0 and θ0 are the equilibrium bond lengthand angle. The size of the simulation box can vary from 50 × 50 ×50 nm3 to 500 × 500 × 500 nm3, depending on the system and thecomposition. We conducted an annealing procedure over a period of50 ps by increasing the temperature from 298 to 398 K, followed bya short MD simulation for 50 ps in a NVT ensemble, followed bya cooling procedure down to 298 K.44 We did not observe any driftto a more ordered state after the equilibration procedure. For analysispurposes, however, final trajectories after full equilibration were used.
The degradation process is simulated as the following: first, theinitial morphologies are generated using similar set of parameters and
) unless CC License in place (see abstract). ecsdl.org/site/terms_use address. Redistribution subject to ECS terms of use (see 80.14.247.106Downloaded on 2015-11-16 to IP

F62 Journal of The Electrochemical Society, 163 (2) F59-F70 (2016)
Figure 3. The schematics of the multiscale continuum performance model used in this paper.
process that are explained elsewhere.44 In order to mimic the degra-dation process, Nafion sidechains are randomly detached at differentpercentage from the backbone under various water contents. In oursimulations, the detached sidechains are assumed to remain in the wa-ter phase inside the Nafion pore as “dissolved” sulfonic anions, thusthe system remains electro-neutral.
We have used several tools to calculate structural properties ofthe degraded membrane to investigate the impact of side chain losseson the microstructural properties of the membrane. These techniquesinclude Radial Distribution Function (RDF), Pore Side Distribution,Cluster Size analysis, and Pore Network Analysis.43,44,50
Performance model.—General framework.—The performance modelis a multi-paradigm multiscale single-cell model implemented withinour in house simulation package MS LIBER-T (see Figure 3).56–58
This is a software coded in a modular framework on an independentC/Python language basis, highly flexible and portable with multipleapplication domains already demonstrated.59,60 Similar to the previousmodels developed by Franco et al., the single-cell PEMFC model inMS LIBER-T represents explicitly the physical mechanisms at differ-ent scales as nonlinear sub-models in interaction (modularity)61 andit is designed to calculate electrochemical signals (e.g. polarizationcurves, cell potential vs. time, etc.) from the chemical and structuralproperties of the materials.62–65
For simplicity reasons, in this paper we restrict ourselves on thecell model based on the following overall assumptions:
� isothermal conditions;� anode operating with water saturated H2 and cathode operating
with water saturated O2. Under this assumption, the PEM hydrationmaintains at λ = 19. From this, only the CGMD database corre-sponding to this water content is used for the performance decaycalculations shown in this paper. We underline that the model is gen-eral and other water contents and/or water content transients may bealso studied, provided that H2O transport is resolved across the PEM.
Indeed, the mechanisms described are� H+ transport across the membrane electrodes assembly within
a 1-D approach;� e− transport across the CLs and gas diffusion layers within a
1-D approach;� the presence of H2 and O2 in the on-catalyst ionomer film inside
the CLs within the approach reported in Ref. 67. In the case of the
anode, a 0D mass balance equation between the O2 crossover rate fromthe PEM to the anode and the O2 consumption rate on the catalyst, issolved to calculate the evolution of the resulting O2 concentration inthe on-catalyst ionomer film (Figure 4b);
� the interfacial nanoscale electrochemical mechanisms at thevicinity of the catalyst including both elementary kinetics andelectrochemical double layer effects within an on-the-fly coupledKMC/continuum approach.66,67 The impact of the surface roughnesson the electrochemical double layer structure, as addressed in somepublications,68,69 is not taken into account in the present model.
We use the version of our model which treats the elementary kineticreactions in the CLs through the Kinetic Monte Carlo ElectrochemicalVariable Size Method (KMC E-VSSM) that we have introduced anddiscussed in Ref. 67 for the cathode CL. This approach resolves the ad-sorption/desorption, adspecies surface diffusion and reactions on thecatalyst surface during the PEMFC operation, and allows calculatingthe electrodes and cell potential.
In general, the performance model can account for the completecycle of the PEM chemical aging, i.e.: H2O2 formation in the anodefrom the O2 crossover from the cathode, H2O2 formation in the cath-ode through the ORR, the diffusion of H2O2 in the PEM and H2O2
decomposition into OH◦ and OOH◦ radicals in presence of Fe2+/Fe3+
Fenton’s cations, the degradation removal of the side chains and theimpact on the PEM proton conductivity and cell performance decay(Figure 4).
For demonstration purposes in this paper, the degradation kineticsis assumed to be of first order toward the OH◦ concentration, i.e.:
OH◦ + R · · · SC → R′ + D [12]
where R and R′ refers to the fresh and aged polymer respectively, SCrefers to a single side chain and D to the detached side chain. Theeffect of hydroxide radical in the CGMD simulations is captured bypresence of water and hydronium ion and therefore is not explicitlyadded to the CGMD simulations.
The model implements the CGMD database with spatially resolved1D resolution across the PEM thickness. The PEM model, comprisingthe mathematical descriptions of the relevant transport and chemicalreaction mechanisms described in the following sections, is coded inPython and coupled as an additional module in MS LIBER-T.
) unless CC License in place (see abstract). ecsdl.org/site/terms_use address. Redistribution subject to ECS terms of use (see 80.14.247.106Downloaded on 2015-11-16 to IP

Journal of The Electrochemical Society, 163 (2) F59-F70 (2016) F63
Figure 4. a) Scheme of the complete cycle of PEM chemical aging accounted in our model; b) scheme represented within the cell model.
O2 transport model in the PEM.—The transport of O2 is assumed tobe simply governed by Fickean diffusion and it is spatially resolvedin 1D through the PEM thickness (the H2 transport was neglecteddue to its high reactivity at the high potentials typically found in thecathode):
∂ci
∂t= ∂
∂y
(Def f
i
∂ci
∂y
)[13]
H2O2 production models.—The HOR in the anode is modeled in com-petition with a H2O2 production reaction through our KMC E-VSSMapproach with DFT-calculated kinetic activation energies. The ele-mentary reaction steps considered are detailed in Table I.62 Parametervalues of the associated electrochemical double layer sub-model and
of the surface diffusion processes are identical to the ones used in ourprevious work.67
For the H2O2 production within the ORR pathway in the cathodeCL, we have considered the elementary kinetic reaction in Table II,still within our KMC E-VSSM approach, with the same parametersvalues for the activation barriers, diffusion barriers and electrochemi-cal double layer sub-model that in Ref. 67. The reaction steps and theactivation barriers values were determined by DFT calculations car-ried out on Pt(111) surfaces.62,70 The modular character of the modelallows considering here other DFT databases, with different H2O2
production rates, corresponding to Pt bimetallic catalysts. This willbe the subject of a future publication.
For the adsorption steps we follow the same approach as in ourprevious publication:67 according to the collision theory, the kinetic
) unless CC License in place (see abstract). ecsdl.org/site/terms_use address. Redistribution subject to ECS terms of use (see 80.14.247.106Downloaded on 2015-11-16 to IP

F64 Journal of The Electrochemical Society, 163 (2) F59-F70 (2016)
Table I. Elementary kinetic model for the H2O2 production in theanode CL.
Activation energies (kJ.mol−1)
Reaction Eactf Eact
b
H2 + 2 s ←→k1/k−1
2Hads 68 ∞H2 + s ←→
k2/k−2Hads + H+ + e− 34 34
Hads ←→k3/k−3
s + H+ + e− 53 53
Ocross-over2 + s ←→
k4/k−4O2 ads — ∞
O2ads + Hads ←→k5/k−5
HO2ads + s 41 39
HO2 ads + Hads ←→k6/k−6
H2O2ads + s 35 68
H2O2 ads ←→k7/k−7
H2O2 + s 19 ∞
parameters are given by
ki = sc
nmax
P√2πmkB T
[14]
where P and m are the partial pressure at x = L (that can be related tothe concentration of the dissolved reactant in the electrolyte) and theatomic mass of a reactant respectively. sc is the sticking coefficientestimated from published values.71,72 For the reaction steps, accordingto the extended transition state theory, the kinetic parameters are givenby
ki j = κi j exp
(− E∗
i j,act
kB T
)[15]
where kij and Eij,act are the kinetic rate constant and activation energyalong the minimal energy path for going from state i to state j. Theactivation energies Eij,act are written as
Ei j,act = Ei j,actDFT + f (σ) [16]
In Equation 16, f (σ) is the effect of the interfacial electric field, func-tion of the catalyst charge density σ, onto the effective kinetics.62 Thisquantity together with the concentration of protons in the electrolyteat the vicinity of the reaction sites, is calculated by means of ournon-equilibrium electrochemical double layer model in our work.66
The KMC E-VSSM allows then the calculation of the evolution ofthe adspecies coverage on the anode and cathode catalyst surfaces.H2O2 and iron ions reaction-transport models.—The transport ofH2O2 and iron ions is assumed to be diffusive and they are spatially
Table II. Elementary kinetic model for the H2O2 production in thecathode CL.
Activation energies (kJ.mol−1)
Reaction Eactf Eact
b
O2 + s ←→k1/k−1
O2ads — ∞O2ads + s ←→
k2/k−22 Oads 30 149
H+ + e− + O2ads ←→k3/k−3
HO2ads 38 43
2OHads ←→k4/k−4
H2Oads + Oads 1 158
H+ + e− + Oads ←→k5/k−5
OHads + s 88 94
H+ + e− + OHads ←→k6/k−6
H2Oads + s 19 80
H+ + e− + HO2 ads ←→k7/k−7
H2O2ads 24 47
H2O2 ads ←→k8/k−8
H2O2 + s — ∞
Table III. Elementary kinetic model for the Fenton’s reactions.The kinetic parameter values are from Ref. 34.
Kineticparameter (s−1)
Reaction Kinetic rate ki
H2O2 + Fe2+ + H+−→
k1Fe3+ + OH◦ + H2O
v1 = k1CH2 O2 CFe2+ CH+ 63.10−3
OH◦ + Fe2+ + H+−→
k2Fe3+ + H2O
v2 = k2CO H◦ CFe2+ CH+ 3.3.105
resolved in 1D through the PEM thickness from the solution of
∂ci
∂t= ∂
∂y
(Def f
i
∂ci
∂y
)+ Si (y) [17]
where the source/sink term is related to the Fenton reactions describingthe H2O2 decomposition in OH◦/OOH◦ in presence of the Fenton’scations. In this paper, for demonstration purposes, only the presenceof Fe2+ and the Fenton reactions reported in Table III were considered.
The concentration of the reaction intermediates, reactants andproducts are calculated from the mass balances:
dc j (y, t)
dt=
∑iproduction
νi −∑
jconsumption
ν j [18]
Membrane chemical aging model.—The side chain concentration isresolved from the following balance equation:
dcside chain(y, t)
dt= −kDEG · cside chain(y, t).CO H◦ (y, t) [19]
The bulk electrolyte potential at the cathode is given by
φbulkcathode = −I × Req = − I
Lmembrane·∫ y=Lmembrane
y=0
dy
σe f fH+ (y, t)
[20]
where σe f fH+ (y, t) is the effective proton conductivity calculated from
the CGMD database following Equation 6.Some of the parameters values used are reported in Table IV. The
values of the parameters not reported here are the same as in ourprevious publications.62
Results
Membrane meso/microstructure.— PEM simulations were per-formed with λ = 2, 4, 9, 15. The mesoscopic structure of the hy-drated membrane at λ = 9 is visualized in Figure 5, revealing asponge-like structure, similar to structures obtained by other meso-scale simulations.75,73 Water beads together with hydrophilic beadsof sidechains form clusters, which are embedded in the hydropho-bic phase of the backbones. The detailed structural analysis indicatesthat the hydrophilic subphase is composed of a three dimensional
Table IV. Parameters and numerical values.
Parameter Numerical value (units) Source
Temperature (T) 353 K assumedkDEG 100 Ref. 35
Selectrode 2.5 × 10⁻⁵ m2 Ref. 8Fe2+flux 2.7 × 10⁻¹⁰ kmol/sec.m3 assumed
γ (Figure 4b) 10−5 assumedDef f
H+ 1 × 10⁻⁹ m/sec assumed
Def fO2
4 × 10⁻⁸ m/sec assumedMembrane thickness 2.5 × 10⁻⁵ m assumed
σe f fH+ (BOL) 2 × 10⁻⁴ S/m assumed
λ 15 assumed
) unless CC License in place (see abstract). ecsdl.org/site/terms_use address. Redistribution subject to ECS terms of use (see 80.14.247.106Downloaded on 2015-11-16 to IP

Journal of The Electrochemical Society, 163 (2) F59-F70 (2016) F65
Figure 5. a) RDF elucidating the microphase separation of hydrophilic andhydrophobic domains in Nafion ionomer for side-chain and water;44 b) asnapshot of the final microstructure in hydrated Nafion ionomer at λ = 9,obtained from CGMD simulations and before detachment of sidechains. Thehydrophilic domain (water, hydronium, Nafion sidechain) is shown in greenand hydrophobic domain (Nafion backbone) is shown in red.
network of irregular channels. The typical channel sizes are from1 nm, 2 nm, and 4 nm at λ = 2, 4, 9, 15. This corresponds roughly tolinear microscopic swelling. The site-site radial distribution function(RDF), obtained from CGMD simulations, matches very well to thosefrom the atomistic MD simulations.43 The RDF between the sidechainbeads and the other components of the mixture show that side chainsare surrounded with water and hydrated protons. The autocorrelationfunctions exhibit similar dependences on bead separation at all λ,indicating a strong clustering of sidechains due to the aggregation andfolding of polymer backbones.74 The degree of ordering of water nearpolymer|water interfaces decreases with increasingλ.
So far, coarse-grained approaches offer the most viable route tothe molecular modeling of self-organization phenomena in hydratedionomer membranes.
Admittedly, the coarse-grained treatment implies simplifications instructural representation and in interactions, which can be systemati-cally improved with advanced force-matching procedures. Moreover,it allows simulating systems with sufficient size and sufficient statisti-cal sampling. Structural correlations, thermodynamic properties, andtransport parameters, can be studied.
Figure 6 illustrates tortuosity factor as a function of the sidechainloss (%). Tortuosity factor is defined as a ratio of the geometricalpore length and pore axis. The insert depicts average pore size innm as function of the degradation at different water contentment(λ = 2, 4, 9, 15). The diameters of water channels vary in the rangeof 1–7 nm, exhibiting a roughly linear increase from low to high wa-ter content. The average separation of side chains increases as wellwith water content, which indicates a continuous structural reorgani-zation of polymer aggregates upon water uptake.44 This could involvebackbones sliding along each other in order to adopt more stretchedconformations. The sidechain separation varies in a range of 1nm orslightly above. The network of aqueous domains exhibits a percola-tion threshold at a volume fraction of ∼10%, which is in line withthe value determined from conductivity studies. This value is simi-lar to the theoretical percolation threshold for bond percolation onan fcc lattice. It indicates a highly interconnected network of waternanochannels.
In Figure 7a we can see the side chain separation (nm) as a func-tion of the degree of side chain degradation (%) and water content (λ).Overall, by increasing the hydration level, side chains move apart, withtheir mean separation at Beginning Of Life (BOL) increasing from0.92 nm at λ = 2 to 1.48 nm for λ = 15. Figure 7a also shows thatby increasing degradation (percentage of side chains detached frombackbone), side chain separation decreases. Side chain separationson a single ionomer chain are between 1.5–1.7 nm.75 Charge distri-bution and the magnitude of electrostatic interactions between side
Figure 6. a) CGMD data analysis: tortuosity factor as a function of thesidechain loss (%). Small frame: average pore size in nm as function of thedegradation percentage for different water contents (λ = 2, 4, 9 and 15); b)snapshots of calculated PEM mesostructures for two water contents.
chains determine how ionomer backbones are assembled into fibrilsor lamellae, where, the net density of side chains increases. Loss ofsidechains reduces electrostatic hindrances between side chains onthe surface of fibrils. The latter facilitates easier backbone folding,leading to lower side chain separations. Thus, the effective packingdensity of side chains due to better polymer degradation indicates thatside separations and aggregate sizes decreases with side chain loss. Wespeculate that decrease in sizes of backbone aggregates corresponds toa decrease in electrostatic interaction between remaining side chainsattached to the backbone, which causes increases in packing densityof backbones,
In Figure 7b we illustrate normalized average of sidechain separa-tion (dss) for λ = 9 with respect to that for the Beginning of Life (BOL)membrane model where no sidechain losses are imposed (%deg = 0).Using a random-walk model for proton diffusion based on theEinstein-Smoluchowski equation39,76 one can estimate the relation-ship between proton conductivity, proton diffusivity and mean stepdistance,
σe f fH+ ≈ DH+ = l2
zτD[21]
where z is a constant dependent upon the dimensionality of randomwalk (6 for three-dimensional walk), l is the mean step distance, i.e.side chain separations (dss) and τD is the mean time between suc-cessive steps. Notice that the above relationship does not necessarilymean protons transfer via a “hopping” Grotthuss mechanism39 andcan similarly describe the vehicular mass diffusions. Overall, the nor-malized relationship between side chain separation and degradationof sidechains depicted in Figure 7b indicates that proton conductivity
) unless CC License in place (see abstract). ecsdl.org/site/terms_use address. Redistribution subject to ECS terms of use (see 80.14.247.106Downloaded on 2015-11-16 to IP

F66 Journal of The Electrochemical Society, 163 (2) F59-F70 (2016)
Figure 7. (a) side chain separation (nm) as a function of the degree of sidechain degradation (%) and water content (λ). (b) normalized average ofsidechain separation (dss) for λ = 9 with respect to that for the BOL membranemodel where no sidechain losses are imposed (%deg = 0).
is declined by increasing sidechain losses in accordance to the aboveequation.
Performance decay.— The CGMD-generated database has beenused in the performance model following the algorithm presented inOverall methodology section.
We carried out four different simulation cases: OCV, 0.1, 0.3 and0.5 A/cm2 applied current densities. For all the cases, the systemswere initialized without considering the PEM degradation along thefirst 0.1 seconds of simulated time, until the steady state is reached:then the degradation process is “activated” by switching on a constantinput flux of Fe2+ (10−14 kmol/m3.sec). As it is explained in Figure4, the model allows capturing the HOR and ORR intermediates cov-erage evolution in both anode and cathode as well as other outputs(such as faradaic current, H2O2 production rate, . . . ) not shown here.The PEM simulation sub-model calculates the evolution of the poros-ity/tortuosity, the SO−
3 concentration, conductivity and the associatedelectrostatic potential evolution across the PEM along the simulationby help of Equation 20.
In Figure 8a, we report the calculated SO−3 concentration evolution
in time for the four cases investigated. The initial SO−3 concentration
was assumed to be 1.2 kmol/m3 for all the cases. In all the curves inFigure 8a the concentration decays in time with an overall rate whichdepends on the value of the applied current density. Indeed, the SO3
−
degradation rate increases as the applied current density decreases,which is in agreement with the experimental knowledge. This trendis because of the faradaic current present in the anode, and thus theHOR overall rate (in spite of the H2O2 formation), increases withthe imposed total current density as the faradaic current evolves tobalance it. Briefly, the less H2O2 is formed in the anode, the less SO−
3is degradated.
Figure 8. (a) Calculated evolution of the SO−3 concentration in the PEM
at OCV, 0.1, 0.3 and 0.5 A/cm2 current densities; (b) associated calculatedevolution of porosity/tortuosity (normalized in 1 at t = 0 sec.); (c) associatedrelative conductivity evolution (normalized in 1 at t = 0 sec.).
In Figure 8b we report the corresponding normalized ε/τ evolutionsfor all the cases under investigation. The SO−
3 consumption generatesa decrease on the tortuosity (τ) (see Figure 6) and an increase on theporosity (ε). As one can see, under OCV conditions, this factor variesfrom 1 to ∼3 after 24 hours of simulated time which is in agreementwith the experimental known fact that OCV conditions are the mostdamageable for the PEM.
) unless CC License in place (see abstract). ecsdl.org/site/terms_use address. Redistribution subject to ECS terms of use (see 80.14.247.106Downloaded on 2015-11-16 to IP

Journal of The Electrochemical Society, 163 (2) F59-F70 (2016) F67
Figure 9. Anode surface coverage evolution under OCV conditions for timeintervals between 0 and 30 hours (a) and from 20 to 30 hours (b).
In Figure 8c, the PEM normalized conductivity evolution on timeis shown, with a trend which correlates with the increase on the ε/τfactor and the loss of SO−
3 .We underline that, according to our model, the increase over time
of the ε/τ factor during the PEM degradation, leads to a monotonousincrease of the effective O2 diffusion coefficient. The resulting in-crease of the O2 crossover leads to the increase of the O2 adsorptionand consequent O formation in the anode catalyst which favors theORR and the H2O production. In Figure 9 we present, as an exam-ple, the evolution of the adspecies coverage on the anode catalystunder OCV conditions. During the first ∼25 hours of simulated op-eration, the HOR governs the anode operation with a high coverageof H (∼0.5 ML) and other species such as H2 (∼0.2 ML) and H2O2
(∼0.05 ML). Later, once the O2 crossover becomes sufficiently high,the anode becomes “cathodized” depleting the overall cell potential.This process is self-maintained because of the retro-feedback with theO2 crossover: in other words, the more H2O2 is produced, the moresidechain loss is induced and finally the more O2 crossover results,leading again to more H2O2 production and so on. Not surprisingly, inFigure 10, we can observe that the PEM degradation does not affectthe calculated ORR adspecies coverage for the cathode under OCVconditions.
In Figure 11, we report the cathode ORR coverage evolution forthe case of an applied current density of 0.5 A/cm2. As it was previ-
Figure 10. Cathode surface coverage evolution under OCV conditions for asimulated operation time interval between 0 and 30 hours.
ously predicted67 the H2O is the dominant adspecie (with an initialcoverage value of ∼0.6 ML for H2O, 0.3 ML for O2 and 0.03 MLfor O). The PEM degradation process at non-zero current leads to thecathode coverage evolution. Indeed, the cathode responds by increas-ing the water production as a consequence of the electrostatic potentialdecrease over time through the PEM (conductivity depletion).
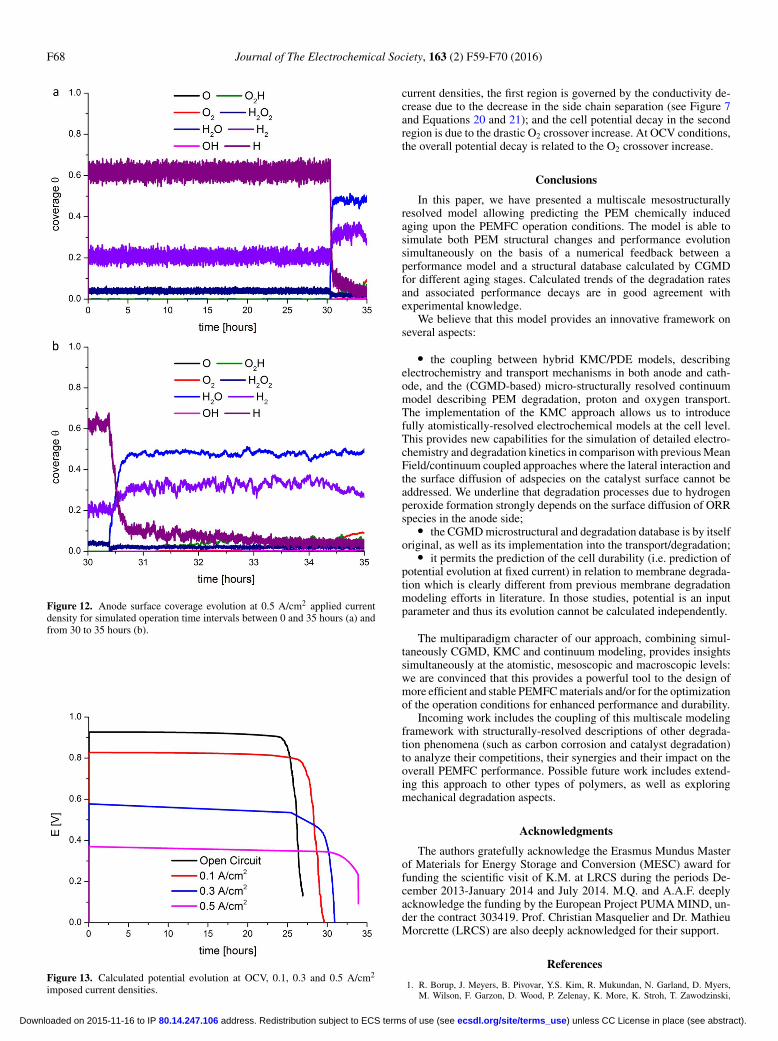
In Figure 12, two different simulated time ranges are presentedfor the HOR coverage evolution in the anode at 0.5 A/cm2. As onecan see around ∼33 hours, the anode starts to generate more H2O,O2H and OH, which leads to the cathode potential (the cell potential)decrease over time (Figure 13). This occurs because at ∼33 hoursthe porosity/tortuosity factor suddenly starts to increase (see Figure8b), affecting the effective O2 diffusion coefficient and favoring anundesired ORR in the anode side.
In Figure 13 we summarize the cell potential evolution for thefour studied cases. As known from experimental knowledge, underthe assumption that PEM aging is the only degradation mechanisminvolved, the cell performance degradation rate increases as the ap-plied current density decreases. For the three cases where the appliedcurrent density is non-zero, the potential decay clearly splits into tworegions: first a region until ∼25 hours where the cell potential decaysroughly linearly; then a second region where the cell potential decaysin a non-linear fashion. According to our model, at non-zero applied
Figure 11. Cathode surface coverage evolution at 0.5 A/cm2 applied currentdensity for a simulated operation time interval between 0 and 35 hours.
) unless CC License in place (see abstract). ecsdl.org/site/terms_use address. Redistribution subject to ECS terms of use (see 80.14.247.106Downloaded on 2015-11-16 to IP
F68 Journal of The Electrochemical Society, 163 (2) F59-F70 (2016)
Figure 12. Anode surface coverage evolution at 0.5 A/cm2 applied currentdensity for simulated operation time intervals between 0 and 35 hours (a) andfrom 30 to 35 hours (b).
Figure 13. Calculated potential evolution at OCV, 0.1, 0.3 and 0.5 A/cm2
imposed current densities.
current densities, the first region is governed by the conductivity de-crease due to the decrease in the side chain separation (see Figure 7and Equations 20 and 21); and the cell potential decay in the secondregion is due to the drastic O2 crossover increase. At OCV conditions,the overall potential decay is related to the O2 crossover increase.
Conclusions
In this paper, we have presented a multiscale mesostructurallyresolved model allowing predicting the PEM chemically inducedaging upon the PEMFC operation conditions. The model is able tosimulate both PEM structural changes and performance evolutionsimultaneously on the basis of a numerical feedback between aperformance model and a structural database calculated by CGMDfor different aging stages. Calculated trends of the degradation ratesand associated performance decays are in good agreement withexperimental knowledge.
We believe that this model provides an innovative framework onseveral aspects:
� the coupling between hybrid KMC/PDE models, describingelectrochemistry and transport mechanisms in both anode and cath-ode, and the (CGMD-based) micro-structurally resolved continuummodel describing PEM degradation, proton and oxygen transport.The implementation of the KMC approach allows us to introducefully atomistically-resolved electrochemical models at the cell level.This provides new capabilities for the simulation of detailed electro-chemistry and degradation kinetics in comparison with previous MeanField/continuum coupled approaches where the lateral interaction andthe surface diffusion of adspecies on the catalyst surface cannot beaddressed. We underline that degradation processes due to hydrogenperoxide formation strongly depends on the surface diffusion of ORRspecies in the anode side;
� the CGMD microstructural and degradation database is by itselforiginal, as well as its implementation into the transport/degradation;
� it permits the prediction of the cell durability (i.e. prediction ofpotential evolution at fixed current) in relation to membrane degrada-tion which is clearly different from previous membrane degradationmodeling efforts in literature. In those studies, potential is an inputparameter and thus its evolution cannot be calculated independently.
The multiparadigm character of our approach, combining simul-taneously CGMD, KMC and continuum modeling, provides insightssimultaneously at the atomistic, mesoscopic and macroscopic levels:we are convinced that this provides a powerful tool to the design ofmore efficient and stable PEMFC materials and/or for the optimizationof the operation conditions for enhanced performance and durability.
Incoming work includes the coupling of this multiscale modelingframework with structurally-resolved descriptions of other degrada-tion phenomena (such as carbon corrosion and catalyst degradation)to analyze their competitions, their synergies and their impact on theoverall PEMFC performance. Possible future work includes extend-ing this approach to other types of polymers, as well as exploringmechanical degradation aspects.
Acknowledgments
The authors gratefully acknowledge the Erasmus Mundus Masterof Materials for Energy Storage and Conversion (MESC) award forfunding the scientific visit of K.M. at LRCS during the periods De-cember 2013-January 2014 and July 2014. M.Q. and A.A.F. deeplyacknowledge the funding by the European Project PUMA MIND, un-der the contract 303419. Prof. Christian Masquelier and Dr. MathieuMorcrette (LRCS) are also deeply acknowledged for their support.
References
1. R. Borup, J. Meyers, B. Pivovar, Y.S. Kim, R. Mukundan, N. Garland, D. Myers,M. Wilson, F. Garzon, D. Wood, P. Zelenay, K. More, K. Stroh, T. Zawodzinski,
) unless CC License in place (see abstract). ecsdl.org/site/terms_use address. Redistribution subject to ECS terms of use (see 80.14.247.106Downloaded on 2015-11-16 to IP

Journal of The Electrochemical Society, 163 (2) F59-F70 (2016) F69
J. Boncella, J.E. McGrath, M. Inaba, K. Miyatake, M. Hori, K. Ota, Z. Ogumi,S. Miyata, A. Nishikata, Z. Siroma, Y. Uchimoto, K. Yasuda, K.-i. Kimijima, andN. Iwashita, Chem. Rev., 107, 3904 (2007).
2. A.A. Franco, PEMFC degradation modeling and analysis, book chapter in: Polymerelectrolyte membrane and direct methanol fuel cell technology (PEMFCs and DM-FCs) - Volume 1: Fundamentals and performance, edited by C. Hartnig and C. Roth(publisher: Woodhead, Cambridge, UK) (2012).
3. Polymer Electrolyte Fuel Cells: Science, Applications and Challenges, A.A. Franco,Ed., CRC Press, Taylor and Francis Group, FL, USA (2013).
4. V. Stanic and M. Hoberecht, “Mechanism of pinhole formation in membrane electrodeassemblies for PEM fuel cells,” Proc.-Electrochem. Soc., 21, 391 (2004).
5. P. Trogadas and T.G. Fuller, Membrane Degradation Mechanisms in Polymer Elec-trolyte Fuel Cell, book chapter in: Polymer Electrolyte Fuel Cells: Science, Applica-tions and Challenges, A.A. Franco, Ed., CRC Press, USA (2013).
6. S.S. Kocha, J. Deliang Yang, and J.S. Yi, “Characterization of gas crossover and itsimplications in PEM fuel cells,” AIChE Journal, 52, 1916 (2006).
7. M. Danilczuk, F.D. Coms, and S. Schlick, “Visualizing Chemical Reactions andCrossover Processes in a Fuel Cell Inserted in the ESR Resonator: Detection bySpin Trapping of Oxygen Radicals, Nafion-Derived Fragments, and Hydrogen andDeuterium Atoms,” The J. of Phys. Chem. B, 113, 8031 (2009).
8. A.C. Fernandes and E.A. Ticianelli, “A performance and degradation study of Nafion212 membrane for proton exchange membrane fuel cells,” J. of Power Sources, 193,547 (2009).
9. V.O. Mittal, H.R. Kunz, and J.M. Fenton, “Is H2O2 Involved in the MembraneDegradation Mechanism in PEMFC?,” Electrochem. and Solid-State Let., 9, A299(2006).
10. W. Liu and D. Zuckerbrod, “In Situ Detection of Hydrogen Peroxide in PEM FuelCells,” J. Electrochem. Soc., 152, A1165 (2005).
11. J. Solla-Gullon, J. Vidal-Iglesias, J.M. Feliu, and A. Aldaz, Electrocatalysis on Shape-Controlled Pt Nanoparticles, book chapter in: Polymer Electrolyte Fuel Cells: Science,Applications and Challenges, A.A. Franco, Ed., CRC Press, USA (2013).
12. A.P. Young, J. Stumper, S. Knights, and E. Gyenge, “Ionomer Degradation in PolymerElectrolyte Membrane Fuel Cells,” J. Electrochem. Soc., 157, B425 (2010).
13. H. Tang, S. Peikang, S.P. Jiang, F. Wang, and M. Pan, “A degradation study ofNafion proton exchange membrane of PEM fuel cells,” J. of Power Sources, 170, 85(2007).
14. M. Inaba, T. Kinumoto, M. Kiriake, R. Umebayashi, A. Tasaka, and Z. Ogumi, “Gascrossover and membrane degradation in polymer electrolyte fuel cells,” Electrochim.Acta, 51, 5746 (2006).
15. J. Healy, C. Hayden, T. Xie, K. Olson, R. Waldo, M. Brundage, H. Gasteiger, andJ. Abbott, “Aspects of the Chemical Degradation of PFSA Ionomers used in PEMFuel Cells,” Fuel Cells, 5, 302 (2005).
16. M. Aoki, H. Uchida, and M. Watanabe, “Decomposition mechanism of perfluorosul-fonic acid electrolyte in polymer electrolyte fuel cells,” Electrochem. Commun., 8,1509 (2006).
17. A. Panchenko, H. Dilger, E. Moller, T. Sixt, and E. Roduner, “In situ EPR investigationof polymer electrolyte membrane degradation in fuel cell applications,” J. of PowerSources, 127, 325 (2004).
18. B. Vogel, E. Aleksandrova, S. Mitov, M. Krafft, A. Dreizler, J. Kerres, M. Hein, andE. Roduner, “Observation of Fuel Cell Membrane Degradation by Ex Situ and In SituElectron Paramagnetic Resonance,” J. Electrochem. Soc., 155, B570 (2008).
19. M.K. Kadirov, A. Bosnjakovic, and S. Schlick, “Membrane-Derived FluorinatedRadicals Detected by Electron Spin Resonance in UV-Irradiated Nafion and DowIonomers: Effect of Counterions and H2O2,” The J. of Phys. Chem. B, 109, 7664(2005).
20. A. Pozio, R.F. Silva, M. De Francesco, and L. Giorgi, “Nafion degradation in PEFCsfrom end plate iron contamination,” Electrochim. Acta, 48, 1543 (2003).
21. F.N. Buchi, M. Inaba, T.J. Schmidt, J. Scherer, D. Munter, and R. Strobel, “Influenceof Metallic Bipolar Plates on the Durability of Polymer Electrolyte Fuel Cells, in:Polymer Electrolyte Fuel Cell Durability”, Springer New York, pp. 243 (2009).
22. M. J. Eslamibidgoli, P.-E. Alix Melchy, and M. H. Eikerling, “Modelingthe local potential at Pt nanoparticles in polymer electrolyte membranes,”Phys.Chem.Chem.Phys., 17, 9802 (2015).
23. S. Helmly, B. Ohnmacht, P. Gazdzicki, R. Hiesgen, E. Gulzow, and K. A. Friedrich,“Influence of the Distribution of Platinum Deposits on the Properties and Degradationof Platinum-Impregnated Nafion Membranes,” J. Electrochem. Soc., 161(14), F1416(2014).
24. J. M. Christ, K. C. Neyerlin, R. Richards, and H. N. Dinh, “Concentration Effects ofPolymer Electrolyte Membrane Degradation Products on Oxygen Reduction Activityfor Three Platinum Catalysts,” J. Electrochem. Soc., 161(14), F1360 (2014).
25. M. Gummalla, V. V. Atrazhev, D. Condit, N. Cipollini, T. Madden, N. Y. Kuzminy,D. Weiss, and S. F. Burlatsky, “Degradation of Polymer-Electrolyte Membranes inFuel Cells,” J. Electrochem. Soc., 157(11), B1542 (2010).
26. T. Xie and C.A. Hayden, “A kinetic model for the chemical degradation of perfluori-nated sulfonic acid ionomers: Weak end groups versus side chain cleavage,” Polymer,48, 5497 (2007).
27. L. Ghassemzadeh, K.D. Kreuer, J. Maier, and K. Muller, “Chemical degradation ofNafion membranes under mimic fuel cell conditions as investigated by solid-stateNMR spectroscopy,” J. Phys. Chem. C, 114(34), 14635 (2010).
28. D. A. Schiraldi, D. Savant, and C. Zhou, “Chemical Degradation of Membrane Poly-mer Model Compounds Under Simulated Fuel Cell Conditions,” ECS Transactions,33(1), 883 (2010).
29. T. Ishimoto, R. Nagumo, T. Ogura, T. Ishihara, B. Kim, A. Miyamoto,and M. Koyama, “Chemical Degradation Mechanism of Model Compound,CF3(CF2)3O(CF2)2OCF2SO3H, of PFSA Polymer by Attack of Hydroxyl Radical inPEMFCs,” J. Electrochem. Soc., 157, B1305 (2010).
30. C. Chen and T.F. Fuller, “Modeling of H2O2 formation in PEMFCs,” ElectrochimicaActa, 54, 3984 (2009).
31. L. Gubler, S. M. Dockheer, and W. H. Koppenol, “Radical (HO · , H · and HOO · )Formation and Ionomer Degradation in Polymer Electrolyte Fuel Cells,” J. Elec-trochem. Soc., 158, B755 (2011).
32. A. A. Shah, T. R. Ralph, and F. C. Walsh, “Modeling and Simulation of the Degrada-tion of Perfluorinated Ion-Exchange Membranes in PEM Fuel Cells,” J. Electrochem.Soc., 156, B465 (2009).
33. K. Kawai, T. Mabuchi, and T. Tokumasu, “Numerical Analysis of Proton Conductivityin Hydrated Nafion Membrane Contaminated with Iron Ion,” ECS Trans., 64(3), 789(2014).
34. R. Coulon, Modelisation de la degradation chimique de membranes dans les pilesa combustible a membrane electrolyte polymere, PhD manuscript, Universite JosephFourier, Grenoble (2012).
35. R. Coulon, W. Bessler, and A. A. Franco, “Modeling Chemical Degradation of aPolymer Electrolyte Membrane and its Impact on Fuel Cell Performance,” ECSTrans., 25(35), 259 (2010).
36. A. A. Franco, Toward a Bottom-Up Multiscale Modeling Framework for the TransientAnalysis of PEM Fuel Cells Operation, book chapter in: Polymer Electrolyte FuelCells: Science, Applications and Challenges, A. A. Franco, Ed., CRC Press, USA(2013).
37. M. P. Eschenbach, R. Coulon, A. A. Franco, J. Kallo, and W. G. Bessler, “Multi-scalesimulation of fuel cells: from the cell to the system,” Solid State Ion., 192(1), 615(2011).
38. P. Choi, N. H. Jalani, and R. Datta, “Thermodynamics and proton transport in NafionI. Membrane swelling, sorption, and ion-exchange equilibrium,” J. Electrochem. Soc.,152(3), E84 (2005).
39. P. Choi, N. H. Jalani, and R. Datta, “Thermodynamics and proton transport in NafionII. Proton diffusion mechanisms and conductivity,” J. Electrochem. Soc., 152(3),E123 (2005).
40. K. H. Wong and E. Kjeang, “Mitigation of Chemical Membrane Degradation inFuel Cells: Understanding the Effect of Cell Voltage and Iron Ion Redox Cycle,”ChemSusChem., 8, 1072 (2015).
41. K. H. Wong and E. Kjeang, “Macroscopic In-Situ Modeling of Chemical MembraneDegradation in Polymer Electrolyte Fuel Cells,” J. Electrochem. Soc., 161(9), F823(2014).
42. M. Chandesris, V. Medeau, N. Guillet, S. Chelghoum, D. Thoby, and F. Fouda-Onana,“Membrane degradation in PEM water electrolyzer: Numerical modeling and exper-imental evidence of the influence of temperature and current density,” Int. J. Hydrog.Energy, 40(3), 1353 (2015).
43. K. Malek, T. Mashio, and M. Eikerling, “Microstructure of Catalyst Layers in PEMFuel Cells Redefined: A Computational Approach,” Electrocatalysis, 2, 141 (2011).
44. K. Malek, M. Eikerling, Q. Wang, Z. Liu, S. Otsuka, K. Akizuki, and M. Abe,“Nanophase segregation and water dynamics in hydrated Nafion: molecular modelingand experimental validation,” J. Chem. Phys., 129, 204702 (2008).
45. K. Malek, M. Eikerling, Q. Wang, T. Navessin, and Z. Liu, “Self-organization inCatalyst Layers of Polymer Electrolyte Fuel Cells,” J. Phys. Chem. C., 111(36),13627 (2007).
46. M. H. Eikerling and K. Malek, “Physical Modeling of Materials for PEFC: A Balanc-ing Act of Water and Complex Morphologies, book chapter in: Polymer ElectrolyteMembrane Fuel Cells: Materials, Properties, and Performance”, D. Wilkinson Ed.,CRC Press, Taylor & Francis 343 (2009).
47. A. Vishnyakov and A. V. Neimark, “Molecular simulation study of Nafion membranesolvation in water and methanol,” J. Phys. Chem. B, 104, 4471 (2000).
48. D. A. Mologin, P. G. Khalatur, and A. R. Khokhlov, “Structural Organization ofWater-Containing Nafion: A Cellular-Automaton-Based Simulation,” Macromol.Theory Simul., 11(5), 587 (2002).
49. P. G. Khalatur, S. K. Talitskikh, and A. R. Khokhlov, “Structural Organization ofWater-Containing Nafion: The Integral Equation Theory,” Macromol. Theory.Simul.,11(5), 566 (2002).
50. K. Malek and A. A. Franco, “Microstructure-based modeling of aging mechanismsin catalyst layers of polymer electrolyte fuel cells,” J. Phys. Chem. B, 115(25), 8088(2011).
51. L. Ghassemzadeh and S. Holdcroft, “Quantifying the Structural Changes of PFSAIonomer upon Reaction with Hydroxyl Radicals,” J. Am. Chem. Soc., 135, 8181(2013).
52. D. E. Curtin, R. D. Lousenberg, T. J. Henry, P. C. Tangeman, and M. E. Tisack,“Advanced materials for improved PEMFC performance and life,” J. Power Sources,131, 41 (2004).
53. C. Zhou, M. A. Guerra, Z. M. Qiu, T. A. Zawodzinski, and D. A. Schiraldi, “Chemicaldurability studies of perfluorinated sulfonic acid polymers and model compoundsunder mimic fuel cell conditions,” Macromolecules, 40, 8695 (2007).
54. S. J. Marrink, A. H. de Vries, and A. E. Mark, “Coarse grained model for semiquan-titative lipid simulations,” J. Phys. Chem. B, 108(2), 750 (2007).
55. J. T. Wescott, Y. Qi, L. Subramanian, and T. W. Capehart, “Mesoscale simulationof morphology in hydrated perfluorosulfonic acid membranes,” Chem. Phys., 12,134702 (2006).
56. www.modeling-electrochemistry.com57. A. A. Franco and K. H. Xue, “Carbon-based electrodes for lithium air batteries:
scientific and technological challenges from a modeling perspective,” ECS J. SolidState Sci. Technol., 2(10), M3084 (2013).
58. A. A. Franco, “Multiscale Modeling of Rechargeable Lithium Ion Batteries: Con-cepts, Methods and Challenges,” R. Soc. Chem. Adv., 3(32), 13027 (2013).
59. K. H. Xue, E. McTurk, L. Johnson, P. G. Bruce, and A. A. Franco, “A comprehensivemodel for non-aqueous lithium air batteries involving different reaction mechanisms,”J. Electrochem. Soc., 162(4), A614 (2015).
) unless CC License in place (see abstract). ecsdl.org/site/terms_use address. Redistribution subject to ECS terms of use (see 80.14.247.106Downloaded on 2015-11-16 to IP

F70 Journal of The Electrochemical Society, 163 (2) F59-F70 (2016)
60. K. H. Xue, T. K. Nguyen, and A. A. Franco, “Impact of the cathode microstruc-ture on the discharge performance of lithium air batteries: a multiscale model,” J.Electrochem. Soc., 161(8), E3028 (2014).
61. A. A. Franco, “A physical multi-scale model of the electrochemical dynamicsin a polymer electrolyte fuel cell – An infinite dimensional Bond Graph ap-proach”; PhD Thesis Universite Claude Bernard Lyon-1 (France) no. 2005LYO10239(2005).
62. R. F. de Morais, D. Loffreda, P. Sautet, and A. A. Franco, “A multiscale the-oretical methodology for the calculation of electrochemical observables fromab initio data: application to the oxygen reduction reaction in a Pt (111)-based polymer electrolyte membrane fuel cell,” Electrochim. Acta, 56(28), 10842(2011).
63. A. A. Franco, M. Guinard, B. Barthe, and O. Lemaire, “Impact of carbon monox-ide on PEFC catalyst carbon support degradation under current-cycled operatingconditions,” Electrochim. Acta, 54 5267 (2009).
64. A. A. Franco et al. “PtxCoy Catalysts Degradation in PEFC Environments:Mechanistic Insights I. Multiscale Modeling,” J. Electrochem. Soc., 156, B410(2009).
65. A.A. Franco, A multiscale modeling framework for the transient analysis of PEMFuel Cells-From the fundamentals to the engineering practice, Habilitation (H.D.R.)manuscript, Universite Claude Bernard Lyon 1, France (2010). Available onlinein: http://tel.archives-ouvertes.fr/docs/00/74/09/67/PDF/Alejandro_A_Franco_Manuscript_HDR_July_12_2010.pdf.
66. M. Quiroga, K. H. Xue, T. K. Nguyen, H. Huang, M. Tulodziecki, and A. A. Franco,“A multiscale model of electrochemical double layers in energy conversion andstorage,” J. Electrochem. Soc., 161(8), E3302 (2014).
67. M. A. Quiroga and A. A. Franco, “A multi-paradigm computational model of mate-rials electrochemical reactivity for energy conversion and storage,” J. Electrochem.Soc., 162(7), E73 (2015).
68. P. K. Das and S. Bhattacharjee, “Electrostatic double layer force between a sphereand a planar substrate in the presence of previously deposited spherical particles,”Langmuir, 21(10), 4755 (2005).
69. P. K. Das and S. Bhattacharjee, “Electrostatic double-layer interaction between spher-ical particles inside a rough capillary,” J. Colloid Interface Sci., 273(1), 278 (2004).
70. R. Ferreira de Morais, A. A. Franco, P. Sautet, and D. Loffreda, “Interplay betweenReaction Mechanism and Hydroxyl Species for Water Formation on Pt (111),” ACSCatal., 5, 1068 (2014).
71. K. Griffiths and D. Bonnett, “The effects of hidden impurities on the reactivity of aPt (111) crystal,” Surf. Sci., 177, 169 (1986).
72. D. R. Monroe and R. P. Merrill, “Comparative kinetic studies of CO-O2 and CO-NOreactions over single crystal and supported rhodium catalysts,” J. Catal., 65, 461(1980).
73. D. Wu, S. J. Paddison, and J. A. Elliott, “A comparative study of the hydrated mor-phologies of perfluorosulfonic acid fuel cell membranes with mesoscopic simula-tions,” Energy & Environmental Science, 1(2), 284 (2008).
74. E. Allahyarov and P. L. Taylor, ”Role of electrostatic forces in cluster formation in adry ionomer,” J. Chem. Phys., 127(15), 154901 (2007).
75. K. Malek, M. Eikerling, Q. Wang, Z. Liu, S. Otsuka, K. Akizuki, and M. Abe,“Nanophase segregation and water dynamics in hydrated Nafion: molecular modelingand experimental validation,” J. Chem. Phys., 129, 204702 (2008).
76. J. Philibert, Atom Movements Diffusion and Mass Transport in Solids, Les Editionsde Physique, Les Ulis (1991).
) unless CC License in place (see abstract). ecsdl.org/site/terms_use address. Redistribution subject to ECS terms of use (see 80.14.247.106Downloaded on 2015-11-16 to IP